Anderson County, TX Map & Demographics
Anderson County Overview
$23,548
PER CAPITA INCOME
$67,510
AVG FAMILY INCOME
$57,445
AVG HOUSEHOLD INCOME
35.7%
WAGE / INCOME GAP [ % ]
64.3¢/ $1
WAGE / INCOME GAP [ $ ]
$11,876
FAMILY INCOME DEFICIT
0.43
INEQUALITY / GINI INDEX
58,077
TOTAL POPULATION
35,807
MALE POPULATION
22,270
FEMALE POPULATION
160.79
MALES / 100 FEMALES
62.19
FEMALES / 100 MALES
39.3
MEDIAN AGE
3.2
AVG FAMILY SIZE
2.7
AVG HOUSEHOLD SIZE
20,857
LABOR FORCE [ PEOPLE ]
43.1%
PERCENT IN LABOR FORCE
3.9%
UNEMPLOYMENT RATE
Income in Anderson County
Income Overview in Anderson County
Per Capita Income in Anderson County is $23,548, while median incomes of families and households are $67,510 and $57,445 respectively.
| Characteristic | Number | Measure |
| Per Capita Income | 58,077 | $23,548 |
| Median Family Income | 12,150 | $67,510 |
| Mean Family Income | 12,150 | $83,795 |
| Median Household Income | 16,899 | $57,445 |
| Mean Household Income | 16,899 | $72,139 |
| Income Deficit | 12,150 | $11,876 |
| Wage / Income Gap (%) | 58,077 | 35.75% |
| Wage / Income Gap ($) | 58,077 | 64.25¢ per $1 |
| Gini / Inequality Index | 58,077 | 0.43 |
Earnings by Sex in Anderson County
Average Earnings in Anderson County are $34,750, $42,404 for men and $27,245 for women, a difference of 35.7%.
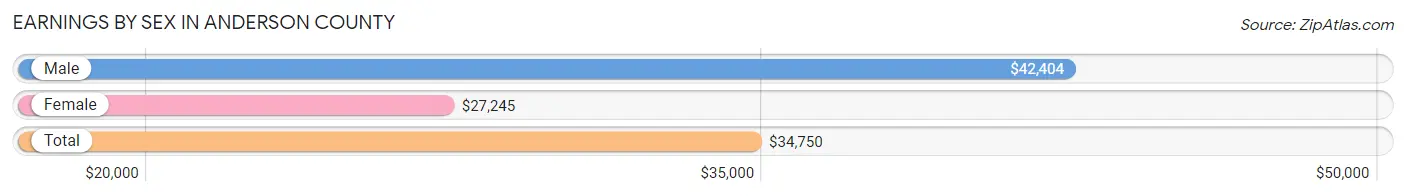
| Sex | Number | Average Earnings |
| Male | 12,929 (57.8%) | $42,404 |
| Female | 9,428 (42.2%) | $27,245 |
| Total | 22,357 (100.0%) | $34,750 |
Earnings by Sex by Income Bracket in Anderson County
The most common earnings brackets in Anderson County are $100,000+ for men (1,568 | 12.1%) and $25,000 to $29,999 for women (1,029 | 10.9%).
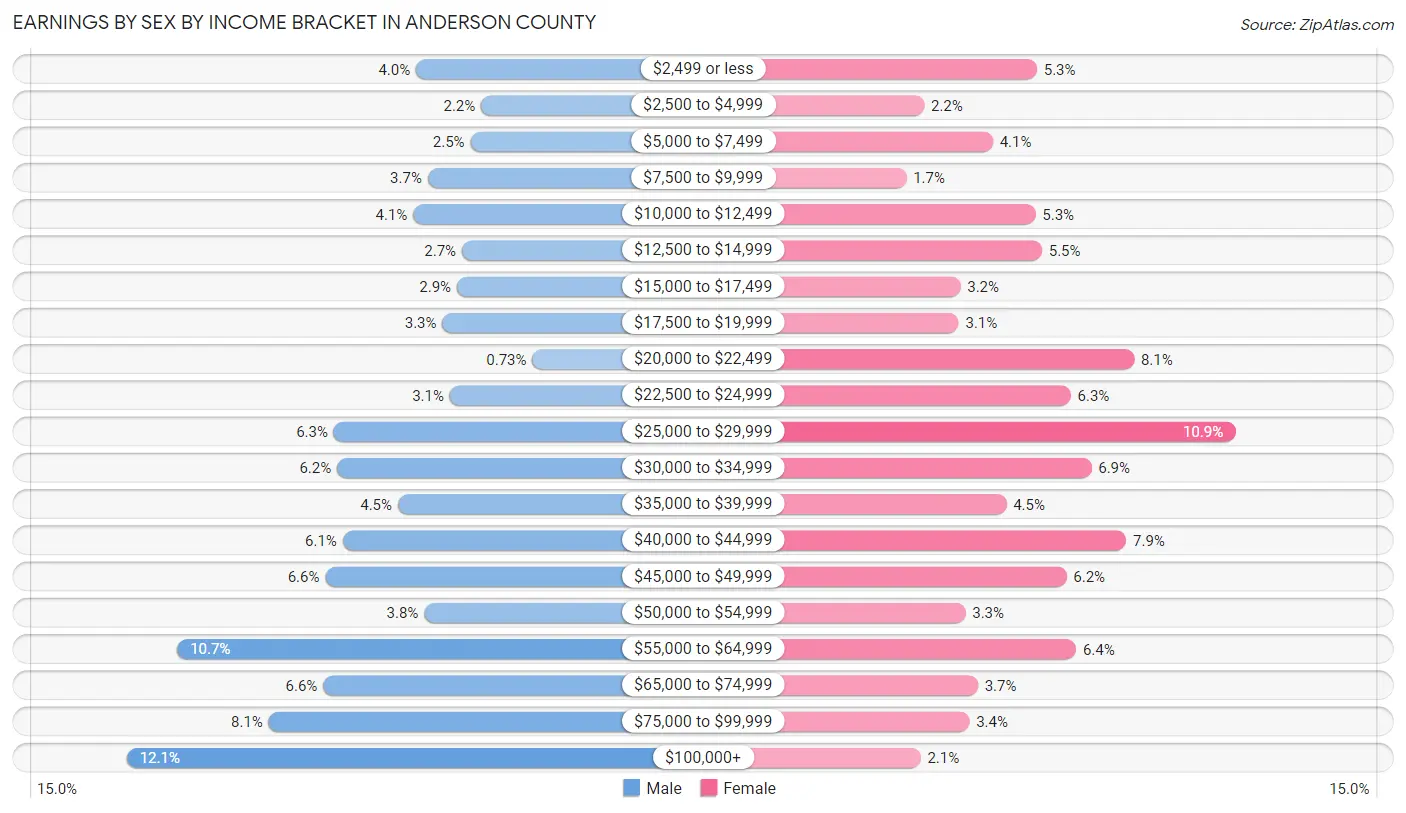
| Income | Male | Female |
| $2,499 or less | 517 (4.0%) | 503 (5.3%) |
| $2,500 to $4,999 | 281 (2.2%) | 205 (2.2%) |
| $5,000 to $7,499 | 319 (2.5%) | 387 (4.1%) |
| $7,500 to $9,999 | 474 (3.7%) | 157 (1.7%) |
| $10,000 to $12,499 | 527 (4.1%) | 500 (5.3%) |
| $12,500 to $14,999 | 351 (2.7%) | 517 (5.5%) |
| $15,000 to $17,499 | 369 (2.9%) | 301 (3.2%) |
| $17,500 to $19,999 | 422 (3.3%) | 296 (3.1%) |
| $20,000 to $22,499 | 94 (0.7%) | 761 (8.1%) |
| $22,500 to $24,999 | 394 (3.0%) | 593 (6.3%) |
| $25,000 to $29,999 | 816 (6.3%) | 1,029 (10.9%) |
| $30,000 to $34,999 | 804 (6.2%) | 648 (6.9%) |
| $35,000 to $39,999 | 583 (4.5%) | 422 (4.5%) |
| $40,000 to $44,999 | 783 (6.1%) | 740 (7.9%) |
| $45,000 to $49,999 | 847 (6.6%) | 582 (6.2%) |
| $50,000 to $54,999 | 487 (3.8%) | 314 (3.3%) |
| $55,000 to $64,999 | 1,385 (10.7%) | 607 (6.4%) |
| $65,000 to $74,999 | 855 (6.6%) | 347 (3.7%) |
| $75,000 to $99,999 | 1,053 (8.1%) | 324 (3.4%) |
| $100,000+ | 1,568 (12.1%) | 195 (2.1%) |
| Total | 12,929 (100.0%) | 9,428 (100.0%) |
Earnings by Sex by Educational Attainment in Anderson County
Average earnings in Anderson County are $48,192 for men and $29,828 for women, a difference of 38.1%. Men with an educational attainment of bachelor's degree enjoy the highest average annual earnings of $67,346, while those with less than high school education earn the least with $29,519. Women with an educational attainment of bachelor's degree earn the most with the average annual earnings of $46,749, while those with less than high school education have the smallest earnings of $23,011.
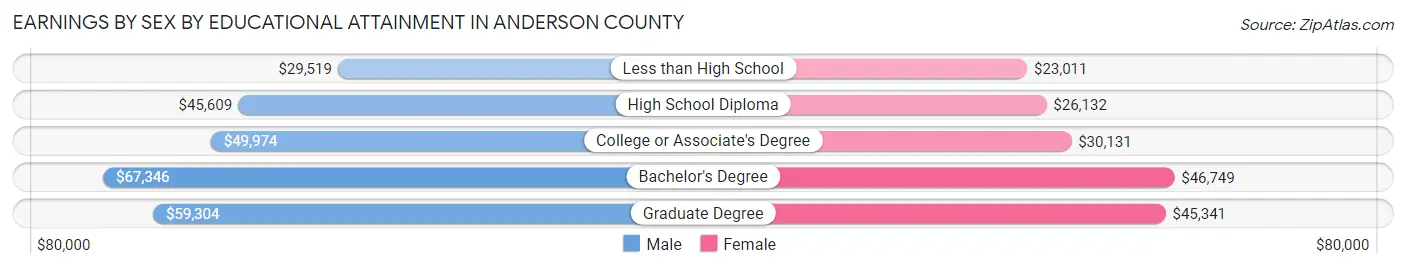
| Educational Attainment | Male Income | Female Income |
| Less than High School | $29,519 | $23,011 |
| High School Diploma | $45,609 | $26,132 |
| College or Associate's Degree | $49,974 | $30,131 |
| Bachelor's Degree | $67,346 | $46,749 |
| Graduate Degree | $59,304 | $45,341 |
| Total | $48,192 | $29,828 |
Family Income in Anderson County
Family Income Brackets in Anderson County
According to the Anderson County family income data, there are 2,649 families falling into the $50,000 to $74,999 income range, which is the most common income bracket and makes up 21.8% of all families. Conversely, the $10,000 to $14,999 income bracket is the least frequent group with only 328 families (2.7%) belonging to this category.
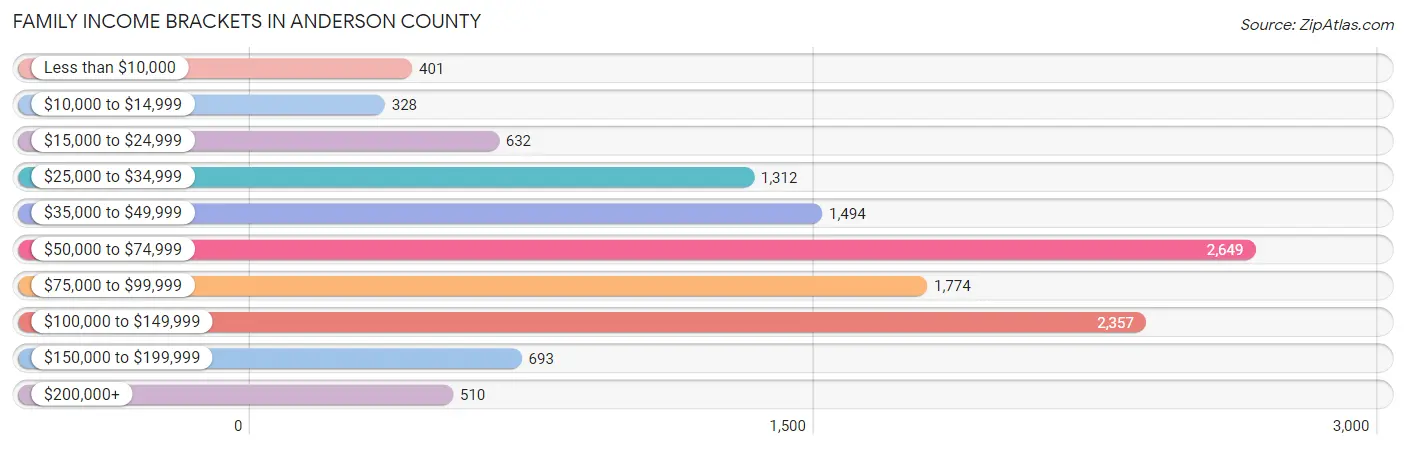
| Income Bracket | # Families | % Families |
| Less than $10,000 | 401 | 3.3% |
| $10,000 to $14,999 | 328 | 2.7% |
| $15,000 to $24,999 | 632 | 5.2% |
| $25,000 to $34,999 | 1,312 | 10.8% |
| $35,000 to $49,999 | 1,494 | 12.3% |
| $50,000 to $74,999 | 2,649 | 21.8% |
| $75,000 to $99,999 | 1,774 | 14.6% |
| $100,000 to $149,999 | 2,357 | 19.4% |
| $150,000 to $199,999 | 693 | 5.7% |
| $200,000+ | 510 | 4.2% |
Family Income by Famaliy Size in Anderson County
4-person families (2,152 | 17.7%) account for the highest median family income in Anderson County with $74,167 per family, while 2-person families (5,480 | 45.1%) have the highest median income of $31,870 per family member.
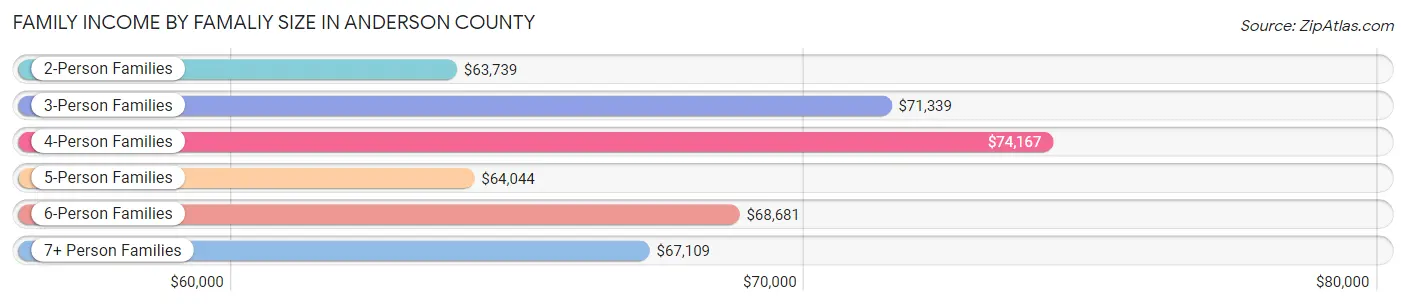
| Income Bracket | # Families | Median Income |
| 2-Person Families | 5,480 (45.1%) | $63,739 |
| 3-Person Families | 3,315 (27.3%) | $71,339 |
| 4-Person Families | 2,152 (17.7%) | $74,167 |
| 5-Person Families | 748 (6.2%) | $64,044 |
| 6-Person Families | 321 (2.6%) | $68,681 |
| 7+ Person Families | 134 (1.1%) | $67,109 |
| Total | 12,150 (100.0%) | $67,510 |
Family Income by Number of Earners in Anderson County
The median family income in Anderson County is $67,510, with families comprising 3+ earners (926) having the highest median family income of $133,926, while families with no earners (2,116) have the lowest median family income of $42,041, accounting for 7.6% and 17.4% of families, respectively.
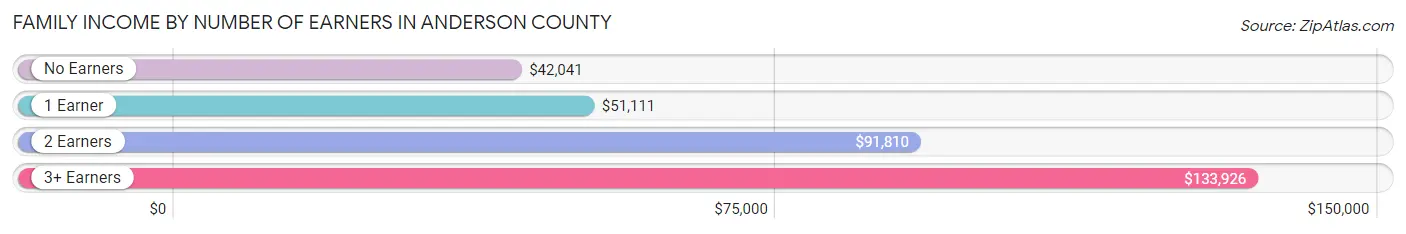
| Number of Earners | # Families | Median Income |
| No Earners | 2,116 (17.4%) | $42,041 |
| 1 Earner | 4,730 (38.9%) | $51,111 |
| 2 Earners | 4,378 (36.0%) | $91,810 |
| 3+ Earners | 926 (7.6%) | $133,926 |
| Total | 12,150 (100.0%) | $67,510 |
Household Income in Anderson County
Household Income Brackets in Anderson County
With 3,346 households falling in the category, the $50,000 to $74,999 income range is the most frequent in Anderson County, accounting for 19.8% of all households. In contrast, only 507 households (3.0%) fall into the $200,000+ income bracket, making it the least populous group.
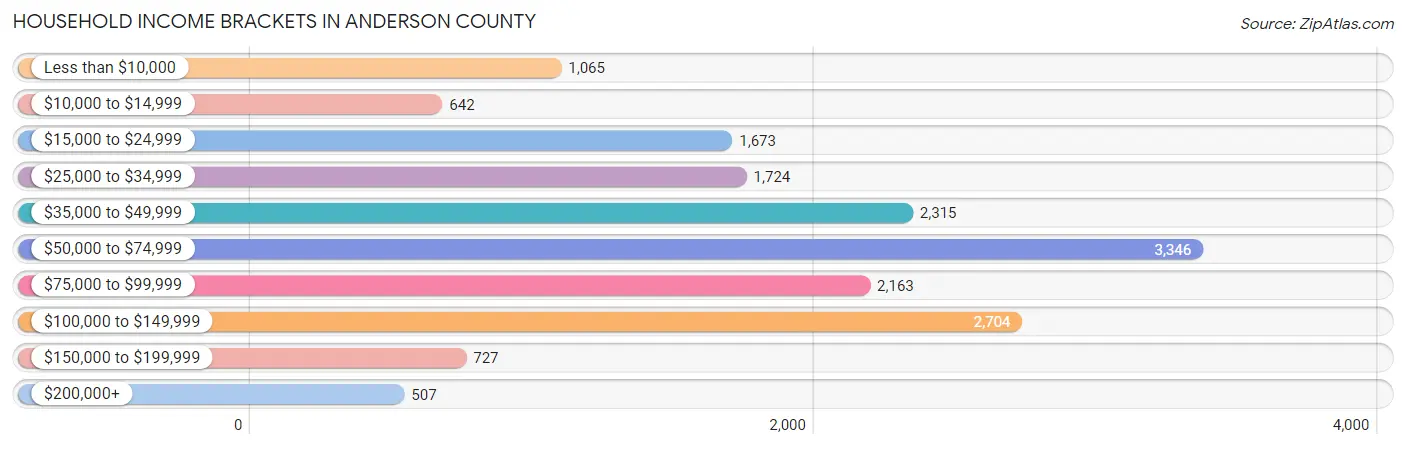
| Income Bracket | # Households | % Households |
| Less than $10,000 | 1,065 | 6.3% |
| $10,000 to $14,999 | 642 | 3.8% |
| $15,000 to $24,999 | 1,673 | 9.9% |
| $25,000 to $34,999 | 1,724 | 10.2% |
| $35,000 to $49,999 | 2,315 | 13.7% |
| $50,000 to $74,999 | 3,346 | 19.8% |
| $75,000 to $99,999 | 2,163 | 12.8% |
| $100,000 to $149,999 | 2,704 | 16.0% |
| $150,000 to $199,999 | 727 | 4.3% |
| $200,000+ | 507 | 3.0% |
Household Income by Householder Age in Anderson County
The median household income in Anderson County is $57,445, with the highest median household income of $62,057 found in the 25 to 44 years age bracket for the primary householder. A total of 5,620 households (33.3%) fall into this category. Meanwhile, the 15 to 24 years age bracket for the primary householder has the lowest median household income of $29,098, with 704 households (4.2%) in this group.
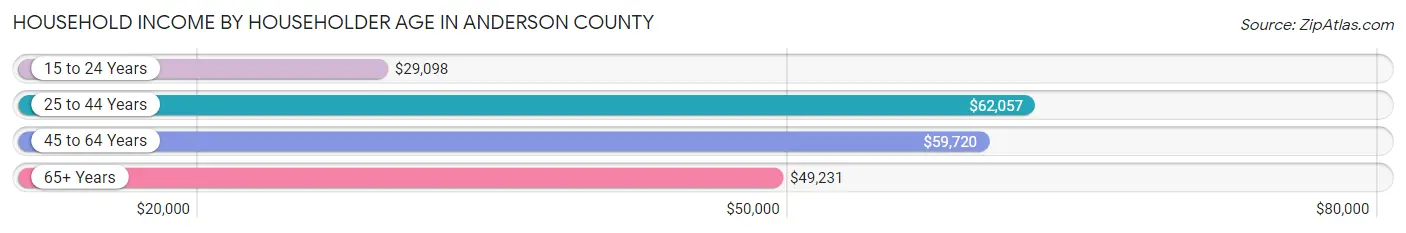
| Income Bracket | # Households | Median Income |
| 15 to 24 Years | 704 (4.2%) | $29,098 |
| 25 to 44 Years | 5,620 (33.3%) | $62,057 |
| 45 to 64 Years | 5,672 (33.6%) | $59,720 |
| 65+ Years | 4,903 (29.0%) | $49,231 |
| Total | 16,899 (100.0%) | $57,445 |
Poverty in Anderson County
Income Below Poverty by Sex and Age in Anderson County
With 15.0% poverty level for males and 16.3% for females among the residents of Anderson County, 15 year old males and under 5 year old females are the most vulnerable to poverty, with 155 males (44.2%) and 495 females (37.1%) in their respective age groups living below the poverty level.
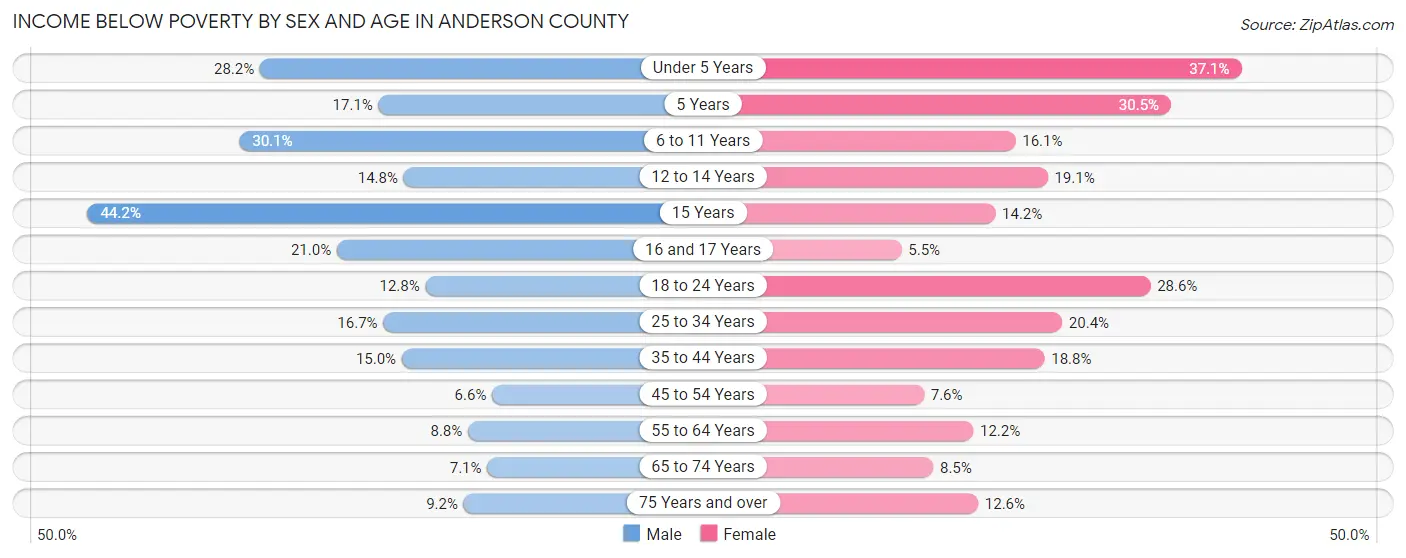
| Age Bracket | Male | Female |
| Under 5 Years | 460 (28.1%) | 495 (37.1%) |
| 5 Years | 54 (17.1%) | 62 (30.5%) |
| 6 to 11 Years | 506 (30.1%) | 308 (16.1%) |
| 12 to 14 Years | 169 (14.8%) | 156 (19.1%) |
| 15 Years | 155 (44.2%) | 37 (14.2%) |
| 16 and 17 Years | 154 (21.0%) | 34 (5.5%) |
| 18 to 24 Years | 291 (12.8%) | 427 (28.6%) |
| 25 to 34 Years | 580 (16.7%) | 576 (20.4%) |
| 35 to 44 Years | 495 (15.0%) | 486 (18.8%) |
| 45 to 54 Years | 185 (6.6%) | 204 (7.6%) |
| 55 to 64 Years | 191 (8.8%) | 357 (12.2%) |
| 65 to 74 Years | 156 (7.0%) | 217 (8.5%) |
| 75 Years and over | 122 (9.2%) | 240 (12.6%) |
| Total | 3,518 (15.0%) | 3,599 (16.3%) |
Income Above Poverty by Sex and Age in Anderson County
According to the poverty statistics in Anderson County, males aged 45 to 54 years and females aged 16 and 17 years are the age groups that are most secure financially, with 93.4% of males and 94.5% of females in these age groups living above the poverty line.
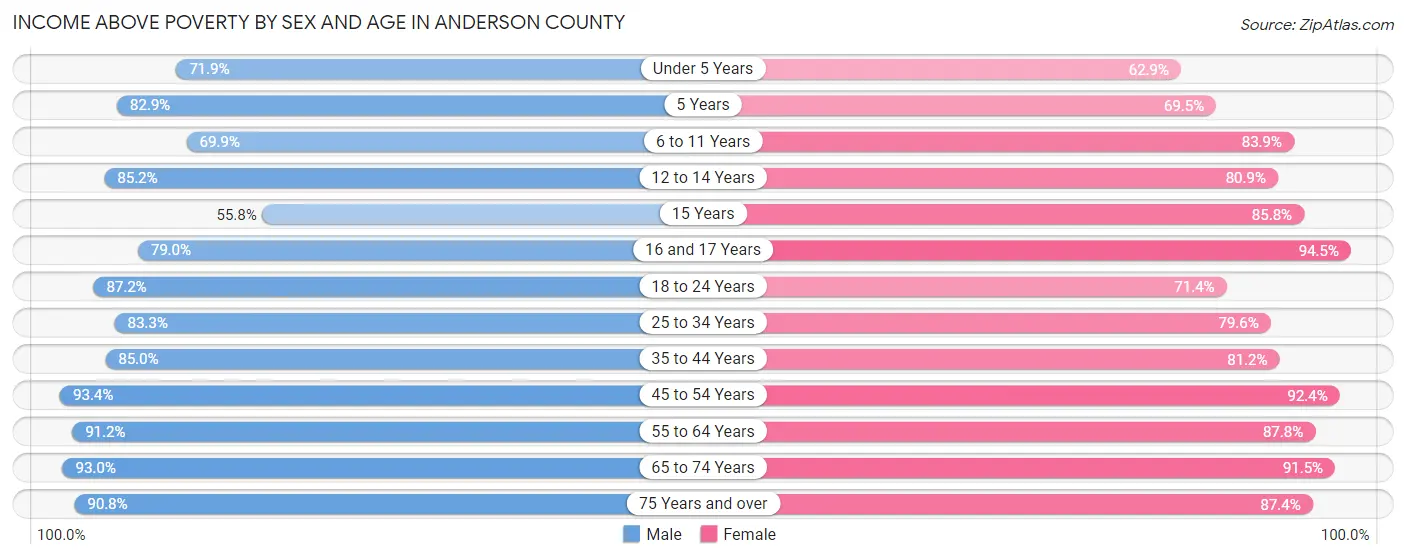
| Age Bracket | Male | Female |
| Under 5 Years | 1,174 (71.9%) | 840 (62.9%) |
| 5 Years | 261 (82.9%) | 141 (69.5%) |
| 6 to 11 Years | 1,177 (69.9%) | 1,605 (83.9%) |
| 12 to 14 Years | 972 (85.2%) | 661 (80.9%) |
| 15 Years | 196 (55.8%) | 223 (85.8%) |
| 16 and 17 Years | 579 (79.0%) | 581 (94.5%) |
| 18 to 24 Years | 1,984 (87.2%) | 1,065 (71.4%) |
| 25 to 34 Years | 2,893 (83.3%) | 2,244 (79.6%) |
| 35 to 44 Years | 2,810 (85.0%) | 2,101 (81.2%) |
| 45 to 54 Years | 2,617 (93.4%) | 2,477 (92.4%) |
| 55 to 64 Years | 1,970 (91.2%) | 2,575 (87.8%) |
| 65 to 74 Years | 2,058 (92.9%) | 2,344 (91.5%) |
| 75 Years and over | 1,199 (90.8%) | 1,660 (87.4%) |
| Total | 19,890 (85.0%) | 18,517 (83.7%) |
Income Below Poverty Among Married-Couple Families in Anderson County
The poverty statistics for married-couple families in Anderson County show that 6.9% or 590 of the total 8,567 families live below the poverty line. Families with 3 or 4 children have the highest poverty rate of 41.6%, comprising of 323 families. On the other hand, families with 5 or more children have the lowest poverty rate of 0.0%, which includes 0 families.
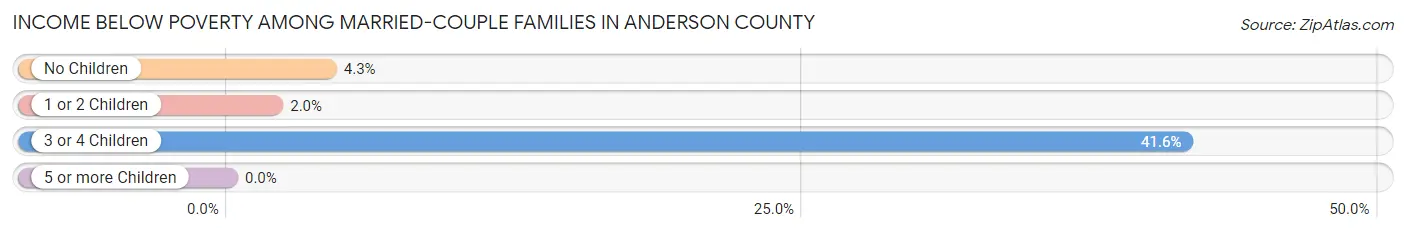
| Children | Above Poverty | Below Poverty |
| No Children | 4,672 (95.7%) | 210 (4.3%) |
| 1 or 2 Children | 2,838 (98.0%) | 57 (2.0%) |
| 3 or 4 Children | 454 (58.4%) | 323 (41.6%) |
| 5 or more Children | 13 (100.0%) | 0 (0.0%) |
| Total | 7,977 (93.1%) | 590 (6.9%) |
Income Below Poverty Among Single-Parent Households in Anderson County
According to the poverty data in Anderson County, 8.7% or 67 single-father households and 26.5% or 746 single-mother households are living below the poverty line. Among single-father households, those with no children have the highest poverty rate, with 28 households (11.4%) experiencing poverty. Likewise, among single-mother households, those with 5 or more children have the highest poverty rate, with 17 households (100.0%) falling below the poverty line.
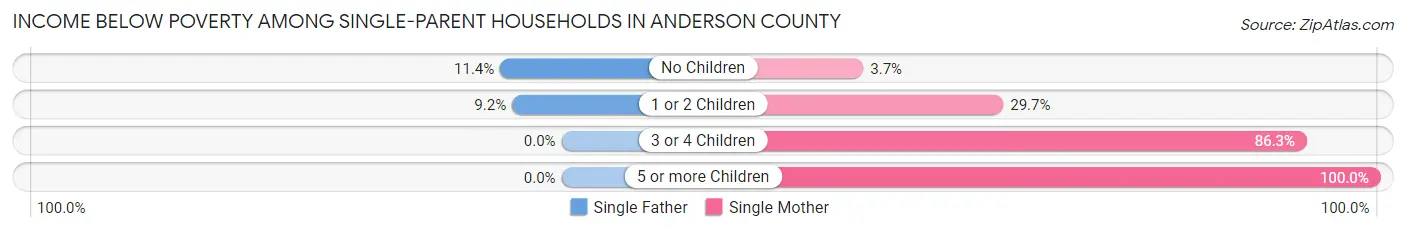
| Children | Single Father | Single Mother |
| No Children | 28 (11.4%) | 41 (3.7%) |
| 1 or 2 Children | 39 (9.2%) | 399 (29.7%) |
| 3 or 4 Children | 0 (0.0%) | 289 (86.3%) |
| 5 or more Children | 0 (0.0%) | 17 (100.0%) |
| Total | 67 (8.7%) | 746 (26.5%) |
Income Below Poverty Among Married-Couple vs Single-Parent Households in Anderson County
The poverty data for Anderson County shows that 590 of the married-couple family households (6.9%) and 813 of the single-parent households (22.7%) are living below the poverty level. Within the married-couple family households, those with 3 or 4 children have the highest poverty rate, with 323 households (41.6%) falling below the poverty line. Among the single-parent households, those with 5 or more children have the highest poverty rate, with 17 household (100.0%) living below poverty.
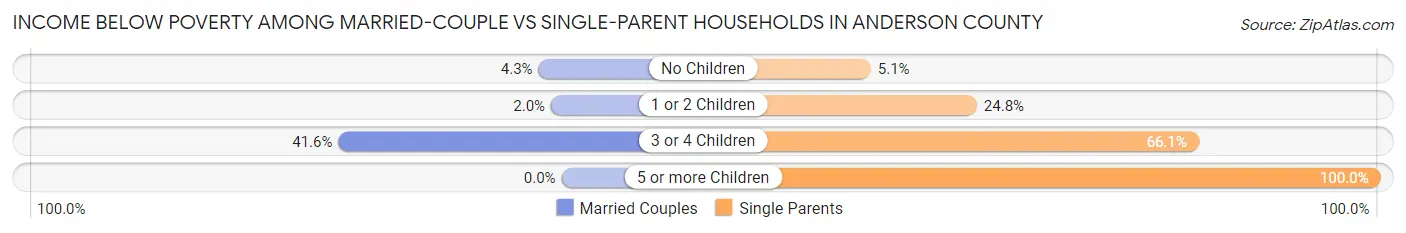
| Children | Married-Couple Families | Single-Parent Households |
| No Children | 210 (4.3%) | 69 (5.1%) |
| 1 or 2 Children | 57 (2.0%) | 438 (24.8%) |
| 3 or 4 Children | 323 (41.6%) | 289 (66.1%) |
| 5 or more Children | 0 (0.0%) | 17 (100.0%) |
| Total | 590 (6.9%) | 813 (22.7%) |
Race in Anderson County
The most populous races in Anderson County are White / Caucasian (36,996 | 63.7%), Black / African American (11,225 | 19.3%), and Hispanic or Latino (10,644 | 18.3%).
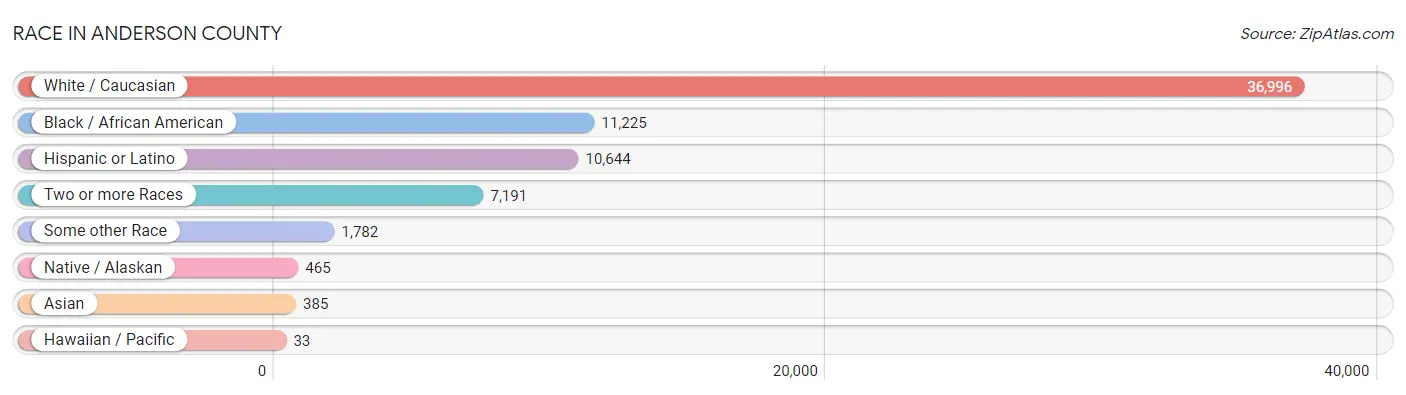
| Race | # Population | % Population |
| Asian | 385 | 0.7% |
| Black / African American | 11,225 | 19.3% |
| Hawaiian / Pacific | 33 | 0.1% |
| Hispanic or Latino | 10,644 | 18.3% |
| Native / Alaskan | 465 | 0.8% |
| White / Caucasian | 36,996 | 63.7% |
| Two or more Races | 7,191 | 12.4% |
| Some other Race | 1,782 | 3.1% |
| Total | 58,077 | 100.0% |
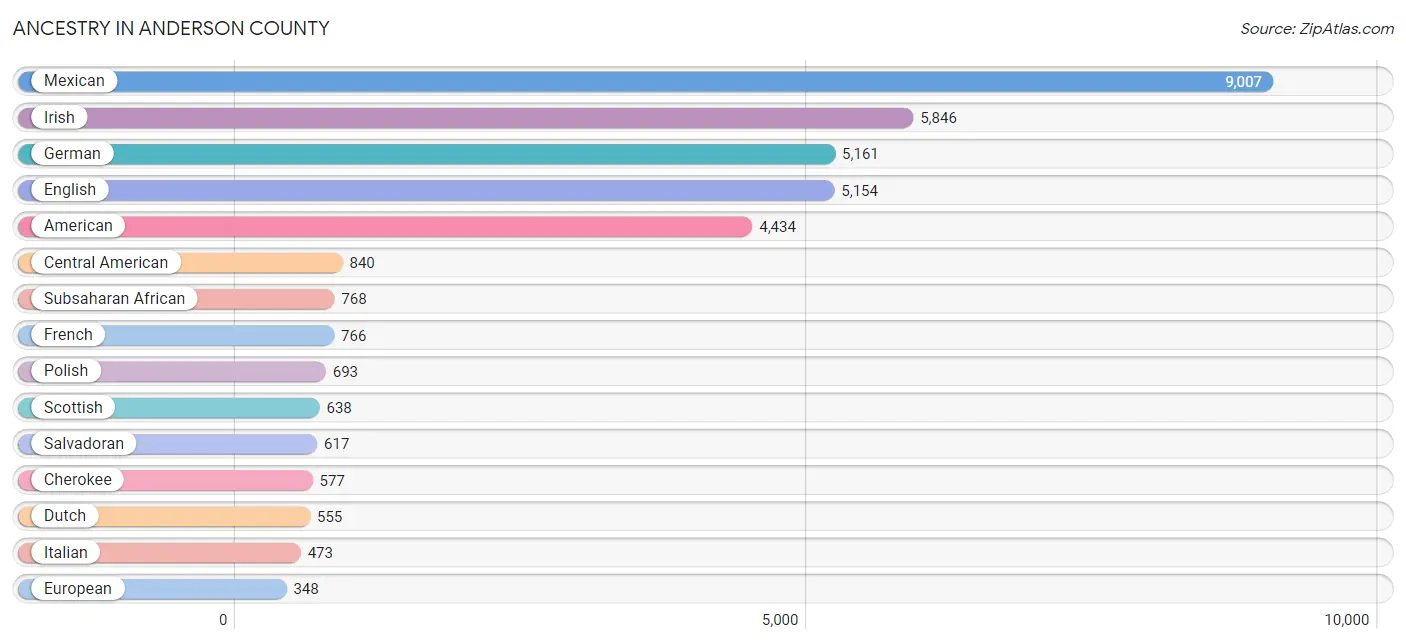
Ancestry in Anderson County
The most populous ancestries reported in Anderson County are Mexican (9,007 | 15.5%), Irish (5,846 | 10.1%), German (5,161 | 8.9%), English (5,154 | 8.9%), and American (4,434 | 7.6%), together accounting for 51.0% of all Anderson County residents.
| Ancestry | # Population | % Population |
| African | 291 | 0.5% |
| Alsatian | 1 | 0.0% |
| American | 4,434 | 7.6% |
| Apache | 287 | 0.5% |
| Arab | 14 | 0.0% |
| Austrian | 18 | 0.0% |
| Belgian | 47 | 0.1% |
| Bhutanese | 7 | 0.0% |
| Blackfeet | 109 | 0.2% |
| Brazilian | 13 | 0.0% |
| British | 319 | 0.5% |
| Burmese | 15 | 0.0% |
| Canadian | 49 | 0.1% |
| Celtic | 8 | 0.0% |
| Central American | 840 | 1.5% |
| Central American Indian | 39 | 0.1% |
| Cherokee | 577 | 1.0% |
| Chickasaw | 313 | 0.5% |
| Chippewa | 26 | 0.0% |
| Choctaw | 50 | 0.1% |
| Colombian | 16 | 0.0% |
| Comanche | 276 | 0.5% |
| Cree | 10 | 0.0% |
| Croatian | 12 | 0.0% |
| Cuban | 16 | 0.0% |
| Czech | 84 | 0.1% |
| Danish | 6 | 0.0% |
| Dominican | 12 | 0.0% |
| Dutch | 555 | 1.0% |
| Dutch West Indian | 15 | 0.0% |
| Eastern European | 60 | 0.1% |
| English | 5,154 | 8.9% |
| European | 348 | 0.6% |
| Finnish | 10 | 0.0% |
| French | 766 | 1.3% |
| French Canadian | 55 | 0.1% |
| German | 5,161 | 8.9% |
| German Russian | 7 | 0.0% |
| Ghanaian | 25 | 0.0% |
| Greek | 85 | 0.2% |
| Guatemalan | 164 | 0.3% |
| Guyanese | 27 | 0.1% |
| Honduran | 45 | 0.1% |
| Hungarian | 8 | 0.0% |
| Indian (Asian) | 5 | 0.0% |
| Indonesian | 25 | 0.0% |
| Irish | 5,846 | 10.1% |
| Iroquois | 9 | 0.0% |
| Italian | 473 | 0.8% |
| Jamaican | 7 | 0.0% |
| Korean | 190 | 0.3% |
| Laotian | 40 | 0.1% |
| Lebanese | 14 | 0.0% |
| Lithuanian | 11 | 0.0% |
| Malaysian | 6 | 0.0% |
| Mexican | 9,007 | 15.5% |
| Mexican American Indian | 93 | 0.2% |
| Native Hawaiian | 33 | 0.1% |
| Navajo | 46 | 0.1% |
| Nicaraguan | 14 | 0.0% |
| Nigerian | 111 | 0.2% |
| Northern European | 37 | 0.1% |
| Norwegian | 230 | 0.4% |
| Osage | 3 | 0.0% |
| Pakistani | 15 | 0.0% |
| Polish | 693 | 1.2% |
| Portuguese | 73 | 0.1% |
| Puerto Rican | 253 | 0.4% |
| Russian | 28 | 0.1% |
| Salvadoran | 617 | 1.1% |
| Scandinavian | 117 | 0.2% |
| Scotch-Irish | 258 | 0.4% |
| Scottish | 638 | 1.1% |
| Sioux | 114 | 0.2% |
| Slavic | 19 | 0.0% |
| South American | 16 | 0.0% |
| South American Indian | 13 | 0.0% |
| Spaniard | 71 | 0.1% |
| Spanish | 188 | 0.3% |
| Spanish American | 19 | 0.0% |
| Sri Lankan | 209 | 0.4% |
| Subsaharan African | 768 | 1.3% |
| Swedish | 112 | 0.2% |
| Swiss | 48 | 0.1% |
| Thai | 12 | 0.0% |
| Trinidadian and Tobagonian | 8 | 0.0% |
| Turkish | 14 | 0.0% |
| U.S. Virgin Islander | 15 | 0.0% |
| Welsh | 248 | 0.4% | View All 89 Rows |
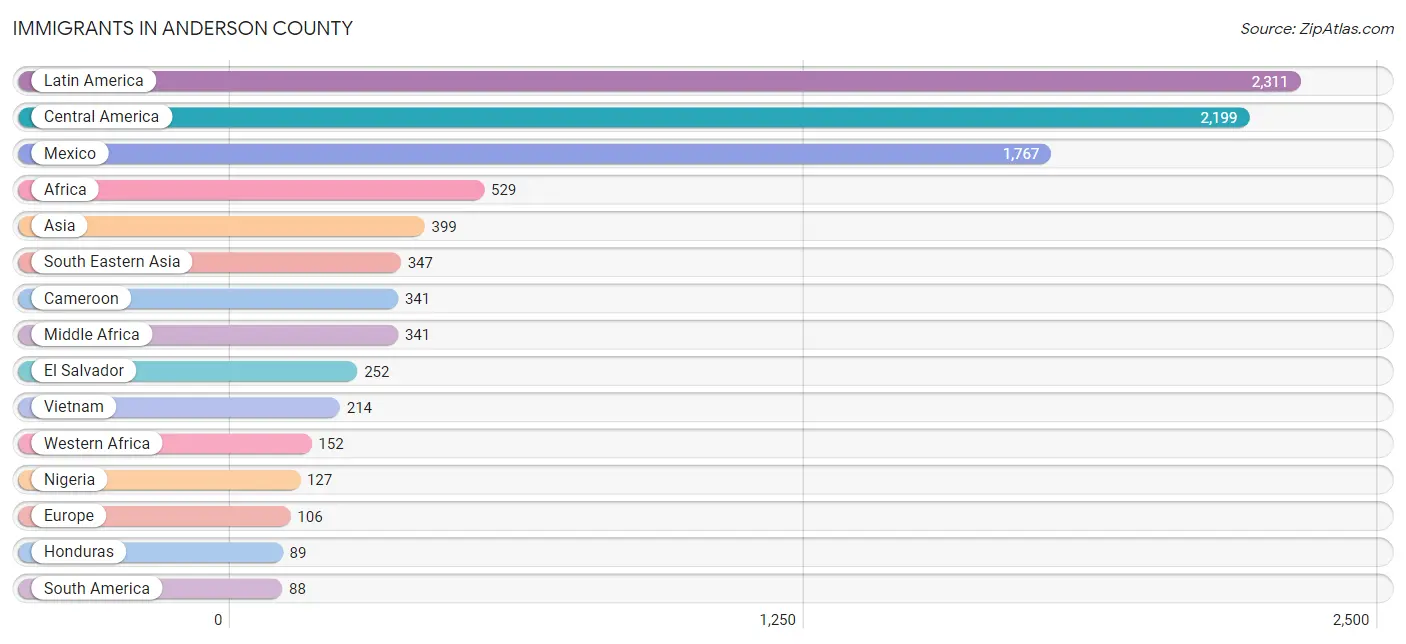
Immigrants in Anderson County
The most numerous immigrant groups reported in Anderson County came from Latin America (2,311 | 4.0%), Central America (2,199 | 3.8%), Mexico (1,767 | 3.0%), Africa (529 | 0.9%), and Asia (399 | 0.7%), together accounting for 12.4% of all Anderson County residents.
| Immigration Origin | # Population | % Population |
| Africa | 529 | 0.9% |
| Asia | 399 | 0.7% |
| Brazil | 65 | 0.1% |
| Cameroon | 341 | 0.6% |
| Canada | 49 | 0.1% |
| Caribbean | 24 | 0.0% |
| Central America | 2,199 | 3.8% |
| Colombia | 16 | 0.0% |
| Cuba | 4 | 0.0% |
| Dominican Republic | 12 | 0.0% |
| Eastern Asia | 5 | 0.0% |
| Eastern Europe | 16 | 0.0% |
| El Salvador | 252 | 0.4% |
| England | 12 | 0.0% |
| Europe | 106 | 0.2% |
| Germany | 51 | 0.1% |
| Ghana | 25 | 0.0% |
| Guatemala | 83 | 0.1% |
| Guyana | 7 | 0.0% |
| Honduras | 89 | 0.2% |
| India | 12 | 0.0% |
| Indonesia | 43 | 0.1% |
| Iran | 14 | 0.0% |
| Ireland | 2 | 0.0% |
| Korea | 5 | 0.0% |
| Laos | 6 | 0.0% |
| Latin America | 2,311 | 4.0% |
| Mexico | 1,767 | 3.0% |
| Middle Africa | 341 | 0.6% |
| Netherlands | 6 | 0.0% |
| Nigeria | 127 | 0.2% |
| Northern Europe | 14 | 0.0% |
| Pakistan | 21 | 0.0% |
| Philippines | 52 | 0.1% |
| Poland | 5 | 0.0% |
| Russia | 11 | 0.0% |
| South America | 88 | 0.2% |
| South Central Asia | 47 | 0.1% |
| South Eastern Asia | 347 | 0.6% |
| Switzerland | 19 | 0.0% |
| Trinidad and Tobago | 8 | 0.0% |
| Vietnam | 214 | 0.4% |
| Western Africa | 152 | 0.3% |
| Western Europe | 76 | 0.1% | View All 44 Rows |
Sex and Age in Anderson County
Sex and Age in Anderson County
The most populous age groups in Anderson County are 35 to 39 Years (3,478 | 9.7%) for men and 55 to 59 Years (1,599 | 7.2%) for women.
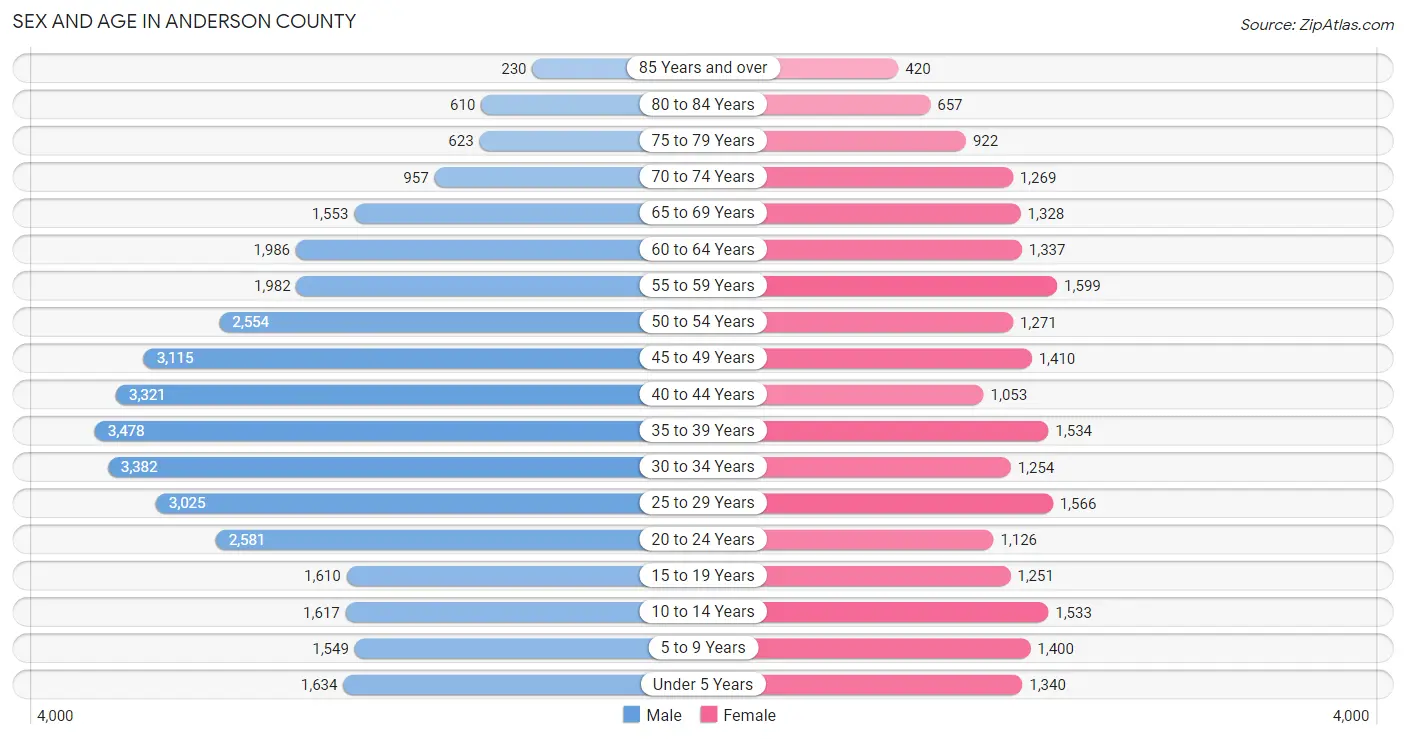
| Age Bracket | Male | Female |
| Under 5 Years | 1,634 (4.6%) | 1,340 (6.0%) |
| 5 to 9 Years | 1,549 (4.3%) | 1,400 (6.3%) |
| 10 to 14 Years | 1,617 (4.5%) | 1,533 (6.9%) |
| 15 to 19 Years | 1,610 (4.5%) | 1,251 (5.6%) |
| 20 to 24 Years | 2,581 (7.2%) | 1,126 (5.1%) |
| 25 to 29 Years | 3,025 (8.5%) | 1,566 (7.0%) |
| 30 to 34 Years | 3,382 (9.5%) | 1,254 (5.6%) |
| 35 to 39 Years | 3,478 (9.7%) | 1,534 (6.9%) |
| 40 to 44 Years | 3,321 (9.3%) | 1,053 (4.7%) |
| 45 to 49 Years | 3,115 (8.7%) | 1,410 (6.3%) |
| 50 to 54 Years | 2,554 (7.1%) | 1,271 (5.7%) |
| 55 to 59 Years | 1,982 (5.5%) | 1,599 (7.2%) |
| 60 to 64 Years | 1,986 (5.6%) | 1,337 (6.0%) |
| 65 to 69 Years | 1,553 (4.3%) | 1,328 (6.0%) |
| 70 to 74 Years | 957 (2.7%) | 1,269 (5.7%) |
| 75 to 79 Years | 623 (1.7%) | 922 (4.1%) |
| 80 to 84 Years | 610 (1.7%) | 657 (2.9%) |
| 85 Years and over | 230 (0.6%) | 420 (1.9%) |
| Total | 35,807 (100.0%) | 22,270 (100.0%) |
Families and Households in Anderson County
Median Family Size in Anderson County
The median family size in Anderson County is 3.17 persons per family, with married-couple families (8,567 | 70.5%) accounting for the largest median family size of 3.22 persons per family. On the other hand, single female/mother families (2,813 | 23.2%) represent the smallest median family size with 3.07 persons per family.
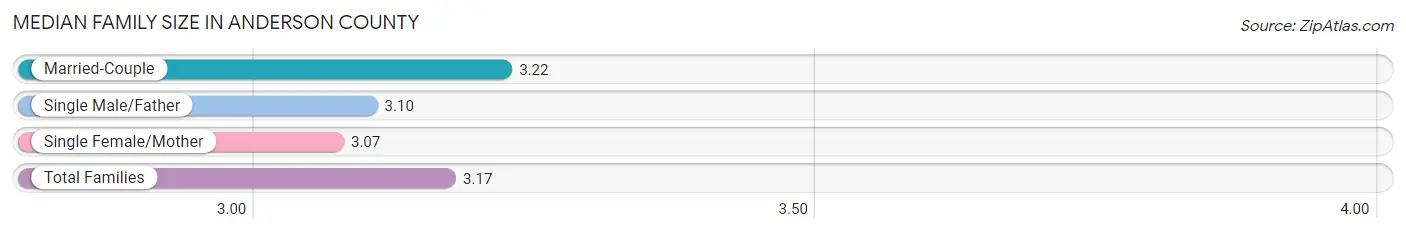
| Family Type | # Families | Family Size |
| Married-Couple | 8,567 (70.5%) | 3.22 |
| Single Male/Father | 770 (6.3%) | 3.10 |
| Single Female/Mother | 2,813 (23.2%) | 3.07 |
| Total Families | 12,150 (100.0%) | 3.17 |
Median Household Size in Anderson County
The median household size in Anderson County is 2.69 persons per household, with single male/father households (770 | 4.6%) accounting for the largest median household size of 3.46 persons per household. non-family households (4,749 | 28.1%) represent the smallest median household size with 1.18 persons per household.
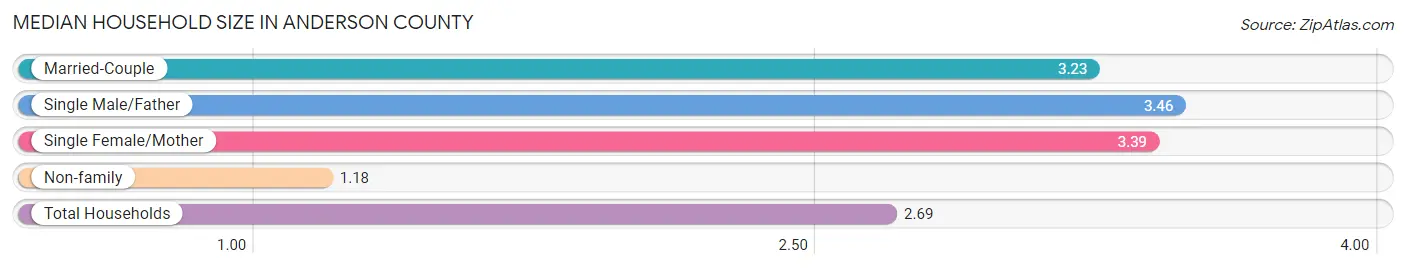
| Household Type | # Households | Household Size |
| Married-Couple | 8,567 (50.7%) | 3.23 |
| Single Male/Father | 770 (4.6%) | 3.46 |
| Single Female/Mother | 2,813 (16.7%) | 3.39 |
| Non-family | 4,749 (28.1%) | 1.18 |
| Total Households | 16,899 (100.0%) | 2.69 |
Household Size by Marriage Status in Anderson County
Out of a total of 16,899 households in Anderson County, 12,150 (71.9%) are family households, while 4,749 (28.1%) are nonfamily households. The most numerous type of family households are 2-person households, comprising 5,278, and the most common type of nonfamily households are 1-person households, comprising 4,133.
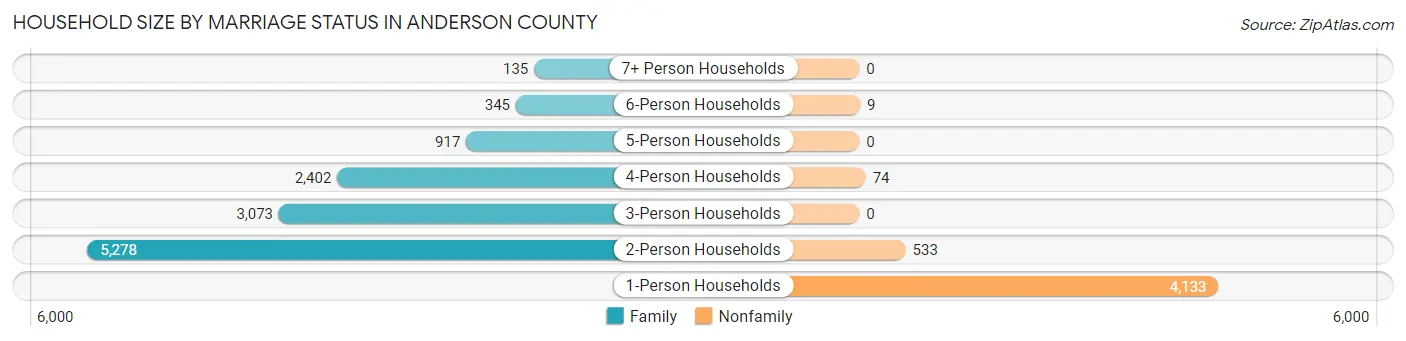
| Household Size | Family Households | Nonfamily Households |
| 1-Person Households | - | 4,133 (24.5%) |
| 2-Person Households | 5,278 (31.2%) | 533 (3.2%) |
| 3-Person Households | 3,073 (18.2%) | 0 (0.0%) |
| 4-Person Households | 2,402 (14.2%) | 74 (0.4%) |
| 5-Person Households | 917 (5.4%) | 0 (0.0%) |
| 6-Person Households | 345 (2.0%) | 9 (0.1%) |
| 7+ Person Households | 135 (0.8%) | 0 (0.0%) |
| Total | 12,150 (71.9%) | 4,749 (28.1%) |
Female Fertility in Anderson County
Fertility by Age in Anderson County
Average fertility rate in Anderson County is 49.0 births per 1,000 women. Women in the age bracket of 20 to 34 years have the highest fertility rate with 100.0 births per 1,000 women. Women in the age bracket of 20 to 34 years acount for 86.0% of all women with births.
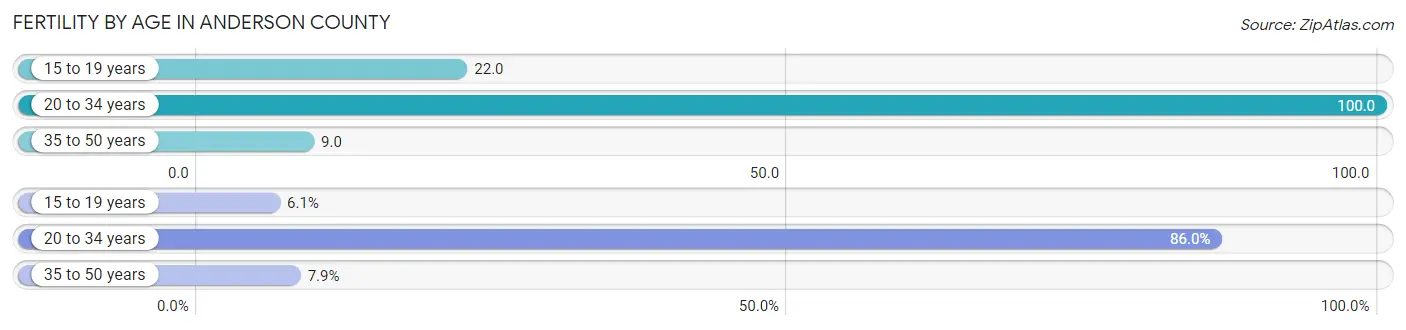
| Age Bracket | Women with Births | Births / 1,000 Women |
| 15 to 19 years | 28 (6.1%) | 22.0 |
| 20 to 34 years | 394 (86.0%) | 100.0 |
| 35 to 50 years | 36 (7.9%) | 9.0 |
| Total | 458 (100.0%) | 49.0 |
Fertility by Age by Marriage Status in Anderson County
70.7% of women with births (458) in Anderson County are married. The highest percentage of unmarried women with births falls into 15 to 19 years age bracket with 100.0% of them unmarried at the time of birth, while the lowest percentage of unmarried women with births belong to 35 to 50 years age bracket with 0.0% of them unmarried.
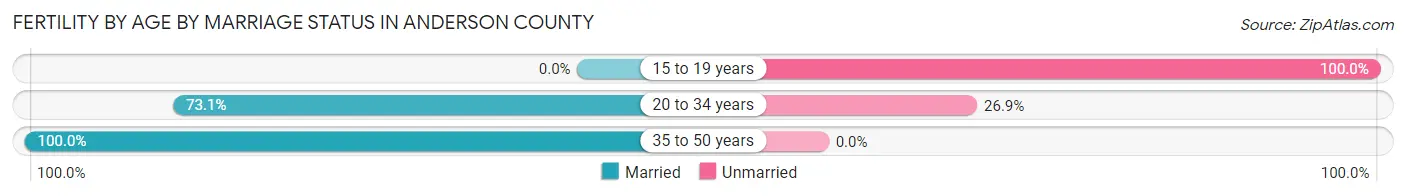
| Age Bracket | Married | Unmarried |
| 15 to 19 years | 0 (0.0%) | 28 (100.0%) |
| 20 to 34 years | 288 (73.1%) | 106 (26.9%) |
| 35 to 50 years | 36 (100.0%) | 0 (0.0%) |
| Total | 324 (70.7%) | 134 (29.3%) |
Fertility by Education in Anderson County
Average fertility rate in Anderson County is 49.0 births per 1,000 women. Women with the education attainment of high school diploma have the highest fertility rate of 69.0 births per 1,000 women, while women with the education attainment of less than high school have the lowest fertility at 7.0 births per 1,000 women. Women with the education attainment of high school diploma represent 49.3% of all women with births.
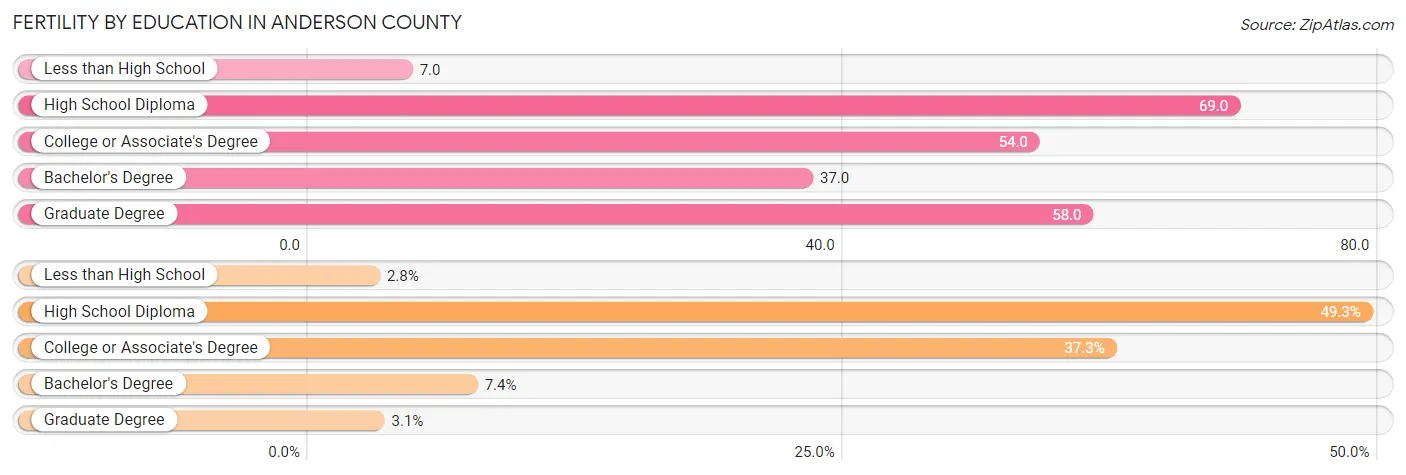
| Educational Attainment | Women with Births | Births / 1,000 Women |
| Less than High School | 13 (2.8%) | 7.0 |
| High School Diploma | 226 (49.3%) | 69.0 |
| College or Associate's Degree | 171 (37.3%) | 54.0 |
| Bachelor's Degree | 34 (7.4%) | 37.0 |
| Graduate Degree | 14 (3.1%) | 58.0 |
| Total | 458 (100.0%) | 49.0 |
Fertility by Education by Marriage Status in Anderson County
29.3% of women with births in Anderson County are unmarried. Women with the educational attainment of bachelor's degree are most likely to be married with 100.0% of them married at childbirth, while women with the educational attainment of less than high school are least likely to be married with 100.0% of them unmarried at childbirth.
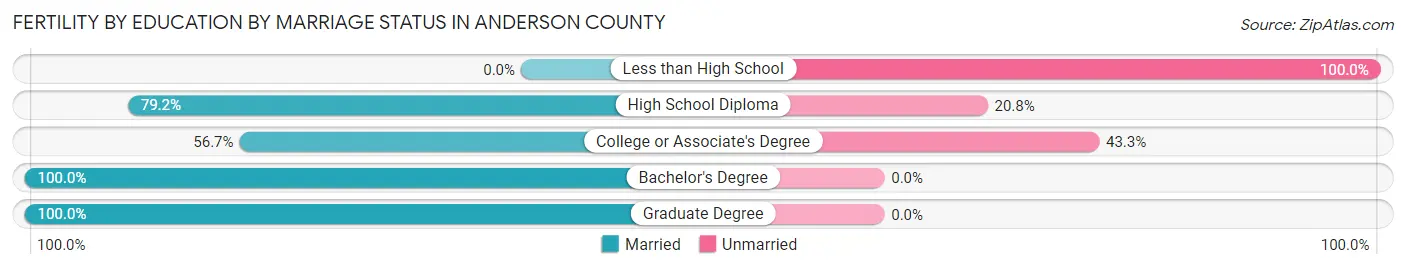
| Educational Attainment | Married | Unmarried |
| Less than High School | 0 (0.0%) | 13 (100.0%) |
| High School Diploma | 179 (79.2%) | 47 (20.8%) |
| College or Associate's Degree | 97 (56.7%) | 74 (43.3%) |
| Bachelor's Degree | 34 (100.0%) | 0 (0.0%) |
| Graduate Degree | 14 (100.0%) | 0 (0.0%) |
| Total | 324 (70.7%) | 134 (29.3%) |
Employment Characteristics in Anderson County
Employment by Class of Employer in Anderson County
Among the 19,753 employed individuals in Anderson County, private company employees (12,382 | 62.7%), state government employees (2,571 | 13.0%), and local government employees (1,862 | 9.4%) make up the most common classes of employment.
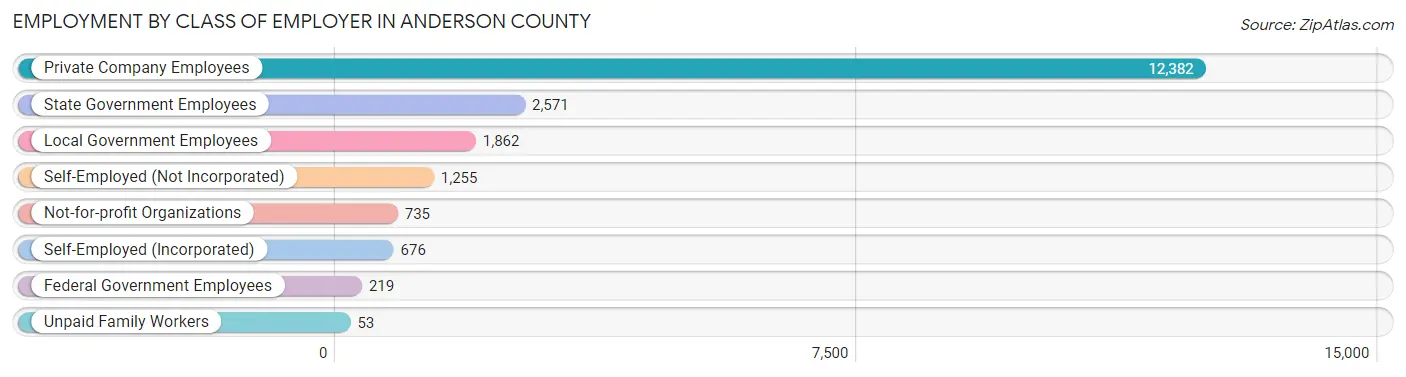
| Employer Class | # Employees | % Employees |
| Private Company Employees | 12,382 | 62.7% |
| Self-Employed (Incorporated) | 676 | 3.4% |
| Self-Employed (Not Incorporated) | 1,255 | 6.4% |
| Not-for-profit Organizations | 735 | 3.7% |
| Local Government Employees | 1,862 | 9.4% |
| State Government Employees | 2,571 | 13.0% |
| Federal Government Employees | 219 | 1.1% |
| Unpaid Family Workers | 53 | 0.3% |
| Total | 19,753 | 100.0% |
Employment Status by Age in Anderson County
According to the labor force statistics for Anderson County, out of the total population over 16 years of age (48,393), 43.1% or 20,857 individuals are in the labor force, with 3.9% or 813 of them unemployed. The age group with the highest labor force participation rate is 25 to 29 years, with 60.1% or 2,759 individuals in the labor force. Within the labor force, the 16 to 19 years age range has the highest percentage of unemployed individuals, with 12.0% or 93 of them being unemployed.
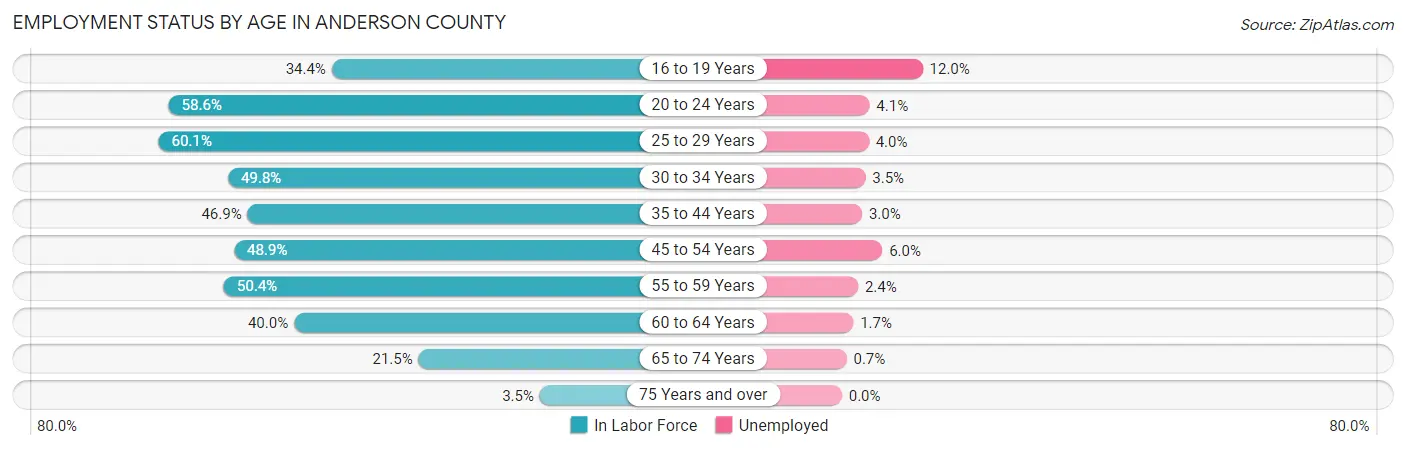
| Age Bracket | In Labor Force | Unemployed |
| 16 to 19 Years | 774 (34.4%) | 93 (12.0%) |
| 20 to 24 Years | 2,172 (58.6%) | 89 (4.1%) |
| 25 to 29 Years | 2,759 (60.1%) | 110 (4.0%) |
| 30 to 34 Years | 2,309 (49.8%) | 81 (3.5%) |
| 35 to 44 Years | 4,402 (46.9%) | 132 (3.0%) |
| 45 to 54 Years | 4,083 (48.9%) | 245 (6.0%) |
| 55 to 59 Years | 1,805 (50.4%) | 43 (2.4%) |
| 60 to 64 Years | 1,329 (40.0%) | 23 (1.7%) |
| 65 to 74 Years | 1,098 (21.5%) | 8 (0.7%) |
| 75 Years and over | 121 (3.5%) | 0 (0.0%) |
| Total | 20,857 (43.1%) | 813 (3.9%) |
Employment Status by Educational Attainment in Anderson County
According to labor force statistics for Anderson County, 49.2% of individuals (16,663) out of the total population between 25 and 64 years of age (33,867) are in the labor force, with 3.8% or 633 of them being unemployed. The group with the highest labor force participation rate are those with the educational attainment of bachelor's degree or higher, with 77.3% or 2,896 individuals in the labor force. Within the labor force, individuals with high school diploma education have the highest percentage of unemployment, with 4.4% or 280 of them being unemployed.
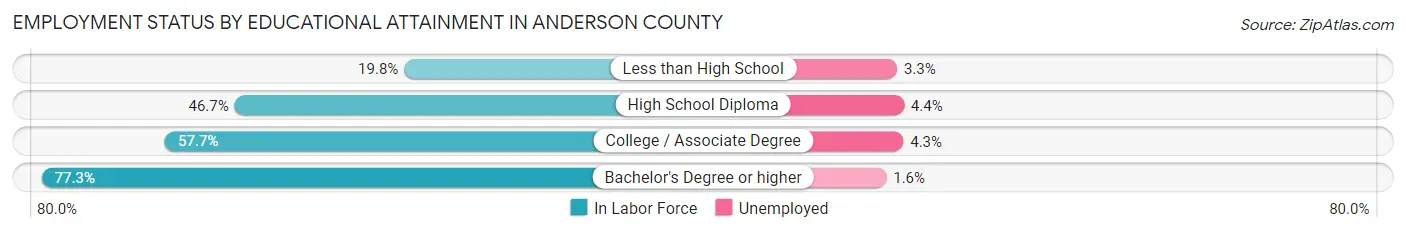
| Educational Attainment | In Labor Force | Unemployed |
| Less than High School | 1,093 (19.8%) | 182 (3.3%) |
| High School Diploma | 6,359 (46.7%) | 599 (4.4%) |
| College / Associate Degree | 6,337 (57.7%) | 472 (4.3%) |
| Bachelor's Degree or higher | 2,896 (77.3%) | 60 (1.6%) |
| Total | 16,663 (49.2%) | 1,287 (3.8%) |
Employment Occupations by Sex in Anderson County
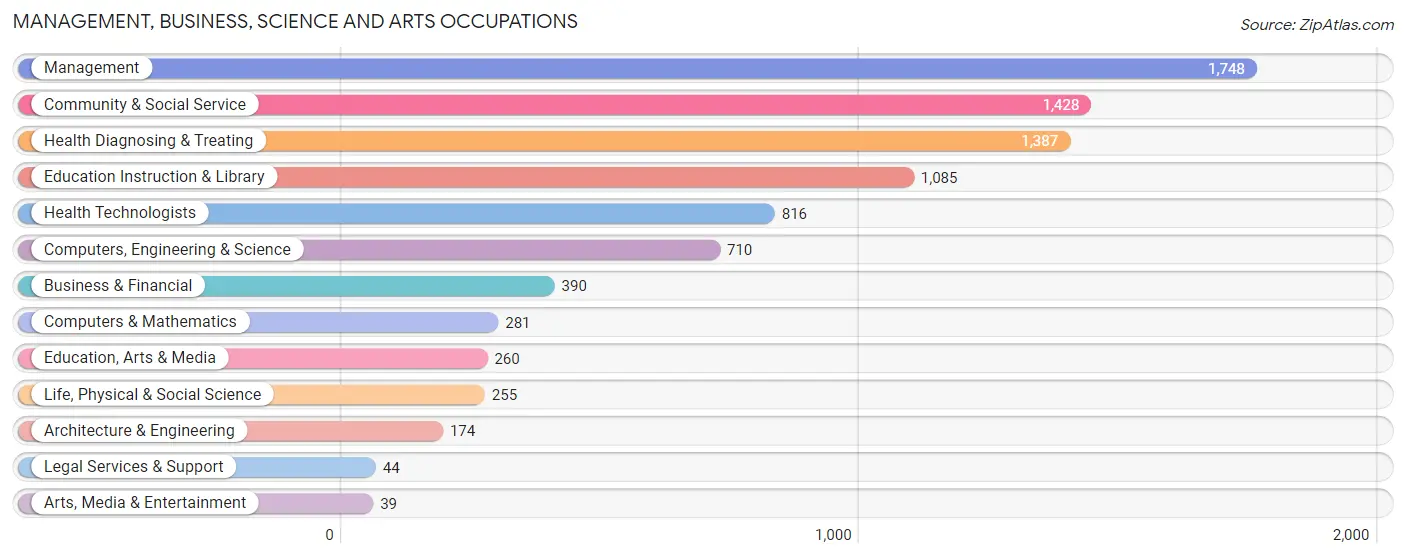
Management, Business, Science and Arts Occupations
The most common Management, Business, Science and Arts occupations in Anderson County are Management (1,748 | 8.7%), Community & Social Service (1,428 | 7.1%), Health Diagnosing & Treating (1,387 | 6.9%), Education Instruction & Library (1,085 | 5.4%), and Health Technologists (816 | 4.1%).
Management, Business, Science and Arts Occupations by Sex
Within the Management, Business, Science and Arts occupations in Anderson County, the most male-oriented occupations are Life, Physical & Social Science (89.0%), Management (80.4%), and Computers, Engineering & Science (76.1%), while the most female-oriented occupations are Education, Arts & Media (84.2%), Health Diagnosing & Treating (80.0%), and Legal Services & Support (79.5%).
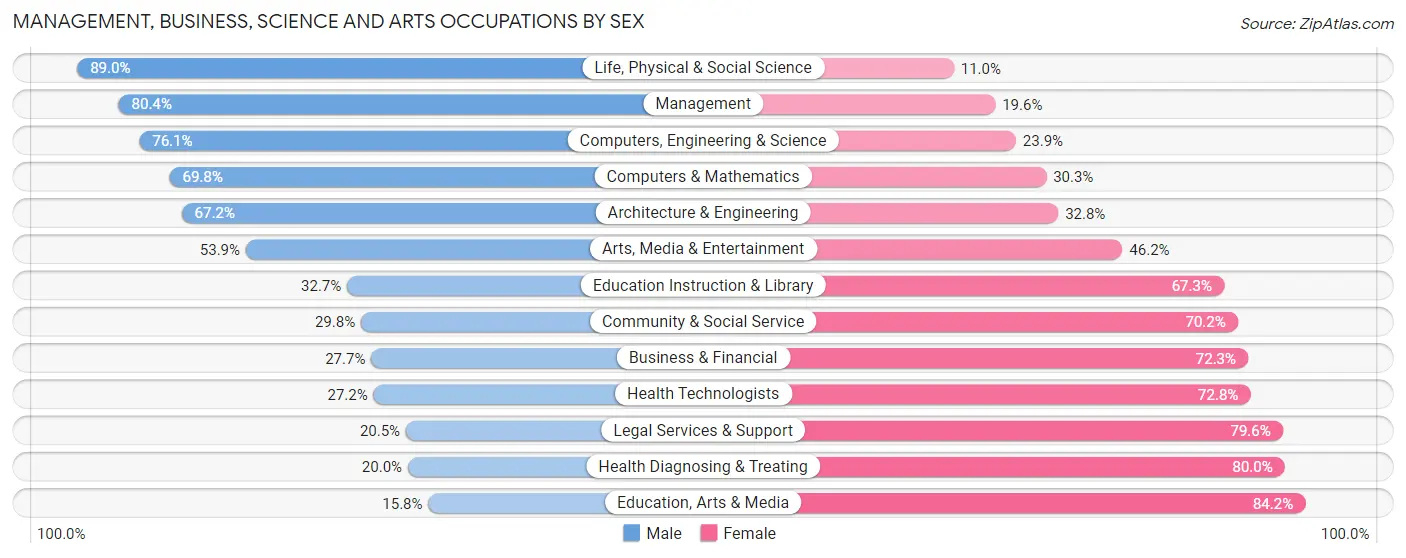
| Occupation | Male | Female |
| Management | 1,405 (80.4%) | 343 (19.6%) |
| Business & Financial | 108 (27.7%) | 282 (72.3%) |
| Computers, Engineering & Science | 540 (76.1%) | 170 (23.9%) |
| Computers & Mathematics | 196 (69.8%) | 85 (30.2%) |
| Architecture & Engineering | 117 (67.2%) | 57 (32.8%) |
| Life, Physical & Social Science | 227 (89.0%) | 28 (11.0%) |
| Community & Social Service | 426 (29.8%) | 1,002 (70.2%) |
| Education, Arts & Media | 41 (15.8%) | 219 (84.2%) |
| Legal Services & Support | 9 (20.4%) | 35 (79.5%) |
| Education Instruction & Library | 355 (32.7%) | 730 (67.3%) |
| Arts, Media & Entertainment | 21 (53.8%) | 18 (46.2%) |
| Health Diagnosing & Treating | 278 (20.0%) | 1,109 (80.0%) |
| Health Technologists | 222 (27.2%) | 594 (72.8%) |
| Total (Category) | 2,757 (48.7%) | 2,906 (51.3%) |
| Total (Overall) | 11,481 (57.4%) | 8,524 (42.6%) |
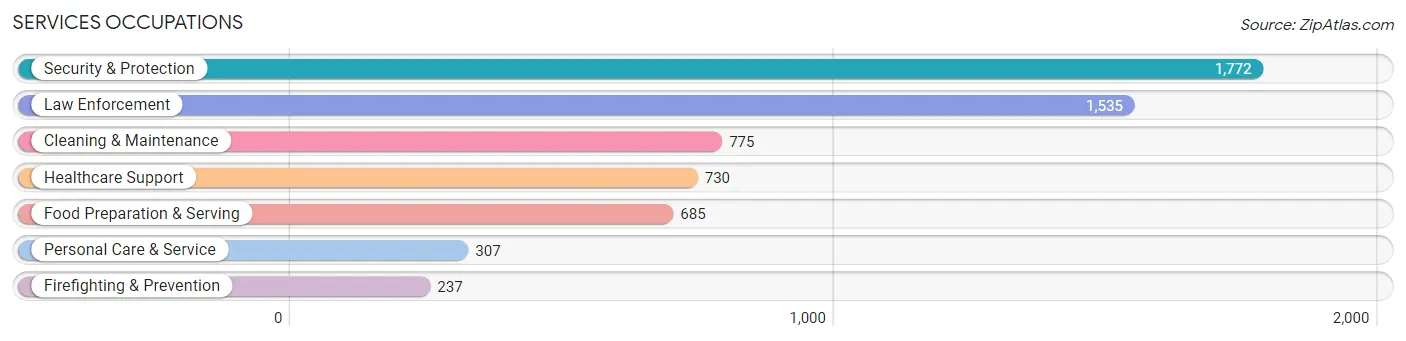
Services Occupations
The most common Services occupations in Anderson County are Security & Protection (1,772 | 8.9%), Law Enforcement (1,535 | 7.7%), Cleaning & Maintenance (775 | 3.9%), Healthcare Support (730 | 3.6%), and Food Preparation & Serving (685 | 3.4%).
Services Occupations by Sex
Within the Services occupations in Anderson County, the most male-oriented occupations are Law Enforcement (72.6%), Security & Protection (72.0%), and Firefighting & Prevention (67.5%), while the most female-oriented occupations are Healthcare Support (86.4%), Personal Care & Service (67.7%), and Food Preparation & Serving (66.7%).
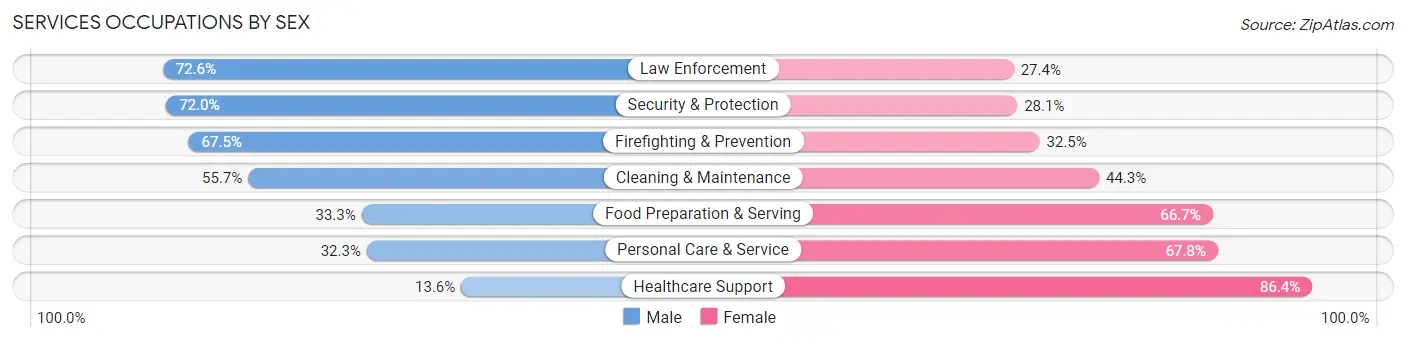
| Occupation | Male | Female |
| Healthcare Support | 99 (13.6%) | 631 (86.4%) |
| Security & Protection | 1,275 (72.0%) | 497 (28.1%) |
| Firefighting & Prevention | 160 (67.5%) | 77 (32.5%) |
| Law Enforcement | 1,115 (72.6%) | 420 (27.4%) |
| Food Preparation & Serving | 228 (33.3%) | 457 (66.7%) |
| Cleaning & Maintenance | 432 (55.7%) | 343 (44.3%) |
| Personal Care & Service | 99 (32.3%) | 208 (67.7%) |
| Total (Category) | 2,133 (50.0%) | 2,136 (50.0%) |
| Total (Overall) | 11,481 (57.4%) | 8,524 (42.6%) |
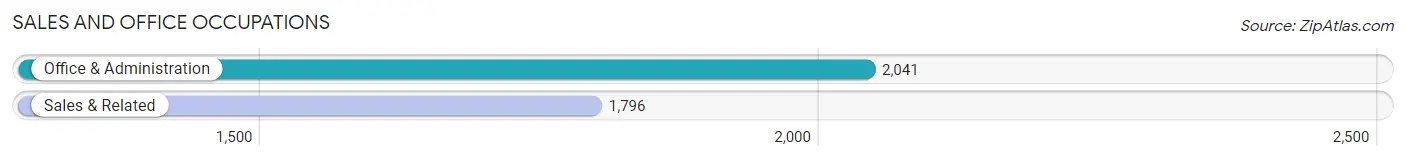
Sales and Office Occupations
The most common Sales and Office occupations in Anderson County are Office & Administration (2,041 | 10.2%), and Sales & Related (1,796 | 9.0%).
Sales and Office Occupations by Sex
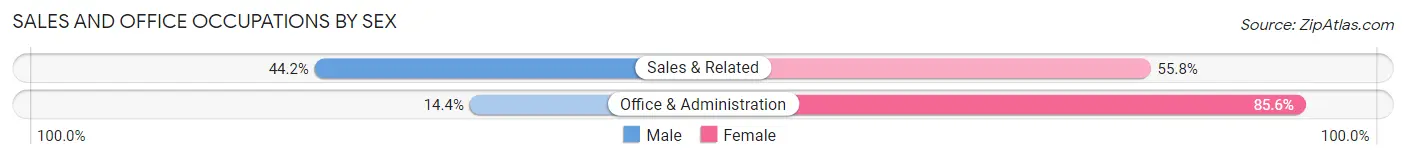
| Occupation | Male | Female |
| Sales & Related | 794 (44.2%) | 1,002 (55.8%) |
| Office & Administration | 294 (14.4%) | 1,747 (85.6%) |
| Total (Category) | 1,088 (28.4%) | 2,749 (71.6%) |
| Total (Overall) | 11,481 (57.4%) | 8,524 (42.6%) |
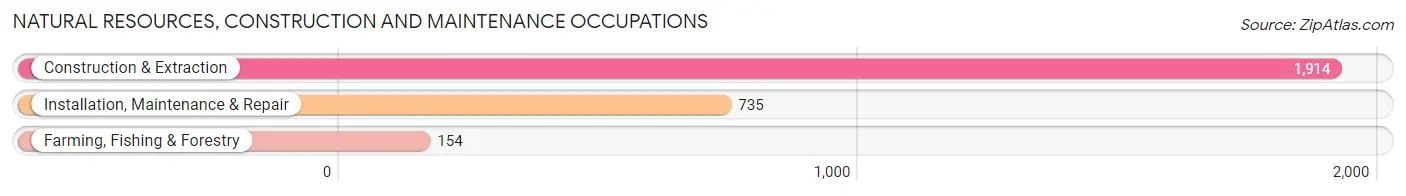
Natural Resources, Construction and Maintenance Occupations
The most common Natural Resources, Construction and Maintenance occupations in Anderson County are Construction & Extraction (1,914 | 9.6%), Installation, Maintenance & Repair (735 | 3.7%), and Farming, Fishing & Forestry (154 | 0.8%).
Natural Resources, Construction and Maintenance Occupations by Sex
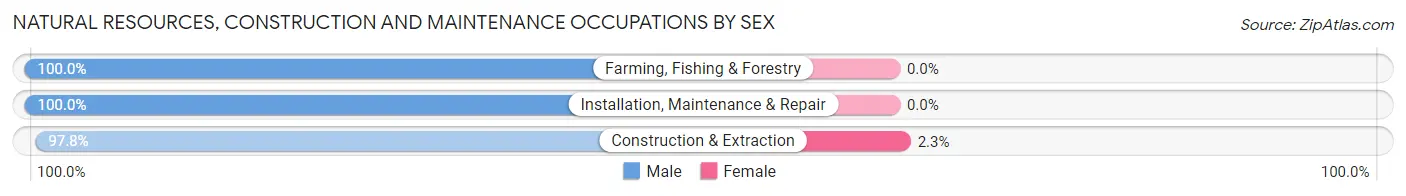
| Occupation | Male | Female |
| Farming, Fishing & Forestry | 154 (100.0%) | 0 (0.0%) |
| Construction & Extraction | 1,871 (97.8%) | 43 (2.2%) |
| Installation, Maintenance & Repair | 735 (100.0%) | 0 (0.0%) |
| Total (Category) | 2,760 (98.5%) | 43 (1.5%) |
| Total (Overall) | 11,481 (57.4%) | 8,524 (42.6%) |
Production, Transportation and Moving Occupations
The most common Production, Transportation and Moving occupations in Anderson County are Material Moving (1,713 | 8.6%), Production (951 | 4.8%), and Transportation (769 | 3.8%).
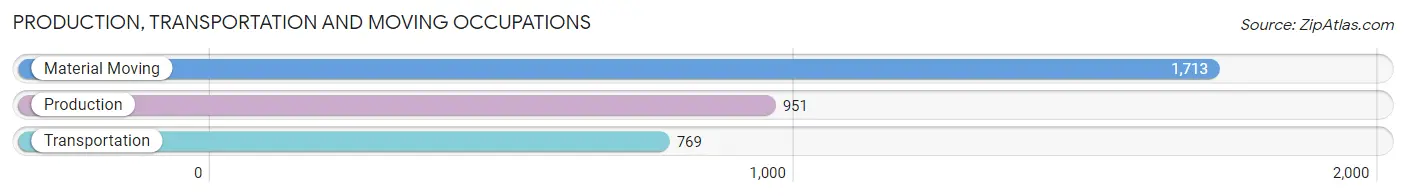
Production, Transportation and Moving Occupations by Sex
| Occupation | Male | Female |
| Production | 721 (75.8%) | 230 (24.2%) |
| Transportation | 695 (90.4%) | 74 (9.6%) |
| Material Moving | 1,327 (77.5%) | 386 (22.5%) |
| Total (Category) | 2,743 (79.9%) | 690 (20.1%) |
| Total (Overall) | 11,481 (57.4%) | 8,524 (42.6%) |
Employment Industries by Sex in Anderson County
Employment Industries in Anderson County
The major employment industries in Anderson County include Public Administration (2,730 | 13.7%), Health Care & Social Assistance (2,560 | 12.8%), Retail Trade (2,301 | 11.5%), Construction (1,761 | 8.8%), and Manufacturing (1,652 | 8.3%).
Employment Industries by Sex in Anderson County
The Anderson County industries that see more men than women are Agriculture, Fishing & Hunting (96.1%), Construction (95.6%), and Mining, Quarrying, & Extraction (95.4%), whereas the industries that tend to have a higher number of women are Health Care & Social Assistance (83.9%), Real Estate, Rental & Leasing (79.7%), and Finance & Insurance (69.6%).
| Industry | Male | Female |
| Agriculture, Fishing & Hunting | 340 (96.1%) | 14 (4.0%) |
| Mining, Quarrying, & Extraction | 739 (95.4%) | 36 (4.6%) |
| Construction | 1,683 (95.6%) | 78 (4.4%) |
| Manufacturing | 1,279 (77.4%) | 373 (22.6%) |
| Wholesale Trade | 88 (48.6%) | 93 (51.4%) |
| Retail Trade | 1,208 (52.5%) | 1,093 (47.5%) |
| Transportation & Warehousing | 1,055 (78.7%) | 285 (21.3%) |
| Utilities | 186 (89.9%) | 21 (10.1%) |
| Information | 71 (58.7%) | 50 (41.3%) |
| Finance & Insurance | 170 (30.4%) | 389 (69.6%) |
| Real Estate, Rental & Leasing | 37 (20.3%) | 145 (79.7%) |
| Professional & Scientific | 293 (33.9%) | 571 (66.1%) |
| Enterprise Management | 13 (56.5%) | 10 (43.5%) |
| Administrative & Support | 319 (41.2%) | 455 (58.8%) |
| Educational Services | 540 (34.8%) | 1,012 (65.2%) |
| Health Care & Social Assistance | 412 (16.1%) | 2,148 (83.9%) |
| Arts, Entertainment & Recreation | 183 (81.7%) | 41 (18.3%) |
| Accommodation & Food Services | 472 (58.8%) | 331 (41.2%) |
| Public Administration | 1,690 (61.9%) | 1,040 (38.1%) |
| Total | 11,481 (57.4%) | 8,524 (42.6%) |
Education in Anderson County
School Enrollment in Anderson County
The most common levels of schooling among the 11,114 students in Anderson County are high school (2,869 | 25.8%), college / undergraduate (2,574 | 23.2%), and middle school (2,363 | 21.3%).
| School Level | # Students | % Students |
| Nursery / Preschool | 449 | 4.0% |
| Kindergarten | 343 | 3.1% |
| Elementary School | 2,291 | 20.6% |
| Middle School | 2,363 | 21.3% |
| High School | 2,869 | 25.8% |
| College / Undergraduate | 2,574 | 23.2% |
| Graduate / Professional | 225 | 2.0% |
| Total | 11,114 | 100.0% |
School Enrollment by Age by Funding Source in Anderson County
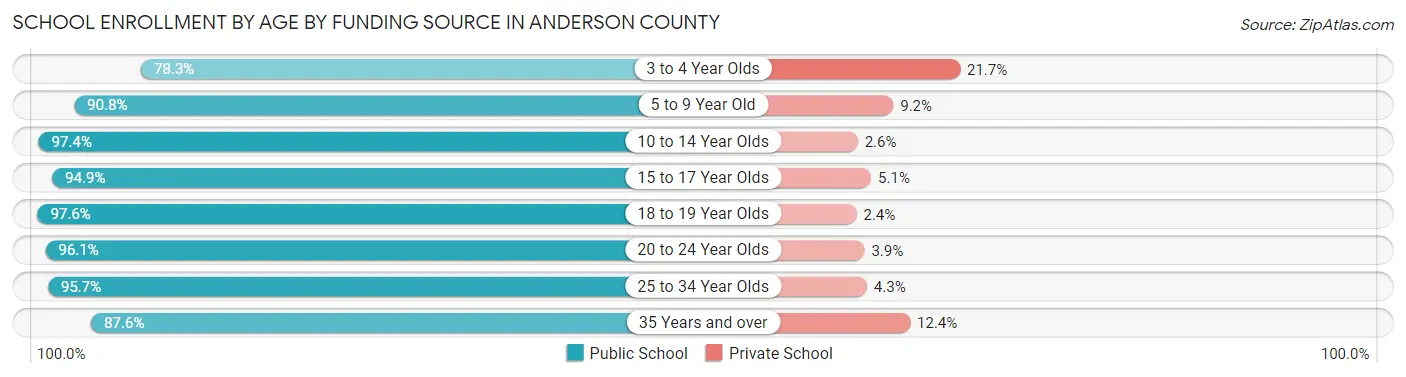
Out of a total of 11,114 students who are enrolled in schools in Anderson County, 689 (6.2%) attend a private institution, while the remaining 10,425 (93.8%) are enrolled in public schools. The age group of 3 to 4 year olds has the highest likelihood of being enrolled in private schools, with 49 (21.7% in the age bracket) enrolled. Conversely, the age group of 18 to 19 year olds has the lowest likelihood of being enrolled in a private school, with 570 (97.6% in the age bracket) attending a public institution.
| Age Bracket | Public School | Private School |
| 3 to 4 Year Olds | 177 (78.3%) | 49 (21.7%) |
| 5 to 9 Year Old | 2,230 (90.8%) | 227 (9.2%) |
| 10 to 14 Year Olds | 2,951 (97.4%) | 79 (2.6%) |
| 15 to 17 Year Olds | 1,762 (94.9%) | 95 (5.1%) |
| 18 to 19 Year Olds | 570 (97.6%) | 14 (2.4%) |
| 20 to 24 Year Olds | 694 (96.1%) | 28 (3.9%) |
| 25 to 34 Year Olds | 973 (95.7%) | 44 (4.3%) |
| 35 Years and over | 1,070 (87.6%) | 151 (12.4%) |
| Total | 10,425 (93.8%) | 689 (6.2%) |
Educational Attainment by Field of Study in Anderson County
Business (1,167 | 19.9%), education (927 | 15.8%), science & technology (723 | 12.3%), liberal arts & history (518 | 8.8%), and arts & humanities (435 | 7.4%) are the most common fields of study among 5,878 individuals in Anderson County who have obtained a bachelor's degree or higher.
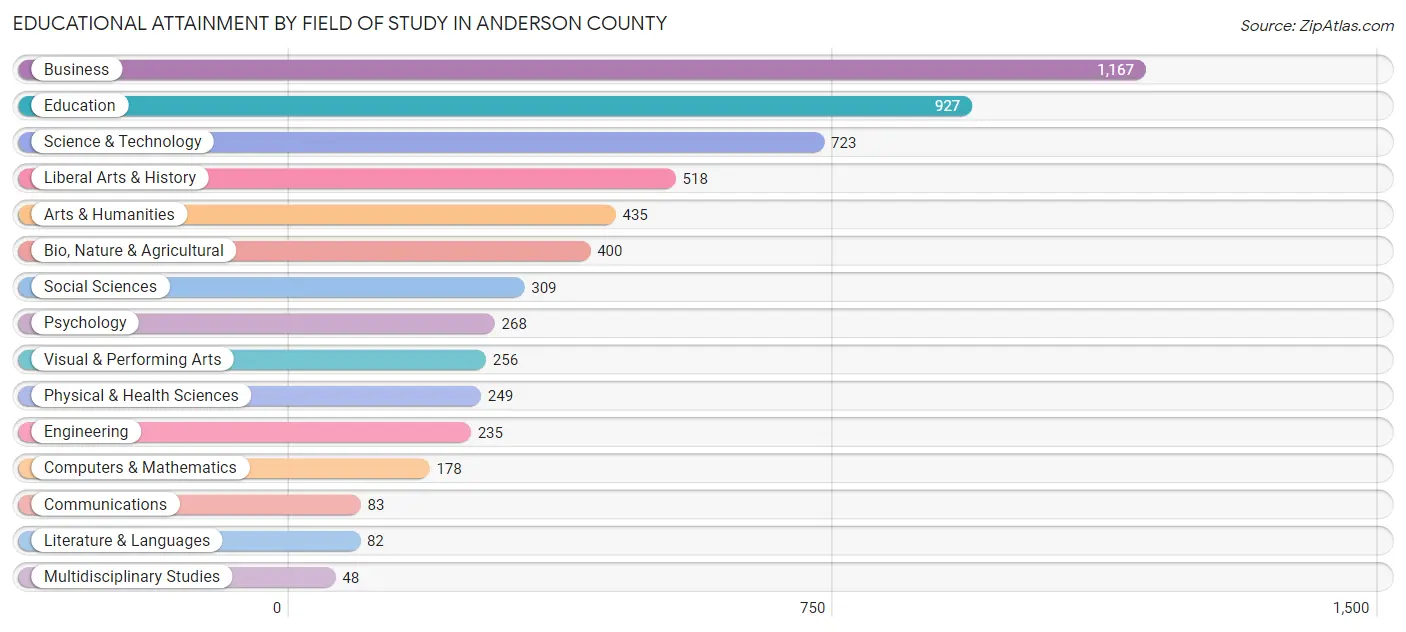
| Field of Study | # Graduates | % Graduates |
| Computers & Mathematics | 178 | 3.0% |
| Bio, Nature & Agricultural | 400 | 6.8% |
| Physical & Health Sciences | 249 | 4.2% |
| Psychology | 268 | 4.6% |
| Social Sciences | 309 | 5.3% |
| Engineering | 235 | 4.0% |
| Multidisciplinary Studies | 48 | 0.8% |
| Science & Technology | 723 | 12.3% |
| Business | 1,167 | 19.9% |
| Education | 927 | 15.8% |
| Literature & Languages | 82 | 1.4% |
| Liberal Arts & History | 518 | 8.8% |
| Visual & Performing Arts | 256 | 4.4% |
| Communications | 83 | 1.4% |
| Arts & Humanities | 435 | 7.4% |
| Total | 5,878 | 100.0% |
Transportation & Commute in Anderson County
Vehicle Availability by Sex in Anderson County
The most prevalent vehicle ownership categories in Anderson County are males with 2 vehicles (5,412, accounting for 47.8%) and females with 2 vehicles (3,986, making up 64.2%).
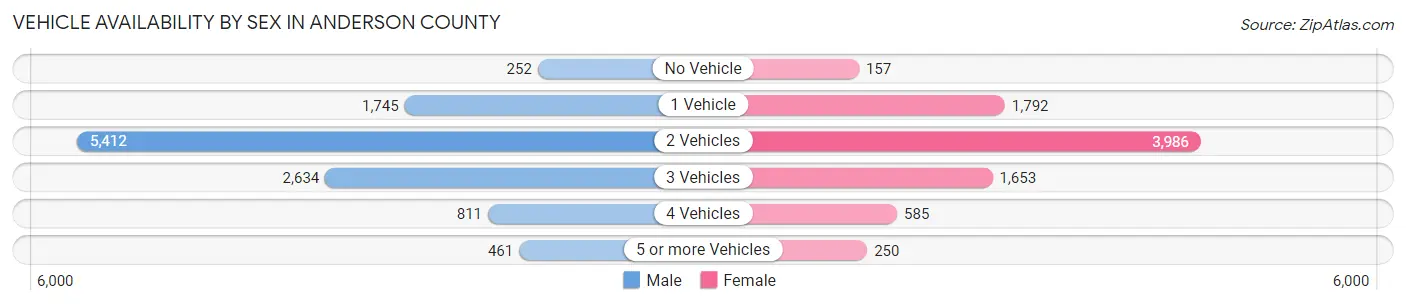
| Vehicles Available | Male | Female |
| No Vehicle | 252 (2.2%) | 157 (1.9%) |
| 1 Vehicle | 1,745 (15.4%) | 1,792 (21.3%) |
| 2 Vehicles | 5,412 (47.8%) | 3,986 (47.3%) |
| 3 Vehicles | 2,634 (23.3%) | 1,653 (19.6%) |
| 4 Vehicles | 811 (7.2%) | 585 (7.0%) |
| 5 or more Vehicles | 461 (4.1%) | 250 (3.0%) |
| Total | 11,315 (100.0%) | 8,423 (100.0%) |
Commute Time in Anderson County
The most frequently occuring commute durations in Anderson County are 5 to 9 minutes (3,467 commuters, 18.1%), 10 to 14 minutes (3,109 commuters, 16.3%), and 20 to 24 minutes (2,768 commuters, 14.5%).
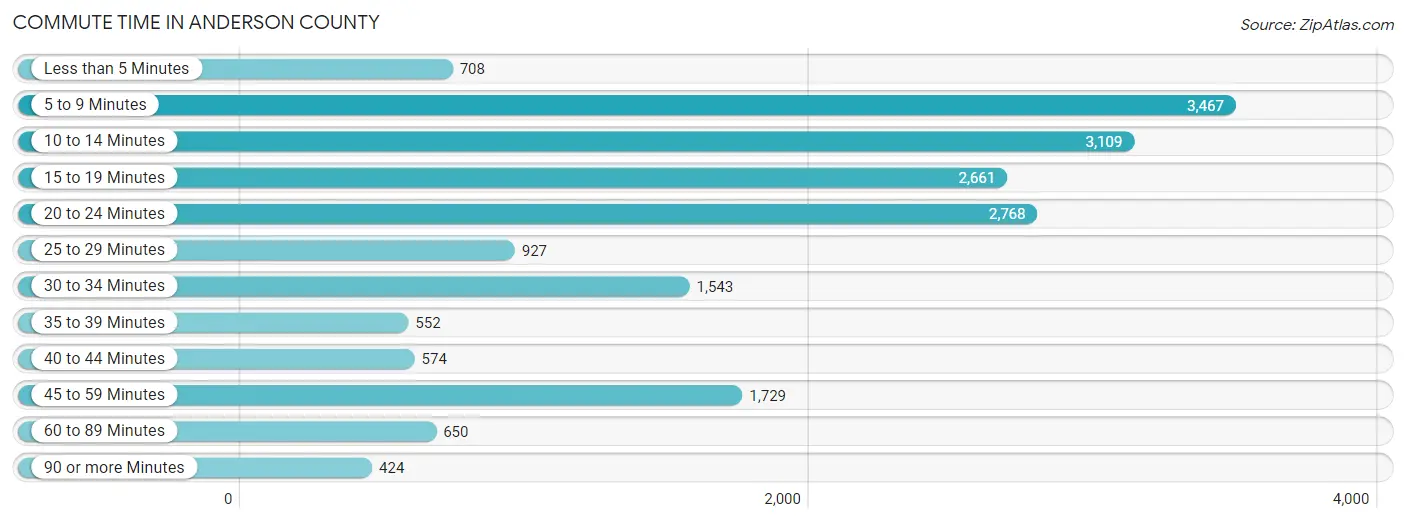
| Commute Time | # Commuters | % Commuters |
| Less than 5 Minutes | 708 | 3.7% |
| 5 to 9 Minutes | 3,467 | 18.1% |
| 10 to 14 Minutes | 3,109 | 16.3% |
| 15 to 19 Minutes | 2,661 | 13.9% |
| 20 to 24 Minutes | 2,768 | 14.5% |
| 25 to 29 Minutes | 927 | 4.9% |
| 30 to 34 Minutes | 1,543 | 8.1% |
| 35 to 39 Minutes | 552 | 2.9% |
| 40 to 44 Minutes | 574 | 3.0% |
| 45 to 59 Minutes | 1,729 | 9.0% |
| 60 to 89 Minutes | 650 | 3.4% |
| 90 or more Minutes | 424 | 2.2% |
Commute Time by Sex in Anderson County
The most common commute times in Anderson County are 5 to 9 minutes (1,777 commuters, 16.2%) for males and 5 to 9 minutes (1,690 commuters, 20.8%) for females.
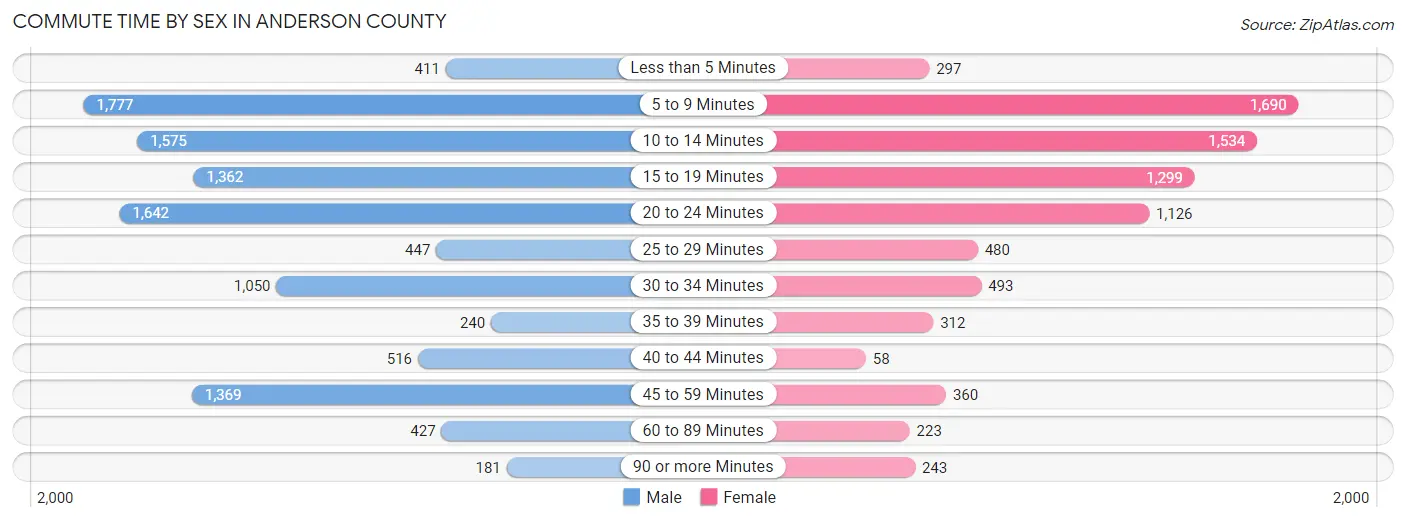
| Commute Time | Male | Female |
| Less than 5 Minutes | 411 (3.7%) | 297 (3.7%) |
| 5 to 9 Minutes | 1,777 (16.2%) | 1,690 (20.8%) |
| 10 to 14 Minutes | 1,575 (14.3%) | 1,534 (18.9%) |
| 15 to 19 Minutes | 1,362 (12.4%) | 1,299 (16.0%) |
| 20 to 24 Minutes | 1,642 (14.9%) | 1,126 (13.9%) |
| 25 to 29 Minutes | 447 (4.1%) | 480 (5.9%) |
| 30 to 34 Minutes | 1,050 (9.6%) | 493 (6.1%) |
| 35 to 39 Minutes | 240 (2.2%) | 312 (3.8%) |
| 40 to 44 Minutes | 516 (4.7%) | 58 (0.7%) |
| 45 to 59 Minutes | 1,369 (12.4%) | 360 (4.4%) |
| 60 to 89 Minutes | 427 (3.9%) | 223 (2.8%) |
| 90 or more Minutes | 181 (1.7%) | 243 (3.0%) |
Time of Departure to Work by Sex in Anderson County
The most frequent times of departure to work in Anderson County are 12:00 AM to 4:59 AM (2,119, 19.3%) for males and 7:30 AM to 7:59 AM (1,489, 18.3%) for females.
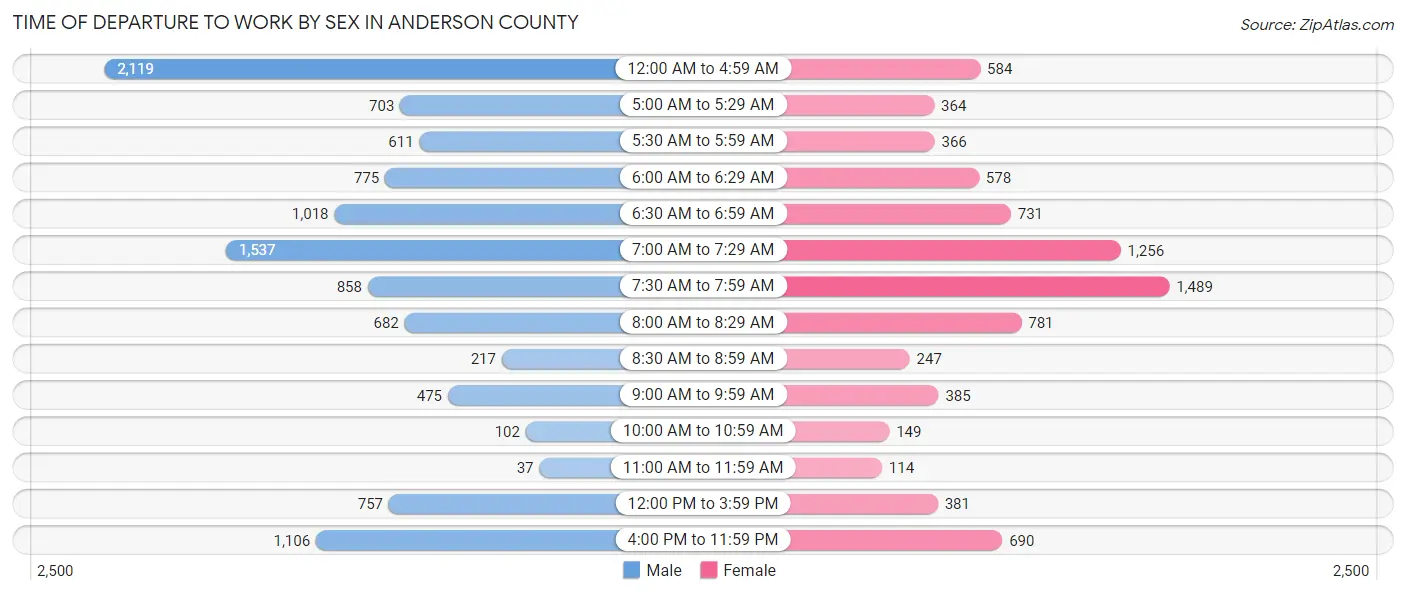
| Time of Departure | Male | Female |
| 12:00 AM to 4:59 AM | 2,119 (19.3%) | 584 (7.2%) |
| 5:00 AM to 5:29 AM | 703 (6.4%) | 364 (4.5%) |
| 5:30 AM to 5:59 AM | 611 (5.6%) | 366 (4.5%) |
| 6:00 AM to 6:29 AM | 775 (7.0%) | 578 (7.1%) |
| 6:30 AM to 6:59 AM | 1,018 (9.3%) | 731 (9.0%) |
| 7:00 AM to 7:29 AM | 1,537 (14.0%) | 1,256 (15.5%) |
| 7:30 AM to 7:59 AM | 858 (7.8%) | 1,489 (18.3%) |
| 8:00 AM to 8:29 AM | 682 (6.2%) | 781 (9.6%) |
| 8:30 AM to 8:59 AM | 217 (2.0%) | 247 (3.0%) |
| 9:00 AM to 9:59 AM | 475 (4.3%) | 385 (4.7%) |
| 10:00 AM to 10:59 AM | 102 (0.9%) | 149 (1.8%) |
| 11:00 AM to 11:59 AM | 37 (0.3%) | 114 (1.4%) |
| 12:00 PM to 3:59 PM | 757 (6.9%) | 381 (4.7%) |
| 4:00 PM to 11:59 PM | 1,106 (10.1%) | 690 (8.5%) |
| Total | 10,997 (100.0%) | 8,115 (100.0%) |
Housing Occupancy in Anderson County
Occupancy by Ownership in Anderson County
Of the total 16,899 dwellings in Anderson County, owner-occupied units account for 11,602 (68.6%), while renter-occupied units make up 5,297 (31.4%).
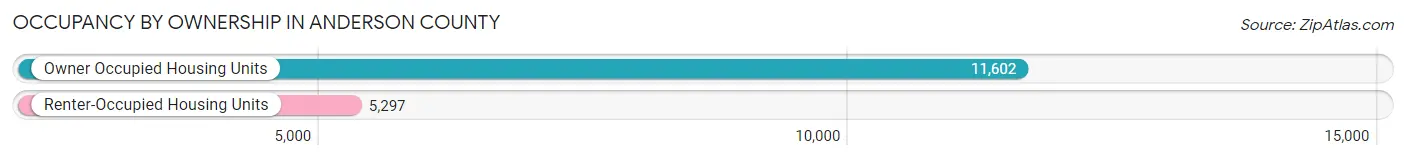
| Occupancy | # Housing Units | % Housing Units |
| Owner Occupied Housing Units | 11,602 | 68.6% |
| Renter-Occupied Housing Units | 5,297 | 31.4% |
| Total Occupied Housing Units | 16,899 | 100.0% |
Occupancy by Household Size in Anderson County
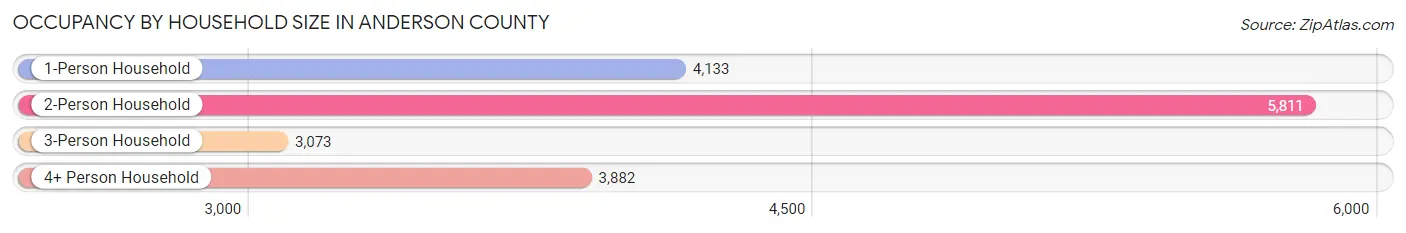
| Household Size | # Housing Units | % Housing Units |
| 1-Person Household | 4,133 | 24.5% |
| 2-Person Household | 5,811 | 34.4% |
| 3-Person Household | 3,073 | 18.2% |
| 4+ Person Household | 3,882 | 23.0% |
| Total Housing Units | 16,899 | 100.0% |
Occupancy by Ownership by Household Size in Anderson County
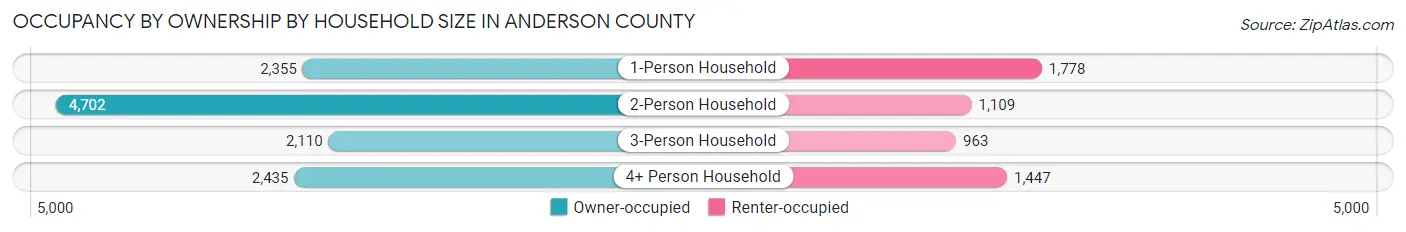
| Household Size | Owner-occupied | Renter-occupied |
| 1-Person Household | 2,355 (57.0%) | 1,778 (43.0%) |
| 2-Person Household | 4,702 (80.9%) | 1,109 (19.1%) |
| 3-Person Household | 2,110 (68.7%) | 963 (31.3%) |
| 4+ Person Household | 2,435 (62.7%) | 1,447 (37.3%) |
| Total Housing Units | 11,602 (68.6%) | 5,297 (31.4%) |
Occupancy by Educational Attainment in Anderson County
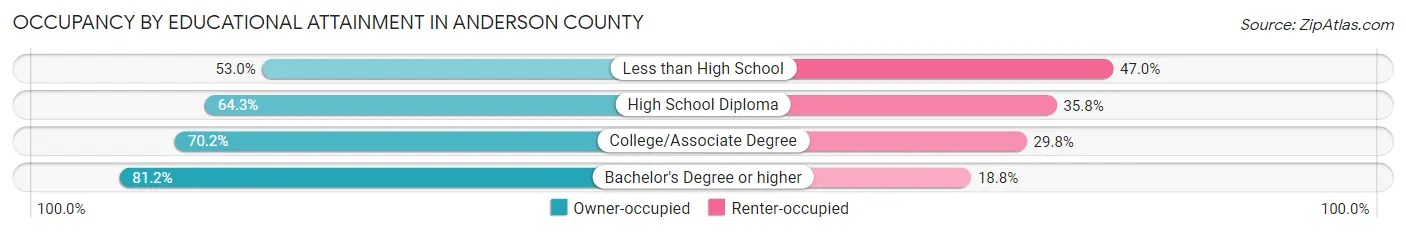
| Household Size | Owner-occupied | Renter-occupied |
| Less than High School | 649 (53.0%) | 575 (47.0%) |
| High School Diploma | 4,046 (64.2%) | 2,251 (35.7%) |
| College/Associate Degree | 4,497 (70.2%) | 1,913 (29.8%) |
| Bachelor's Degree or higher | 2,410 (81.2%) | 558 (18.8%) |
Occupancy by Age of Householder in Anderson County
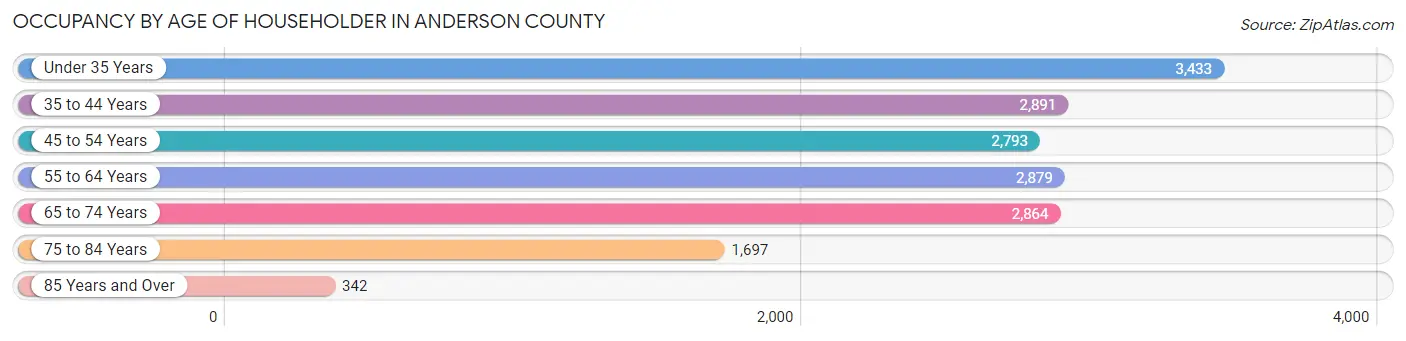
| Age Bracket | # Households | % Households |
| Under 35 Years | 3,433 | 20.3% |
| 35 to 44 Years | 2,891 | 17.1% |
| 45 to 54 Years | 2,793 | 16.5% |
| 55 to 64 Years | 2,879 | 17.0% |
| 65 to 74 Years | 2,864 | 17.0% |
| 75 to 84 Years | 1,697 | 10.0% |
| 85 Years and Over | 342 | 2.0% |
| Total | 16,899 | 100.0% |
Housing Finances in Anderson County
Median Income by Occupancy in Anderson County
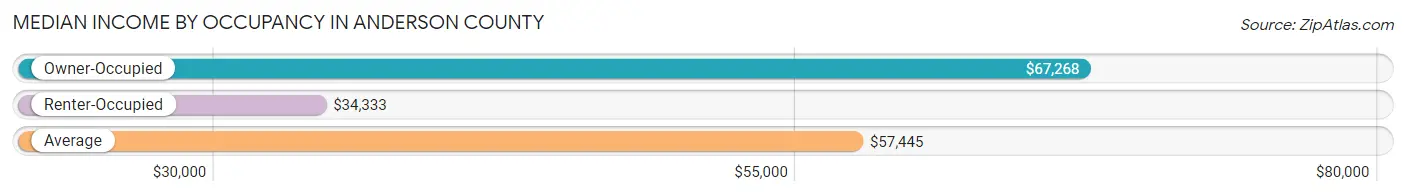
| Occupancy Type | # Households | Median Income |
| Owner-Occupied | 11,602 (68.6%) | $67,268 |
| Renter-Occupied | 5,297 (31.4%) | $34,333 |
| Average | 16,899 (100.0%) | $57,445 |
Occupancy by Householder Income Bracket in Anderson County
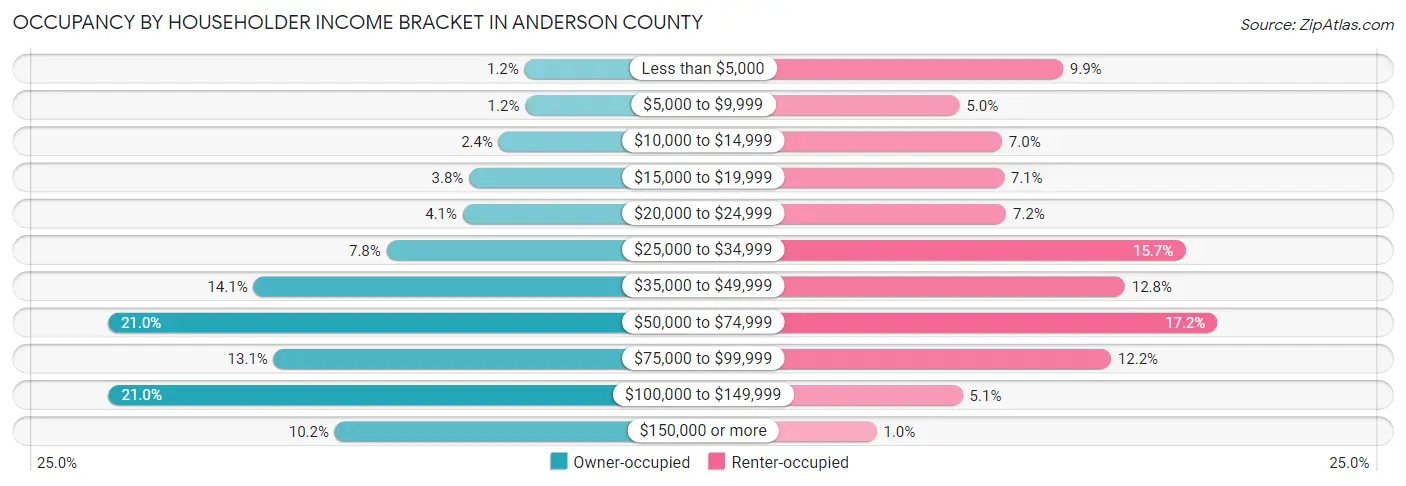
| Income Bracket | Owner-occupied | Renter-occupied |
| Less than $5,000 | 138 (1.2%) | 523 (9.9%) |
| $5,000 to $9,999 | 135 (1.2%) | 262 (5.0%) |
| $10,000 to $14,999 | 281 (2.4%) | 369 (7.0%) |
| $15,000 to $19,999 | 444 (3.8%) | 374 (7.1%) |
| $20,000 to $24,999 | 479 (4.1%) | 380 (7.2%) |
| $25,000 to $34,999 | 900 (7.8%) | 831 (15.7%) |
| $35,000 to $49,999 | 1,636 (14.1%) | 679 (12.8%) |
| $50,000 to $74,999 | 2,440 (21.0%) | 912 (17.2%) |
| $75,000 to $99,999 | 1,525 (13.1%) | 644 (12.2%) |
| $100,000 to $149,999 | 2,437 (21.0%) | 270 (5.1%) |
| $150,000 or more | 1,187 (10.2%) | 53 (1.0%) |
| Total | 11,602 (100.0%) | 5,297 (100.0%) |
Monthly Housing Cost Tiers in Anderson County
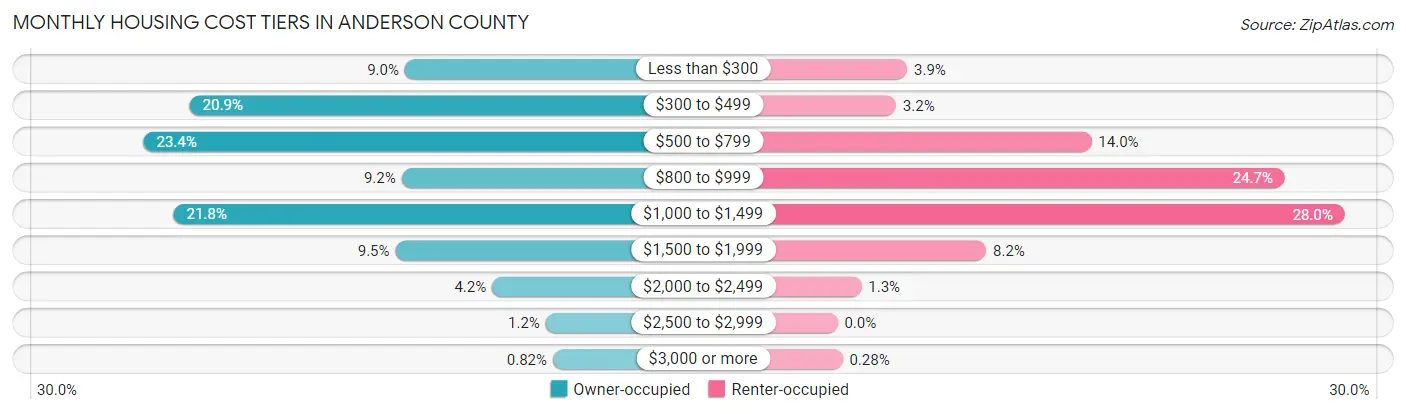
| Monthly Cost | Owner-occupied | Renter-occupied |
| Less than $300 | 1,044 (9.0%) | 204 (3.8%) |
| $300 to $499 | 2,423 (20.9%) | 171 (3.2%) |
| $500 to $799 | 2,718 (23.4%) | 743 (14.0%) |
| $800 to $999 | 1,065 (9.2%) | 1,309 (24.7%) |
| $1,000 to $1,499 | 2,526 (21.8%) | 1,484 (28.0%) |
| $1,500 to $1,999 | 1,104 (9.5%) | 435 (8.2%) |
| $2,000 to $2,499 | 485 (4.2%) | 70 (1.3%) |
| $2,500 to $2,999 | 142 (1.2%) | 0 (0.0%) |
| $3,000 or more | 95 (0.8%) | 15 (0.3%) |
| Total | 11,602 (100.0%) | 5,297 (100.0%) |
Physical Housing Characteristics in Anderson County
Housing Structures in Anderson County
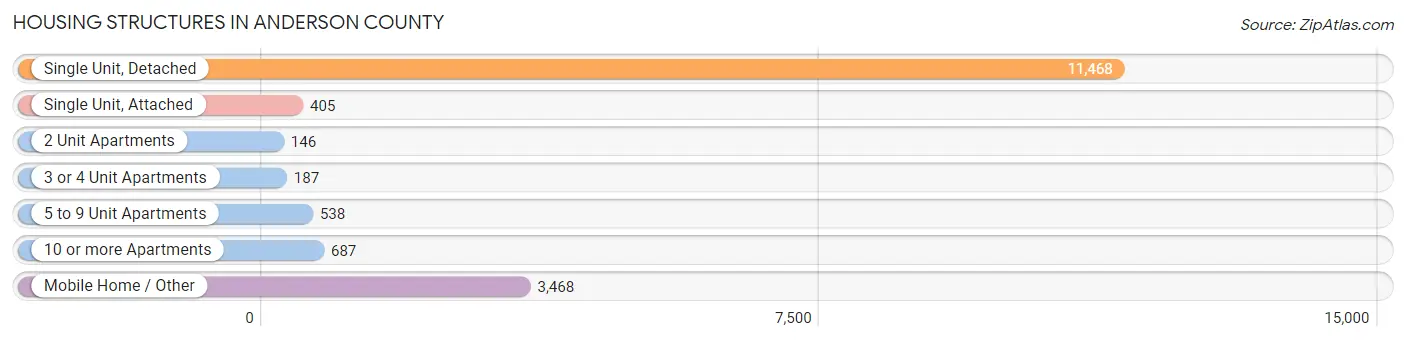
| Structure Type | # Housing Units | % Housing Units |
| Single Unit, Detached | 11,468 | 67.9% |
| Single Unit, Attached | 405 | 2.4% |
| 2 Unit Apartments | 146 | 0.9% |
| 3 or 4 Unit Apartments | 187 | 1.1% |
| 5 to 9 Unit Apartments | 538 | 3.2% |
| 10 or more Apartments | 687 | 4.1% |
| Mobile Home / Other | 3,468 | 20.5% |
| Total | 16,899 | 100.0% |
Housing Structures by Occupancy in Anderson County
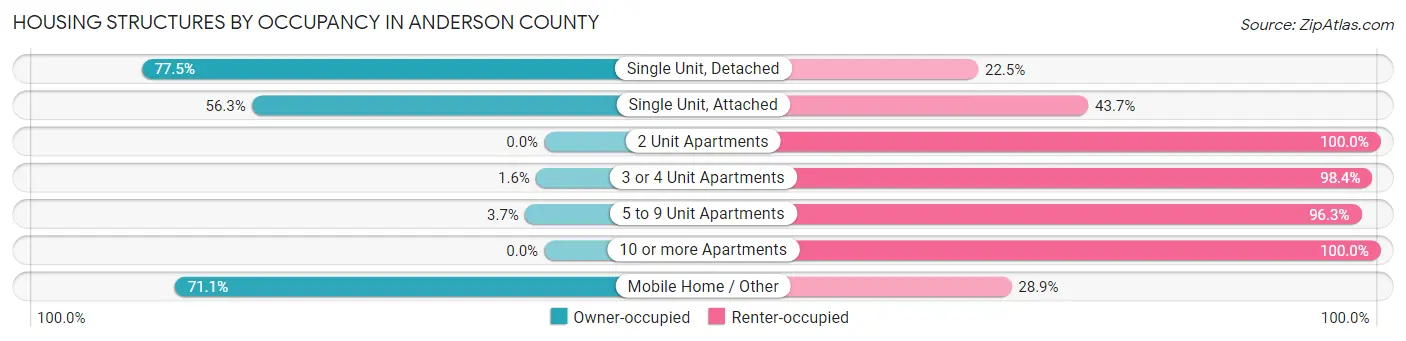
| Structure Type | Owner-occupied | Renter-occupied |
| Single Unit, Detached | 8,886 (77.5%) | 2,582 (22.5%) |
| Single Unit, Attached | 228 (56.3%) | 177 (43.7%) |
| 2 Unit Apartments | 0 (0.0%) | 146 (100.0%) |
| 3 or 4 Unit Apartments | 3 (1.6%) | 184 (98.4%) |
| 5 to 9 Unit Apartments | 20 (3.7%) | 518 (96.3%) |
| 10 or more Apartments | 0 (0.0%) | 687 (100.0%) |
| Mobile Home / Other | 2,465 (71.1%) | 1,003 (28.9%) |
| Total | 11,602 (68.6%) | 5,297 (31.4%) |
Housing Structures by Number of Rooms in Anderson County
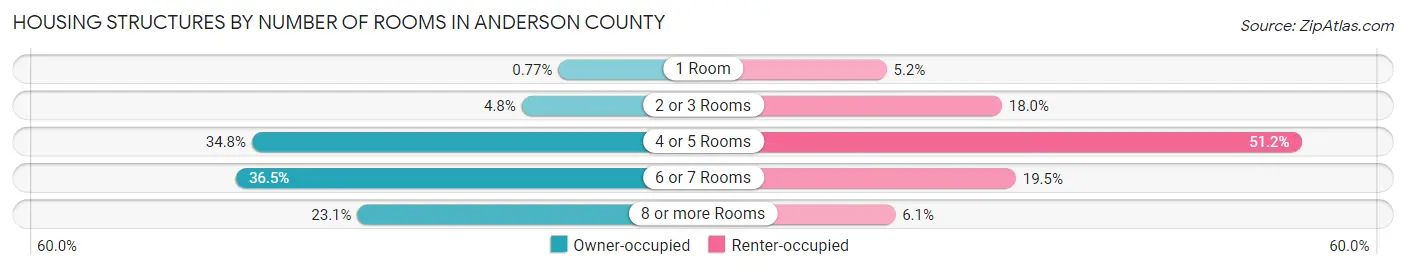
| Number of Rooms | Owner-occupied | Renter-occupied |
| 1 Room | 89 (0.8%) | 274 (5.2%) |
| 2 or 3 Rooms | 562 (4.8%) | 952 (18.0%) |
| 4 or 5 Rooms | 4,035 (34.8%) | 2,712 (51.2%) |
| 6 or 7 Rooms | 4,239 (36.5%) | 1,034 (19.5%) |
| 8 or more Rooms | 2,677 (23.1%) | 325 (6.1%) |
| Total | 11,602 (100.0%) | 5,297 (100.0%) |
Housing Structure by Heating Type in Anderson County
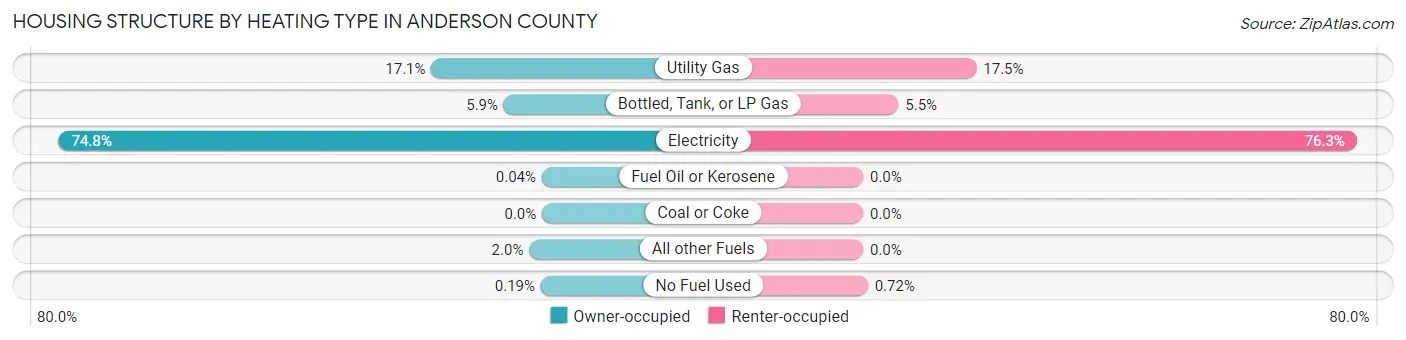
| Heating Type | Owner-occupied | Renter-occupied |
| Utility Gas | 1,986 (17.1%) | 928 (17.5%) |
| Bottled, Tank, or LP Gas | 686 (5.9%) | 289 (5.5%) |
| Electricity | 8,672 (74.8%) | 4,042 (76.3%) |
| Fuel Oil or Kerosene | 5 (0.0%) | 0 (0.0%) |
| Coal or Coke | 0 (0.0%) | 0 (0.0%) |
| All other Fuels | 231 (2.0%) | 0 (0.0%) |
| No Fuel Used | 22 (0.2%) | 38 (0.7%) |
| Total | 11,602 (100.0%) | 5,297 (100.0%) |
Household Vehicle Usage in Anderson County
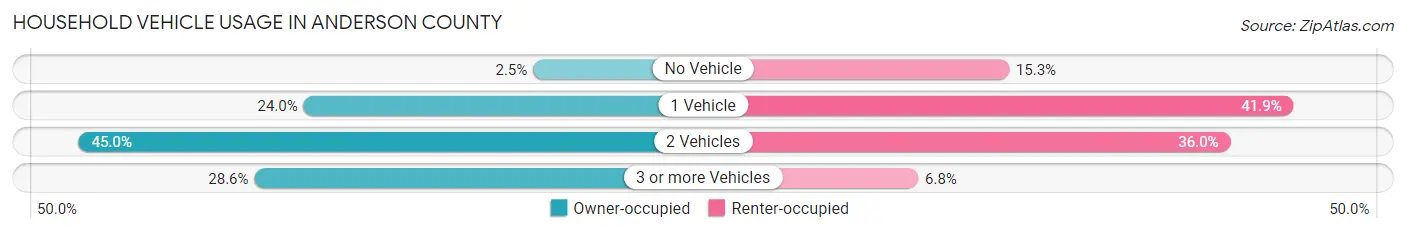
| Vehicles per Household | Owner-occupied | Renter-occupied |
| No Vehicle | 294 (2.5%) | 811 (15.3%) |
| 1 Vehicle | 2,780 (24.0%) | 2,218 (41.9%) |
| 2 Vehicles | 5,216 (45.0%) | 1,906 (36.0%) |
| 3 or more Vehicles | 3,312 (28.5%) | 362 (6.8%) |
| Total | 11,602 (100.0%) | 5,297 (100.0%) |
Real Estate & Mortgages in Anderson County
Real Estate and Mortgage Overview in Anderson County
| Characteristic | Without Mortgage | With Mortgage |
| Housing Units | 6,762 | 4,840 |
| Median Property Value | $141,600 | $160,500 |
| Median Household Income | $57,570 | $833 |
| Monthly Housing Costs | $500 | $86 |
| Real Estate Taxes | $1,317 | $122 |
Property Value by Mortgage Status in Anderson County
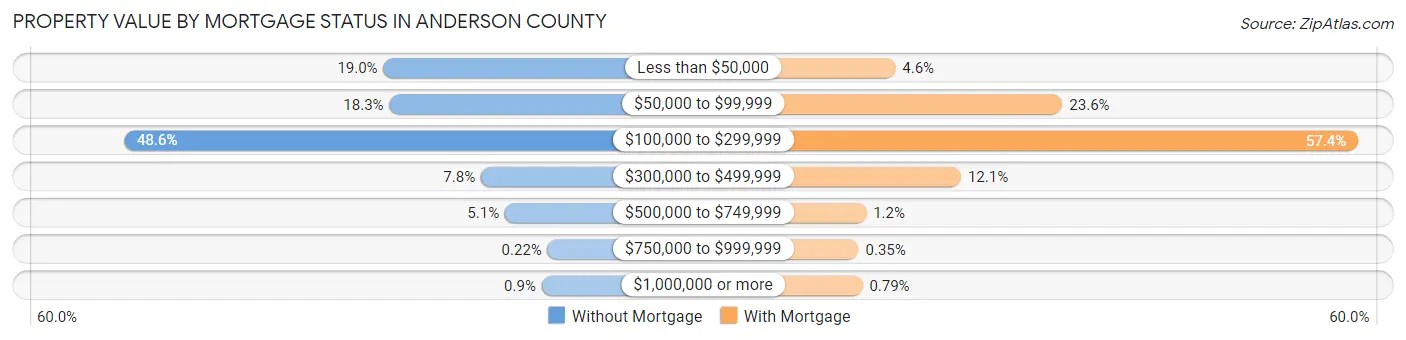
| Property Value | Without Mortgage | With Mortgage |
| Less than $50,000 | 1,284 (19.0%) | 220 (4.5%) |
| $50,000 to $99,999 | 1,238 (18.3%) | 1,144 (23.6%) |
| $100,000 to $299,999 | 3,289 (48.6%) | 2,779 (57.4%) |
| $300,000 to $499,999 | 530 (7.8%) | 583 (12.0%) |
| $500,000 to $749,999 | 345 (5.1%) | 59 (1.2%) |
| $750,000 to $999,999 | 15 (0.2%) | 17 (0.4%) |
| $1,000,000 or more | 61 (0.9%) | 38 (0.8%) |
| Total | 6,762 (100.0%) | 4,840 (100.0%) |
Household Income by Mortgage Status in Anderson County
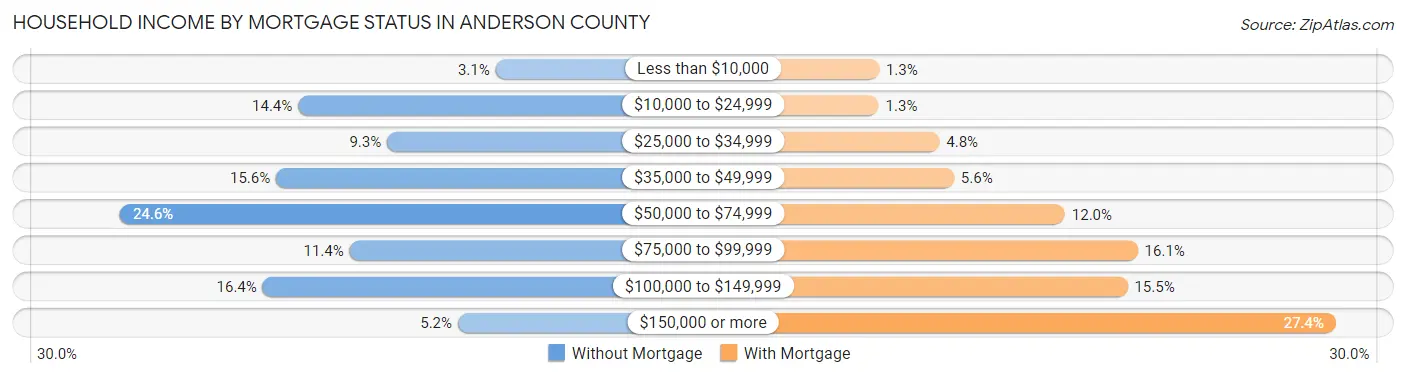
| Household Income | Without Mortgage | With Mortgage |
| Less than $10,000 | 209 (3.1%) | 65 (1.3%) |
| $10,000 to $24,999 | 972 (14.4%) | 64 (1.3%) |
| $25,000 to $34,999 | 628 (9.3%) | 232 (4.8%) |
| $35,000 to $49,999 | 1,057 (15.6%) | 272 (5.6%) |
| $50,000 to $74,999 | 1,660 (24.5%) | 579 (12.0%) |
| $75,000 to $99,999 | 773 (11.4%) | 780 (16.1%) |
| $100,000 to $149,999 | 1,109 (16.4%) | 752 (15.5%) |
| $150,000 or more | 354 (5.2%) | 1,328 (27.4%) |
| Total | 6,762 (100.0%) | 4,840 (100.0%) |
Property Value to Household Income Ratio in Anderson County
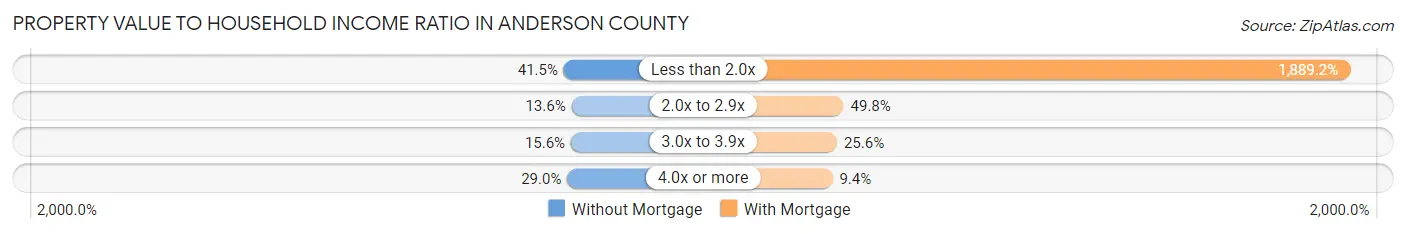
| Value-to-Income Ratio | Without Mortgage | With Mortgage |
| Less than 2.0x | 2,809 (41.5%) | 91,439 (1,889.2%) |
| 2.0x to 2.9x | 917 (13.6%) | 2,410 (49.8%) |
| 3.0x to 3.9x | 1,052 (15.6%) | 1,240 (25.6%) |
| 4.0x or more | 1,961 (29.0%) | 453 (9.4%) |
| Total | 6,762 (100.0%) | 4,840 (100.0%) |
Real Estate Taxes by Mortgage Status in Anderson County
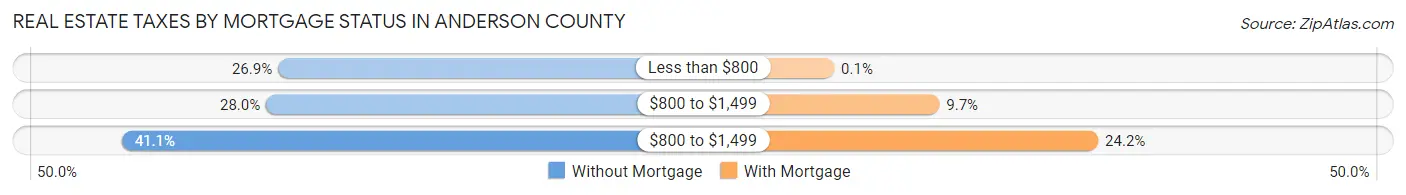
| Property Taxes | Without Mortgage | With Mortgage |
| Less than $800 | 1,816 (26.9%) | 5 (0.1%) |
| $800 to $1,499 | 1,890 (28.0%) | 470 (9.7%) |
| $800 to $1,499 | 2,781 (41.1%) | 1,172 (24.2%) |
| Total | 6,762 (100.0%) | 4,840 (100.0%) |
Health & Disability in Anderson County
Health Insurance Coverage by Age in Anderson County
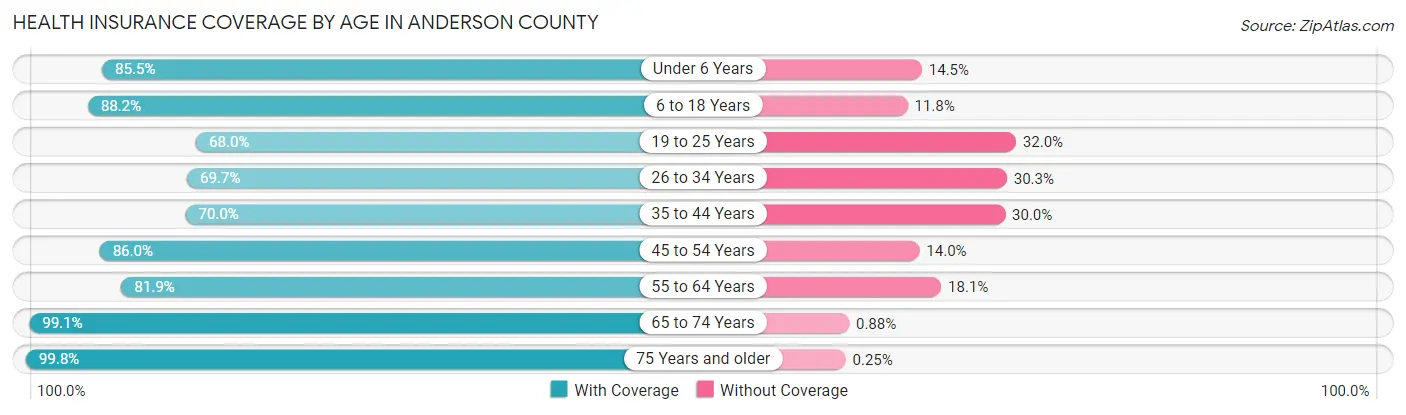
| Age Bracket | With Coverage | Without Coverage |
| Under 6 Years | 2,987 (85.5%) | 505 (14.5%) |
| 6 to 18 Years | 7,102 (88.2%) | 949 (11.8%) |
| 19 to 25 Years | 2,516 (68.0%) | 1,184 (32.0%) |
| 26 to 34 Years | 4,064 (69.7%) | 1,767 (30.3%) |
| 35 to 44 Years | 4,125 (70.0%) | 1,767 (30.0%) |
| 45 to 54 Years | 4,715 (86.0%) | 768 (14.0%) |
| 55 to 64 Years | 4,173 (81.9%) | 920 (18.1%) |
| 65 to 74 Years | 4,733 (99.1%) | 42 (0.9%) |
| 75 Years and older | 3,213 (99.8%) | 8 (0.3%) |
| Total | 37,628 (82.6%) | 7,910 (17.4%) |
Health Insurance Coverage by Citizenship Status in Anderson County
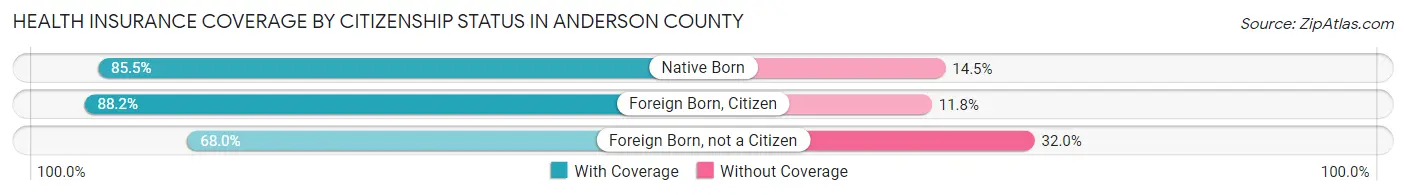
| Citizenship Status | With Coverage | Without Coverage |
| Native Born | 2,987 (85.5%) | 505 (14.5%) |
| Foreign Born, Citizen | 7,102 (88.2%) | 949 (11.8%) |
| Foreign Born, not a Citizen | 2,516 (68.0%) | 1,184 (32.0%) |
Health Insurance Coverage by Household Income in Anderson County
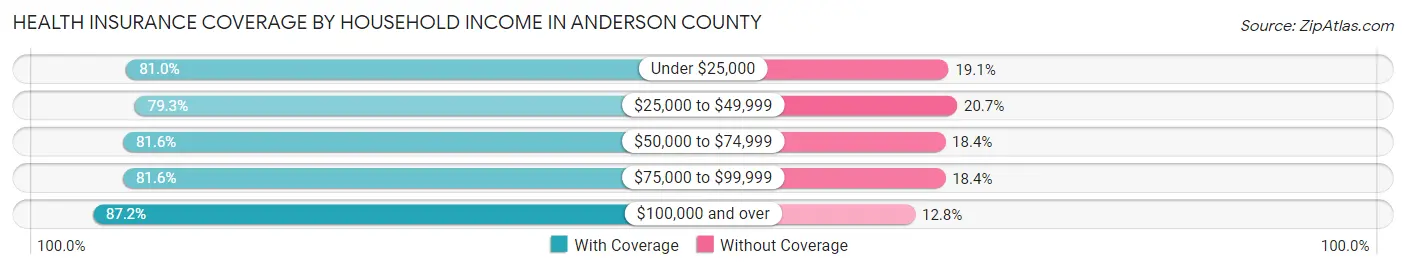
| Household Income | With Coverage | Without Coverage |
| Under $25,000 | 5,217 (80.9%) | 1,228 (19.1%) |
| $25,000 to $49,999 | 7,734 (79.3%) | 2,014 (20.7%) |
| $50,000 to $74,999 | 7,640 (81.6%) | 1,726 (18.4%) |
| $75,000 to $99,999 | 5,411 (81.6%) | 1,223 (18.4%) |
| $100,000 and over | 11,553 (87.2%) | 1,694 (12.8%) |
Public vs Private Health Insurance Coverage by Age in Anderson County
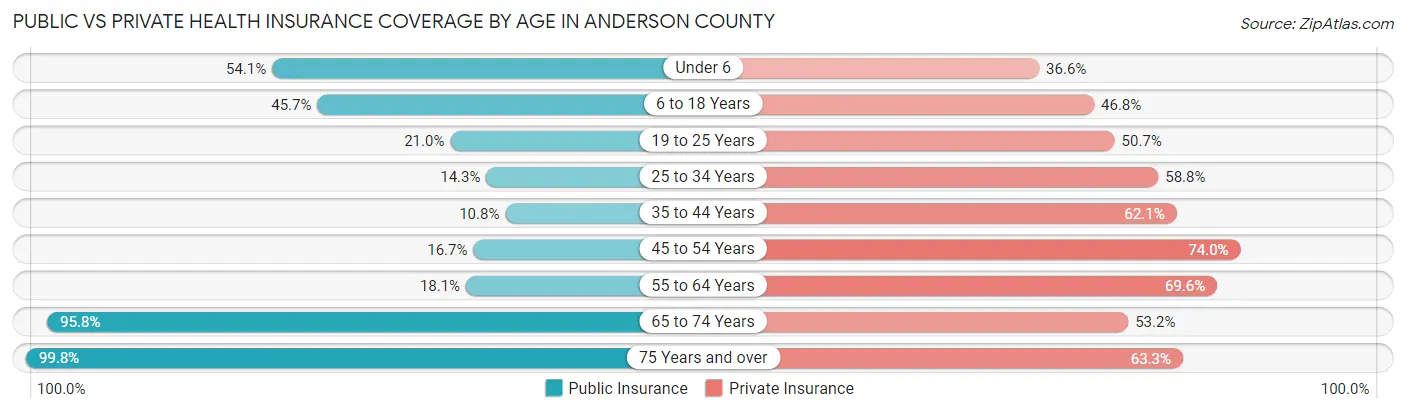
| Age Bracket | Public Insurance | Private Insurance |
| Under 6 | 1,888 (54.1%) | 1,279 (36.6%) |
| 6 to 18 Years | 3,677 (45.7%) | 3,770 (46.8%) |
| 19 to 25 Years | 777 (21.0%) | 1,874 (50.6%) |
| 25 to 34 Years | 834 (14.3%) | 3,426 (58.8%) |
| 35 to 44 Years | 636 (10.8%) | 3,660 (62.1%) |
| 45 to 54 Years | 916 (16.7%) | 4,057 (74.0%) |
| 55 to 64 Years | 921 (18.1%) | 3,547 (69.6%) |
| 65 to 74 Years | 4,576 (95.8%) | 2,539 (53.2%) |
| 75 Years and over | 3,213 (99.8%) | 2,039 (63.3%) |
| Total | 17,438 (38.3%) | 26,191 (57.5%) |
Disability Status by Sex by Age in Anderson County
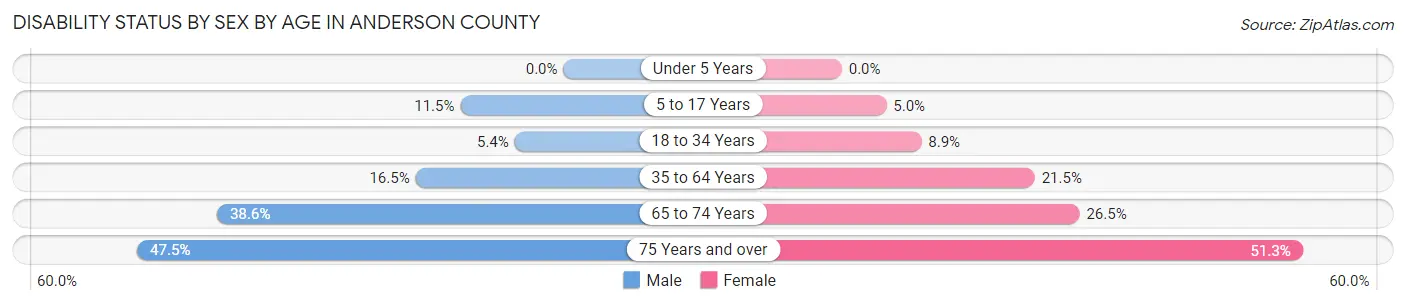
| Age Bracket | Male | Female |
| Under 5 Years | 0 (0.0%) | 0 (0.0%) |
| 5 to 17 Years | 488 (11.5%) | 189 (5.0%) |
| 18 to 34 Years | 311 (5.4%) | 382 (8.9%) |
| 35 to 64 Years | 1,362 (16.5%) | 1,762 (21.5%) |
| 65 to 74 Years | 854 (38.6%) | 678 (26.5%) |
| 75 Years and over | 627 (47.5%) | 975 (51.3%) |
Disability Class by Sex by Age in Anderson County
Disability Class: Hearing Difficulty
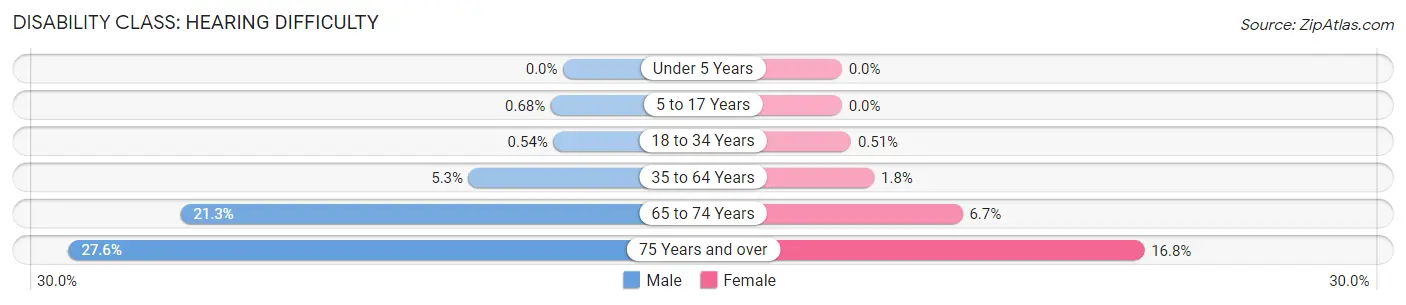
| Age Bracket | Male | Female |
| Under 5 Years | 0 (0.0%) | 0 (0.0%) |
| 5 to 17 Years | 29 (0.7%) | 0 (0.0%) |
| 18 to 34 Years | 31 (0.5%) | 22 (0.5%) |
| 35 to 64 Years | 435 (5.3%) | 148 (1.8%) |
| 65 to 74 Years | 472 (21.3%) | 172 (6.7%) |
| 75 Years and over | 364 (27.6%) | 320 (16.8%) |
Disability Class: Vision Difficulty
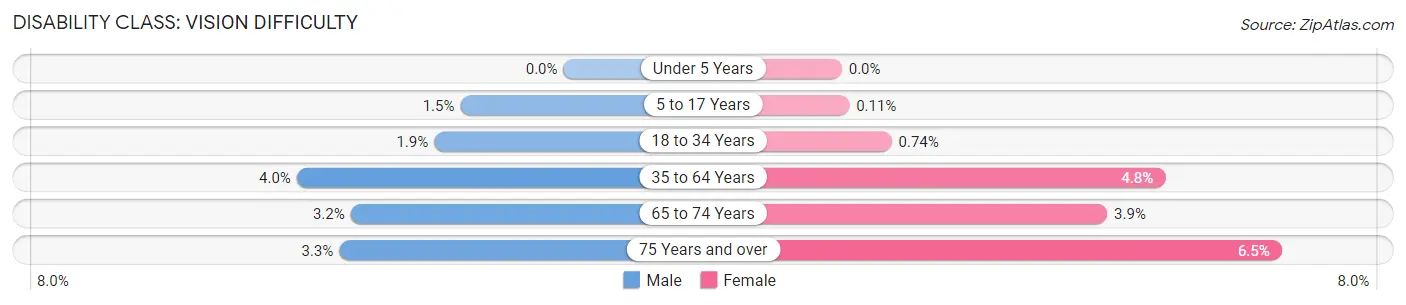
| Age Bracket | Male | Female |
| Under 5 Years | 0 (0.0%) | 0 (0.0%) |
| 5 to 17 Years | 65 (1.5%) | 4 (0.1%) |
| 18 to 34 Years | 110 (1.9%) | 32 (0.7%) |
| 35 to 64 Years | 327 (4.0%) | 394 (4.8%) |
| 65 to 74 Years | 70 (3.2%) | 101 (3.9%) |
| 75 Years and over | 44 (3.3%) | 124 (6.5%) |
Disability Class: Cognitive Difficulty
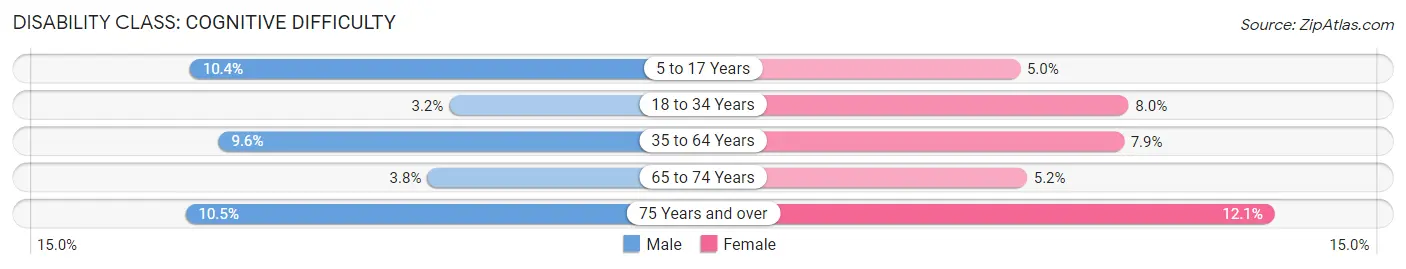
| Age Bracket | Male | Female |
| 5 to 17 Years | 442 (10.4%) | 189 (5.0%) |
| 18 to 34 Years | 182 (3.2%) | 344 (8.0%) |
| 35 to 64 Years | 794 (9.6%) | 644 (7.9%) |
| 65 to 74 Years | 84 (3.8%) | 132 (5.1%) |
| 75 Years and over | 139 (10.5%) | 229 (12.0%) |
Disability Class: Ambulatory Difficulty
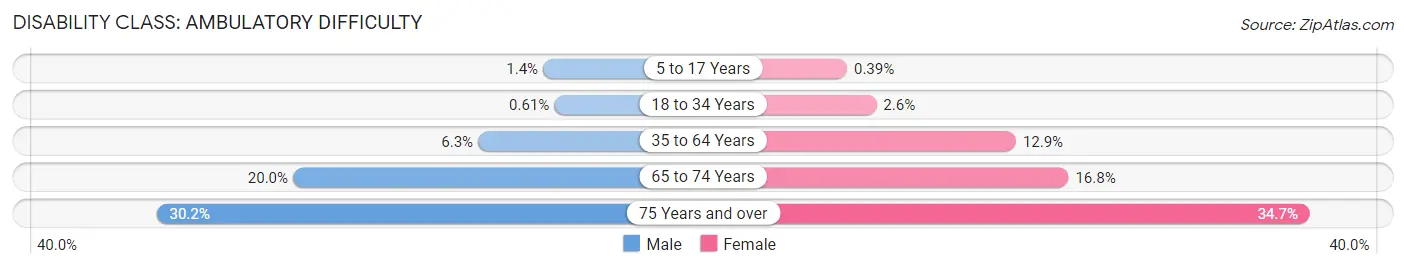
| Age Bracket | Male | Female |
| 5 to 17 Years | 61 (1.4%) | 15 (0.4%) |
| 18 to 34 Years | 35 (0.6%) | 111 (2.6%) |
| 35 to 64 Years | 518 (6.3%) | 1,060 (12.9%) |
| 65 to 74 Years | 443 (20.0%) | 431 (16.8%) |
| 75 Years and over | 399 (30.2%) | 660 (34.7%) |
Disability Class: Self-Care Difficulty
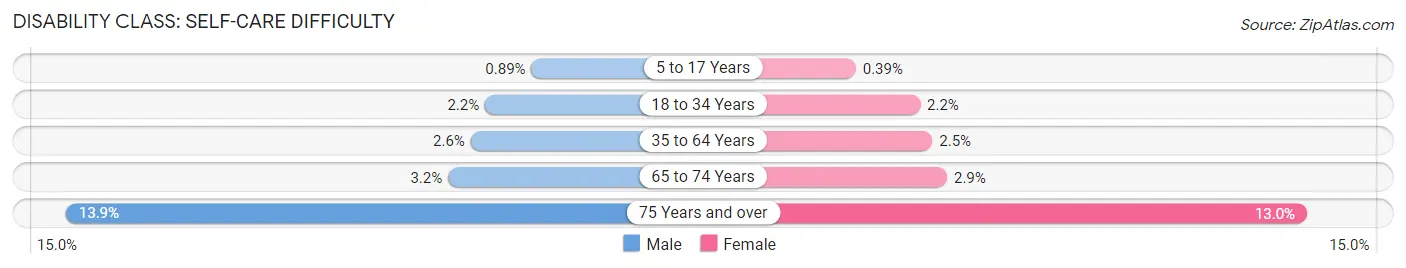
| Age Bracket | Male | Female |
| 5 to 17 Years | 38 (0.9%) | 15 (0.4%) |
| 18 to 34 Years | 125 (2.2%) | 94 (2.2%) |
| 35 to 64 Years | 213 (2.6%) | 207 (2.5%) |
| 65 to 74 Years | 71 (3.2%) | 75 (2.9%) |
| 75 Years and over | 183 (13.9%) | 246 (13.0%) |
Technology Access in Anderson County
Computing Device Access in Anderson County
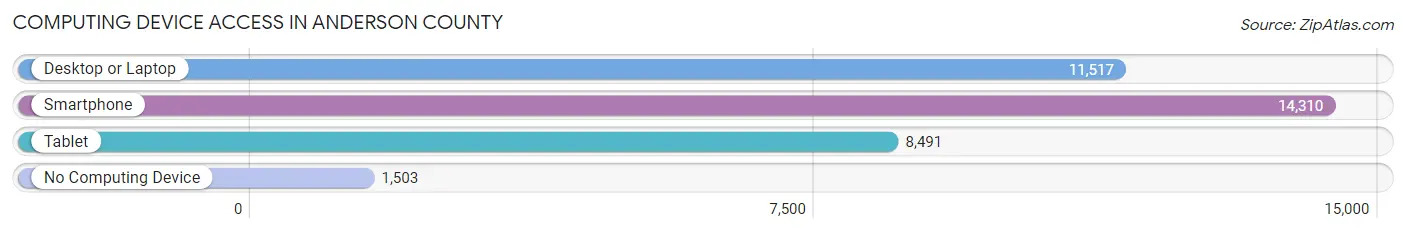
| Device Type | # Households | % Households |
| Desktop or Laptop | 11,517 | 68.1% |
| Smartphone | 14,310 | 84.7% |
| Tablet | 8,491 | 50.2% |
| No Computing Device | 1,503 | 8.9% |
| Total | 16,899 | 100.0% |
Internet Access in Anderson County
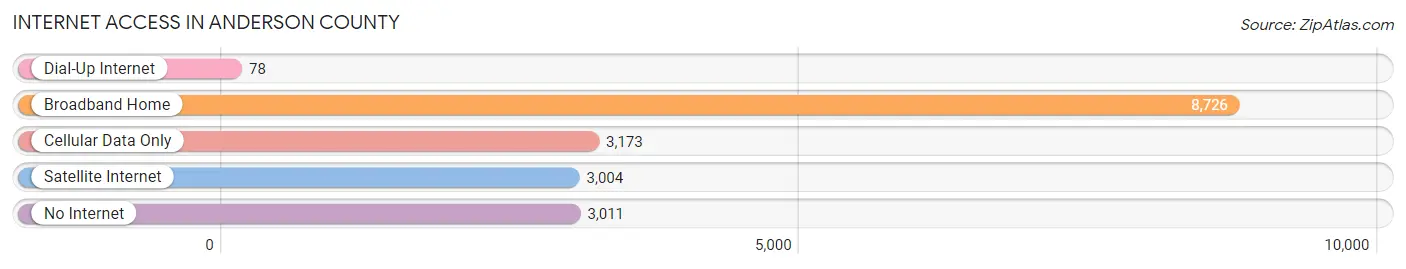
| Internet Type | # Households | % Households |
| Dial-Up Internet | 78 | 0.5% |
| Broadband Home | 8,726 | 51.6% |
| Cellular Data Only | 3,173 | 18.8% |
| Satellite Internet | 3,004 | 17.8% |
| No Internet | 3,011 | 17.8% |
| Total | 16,899 | 100.0% |
Anderson County Summary
Anderson County is located in the east-central part of the state of Texas, and is part of the Tyler-Longview metropolitan area. The county is named for Kenneth Lewis Anderson, a soldier in the Texas Revolution. As of the 2010 census, the population was 58,458.
Geography
Anderson County is located in the East Texas Timberlands region of the state. The county is bordered by Henderson County to the north, Van Zandt County to the east, Cherokee County to the south, and Freestone and Leon counties to the west. The county is located approximately 100 miles southeast of Dallas and 150 miles north of Houston.
The county is mostly flat with rolling hills in the northern and western parts. The Trinity River forms the eastern border of the county, and the Neches River forms the western border. The county is home to several small lakes, including Lake Palestine, Lake Frankston, and Lake Striker.
The county is home to the Davy Crockett National Forest, which covers over 160,000 acres. The forest is home to a variety of wildlife, including white-tailed deer, wild turkeys, and numerous species of birds.
History
The area that is now Anderson County was originally inhabited by the Caddo Indians. The first European settlers arrived in the area in the early 1800s. The county was established in 1846 and was named for Kenneth Lewis Anderson, a soldier in the Texas Revolution.
The county was largely agricultural in the 19th century, with cotton and corn being the main crops. The county also had a thriving timber industry, with several sawmills located in the area.
In the early 20th century, the county began to diversify its economy. Oil and gas were discovered in the area in the 1920s, and the county became a major producer of oil and gas. The county also became a major producer of timber, and the timber industry remains an important part of the county’s economy today.
Economy
The economy of Anderson County is largely based on agriculture, oil and gas, and timber. The county is home to several large agricultural operations, including cattle ranches, poultry farms, and vegetable farms.
The county is also home to several oil and gas companies, including Anadarko Petroleum Corporation, Chevron Corporation, and ExxonMobil Corporation. The county is a major producer of oil and gas, and the industry is an important part of the county’s economy.
The timber industry is also an important part of the county’s economy. The county is home to several large timber companies, including Weyerhaeuser Company and International Paper Company. The timber industry is responsible for thousands of jobs in the county.
Demographics
As of the 2010 census, the population of Anderson County was 58,458. The population is largely white (83.3%), with African Americans making up 11.2% of the population, Hispanics making up 4.2%, and Asians making up 1.3%.
The median household income in the county is $45,845, and the median family income is $54,845. The per capita income in the county is $22,845. The unemployment rate in the county is 4.2%.
Conclusion
Anderson County is located in the east-central part of the state of Texas, and is part of the Tyler-Longview metropolitan area. The county is named for Kenneth Lewis Anderson, a soldier in the Texas Revolution. The county is mostly flat with rolling hills in the northern and western parts, and is home to several small lakes. The economy of Anderson County is largely based on agriculture, oil and gas, and timber. As of the 2010 census, the population of Anderson County was 58,458. The population is largely white, with African Americans, Hispanics, and Asians making up the remainder of the population. The median household income in the county is $45,845, and the median family income is $54,845. The per capita income in the county is $22,845. The unemployment rate in the county is 4.2%.
Common Questions
What is Per Capita Income in Anderson County?
Per Capita income in Anderson County is $23,548.
What is the Median Family Income in Anderson County?
Median Family Income in Anderson County is $67,510.
What is the Median Household income in Anderson County?
Median Household Income in Anderson County is $57,445.
What is Income or Wage Gap in Anderson County?
Income or Wage Gap in Anderson County is 35.7%.
Women in Anderson County earn 64.3 cents for every dollar earned by a man.
What is Family Income Deficit in Anderson County?
Family Income Deficit in Anderson County is $11,876.
Families that are below poverty line in Anderson County earn $11,876 less on average than the poverty threshold level.
What is Inequality or Gini Index in Anderson County?
Inequality or Gini Index in Anderson County is 0.43.
What is the Total Population of Anderson County?
Total Population of Anderson County is 58,077.
What is the Total Male Population of Anderson County?
Total Male Population of Anderson County is 35,807.
What is the Total Female Population of Anderson County?
Total Female Population of Anderson County is 22,270.
What is the Ratio of Males per 100 Females in Anderson County?
There are 160.79 Males per 100 Females in Anderson County.
What is the Ratio of Females per 100 Males in Anderson County?
There are 62.19 Females per 100 Males in Anderson County.
What is the Median Population Age in Anderson County?
Median Population Age in Anderson County is 39.3 Years.
What is the Average Family Size in Anderson County
Average Family Size in Anderson County is 3.2 People.
What is the Average Household Size in Anderson County
Average Household Size in Anderson County is 2.7 People.
How Large is the Labor Force in Anderson County?
There are 20,857 People in the Labor Forcein in Anderson County.
What is the Percentage of People in the Labor Force in Anderson County?
43.1% of People are in the Labor Force in Anderson County.
What is the Unemployment Rate in Anderson County?
Unemployment Rate in Anderson County is 3.9%.