Bandera, TX Map & Demographics
Bandera Map
Bandera Overview
$23,898
PER CAPITA INCOME
$71,477
AVG FAMILY INCOME
$32,125
AVG HOUSEHOLD INCOME
0.49
INEQUALITY / GINI INDEX
565
TOTAL POPULATION
267
MALE POPULATION
298
FEMALE POPULATION
89.60
MALES / 100 FEMALES
111.61
FEMALES / 100 MALES
38.8
MEDIAN AGE
3.5
AVG FAMILY SIZE
2.3
AVG HOUSEHOLD SIZE
304
LABOR FORCE [ PEOPLE ]
59.1%
PERCENT IN LABOR FORCE
10.5%
UNEMPLOYMENT RATE
Bandera Zip Codes
Bandera Area Codes
Income in Bandera
Income Overview in Bandera
Per Capita Income in Bandera is $23,898, while median incomes of families and households are $71,477 and $32,125 respectively.
| Characteristic | Number | Measure |
| Per Capita Income | 565 | $23,898 |
| Median Family Income | 102 | $71,477 |
| Mean Family Income | 102 | $80,423 |
| Median Household Income | 230 | $32,125 |
| Mean Household Income | 230 | $50,552 |
| Income Deficit | 102 | $0 |
| Wage / Income Gap (%) | 565 | 0.00% |
| Wage / Income Gap ($) | 565 | 100.00¢ per $1 |
| Gini / Inequality Index | 565 | 0.49 |
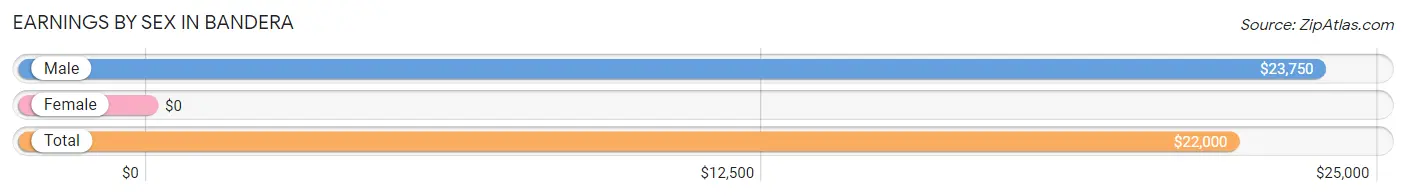
Earnings by Sex in Bandera
| Sex | Number | Average Earnings |
| Male | 174 (57.6%) | $23,750 |
| Female | 128 (42.4%) | $0 |
| Total | 302 (100.0%) | $22,000 |
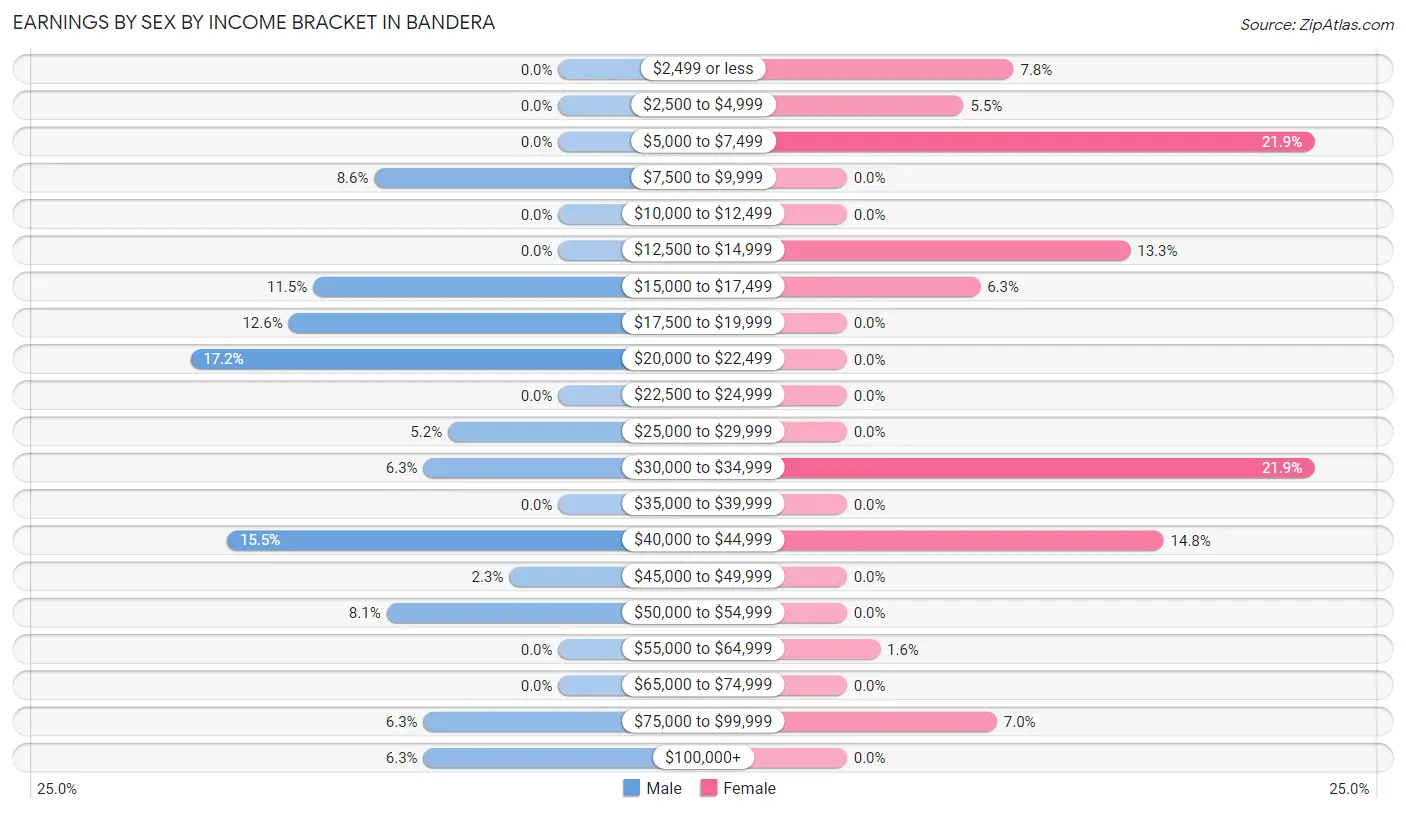
Earnings by Sex by Income Bracket in Bandera
The most common earnings brackets in Bandera are $20,000 to $22,499 for men (30 | 17.2%) and $5,000 to $7,499 for women (28 | 21.9%).
| Income | Male | Female |
| $2,499 or less | 0 (0.0%) | 10 (7.8%) |
| $2,500 to $4,999 | 0 (0.0%) | 7 (5.5%) |
| $5,000 to $7,499 | 0 (0.0%) | 28 (21.9%) |
| $7,500 to $9,999 | 15 (8.6%) | 0 (0.0%) |
| $10,000 to $12,499 | 0 (0.0%) | 0 (0.0%) |
| $12,500 to $14,999 | 0 (0.0%) | 17 (13.3%) |
| $15,000 to $17,499 | 20 (11.5%) | 8 (6.2%) |
| $17,500 to $19,999 | 22 (12.6%) | 0 (0.0%) |
| $20,000 to $22,499 | 30 (17.2%) | 0 (0.0%) |
| $22,500 to $24,999 | 0 (0.0%) | 0 (0.0%) |
| $25,000 to $29,999 | 9 (5.2%) | 0 (0.0%) |
| $30,000 to $34,999 | 11 (6.3%) | 28 (21.9%) |
| $35,000 to $39,999 | 0 (0.0%) | 0 (0.0%) |
| $40,000 to $44,999 | 27 (15.5%) | 19 (14.8%) |
| $45,000 to $49,999 | 4 (2.3%) | 0 (0.0%) |
| $50,000 to $54,999 | 14 (8.1%) | 0 (0.0%) |
| $55,000 to $64,999 | 0 (0.0%) | 2 (1.6%) |
| $65,000 to $74,999 | 0 (0.0%) | 0 (0.0%) |
| $75,000 to $99,999 | 11 (6.3%) | 9 (7.0%) |
| $100,000+ | 11 (6.3%) | 0 (0.0%) |
| Total | 174 (100.0%) | 128 (100.0%) |
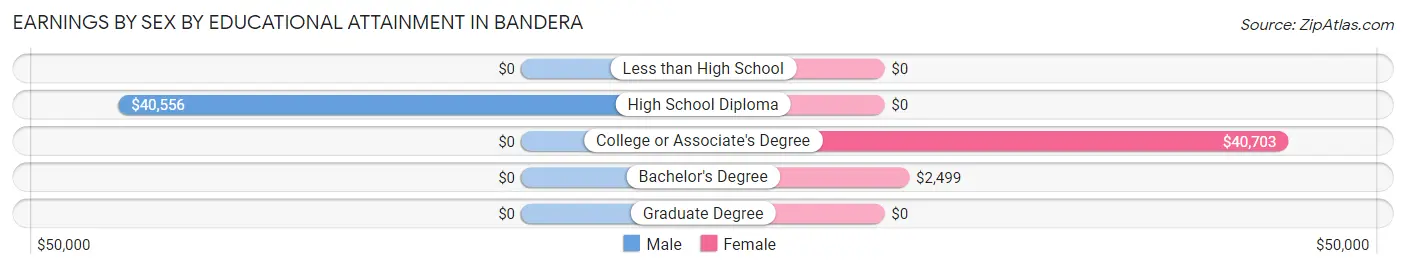
Earnings by Sex by Educational Attainment in Bandera
| Educational Attainment | Male Income | Female Income |
| Less than High School | - | - |
| High School Diploma | $40,556 | $0 |
| College or Associate's Degree | - | - |
| Bachelor's Degree | - | - |
| Graduate Degree | - | - |
| Total | $40,648 | $0 |
Family Income in Bandera
Family Income Brackets in Bandera
According to the Bandera family income data, there are 25 families falling into the $50,000 to $74,999 income range, which is the most common income bracket and makes up 24.5% of all families.
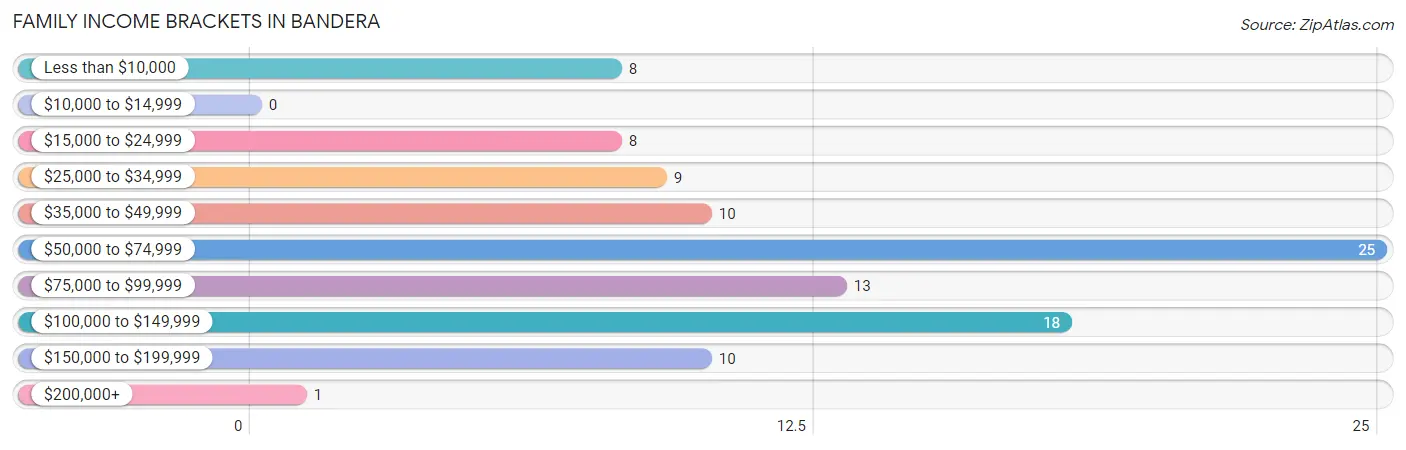
| Income Bracket | # Families | % Families |
| Less than $10,000 | 8 | 7.8% |
| $10,000 to $14,999 | 0 | 0.0% |
| $15,000 to $24,999 | 8 | 7.8% |
| $25,000 to $34,999 | 9 | 8.8% |
| $35,000 to $49,999 | 10 | 9.8% |
| $50,000 to $74,999 | 25 | 24.5% |
| $75,000 to $99,999 | 13 | 12.7% |
| $100,000 to $149,999 | 18 | 17.6% |
| $150,000 to $199,999 | 10 | 9.8% |
| $200,000+ | 1 | 1.0% |
Family Income by Famaliy Size in Bandera
2-person families (49 | 48.0%) account for the highest median family income in Bandera with $76,607 per family, while 2-person families (49 | 48.0%) have the highest median income of $38,304 per family member.
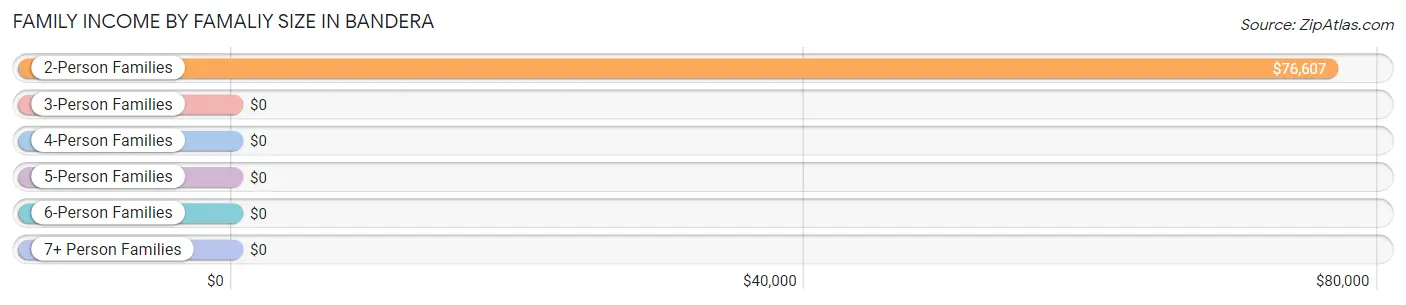
| Income Bracket | # Families | Median Income |
| 2-Person Families | 49 (48.0%) | $76,607 |
| 3-Person Families | 26 (25.5%) | $0 |
| 4-Person Families | 18 (17.6%) | $0 |
| 5-Person Families | 7 (6.9%) | $0 |
| 6-Person Families | 2 (2.0%) | $0 |
| 7+ Person Families | 0 (0.0%) | $0 |
| Total | 102 (100.0%) | $71,477 |
Family Income by Number of Earners in Bandera
| Number of Earners | # Families | Median Income |
| No Earners | 18 (17.6%) | $0 |
| 1 Earner | 25 (24.5%) | $0 |
| 2 Earners | 30 (29.4%) | $0 |
| 3+ Earners | 29 (28.4%) | $0 |
| Total | 102 (100.0%) | $71,477 |
Household Income in Bandera
Household Income Brackets in Bandera
With 51 households falling in the category, the $15,000 to $24,999 income range is the most frequent in Bandera, accounting for 22.2% of all households. In contrast, only 1 households (0.4%) fall into the $200,000+ income bracket, making it the least populous group.
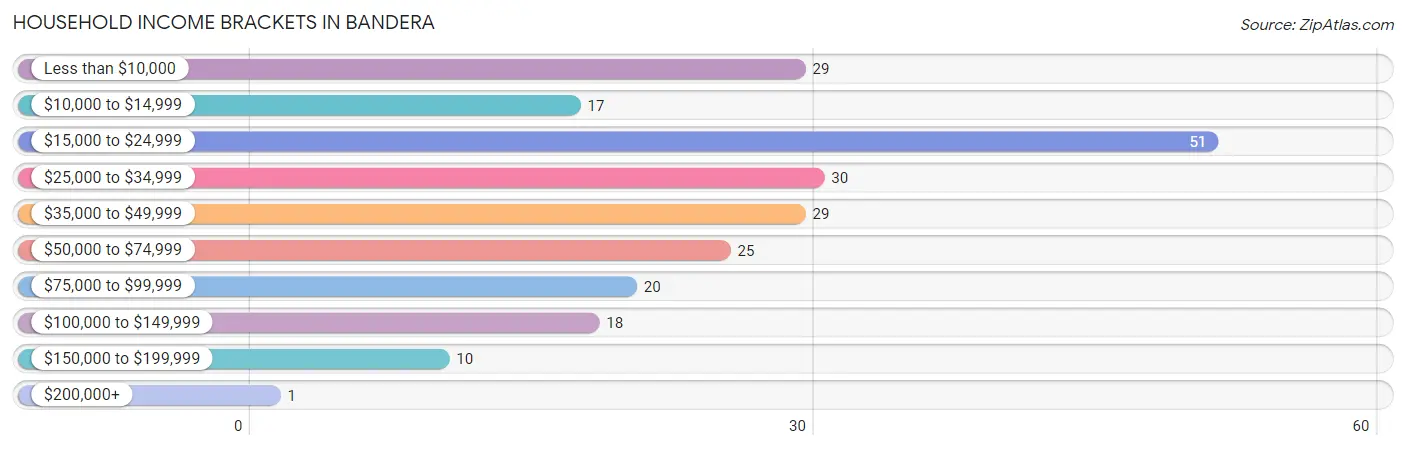
| Income Bracket | # Households | % Households |
| Less than $10,000 | 29 | 12.6% |
| $10,000 to $14,999 | 17 | 7.4% |
| $15,000 to $24,999 | 51 | 22.2% |
| $25,000 to $34,999 | 30 | 13.0% |
| $35,000 to $49,999 | 29 | 12.6% |
| $50,000 to $74,999 | 25 | 10.9% |
| $75,000 to $99,999 | 20 | 8.7% |
| $100,000 to $149,999 | 18 | 7.8% |
| $150,000 to $199,999 | 10 | 4.3% |
| $200,000+ | 1 | 0.4% |
Household Income by Householder Age in Bandera
The median household income in Bandera is $32,125, with the highest median household income of $31,438 found in the 15 to 24 years age bracket for the primary householder. A total of 35 households (15.2%) fall into this category. Meanwhile, the 25 to 44 years age bracket for the primary householder has the lowest median household income of $0, with 38 households (16.5%) in this group.
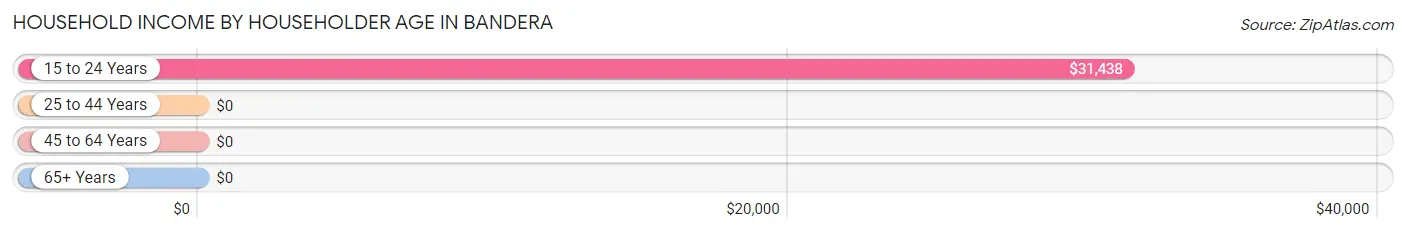
| Income Bracket | # Households | Median Income |
| 15 to 24 Years | 35 (15.2%) | $31,438 |
| 25 to 44 Years | 38 (16.5%) | $0 |
| 45 to 64 Years | 46 (20.0%) | $0 |
| 65+ Years | 111 (48.3%) | $0 |
| Total | 230 (100.0%) | $32,125 |
Poverty in Bandera
Income Below Poverty by Sex and Age in Bandera
With 12.5% poverty level for males and 19.8% for females among the residents of Bandera, 55 to 64 year old males and 18 to 24 year old females are the most vulnerable to poverty, with 10 males (43.5%) and 17 females (38.6%) in their respective age groups living below the poverty level.
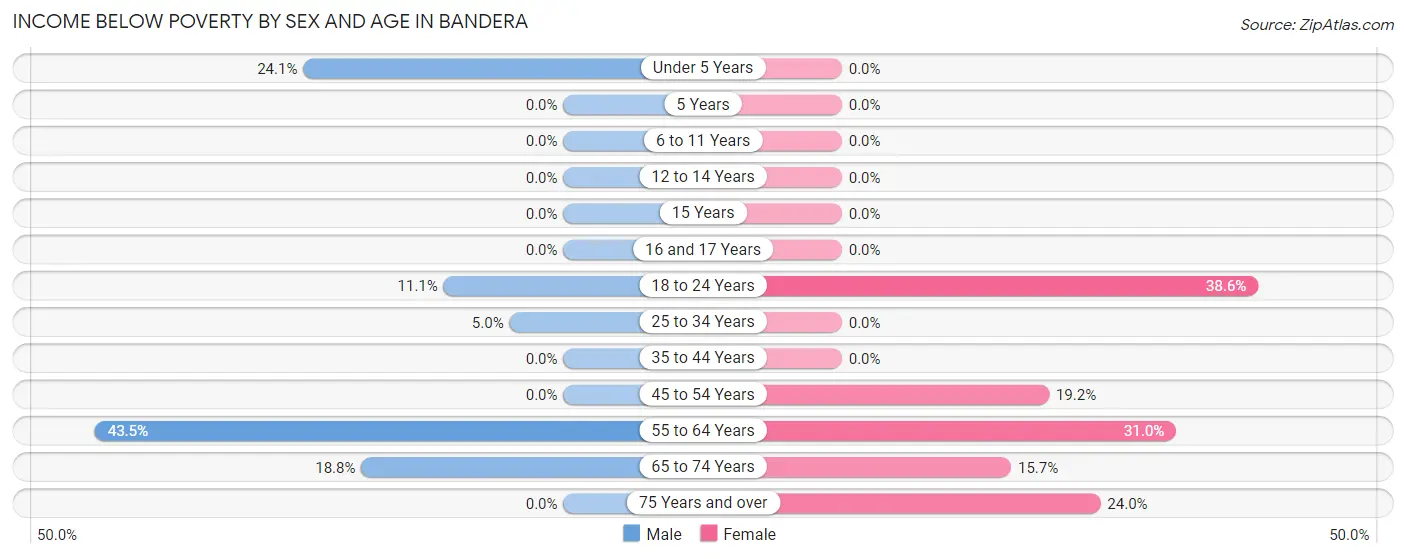
| Age Bracket | Male | Female |
| Under 5 Years | 7 (24.1%) | 0 (0.0%) |
| 5 Years | 0 (0.0%) | 0 (0.0%) |
| 6 to 11 Years | 0 (0.0%) | 0 (0.0%) |
| 12 to 14 Years | 0 (0.0%) | 0 (0.0%) |
| 15 Years | 0 (0.0%) | 0 (0.0%) |
| 16 and 17 Years | 0 (0.0%) | 0 (0.0%) |
| 18 to 24 Years | 6 (11.1%) | 17 (38.6%) |
| 25 to 34 Years | 4 (5.0%) | 0 (0.0%) |
| 35 to 44 Years | 0 (0.0%) | 0 (0.0%) |
| 45 to 54 Years | 0 (0.0%) | 10 (19.2%) |
| 55 to 64 Years | 10 (43.5%) | 9 (31.0%) |
| 65 to 74 Years | 3 (18.8%) | 11 (15.7%) |
| 75 Years and over | 0 (0.0%) | 6 (24.0%) |
| Total | 30 (12.5%) | 53 (19.8%) |
Income Above Poverty by Sex and Age in Bandera
According to the poverty statistics in Bandera, males aged 6 to 11 years and females aged 6 to 11 years are the age groups that are most secure financially, with 100.0% of males and 100.0% of females in these age groups living above the poverty line.
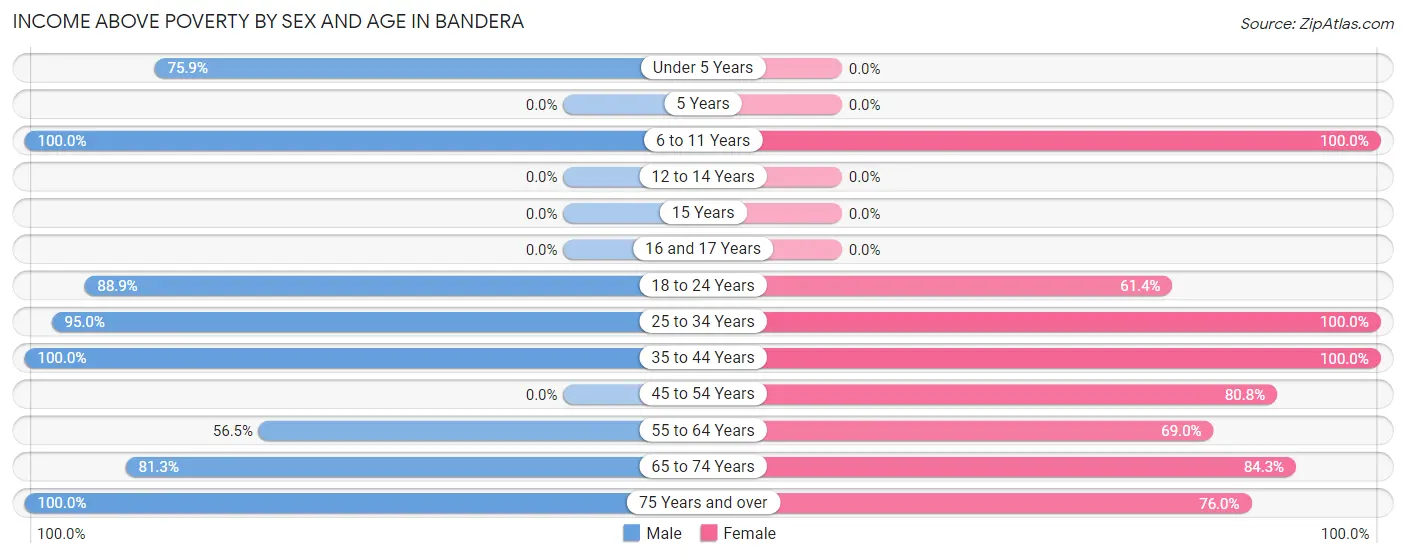
| Age Bracket | Male | Female |
| Under 5 Years | 22 (75.9%) | 0 (0.0%) |
| 5 Years | 0 (0.0%) | 0 (0.0%) |
| 6 to 11 Years | 2 (100.0%) | 6 (100.0%) |
| 12 to 14 Years | 0 (0.0%) | 0 (0.0%) |
| 15 Years | 0 (0.0%) | 0 (0.0%) |
| 16 and 17 Years | 0 (0.0%) | 0 (0.0%) |
| 18 to 24 Years | 48 (88.9%) | 27 (61.4%) |
| 25 to 34 Years | 76 (95.0%) | 28 (100.0%) |
| 35 to 44 Years | 19 (100.0%) | 14 (100.0%) |
| 45 to 54 Years | 0 (0.0%) | 42 (80.8%) |
| 55 to 64 Years | 13 (56.5%) | 20 (69.0%) |
| 65 to 74 Years | 13 (81.2%) | 59 (84.3%) |
| 75 Years and over | 17 (100.0%) | 19 (76.0%) |
| Total | 210 (87.5%) | 215 (80.2%) |
Income Below Poverty Among Married-Couple Families in Bandera
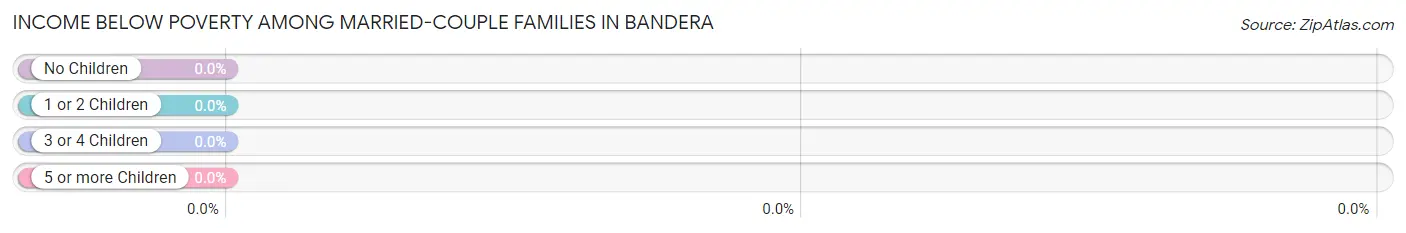
| Children | Above Poverty | Below Poverty |
| No Children | 62 (100.0%) | 0 (0.0%) |
| 1 or 2 Children | 4 (100.0%) | 0 (0.0%) |
| 3 or 4 Children | 2 (100.0%) | 0 (0.0%) |
| 5 or more Children | 0 (0.0%) | 0 (0.0%) |
| Total | 68 (100.0%) | 0 (0.0%) |
Income Below Poverty Among Single-Parent Households in Bandera
According to the poverty data in Bandera, 40.0% or 6 single-father households and 10.5% or 2 single-mother households are living below the poverty line. Among single-father households, those with 1 or 2 children have the highest poverty rate, with 6 households (100.0%) experiencing poverty. Likewise, among single-mother households, those with no children have the highest poverty rate, with 2 households (20.0%) falling below the poverty line.
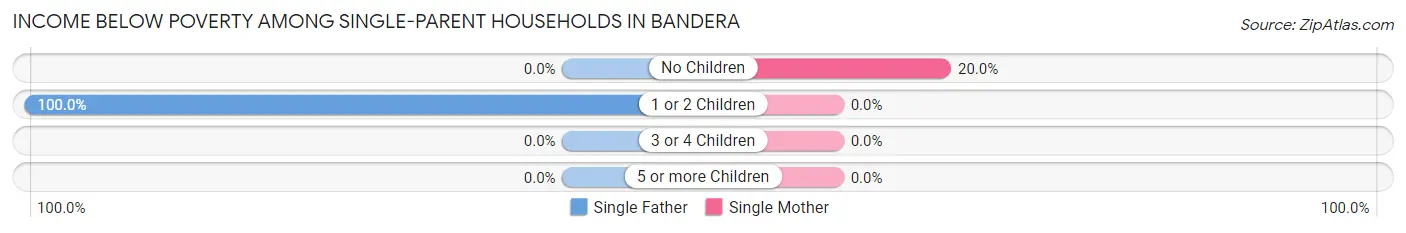
| Children | Single Father | Single Mother |
| No Children | 0 (0.0%) | 2 (20.0%) |
| 1 or 2 Children | 6 (100.0%) | 0 (0.0%) |
| 3 or 4 Children | 0 (0.0%) | 0 (0.0%) |
| 5 or more Children | 0 (0.0%) | 0 (0.0%) |
| Total | 6 (40.0%) | 2 (10.5%) |
Income Below Poverty Among Married-Couple vs Single-Parent Households in Bandera
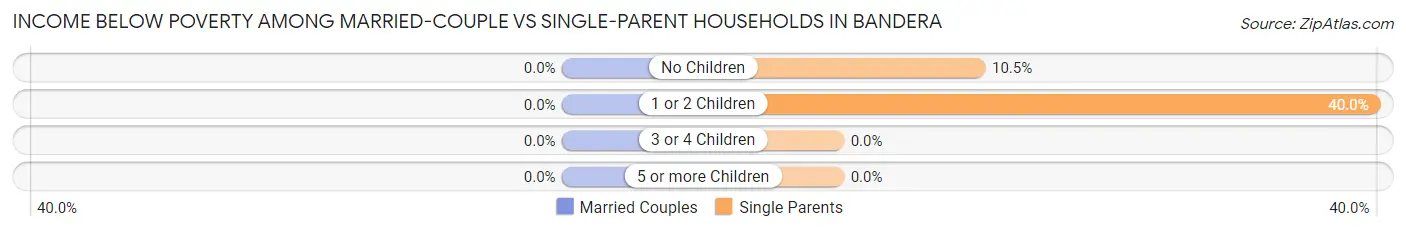
| Children | Married-Couple Families | Single-Parent Households |
| No Children | 0 (0.0%) | 2 (10.5%) |
| 1 or 2 Children | 0 (0.0%) | 6 (40.0%) |
| 3 or 4 Children | 0 (0.0%) | 0 (0.0%) |
| 5 or more Children | 0 (0.0%) | 0 (0.0%) |
| Total | 0 (0.0%) | 8 (23.5%) |
Race in Bandera
The most populous races in Bandera are White / Caucasian (457 | 80.9%), Hispanic or Latino (173 | 30.6%), and Two or more Races (69 | 12.2%).
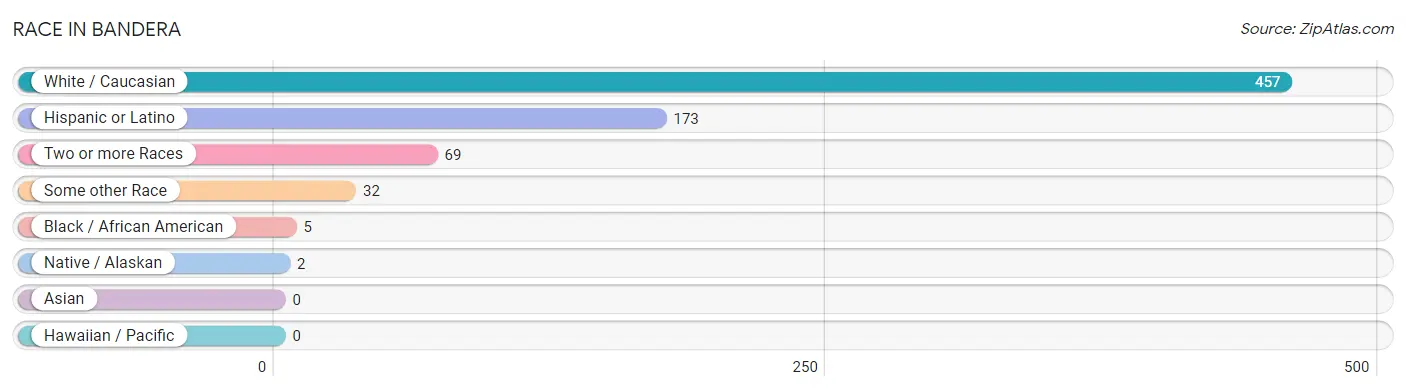
| Race | # Population | % Population |
| Asian | 0 | 0.0% |
| Black / African American | 5 | 0.9% |
| Hawaiian / Pacific | 0 | 0.0% |
| Hispanic or Latino | 173 | 30.6% |
| Native / Alaskan | 2 | 0.4% |
| White / Caucasian | 457 | 80.9% |
| Two or more Races | 69 | 12.2% |
| Some other Race | 32 | 5.7% |
| Total | 565 | 100.0% |
Ancestry in Bandera
The most populous ancestries reported in Bandera are Mexican (121 | 21.4%), English (113 | 20.0%), German (82 | 14.5%), Irish (44 | 7.8%), and Scotch-Irish (30 | 5.3%), together accounting for 69.0% of all Bandera residents.
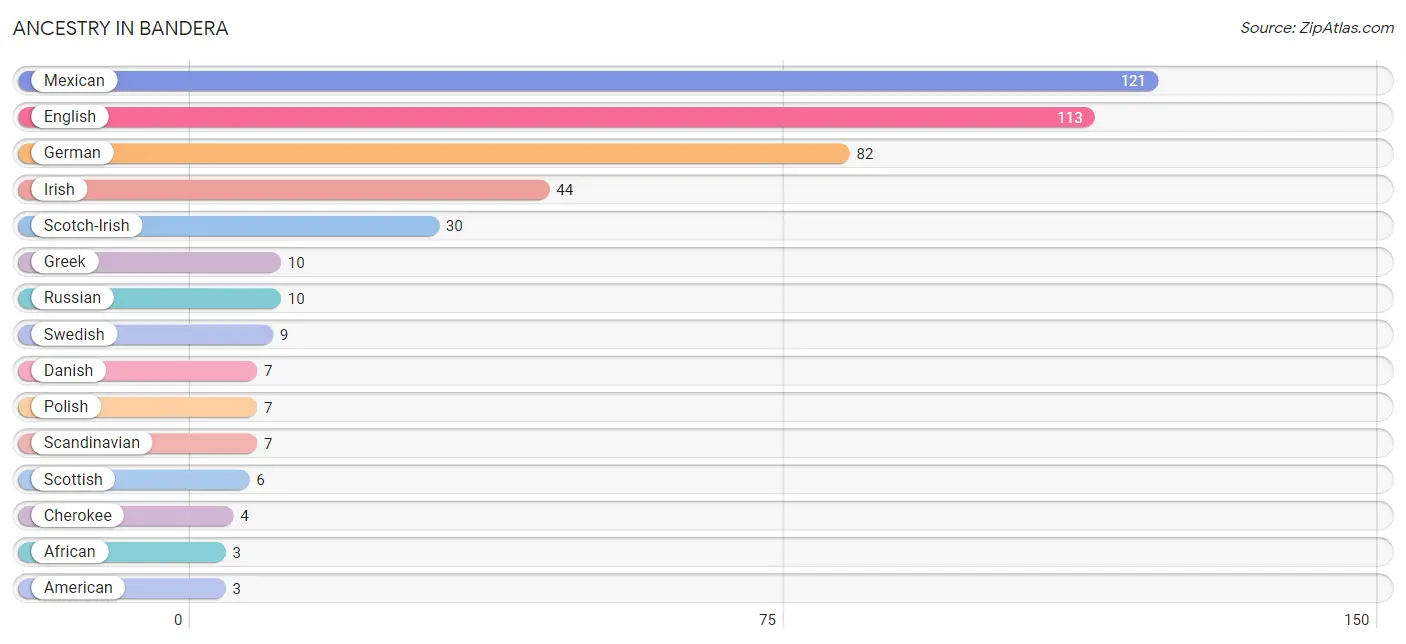
| Ancestry | # Population | % Population |
| African | 3 | 0.5% |
| American | 3 | 0.5% |
| British | 1 | 0.2% |
| Cherokee | 4 | 0.7% |
| Danish | 7 | 1.2% |
| English | 113 | 20.0% |
| German | 82 | 14.5% |
| Greek | 10 | 1.8% |
| Irish | 44 | 7.8% |
| Italian | 3 | 0.5% |
| Mexican | 121 | 21.4% |
| Navajo | 1 | 0.2% |
| Polish | 7 | 1.2% |
| Russian | 10 | 1.8% |
| Scandinavian | 7 | 1.2% |
| Scotch-Irish | 30 | 5.3% |
| Scottish | 6 | 1.1% |
| Subsaharan African | 3 | 0.5% |
| Swedish | 9 | 1.6% | View All 19 Rows |
Immigrants in Bandera
The most numerous immigrant groups reported in Bandera came from , and Canada (2 | 0.4%), together accounting for 0.4% of all Bandera residents.

| Immigration Origin | # Population | % Population |
| Canada | 2 | 0.4% | View All 1 Rows |
Sex and Age in Bandera
Sex and Age in Bandera
The most populous age groups in Bandera are 25 to 29 Years (56 | 21.0%) for men and 65 to 69 Years (56 | 18.8%) for women.
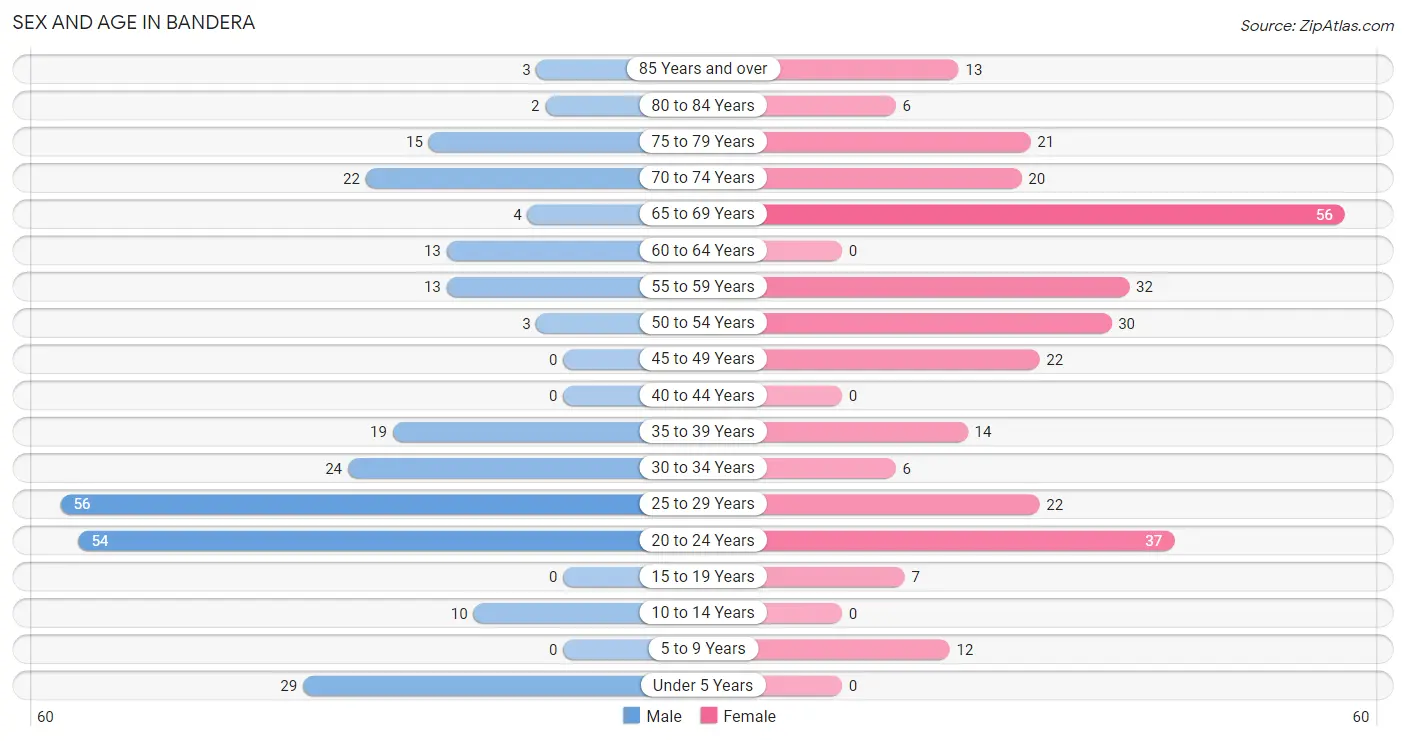
| Age Bracket | Male | Female |
| Under 5 Years | 29 (10.9%) | 0 (0.0%) |
| 5 to 9 Years | 0 (0.0%) | 12 (4.0%) |
| 10 to 14 Years | 10 (3.7%) | 0 (0.0%) |
| 15 to 19 Years | 0 (0.0%) | 7 (2.4%) |
| 20 to 24 Years | 54 (20.2%) | 37 (12.4%) |
| 25 to 29 Years | 56 (21.0%) | 22 (7.4%) |
| 30 to 34 Years | 24 (9.0%) | 6 (2.0%) |
| 35 to 39 Years | 19 (7.1%) | 14 (4.7%) |
| 40 to 44 Years | 0 (0.0%) | 0 (0.0%) |
| 45 to 49 Years | 0 (0.0%) | 22 (7.4%) |
| 50 to 54 Years | 3 (1.1%) | 30 (10.1%) |
| 55 to 59 Years | 13 (4.9%) | 32 (10.7%) |
| 60 to 64 Years | 13 (4.9%) | 0 (0.0%) |
| 65 to 69 Years | 4 (1.5%) | 56 (18.8%) |
| 70 to 74 Years | 22 (8.2%) | 20 (6.7%) |
| 75 to 79 Years | 15 (5.6%) | 21 (7.0%) |
| 80 to 84 Years | 2 (0.7%) | 6 (2.0%) |
| 85 Years and over | 3 (1.1%) | 13 (4.4%) |
| Total | 267 (100.0%) | 298 (100.0%) |
Families and Households in Bandera
Median Family Size in Bandera
The median family size in Bandera is 3.53 persons per family, with single female/mother families (19 | 18.6%) accounting for the largest median family size of 3.95 persons per family. On the other hand, single male/father families (15 | 14.7%) represent the smallest median family size with 3.07 persons per family.
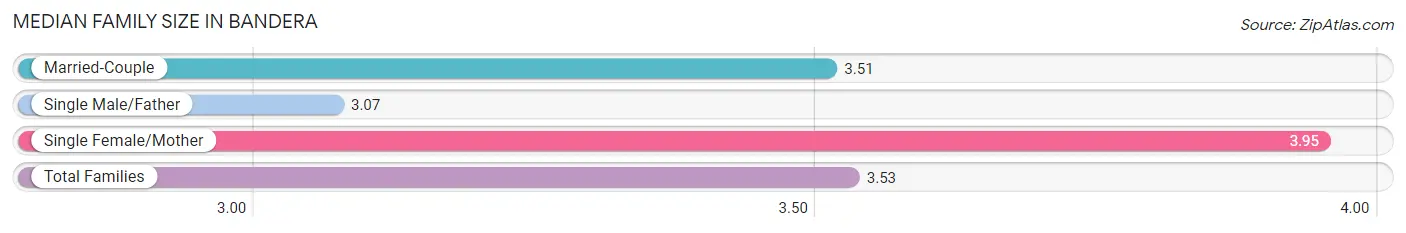
| Family Type | # Families | Family Size |
| Married-Couple | 68 (66.7%) | 3.51 |
| Single Male/Father | 15 (14.7%) | 3.07 |
| Single Female/Mother | 19 (18.6%) | 3.95 |
| Total Families | 102 (100.0%) | 3.53 |
Median Household Size in Bandera
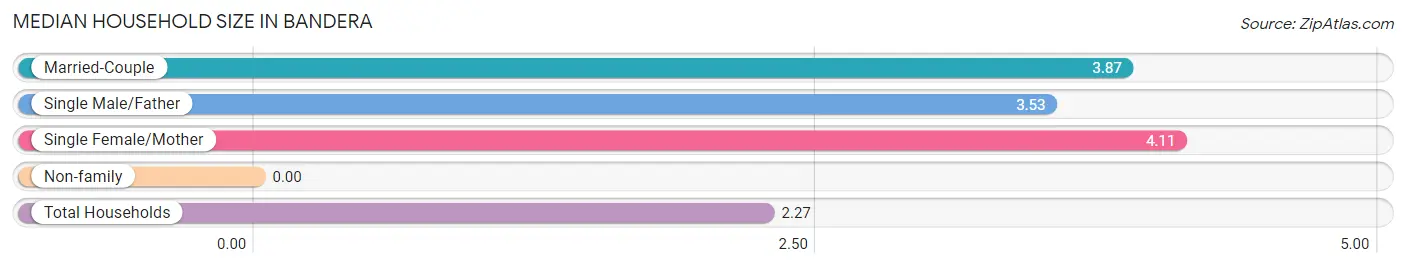
| Household Type | # Households | Household Size |
| Married-Couple | 68 (29.6%) | 3.87 |
| Single Male/Father | 15 (6.5%) | 3.53 |
| Single Female/Mother | 19 (8.3%) | 4.11 |
| Non-family | 128 (55.6%) | - |
| Total Households | 230 (100.0%) | 2.27 |
Household Size by Marriage Status in Bandera
Out of a total of 230 households in Bandera, 102 (44.4%) are family households, while 128 (55.6%) are nonfamily households. The most numerous type of family households are 3-person households, comprising 34, and the most common type of nonfamily households are 1-person households, comprising 128.
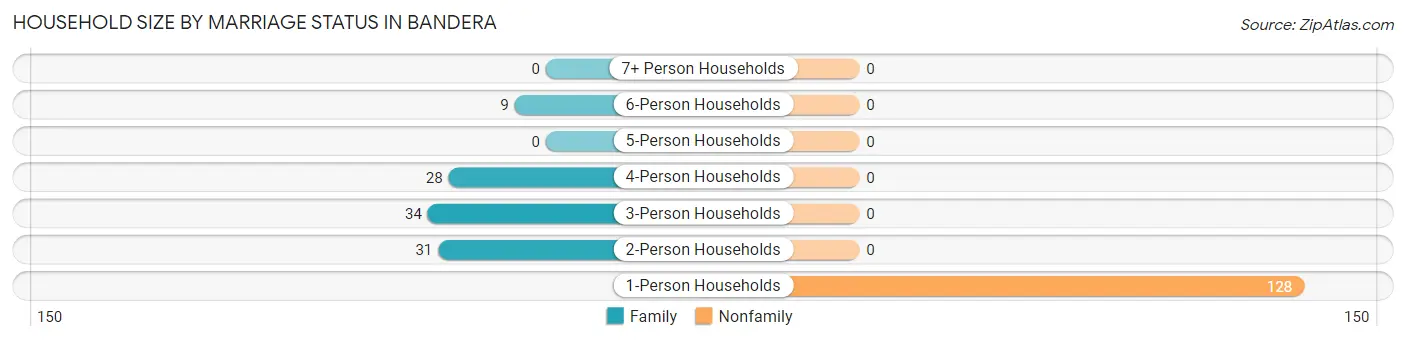
| Household Size | Family Households | Nonfamily Households |
| 1-Person Households | - | 128 (55.6%) |
| 2-Person Households | 31 (13.5%) | 0 (0.0%) |
| 3-Person Households | 34 (14.8%) | 0 (0.0%) |
| 4-Person Households | 28 (12.2%) | 0 (0.0%) |
| 5-Person Households | 0 (0.0%) | 0 (0.0%) |
| 6-Person Households | 9 (3.9%) | 0 (0.0%) |
| 7+ Person Households | 0 (0.0%) | 0 (0.0%) |
| Total | 102 (44.4%) | 128 (55.6%) |
Female Fertility in Bandera
Fertility by Age in Bandera
Average fertility rate in Bandera is 56.0 births per 1,000 women. Women in the age bracket of 20 to 34 years have the highest fertility rate with 108.0 births per 1,000 women. Women in the age bracket of 20 to 34 years acount for 100.0% of all women with births.
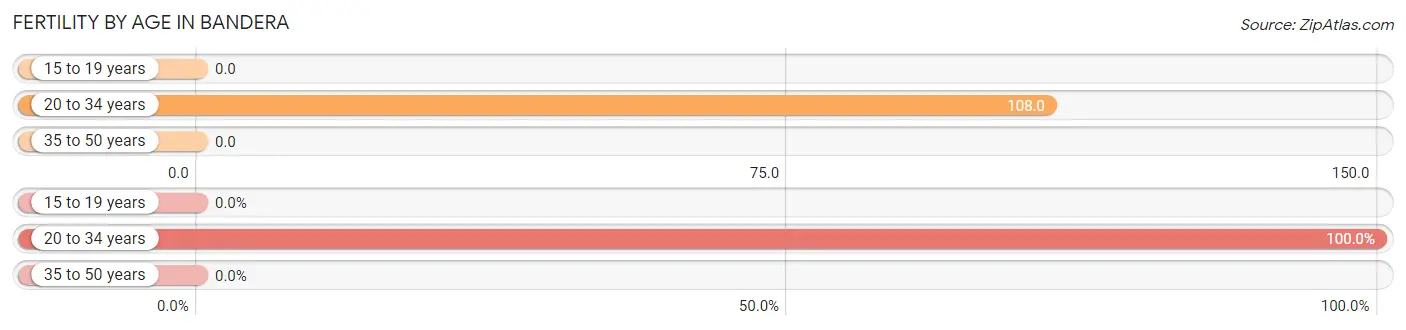
| Age Bracket | Women with Births | Births / 1,000 Women |
| 15 to 19 years | 0 (0.0%) | 0.0 |
| 20 to 34 years | 7 (100.0%) | 108.0 |
| 35 to 50 years | 0 (0.0%) | 0.0 |
| Total | 7 (100.0%) | 56.0 |
Fertility by Age by Marriage Status in Bandera
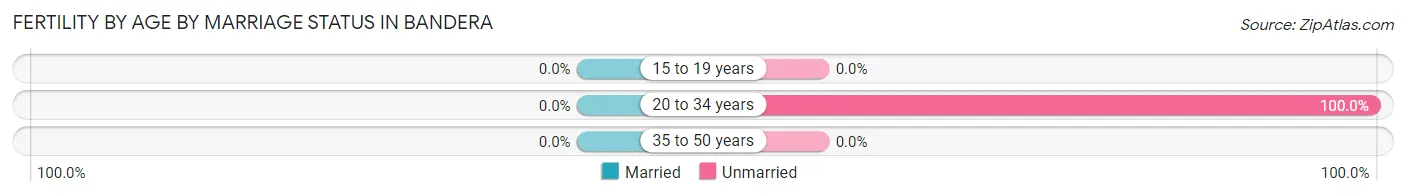
| Age Bracket | Married | Unmarried |
| 15 to 19 years | 0 (0.0%) | 0 (0.0%) |
| 20 to 34 years | 0 (0.0%) | 7 (100.0%) |
| 35 to 50 years | 0 (0.0%) | 0 (0.0%) |
| Total | 0 (0.0%) | 7 (100.0%) |
Fertility by Education in Bandera
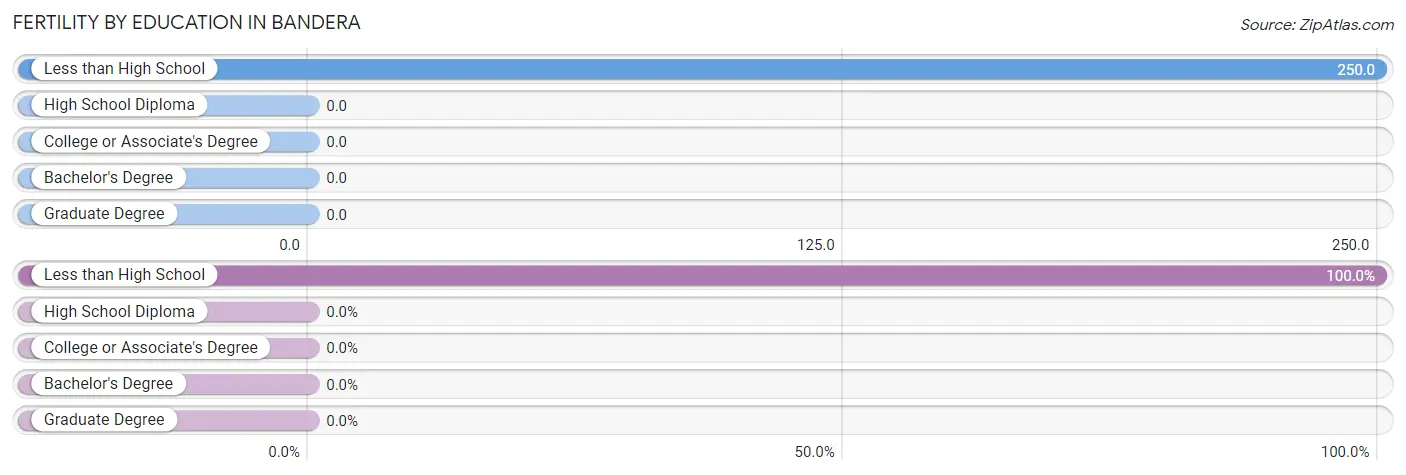
| Educational Attainment | Women with Births | Births / 1,000 Women |
| Less than High School | 7 (100.0%) | 250.0 |
| High School Diploma | 0 (0.0%) | 0.0 |
| College or Associate's Degree | 0 (0.0%) | 0.0 |
| Bachelor's Degree | 0 (0.0%) | 0.0 |
| Graduate Degree | 0 (0.0%) | 0.0 |
| Total | 7 (100.0%) | 56.0 |
Fertility by Education by Marriage Status in Bandera
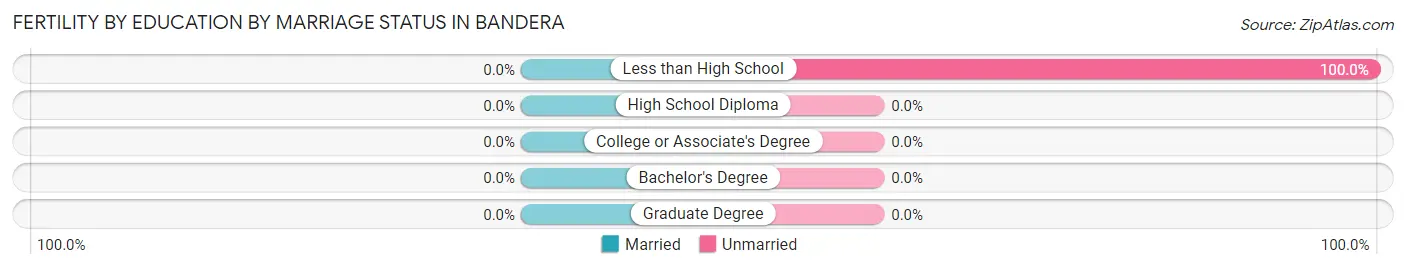
| Educational Attainment | Married | Unmarried |
| Less than High School | 0 (0.0%) | 7 (100.0%) |
| High School Diploma | 0 (0.0%) | 0 (0.0%) |
| College or Associate's Degree | 0 (0.0%) | 0 (0.0%) |
| Bachelor's Degree | 0 (0.0%) | 0 (0.0%) |
| Graduate Degree | 0 (0.0%) | 0 (0.0%) |
| Total | 0 (0.0%) | 7 (100.0%) |
Employment Characteristics in Bandera
Employment by Class of Employer in Bandera
Among the 272 employed individuals in Bandera, private company employees (224 | 82.4%), local government employees (30 | 11.0%), and federal government employees (18 | 6.6%) make up the most common classes of employment.
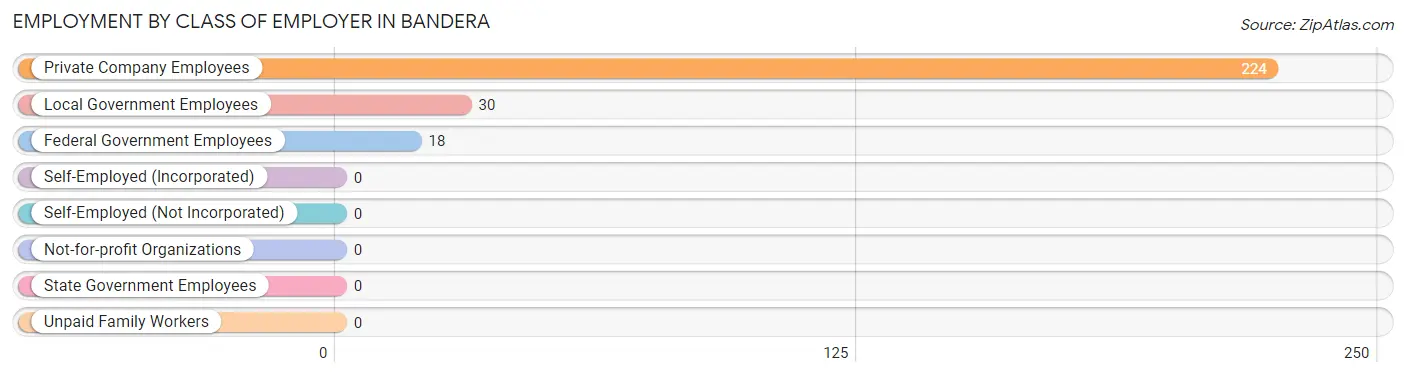
| Employer Class | # Employees | % Employees |
| Private Company Employees | 224 | 82.4% |
| Self-Employed (Incorporated) | 0 | 0.0% |
| Self-Employed (Not Incorporated) | 0 | 0.0% |
| Not-for-profit Organizations | 0 | 0.0% |
| Local Government Employees | 30 | 11.0% |
| State Government Employees | 0 | 0.0% |
| Federal Government Employees | 18 | 6.6% |
| Unpaid Family Workers | 0 | 0.0% |
| Total | 272 | 100.0% |
Employment Status by Age in Bandera
According to the labor force statistics for Bandera, out of the total population over 16 years of age (514), 59.1% or 304 individuals are in the labor force, with 10.5% or 32 of them unemployed. The age group with the highest labor force participation rate is 25 to 29 years, with 94.9% or 74 individuals in the labor force. Within the labor force, the 65 to 74 years age range has the highest percentage of unemployed individuals, with 33.3% or 6 of them being unemployed.
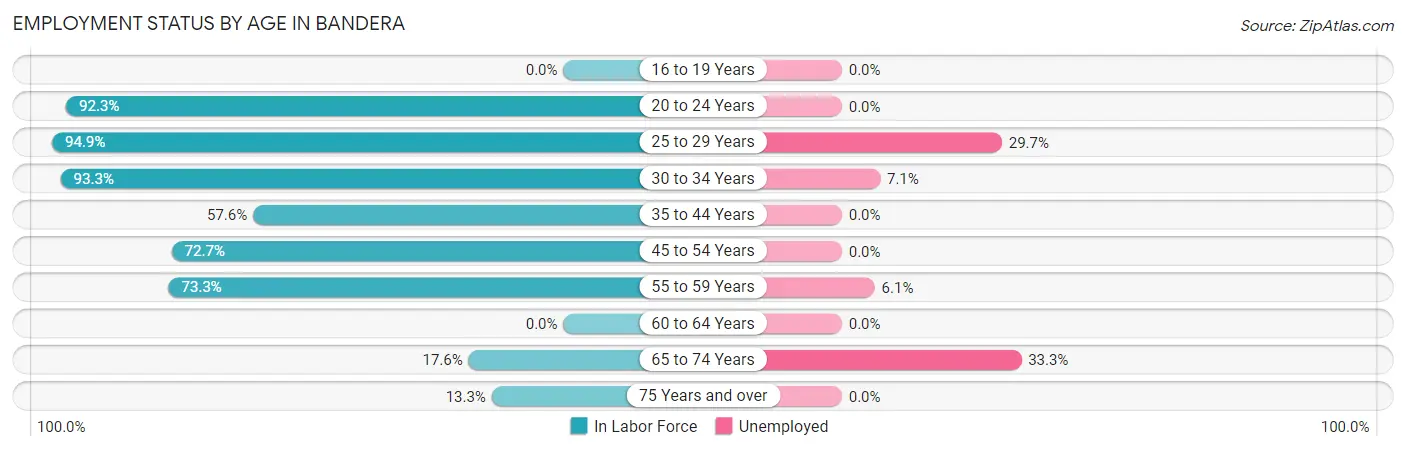
| Age Bracket | In Labor Force | Unemployed |
| 16 to 19 Years | 0 (0.0%) | 0 (0.0%) |
| 20 to 24 Years | 84 (92.3%) | 0 (0.0%) |
| 25 to 29 Years | 74 (94.9%) | 22 (29.7%) |
| 30 to 34 Years | 28 (93.3%) | 2 (7.1%) |
| 35 to 44 Years | 19 (57.6%) | 0 (0.0%) |
| 45 to 54 Years | 40 (72.7%) | 0 (0.0%) |
| 55 to 59 Years | 33 (73.3%) | 2 (6.1%) |
| 60 to 64 Years | 0 (0.0%) | 0 (0.0%) |
| 65 to 74 Years | 18 (17.6%) | 6 (33.3%) |
| 75 Years and over | 8 (13.3%) | 0 (0.0%) |
| Total | 304 (59.1%) | 32 (10.5%) |
Employment Status by Educational Attainment in Bandera
According to labor force statistics for Bandera, 76.4% of individuals (194) out of the total population between 25 and 64 years of age (254) are in the labor force, with 13.4% or 26 of them being unemployed. The group with the highest labor force participation rate are those with the educational attainment of high school diploma, with 88.2% or 67 individuals in the labor force. Within the labor force, individuals with high school diploma education have the highest percentage of unemployment, with 32.8% or 22 of them being unemployed.
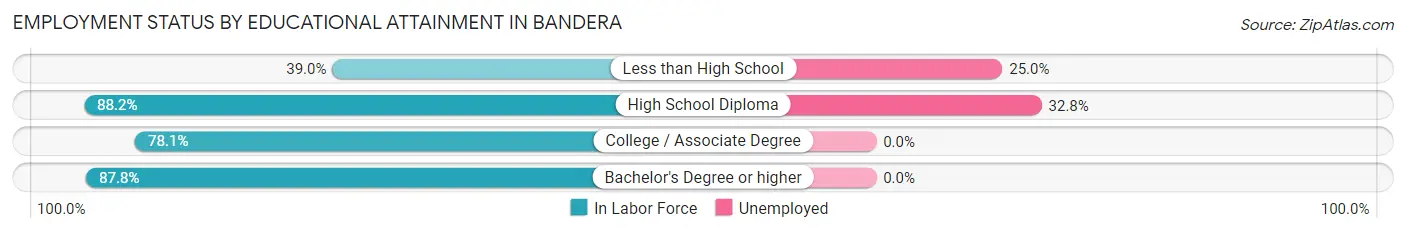
| Educational Attainment | In Labor Force | Unemployed |
| Less than High School | 16 (39.0%) | 10 (25.0%) |
| High School Diploma | 67 (88.2%) | 25 (32.8%) |
| College / Associate Degree | 75 (78.1%) | 0 (0.0%) |
| Bachelor's Degree or higher | 36 (87.8%) | 0 (0.0%) |
| Total | 194 (76.4%) | 34 (13.4%) |
Employment Occupations by Sex in Bandera
Management, Business, Science and Arts Occupations
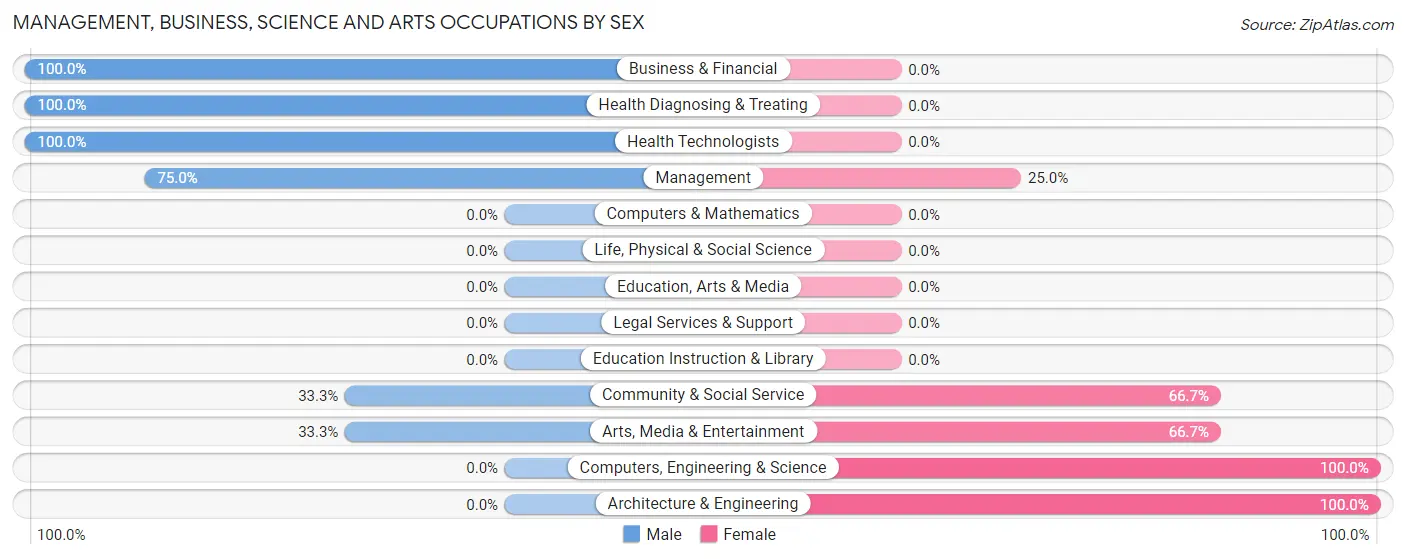
The most common Management, Business, Science and Arts occupations in Bandera are Health Diagnosing & Treating (14 | 5.1%), Health Technologists (14 | 5.1%), Management (12 | 4.4%), Business & Financial (10 | 3.7%), and Computers, Engineering & Science (7 | 2.6%).
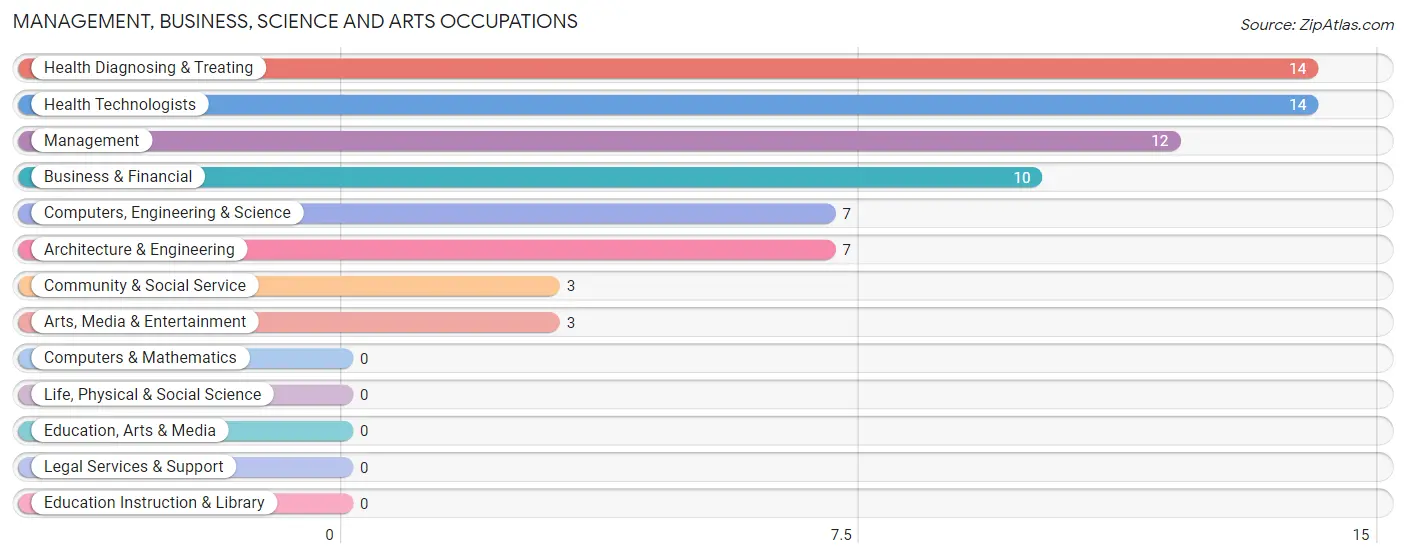
Management, Business, Science and Arts Occupations by Sex
Within the Management, Business, Science and Arts occupations in Bandera, the most male-oriented occupations are Business & Financial (100.0%), Health Diagnosing & Treating (100.0%), and Health Technologists (100.0%), while the most female-oriented occupations are Computers, Engineering & Science (100.0%), Architecture & Engineering (100.0%), and Community & Social Service (66.7%).
| Occupation | Male | Female |
| Management | 9 (75.0%) | 3 (25.0%) |
| Business & Financial | 10 (100.0%) | 0 (0.0%) |
| Computers, Engineering & Science | 0 (0.0%) | 7 (100.0%) |
| Computers & Mathematics | 0 (0.0%) | 0 (0.0%) |
| Architecture & Engineering | 0 (0.0%) | 7 (100.0%) |
| Life, Physical & Social Science | 0 (0.0%) | 0 (0.0%) |
| Community & Social Service | 1 (33.3%) | 2 (66.7%) |
| Education, Arts & Media | 0 (0.0%) | 0 (0.0%) |
| Legal Services & Support | 0 (0.0%) | 0 (0.0%) |
| Education Instruction & Library | 0 (0.0%) | 0 (0.0%) |
| Arts, Media & Entertainment | 1 (33.3%) | 2 (66.7%) |
| Health Diagnosing & Treating | 14 (100.0%) | 0 (0.0%) |
| Health Technologists | 14 (100.0%) | 0 (0.0%) |
| Total (Category) | 34 (73.9%) | 12 (26.1%) |
| Total (Overall) | 174 (64.0%) | 98 (36.0%) |
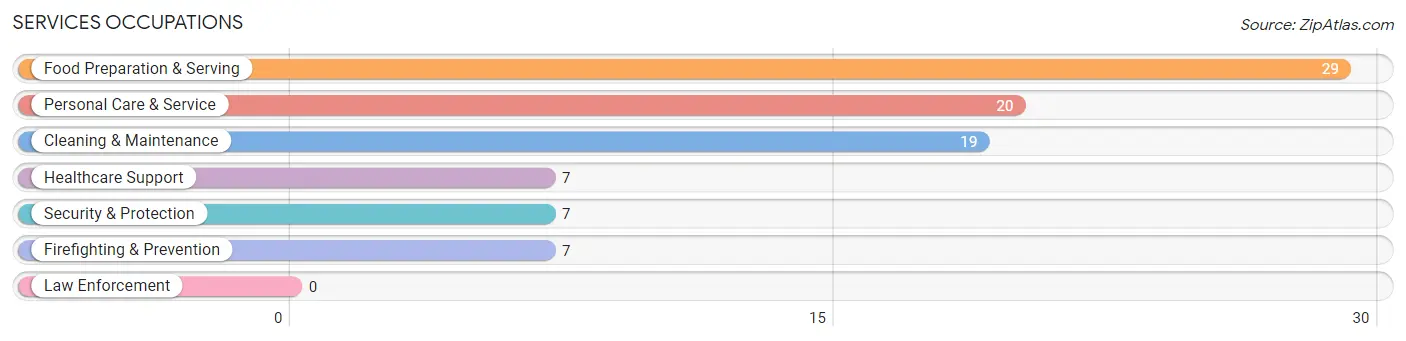
Services Occupations
The most common Services occupations in Bandera are Food Preparation & Serving (29 | 10.7%), Personal Care & Service (20 | 7.3%), Cleaning & Maintenance (19 | 7.0%), Healthcare Support (7 | 2.6%), and Security & Protection (7 | 2.6%).
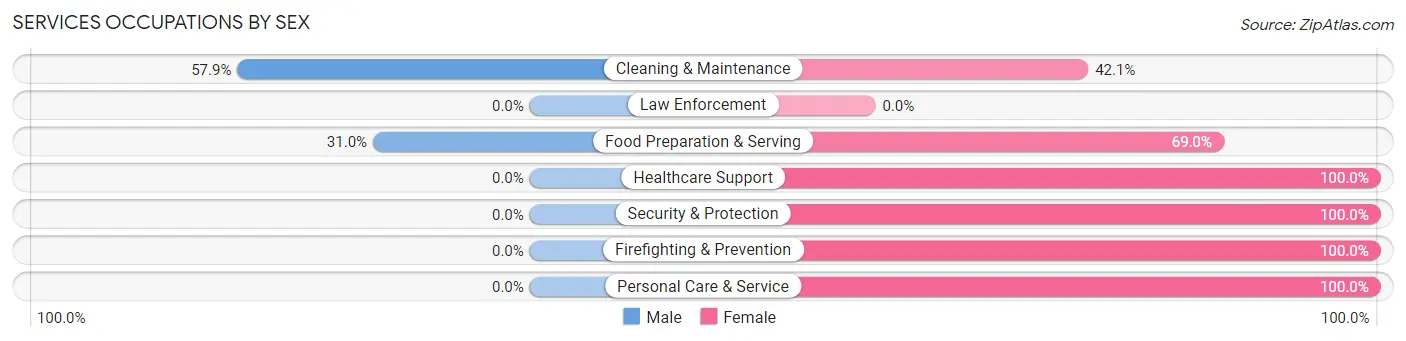
Services Occupations by Sex
Within the Services occupations in Bandera, the most male-oriented occupations are Cleaning & Maintenance (57.9%), and Food Preparation & Serving (31.0%), while the most female-oriented occupations are Healthcare Support (100.0%), Security & Protection (100.0%), and Firefighting & Prevention (100.0%).
| Occupation | Male | Female |
| Healthcare Support | 0 (0.0%) | 7 (100.0%) |
| Security & Protection | 0 (0.0%) | 7 (100.0%) |
| Firefighting & Prevention | 0 (0.0%) | 7 (100.0%) |
| Law Enforcement | 0 (0.0%) | 0 (0.0%) |
| Food Preparation & Serving | 9 (31.0%) | 20 (69.0%) |
| Cleaning & Maintenance | 11 (57.9%) | 8 (42.1%) |
| Personal Care & Service | 0 (0.0%) | 20 (100.0%) |
| Total (Category) | 20 (24.4%) | 62 (75.6%) |
| Total (Overall) | 174 (64.0%) | 98 (36.0%) |
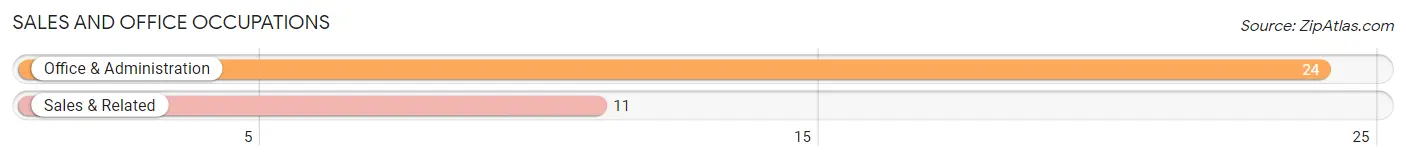
Sales and Office Occupations
The most common Sales and Office occupations in Bandera are Office & Administration (24 | 8.8%), and Sales & Related (11 | 4.0%).
Sales and Office Occupations by Sex
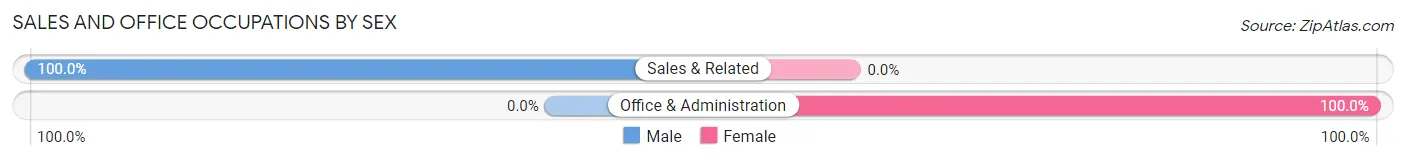
| Occupation | Male | Female |
| Sales & Related | 11 (100.0%) | 0 (0.0%) |
| Office & Administration | 0 (0.0%) | 24 (100.0%) |
| Total (Category) | 11 (31.4%) | 24 (68.6%) |
| Total (Overall) | 174 (64.0%) | 98 (36.0%) |
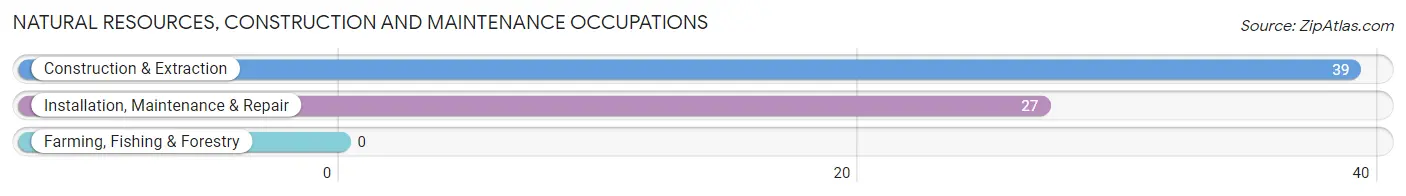
Natural Resources, Construction and Maintenance Occupations
The most common Natural Resources, Construction and Maintenance occupations in Bandera are Construction & Extraction (39 | 14.3%), and Installation, Maintenance & Repair (27 | 9.9%).
Natural Resources, Construction and Maintenance Occupations by Sex
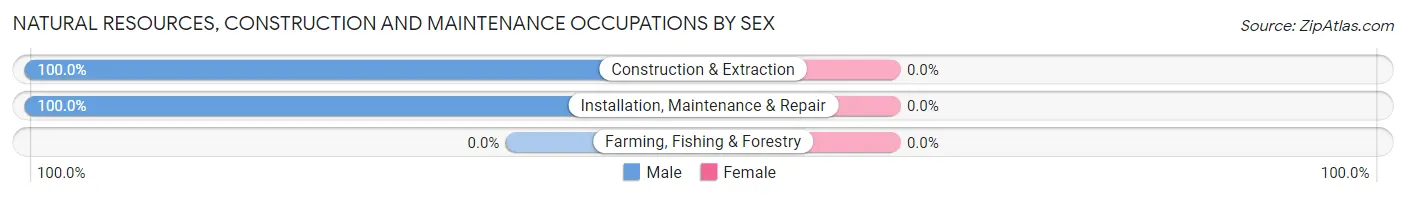
| Occupation | Male | Female |
| Farming, Fishing & Forestry | 0 (0.0%) | 0 (0.0%) |
| Construction & Extraction | 39 (100.0%) | 0 (0.0%) |
| Installation, Maintenance & Repair | 27 (100.0%) | 0 (0.0%) |
| Total (Category) | 66 (100.0%) | 0 (0.0%) |
| Total (Overall) | 174 (64.0%) | 98 (36.0%) |
Production, Transportation and Moving Occupations
The most common Production, Transportation and Moving occupations in Bandera are Material Moving (30 | 11.0%), Production (9 | 3.3%), and Transportation (4 | 1.5%).
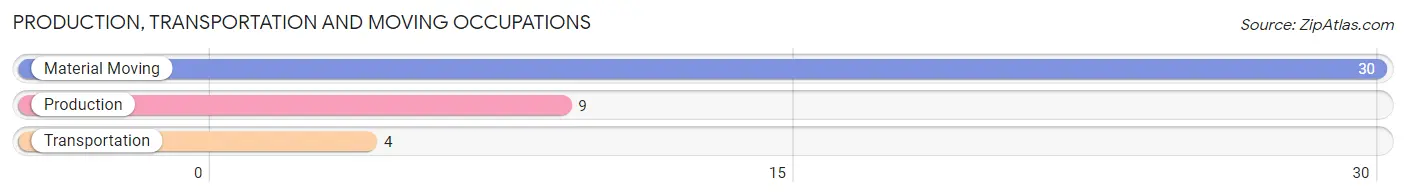
Production, Transportation and Moving Occupations by Sex
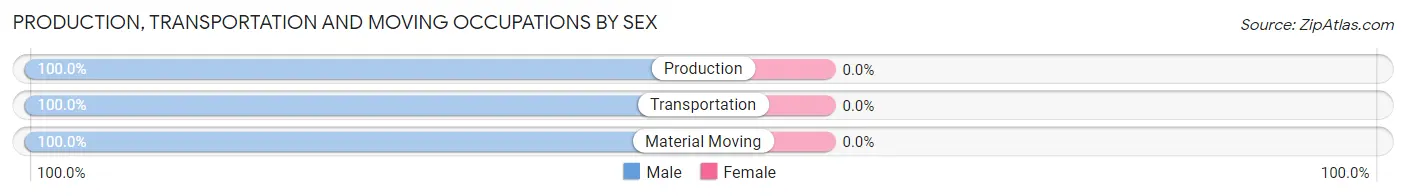
| Occupation | Male | Female |
| Production | 9 (100.0%) | 0 (0.0%) |
| Transportation | 4 (100.0%) | 0 (0.0%) |
| Material Moving | 30 (100.0%) | 0 (0.0%) |
| Total (Category) | 43 (100.0%) | 0 (0.0%) |
| Total (Overall) | 174 (64.0%) | 98 (36.0%) |
Employment Industries by Sex in Bandera
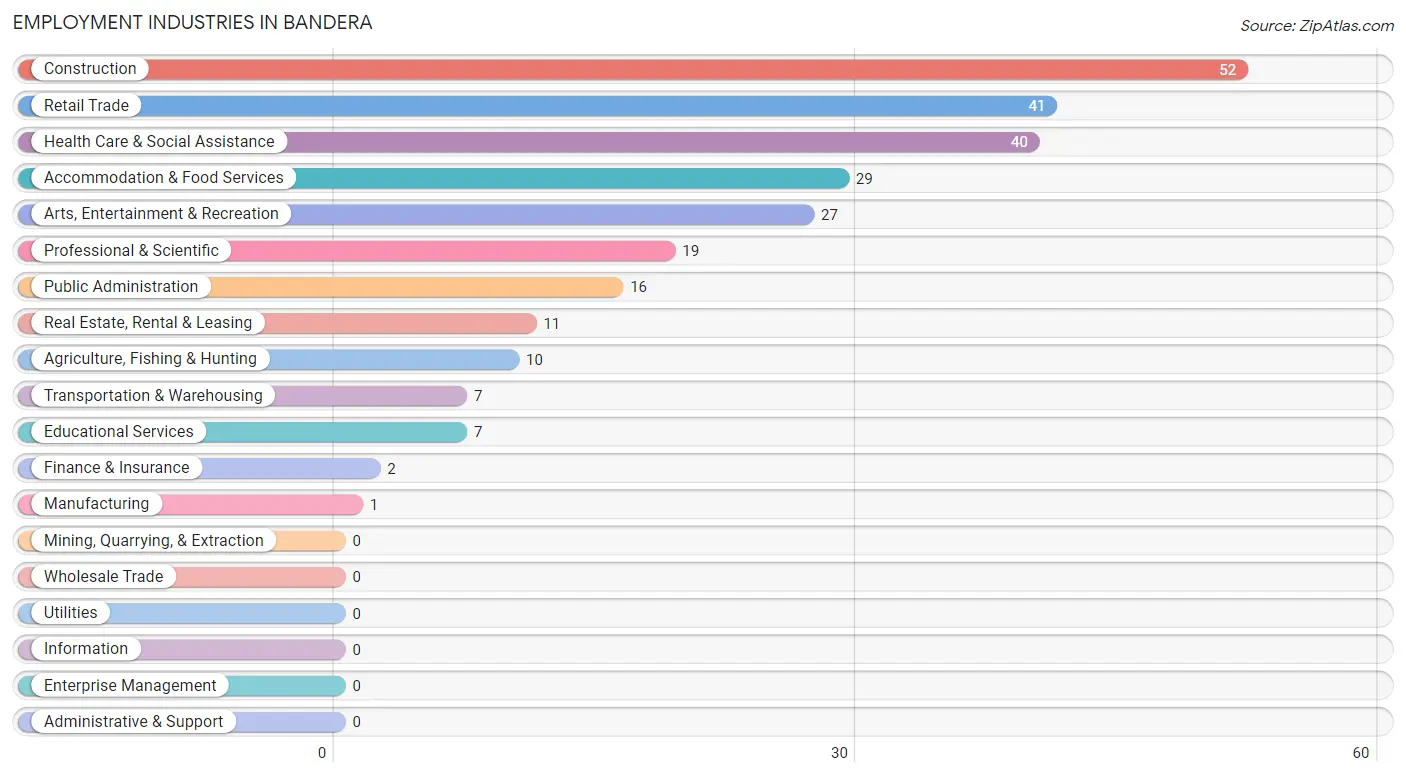
Employment Industries in Bandera
The major employment industries in Bandera include Construction (52 | 19.1%), Retail Trade (41 | 15.1%), Health Care & Social Assistance (40 | 14.7%), Accommodation & Food Services (29 | 10.7%), and Arts, Entertainment & Recreation (27 | 9.9%).
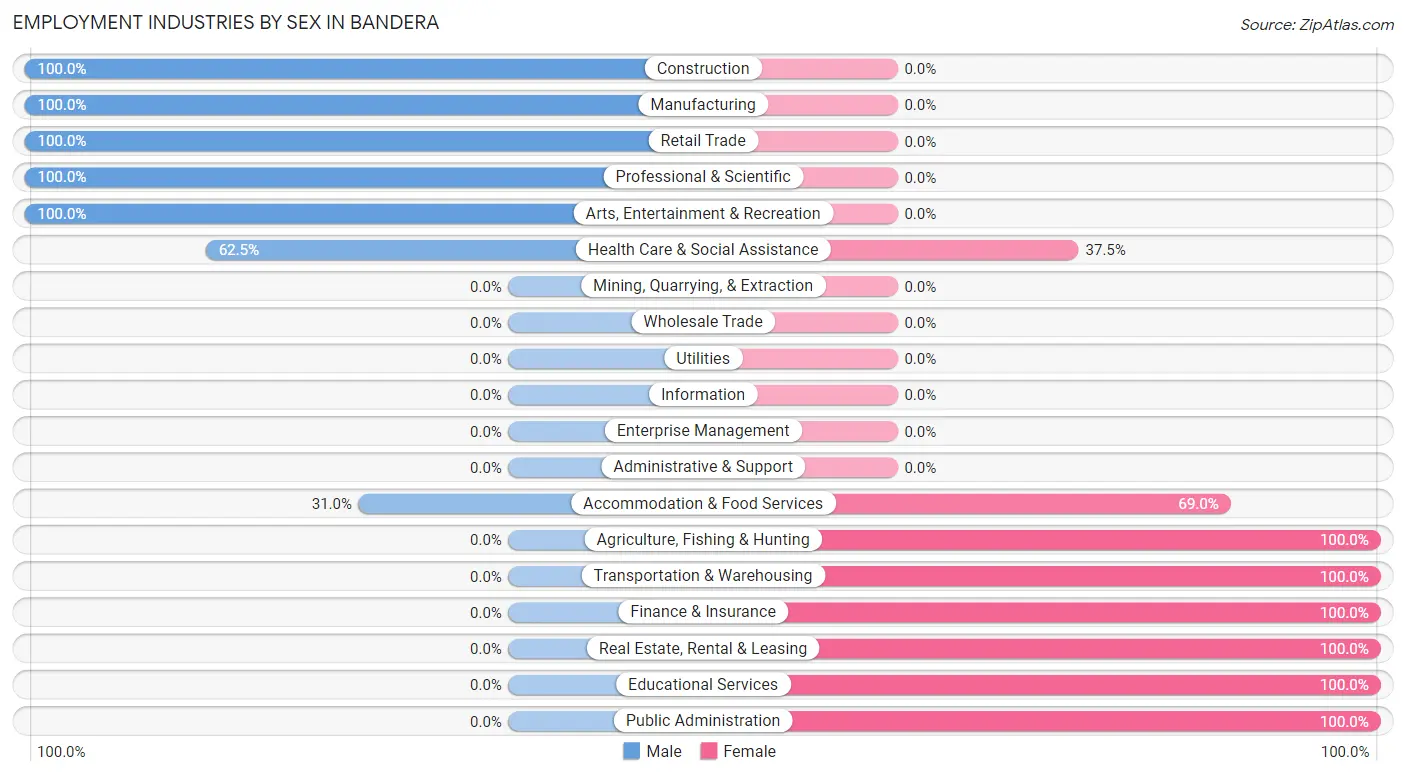
Employment Industries by Sex in Bandera
The Bandera industries that see more men than women are Construction (100.0%), Manufacturing (100.0%), and Retail Trade (100.0%), whereas the industries that tend to have a higher number of women are Agriculture, Fishing & Hunting (100.0%), Transportation & Warehousing (100.0%), and Finance & Insurance (100.0%).
| Industry | Male | Female |
| Agriculture, Fishing & Hunting | 0 (0.0%) | 10 (100.0%) |
| Mining, Quarrying, & Extraction | 0 (0.0%) | 0 (0.0%) |
| Construction | 52 (100.0%) | 0 (0.0%) |
| Manufacturing | 1 (100.0%) | 0 (0.0%) |
| Wholesale Trade | 0 (0.0%) | 0 (0.0%) |
| Retail Trade | 41 (100.0%) | 0 (0.0%) |
| Transportation & Warehousing | 0 (0.0%) | 7 (100.0%) |
| Utilities | 0 (0.0%) | 0 (0.0%) |
| Information | 0 (0.0%) | 0 (0.0%) |
| Finance & Insurance | 0 (0.0%) | 2 (100.0%) |
| Real Estate, Rental & Leasing | 0 (0.0%) | 11 (100.0%) |
| Professional & Scientific | 19 (100.0%) | 0 (0.0%) |
| Enterprise Management | 0 (0.0%) | 0 (0.0%) |
| Administrative & Support | 0 (0.0%) | 0 (0.0%) |
| Educational Services | 0 (0.0%) | 7 (100.0%) |
| Health Care & Social Assistance | 25 (62.5%) | 15 (37.5%) |
| Arts, Entertainment & Recreation | 27 (100.0%) | 0 (0.0%) |
| Accommodation & Food Services | 9 (31.0%) | 20 (69.0%) |
| Public Administration | 0 (0.0%) | 16 (100.0%) |
| Total | 174 (64.0%) | 98 (36.0%) |
Education in Bandera
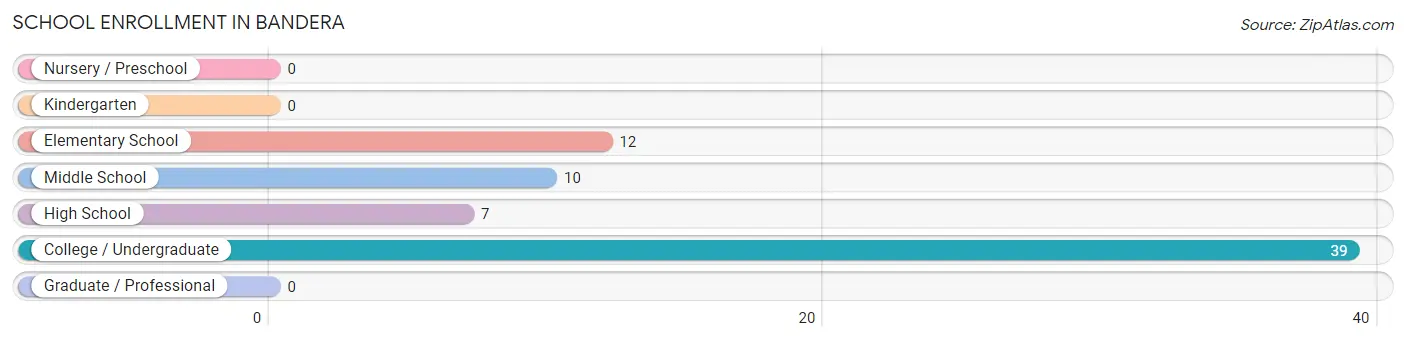
School Enrollment in Bandera
The most common levels of schooling among the 68 students in Bandera are college / undergraduate (39 | 57.4%), elementary school (12 | 17.6%), and middle school (10 | 14.7%).
| School Level | # Students | % Students |
| Nursery / Preschool | 0 | 0.0% |
| Kindergarten | 0 | 0.0% |
| Elementary School | 12 | 17.6% |
| Middle School | 10 | 14.7% |
| High School | 7 | 10.3% |
| College / Undergraduate | 39 | 57.4% |
| Graduate / Professional | 0 | 0.0% |
| Total | 68 | 100.0% |
School Enrollment by Age by Funding Source in Bandera
Out of a total of 68 students who are enrolled in schools in Bandera, 3 (4.4%) attend a private institution, while the remaining 65 (95.6%) are enrolled in public schools. The age group of 10 to 14 year olds has the highest likelihood of being enrolled in private schools, with 2 (20.0% in the age bracket) enrolled. Conversely, the age group of 18 to 19 year olds has the lowest likelihood of being enrolled in a private school, with 7 (100.0% in the age bracket) attending a public institution.
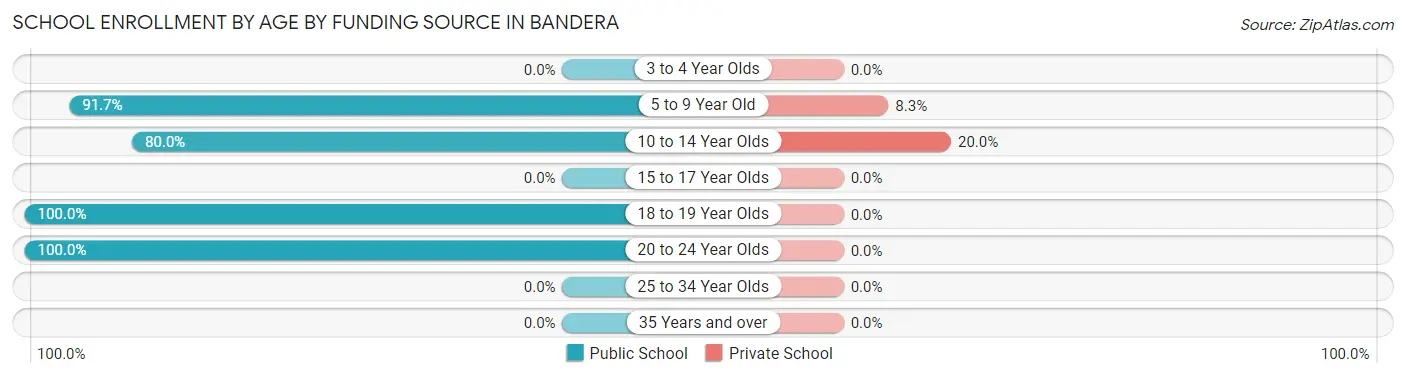
| Age Bracket | Public School | Private School |
| 3 to 4 Year Olds | 0 (0.0%) | 0 (0.0%) |
| 5 to 9 Year Old | 11 (91.7%) | 1 (8.3%) |
| 10 to 14 Year Olds | 8 (80.0%) | 2 (20.0%) |
| 15 to 17 Year Olds | 0 (0.0%) | 0 (0.0%) |
| 18 to 19 Year Olds | 7 (100.0%) | 0 (0.0%) |
| 20 to 24 Year Olds | 39 (100.0%) | 0 (0.0%) |
| 25 to 34 Year Olds | 0 (0.0%) | 0 (0.0%) |
| 35 Years and over | 0 (0.0%) | 0 (0.0%) |
| Total | 65 (95.6%) | 3 (4.4%) |
Educational Attainment by Field of Study in Bandera
Business (22 | 26.5%), physical & health sciences (14 | 16.9%), science & technology (13 | 15.7%), psychology (11 | 13.3%), and computers & mathematics (6 | 7.2%) are the most common fields of study among 83 individuals in Bandera who have obtained a bachelor's degree or higher.
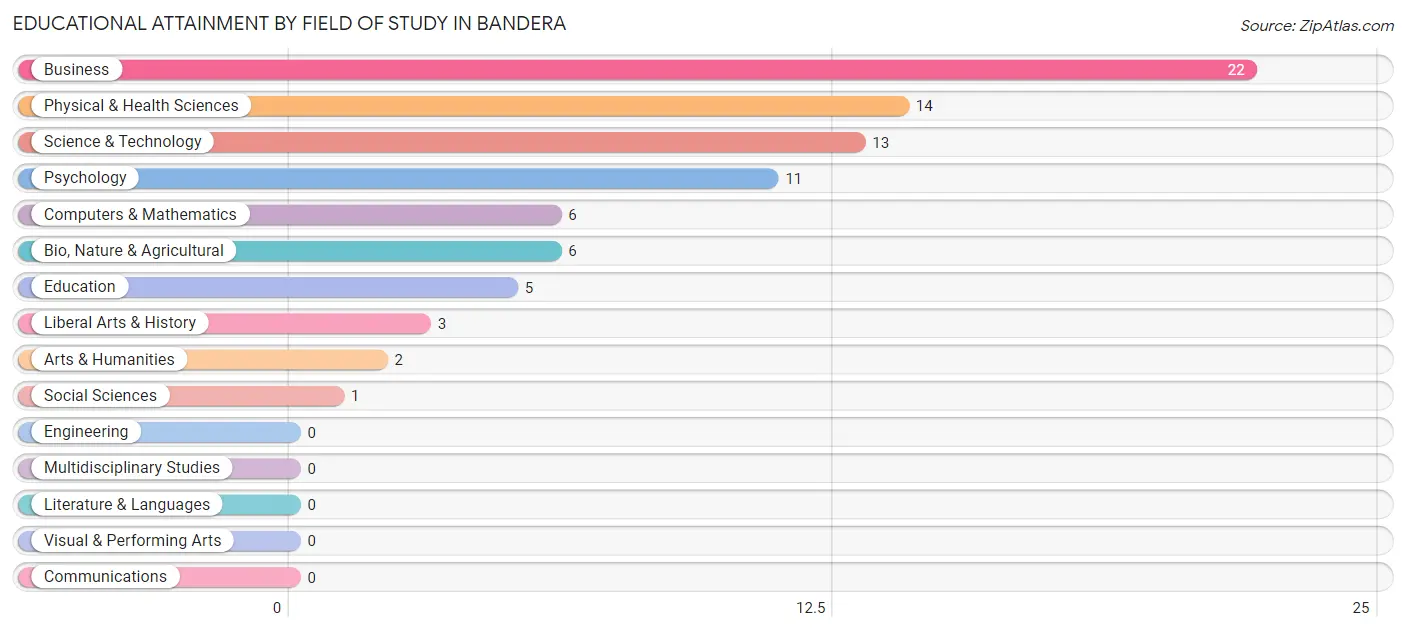
| Field of Study | # Graduates | % Graduates |
| Computers & Mathematics | 6 | 7.2% |
| Bio, Nature & Agricultural | 6 | 7.2% |
| Physical & Health Sciences | 14 | 16.9% |
| Psychology | 11 | 13.3% |
| Social Sciences | 1 | 1.2% |
| Engineering | 0 | 0.0% |
| Multidisciplinary Studies | 0 | 0.0% |
| Science & Technology | 13 | 15.7% |
| Business | 22 | 26.5% |
| Education | 5 | 6.0% |
| Literature & Languages | 0 | 0.0% |
| Liberal Arts & History | 3 | 3.6% |
| Visual & Performing Arts | 0 | 0.0% |
| Communications | 0 | 0.0% |
| Arts & Humanities | 2 | 2.4% |
| Total | 83 | 100.0% |
Transportation & Commute in Bandera
Vehicle Availability by Sex in Bandera
The most prevalent vehicle ownership categories in Bandera are males with 2 vehicles (91, accounting for 52.3%) and females with 2 vehicles (5, making up 92.9%).
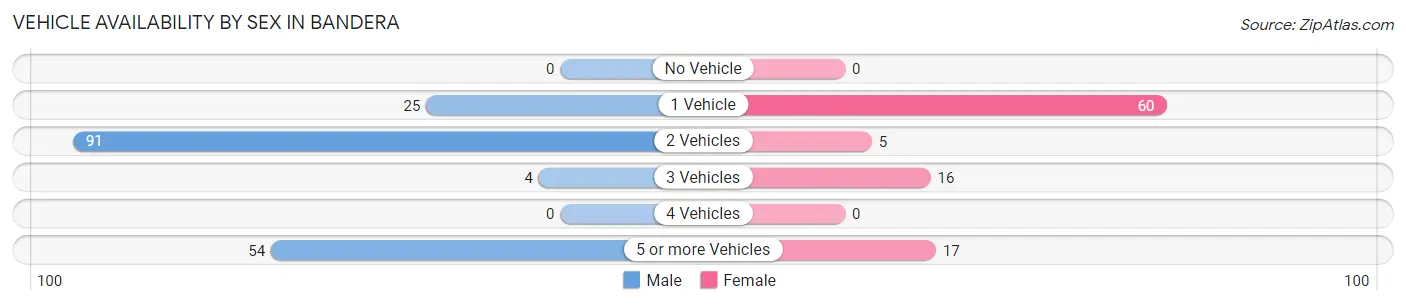
| Vehicles Available | Male | Female |
| No Vehicle | 0 (0.0%) | 0 (0.0%) |
| 1 Vehicle | 25 (14.4%) | 60 (61.2%) |
| 2 Vehicles | 91 (52.3%) | 5 (5.1%) |
| 3 Vehicles | 4 (2.3%) | 16 (16.3%) |
| 4 Vehicles | 0 (0.0%) | 0 (0.0%) |
| 5 or more Vehicles | 54 (31.0%) | 17 (17.3%) |
| Total | 174 (100.0%) | 98 (100.0%) |
Commute Time in Bandera
The most frequently occuring commute durations in Bandera are less than 5 minutes (68 commuters, 25.0%), 30 to 34 minutes (60 commuters, 22.1%), and 5 to 9 minutes (48 commuters, 17.6%).
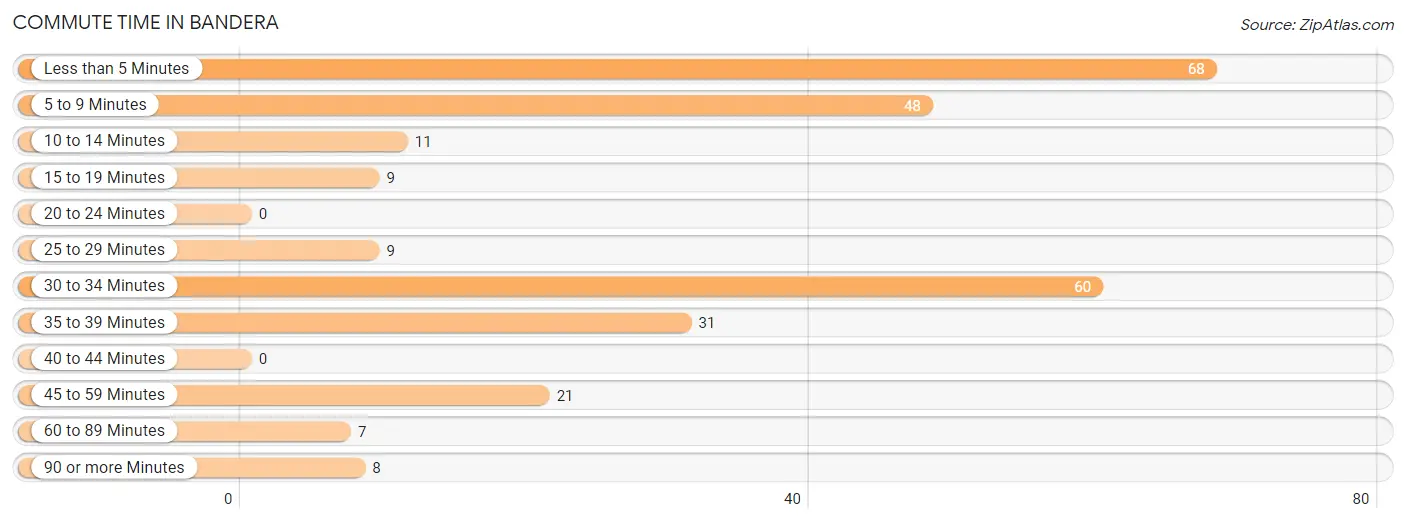
| Commute Time | # Commuters | % Commuters |
| Less than 5 Minutes | 68 | 25.0% |
| 5 to 9 Minutes | 48 | 17.6% |
| 10 to 14 Minutes | 11 | 4.0% |
| 15 to 19 Minutes | 9 | 3.3% |
| 20 to 24 Minutes | 0 | 0.0% |
| 25 to 29 Minutes | 9 | 3.3% |
| 30 to 34 Minutes | 60 | 22.1% |
| 35 to 39 Minutes | 31 | 11.4% |
| 40 to 44 Minutes | 0 | 0.0% |
| 45 to 59 Minutes | 21 | 7.7% |
| 60 to 89 Minutes | 7 | 2.6% |
| 90 or more Minutes | 8 | 2.9% |
Commute Time by Sex in Bandera
The most common commute times in Bandera are 30 to 34 minutes (60 commuters, 34.5%) for males and less than 5 minutes (58 commuters, 59.2%) for females.
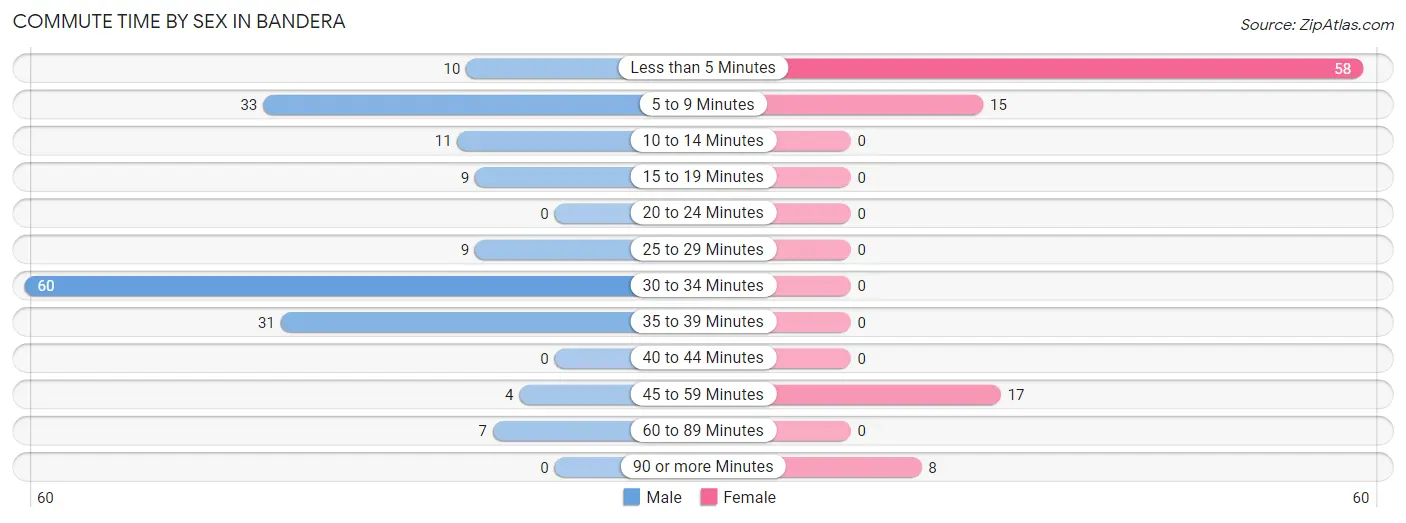
| Commute Time | Male | Female |
| Less than 5 Minutes | 10 (5.8%) | 58 (59.2%) |
| 5 to 9 Minutes | 33 (19.0%) | 15 (15.3%) |
| 10 to 14 Minutes | 11 (6.3%) | 0 (0.0%) |
| 15 to 19 Minutes | 9 (5.2%) | 0 (0.0%) |
| 20 to 24 Minutes | 0 (0.0%) | 0 (0.0%) |
| 25 to 29 Minutes | 9 (5.2%) | 0 (0.0%) |
| 30 to 34 Minutes | 60 (34.5%) | 0 (0.0%) |
| 35 to 39 Minutes | 31 (17.8%) | 0 (0.0%) |
| 40 to 44 Minutes | 0 (0.0%) | 0 (0.0%) |
| 45 to 59 Minutes | 4 (2.3%) | 17 (17.3%) |
| 60 to 89 Minutes | 7 (4.0%) | 0 (0.0%) |
| 90 or more Minutes | 0 (0.0%) | 8 (8.2%) |
Time of Departure to Work by Sex in Bandera
The most frequent times of departure to work in Bandera are 7:00 AM to 7:29 AM (64, 36.8%) for males and 7:30 AM to 7:59 AM (29, 29.6%) for females.
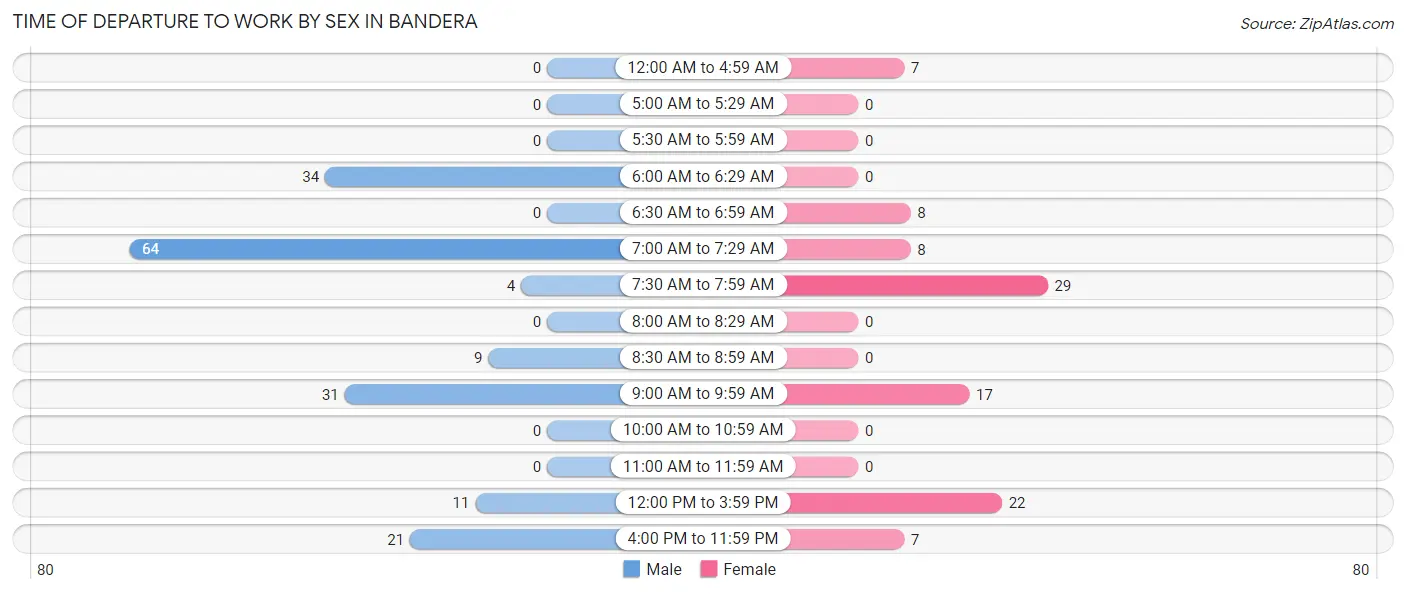
| Time of Departure | Male | Female |
| 12:00 AM to 4:59 AM | 0 (0.0%) | 7 (7.1%) |
| 5:00 AM to 5:29 AM | 0 (0.0%) | 0 (0.0%) |
| 5:30 AM to 5:59 AM | 0 (0.0%) | 0 (0.0%) |
| 6:00 AM to 6:29 AM | 34 (19.5%) | 0 (0.0%) |
| 6:30 AM to 6:59 AM | 0 (0.0%) | 8 (8.2%) |
| 7:00 AM to 7:29 AM | 64 (36.8%) | 8 (8.2%) |
| 7:30 AM to 7:59 AM | 4 (2.3%) | 29 (29.6%) |
| 8:00 AM to 8:29 AM | 0 (0.0%) | 0 (0.0%) |
| 8:30 AM to 8:59 AM | 9 (5.2%) | 0 (0.0%) |
| 9:00 AM to 9:59 AM | 31 (17.8%) | 17 (17.3%) |
| 10:00 AM to 10:59 AM | 0 (0.0%) | 0 (0.0%) |
| 11:00 AM to 11:59 AM | 0 (0.0%) | 0 (0.0%) |
| 12:00 PM to 3:59 PM | 11 (6.3%) | 22 (22.5%) |
| 4:00 PM to 11:59 PM | 21 (12.1%) | 7 (7.1%) |
| Total | 174 (100.0%) | 98 (100.0%) |
Housing Occupancy in Bandera
Occupancy by Ownership in Bandera
Of the total 230 dwellings in Bandera, owner-occupied units account for 125 (54.3%), while renter-occupied units make up 105 (45.7%).
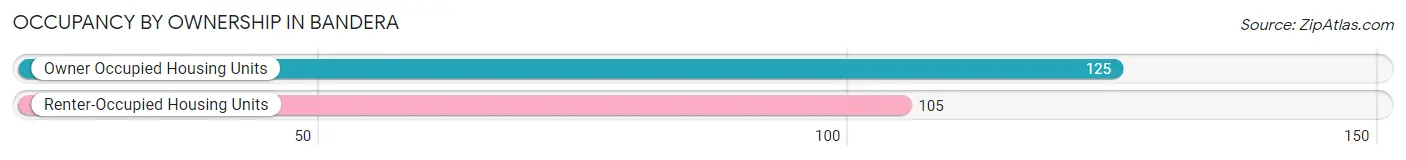
| Occupancy | # Housing Units | % Housing Units |
| Owner Occupied Housing Units | 125 | 54.3% |
| Renter-Occupied Housing Units | 105 | 45.7% |
| Total Occupied Housing Units | 230 | 100.0% |
Occupancy by Household Size in Bandera
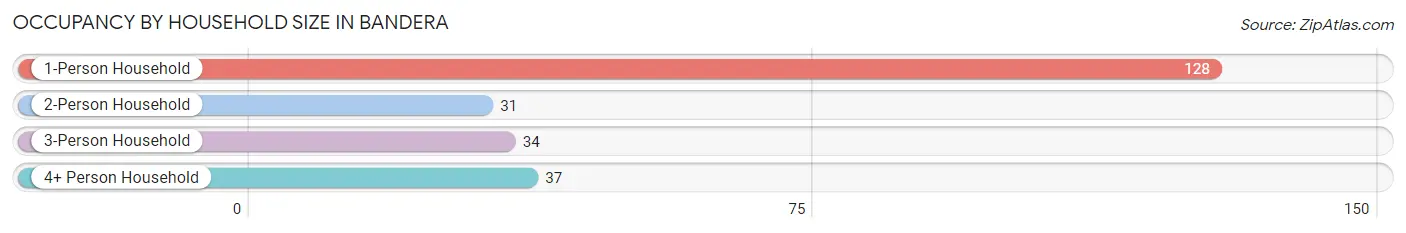
| Household Size | # Housing Units | % Housing Units |
| 1-Person Household | 128 | 55.6% |
| 2-Person Household | 31 | 13.5% |
| 3-Person Household | 34 | 14.8% |
| 4+ Person Household | 37 | 16.1% |
| Total Housing Units | 230 | 100.0% |
Occupancy by Ownership by Household Size in Bandera
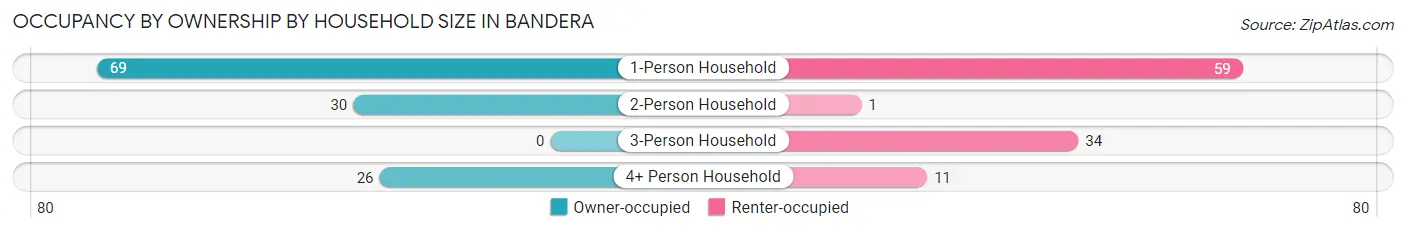
| Household Size | Owner-occupied | Renter-occupied |
| 1-Person Household | 69 (53.9%) | 59 (46.1%) |
| 2-Person Household | 30 (96.8%) | 1 (3.2%) |
| 3-Person Household | 0 (0.0%) | 34 (100.0%) |
| 4+ Person Household | 26 (70.3%) | 11 (29.7%) |
| Total Housing Units | 125 (54.3%) | 105 (45.7%) |
Occupancy by Educational Attainment in Bandera
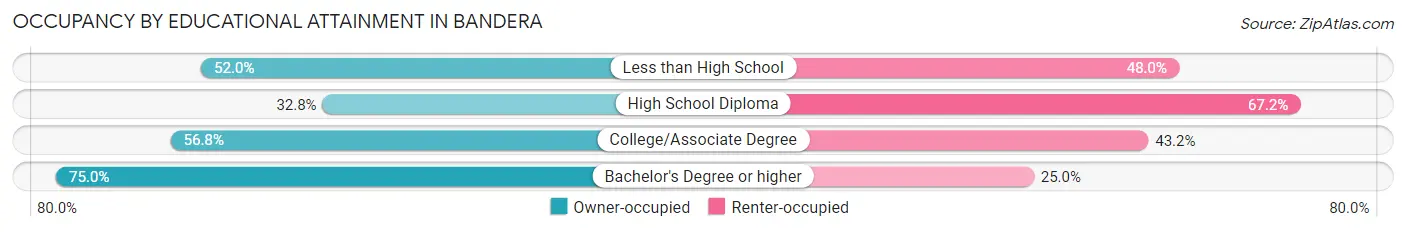
| Household Size | Owner-occupied | Renter-occupied |
| Less than High School | 13 (52.0%) | 12 (48.0%) |
| High School Diploma | 19 (32.8%) | 39 (67.2%) |
| College/Associate Degree | 54 (56.8%) | 41 (43.2%) |
| Bachelor's Degree or higher | 39 (75.0%) | 13 (25.0%) |
Occupancy by Age of Householder in Bandera
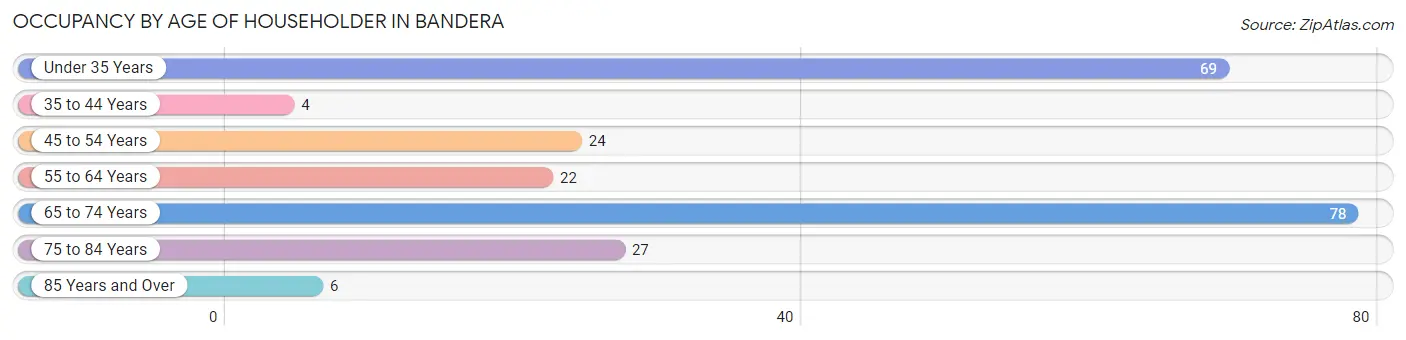
| Age Bracket | # Households | % Households |
| Under 35 Years | 69 | 30.0% |
| 35 to 44 Years | 4 | 1.7% |
| 45 to 54 Years | 24 | 10.4% |
| 55 to 64 Years | 22 | 9.6% |
| 65 to 74 Years | 78 | 33.9% |
| 75 to 84 Years | 27 | 11.7% |
| 85 Years and Over | 6 | 2.6% |
| Total | 230 | 100.0% |
Housing Finances in Bandera
Median Income by Occupancy in Bandera
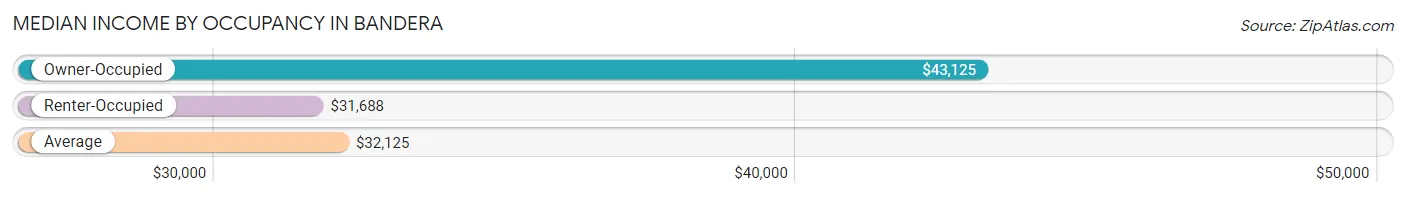
| Occupancy Type | # Households | Median Income |
| Owner-Occupied | 125 (54.3%) | $43,125 |
| Renter-Occupied | 105 (45.7%) | $31,688 |
| Average | 230 (100.0%) | $32,125 |
Occupancy by Householder Income Bracket in Bandera
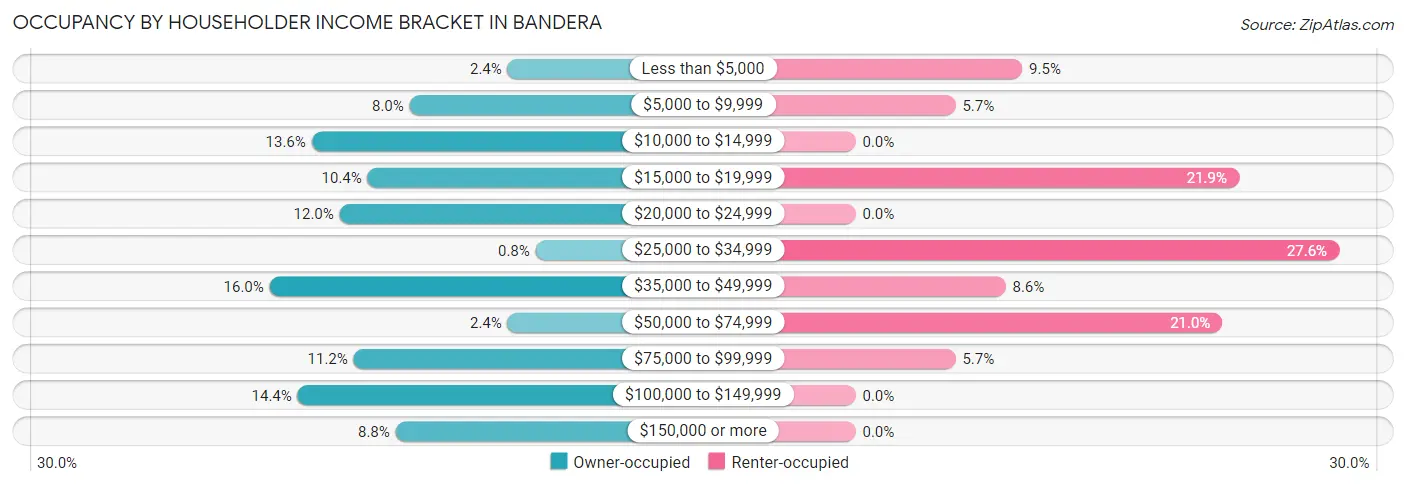
| Income Bracket | Owner-occupied | Renter-occupied |
| Less than $5,000 | 3 (2.4%) | 10 (9.5%) |
| $5,000 to $9,999 | 10 (8.0%) | 6 (5.7%) |
| $10,000 to $14,999 | 17 (13.6%) | 0 (0.0%) |
| $15,000 to $19,999 | 13 (10.4%) | 23 (21.9%) |
| $20,000 to $24,999 | 15 (12.0%) | 0 (0.0%) |
| $25,000 to $34,999 | 1 (0.8%) | 29 (27.6%) |
| $35,000 to $49,999 | 20 (16.0%) | 9 (8.6%) |
| $50,000 to $74,999 | 3 (2.4%) | 22 (20.9%) |
| $75,000 to $99,999 | 14 (11.2%) | 6 (5.7%) |
| $100,000 to $149,999 | 18 (14.4%) | 0 (0.0%) |
| $150,000 or more | 11 (8.8%) | 0 (0.0%) |
| Total | 125 (100.0%) | 105 (100.0%) |
Monthly Housing Cost Tiers in Bandera
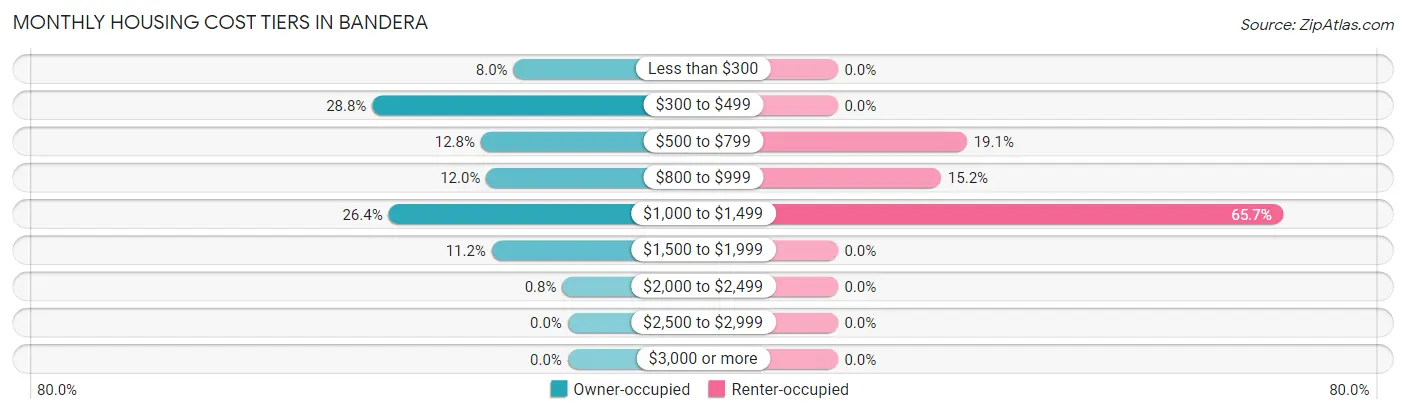
| Monthly Cost | Owner-occupied | Renter-occupied |
| Less than $300 | 10 (8.0%) | 0 (0.0%) |
| $300 to $499 | 36 (28.8%) | 0 (0.0%) |
| $500 to $799 | 16 (12.8%) | 20 (19.1%) |
| $800 to $999 | 15 (12.0%) | 16 (15.2%) |
| $1,000 to $1,499 | 33 (26.4%) | 69 (65.7%) |
| $1,500 to $1,999 | 14 (11.2%) | 0 (0.0%) |
| $2,000 to $2,499 | 1 (0.8%) | 0 (0.0%) |
| $2,500 to $2,999 | 0 (0.0%) | 0 (0.0%) |
| $3,000 or more | 0 (0.0%) | 0 (0.0%) |
| Total | 125 (100.0%) | 105 (100.0%) |
Physical Housing Characteristics in Bandera
Housing Structures in Bandera
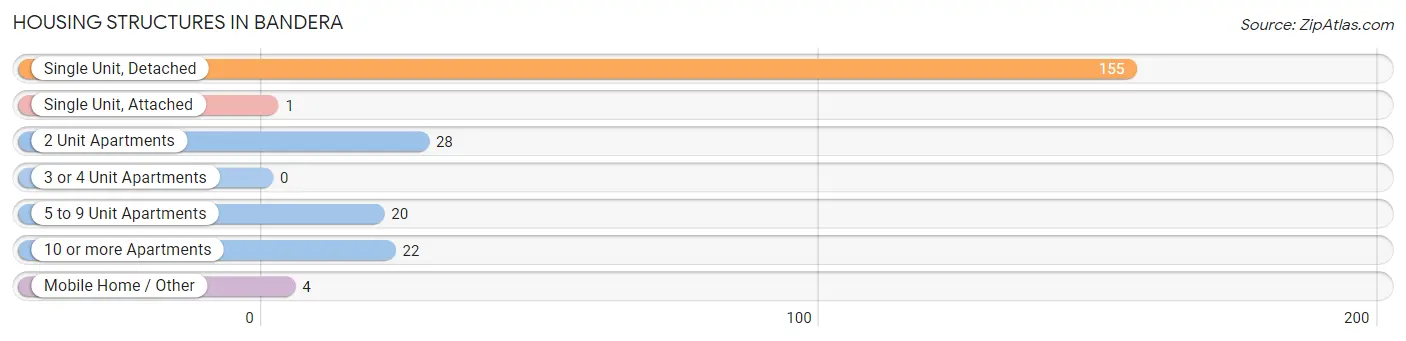
| Structure Type | # Housing Units | % Housing Units |
| Single Unit, Detached | 155 | 67.4% |
| Single Unit, Attached | 1 | 0.4% |
| 2 Unit Apartments | 28 | 12.2% |
| 3 or 4 Unit Apartments | 0 | 0.0% |
| 5 to 9 Unit Apartments | 20 | 8.7% |
| 10 or more Apartments | 22 | 9.6% |
| Mobile Home / Other | 4 | 1.7% |
| Total | 230 | 100.0% |
Housing Structures by Occupancy in Bandera
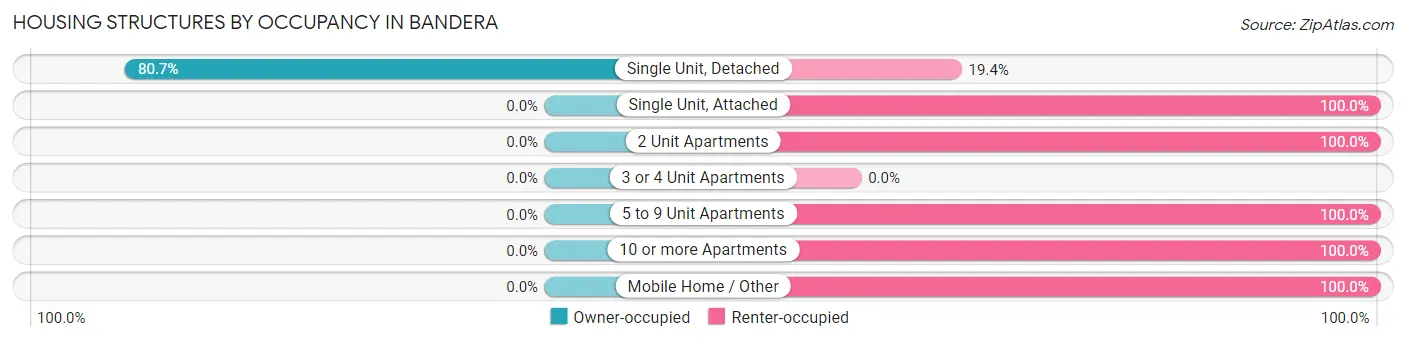
| Structure Type | Owner-occupied | Renter-occupied |
| Single Unit, Detached | 125 (80.6%) | 30 (19.4%) |
| Single Unit, Attached | 0 (0.0%) | 1 (100.0%) |
| 2 Unit Apartments | 0 (0.0%) | 28 (100.0%) |
| 3 or 4 Unit Apartments | 0 (0.0%) | 0 (0.0%) |
| 5 to 9 Unit Apartments | 0 (0.0%) | 20 (100.0%) |
| 10 or more Apartments | 0 (0.0%) | 22 (100.0%) |
| Mobile Home / Other | 0 (0.0%) | 4 (100.0%) |
| Total | 125 (54.3%) | 105 (45.7%) |
Housing Structures by Number of Rooms in Bandera
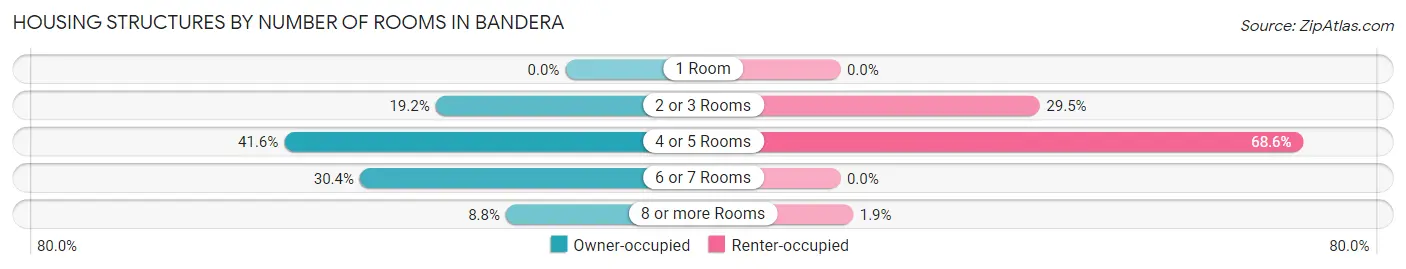
| Number of Rooms | Owner-occupied | Renter-occupied |
| 1 Room | 0 (0.0%) | 0 (0.0%) |
| 2 or 3 Rooms | 24 (19.2%) | 31 (29.5%) |
| 4 or 5 Rooms | 52 (41.6%) | 72 (68.6%) |
| 6 or 7 Rooms | 38 (30.4%) | 0 (0.0%) |
| 8 or more Rooms | 11 (8.8%) | 2 (1.9%) |
| Total | 125 (100.0%) | 105 (100.0%) |
Housing Structure by Heating Type in Bandera
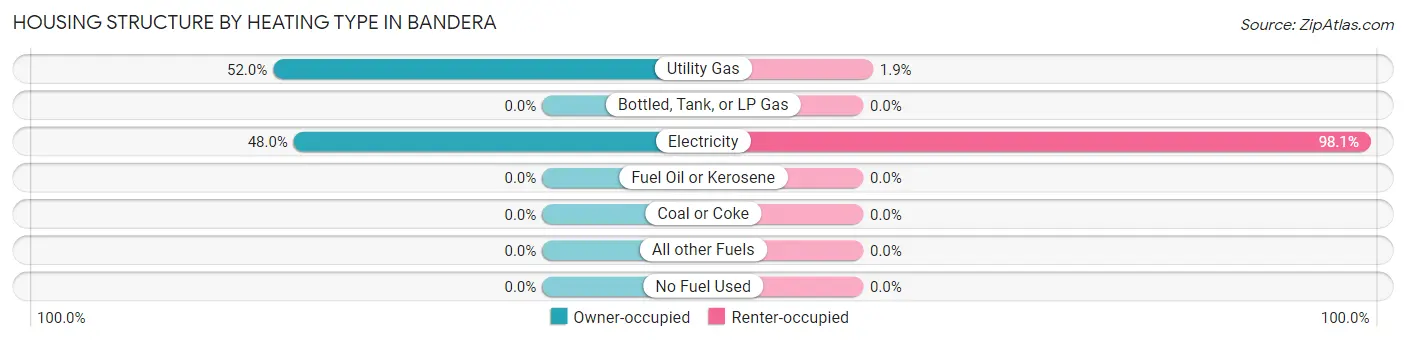
| Heating Type | Owner-occupied | Renter-occupied |
| Utility Gas | 65 (52.0%) | 2 (1.9%) |
| Bottled, Tank, or LP Gas | 0 (0.0%) | 0 (0.0%) |
| Electricity | 60 (48.0%) | 103 (98.1%) |
| Fuel Oil or Kerosene | 0 (0.0%) | 0 (0.0%) |
| Coal or Coke | 0 (0.0%) | 0 (0.0%) |
| All other Fuels | 0 (0.0%) | 0 (0.0%) |
| No Fuel Used | 0 (0.0%) | 0 (0.0%) |
| Total | 125 (100.0%) | 105 (100.0%) |
Household Vehicle Usage in Bandera
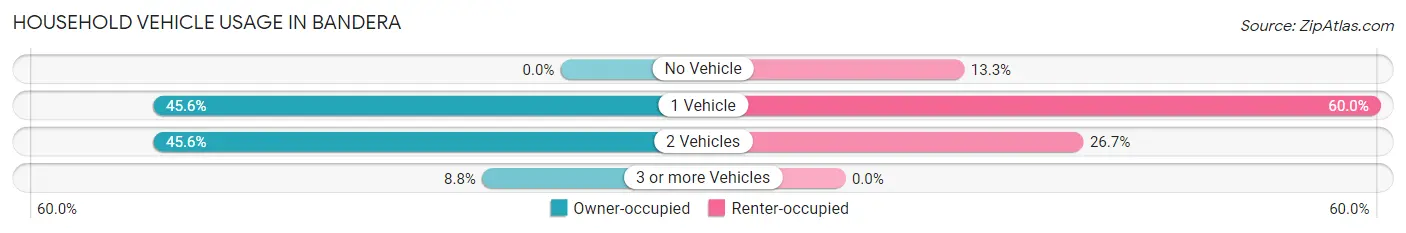
| Vehicles per Household | Owner-occupied | Renter-occupied |
| No Vehicle | 0 (0.0%) | 14 (13.3%) |
| 1 Vehicle | 57 (45.6%) | 63 (60.0%) |
| 2 Vehicles | 57 (45.6%) | 28 (26.7%) |
| 3 or more Vehicles | 11 (8.8%) | 0 (0.0%) |
| Total | 125 (100.0%) | 105 (100.0%) |
Real Estate & Mortgages in Bandera
Real Estate and Mortgage Overview in Bandera
| Characteristic | Without Mortgage | With Mortgage |
| Housing Units | 63 | 62 |
| Median Property Value | $143,400 | $210,400 |
| Median Household Income | - | - |
| Monthly Housing Costs | $415 | $0 |
| Real Estate Taxes | $1,458 | $4 |
Property Value by Mortgage Status in Bandera
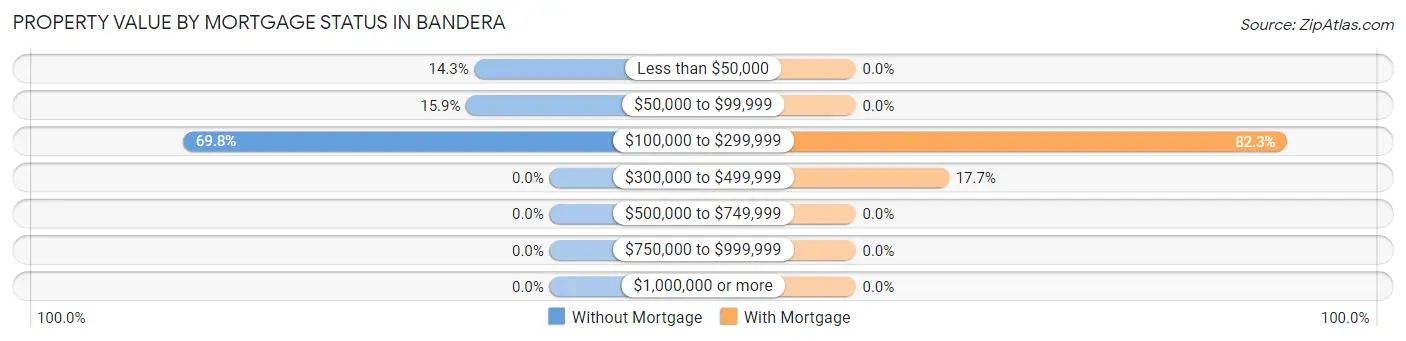
| Property Value | Without Mortgage | With Mortgage |
| Less than $50,000 | 9 (14.3%) | 0 (0.0%) |
| $50,000 to $99,999 | 10 (15.9%) | 0 (0.0%) |
| $100,000 to $299,999 | 44 (69.8%) | 51 (82.3%) |
| $300,000 to $499,999 | 0 (0.0%) | 11 (17.7%) |
| $500,000 to $749,999 | 0 (0.0%) | 0 (0.0%) |
| $750,000 to $999,999 | 0 (0.0%) | 0 (0.0%) |
| $1,000,000 or more | 0 (0.0%) | 0 (0.0%) |
| Total | 63 (100.0%) | 62 (100.0%) |
Household Income by Mortgage Status in Bandera
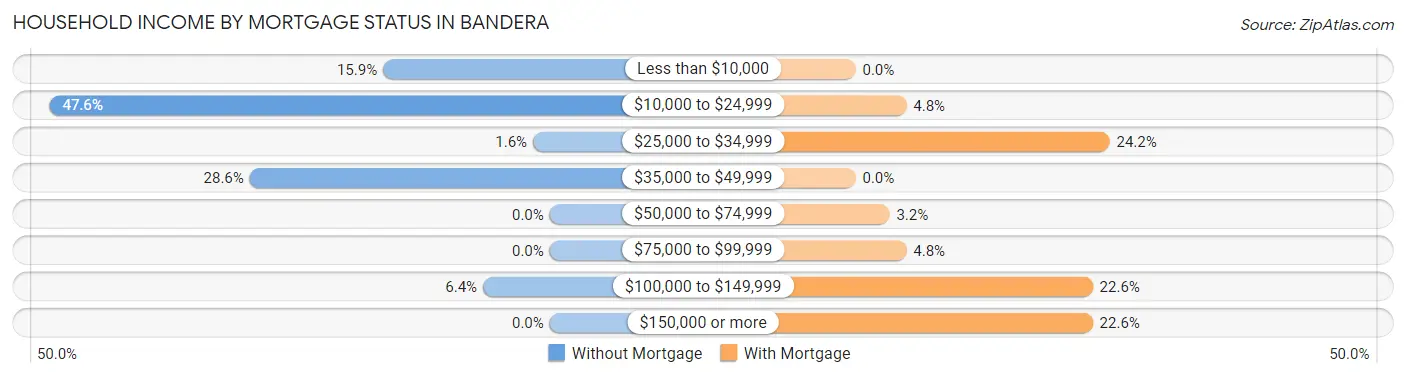
| Household Income | Without Mortgage | With Mortgage |
| Less than $10,000 | 10 (15.9%) | 0 (0.0%) |
| $10,000 to $24,999 | 30 (47.6%) | 3 (4.8%) |
| $25,000 to $34,999 | 1 (1.6%) | 15 (24.2%) |
| $35,000 to $49,999 | 18 (28.6%) | 0 (0.0%) |
| $50,000 to $74,999 | 0 (0.0%) | 2 (3.2%) |
| $75,000 to $99,999 | 0 (0.0%) | 3 (4.8%) |
| $100,000 to $149,999 | 4 (6.4%) | 14 (22.6%) |
| $150,000 or more | 0 (0.0%) | 14 (22.6%) |
| Total | 63 (100.0%) | 62 (100.0%) |
Property Value to Household Income Ratio in Bandera
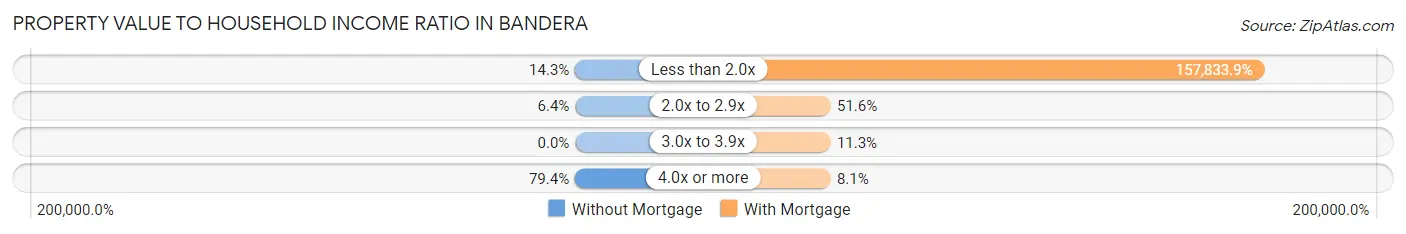
| Value-to-Income Ratio | Without Mortgage | With Mortgage |
| Less than 2.0x | 9 (14.3%) | 97,857 (157,833.9%) |
| 2.0x to 2.9x | 4 (6.4%) | 32 (51.6%) |
| 3.0x to 3.9x | 0 (0.0%) | 7 (11.3%) |
| 4.0x or more | 50 (79.4%) | 5 (8.1%) |
| Total | 63 (100.0%) | 62 (100.0%) |
Real Estate Taxes by Mortgage Status in Bandera
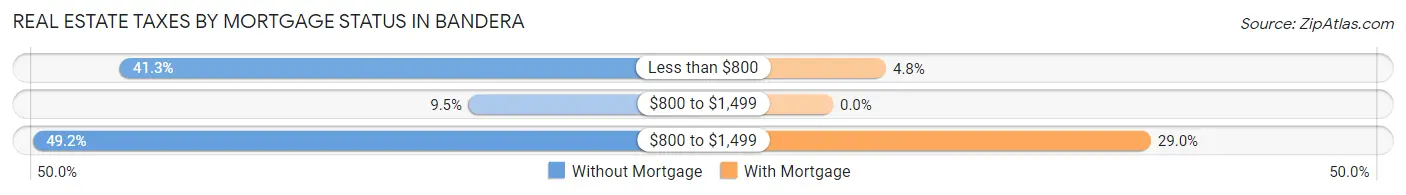
| Property Taxes | Without Mortgage | With Mortgage |
| Less than $800 | 26 (41.3%) | 3 (4.8%) |
| $800 to $1,499 | 6 (9.5%) | 0 (0.0%) |
| $800 to $1,499 | 31 (49.2%) | 18 (29.0%) |
| Total | 63 (100.0%) | 62 (100.0%) |
Health & Disability in Bandera
Health Insurance Coverage by Age in Bandera
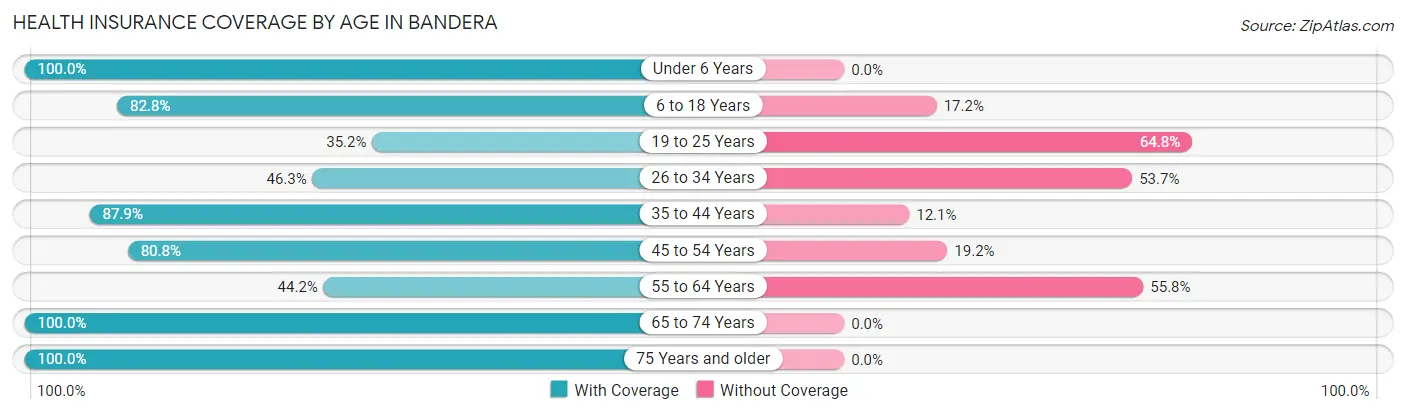
| Age Bracket | With Coverage | Without Coverage |
| Under 6 Years | 29 (100.0%) | 0 (0.0%) |
| 6 to 18 Years | 24 (82.8%) | 5 (17.2%) |
| 19 to 25 Years | 32 (35.2%) | 59 (64.8%) |
| 26 to 34 Years | 50 (46.3%) | 58 (53.7%) |
| 35 to 44 Years | 29 (87.9%) | 4 (12.1%) |
| 45 to 54 Years | 42 (80.8%) | 10 (19.2%) |
| 55 to 64 Years | 23 (44.2%) | 29 (55.8%) |
| 65 to 74 Years | 86 (100.0%) | 0 (0.0%) |
| 75 Years and older | 42 (100.0%) | 0 (0.0%) |
| Total | 357 (68.4%) | 165 (31.6%) |
Health Insurance Coverage by Citizenship Status in Bandera
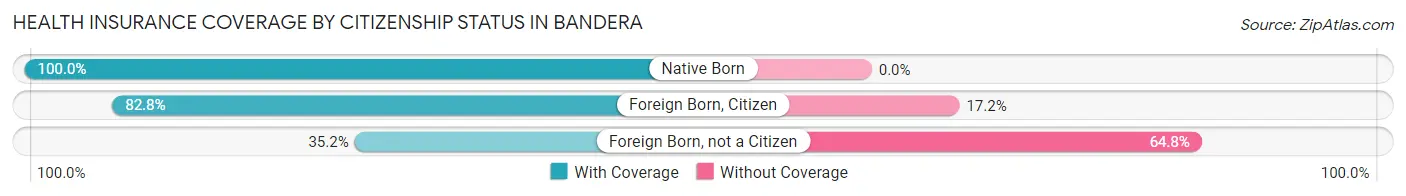
| Citizenship Status | With Coverage | Without Coverage |
| Native Born | 29 (100.0%) | 0 (0.0%) |
| Foreign Born, Citizen | 24 (82.8%) | 5 (17.2%) |
| Foreign Born, not a Citizen | 32 (35.2%) | 59 (64.8%) |
Health Insurance Coverage by Household Income in Bandera
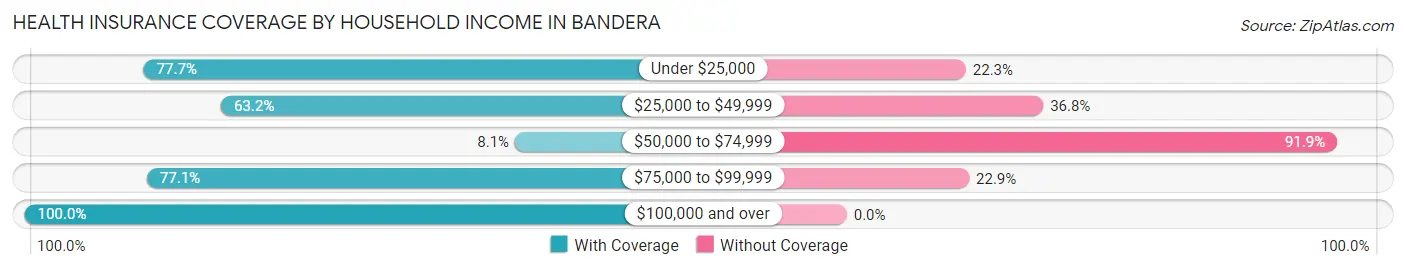
| Household Income | With Coverage | Without Coverage |
| Under $25,000 | 101 (77.7%) | 29 (22.3%) |
| $25,000 to $49,999 | 79 (63.2%) | 46 (36.8%) |
| $50,000 to $74,999 | 7 (8.1%) | 79 (91.9%) |
| $75,000 to $99,999 | 37 (77.1%) | 11 (22.9%) |
| $100,000 and over | 133 (100.0%) | 0 (0.0%) |
Public vs Private Health Insurance Coverage by Age in Bandera
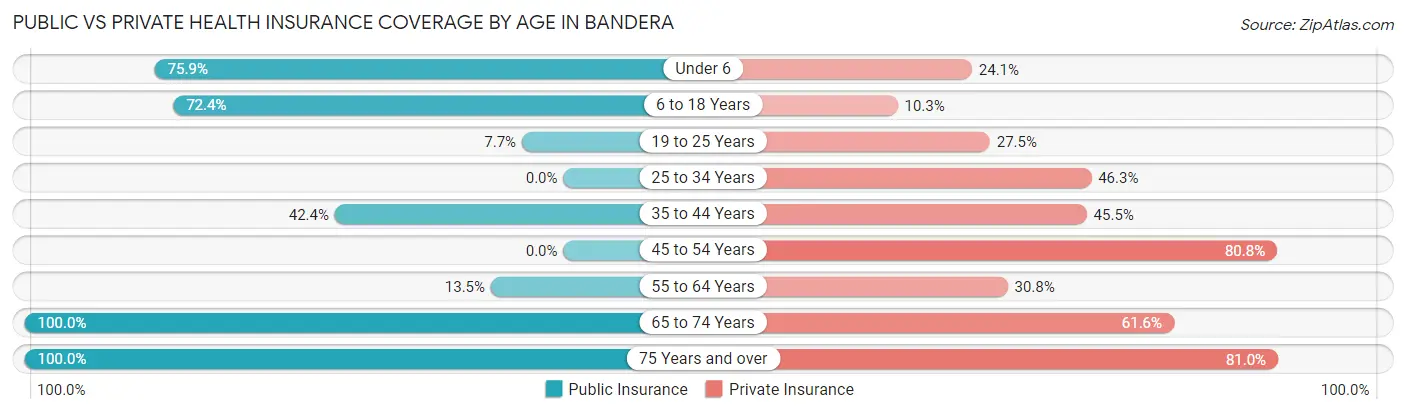
| Age Bracket | Public Insurance | Private Insurance |
| Under 6 | 22 (75.9%) | 7 (24.1%) |
| 6 to 18 Years | 21 (72.4%) | 3 (10.3%) |
| 19 to 25 Years | 7 (7.7%) | 25 (27.5%) |
| 25 to 34 Years | 0 (0.0%) | 50 (46.3%) |
| 35 to 44 Years | 14 (42.4%) | 15 (45.5%) |
| 45 to 54 Years | 0 (0.0%) | 42 (80.8%) |
| 55 to 64 Years | 7 (13.5%) | 16 (30.8%) |
| 65 to 74 Years | 86 (100.0%) | 53 (61.6%) |
| 75 Years and over | 42 (100.0%) | 34 (80.9%) |
| Total | 199 (38.1%) | 245 (46.9%) |
Disability Status by Sex by Age in Bandera
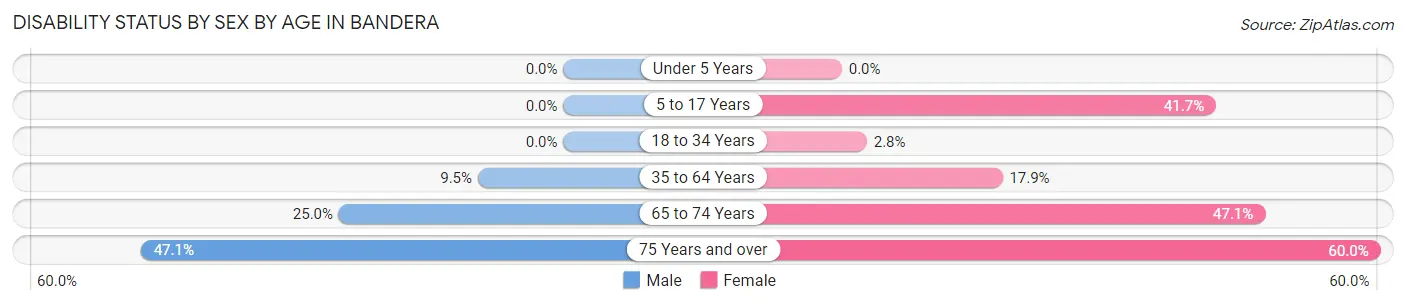
| Age Bracket | Male | Female |
| Under 5 Years | 0 (0.0%) | 0 (0.0%) |
| 5 to 17 Years | 0 (0.0%) | 5 (41.7%) |
| 18 to 34 Years | 0 (0.0%) | 2 (2.8%) |
| 35 to 64 Years | 4 (9.5%) | 17 (17.9%) |
| 65 to 74 Years | 4 (25.0%) | 33 (47.1%) |
| 75 Years and over | 8 (47.1%) | 15 (60.0%) |
Disability Class by Sex by Age in Bandera
Disability Class: Hearing Difficulty
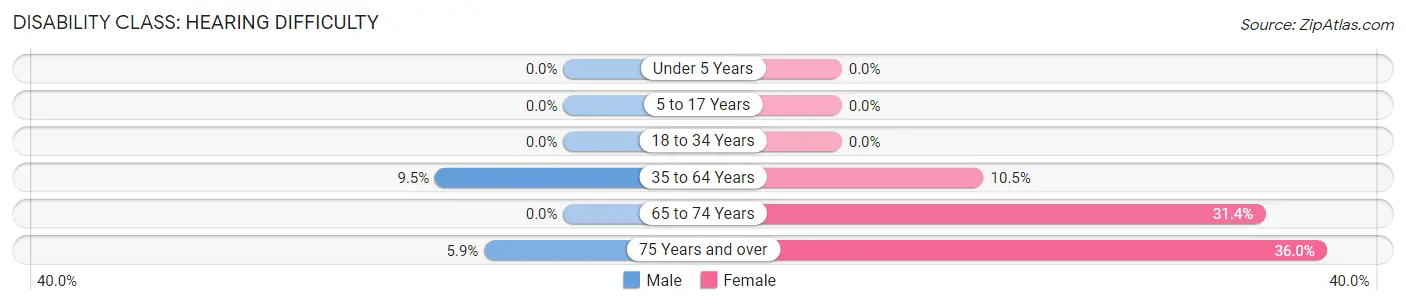
| Age Bracket | Male | Female |
| Under 5 Years | 0 (0.0%) | 0 (0.0%) |
| 5 to 17 Years | 0 (0.0%) | 0 (0.0%) |
| 18 to 34 Years | 0 (0.0%) | 0 (0.0%) |
| 35 to 64 Years | 4 (9.5%) | 10 (10.5%) |
| 65 to 74 Years | 0 (0.0%) | 22 (31.4%) |
| 75 Years and over | 1 (5.9%) | 9 (36.0%) |
Disability Class: Vision Difficulty
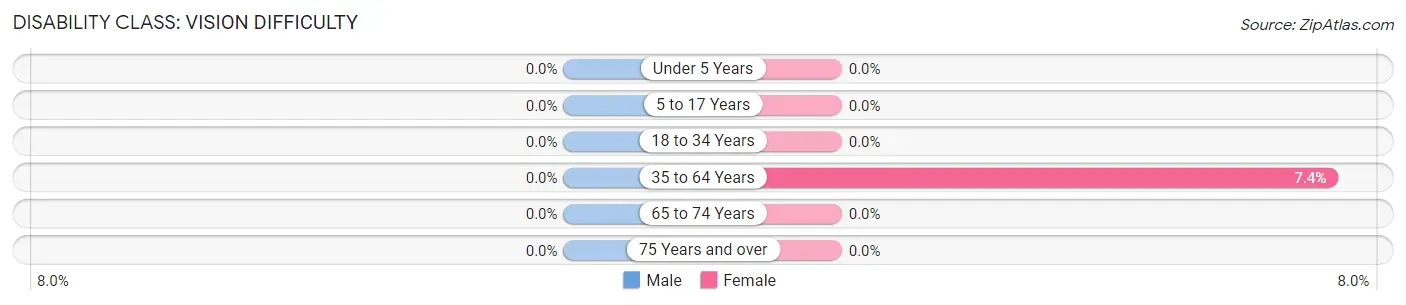
| Age Bracket | Male | Female |
| Under 5 Years | 0 (0.0%) | 0 (0.0%) |
| 5 to 17 Years | 0 (0.0%) | 0 (0.0%) |
| 18 to 34 Years | 0 (0.0%) | 0 (0.0%) |
| 35 to 64 Years | 0 (0.0%) | 7 (7.4%) |
| 65 to 74 Years | 0 (0.0%) | 0 (0.0%) |
| 75 Years and over | 0 (0.0%) | 0 (0.0%) |
Disability Class: Cognitive Difficulty
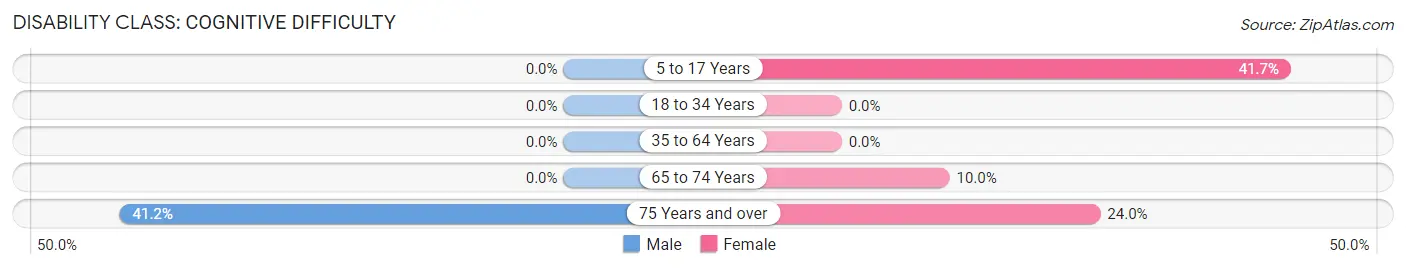
| Age Bracket | Male | Female |
| 5 to 17 Years | 0 (0.0%) | 5 (41.7%) |
| 18 to 34 Years | 0 (0.0%) | 0 (0.0%) |
| 35 to 64 Years | 0 (0.0%) | 0 (0.0%) |
| 65 to 74 Years | 0 (0.0%) | 7 (10.0%) |
| 75 Years and over | 7 (41.2%) | 6 (24.0%) |
Disability Class: Ambulatory Difficulty
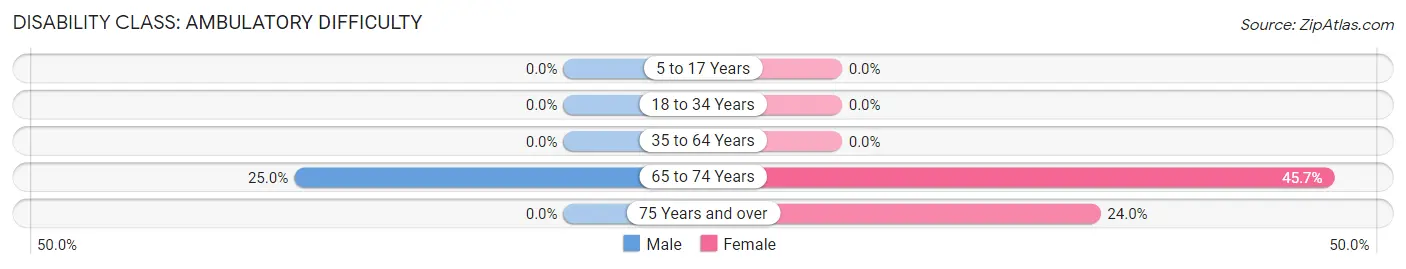
| Age Bracket | Male | Female |
| 5 to 17 Years | 0 (0.0%) | 0 (0.0%) |
| 18 to 34 Years | 0 (0.0%) | 0 (0.0%) |
| 35 to 64 Years | 0 (0.0%) | 0 (0.0%) |
| 65 to 74 Years | 4 (25.0%) | 32 (45.7%) |
| 75 Years and over | 0 (0.0%) | 6 (24.0%) |
Disability Class: Self-Care Difficulty
| Age Bracket | Male | Female |
| 5 to 17 Years | 0 (0.0%) | 0 (0.0%) |
| 18 to 34 Years | 0 (0.0%) | 0 (0.0%) |
| 35 to 64 Years | 0 (0.0%) | 0 (0.0%) |
| 65 to 74 Years | 0 (0.0%) | 0 (0.0%) |
| 75 Years and over | 0 (0.0%) | 0 (0.0%) |
Technology Access in Bandera
Computing Device Access in Bandera
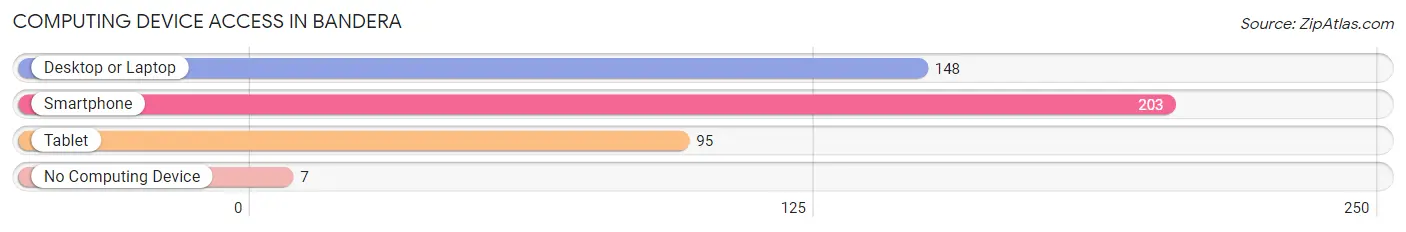
| Device Type | # Households | % Households |
| Desktop or Laptop | 148 | 64.3% |
| Smartphone | 203 | 88.3% |
| Tablet | 95 | 41.3% |
| No Computing Device | 7 | 3.0% |
| Total | 230 | 100.0% |
Internet Access in Bandera
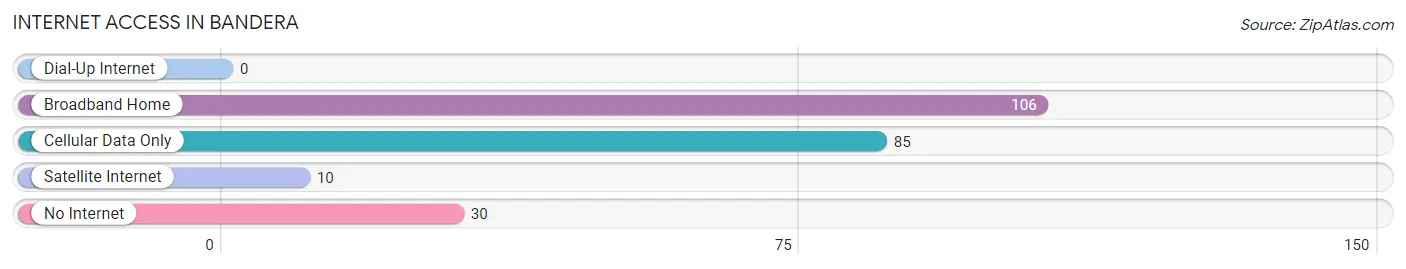
| Internet Type | # Households | % Households |
| Dial-Up Internet | 0 | 0.0% |
| Broadband Home | 106 | 46.1% |
| Cellular Data Only | 85 | 37.0% |
| Satellite Internet | 10 | 4.3% |
| No Internet | 30 | 13.0% |
| Total | 230 | 100.0% |
Bandera Summary
Bandera, Texas is a small town located in the heart of the Texas Hill Country, about an hour northwest of San Antonio. It is the county seat of Bandera County and is known as the “Cowboy Capital of the World.” The town was founded in 1853 and has a population of about 1,000 people.
Geography
Bandera is located in the Hill Country of south-central Texas, about an hour northwest of San Antonio. It is situated on the Medina River, which is a tributary of the San Antonio River. The town is surrounded by rolling hills and is known for its scenic beauty. The climate is generally mild, with hot summers and cool winters.
Economy
The economy of Bandera is largely based on tourism. The town is known for its cowboy culture and is a popular destination for horseback riding, camping, fishing, and hunting. There are also several wineries and breweries in the area. The town is also home to several small businesses, including restaurants, shops, and galleries.
Demographics
As of the 2010 census, the population of Bandera was 1,064. The racial makeup of the town was 94.3% White, 0.3% African American, 0.2% Native American, 0.2% Asian, 0.1% Pacific Islander, 3.3% from other races, and 1.5% from two or more races. Hispanic or Latino of any race were 8.2% of the population.
History
Bandera was founded in 1853 by a group of settlers from the German settlement of Fredericksburg. The town was named after the Spanish word for “flag” and was originally intended to be a trading post. The town quickly grew and by the late 1800s, it was a bustling center of commerce.
In the early 1900s, the town became a popular destination for cowboys and ranchers. The town was known for its rodeos and was the site of the first rodeo in Texas in 1883. The town also became a popular destination for tourists, who came to experience the cowboy culture and enjoy the scenic beauty of the Hill Country.
Today, Bandera is still a popular destination for tourists and is known for its cowboy culture. The town is home to several festivals and events throughout the year, including the Bandera County Fair and the Bandera Music Festival. The town is also home to several wineries and breweries, as well as several small businesses.
Common Questions
What is Per Capita Income in Bandera?
Per Capita income in Bandera is $23,898.
What is the Median Family Income in Bandera?
Median Family Income in Bandera is $71,477.
What is the Median Household income in Bandera?
Median Household Income in Bandera is $32,125.
What is Inequality or Gini Index in Bandera?
Inequality or Gini Index in Bandera is 0.49.
What is the Total Population of Bandera?
Total Population of Bandera is 565.
What is the Total Male Population of Bandera?
Total Male Population of Bandera is 267.
What is the Total Female Population of Bandera?
Total Female Population of Bandera is 298.
What is the Ratio of Males per 100 Females in Bandera?
There are 89.60 Males per 100 Females in Bandera.
What is the Ratio of Females per 100 Males in Bandera?
There are 111.61 Females per 100 Males in Bandera.
What is the Median Population Age in Bandera?
Median Population Age in Bandera is 38.8 Years.
What is the Average Family Size in Bandera
Average Family Size in Bandera is 3.5 People.
What is the Average Household Size in Bandera
Average Household Size in Bandera is 2.3 People.
How Large is the Labor Force in Bandera?
There are 304 People in the Labor Forcein in Bandera.
What is the Percentage of People in the Labor Force in Bandera?
59.1% of People are in the Labor Force in Bandera.
What is the Unemployment Rate in Bandera?
Unemployment Rate in Bandera is 10.5%.