Anthony, TX Map & Demographics
Anthony Map
Anthony Overview
$21,304
PER CAPITA INCOME
$51,125
AVG FAMILY INCOME
$48,934
AVG HOUSEHOLD INCOME
37.8%
WAGE / INCOME GAP [ % ]
62.2¢/ $1
WAGE / INCOME GAP [ $ ]
$7,755
FAMILY INCOME DEFICIT
0.41
INEQUALITY / GINI INDEX
3,811
TOTAL POPULATION
1,993
MALE POPULATION
1,818
FEMALE POPULATION
109.63
MALES / 100 FEMALES
91.22
FEMALES / 100 MALES
32.0
MEDIAN AGE
3.3
AVG FAMILY SIZE
2.9
AVG HOUSEHOLD SIZE
1,726
LABOR FORCE [ PEOPLE ]
61.5%
PERCENT IN LABOR FORCE
5.7%
UNEMPLOYMENT RATE
Anthony Zip Codes
Anthony Area Codes
Income in Anthony
Income Overview in Anthony
Per Capita Income in Anthony is $21,304, while median incomes of families and households are $51,125 and $48,934 respectively.
| Characteristic | Number | Measure |
| Per Capita Income | 3,811 | $21,304 |
| Median Family Income | 1,030 | $51,125 |
| Mean Family Income | 1,030 | $64,284 |
| Median Household Income | 1,309 | $48,934 |
| Mean Household Income | 1,309 | $58,763 |
| Income Deficit | 1,030 | $7,755 |
| Wage / Income Gap (%) | 3,811 | 37.81% |
| Wage / Income Gap ($) | 3,811 | 62.19¢ per $1 |
| Gini / Inequality Index | 3,811 | 0.41 |
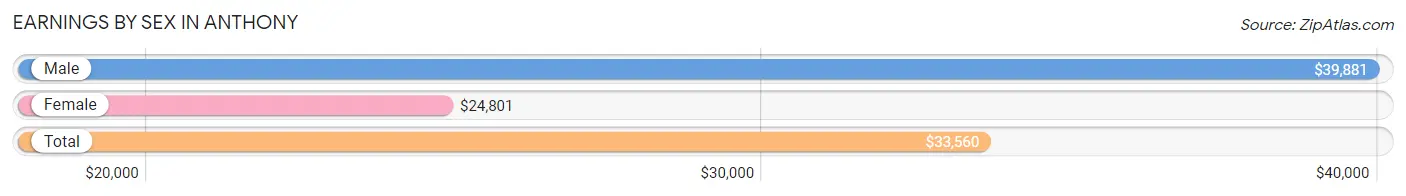
Earnings by Sex in Anthony
Average Earnings in Anthony are $33,560, $39,881 for men and $24,801 for women, a difference of 37.8%.
| Sex | Number | Average Earnings |
| Male | 976 (55.6%) | $39,881 |
| Female | 779 (44.4%) | $24,801 |
| Total | 1,755 (100.0%) | $33,560 |
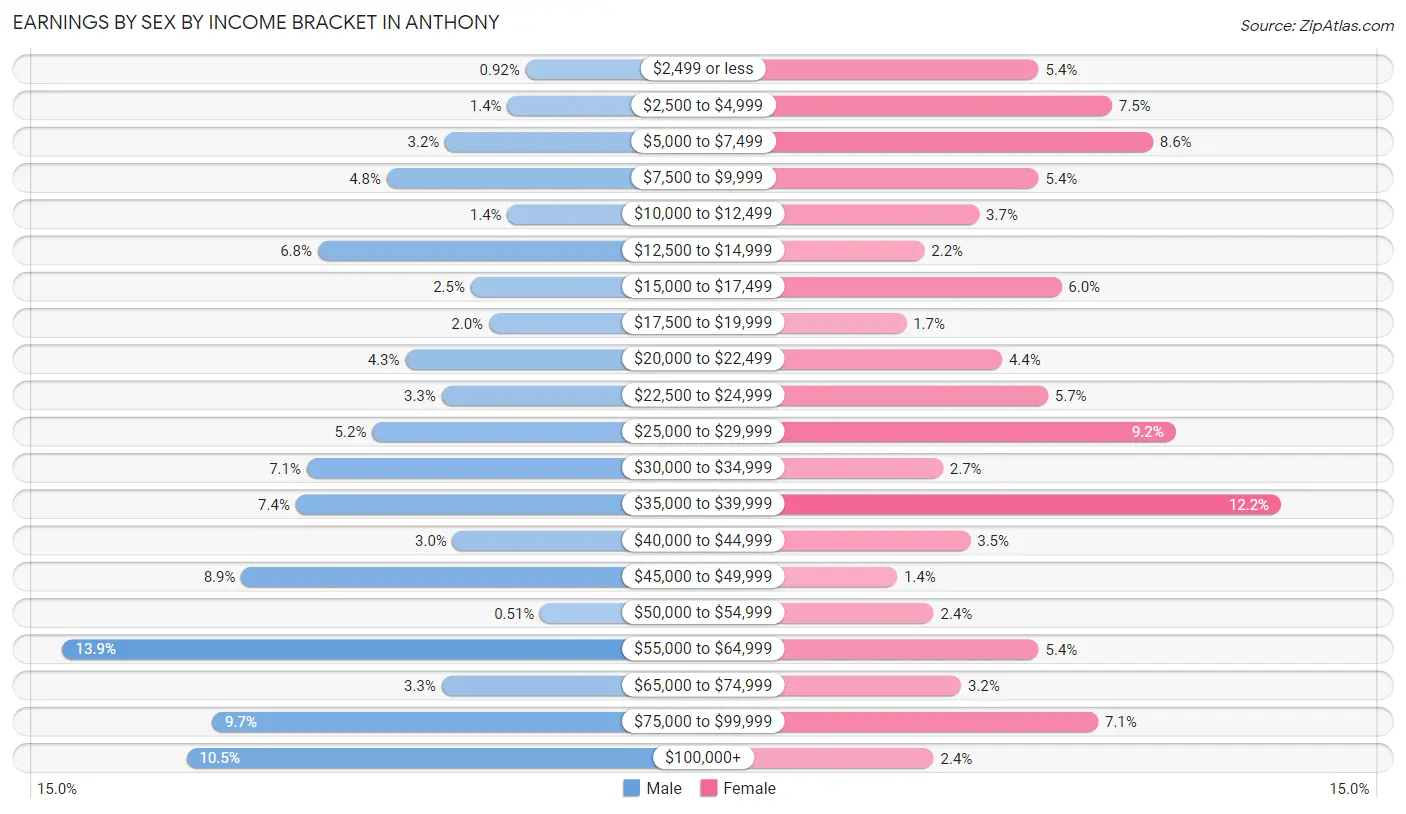
Earnings by Sex by Income Bracket in Anthony
The most common earnings brackets in Anthony are $55,000 to $64,999 for men (136 | 13.9%) and $35,000 to $39,999 for women (95 | 12.2%).
| Income | Male | Female |
| $2,499 or less | 9 (0.9%) | 42 (5.4%) |
| $2,500 to $4,999 | 14 (1.4%) | 58 (7.4%) |
| $5,000 to $7,499 | 31 (3.2%) | 67 (8.6%) |
| $7,500 to $9,999 | 47 (4.8%) | 42 (5.4%) |
| $10,000 to $12,499 | 14 (1.4%) | 29 (3.7%) |
| $12,500 to $14,999 | 66 (6.8%) | 17 (2.2%) |
| $15,000 to $17,499 | 24 (2.5%) | 47 (6.0%) |
| $17,500 to $19,999 | 19 (1.9%) | 13 (1.7%) |
| $20,000 to $22,499 | 42 (4.3%) | 34 (4.4%) |
| $22,500 to $24,999 | 32 (3.3%) | 44 (5.7%) |
| $25,000 to $29,999 | 51 (5.2%) | 72 (9.2%) |
| $30,000 to $34,999 | 69 (7.1%) | 21 (2.7%) |
| $35,000 to $39,999 | 72 (7.4%) | 95 (12.2%) |
| $40,000 to $44,999 | 29 (3.0%) | 27 (3.5%) |
| $45,000 to $49,999 | 87 (8.9%) | 11 (1.4%) |
| $50,000 to $54,999 | 5 (0.5%) | 19 (2.4%) |
| $55,000 to $64,999 | 136 (13.9%) | 42 (5.4%) |
| $65,000 to $74,999 | 32 (3.3%) | 25 (3.2%) |
| $75,000 to $99,999 | 95 (9.7%) | 55 (7.1%) |
| $100,000+ | 102 (10.4%) | 19 (2.4%) |
| Total | 976 (100.0%) | 779 (100.0%) |
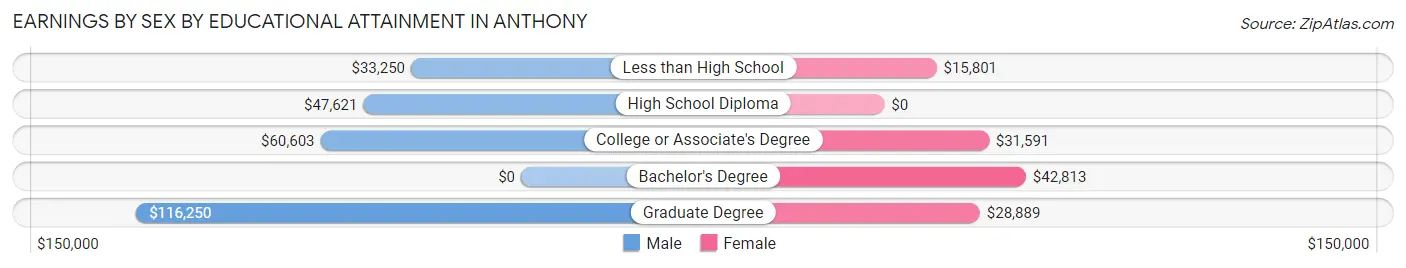
Earnings by Sex by Educational Attainment in Anthony
Average earnings in Anthony are $48,107 for men and $28,322 for women, a difference of 41.1%. Men with an educational attainment of graduate degree enjoy the highest average annual earnings of $116,250, while those with less than high school education earn the least with $33,250. Women with an educational attainment of bachelor's degree earn the most with the average annual earnings of $42,813, while those with less than high school education have the smallest earnings of $15,801.
| Educational Attainment | Male Income | Female Income |
| Less than High School | $33,250 | $15,801 |
| High School Diploma | $47,621 | $0 |
| College or Associate's Degree | $60,603 | $31,591 |
| Bachelor's Degree | - | - |
| Graduate Degree | $116,250 | $28,889 |
| Total | $48,107 | $28,322 |
Family Income in Anthony
Family Income Brackets in Anthony
According to the Anthony family income data, there are 175 families falling into the $15,000 to $24,999 income range, which is the most common income bracket and makes up 17.0% of all families.
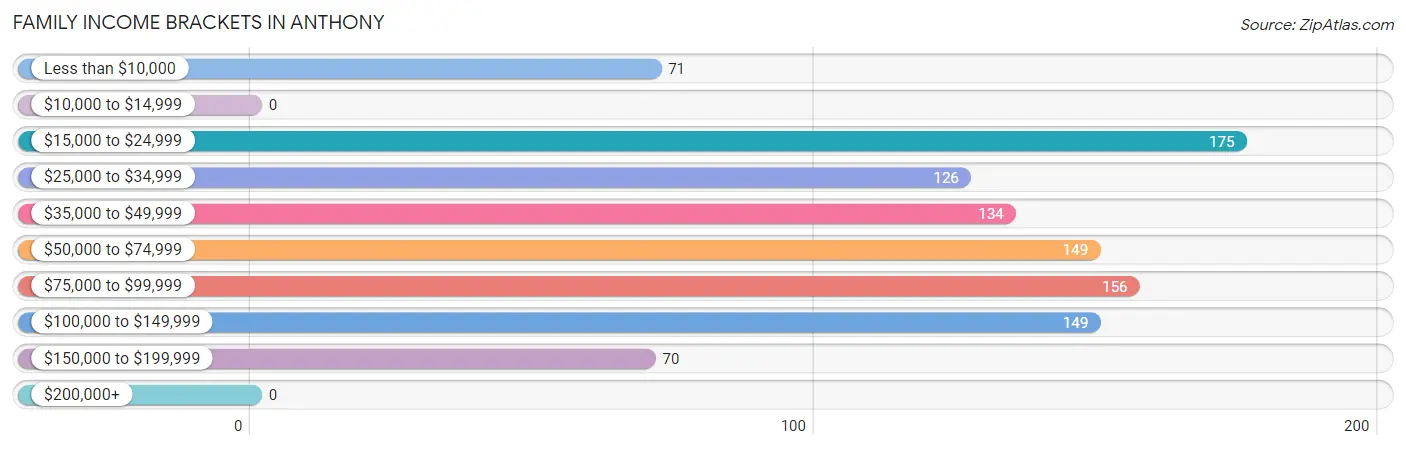
| Income Bracket | # Families | % Families |
| Less than $10,000 | 71 | 6.9% |
| $10,000 to $14,999 | 0 | 0.0% |
| $15,000 to $24,999 | 175 | 17.0% |
| $25,000 to $34,999 | 126 | 12.2% |
| $35,000 to $49,999 | 134 | 13.0% |
| $50,000 to $74,999 | 149 | 14.5% |
| $75,000 to $99,999 | 156 | 15.1% |
| $100,000 to $149,999 | 149 | 14.5% |
| $150,000 to $199,999 | 70 | 6.8% |
| $200,000+ | 0 | 0.0% |
Family Income by Famaliy Size in Anthony
4-person families (282 | 27.4%) account for the highest median family income in Anthony with $68,750 per family, while 2-person families (307 | 29.8%) have the highest median income of $26,307 per family member.
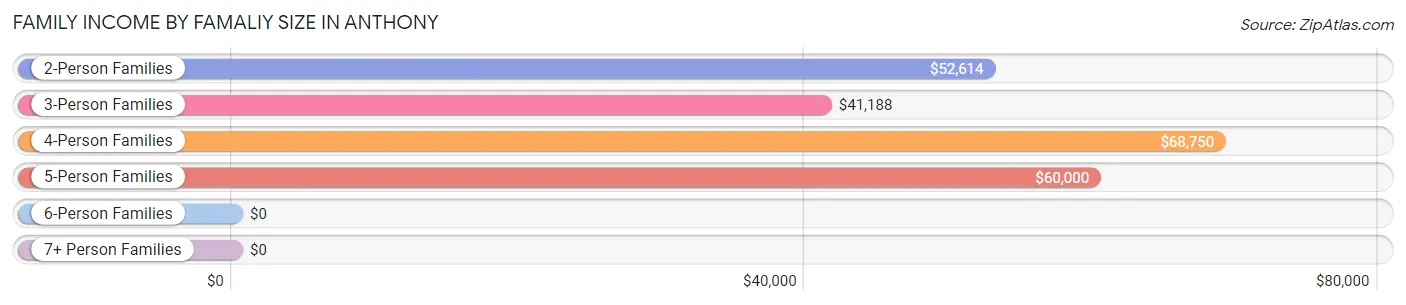
| Income Bracket | # Families | Median Income |
| 2-Person Families | 307 (29.8%) | $52,614 |
| 3-Person Families | 355 (34.5%) | $41,188 |
| 4-Person Families | 282 (27.4%) | $68,750 |
| 5-Person Families | 78 (7.6%) | $60,000 |
| 6-Person Families | 0 (0.0%) | $0 |
| 7+ Person Families | 8 (0.8%) | $0 |
| Total | 1,030 (100.0%) | $51,125 |
Family Income by Number of Earners in Anthony
The median family income in Anthony is $51,125, with families comprising 3+ earners (68) having the highest median family income of $137,500, while families with no earners (112) have the lowest median family income of $21,125, accounting for 6.6% and 10.9% of families, respectively.
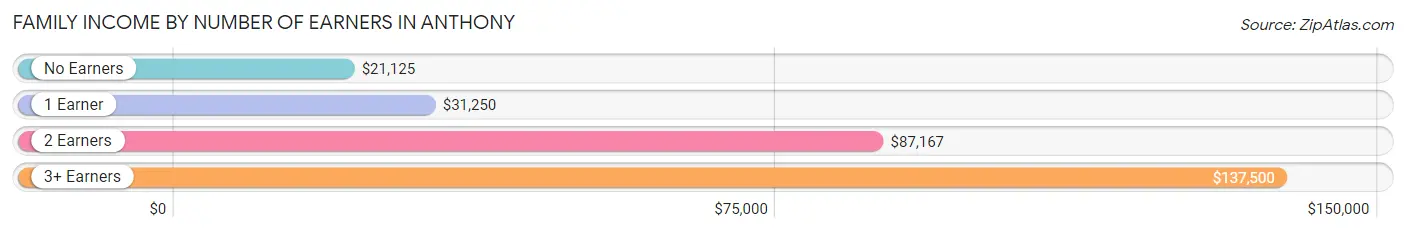
| Number of Earners | # Families | Median Income |
| No Earners | 112 (10.9%) | $21,125 |
| 1 Earner | 466 (45.2%) | $31,250 |
| 2 Earners | 384 (37.3%) | $87,167 |
| 3+ Earners | 68 (6.6%) | $137,500 |
| Total | 1,030 (100.0%) | $51,125 |
Household Income in Anthony
Household Income Brackets in Anthony
With 246 households falling in the category, the $50,000 to $74,999 income range is the most frequent in Anthony, accounting for 18.8% of all households.
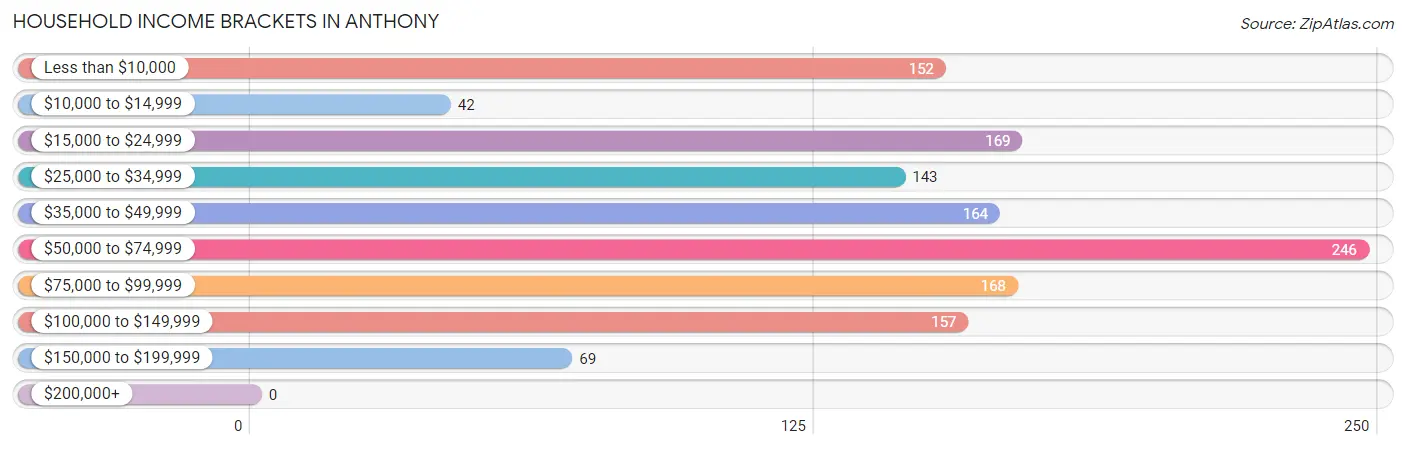
| Income Bracket | # Households | % Households |
| Less than $10,000 | 152 | 11.6% |
| $10,000 to $14,999 | 42 | 3.2% |
| $15,000 to $24,999 | 169 | 12.9% |
| $25,000 to $34,999 | 143 | 10.9% |
| $35,000 to $49,999 | 164 | 12.5% |
| $50,000 to $74,999 | 246 | 18.8% |
| $75,000 to $99,999 | 168 | 12.8% |
| $100,000 to $149,999 | 157 | 12.0% |
| $150,000 to $199,999 | 69 | 5.3% |
| $200,000+ | 0 | 0.0% |
Household Income by Householder Age in Anthony
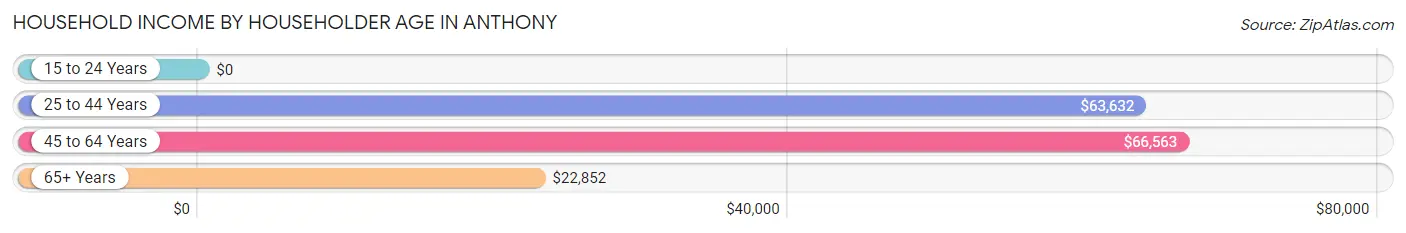
The median household income in Anthony is $48,934, with the highest median household income of $66,563 found in the 45 to 64 years age bracket for the primary householder. A total of 366 households (28.0%) fall into this category. Meanwhile, the 15 to 24 years age bracket for the primary householder has the lowest median household income of $0, with 65 households (5.0%) in this group.
| Income Bracket | # Households | Median Income |
| 15 to 24 Years | 65 (5.0%) | $0 |
| 25 to 44 Years | 594 (45.4%) | $63,632 |
| 45 to 64 Years | 366 (28.0%) | $66,563 |
| 65+ Years | 284 (21.7%) | $22,852 |
| Total | 1,309 (100.0%) | $48,934 |
Poverty in Anthony
Income Below Poverty by Sex and Age in Anthony
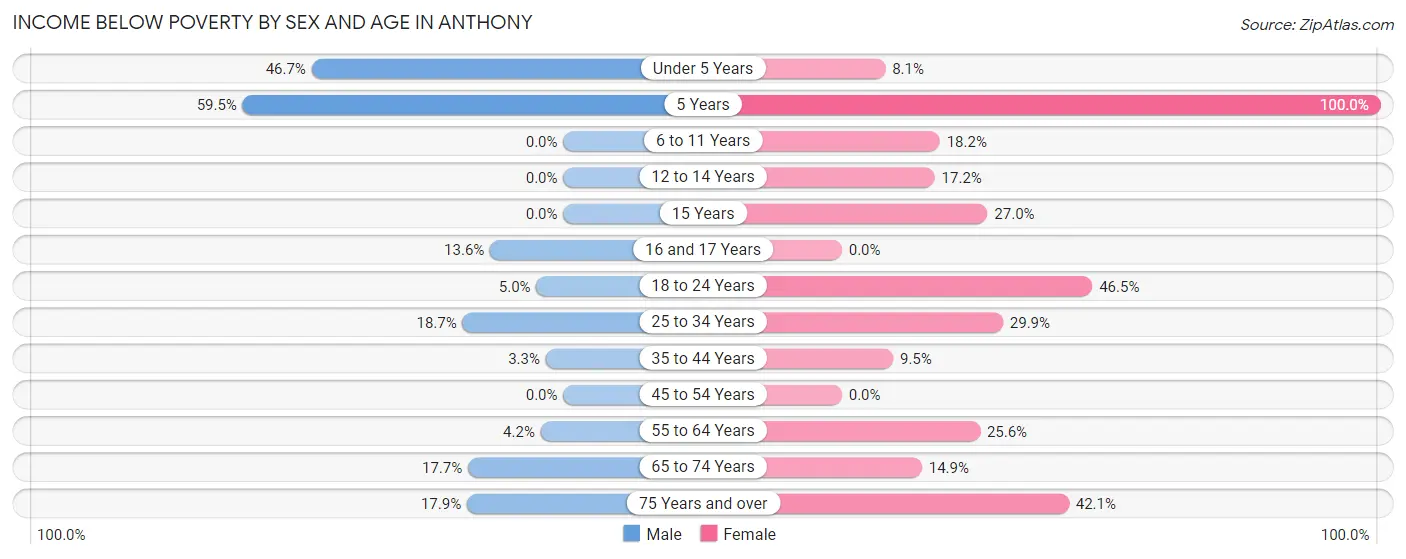
With 14.9% poverty level for males and 23.5% for females among the residents of Anthony, 5 year old males and 5 year old females are the most vulnerable to poverty, with 25 males (59.5%) and 22 females (100.0%) in their respective age groups living below the poverty level.
| Age Bracket | Male | Female |
| Under 5 Years | 135 (46.7%) | 10 (8.1%) |
| 5 Years | 25 (59.5%) | 22 (100.0%) |
| 6 to 11 Years | 0 (0.0%) | 26 (18.2%) |
| 12 to 14 Years | 0 (0.0%) | 15 (17.2%) |
| 15 Years | 0 (0.0%) | 10 (27.0%) |
| 16 and 17 Years | 14 (13.6%) | 0 (0.0%) |
| 18 to 24 Years | 7 (5.0%) | 99 (46.5%) |
| 25 to 34 Years | 61 (18.7%) | 90 (29.9%) |
| 35 to 44 Years | 10 (3.3%) | 25 (9.5%) |
| 45 to 54 Years | 0 (0.0%) | 0 (0.0%) |
| 55 to 64 Years | 5 (4.2%) | 40 (25.6%) |
| 65 to 74 Years | 23 (17.7%) | 15 (14.8%) |
| 75 Years and over | 17 (17.9%) | 75 (42.1%) |
| Total | 297 (14.9%) | 427 (23.5%) |
Income Above Poverty by Sex and Age in Anthony
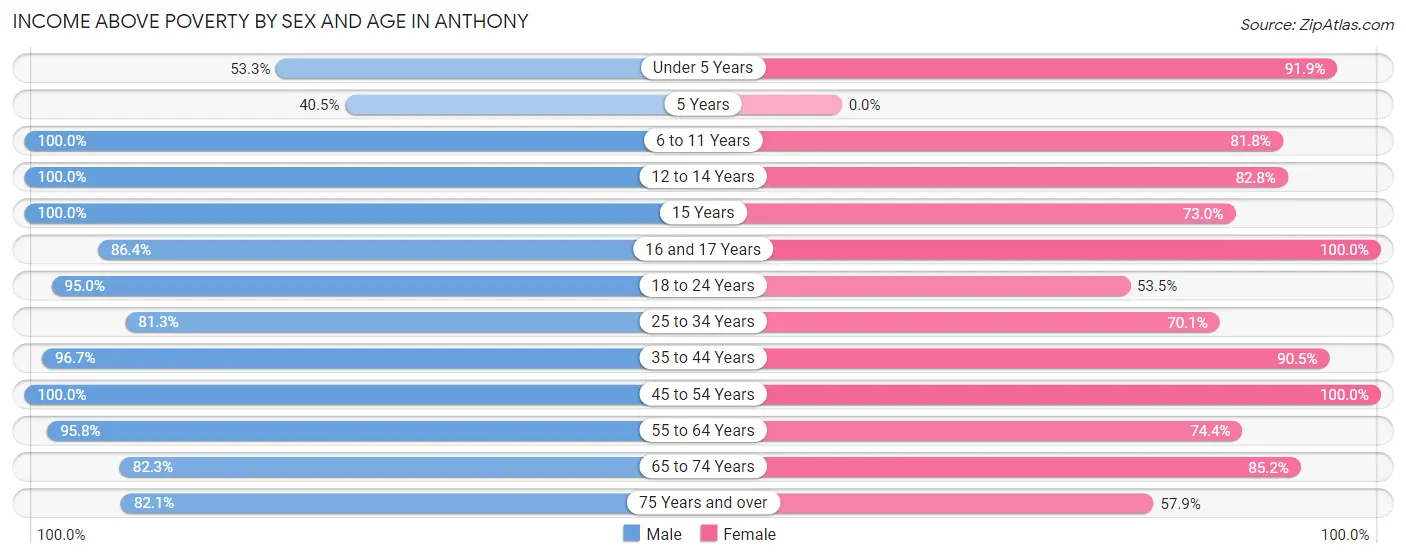
According to the poverty statistics in Anthony, males aged 6 to 11 years and females aged 16 and 17 years are the age groups that are most secure financially, with 100.0% of males and 100.0% of females in these age groups living above the poverty line.
| Age Bracket | Male | Female |
| Under 5 Years | 154 (53.3%) | 114 (91.9%) |
| 5 Years | 17 (40.5%) | 0 (0.0%) |
| 6 to 11 Years | 67 (100.0%) | 117 (81.8%) |
| 12 to 14 Years | 180 (100.0%) | 72 (82.8%) |
| 15 Years | 14 (100.0%) | 27 (73.0%) |
| 16 and 17 Years | 89 (86.4%) | 11 (100.0%) |
| 18 to 24 Years | 133 (95.0%) | 114 (53.5%) |
| 25 to 34 Years | 265 (81.3%) | 211 (70.1%) |
| 35 to 44 Years | 297 (96.7%) | 238 (90.5%) |
| 45 to 54 Years | 181 (100.0%) | 182 (100.0%) |
| 55 to 64 Years | 114 (95.8%) | 116 (74.4%) |
| 65 to 74 Years | 107 (82.3%) | 86 (85.2%) |
| 75 Years and over | 78 (82.1%) | 103 (57.9%) |
| Total | 1,696 (85.1%) | 1,391 (76.5%) |
Income Below Poverty Among Married-Couple Families in Anthony
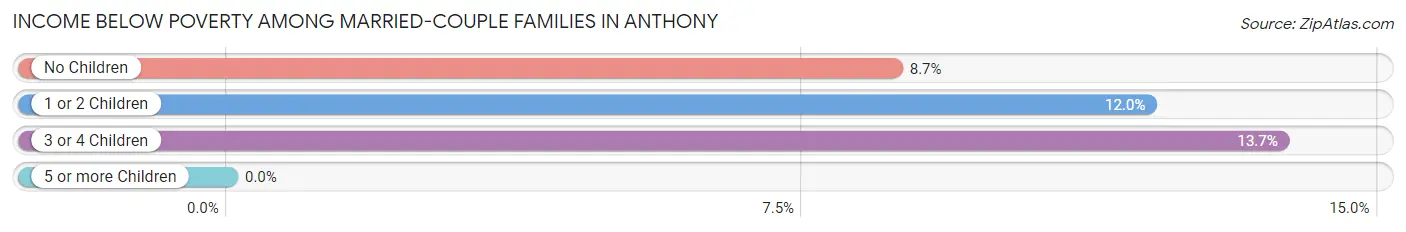
The poverty statistics for married-couple families in Anthony show that 10.7% or 76 of the total 712 families live below the poverty line. Families with 3 or 4 children have the highest poverty rate of 13.7%, comprising of 7 families. On the other hand, families with no children have the lowest poverty rate of 8.7%, which includes 27 families.
| Children | Above Poverty | Below Poverty |
| No Children | 284 (91.3%) | 27 (8.7%) |
| 1 or 2 Children | 308 (88.0%) | 42 (12.0%) |
| 3 or 4 Children | 44 (86.3%) | 7 (13.7%) |
| 5 or more Children | 0 (0.0%) | 0 (0.0%) |
| Total | 636 (89.3%) | 76 (10.7%) |
Income Below Poverty Among Single-Parent Households in Anthony
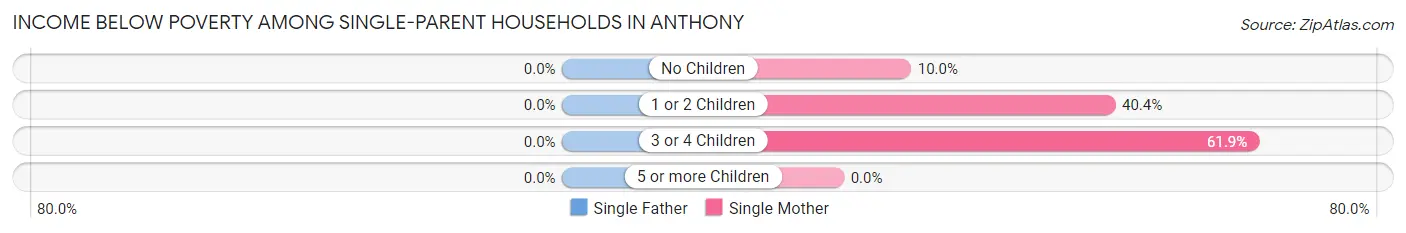
| Children | Single Father | Single Mother |
| No Children | 0 (0.0%) | 7 (10.0%) |
| 1 or 2 Children | 0 (0.0%) | 74 (40.4%) |
| 3 or 4 Children | 0 (0.0%) | 13 (61.9%) |
| 5 or more Children | 0 (0.0%) | 0 (0.0%) |
| Total | 0 (0.0%) | 94 (34.3%) |
Income Below Poverty Among Married-Couple vs Single-Parent Households in Anthony
The poverty data for Anthony shows that 76 of the married-couple family households (10.7%) and 94 of the single-parent households (29.6%) are living below the poverty level. Within the married-couple family households, those with 3 or 4 children have the highest poverty rate, with 7 households (13.7%) falling below the poverty line. Among the single-parent households, those with 3 or 4 children have the highest poverty rate, with 13 household (61.9%) living below poverty.
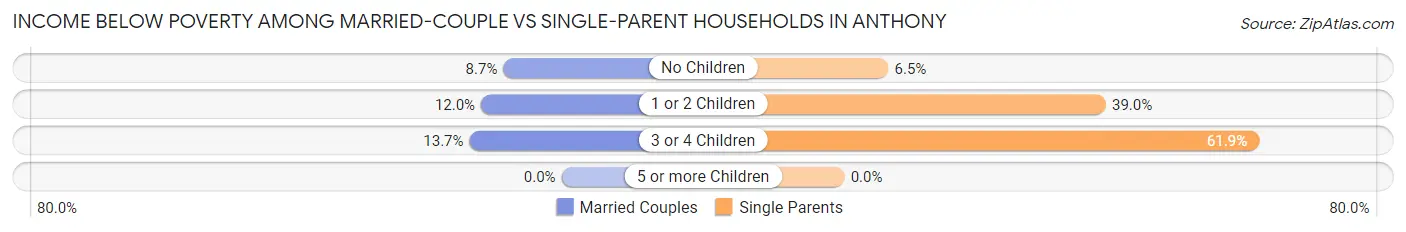
| Children | Married-Couple Families | Single-Parent Households |
| No Children | 27 (8.7%) | 7 (6.5%) |
| 1 or 2 Children | 42 (12.0%) | 74 (39.0%) |
| 3 or 4 Children | 7 (13.7%) | 13 (61.9%) |
| 5 or more Children | 0 (0.0%) | 0 (0.0%) |
| Total | 76 (10.7%) | 94 (29.6%) |
Race in Anthony
The most populous races in Anthony are Hispanic or Latino (3,619 | 95.0%), White / Caucasian (2,014 | 52.8%), and Some other Race (902 | 23.7%).
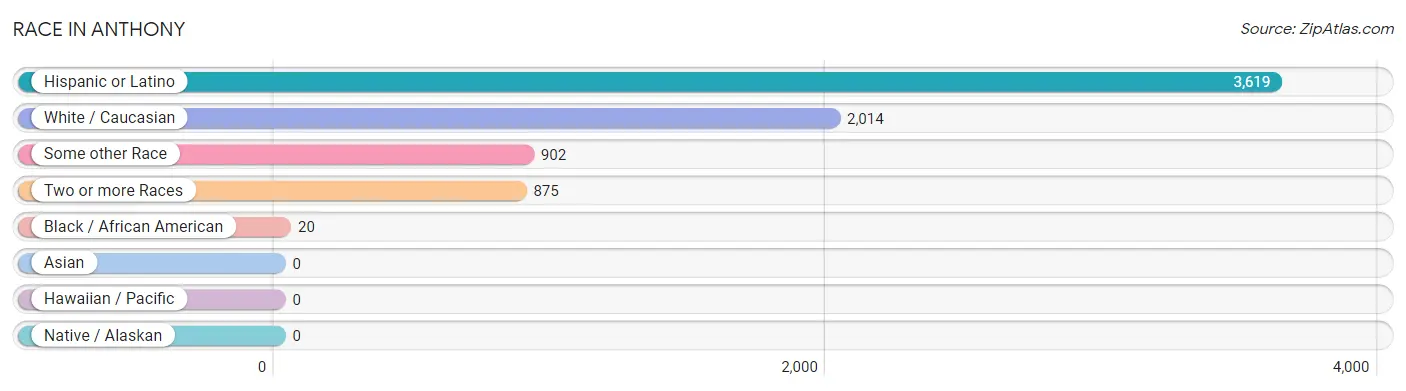
| Race | # Population | % Population |
| Asian | 0 | 0.0% |
| Black / African American | 20 | 0.5% |
| Hawaiian / Pacific | 0 | 0.0% |
| Hispanic or Latino | 3,619 | 95.0% |
| Native / Alaskan | 0 | 0.0% |
| White / Caucasian | 2,014 | 52.8% |
| Two or more Races | 875 | 23.0% |
| Some other Race | 902 | 23.7% |
| Total | 3,811 | 100.0% |
Ancestry in Anthony
The most populous ancestries reported in Anthony are Mexican (3,396 | 89.1%), Central American (150 | 3.9%), Honduran (150 | 3.9%), Irish (49 | 1.3%), and English (43 | 1.1%), together accounting for 99.4% of all Anthony residents.
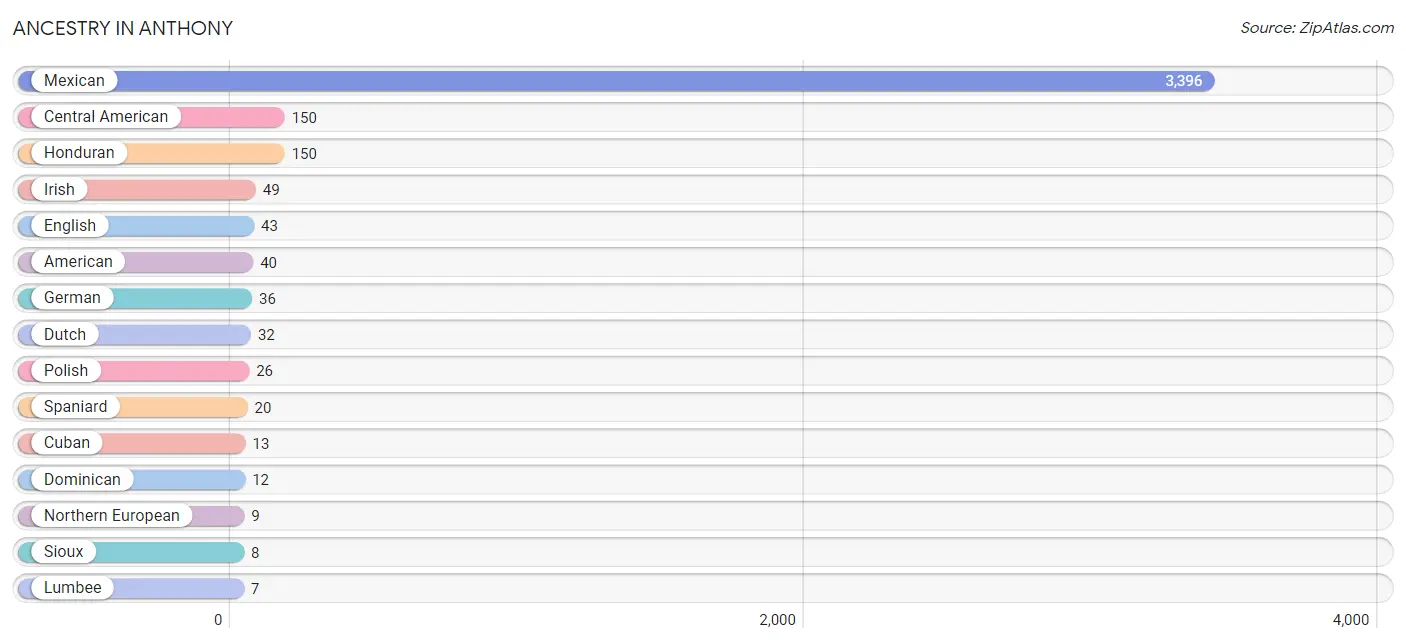
| Ancestry | # Population | % Population |
| African | 3 | 0.1% |
| American | 40 | 1.1% |
| Burmese | 1 | 0.0% |
| Central American | 150 | 3.9% |
| Cuban | 13 | 0.3% |
| Dominican | 12 | 0.3% |
| Dutch | 32 | 0.8% |
| English | 43 | 1.1% |
| German | 36 | 0.9% |
| Honduran | 150 | 3.9% |
| Irish | 49 | 1.3% |
| Italian | 6 | 0.2% |
| Lumbee | 7 | 0.2% |
| Mexican | 3,396 | 89.1% |
| Northern European | 9 | 0.2% |
| Polish | 26 | 0.7% |
| Sioux | 8 | 0.2% |
| Spaniard | 20 | 0.5% |
| Subsaharan African | 3 | 0.1% |
| Thai | 5 | 0.1% | View All 20 Rows |
Immigrants in Anthony
The most numerous immigrant groups reported in Anthony came from Latin America (970 | 25.5%), Central America (967 | 25.4%), Mexico (894 | 23.5%), Honduras (73 | 1.9%), and Caribbean (3 | 0.1%), together accounting for 76.3% of all Anthony residents.

| Immigration Origin | # Population | % Population |
| Caribbean | 3 | 0.1% |
| Central America | 967 | 25.4% |
| Dominican Republic | 3 | 0.1% |
| Honduras | 73 | 1.9% |
| Latin America | 970 | 25.5% |
| Mexico | 894 | 23.5% | View All 6 Rows |
Sex and Age in Anthony
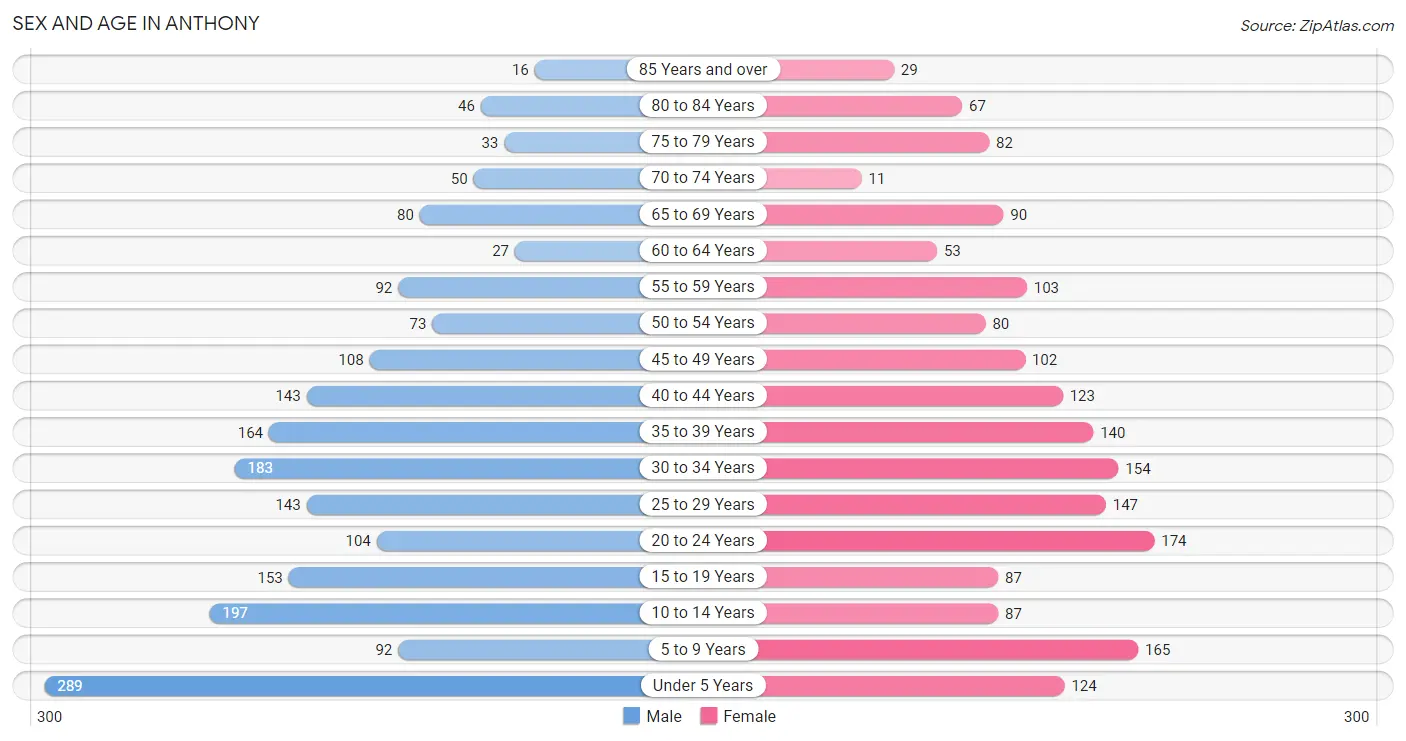
Sex and Age in Anthony
The most populous age groups in Anthony are Under 5 Years (289 | 14.5%) for men and 20 to 24 Years (174 | 9.6%) for women.
| Age Bracket | Male | Female |
| Under 5 Years | 289 (14.5%) | 124 (6.8%) |
| 5 to 9 Years | 92 (4.6%) | 165 (9.1%) |
| 10 to 14 Years | 197 (9.9%) | 87 (4.8%) |
| 15 to 19 Years | 153 (7.7%) | 87 (4.8%) |
| 20 to 24 Years | 104 (5.2%) | 174 (9.6%) |
| 25 to 29 Years | 143 (7.2%) | 147 (8.1%) |
| 30 to 34 Years | 183 (9.2%) | 154 (8.5%) |
| 35 to 39 Years | 164 (8.2%) | 140 (7.7%) |
| 40 to 44 Years | 143 (7.2%) | 123 (6.8%) |
| 45 to 49 Years | 108 (5.4%) | 102 (5.6%) |
| 50 to 54 Years | 73 (3.7%) | 80 (4.4%) |
| 55 to 59 Years | 92 (4.6%) | 103 (5.7%) |
| 60 to 64 Years | 27 (1.3%) | 53 (2.9%) |
| 65 to 69 Years | 80 (4.0%) | 90 (5.0%) |
| 70 to 74 Years | 50 (2.5%) | 11 (0.6%) |
| 75 to 79 Years | 33 (1.7%) | 82 (4.5%) |
| 80 to 84 Years | 46 (2.3%) | 67 (3.7%) |
| 85 Years and over | 16 (0.8%) | 29 (1.6%) |
| Total | 1,993 (100.0%) | 1,818 (100.0%) |
Families and Households in Anthony
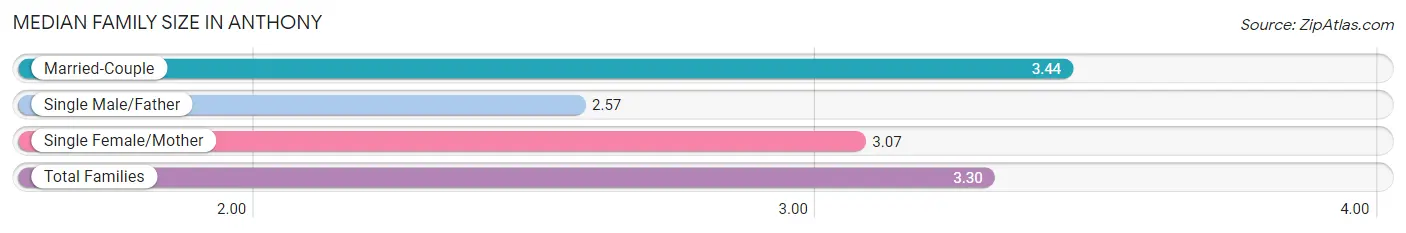
Median Family Size in Anthony
The median family size in Anthony is 3.30 persons per family, with married-couple families (712 | 69.1%) accounting for the largest median family size of 3.44 persons per family. On the other hand, single male/father families (44 | 4.3%) represent the smallest median family size with 2.57 persons per family.
| Family Type | # Families | Family Size |
| Married-Couple | 712 (69.1%) | 3.44 |
| Single Male/Father | 44 (4.3%) | 2.57 |
| Single Female/Mother | 274 (26.6%) | 3.07 |
| Total Families | 1,030 (100.0%) | 3.30 |
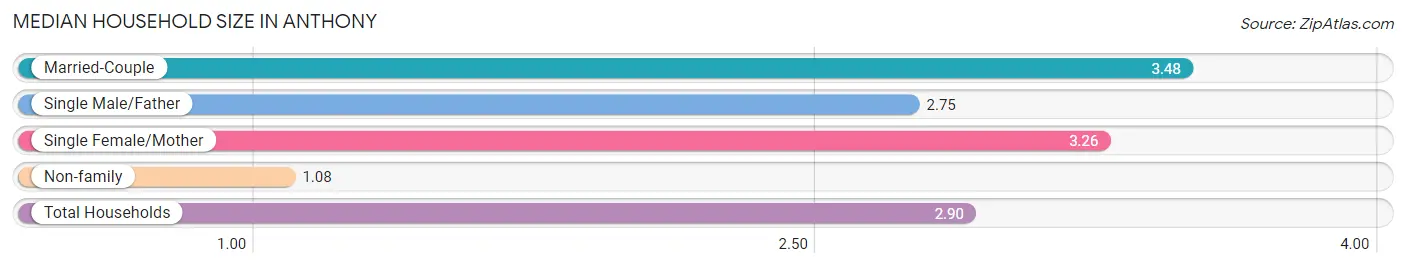
Median Household Size in Anthony
The median household size in Anthony is 2.90 persons per household, with married-couple households (712 | 54.4%) accounting for the largest median household size of 3.48 persons per household. non-family households (279 | 21.3%) represent the smallest median household size with 1.08 persons per household.
| Household Type | # Households | Household Size |
| Married-Couple | 712 (54.4%) | 3.48 |
| Single Male/Father | 44 (3.4%) | 2.75 |
| Single Female/Mother | 274 (20.9%) | 3.26 |
| Non-family | 279 (21.3%) | 1.08 |
| Total Households | 1,309 (100.0%) | 2.90 |
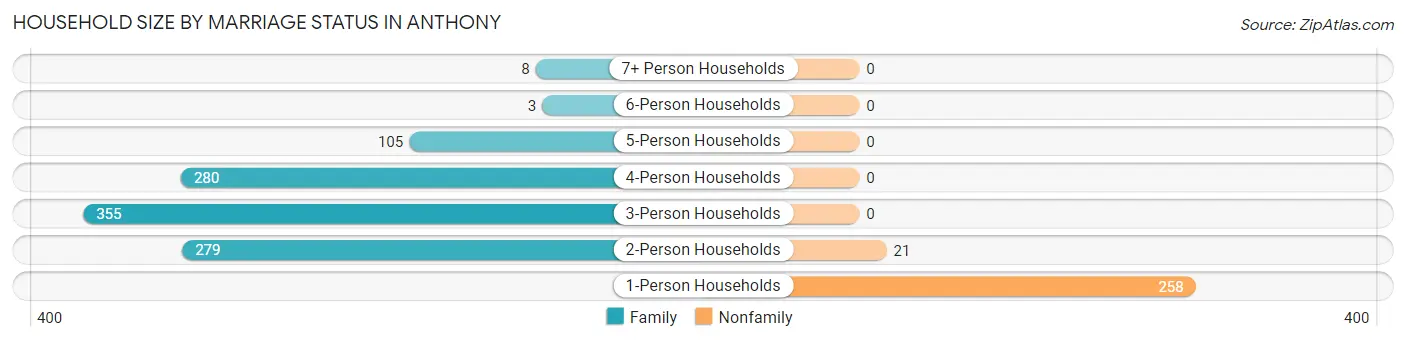
Household Size by Marriage Status in Anthony
Out of a total of 1,309 households in Anthony, 1,030 (78.7%) are family households, while 279 (21.3%) are nonfamily households. The most numerous type of family households are 3-person households, comprising 355, and the most common type of nonfamily households are 1-person households, comprising 258.
| Household Size | Family Households | Nonfamily Households |
| 1-Person Households | - | 258 (19.7%) |
| 2-Person Households | 279 (21.3%) | 21 (1.6%) |
| 3-Person Households | 355 (27.1%) | 0 (0.0%) |
| 4-Person Households | 280 (21.4%) | 0 (0.0%) |
| 5-Person Households | 105 (8.0%) | 0 (0.0%) |
| 6-Person Households | 3 (0.2%) | 0 (0.0%) |
| 7+ Person Households | 8 (0.6%) | 0 (0.0%) |
| Total | 1,030 (78.7%) | 279 (21.3%) |
Female Fertility in Anthony
Fertility by Age in Anthony
Average fertility rate in Anthony is 79.0 births per 1,000 women. Women in the age bracket of 20 to 34 years have the highest fertility rate with 154.0 births per 1,000 women. Women in the age bracket of 20 to 34 years acount for 100.0% of all women with births.
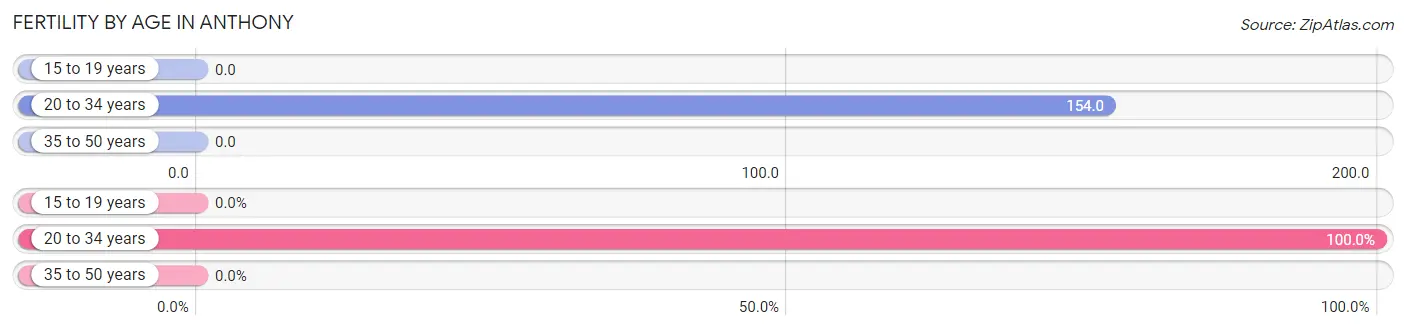
| Age Bracket | Women with Births | Births / 1,000 Women |
| 15 to 19 years | 0 (0.0%) | 0.0 |
| 20 to 34 years | 73 (100.0%) | 154.0 |
| 35 to 50 years | 0 (0.0%) | 0.0 |
| Total | 73 (100.0%) | 79.0 |
Fertility by Age by Marriage Status in Anthony
19.2% of women with births (73) in Anthony are married. The highest percentage of unmarried women with births falls into 20 to 34 years age bracket with 80.8% of them unmarried at the time of birth, while the lowest percentage of unmarried women with births belong to 20 to 34 years age bracket with 80.8% of them unmarried.
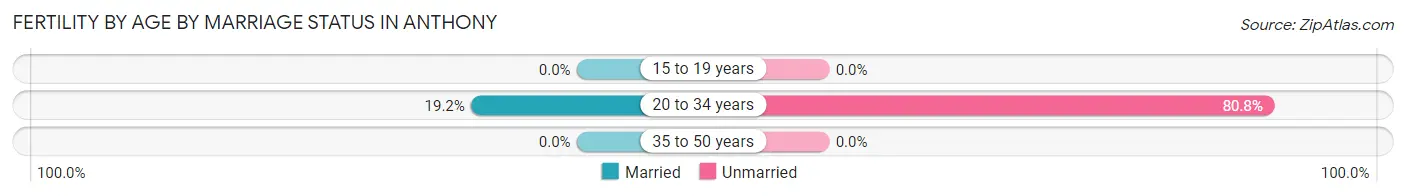
| Age Bracket | Married | Unmarried |
| 15 to 19 years | 0 (0.0%) | 0 (0.0%) |
| 20 to 34 years | 14 (19.2%) | 59 (80.8%) |
| 35 to 50 years | 0 (0.0%) | 0 (0.0%) |
| Total | 14 (19.2%) | 59 (80.8%) |
Fertility by Education in Anthony
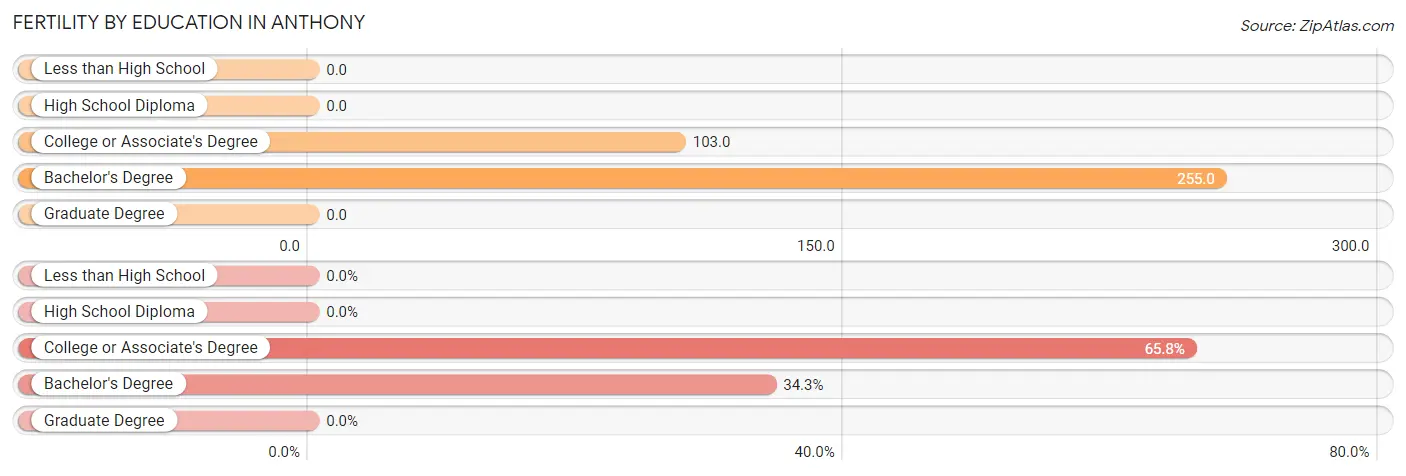
| Educational Attainment | Women with Births | Births / 1,000 Women |
| Less than High School | 0 (0.0%) | 0.0 |
| High School Diploma | 0 (0.0%) | 0.0 |
| College or Associate's Degree | 48 (65.7%) | 103.0 |
| Bachelor's Degree | 25 (34.3%) | 255.0 |
| Graduate Degree | 0 (0.0%) | 0.0 |
| Total | 73 (100.0%) | 79.0 |
Fertility by Education by Marriage Status in Anthony
80.8% of women with births in Anthony are unmarried. Women with the educational attainment of college or associate's degree are most likely to be married with 29.2% of them married at childbirth, while women with the educational attainment of bachelor's degree are least likely to be married with 100.0% of them unmarried at childbirth.
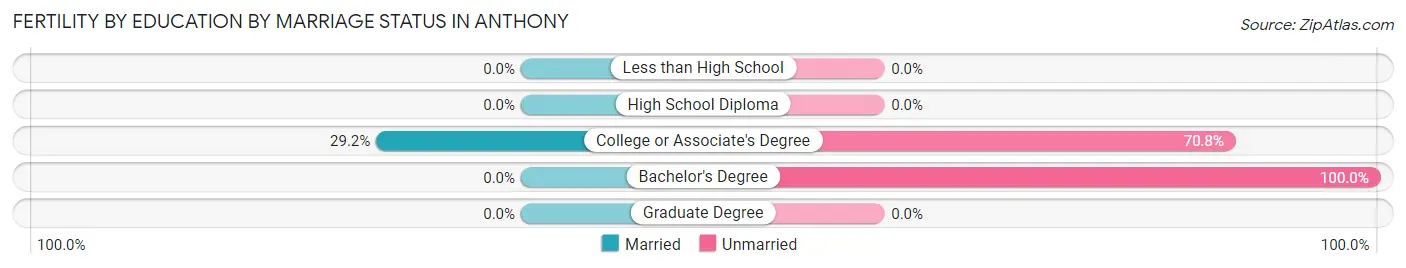
| Educational Attainment | Married | Unmarried |
| Less than High School | 0 (0.0%) | 0 (0.0%) |
| High School Diploma | 0 (0.0%) | 0 (0.0%) |
| College or Associate's Degree | 14 (29.2%) | 34 (70.8%) |
| Bachelor's Degree | 0 (0.0%) | 25 (100.0%) |
| Graduate Degree | 0 (0.0%) | 0 (0.0%) |
| Total | 14 (19.2%) | 59 (80.8%) |
Employment Characteristics in Anthony
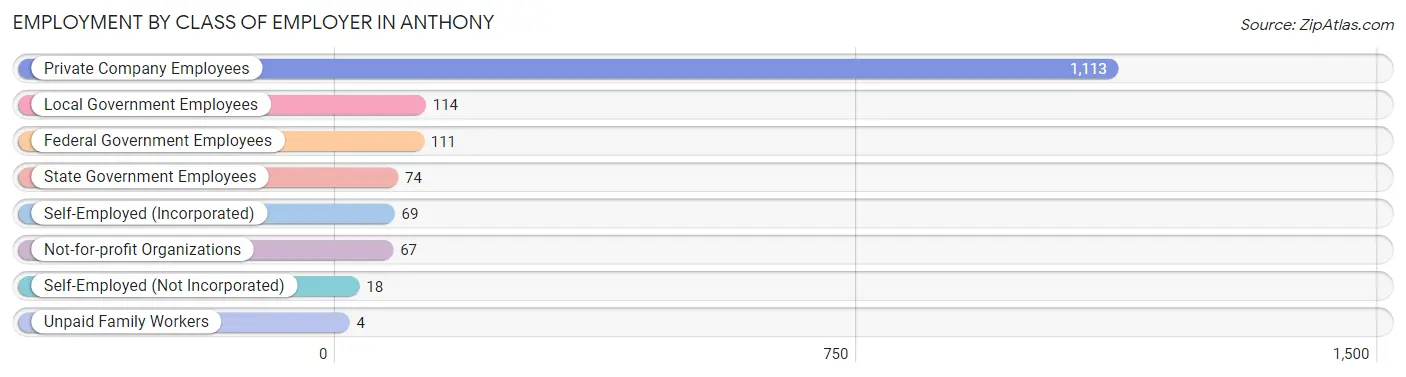
Employment by Class of Employer in Anthony
Among the 1,570 employed individuals in Anthony, private company employees (1,113 | 70.9%), local government employees (114 | 7.3%), and federal government employees (111 | 7.1%) make up the most common classes of employment.
| Employer Class | # Employees | % Employees |
| Private Company Employees | 1,113 | 70.9% |
| Self-Employed (Incorporated) | 69 | 4.4% |
| Self-Employed (Not Incorporated) | 18 | 1.1% |
| Not-for-profit Organizations | 67 | 4.3% |
| Local Government Employees | 114 | 7.3% |
| State Government Employees | 74 | 4.7% |
| Federal Government Employees | 111 | 7.1% |
| Unpaid Family Workers | 4 | 0.3% |
| Total | 1,570 | 100.0% |
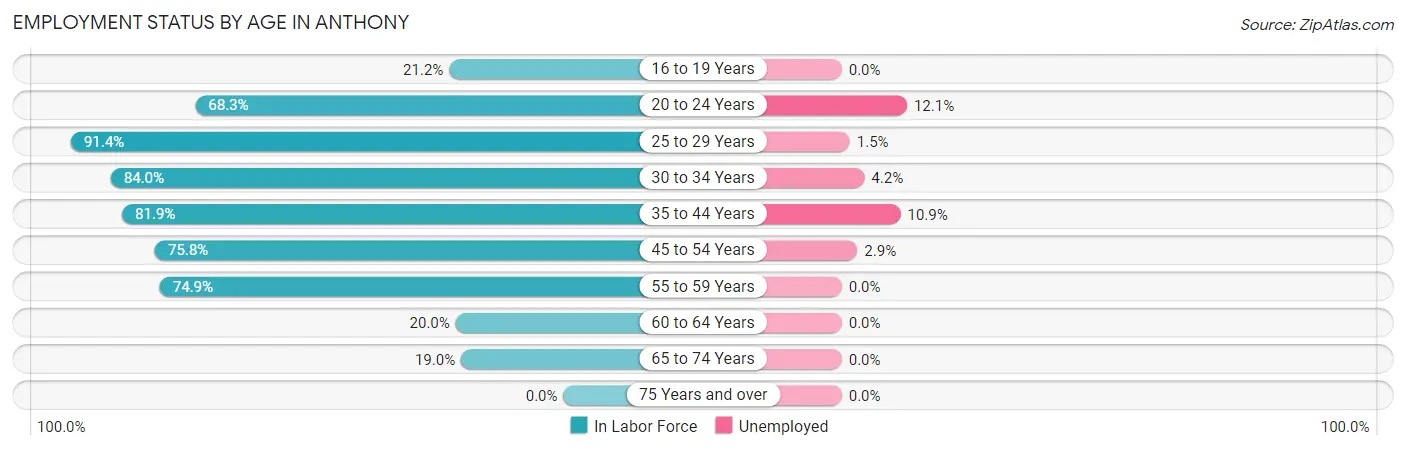
Employment Status by Age in Anthony
According to the labor force statistics for Anthony, out of the total population over 16 years of age (2,806), 61.5% or 1,726 individuals are in the labor force, with 5.7% or 98 of them unemployed. The age group with the highest labor force participation rate is 25 to 29 years, with 91.4% or 265 individuals in the labor force. Within the labor force, the 20 to 24 years age range has the highest percentage of unemployed individuals, with 12.1% or 23 of them being unemployed.
| Age Bracket | In Labor Force | Unemployed |
| 16 to 19 Years | 40 (21.2%) | 0 (0.0%) |
| 20 to 24 Years | 190 (68.3%) | 23 (12.1%) |
| 25 to 29 Years | 265 (91.4%) | 4 (1.5%) |
| 30 to 34 Years | 283 (84.0%) | 12 (4.2%) |
| 35 to 44 Years | 467 (81.9%) | 51 (10.9%) |
| 45 to 54 Years | 275 (75.8%) | 8 (2.9%) |
| 55 to 59 Years | 146 (74.9%) | 0 (0.0%) |
| 60 to 64 Years | 16 (20.0%) | 0 (0.0%) |
| 65 to 74 Years | 44 (19.0%) | 0 (0.0%) |
| 75 Years and over | 0 (0.0%) | 0 (0.0%) |
| Total | 1,726 (61.5%) | 98 (5.7%) |
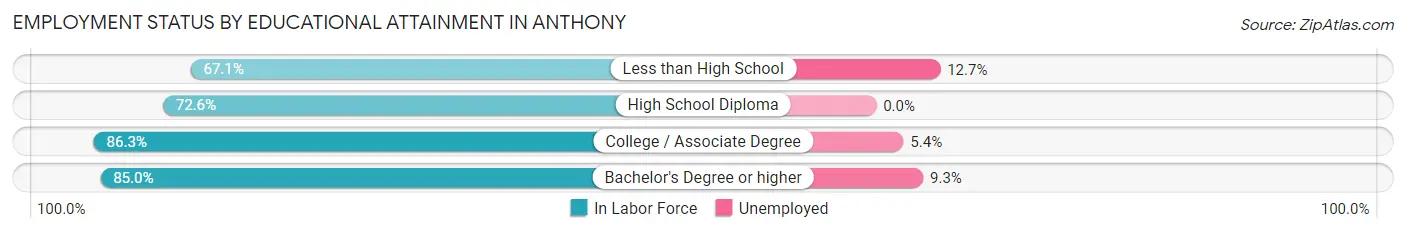
Employment Status by Educational Attainment in Anthony
According to labor force statistics for Anthony, 79.1% of individuals (1,451) out of the total population between 25 and 64 years of age (1,835) are in the labor force, with 5.2% or 75 of them being unemployed. The group with the highest labor force participation rate are those with the educational attainment of college / associate degree, with 86.3% or 628 individuals in the labor force. Within the labor force, individuals with less than high school education have the highest percentage of unemployment, with 12.7% or 20 of them being unemployed.
| Educational Attainment | In Labor Force | Unemployed |
| Less than High School | 157 (67.1%) | 30 (12.7%) |
| High School Diploma | 440 (72.6%) | 0 (0.0%) |
| College / Associate Degree | 628 (86.3%) | 39 (5.4%) |
| Bachelor's Degree or higher | 227 (85.0%) | 25 (9.3%) |
| Total | 1,451 (79.1%) | 95 (5.2%) |
Employment Occupations by Sex in Anthony
Management, Business, Science and Arts Occupations
The most common Management, Business, Science and Arts occupations in Anthony are Community & Social Service (116 | 7.1%), Education Instruction & Library (110 | 6.8%), Management (94 | 5.8%), Computers, Engineering & Science (78 | 4.8%), and Computers & Mathematics (72 | 4.4%).
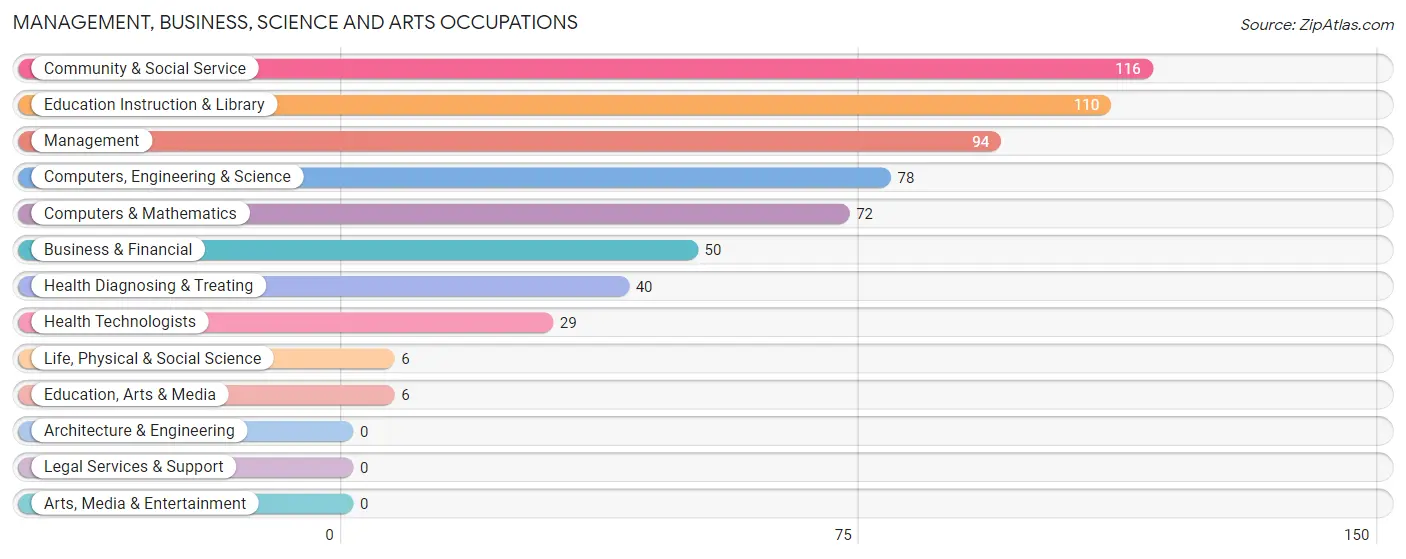
Management, Business, Science and Arts Occupations by Sex
Within the Management, Business, Science and Arts occupations in Anthony, the most male-oriented occupations are Computers & Mathematics (86.1%), Management (84.0%), and Computers, Engineering & Science (82.1%), while the most female-oriented occupations are Education, Arts & Media (100.0%), Community & Social Service (91.4%), and Education Instruction & Library (90.9%).
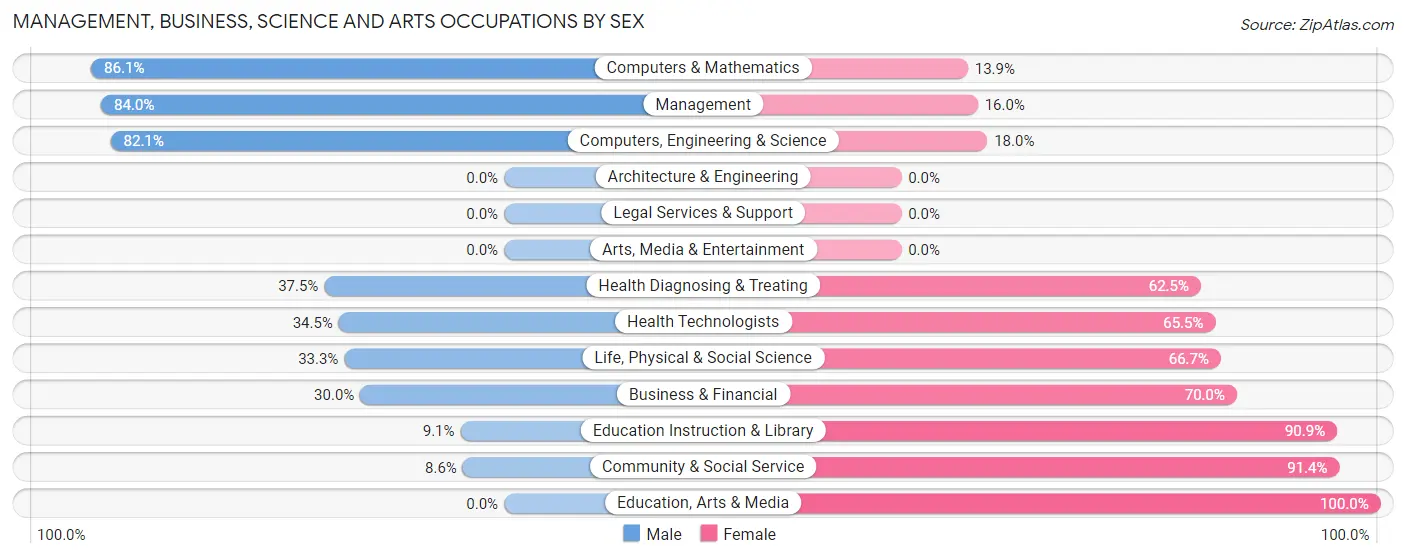
| Occupation | Male | Female |
| Management | 79 (84.0%) | 15 (16.0%) |
| Business & Financial | 15 (30.0%) | 35 (70.0%) |
| Computers, Engineering & Science | 64 (82.1%) | 14 (17.9%) |
| Computers & Mathematics | 62 (86.1%) | 10 (13.9%) |
| Architecture & Engineering | 0 (0.0%) | 0 (0.0%) |
| Life, Physical & Social Science | 2 (33.3%) | 4 (66.7%) |
| Community & Social Service | 10 (8.6%) | 106 (91.4%) |
| Education, Arts & Media | 0 (0.0%) | 6 (100.0%) |
| Legal Services & Support | 0 (0.0%) | 0 (0.0%) |
| Education Instruction & Library | 10 (9.1%) | 100 (90.9%) |
| Arts, Media & Entertainment | 0 (0.0%) | 0 (0.0%) |
| Health Diagnosing & Treating | 15 (37.5%) | 25 (62.5%) |
| Health Technologists | 10 (34.5%) | 19 (65.5%) |
| Total (Category) | 183 (48.4%) | 195 (51.6%) |
| Total (Overall) | 938 (57.6%) | 690 (42.4%) |
Services Occupations
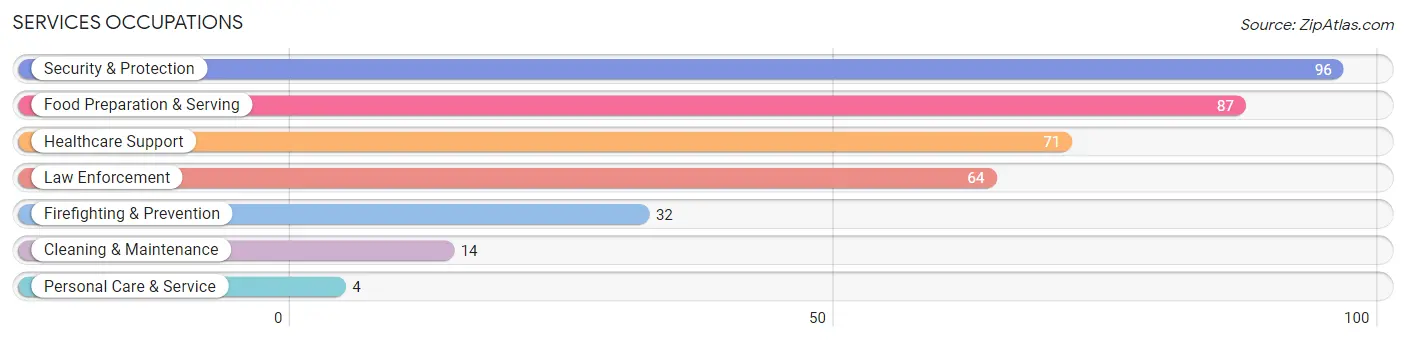
The most common Services occupations in Anthony are Security & Protection (96 | 5.9%), Food Preparation & Serving (87 | 5.3%), Healthcare Support (71 | 4.4%), Law Enforcement (64 | 3.9%), and Firefighting & Prevention (32 | 2.0%).
Services Occupations by Sex
Within the Services occupations in Anthony, the most male-oriented occupations are Security & Protection (100.0%), Firefighting & Prevention (100.0%), and Law Enforcement (100.0%), while the most female-oriented occupations are Healthcare Support (100.0%), Personal Care & Service (100.0%), and Food Preparation & Serving (54.0%).
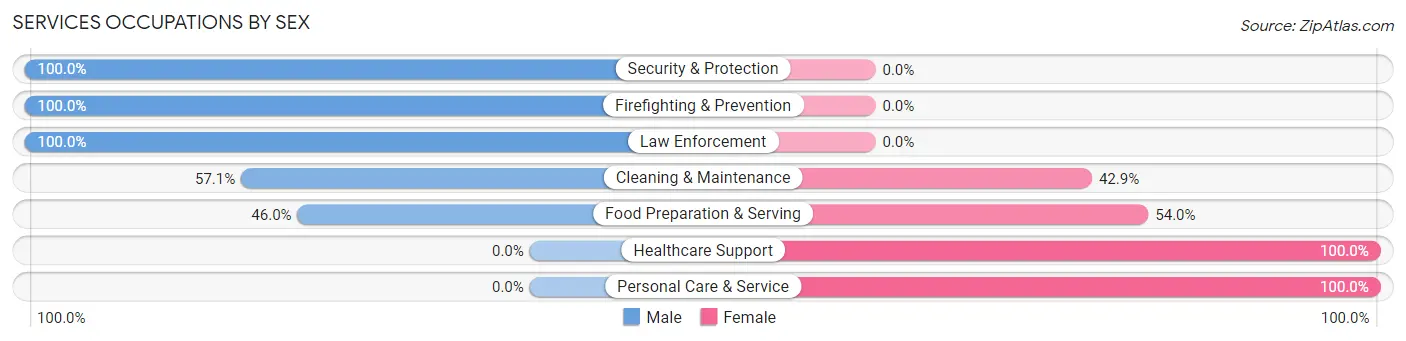
| Occupation | Male | Female |
| Healthcare Support | 0 (0.0%) | 71 (100.0%) |
| Security & Protection | 96 (100.0%) | 0 (0.0%) |
| Firefighting & Prevention | 32 (100.0%) | 0 (0.0%) |
| Law Enforcement | 64 (100.0%) | 0 (0.0%) |
| Food Preparation & Serving | 40 (46.0%) | 47 (54.0%) |
| Cleaning & Maintenance | 8 (57.1%) | 6 (42.9%) |
| Personal Care & Service | 0 (0.0%) | 4 (100.0%) |
| Total (Category) | 144 (52.9%) | 128 (47.1%) |
| Total (Overall) | 938 (57.6%) | 690 (42.4%) |
Sales and Office Occupations
The most common Sales and Office occupations in Anthony are Office & Administration (245 | 15.0%), and Sales & Related (181 | 11.1%).
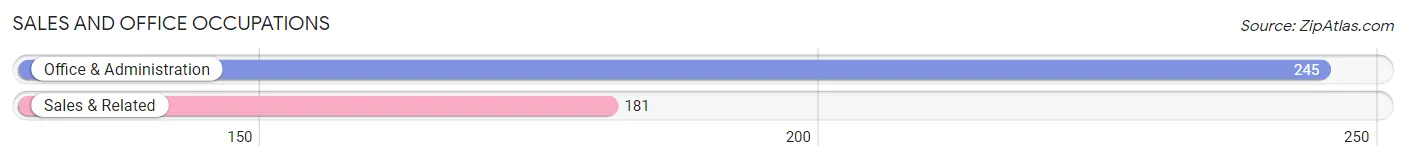
Sales and Office Occupations by Sex
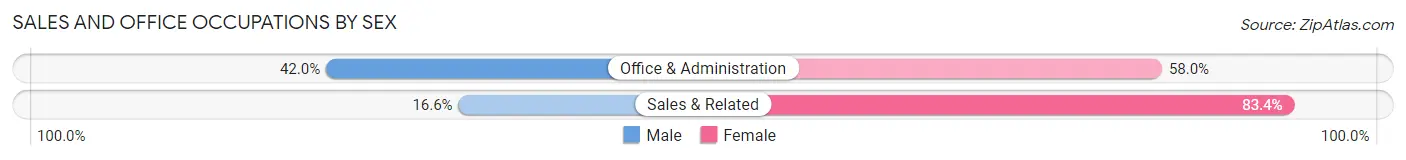
| Occupation | Male | Female |
| Sales & Related | 30 (16.6%) | 151 (83.4%) |
| Office & Administration | 103 (42.0%) | 142 (58.0%) |
| Total (Category) | 133 (31.2%) | 293 (68.8%) |
| Total (Overall) | 938 (57.6%) | 690 (42.4%) |
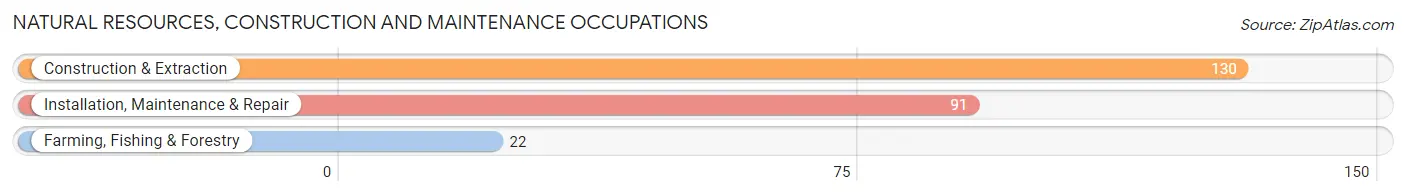
Natural Resources, Construction and Maintenance Occupations
The most common Natural Resources, Construction and Maintenance occupations in Anthony are Construction & Extraction (130 | 8.0%), Installation, Maintenance & Repair (91 | 5.6%), and Farming, Fishing & Forestry (22 | 1.3%).
Natural Resources, Construction and Maintenance Occupations by Sex
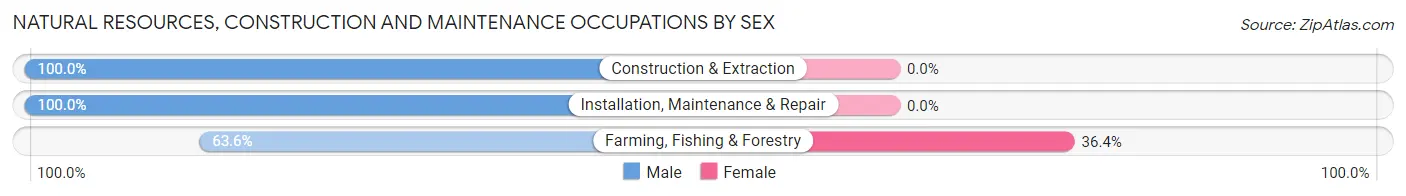
| Occupation | Male | Female |
| Farming, Fishing & Forestry | 14 (63.6%) | 8 (36.4%) |
| Construction & Extraction | 130 (100.0%) | 0 (0.0%) |
| Installation, Maintenance & Repair | 91 (100.0%) | 0 (0.0%) |
| Total (Category) | 235 (96.7%) | 8 (3.3%) |
| Total (Overall) | 938 (57.6%) | 690 (42.4%) |
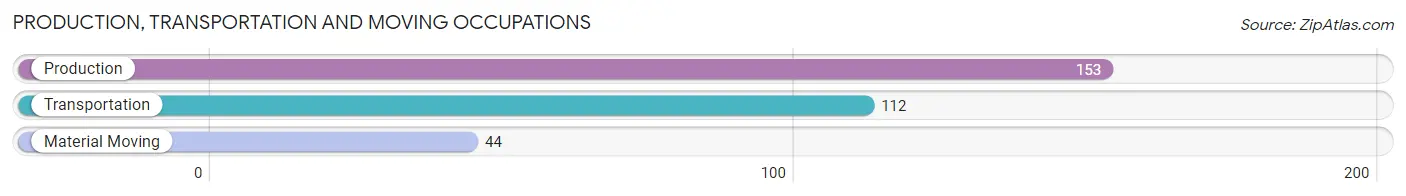
Production, Transportation and Moving Occupations
The most common Production, Transportation and Moving occupations in Anthony are Production (153 | 9.4%), Transportation (112 | 6.9%), and Material Moving (44 | 2.7%).
Production, Transportation and Moving Occupations by Sex
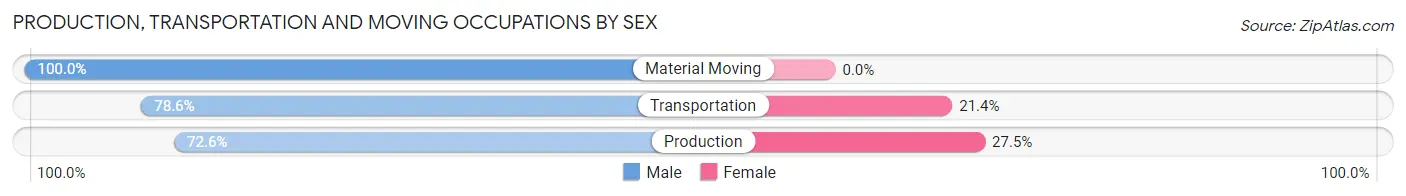
| Occupation | Male | Female |
| Production | 111 (72.6%) | 42 (27.5%) |
| Transportation | 88 (78.6%) | 24 (21.4%) |
| Material Moving | 44 (100.0%) | 0 (0.0%) |
| Total (Category) | 243 (78.6%) | 66 (21.4%) |
| Total (Overall) | 938 (57.6%) | 690 (42.4%) |
Employment Industries by Sex in Anthony
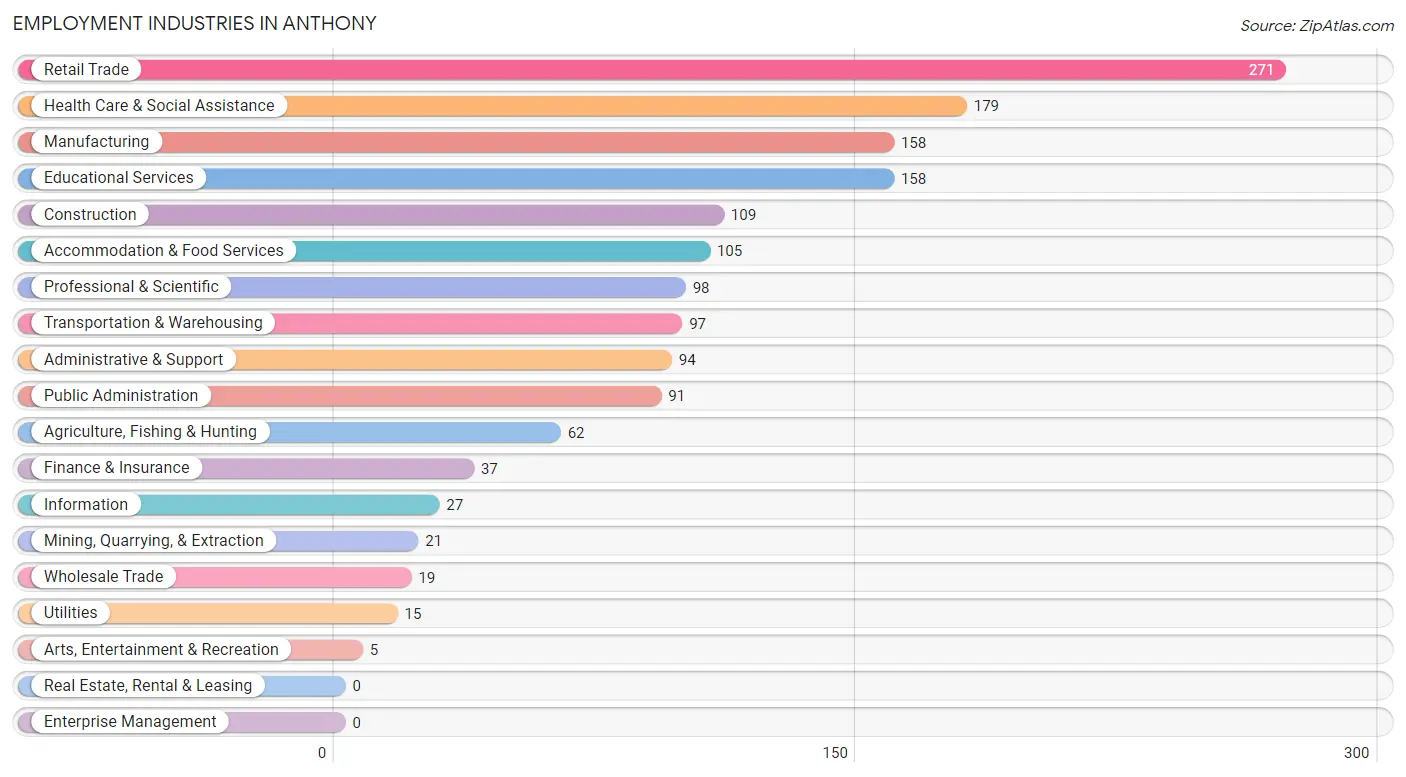
Employment Industries in Anthony
The major employment industries in Anthony include Retail Trade (271 | 16.7%), Health Care & Social Assistance (179 | 11.0%), Manufacturing (158 | 9.7%), Educational Services (158 | 9.7%), and Construction (109 | 6.7%).
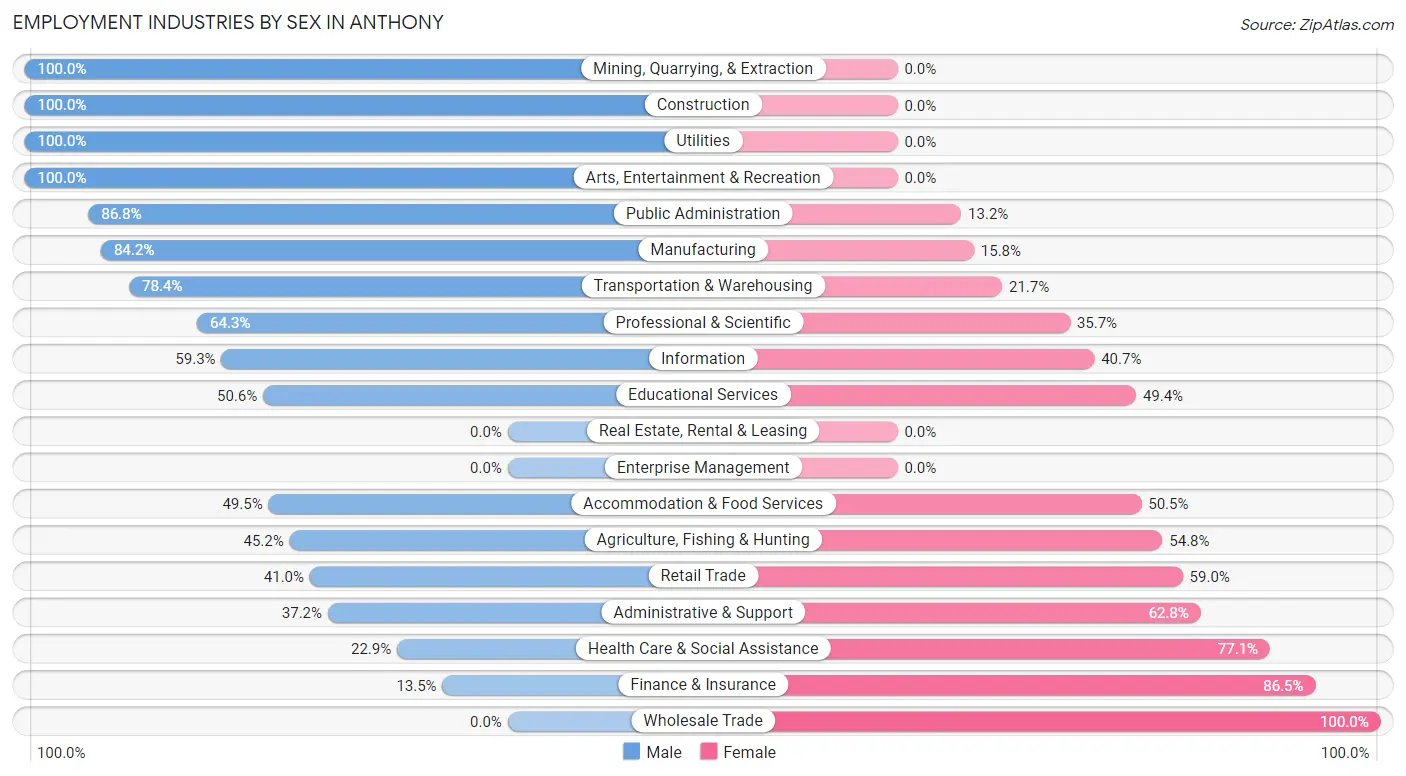
Employment Industries by Sex in Anthony
The Anthony industries that see more men than women are Mining, Quarrying, & Extraction (100.0%), Construction (100.0%), and Utilities (100.0%), whereas the industries that tend to have a higher number of women are Wholesale Trade (100.0%), Finance & Insurance (86.5%), and Health Care & Social Assistance (77.1%).
| Industry | Male | Female |
| Agriculture, Fishing & Hunting | 28 (45.2%) | 34 (54.8%) |
| Mining, Quarrying, & Extraction | 21 (100.0%) | 0 (0.0%) |
| Construction | 109 (100.0%) | 0 (0.0%) |
| Manufacturing | 133 (84.2%) | 25 (15.8%) |
| Wholesale Trade | 0 (0.0%) | 19 (100.0%) |
| Retail Trade | 111 (41.0%) | 160 (59.0%) |
| Transportation & Warehousing | 76 (78.3%) | 21 (21.6%) |
| Utilities | 15 (100.0%) | 0 (0.0%) |
| Information | 16 (59.3%) | 11 (40.7%) |
| Finance & Insurance | 5 (13.5%) | 32 (86.5%) |
| Real Estate, Rental & Leasing | 0 (0.0%) | 0 (0.0%) |
| Professional & Scientific | 63 (64.3%) | 35 (35.7%) |
| Enterprise Management | 0 (0.0%) | 0 (0.0%) |
| Administrative & Support | 35 (37.2%) | 59 (62.8%) |
| Educational Services | 80 (50.6%) | 78 (49.4%) |
| Health Care & Social Assistance | 41 (22.9%) | 138 (77.1%) |
| Arts, Entertainment & Recreation | 5 (100.0%) | 0 (0.0%) |
| Accommodation & Food Services | 52 (49.5%) | 53 (50.5%) |
| Public Administration | 79 (86.8%) | 12 (13.2%) |
| Total | 938 (57.6%) | 690 (42.4%) |
Education in Anthony
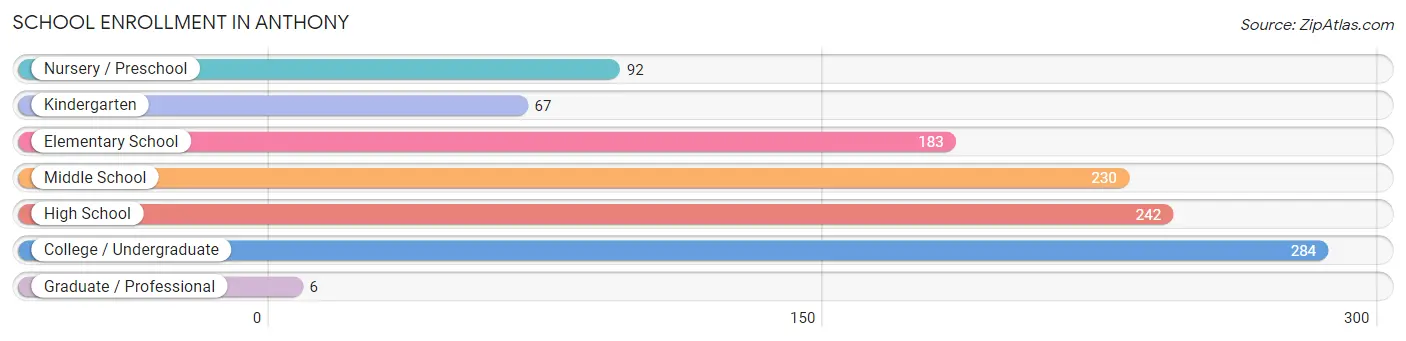
School Enrollment in Anthony
The most common levels of schooling among the 1,104 students in Anthony are college / undergraduate (284 | 25.7%), high school (242 | 21.9%), and middle school (230 | 20.8%).
| School Level | # Students | % Students |
| Nursery / Preschool | 92 | 8.3% |
| Kindergarten | 67 | 6.1% |
| Elementary School | 183 | 16.6% |
| Middle School | 230 | 20.8% |
| High School | 242 | 21.9% |
| College / Undergraduate | 284 | 25.7% |
| Graduate / Professional | 6 | 0.5% |
| Total | 1,104 | 100.0% |
School Enrollment by Age by Funding Source in Anthony
Out of a total of 1,104 students who are enrolled in schools in Anthony, 17 (1.5%) attend a private institution, while the remaining 1,087 (98.5%) are enrolled in public schools. The age group of 15 to 17 year olds has the highest likelihood of being enrolled in private schools, with 11 (6.7% in the age bracket) enrolled. Conversely, the age group of 3 to 4 year olds has the lowest likelihood of being enrolled in a private school, with 85 (100.0% in the age bracket) attending a public institution.
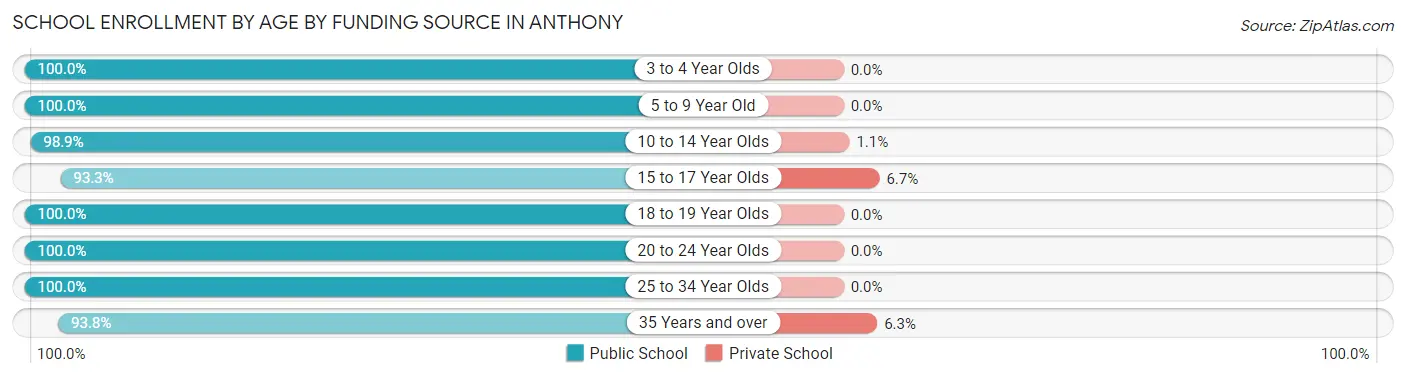
| Age Bracket | Public School | Private School |
| 3 to 4 Year Olds | 85 (100.0%) | 0 (0.0%) |
| 5 to 9 Year Old | 257 (100.0%) | 0 (0.0%) |
| 10 to 14 Year Olds | 275 (98.9%) | 3 (1.1%) |
| 15 to 17 Year Olds | 154 (93.3%) | 11 (6.7%) |
| 18 to 19 Year Olds | 59 (100.0%) | 0 (0.0%) |
| 20 to 24 Year Olds | 174 (100.0%) | 0 (0.0%) |
| 25 to 34 Year Olds | 38 (100.0%) | 0 (0.0%) |
| 35 Years and over | 45 (93.8%) | 3 (6.2%) |
| Total | 1,087 (98.5%) | 17 (1.5%) |
Educational Attainment by Field of Study in Anthony
Business (103 | 35.5%), education (100 | 34.5%), science & technology (27 | 9.3%), arts & humanities (15 | 5.2%), and liberal arts & history (12 | 4.1%) are the most common fields of study among 290 individuals in Anthony who have obtained a bachelor's degree or higher.
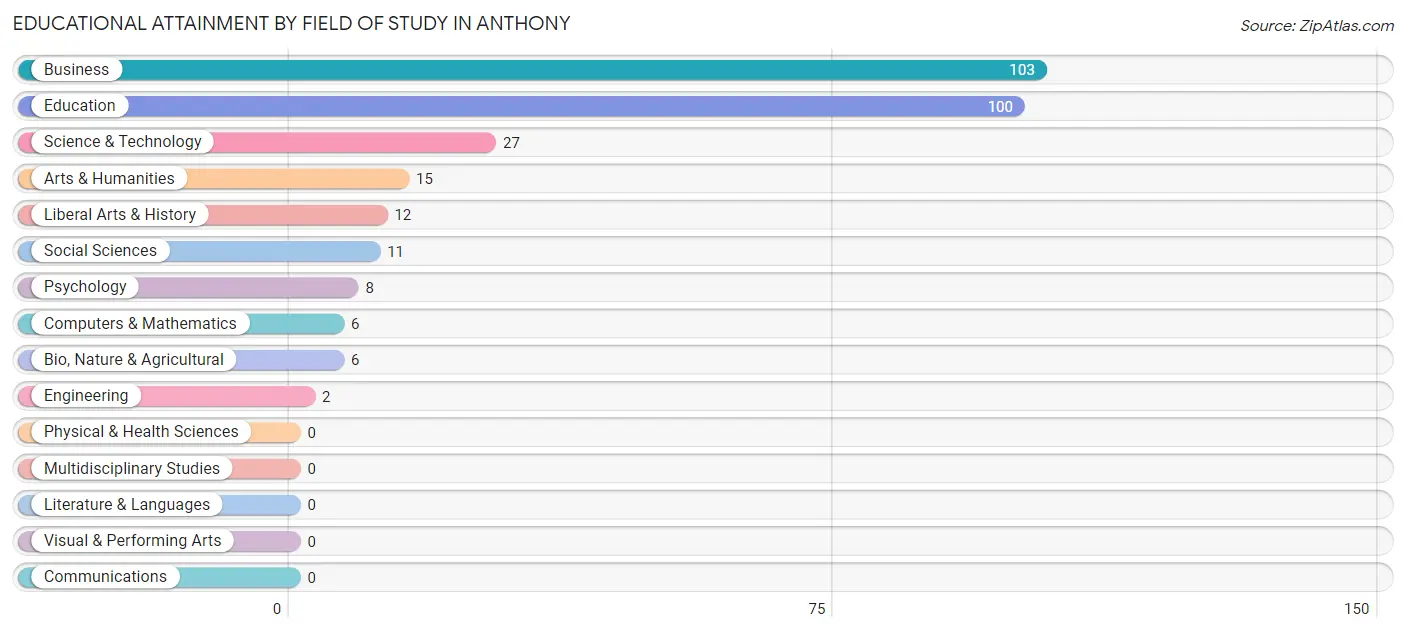
| Field of Study | # Graduates | % Graduates |
| Computers & Mathematics | 6 | 2.1% |
| Bio, Nature & Agricultural | 6 | 2.1% |
| Physical & Health Sciences | 0 | 0.0% |
| Psychology | 8 | 2.8% |
| Social Sciences | 11 | 3.8% |
| Engineering | 2 | 0.7% |
| Multidisciplinary Studies | 0 | 0.0% |
| Science & Technology | 27 | 9.3% |
| Business | 103 | 35.5% |
| Education | 100 | 34.5% |
| Literature & Languages | 0 | 0.0% |
| Liberal Arts & History | 12 | 4.1% |
| Visual & Performing Arts | 0 | 0.0% |
| Communications | 0 | 0.0% |
| Arts & Humanities | 15 | 5.2% |
| Total | 290 | 100.0% |
Transportation & Commute in Anthony
Vehicle Availability by Sex in Anthony
The most prevalent vehicle ownership categories in Anthony are males with 2 vehicles (469, accounting for 50.4%) and females with 2 vehicles (261, making up 73.3%).
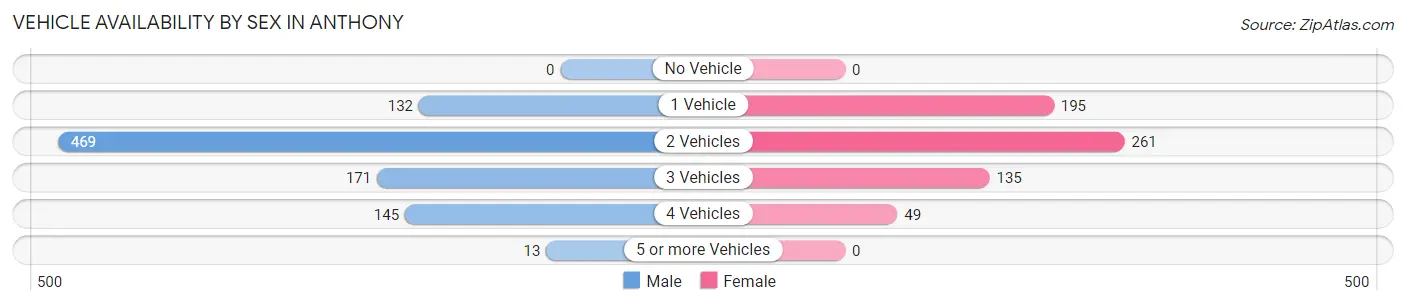
| Vehicles Available | Male | Female |
| No Vehicle | 0 (0.0%) | 0 (0.0%) |
| 1 Vehicle | 132 (14.2%) | 195 (30.5%) |
| 2 Vehicles | 469 (50.4%) | 261 (40.8%) |
| 3 Vehicles | 171 (18.4%) | 135 (21.1%) |
| 4 Vehicles | 145 (15.6%) | 49 (7.7%) |
| 5 or more Vehicles | 13 (1.4%) | 0 (0.0%) |
| Total | 930 (100.0%) | 640 (100.0%) |
Commute Time in Anthony
The most frequently occuring commute durations in Anthony are 5 to 9 minutes (312 commuters, 21.5%), 20 to 24 minutes (237 commuters, 16.3%), and 15 to 19 minutes (211 commuters, 14.5%).
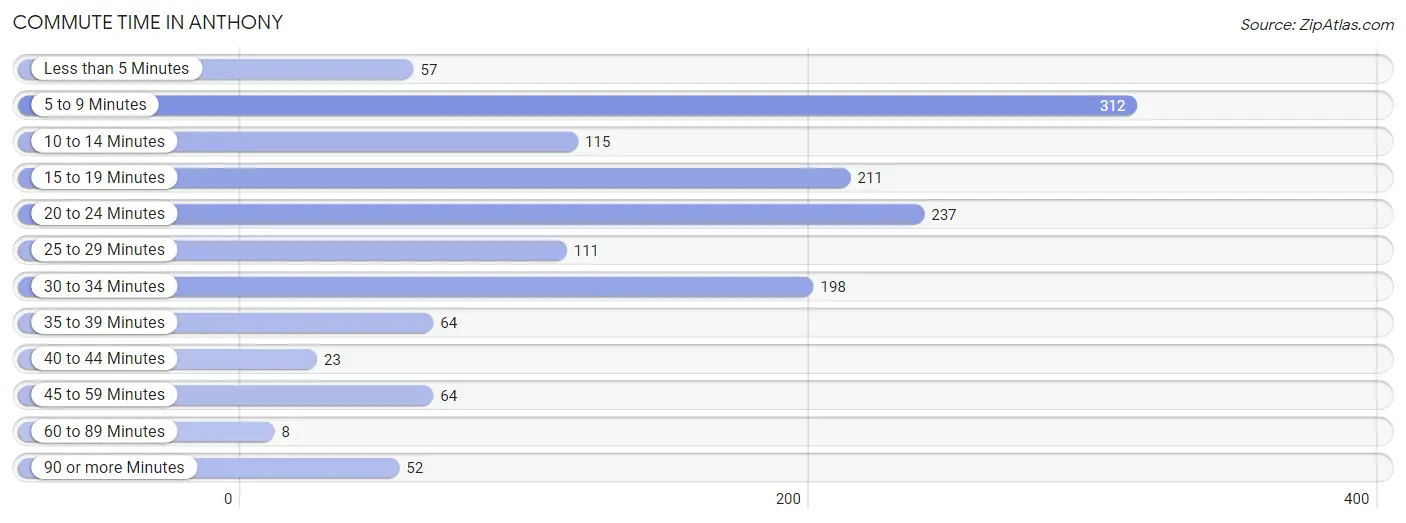
| Commute Time | # Commuters | % Commuters |
| Less than 5 Minutes | 57 | 3.9% |
| 5 to 9 Minutes | 312 | 21.5% |
| 10 to 14 Minutes | 115 | 7.9% |
| 15 to 19 Minutes | 211 | 14.5% |
| 20 to 24 Minutes | 237 | 16.3% |
| 25 to 29 Minutes | 111 | 7.6% |
| 30 to 34 Minutes | 198 | 13.6% |
| 35 to 39 Minutes | 64 | 4.4% |
| 40 to 44 Minutes | 23 | 1.6% |
| 45 to 59 Minutes | 64 | 4.4% |
| 60 to 89 Minutes | 8 | 0.5% |
| 90 or more Minutes | 52 | 3.6% |
Commute Time by Sex in Anthony
The most common commute times in Anthony are 5 to 9 minutes (196 commuters, 22.8%) for males and 15 to 19 minutes (117 commuters, 19.7%) for females.
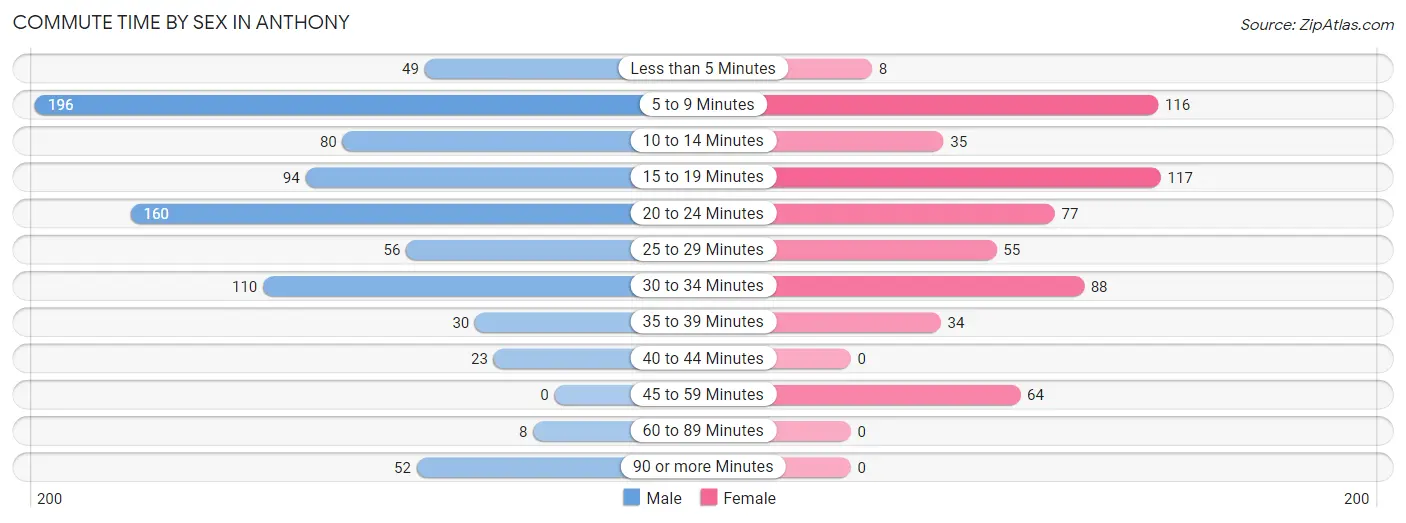
| Commute Time | Male | Female |
| Less than 5 Minutes | 49 (5.7%) | 8 (1.3%) |
| 5 to 9 Minutes | 196 (22.8%) | 116 (19.5%) |
| 10 to 14 Minutes | 80 (9.3%) | 35 (5.9%) |
| 15 to 19 Minutes | 94 (11.0%) | 117 (19.7%) |
| 20 to 24 Minutes | 160 (18.6%) | 77 (13.0%) |
| 25 to 29 Minutes | 56 (6.5%) | 55 (9.3%) |
| 30 to 34 Minutes | 110 (12.8%) | 88 (14.8%) |
| 35 to 39 Minutes | 30 (3.5%) | 34 (5.7%) |
| 40 to 44 Minutes | 23 (2.7%) | 0 (0.0%) |
| 45 to 59 Minutes | 0 (0.0%) | 64 (10.8%) |
| 60 to 89 Minutes | 8 (0.9%) | 0 (0.0%) |
| 90 or more Minutes | 52 (6.1%) | 0 (0.0%) |
Time of Departure to Work by Sex in Anthony
The most frequent times of departure to work in Anthony are 5:30 AM to 5:59 AM (164, 19.1%) for males and 8:00 AM to 8:29 AM (143, 24.1%) for females.
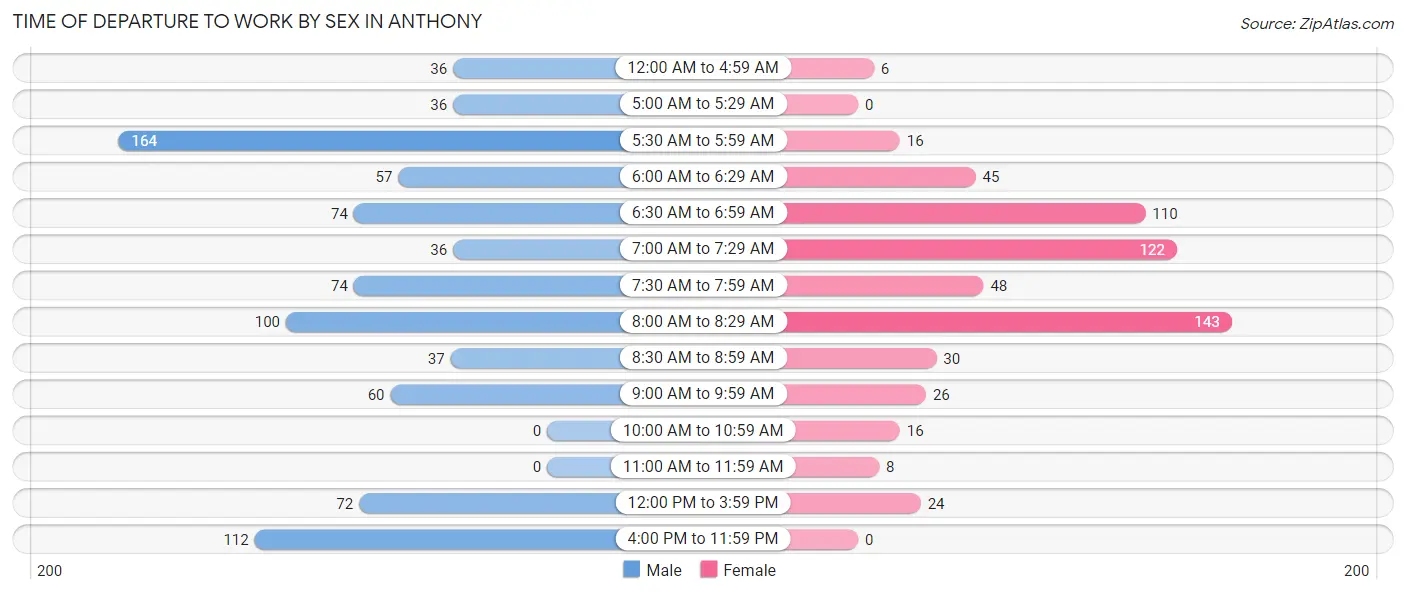
| Time of Departure | Male | Female |
| 12:00 AM to 4:59 AM | 36 (4.2%) | 6 (1.0%) |
| 5:00 AM to 5:29 AM | 36 (4.2%) | 0 (0.0%) |
| 5:30 AM to 5:59 AM | 164 (19.1%) | 16 (2.7%) |
| 6:00 AM to 6:29 AM | 57 (6.6%) | 45 (7.6%) |
| 6:30 AM to 6:59 AM | 74 (8.6%) | 110 (18.5%) |
| 7:00 AM to 7:29 AM | 36 (4.2%) | 122 (20.5%) |
| 7:30 AM to 7:59 AM | 74 (8.6%) | 48 (8.1%) |
| 8:00 AM to 8:29 AM | 100 (11.7%) | 143 (24.1%) |
| 8:30 AM to 8:59 AM | 37 (4.3%) | 30 (5.1%) |
| 9:00 AM to 9:59 AM | 60 (7.0%) | 26 (4.4%) |
| 10:00 AM to 10:59 AM | 0 (0.0%) | 16 (2.7%) |
| 11:00 AM to 11:59 AM | 0 (0.0%) | 8 (1.3%) |
| 12:00 PM to 3:59 PM | 72 (8.4%) | 24 (4.0%) |
| 4:00 PM to 11:59 PM | 112 (13.1%) | 0 (0.0%) |
| Total | 858 (100.0%) | 594 (100.0%) |
Housing Occupancy in Anthony
Occupancy by Ownership in Anthony
Of the total 1,309 dwellings in Anthony, owner-occupied units account for 975 (74.5%), while renter-occupied units make up 334 (25.5%).
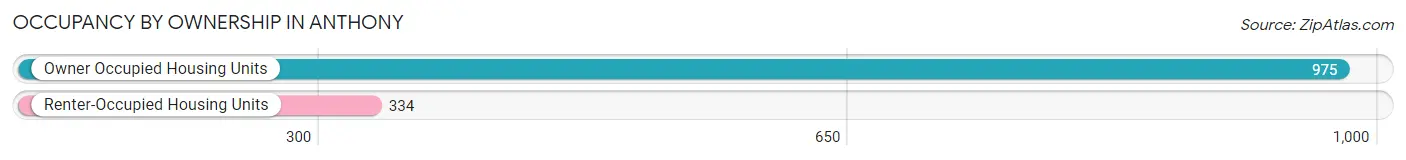
| Occupancy | # Housing Units | % Housing Units |
| Owner Occupied Housing Units | 975 | 74.5% |
| Renter-Occupied Housing Units | 334 | 25.5% |
| Total Occupied Housing Units | 1,309 | 100.0% |
Occupancy by Household Size in Anthony
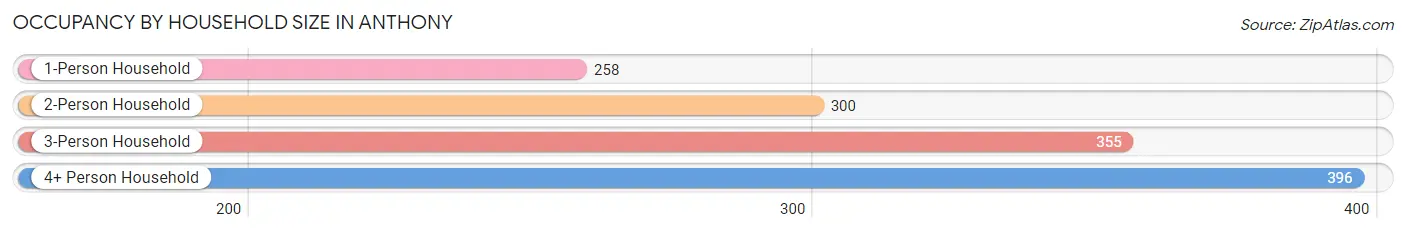
| Household Size | # Housing Units | % Housing Units |
| 1-Person Household | 258 | 19.7% |
| 2-Person Household | 300 | 22.9% |
| 3-Person Household | 355 | 27.1% |
| 4+ Person Household | 396 | 30.2% |
| Total Housing Units | 1,309 | 100.0% |
Occupancy by Ownership by Household Size in Anthony
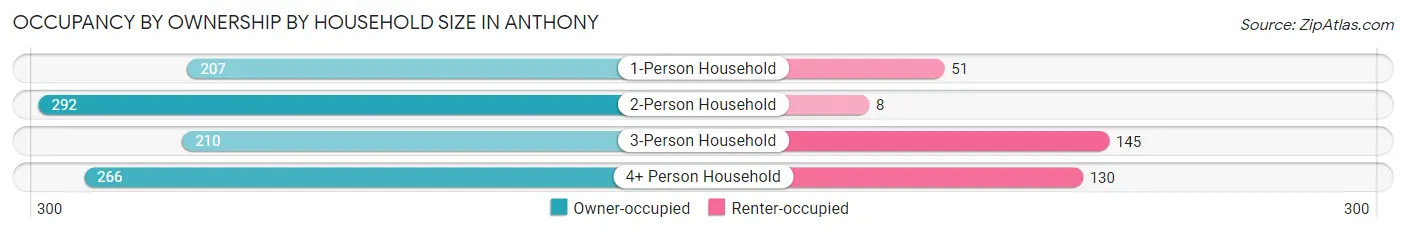
| Household Size | Owner-occupied | Renter-occupied |
| 1-Person Household | 207 (80.2%) | 51 (19.8%) |
| 2-Person Household | 292 (97.3%) | 8 (2.7%) |
| 3-Person Household | 210 (59.2%) | 145 (40.8%) |
| 4+ Person Household | 266 (67.2%) | 130 (32.8%) |
| Total Housing Units | 975 (74.5%) | 334 (25.5%) |
Occupancy by Educational Attainment in Anthony
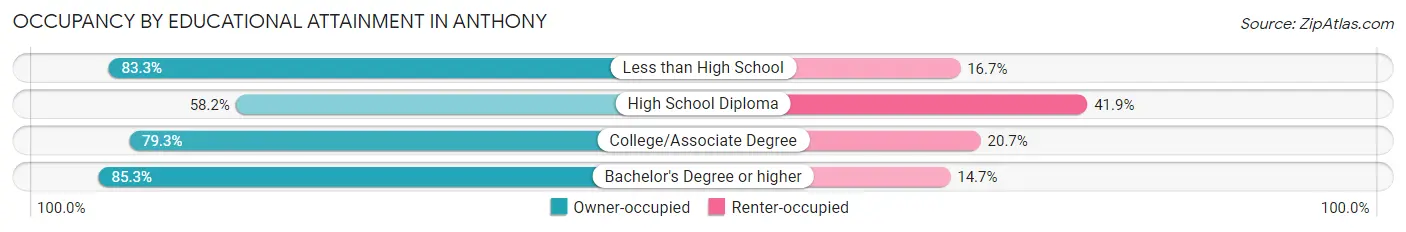
| Household Size | Owner-occupied | Renter-occupied |
| Less than High School | 265 (83.3%) | 53 (16.7%) |
| High School Diploma | 232 (58.2%) | 167 (41.8%) |
| College/Associate Degree | 356 (79.3%) | 93 (20.7%) |
| Bachelor's Degree or higher | 122 (85.3%) | 21 (14.7%) |
Occupancy by Age of Householder in Anthony
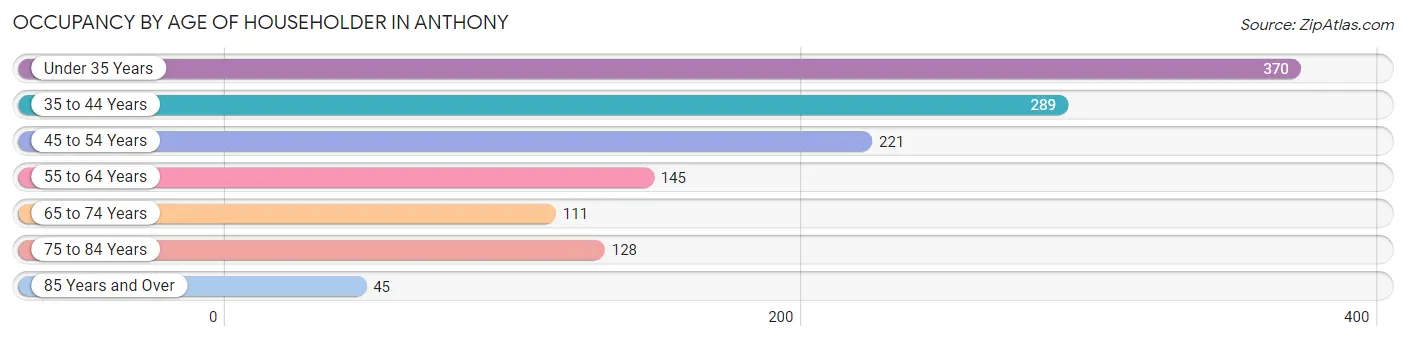
| Age Bracket | # Households | % Households |
| Under 35 Years | 370 | 28.3% |
| 35 to 44 Years | 289 | 22.1% |
| 45 to 54 Years | 221 | 16.9% |
| 55 to 64 Years | 145 | 11.1% |
| 65 to 74 Years | 111 | 8.5% |
| 75 to 84 Years | 128 | 9.8% |
| 85 Years and Over | 45 | 3.4% |
| Total | 1,309 | 100.0% |
Housing Finances in Anthony
Median Income by Occupancy in Anthony
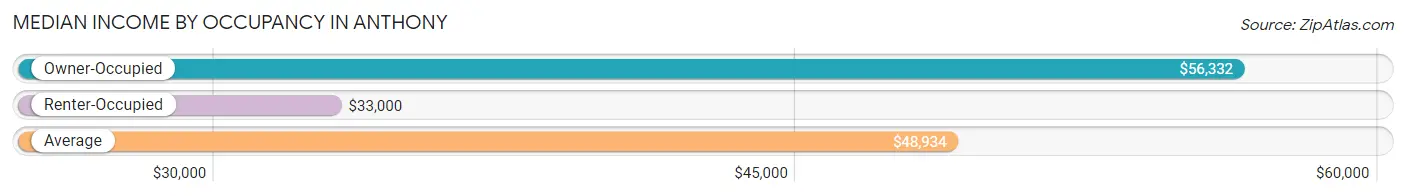
| Occupancy Type | # Households | Median Income |
| Owner-Occupied | 975 (74.5%) | $56,332 |
| Renter-Occupied | 334 (25.5%) | $33,000 |
| Average | 1,309 (100.0%) | $48,934 |
Occupancy by Householder Income Bracket in Anthony
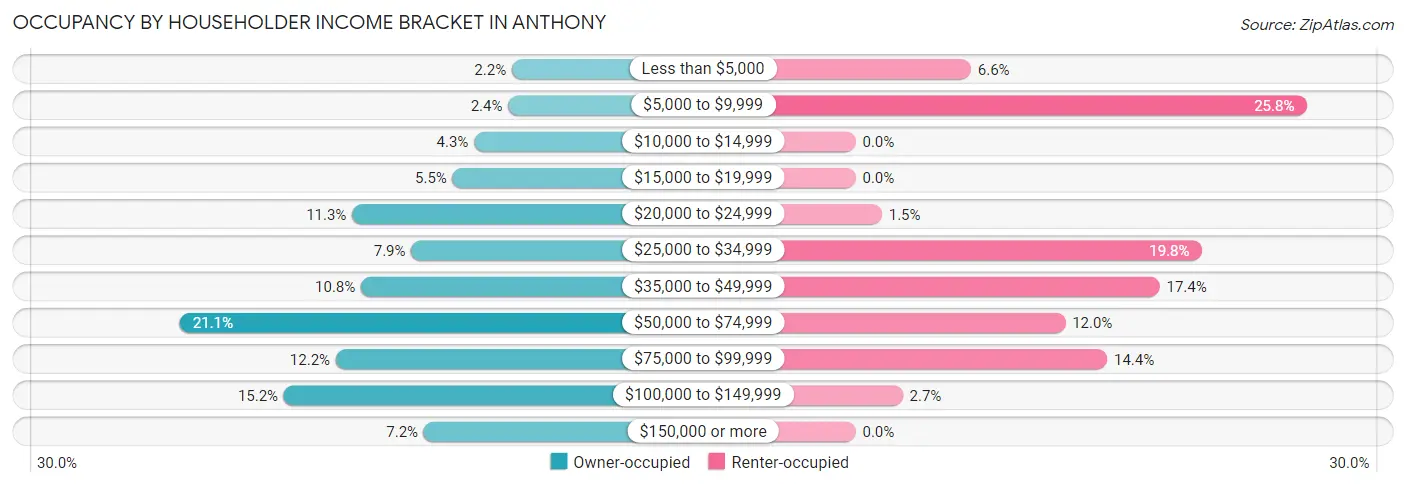
| Income Bracket | Owner-occupied | Renter-occupied |
| Less than $5,000 | 21 (2.1%) | 22 (6.6%) |
| $5,000 to $9,999 | 23 (2.4%) | 86 (25.8%) |
| $10,000 to $14,999 | 42 (4.3%) | 0 (0.0%) |
| $15,000 to $19,999 | 54 (5.5%) | 0 (0.0%) |
| $20,000 to $24,999 | 110 (11.3%) | 5 (1.5%) |
| $25,000 to $34,999 | 77 (7.9%) | 66 (19.8%) |
| $35,000 to $49,999 | 105 (10.8%) | 58 (17.4%) |
| $50,000 to $74,999 | 206 (21.1%) | 40 (12.0%) |
| $75,000 to $99,999 | 119 (12.2%) | 48 (14.4%) |
| $100,000 to $149,999 | 148 (15.2%) | 9 (2.7%) |
| $150,000 or more | 70 (7.2%) | 0 (0.0%) |
| Total | 975 (100.0%) | 334 (100.0%) |
Monthly Housing Cost Tiers in Anthony
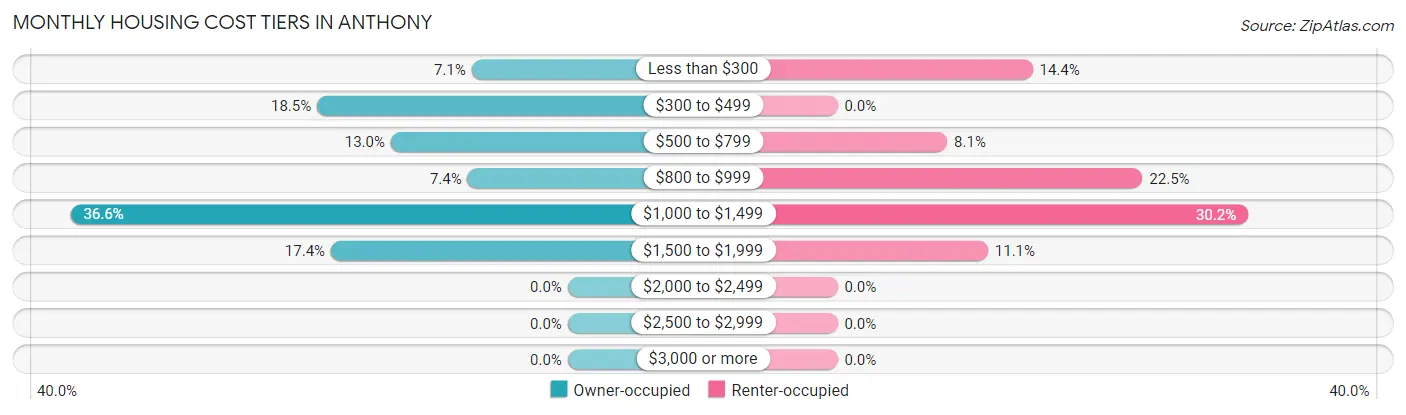
| Monthly Cost | Owner-occupied | Renter-occupied |
| Less than $300 | 69 (7.1%) | 48 (14.4%) |
| $300 to $499 | 180 (18.5%) | 0 (0.0%) |
| $500 to $799 | 127 (13.0%) | 27 (8.1%) |
| $800 to $999 | 72 (7.4%) | 75 (22.5%) |
| $1,000 to $1,499 | 357 (36.6%) | 101 (30.2%) |
| $1,500 to $1,999 | 170 (17.4%) | 37 (11.1%) |
| $2,000 to $2,499 | 0 (0.0%) | 0 (0.0%) |
| $2,500 to $2,999 | 0 (0.0%) | 0 (0.0%) |
| $3,000 or more | 0 (0.0%) | 0 (0.0%) |
| Total | 975 (100.0%) | 334 (100.0%) |
Physical Housing Characteristics in Anthony
Housing Structures in Anthony
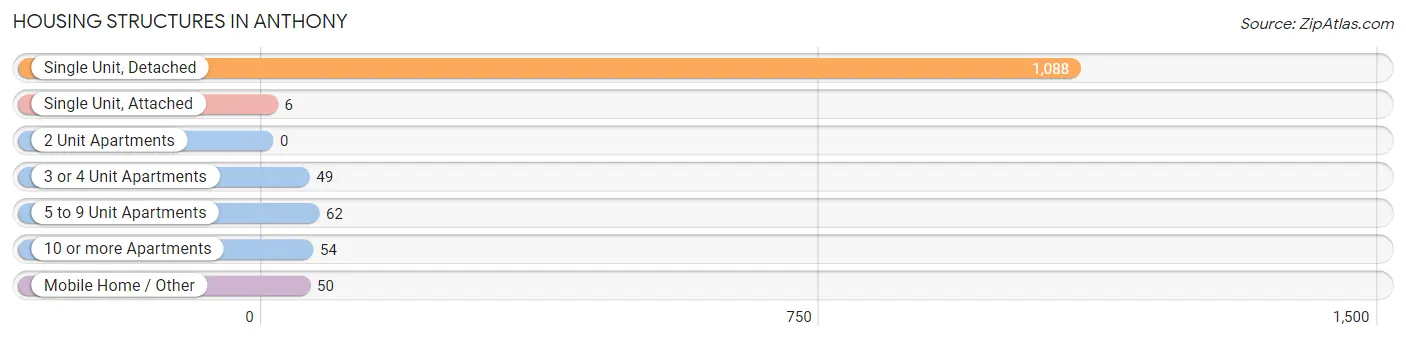
| Structure Type | # Housing Units | % Housing Units |
| Single Unit, Detached | 1,088 | 83.1% |
| Single Unit, Attached | 6 | 0.5% |
| 2 Unit Apartments | 0 | 0.0% |
| 3 or 4 Unit Apartments | 49 | 3.7% |
| 5 to 9 Unit Apartments | 62 | 4.7% |
| 10 or more Apartments | 54 | 4.1% |
| Mobile Home / Other | 50 | 3.8% |
| Total | 1,309 | 100.0% |
Housing Structures by Occupancy in Anthony
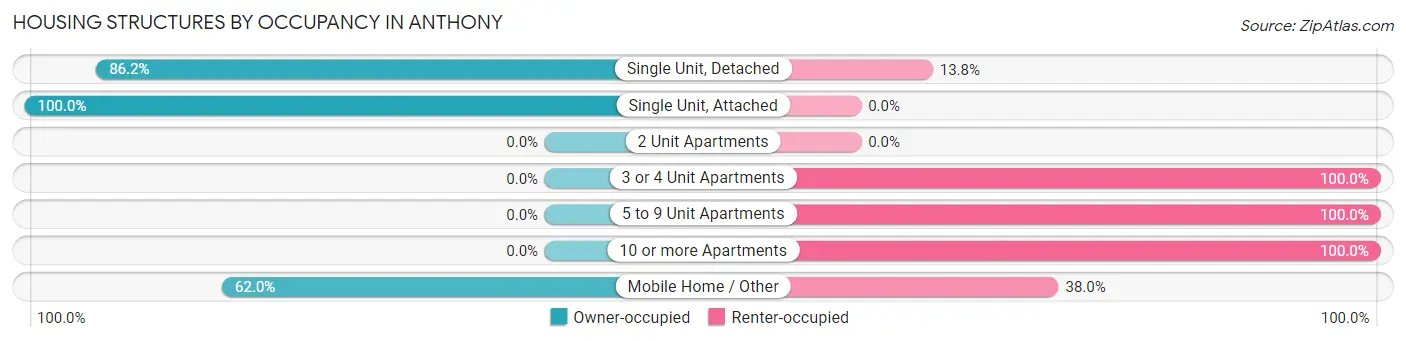
| Structure Type | Owner-occupied | Renter-occupied |
| Single Unit, Detached | 938 (86.2%) | 150 (13.8%) |
| Single Unit, Attached | 6 (100.0%) | 0 (0.0%) |
| 2 Unit Apartments | 0 (0.0%) | 0 (0.0%) |
| 3 or 4 Unit Apartments | 0 (0.0%) | 49 (100.0%) |
| 5 to 9 Unit Apartments | 0 (0.0%) | 62 (100.0%) |
| 10 or more Apartments | 0 (0.0%) | 54 (100.0%) |
| Mobile Home / Other | 31 (62.0%) | 19 (38.0%) |
| Total | 975 (74.5%) | 334 (25.5%) |
Housing Structures by Number of Rooms in Anthony
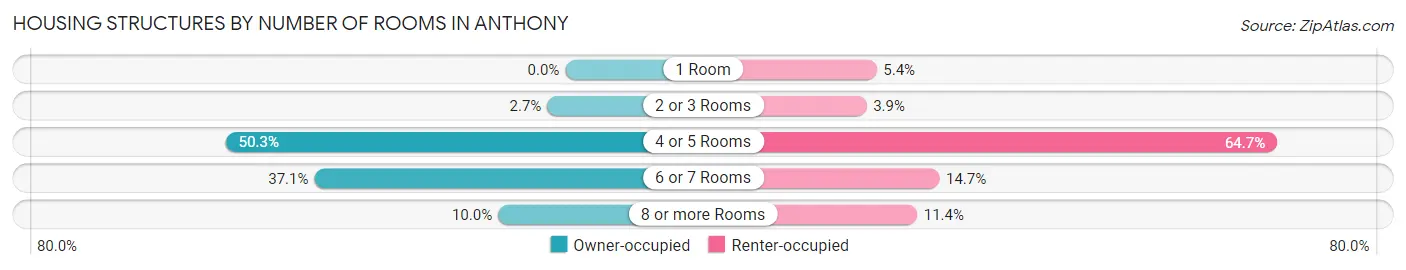
| Number of Rooms | Owner-occupied | Renter-occupied |
| 1 Room | 0 (0.0%) | 18 (5.4%) |
| 2 or 3 Rooms | 26 (2.7%) | 13 (3.9%) |
| 4 or 5 Rooms | 490 (50.3%) | 216 (64.7%) |
| 6 or 7 Rooms | 362 (37.1%) | 49 (14.7%) |
| 8 or more Rooms | 97 (10.0%) | 38 (11.4%) |
| Total | 975 (100.0%) | 334 (100.0%) |
Housing Structure by Heating Type in Anthony
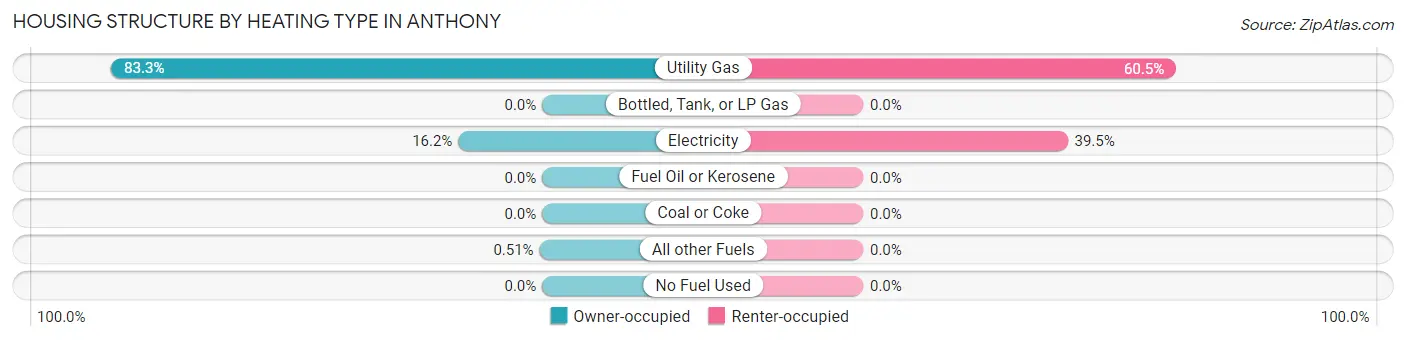
| Heating Type | Owner-occupied | Renter-occupied |
| Utility Gas | 812 (83.3%) | 202 (60.5%) |
| Bottled, Tank, or LP Gas | 0 (0.0%) | 0 (0.0%) |
| Electricity | 158 (16.2%) | 132 (39.5%) |
| Fuel Oil or Kerosene | 0 (0.0%) | 0 (0.0%) |
| Coal or Coke | 0 (0.0%) | 0 (0.0%) |
| All other Fuels | 5 (0.5%) | 0 (0.0%) |
| No Fuel Used | 0 (0.0%) | 0 (0.0%) |
| Total | 975 (100.0%) | 334 (100.0%) |
Household Vehicle Usage in Anthony
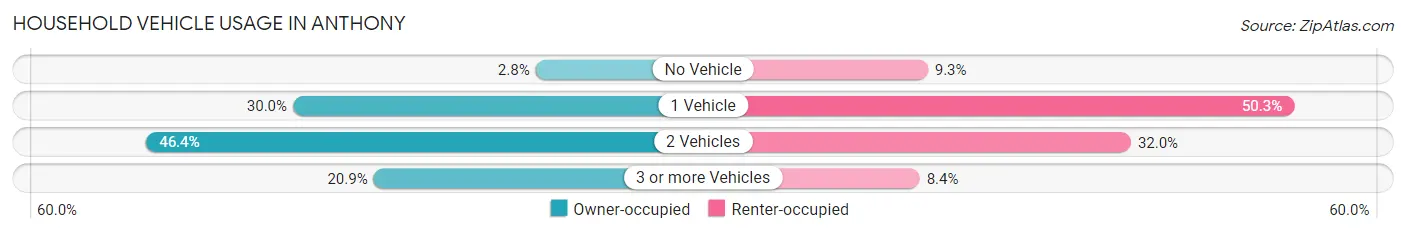
| Vehicles per Household | Owner-occupied | Renter-occupied |
| No Vehicle | 27 (2.8%) | 31 (9.3%) |
| 1 Vehicle | 292 (29.9%) | 168 (50.3%) |
| 2 Vehicles | 452 (46.4%) | 107 (32.0%) |
| 3 or more Vehicles | 204 (20.9%) | 28 (8.4%) |
| Total | 975 (100.0%) | 334 (100.0%) |
Real Estate & Mortgages in Anthony
Real Estate and Mortgage Overview in Anthony
| Characteristic | Without Mortgage | With Mortgage |
| Housing Units | 335 | 640 |
| Median Property Value | $105,300 | $164,000 |
| Median Household Income | $24,397 | $70 |
| Monthly Housing Costs | $419 | $0 |
| Real Estate Taxes | $2,128 | $22 |
Property Value by Mortgage Status in Anthony
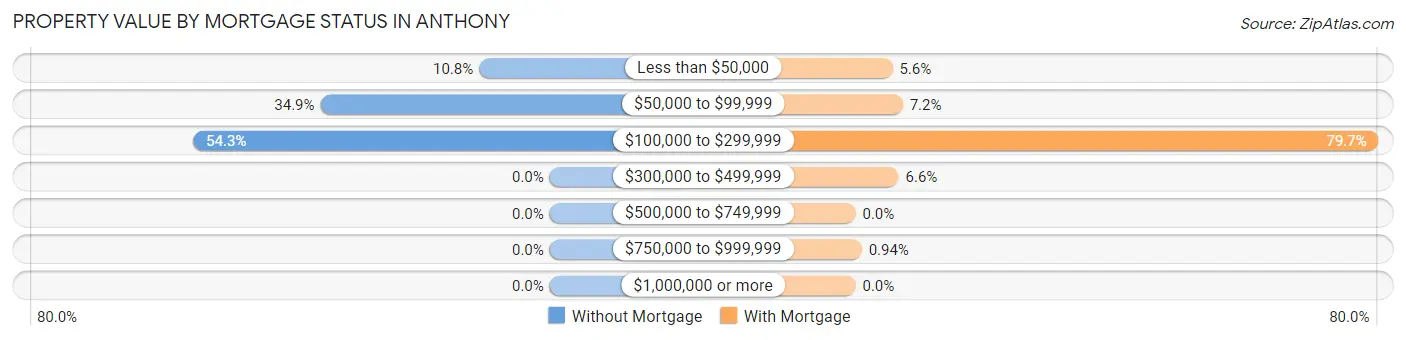
| Property Value | Without Mortgage | With Mortgage |
| Less than $50,000 | 36 (10.7%) | 36 (5.6%) |
| $50,000 to $99,999 | 117 (34.9%) | 46 (7.2%) |
| $100,000 to $299,999 | 182 (54.3%) | 510 (79.7%) |
| $300,000 to $499,999 | 0 (0.0%) | 42 (6.6%) |
| $500,000 to $749,999 | 0 (0.0%) | 0 (0.0%) |
| $750,000 to $999,999 | 0 (0.0%) | 6 (0.9%) |
| $1,000,000 or more | 0 (0.0%) | 0 (0.0%) |
| Total | 335 (100.0%) | 640 (100.0%) |
Household Income by Mortgage Status in Anthony
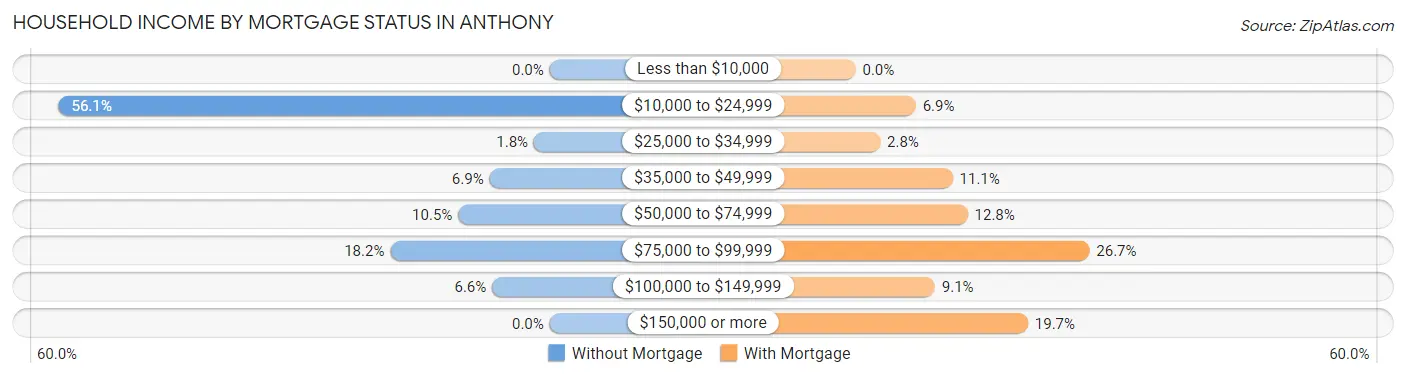
| Household Income | Without Mortgage | With Mortgage |
| Less than $10,000 | 0 (0.0%) | 0 (0.0%) |
| $10,000 to $24,999 | 188 (56.1%) | 44 (6.9%) |
| $25,000 to $34,999 | 6 (1.8%) | 18 (2.8%) |
| $35,000 to $49,999 | 23 (6.9%) | 71 (11.1%) |
| $50,000 to $74,999 | 35 (10.4%) | 82 (12.8%) |
| $75,000 to $99,999 | 61 (18.2%) | 171 (26.7%) |
| $100,000 to $149,999 | 22 (6.6%) | 58 (9.1%) |
| $150,000 or more | 0 (0.0%) | 126 (19.7%) |
| Total | 335 (100.0%) | 640 (100.0%) |
Property Value to Household Income Ratio in Anthony
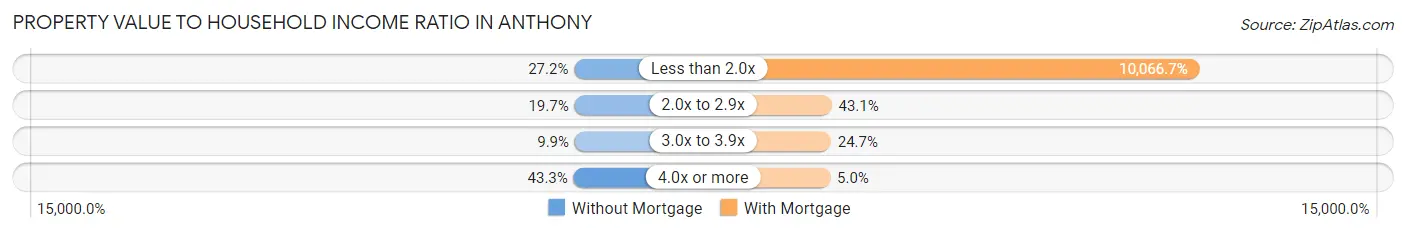
| Value-to-Income Ratio | Without Mortgage | With Mortgage |
| Less than 2.0x | 91 (27.2%) | 64,427 (10,066.7%) |
| 2.0x to 2.9x | 66 (19.7%) | 276 (43.1%) |
| 3.0x to 3.9x | 33 (9.9%) | 158 (24.7%) |
| 4.0x or more | 145 (43.3%) | 32 (5.0%) |
| Total | 335 (100.0%) | 640 (100.0%) |
Real Estate Taxes by Mortgage Status in Anthony
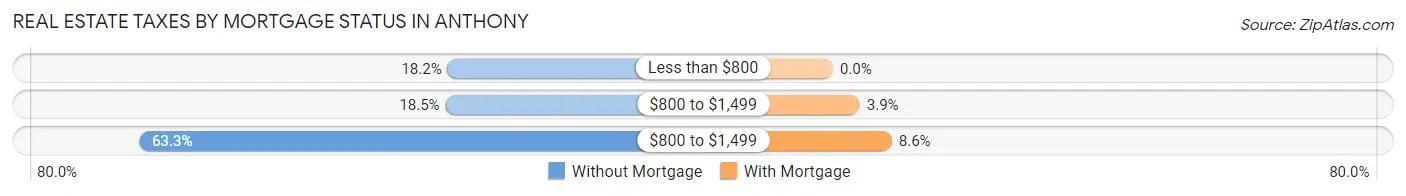
| Property Taxes | Without Mortgage | With Mortgage |
| Less than $800 | 61 (18.2%) | 0 (0.0%) |
| $800 to $1,499 | 62 (18.5%) | 25 (3.9%) |
| $800 to $1,499 | 212 (63.3%) | 55 (8.6%) |
| Total | 335 (100.0%) | 640 (100.0%) |
Health & Disability in Anthony
Health Insurance Coverage by Age in Anthony
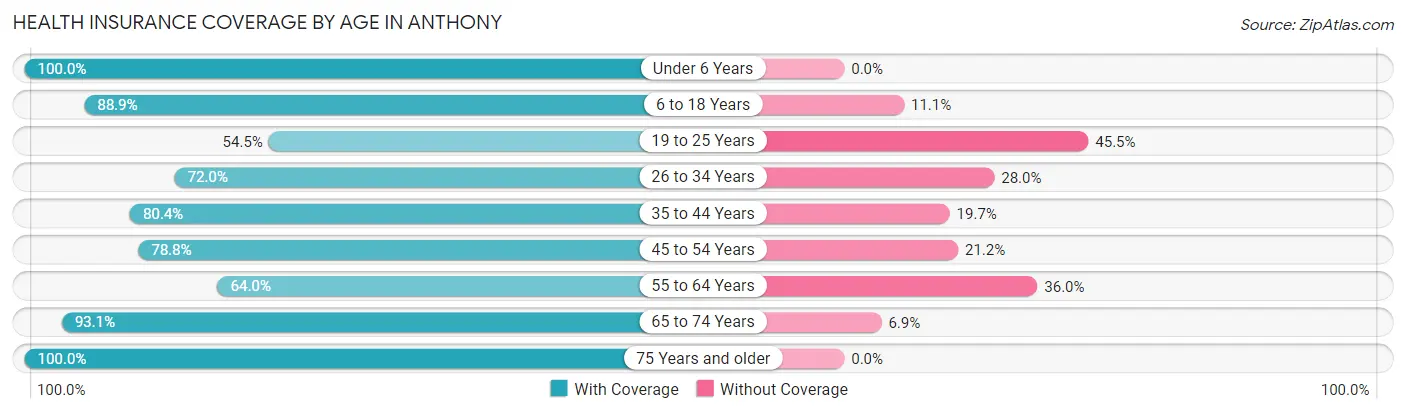
| Age Bracket | With Coverage | Without Coverage |
| Under 6 Years | 477 (100.0%) | 0 (0.0%) |
| 6 to 18 Years | 598 (88.9%) | 75 (11.1%) |
| 19 to 25 Years | 182 (54.5%) | 152 (45.5%) |
| 26 to 34 Years | 443 (72.0%) | 172 (28.0%) |
| 35 to 44 Years | 458 (80.3%) | 112 (19.7%) |
| 45 to 54 Years | 286 (78.8%) | 77 (21.2%) |
| 55 to 64 Years | 176 (64.0%) | 99 (36.0%) |
| 65 to 74 Years | 215 (93.1%) | 16 (6.9%) |
| 75 Years and older | 273 (100.0%) | 0 (0.0%) |
| Total | 3,108 (81.6%) | 703 (18.4%) |
Health Insurance Coverage by Citizenship Status in Anthony
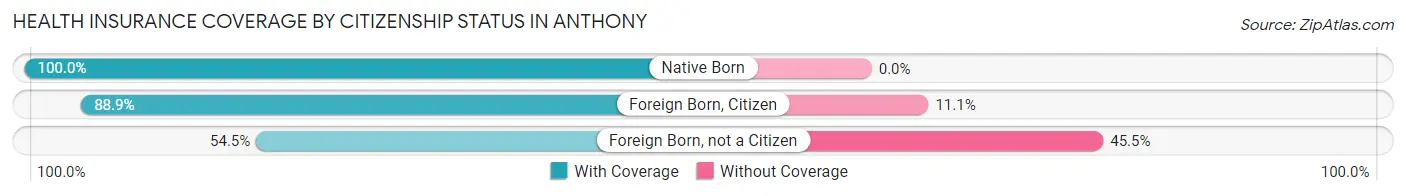
| Citizenship Status | With Coverage | Without Coverage |
| Native Born | 477 (100.0%) | 0 (0.0%) |
| Foreign Born, Citizen | 598 (88.9%) | 75 (11.1%) |
| Foreign Born, not a Citizen | 182 (54.5%) | 152 (45.5%) |
Health Insurance Coverage by Household Income in Anthony
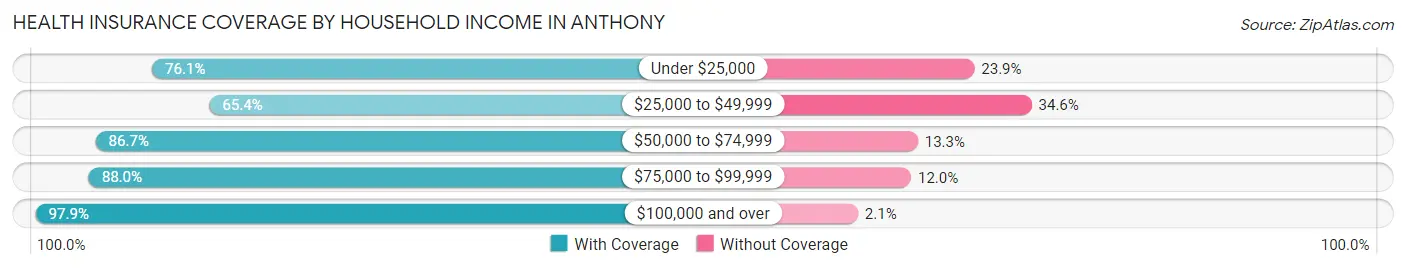
| Household Income | With Coverage | Without Coverage |
| Under $25,000 | 519 (76.1%) | 163 (23.9%) |
| $25,000 to $49,999 | 657 (65.4%) | 348 (34.6%) |
| $50,000 to $74,999 | 567 (86.7%) | 87 (13.3%) |
| $75,000 to $99,999 | 555 (88.0%) | 76 (12.0%) |
| $100,000 and over | 802 (97.9%) | 17 (2.1%) |
Public vs Private Health Insurance Coverage by Age in Anthony
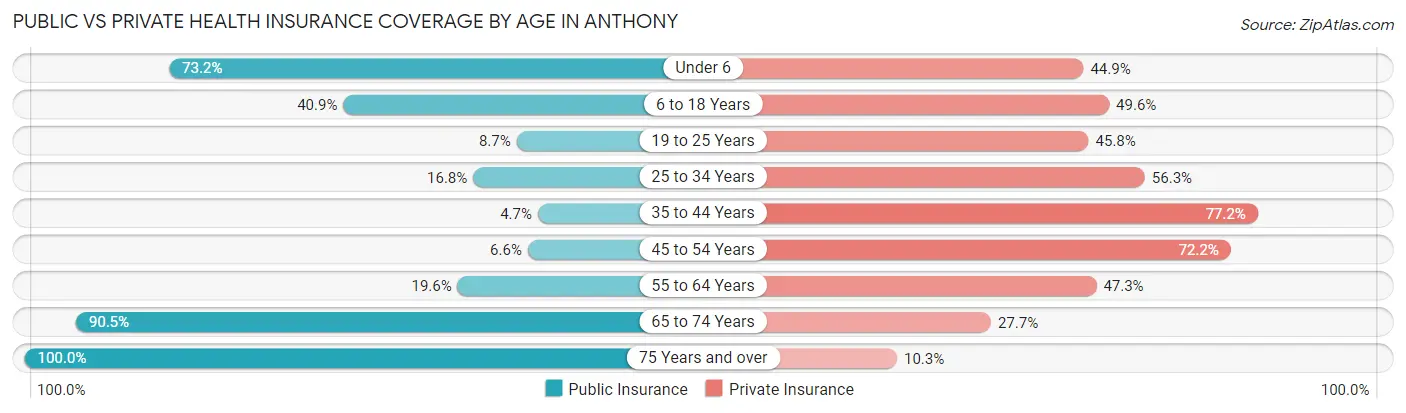
| Age Bracket | Public Insurance | Private Insurance |
| Under 6 | 349 (73.2%) | 214 (44.9%) |
| 6 to 18 Years | 275 (40.9%) | 334 (49.6%) |
| 19 to 25 Years | 29 (8.7%) | 153 (45.8%) |
| 25 to 34 Years | 103 (16.8%) | 346 (56.3%) |
| 35 to 44 Years | 27 (4.7%) | 440 (77.2%) |
| 45 to 54 Years | 24 (6.6%) | 262 (72.2%) |
| 55 to 64 Years | 54 (19.6%) | 130 (47.3%) |
| 65 to 74 Years | 209 (90.5%) | 64 (27.7%) |
| 75 Years and over | 273 (100.0%) | 28 (10.3%) |
| Total | 1,343 (35.2%) | 1,971 (51.7%) |
Disability Status by Sex by Age in Anthony
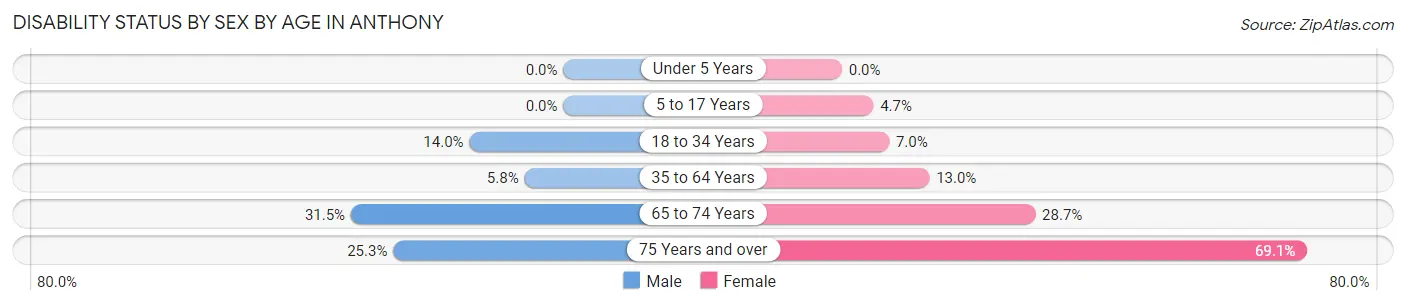
| Age Bracket | Male | Female |
| Under 5 Years | 0 (0.0%) | 0 (0.0%) |
| 5 to 17 Years | 0 (0.0%) | 14 (4.7%) |
| 18 to 34 Years | 65 (14.0%) | 36 (7.0%) |
| 35 to 64 Years | 35 (5.8%) | 78 (13.0%) |
| 65 to 74 Years | 41 (31.5%) | 29 (28.7%) |
| 75 Years and over | 24 (25.3%) | 123 (69.1%) |
Disability Class by Sex by Age in Anthony
Disability Class: Hearing Difficulty
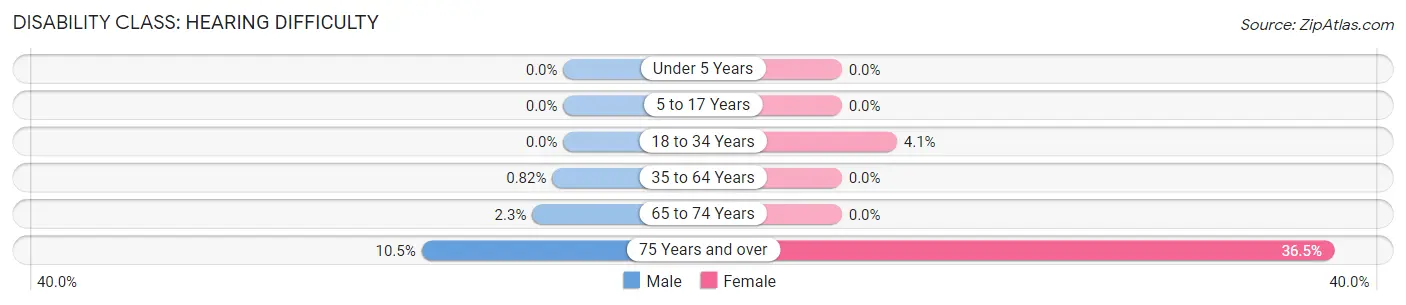
| Age Bracket | Male | Female |
| Under 5 Years | 0 (0.0%) | 0 (0.0%) |
| 5 to 17 Years | 0 (0.0%) | 0 (0.0%) |
| 18 to 34 Years | 0 (0.0%) | 21 (4.1%) |
| 35 to 64 Years | 5 (0.8%) | 0 (0.0%) |
| 65 to 74 Years | 3 (2.3%) | 0 (0.0%) |
| 75 Years and over | 10 (10.5%) | 65 (36.5%) |
Disability Class: Vision Difficulty
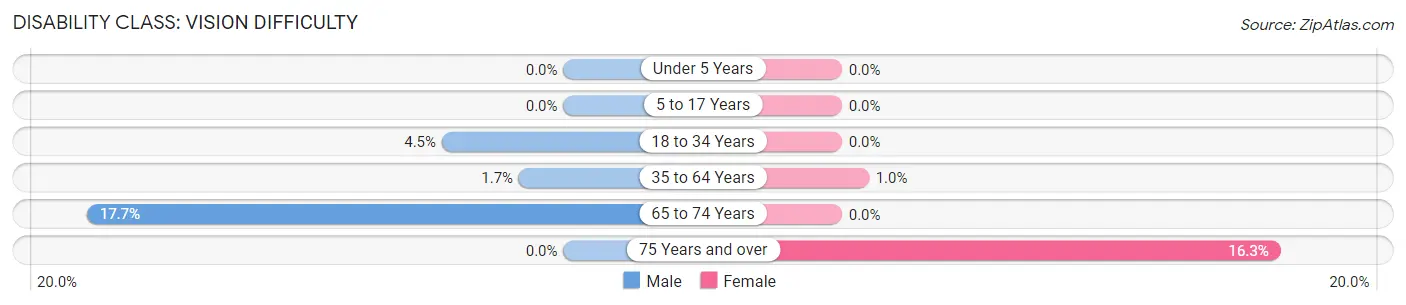
| Age Bracket | Male | Female |
| Under 5 Years | 0 (0.0%) | 0 (0.0%) |
| 5 to 17 Years | 0 (0.0%) | 0 (0.0%) |
| 18 to 34 Years | 21 (4.5%) | 0 (0.0%) |
| 35 to 64 Years | 10 (1.7%) | 6 (1.0%) |
| 65 to 74 Years | 23 (17.7%) | 0 (0.0%) |
| 75 Years and over | 0 (0.0%) | 29 (16.3%) |
Disability Class: Cognitive Difficulty
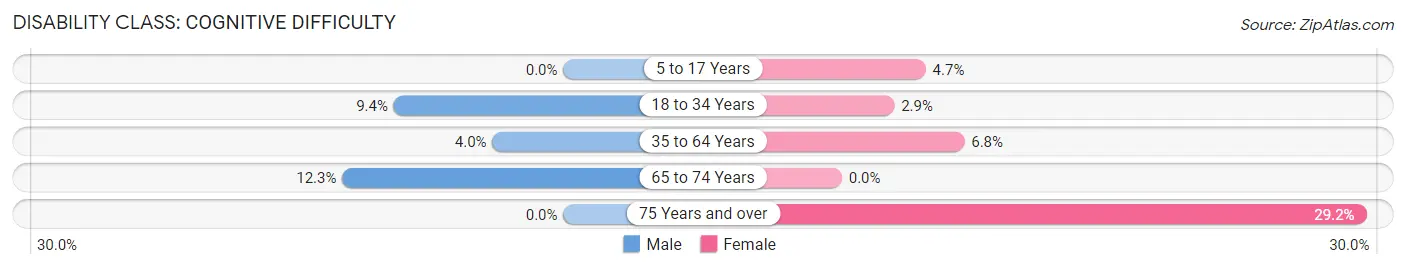
| Age Bracket | Male | Female |
| 5 to 17 Years | 0 (0.0%) | 14 (4.7%) |
| 18 to 34 Years | 44 (9.4%) | 15 (2.9%) |
| 35 to 64 Years | 24 (4.0%) | 41 (6.8%) |
| 65 to 74 Years | 16 (12.3%) | 0 (0.0%) |
| 75 Years and over | 0 (0.0%) | 52 (29.2%) |
Disability Class: Ambulatory Difficulty
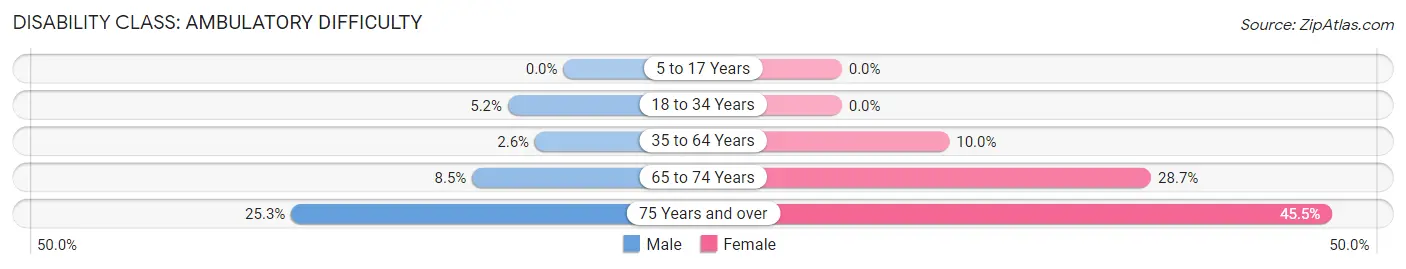
| Age Bracket | Male | Female |
| 5 to 17 Years | 0 (0.0%) | 0 (0.0%) |
| 18 to 34 Years | 24 (5.1%) | 0 (0.0%) |
| 35 to 64 Years | 16 (2.6%) | 60 (10.0%) |
| 65 to 74 Years | 11 (8.5%) | 29 (28.7%) |
| 75 Years and over | 24 (25.3%) | 81 (45.5%) |
Disability Class: Self-Care Difficulty
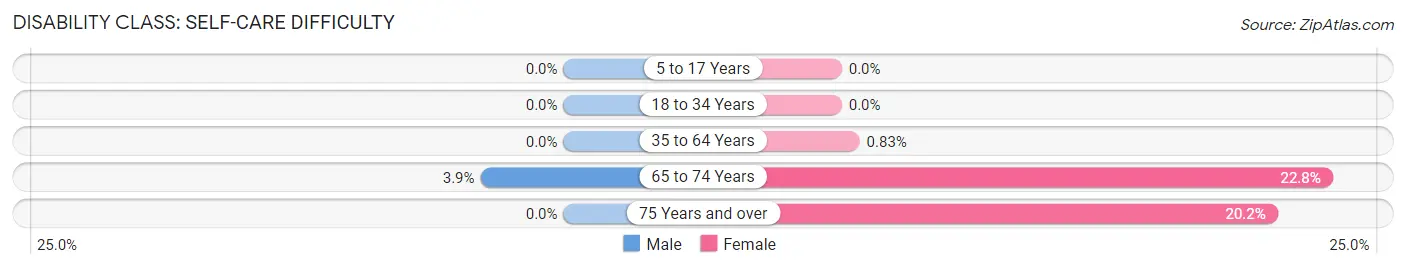
| Age Bracket | Male | Female |
| 5 to 17 Years | 0 (0.0%) | 0 (0.0%) |
| 18 to 34 Years | 0 (0.0%) | 0 (0.0%) |
| 35 to 64 Years | 0 (0.0%) | 5 (0.8%) |
| 65 to 74 Years | 5 (3.8%) | 23 (22.8%) |
| 75 Years and over | 0 (0.0%) | 36 (20.2%) |
Technology Access in Anthony
Computing Device Access in Anthony
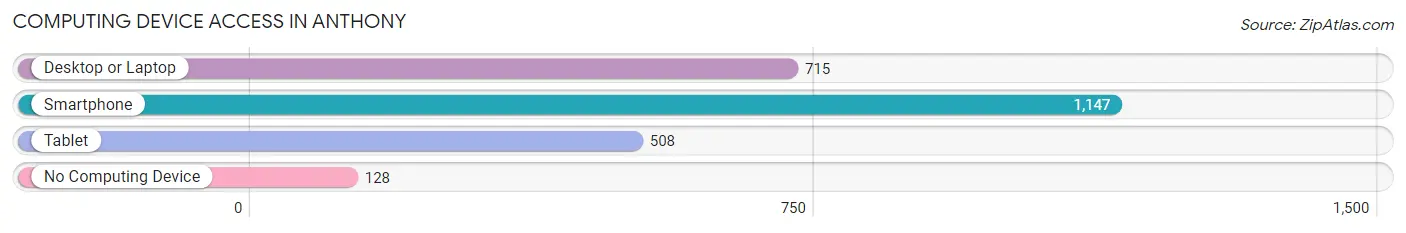
| Device Type | # Households | % Households |
| Desktop or Laptop | 715 | 54.6% |
| Smartphone | 1,147 | 87.6% |
| Tablet | 508 | 38.8% |
| No Computing Device | 128 | 9.8% |
| Total | 1,309 | 100.0% |
Internet Access in Anthony
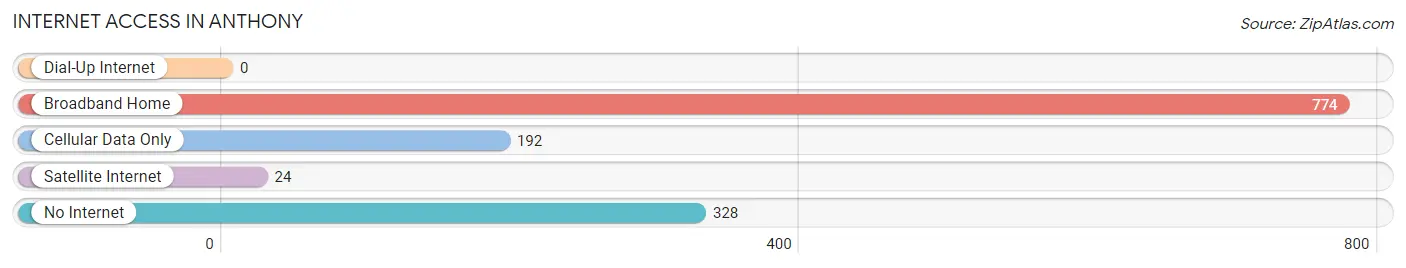
| Internet Type | # Households | % Households |
| Dial-Up Internet | 0 | 0.0% |
| Broadband Home | 774 | 59.1% |
| Cellular Data Only | 192 | 14.7% |
| Satellite Internet | 24 | 1.8% |
| No Internet | 328 | 25.1% |
| Total | 1,309 | 100.0% |
Anthony Summary
Anthony, Texas is a small city located in El Paso County, Texas. It is situated on the western edge of the state, just south of the New Mexico border. The city is part of the El Paso metropolitan area, and is home to a population of approximately 8,000 people.
History
The area that is now Anthony, Texas was first settled in the late 1800s by ranchers and farmers. The town was officially established in 1881, when the El Paso and Northeastern Railway was built through the area. The town was named after a local rancher, Anthony B. Cox.
In the early 1900s, the town began to grow and develop. The first school was built in 1906, and the first post office was established in 1907. The town was incorporated in 1910, and the first mayor was elected in 1911.
In the 1920s, the town experienced a period of growth and prosperity. The population increased from 1,000 to 2,000, and several businesses opened in the area. The town also saw the construction of a new school and a new library.
In the 1950s, the town experienced a period of decline. The population decreased from 2,000 to 1,000, and many businesses closed. The town was also affected by the construction of Interstate 10, which bypassed the town.
In the late 1970s, the town began to experience a period of revitalization. The population increased from 1,000 to 8,000, and several new businesses opened in the area. The town also saw the construction of a new library and a new school.
Geography
Anthony, Texas is located in El Paso County, Texas. It is situated on the western edge of the state, just south of the New Mexico border. The city is part of the El Paso metropolitan area, and is home to a population of approximately 8,000 people.
The city is located in the Chihuahuan Desert, and is characterized by hot, dry summers and mild winters. The average annual temperature is 68 degrees Fahrenheit, and the average annual precipitation is 8.5 inches.
Economy
The economy of Anthony, Texas is largely based on agriculture and tourism. The city is home to several farms and ranches, and is a popular destination for tourists. The city is also home to several small businesses, including restaurants, retail stores, and service providers.
The city is also home to several manufacturing companies, including a plastics factory and a metal fabrication plant. The city is also home to a number of government offices, including the El Paso County Courthouse and the El Paso County Sheriff's Office.
Demographics
As of the 2010 census, the population of Anthony, Texas was 8,000. The racial makeup of the city was 79.3% White, 0.7% African American, 0.3% Native American, 0.2% Asian, 0.1% Pacific Islander, 17.2% from other races, and 2.4% from two or more races. Hispanic or Latino of any race were 95.2% of the population.
The median household income in Anthony, Texas was $30,000, and the median family income was $32,000. The per capita income was $14,000. About 24.3% of the population was below the poverty line.
Common Questions
What is Per Capita Income in Anthony?
Per Capita income in Anthony is $21,304.
What is the Median Family Income in Anthony?
Median Family Income in Anthony is $51,125.
What is the Median Household income in Anthony?
Median Household Income in Anthony is $48,934.
What is Income or Wage Gap in Anthony?
Income or Wage Gap in Anthony is 37.8%.
Women in Anthony earn 62.2 cents for every dollar earned by a man.
What is Family Income Deficit in Anthony?
Family Income Deficit in Anthony is $7,755.
Families that are below poverty line in Anthony earn $7,755 less on average than the poverty threshold level.
What is Inequality or Gini Index in Anthony?
Inequality or Gini Index in Anthony is 0.41.
What is the Total Population of Anthony?
Total Population of Anthony is 3,811.
What is the Total Male Population of Anthony?
Total Male Population of Anthony is 1,993.
What is the Total Female Population of Anthony?
Total Female Population of Anthony is 1,818.
What is the Ratio of Males per 100 Females in Anthony?
There are 109.63 Males per 100 Females in Anthony.
What is the Ratio of Females per 100 Males in Anthony?
There are 91.22 Females per 100 Males in Anthony.
What is the Median Population Age in Anthony?
Median Population Age in Anthony is 32.0 Years.
What is the Average Family Size in Anthony
Average Family Size in Anthony is 3.3 People.
What is the Average Household Size in Anthony
Average Household Size in Anthony is 2.9 People.
How Large is the Labor Force in Anthony?
There are 1,726 People in the Labor Forcein in Anthony.
What is the Percentage of People in the Labor Force in Anthony?
61.5% of People are in the Labor Force in Anthony.
What is the Unemployment Rate in Anthony?
Unemployment Rate in Anthony is 5.7%.