Zip Codes with the Highest Percentage of Population with a Degree in Engineering in Tennessee
RELATED REPORTS & OPTIONS
Engineering
Tennessee
Compare Zip Codes
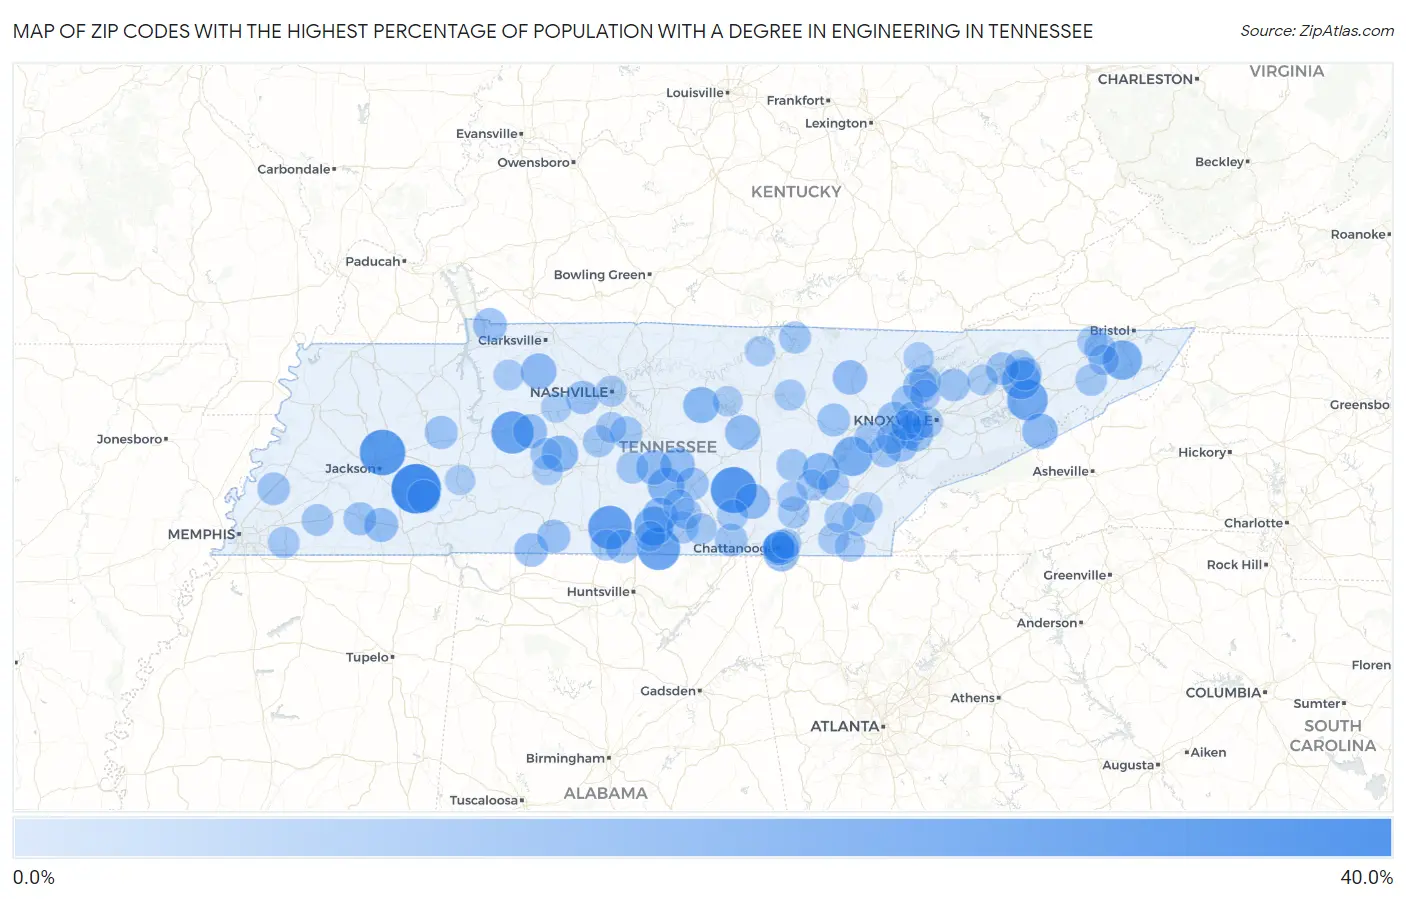
Map of Zip Codes with the Highest Percentage of Population with a Degree in Engineering in Tennessee
0.0%
40.0%
Zip Codes with the Highest Percentage of Population with a Degree in Engineering in Tennessee
| Zip Code | % Graduates | vs State | vs National | |
| 1. | 38347 | 37.5% | 6.2%(+31.3)#1 | 7.6%(+29.9)#240 |
| 2. | 37305 | 32.1% | 6.2%(+26.0)#2 | 7.6%(+24.5)#328 |
| 3. | 38362 | 31.6% | 6.2%(+25.4)#3 | 7.6%(+23.9)#339 |
| 4. | 38459 | 28.6% | 6.2%(+22.4)#4 | 7.6%(+20.9)#409 |
| 5. | 37328 | 27.4% | 6.2%(+21.2)#5 | 7.6%(+19.7)#450 |
| 6. | 37140 | 26.9% | 6.2%(+20.7)#6 | 7.6%(+19.2)#468 |
| 7. | 37713 | 24.4% | 6.2%(+18.2)#7 | 7.6%(+16.8)#581 |
| 8. | 37880 | 22.4% | 6.2%(+16.2)#8 | 7.6%(+14.7)#692 |
| 9. | 37359 | 22.3% | 6.2%(+16.1)#9 | 7.6%(+14.6)#698 |
| 10. | 37694 | 22.2% | 6.2%(+16.1)#10 | 7.6%(+14.6)#699 |
| 11. | 37860 | 21.5% | 6.2%(+15.3)#11 | 7.6%(+13.8)#764 |
| 12. | 37183 | 18.8% | 6.2%(+12.6)#12 | 7.6%(+11.1)#1,065 |
| 13. | 37332 | 18.6% | 6.2%(+12.5)#13 | 7.6%(+11.0)#1,077 |
| 14. | 38487 | 18.2% | 6.2%(+12.0)#14 | 7.6%(+10.5)#1,135 |
| 15. | 37012 | 17.6% | 6.2%(+11.4)#15 | 7.6%(+9.95)#1,208 |
| 16. | 37051 | 17.2% | 6.2%(+11.0)#16 | 7.6%(+9.57)#1,277 |
| 17. | 37727 | 17.1% | 6.2%(+11.0)#17 | 7.6%(+9.50)#1,289 |
| 18. | 37365 | 16.5% | 6.2%(+10.3)#18 | 7.6%(+8.87)#1,396 |
| 19. | 37407 | 16.5% | 6.2%(+10.3)#19 | 7.6%(+8.87)#1,397 |
| 20. | 37403 | 16.4% | 6.2%(+10.3)#20 | 7.6%(+8.80)#1,411 |
| 21. | 37352 | 16.3% | 6.2%(+10.1)#21 | 7.6%(+8.60)#1,447 |
| 22. | 38587 | 16.2% | 6.2%(+9.99)#22 | 7.6%(+8.52)#1,469 |
| 23. | 37020 | 16.0% | 6.2%(+9.79)#23 | 7.6%(+8.32)#1,504 |
| 24. | 37018 | 15.8% | 6.2%(+9.66)#24 | 7.6%(+8.19)#1,531 |
| 25. | 37872 | 15.4% | 6.2%(+9.20)#25 | 7.6%(+7.74)#1,645 |
| 26. | 37137 | 14.8% | 6.2%(+8.63)#26 | 7.6%(+7.17)#1,790 |
| 27. | 38044 | 14.8% | 6.2%(+8.57)#27 | 7.6%(+7.11)#1,814 |
| 28. | 37828 | 14.6% | 6.2%(+8.43)#28 | 7.6%(+6.96)#1,839 |
| 29. | 37028 | 14.5% | 6.2%(+8.29)#29 | 7.6%(+6.83)#1,877 |
| 30. | 38481 | 14.3% | 6.2%(+8.10)#30 | 7.6%(+6.64)#1,934 |
| 31. | 38488 | 14.2% | 6.2%(+8.03)#31 | 7.6%(+6.56)#1,963 |
| 32. | 37830 | 14.2% | 6.2%(+8.00)#32 | 7.6%(+6.54)#1,969 |
| 33. | 37934 | 14.1% | 6.2%(+7.88)#33 | 7.6%(+6.41)#1,994 |
| 34. | 37772 | 14.0% | 6.2%(+7.79)#34 | 7.6%(+6.32)#2,022 |
| 35. | 37408 | 13.9% | 6.2%(+7.70)#35 | 7.6%(+6.24)#2,066 |
| 36. | 37891 | 13.8% | 6.2%(+7.63)#36 | 7.6%(+6.16)#2,096 |
| 37. | 38468 | 13.8% | 6.2%(+7.57)#37 | 7.6%(+6.10)#2,117 |
| 38. | 37143 | 13.7% | 6.2%(+7.53)#38 | 7.6%(+6.07)#2,135 |
| 39. | 37922 | 13.5% | 6.2%(+7.32)#39 | 7.6%(+5.86)#2,216 |
| 40. | 38387 | 13.5% | 6.2%(+7.28)#40 | 7.6%(+5.81)#2,238 |
| 41. | 38008 | 13.4% | 6.2%(+7.21)#41 | 7.6%(+5.74)#2,260 |
| 42. | 38332 | 13.3% | 6.2%(+7.07)#42 | 7.6%(+5.61)#2,325 |
| 43. | 37723 | 13.1% | 6.2%(+6.93)#43 | 7.6%(+5.47)#2,362 |
| 44. | 37708 | 13.0% | 6.2%(+6.83)#44 | 7.6%(+5.37)#2,401 |
| 45. | 37380 | 12.8% | 6.2%(+6.63)#45 | 7.6%(+5.17)#2,489 |
| 46. | 38011 | 12.7% | 6.2%(+6.54)#46 | 7.6%(+5.07)#2,527 |
| 47. | 37355 | 12.7% | 6.2%(+6.49)#47 | 7.6%(+5.02)#2,554 |
| 48. | 37779 | 12.6% | 6.2%(+6.46)#48 | 7.6%(+5.00)#2,562 |
| 49. | 37705 | 12.3% | 6.2%(+6.08)#49 | 7.6%(+4.61)#2,771 |
| 50. | 37014 | 12.2% | 6.2%(+6.02)#50 | 7.6%(+4.55)#2,800 |
| 51. | 37774 | 12.1% | 6.2%(+5.93)#51 | 7.6%(+4.47)#2,837 |
| 52. | 37180 | 12.0% | 6.2%(+5.78)#52 | 7.6%(+4.31)#2,916 |
| 53. | 38549 | 11.9% | 6.2%(+5.73)#53 | 7.6%(+4.27)#2,938 |
| 54. | 37325 | 11.9% | 6.2%(+5.68)#54 | 7.6%(+4.22)#2,967 |
| 55. | 37663 | 11.7% | 6.2%(+5.56)#55 | 7.6%(+4.10)#3,031 |
| 56. | 37398 | 11.7% | 6.2%(+5.54)#56 | 7.6%(+4.07)#3,044 |
| 57. | 37716 | 11.7% | 6.2%(+5.53)#57 | 7.6%(+4.06)#3,047 |
| 58. | 37367 | 11.7% | 6.2%(+5.50)#58 | 7.6%(+4.04)#3,058 |
| 59. | 37179 | 11.6% | 6.2%(+5.39)#59 | 7.6%(+3.92)#3,126 |
| 60. | 38068 | 11.5% | 6.2%(+5.27)#60 | 7.6%(+3.81)#3,210 |
| 61. | 37931 | 11.4% | 6.2%(+5.20)#61 | 7.6%(+3.74)#3,262 |
| 62. | 37690 | 11.4% | 6.2%(+5.20)#62 | 7.6%(+3.73)#3,263 |
| 63. | 38454 | 11.4% | 6.2%(+5.20)#63 | 7.6%(+3.73)#3,266 |
| 64. | 38017 | 11.3% | 6.2%(+5.12)#64 | 7.6%(+3.65)#3,331 |
| 65. | 37379 | 11.3% | 6.2%(+5.10)#65 | 7.6%(+3.64)#3,337 |
| 66. | 37923 | 11.2% | 6.2%(+5.02)#66 | 7.6%(+3.56)#3,401 |
| 67. | 37402 | 11.2% | 6.2%(+5.02)#67 | 7.6%(+3.56)#3,404 |
| 68. | 37763 | 10.8% | 6.2%(+4.67)#68 | 7.6%(+3.20)#3,655 |
| 69. | 37387 | 10.7% | 6.2%(+4.55)#69 | 7.6%(+3.08)#3,752 |
| 70. | 37388 | 10.7% | 6.2%(+4.55)#70 | 7.6%(+3.08)#3,753 |
| 71. | 37321 | 10.7% | 6.2%(+4.52)#71 | 7.6%(+3.05)#3,779 |
| 72. | 37330 | 10.7% | 6.2%(+4.51)#72 | 7.6%(+3.04)#3,794 |
| 73. | 38449 | 10.7% | 6.2%(+4.49)#73 | 7.6%(+3.02)#3,808 |
| 74. | 37318 | 10.6% | 6.2%(+4.38)#74 | 7.6%(+2.92)#3,916 |
| 75. | 37323 | 10.6% | 6.2%(+4.38)#75 | 7.6%(+2.91)#3,922 |
| 76. | 38574 | 10.5% | 6.2%(+4.36)#76 | 7.6%(+2.89)#3,937 |
| 77. | 37219 | 10.4% | 6.2%(+4.27)#77 | 7.6%(+2.80)#4,023 |
| 78. | 37310 | 10.3% | 6.2%(+4.16)#78 | 7.6%(+2.70)#4,131 |
| 79. | 37909 | 10.3% | 6.2%(+4.14)#79 | 7.6%(+2.68)#4,153 |
| 80. | 37067 | 10.2% | 6.2%(+3.98)#80 | 7.6%(+2.51)#4,305 |
| 81. | 37061 | 10.0% | 6.2%(+3.82)#81 | 7.6%(+2.35)#4,439 |
| 82. | 37362 | 10.0% | 6.2%(+3.82)#82 | 7.6%(+2.35)#4,441 |
| 83. | 37861 | 10.0% | 6.2%(+3.80)#83 | 7.6%(+2.34)#4,476 |
| 84. | 37338 | 9.9% | 6.2%(+3.72)#84 | 7.6%(+2.25)#4,531 |
| 85. | 37322 | 9.8% | 6.2%(+3.63)#85 | 7.6%(+2.16)#4,615 |
| 86. | 38461 | 9.8% | 6.2%(+3.62)#86 | 7.6%(+2.16)#4,619 |
| 87. | 37615 | 9.8% | 6.2%(+3.61)#87 | 7.6%(+2.14)#4,636 |
| 88. | 37754 | 9.8% | 6.2%(+3.59)#88 | 7.6%(+2.13)#4,653 |
| 89. | 37771 | 9.7% | 6.2%(+3.52)#89 | 7.6%(+2.05)#4,751 |
| 90. | 37331 | 9.7% | 6.2%(+3.51)#90 | 7.6%(+2.04)#4,759 |
| 91. | 37766 | 9.7% | 6.2%(+3.48)#91 | 7.6%(+2.02)#4,788 |
| 92. | 37660 | 9.6% | 6.2%(+3.42)#92 | 7.6%(+1.96)#4,860 |
| 93. | 37811 | 9.6% | 6.2%(+3.38)#93 | 7.6%(+1.92)#4,904 |
| 94. | 37348 | 9.6% | 6.2%(+3.38)#94 | 7.6%(+1.91)#4,912 |
| 95. | 37029 | 9.5% | 6.2%(+3.35)#95 | 7.6%(+1.88)#4,938 |
| 96. | 38582 | 9.5% | 6.2%(+3.33)#96 | 7.6%(+1.86)#4,965 |
| 97. | 38568 | 9.5% | 6.2%(+3.31)#97 | 7.6%(+1.84)#4,984 |
| 98. | 38329 | 9.5% | 6.2%(+3.30)#98 | 7.6%(+1.83)#5,002 |
| 99. | 37932 | 9.4% | 6.2%(+3.23)#99 | 7.6%(+1.76)#5,079 |
| 100. | 37406 | 9.4% | 6.2%(+3.23)#100 | 7.6%(+1.76)#5,080 |
Common Questions
What are the Top 10 Zip Codes with the Highest Percentage of Population with a Degree in Engineering in Tennessee?
Top 10 Zip Codes with the Highest Percentage of Population with a Degree in Engineering in Tennessee are:
What zip code has the Highest Percentage of Population with a Degree in Engineering in Tennessee?
38347 has the Highest Percentage of Population with a Degree in Engineering in Tennessee with 37.5%.
What is the Percentage of Population with a Degree in Engineering in the State of Tennessee?
Percentage of Population with a Degree in Engineering in Tennessee is 6.2%.
What is the Percentage of Population with a Degree in Engineering in the United States?
Percentage of Population with a Degree in Engineering in the United States is 7.6%.