Zip Codes with the Highest Percentage of Households with Income Below $10,000 in Tennessee
RELATED REPORTS & OPTIONS
Household Income | $0-10k
Tennessee
Compare Zip Codes
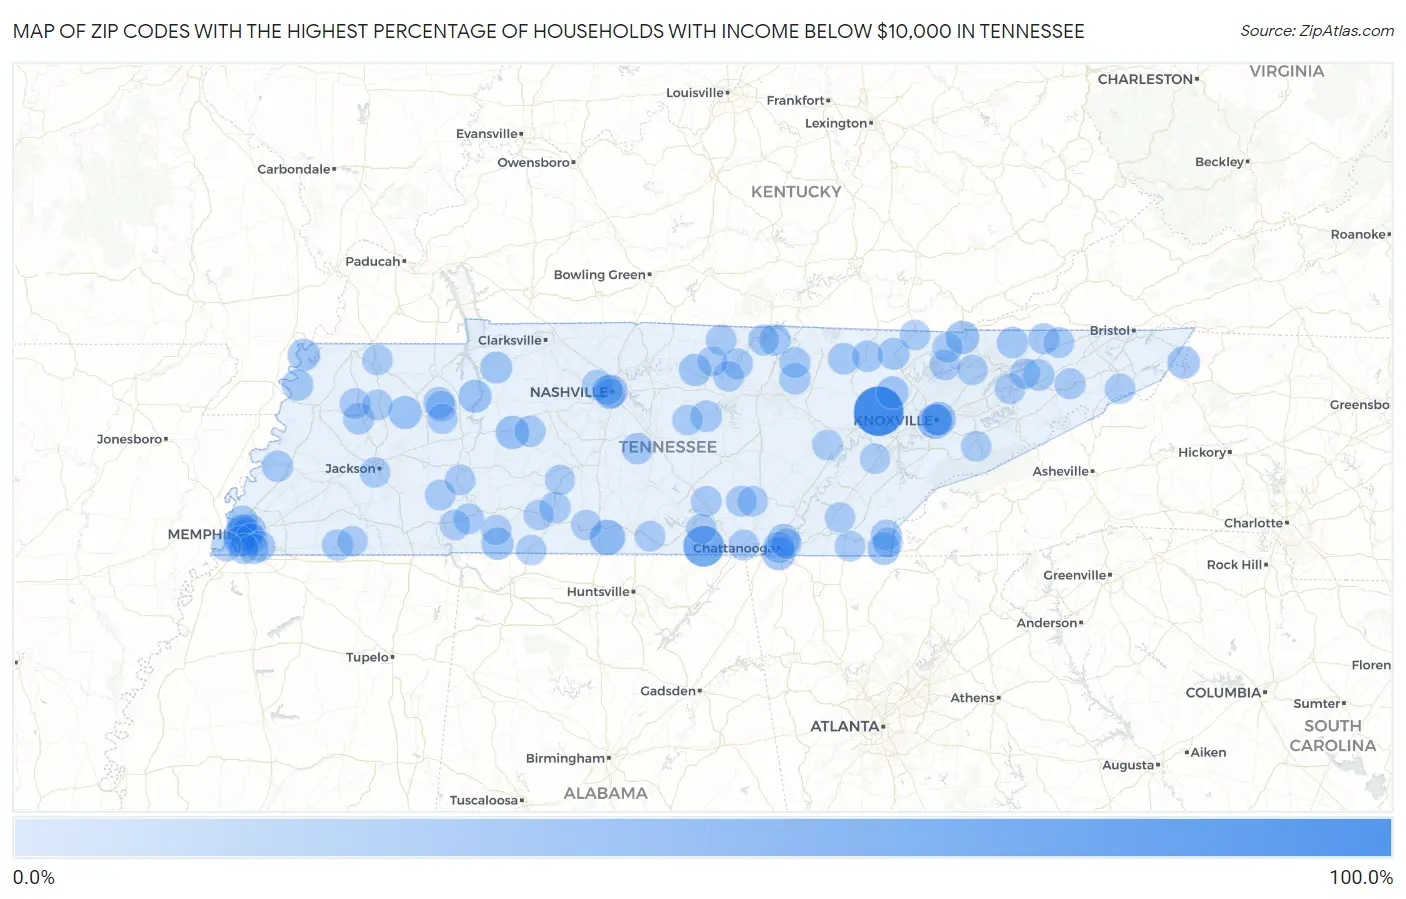
Map of Zip Codes with the Highest Percentage of Households with Income Below $10,000 in Tennessee
0.0%
100.0%
Zip Codes with the Highest Percentage of Households with Income Below $10,000 in Tennessee
| Zip Code | Households with Income < $10k | vs State | vs National | |
| 1. | 37719 | 100.0% | 5.3%(+94.7)#1 | 4.9%(+95.1)#31 |
| 2. | 37376 | 57.6% | 5.3%(+52.3)#2 | 4.9%(+52.7)#84 |
| 3. | 38453 | 32.8% | 5.3%(+27.5)#3 | 4.9%(+27.9)#275 |
| 4. | 37916 | 30.4% | 5.3%(+25.1)#4 | 4.9%(+25.5)#318 |
| 5. | 37915 | 25.2% | 5.3%(+19.9)#5 | 4.9%(+20.3)#477 |
| 6. | 37724 | 23.6% | 5.3%(+18.3)#6 | 4.9%(+18.7)#551 |
| 7. | 37140 | 23.3% | 5.3%(+18.0)#7 | 4.9%(+18.4)#572 |
| 8. | 37410 | 21.9% | 5.3%(+16.6)#8 | 4.9%(+17.0)#642 |
| 9. | 38258 | 21.4% | 5.3%(+16.1)#9 | 4.9%(+16.5)#681 |
| 10. | 38333 | 21.2% | 5.3%(+15.9)#10 | 4.9%(+16.3)#696 |
| 11. | 37201 | 20.9% | 5.3%(+15.6)#11 | 4.9%(+16.0)#710 |
| 12. | 37691 | 19.4% | 5.3%(+14.1)#12 | 4.9%(+14.5)#858 |
| 13. | 38126 | 19.2% | 5.3%(+13.9)#13 | 4.9%(+14.3)#881 |
| 14. | 37710 | 19.0% | 5.3%(+13.7)#14 | 4.9%(+14.1)#901 |
| 15. | 38079 | 18.7% | 5.3%(+13.4)#15 | 4.9%(+13.8)#929 |
| 16. | 37326 | 18.7% | 5.3%(+13.4)#16 | 4.9%(+13.8)#930 |
| 17. | 37151 | 18.2% | 5.3%(+12.9)#17 | 4.9%(+13.3)#1,003 |
| 18. | 38452 | 17.9% | 5.3%(+12.6)#18 | 4.9%(+13.0)#1,039 |
| 19. | 38105 | 17.8% | 5.3%(+12.5)#19 | 4.9%(+12.9)#1,046 |
| 20. | 37351 | 17.6% | 5.3%(+12.3)#20 | 4.9%(+12.7)#1,081 |
| 21. | 38114 | 17.0% | 5.3%(+11.7)#21 | 4.9%(+12.1)#1,161 |
| 22. | 37178 | 16.8% | 5.3%(+11.5)#22 | 4.9%(+11.9)#1,190 |
| 23. | 38108 | 16.6% | 5.3%(+11.3)#23 | 4.9%(+11.7)#1,230 |
| 24. | 37847 | 16.4% | 5.3%(+11.1)#24 | 4.9%(+11.5)#1,263 |
| 25. | 37402 | 15.3% | 5.3%(+10.00)#25 | 4.9%(+10.4)#1,455 |
| 26. | 38541 | 15.3% | 5.3%(+10.00)#26 | 4.9%(+10.4)#1,459 |
| 27. | 38080 | 15.2% | 5.3%(+9.90)#27 | 4.9%(+10.3)#1,482 |
| 28. | 37095 | 15.0% | 5.3%(+9.70)#28 | 4.9%(+10.1)#1,522 |
| 29. | 37711 | 14.9% | 5.3%(+9.60)#29 | 4.9%(+10.00)#1,546 |
| 30. | 38504 | 14.7% | 5.3%(+9.40)#30 | 4.9%(+9.80)#1,608 |
| 31. | 38112 | 14.6% | 5.3%(+9.30)#31 | 4.9%(+9.70)#1,615 |
| 32. | 38107 | 14.5% | 5.3%(+9.20)#32 | 4.9%(+9.60)#1,644 |
| 33. | 37755 | 14.2% | 5.3%(+8.90)#33 | 4.9%(+9.30)#1,722 |
| 34. | 37869 | 14.0% | 5.3%(+8.70)#34 | 4.9%(+9.10)#1,765 |
| 35. | 38382 | 13.6% | 5.3%(+8.30)#35 | 4.9%(+8.70)#1,880 |
| 36. | 38456 | 13.6% | 5.3%(+8.30)#36 | 4.9%(+8.70)#1,885 |
| 37. | 37902 | 13.6% | 5.3%(+8.30)#37 | 4.9%(+8.70)#1,888 |
| 38. | 38554 | 13.6% | 5.3%(+8.30)#38 | 4.9%(+8.70)#1,895 |
| 39. | 38041 | 13.5% | 5.3%(+8.20)#39 | 4.9%(+8.60)#1,920 |
| 40. | 37137 | 13.5% | 5.3%(+8.20)#40 | 4.9%(+8.60)#1,926 |
| 41. | 37153 | 13.3% | 5.3%(+8.00)#41 | 4.9%(+8.40)#1,983 |
| 42. | 38039 | 13.0% | 5.3%(+7.70)#42 | 4.9%(+8.10)#2,086 |
| 43. | 38342 | 12.9% | 5.3%(+7.60)#43 | 4.9%(+8.00)#2,132 |
| 44. | 38127 | 12.5% | 5.3%(+7.20)#44 | 4.9%(+7.60)#2,250 |
| 45. | 38551 | 12.4% | 5.3%(+7.10)#45 | 4.9%(+7.50)#2,304 |
| 46. | 37731 | 12.3% | 5.3%(+7.00)#46 | 4.9%(+7.40)#2,355 |
| 47. | 38543 | 12.2% | 5.3%(+6.90)#47 | 4.9%(+7.30)#2,394 |
| 48. | 38562 | 12.1% | 5.3%(+6.80)#48 | 4.9%(+7.20)#2,416 |
| 49. | 37616 | 12.1% | 5.3%(+6.80)#49 | 4.9%(+7.20)#2,420 |
| 50. | 37347 | 11.9% | 5.3%(+6.60)#50 | 4.9%(+7.00)#2,513 |
| 51. | 37333 | 11.8% | 5.3%(+6.50)#51 | 4.9%(+6.90)#2,573 |
| 52. | 37406 | 11.5% | 5.3%(+6.20)#52 | 4.9%(+6.60)#2,677 |
| 53. | 38330 | 11.5% | 5.3%(+6.20)#53 | 4.9%(+6.60)#2,688 |
| 54. | 38317 | 11.5% | 5.3%(+6.20)#54 | 4.9%(+6.60)#2,695 |
| 55. | 38106 | 11.4% | 5.3%(+6.10)#55 | 4.9%(+6.50)#2,725 |
| 56. | 37339 | 11.3% | 5.3%(+6.00)#56 | 4.9%(+6.40)#2,809 |
| 57. | 37218 | 11.2% | 5.3%(+5.90)#57 | 4.9%(+6.30)#2,842 |
| 58. | 37873 | 11.2% | 5.3%(+5.90)#58 | 4.9%(+6.30)#2,855 |
| 59. | 38111 | 11.1% | 5.3%(+5.80)#59 | 4.9%(+6.20)#2,880 |
| 60. | 38115 | 11.0% | 5.3%(+5.70)#60 | 4.9%(+6.10)#2,945 |
| 61. | 37016 | 11.0% | 5.3%(+5.70)#61 | 4.9%(+6.10)#2,985 |
| 62. | 37150 | 10.9% | 5.3%(+5.60)#62 | 4.9%(+6.00)#3,020 |
| 63. | 37365 | 10.9% | 5.3%(+5.60)#63 | 4.9%(+6.00)#3,028 |
| 64. | 37337 | 10.9% | 5.3%(+5.60)#64 | 4.9%(+6.00)#3,034 |
| 65. | 37813 | 10.8% | 5.3%(+5.50)#65 | 4.9%(+5.90)#3,069 |
| 66. | 38475 | 10.8% | 5.3%(+5.50)#66 | 4.9%(+5.90)#3,097 |
| 67. | 38237 | 10.7% | 5.3%(+5.40)#67 | 4.9%(+5.80)#3,122 |
| 68. | 38564 | 10.7% | 5.3%(+5.40)#68 | 4.9%(+5.80)#3,156 |
| 69. | 37342 | 10.6% | 5.3%(+5.30)#69 | 4.9%(+5.70)#3,194 |
| 70. | 38118 | 10.4% | 5.3%(+5.10)#70 | 4.9%(+5.50)#3,287 |
| 71. | 37203 | 10.4% | 5.3%(+5.10)#71 | 4.9%(+5.50)#3,299 |
| 72. | 37863 | 10.4% | 5.3%(+5.10)#72 | 4.9%(+5.50)#3,312 |
| 73. | 38316 | 10.4% | 5.3%(+5.10)#73 | 4.9%(+5.50)#3,323 |
| 74. | 37866 | 10.4% | 5.3%(+5.10)#74 | 4.9%(+5.50)#3,327 |
| 75. | 38371 | 10.4% | 5.3%(+5.10)#75 | 4.9%(+5.50)#3,336 |
| 76. | 37348 | 10.3% | 5.3%(+5.00)#76 | 4.9%(+5.40)#3,401 |
| 77. | 37891 | 10.2% | 5.3%(+4.90)#77 | 4.9%(+5.30)#3,448 |
| 78. | 38329 | 10.2% | 5.3%(+4.90)#78 | 4.9%(+5.30)#3,450 |
| 79. | 38372 | 10.1% | 5.3%(+4.80)#79 | 4.9%(+5.20)#3,503 |
| 80. | 37310 | 10.1% | 5.3%(+4.80)#80 | 4.9%(+5.20)#3,518 |
| 81. | 37362 | 10.1% | 5.3%(+4.80)#81 | 4.9%(+5.20)#3,521 |
| 82. | 37318 | 10.1% | 5.3%(+4.80)#82 | 4.9%(+5.20)#3,529 |
| 83. | 37391 | 10.1% | 5.3%(+4.80)#83 | 4.9%(+5.20)#3,535 |
| 84. | 38450 | 10.0% | 5.3%(+4.70)#84 | 4.9%(+5.10)#3,597 |
| 85. | 38481 | 10.0% | 5.3%(+4.70)#85 | 4.9%(+5.10)#3,618 |
| 86. | 38116 | 9.9% | 5.3%(+4.60)#86 | 4.9%(+5.00)#3,640 |
| 87. | 38301 | 9.9% | 5.3%(+4.60)#87 | 4.9%(+5.00)#3,644 |
| 88. | 37846 | 9.9% | 5.3%(+4.60)#88 | 4.9%(+5.00)#3,666 |
| 89. | 37762 | 9.9% | 5.3%(+4.60)#89 | 4.9%(+5.00)#3,678 |
| 90. | 38478 | 9.8% | 5.3%(+4.50)#90 | 4.9%(+4.90)#3,717 |
| 91. | 37692 | 9.8% | 5.3%(+4.50)#91 | 4.9%(+4.90)#3,747 |
| 92. | 37888 | 9.8% | 5.3%(+4.50)#92 | 4.9%(+4.90)#3,753 |
| 93. | 38109 | 9.6% | 5.3%(+4.30)#93 | 4.9%(+4.70)#3,866 |
| 94. | 37208 | 9.6% | 5.3%(+4.30)#94 | 4.9%(+4.70)#3,877 |
| 95. | 38067 | 9.6% | 5.3%(+4.30)#95 | 4.9%(+4.70)#3,917 |
| 96. | 37870 | 9.5% | 5.3%(+4.20)#96 | 4.9%(+4.60)#3,980 |
| 97. | 38318 | 9.4% | 5.3%(+4.10)#97 | 4.9%(+4.50)#4,076 |
| 98. | 38464 | 9.3% | 5.3%(+4.00)#98 | 4.9%(+4.40)#4,104 |
| 99. | 38474 | 9.3% | 5.3%(+4.00)#99 | 4.9%(+4.40)#4,119 |
| 100. | 37145 | 9.3% | 5.3%(+4.00)#100 | 4.9%(+4.40)#4,138 |
Common Questions
What are the Top 10 Zip Codes with the Highest Percentage of Households with Income Below $10,000 in Tennessee?
Top 10 Zip Codes with the Highest Percentage of Households with Income Below $10,000 in Tennessee are:
What zip code has the Highest Percentage of Households with Income Below $10,000 in Tennessee?
37719 has the Highest Percentage of Households with Income Below $10,000 in Tennessee with 100.0%.
What is the Percentage of Households with Income Below $10,000 in the State of Tennessee?
Percentage of Households with Income Below $10,000 in Tennessee is 5.3%.
What is the Percentage of Households with Income Below $10,000 in the United States?
Percentage of Households with Income Below $10,000 in the United States is 4.9%.