Zip Codes with the Highest Percentage of Population with a Degree in Education in Tennessee
RELATED REPORTS & OPTIONS
Education
Tennessee
Compare Zip Codes
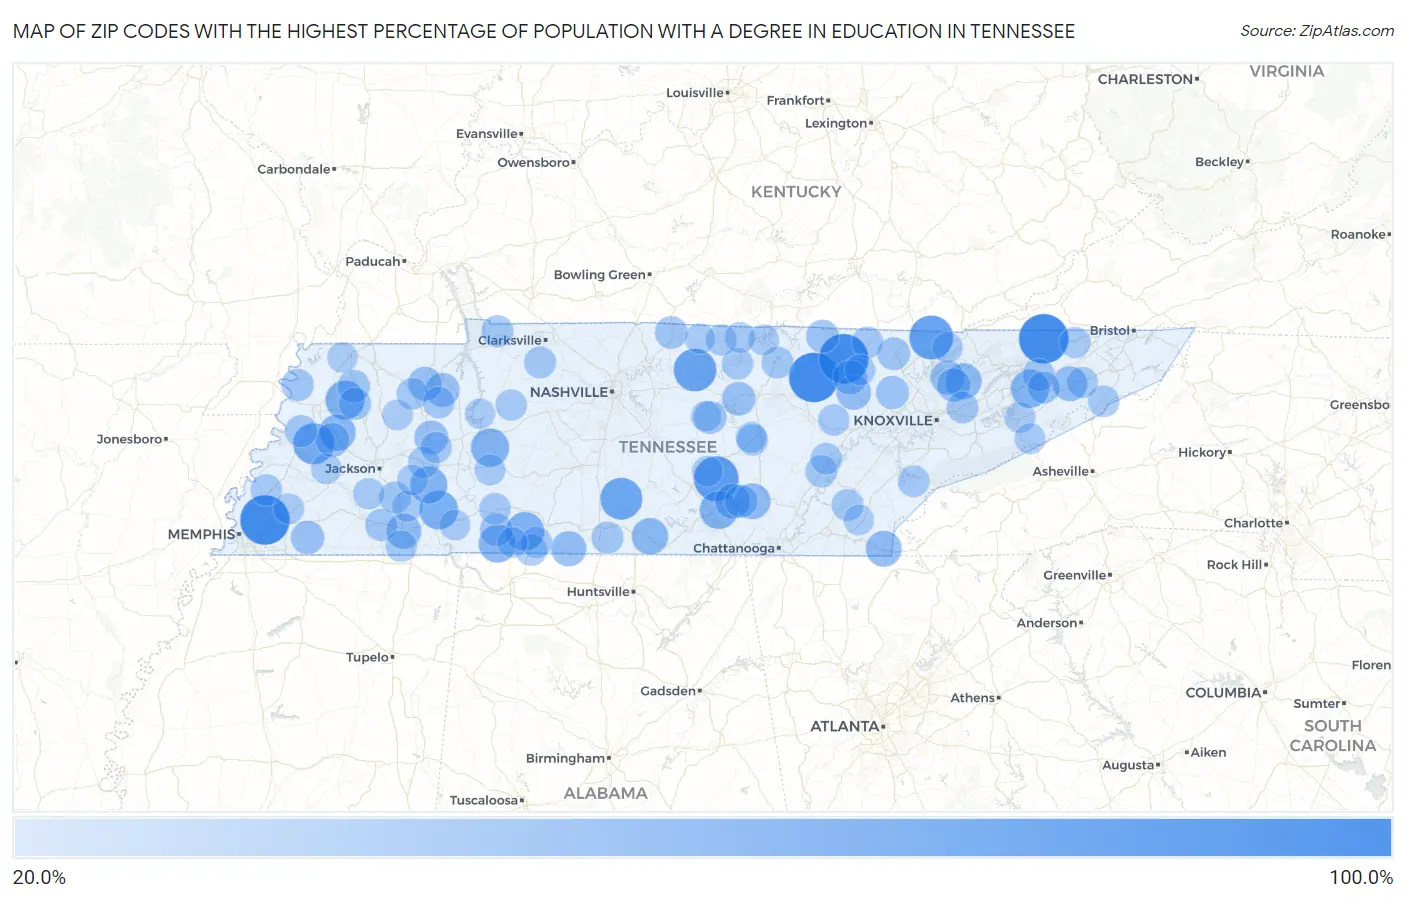
Map of Zip Codes with the Highest Percentage of Population with a Degree in Education in Tennessee
20.0%
100.0%
Zip Codes with the Highest Percentage of Population with a Degree in Education in Tennessee
| Zip Code | % Graduates | vs State | vs National | |
| 1. | 38565 | 100.0% | 12.7%(+87.3)#1 | 11.1%(+88.9)#14 |
| 2. | 37731 | 100.0% | 12.7%(+87.3)#2 | 11.1%(+88.9)#42 |
| 3. | 38504 | 100.0% | 12.7%(+87.3)#3 | 11.1%(+88.9)#48 |
| 4. | 38029 | 100.0% | 12.7%(+87.3)#4 | 11.1%(+88.9)#283 |
| 5. | 37394 | 81.8% | 12.7%(+69.1)#5 | 11.1%(+70.8)#380 |
| 6. | 37715 | 78.1% | 12.7%(+65.4)#6 | 11.1%(+67.1)#412 |
| 7. | 37151 | 73.3% | 12.7%(+60.7)#7 | 11.1%(+62.3)#470 |
| 8. | 37019 | 70.8% | 12.7%(+58.1)#8 | 11.1%(+59.7)#501 |
| 9. | 38037 | 67.2% | 12.7%(+54.5)#9 | 11.1%(+56.1)#545 |
| 10. | 38389 | 60.0% | 12.7%(+47.3)#10 | 11.1%(+48.9)#755 |
| 11. | 38361 | 59.1% | 12.7%(+46.4)#11 | 11.1%(+48.0)#778 |
| 12. | 38486 | 57.5% | 12.7%(+44.9)#12 | 11.1%(+46.5)#826 |
| 13. | 37810 | 56.9% | 12.7%(+44.2)#13 | 11.1%(+45.8)#854 |
| 14. | 37097 | 56.2% | 12.7%(+43.6)#14 | 11.1%(+45.2)#874 |
| 15. | 37366 | 55.9% | 12.7%(+43.2)#15 | 11.1%(+44.8)#889 |
| 16. | 38452 | 55.0% | 12.7%(+42.3)#16 | 11.1%(+43.9)#921 |
| 17. | 38368 | 52.9% | 12.7%(+40.2)#17 | 11.1%(+41.8)#1,018 |
| 18. | 37348 | 50.0% | 12.7%(+37.3)#18 | 11.1%(+38.9)#1,155 |
| 19. | 38021 | 50.0% | 12.7%(+37.3)#19 | 11.1%(+38.9)#1,254 |
| 20. | 37365 | 47.8% | 12.7%(+35.1)#20 | 11.1%(+36.8)#1,341 |
| 21. | 37326 | 47.8% | 12.7%(+35.1)#21 | 11.1%(+36.8)#1,343 |
| 22. | 37848 | 47.8% | 12.7%(+35.1)#22 | 11.1%(+36.8)#1,347 |
| 23. | 38473 | 45.2% | 12.7%(+32.5)#23 | 11.1%(+34.1)#1,549 |
| 24. | 38375 | 45.0% | 12.7%(+32.3)#24 | 11.1%(+34.0)#1,561 |
| 25. | 37313 | 44.6% | 12.7%(+31.9)#25 | 11.1%(+33.5)#1,599 |
| 26. | 37616 | 44.2% | 12.7%(+31.6)#26 | 11.1%(+33.2)#1,641 |
| 27. | 37770 | 43.4% | 12.7%(+30.7)#27 | 11.1%(+32.3)#1,722 |
| 28. | 37872 | 41.5% | 12.7%(+28.9)#28 | 11.1%(+30.5)#1,926 |
| 29. | 37807 | 41.5% | 12.7%(+28.9)#29 | 11.1%(+30.5)#1,930 |
| 30. | 38236 | 41.1% | 12.7%(+28.4)#30 | 11.1%(+30.0)#1,987 |
| 31. | 38231 | 40.9% | 12.7%(+28.3)#31 | 11.1%(+29.9)#2,009 |
| 32. | 38050 | 40.8% | 12.7%(+28.2)#32 | 11.1%(+29.8)#2,032 |
| 33. | 38390 | 40.7% | 12.7%(+28.0)#33 | 11.1%(+29.6)#2,059 |
| 34. | 38544 | 39.7% | 12.7%(+27.0)#34 | 11.1%(+28.6)#2,212 |
| 35. | 37779 | 39.1% | 12.7%(+26.4)#35 | 11.1%(+28.0)#2,304 |
| 36. | 38076 | 39.0% | 12.7%(+26.4)#36 | 11.1%(+28.0)#2,307 |
| 37. | 37710 | 37.9% | 12.7%(+25.3)#37 | 11.1%(+26.9)#2,492 |
| 38. | 38577 | 36.8% | 12.7%(+24.2)#38 | 11.1%(+25.8)#2,689 |
| 39. | 37339 | 36.6% | 12.7%(+23.9)#39 | 11.1%(+25.5)#2,725 |
| 40. | 38450 | 36.5% | 12.7%(+23.8)#40 | 11.1%(+25.4)#2,738 |
| 41. | 37059 | 36.5% | 12.7%(+23.8)#41 | 11.1%(+25.4)#2,742 |
| 42. | 37847 | 36.2% | 12.7%(+23.5)#42 | 11.1%(+25.2)#2,791 |
| 43. | 37186 | 35.8% | 12.7%(+23.1)#43 | 11.1%(+24.7)#2,865 |
| 44. | 38233 | 35.4% | 12.7%(+22.7)#44 | 11.1%(+24.3)#2,943 |
| 45. | 38080 | 35.1% | 12.7%(+22.4)#45 | 11.1%(+24.0)#2,997 |
| 46. | 37711 | 34.7% | 12.7%(+22.1)#46 | 11.1%(+23.7)#3,093 |
| 47. | 38044 | 34.4% | 12.7%(+21.7)#47 | 11.1%(+23.4)#3,156 |
| 48. | 38330 | 34.4% | 12.7%(+21.7)#48 | 11.1%(+23.3)#3,169 |
| 49. | 38040 | 34.1% | 12.7%(+21.5)#49 | 11.1%(+23.1)#3,231 |
| 50. | 37818 | 33.8% | 12.7%(+21.1)#50 | 11.1%(+22.8)#3,314 |
| 51. | 37023 | 33.3% | 12.7%(+20.7)#51 | 11.1%(+22.3)#3,418 |
| 52. | 38453 | 33.3% | 12.7%(+20.7)#52 | 11.1%(+22.3)#3,451 |
| 53. | 38340 | 33.2% | 12.7%(+20.5)#53 | 11.1%(+22.2)#3,522 |
| 54. | 37052 | 32.9% | 12.7%(+20.2)#54 | 11.1%(+21.8)#3,585 |
| 55. | 38570 | 32.8% | 12.7%(+20.1)#55 | 11.1%(+21.7)#3,616 |
| 56. | 37871 | 32.7% | 12.7%(+20.1)#56 | 11.1%(+21.7)#3,621 |
| 57. | 37332 | 32.7% | 12.7%(+20.0)#57 | 11.1%(+21.6)#3,633 |
| 58. | 37370 | 32.5% | 12.7%(+19.9)#58 | 11.1%(+21.5)#3,672 |
| 59. | 38201 | 32.3% | 12.7%(+19.6)#59 | 11.1%(+21.3)#3,732 |
| 60. | 38058 | 32.3% | 12.7%(+19.6)#60 | 11.1%(+21.2)#3,739 |
| 61. | 38342 | 32.2% | 12.7%(+19.5)#61 | 11.1%(+21.1)#3,771 |
| 62. | 38485 | 32.2% | 12.7%(+19.5)#62 | 11.1%(+21.1)#3,774 |
| 63. | 38481 | 32.1% | 12.7%(+19.5)#63 | 11.1%(+21.1)#3,791 |
| 64. | 38562 | 32.1% | 12.7%(+19.4)#64 | 11.1%(+21.0)#3,799 |
| 65. | 37885 | 32.0% | 12.7%(+19.3)#65 | 11.1%(+20.9)#3,849 |
| 66. | 38469 | 31.9% | 12.7%(+19.2)#66 | 11.1%(+20.8)#3,872 |
| 67. | 37650 | 31.8% | 12.7%(+19.2)#67 | 11.1%(+20.8)#3,884 |
| 68. | 37841 | 31.8% | 12.7%(+19.1)#68 | 11.1%(+20.7)#3,892 |
| 69. | 37381 | 31.7% | 12.7%(+19.0)#69 | 11.1%(+20.7)#3,910 |
| 70. | 38367 | 31.7% | 12.7%(+19.0)#70 | 11.1%(+20.6)#3,915 |
| 71. | 38351 | 31.4% | 12.7%(+18.8)#71 | 11.1%(+20.4)#3,990 |
| 72. | 38388 | 31.2% | 12.7%(+18.5)#72 | 11.1%(+20.1)#4,070 |
| 73. | 37723 | 31.1% | 12.7%(+18.5)#73 | 11.1%(+20.1)#4,078 |
| 74. | 37101 | 30.9% | 12.7%(+18.3)#74 | 11.1%(+19.9)#4,146 |
| 75. | 38356 | 30.9% | 12.7%(+18.2)#75 | 11.1%(+19.9)#4,152 |
| 76. | 37641 | 30.8% | 12.7%(+18.1)#76 | 11.1%(+19.8)#4,178 |
| 77. | 37642 | 30.8% | 12.7%(+18.1)#77 | 11.1%(+19.7)#4,188 |
| 78. | 38334 | 30.1% | 12.7%(+17.4)#78 | 11.1%(+19.0)#4,430 |
| 79. | 38559 | 30.0% | 12.7%(+17.3)#79 | 11.1%(+18.9)#4,462 |
| 80. | 37096 | 29.8% | 12.7%(+17.1)#80 | 11.1%(+18.7)#4,563 |
| 81. | 38579 | 29.7% | 12.7%(+17.1)#81 | 11.1%(+18.7)#4,568 |
| 82. | 37852 | 29.7% | 12.7%(+17.0)#82 | 11.1%(+18.7)#4,577 |
| 83. | 37150 | 29.6% | 12.7%(+16.9)#83 | 11.1%(+18.5)#4,625 |
| 84. | 38551 | 29.2% | 12.7%(+16.6)#84 | 11.1%(+18.2)#4,763 |
| 85. | 38352 | 29.1% | 12.7%(+16.4)#85 | 11.1%(+18.0)#4,845 |
| 86. | 37821 | 29.1% | 12.7%(+16.4)#86 | 11.1%(+18.0)#4,847 |
| 87. | 37753 | 29.1% | 12.7%(+16.4)#87 | 11.1%(+18.0)#4,855 |
| 88. | 38575 | 29.0% | 12.7%(+16.3)#88 | 11.1%(+17.9)#4,886 |
| 89. | 38036 | 28.9% | 12.7%(+16.3)#89 | 11.1%(+17.9)#4,907 |
| 90. | 38372 | 28.8% | 12.7%(+16.1)#90 | 11.1%(+17.7)#4,963 |
| 91. | 38220 | 28.8% | 12.7%(+16.1)#91 | 11.1%(+17.7)#4,979 |
| 92. | 37357 | 28.5% | 12.7%(+15.8)#92 | 11.1%(+17.4)#5,115 |
| 93. | 37870 | 28.4% | 12.7%(+15.8)#93 | 11.1%(+17.4)#5,149 |
| 94. | 37325 | 28.2% | 12.7%(+15.6)#94 | 11.1%(+17.2)#5,225 |
| 95. | 38012 | 28.2% | 12.7%(+15.6)#95 | 11.1%(+17.2)#5,227 |
| 96. | 37095 | 28.2% | 12.7%(+15.5)#96 | 11.1%(+17.1)#5,240 |
| 97. | 38261 | 28.1% | 12.7%(+15.4)#97 | 11.1%(+17.0)#5,280 |
| 98. | 38463 | 28.0% | 12.7%(+15.4)#98 | 11.1%(+17.0)#5,301 |
| 99. | 37083 | 27.6% | 12.7%(+14.9)#99 | 11.1%(+16.5)#5,532 |
| 100. | 37134 | 27.4% | 12.7%(+14.7)#100 | 11.1%(+16.3)#5,612 |
Common Questions
What are the Top 10 Zip Codes with the Highest Percentage of Population with a Degree in Education in Tennessee?
Top 10 Zip Codes with the Highest Percentage of Population with a Degree in Education in Tennessee are:
What zip code has the Highest Percentage of Population with a Degree in Education in Tennessee?
38565 has the Highest Percentage of Population with a Degree in Education in Tennessee with 100.0%.
What is the Percentage of Population with a Degree in Education in the State of Tennessee?
Percentage of Population with a Degree in Education in Tennessee is 12.7%.
What is the Percentage of Population with a Degree in Education in the United States?
Percentage of Population with a Degree in Education in the United States is 11.1%.