Zip Codes with the Highest Percentage of Households with Income Above $200,000 in Tennessee
RELATED REPORTS & OPTIONS
Household Income | $200k+
Tennessee
Compare Zip Codes
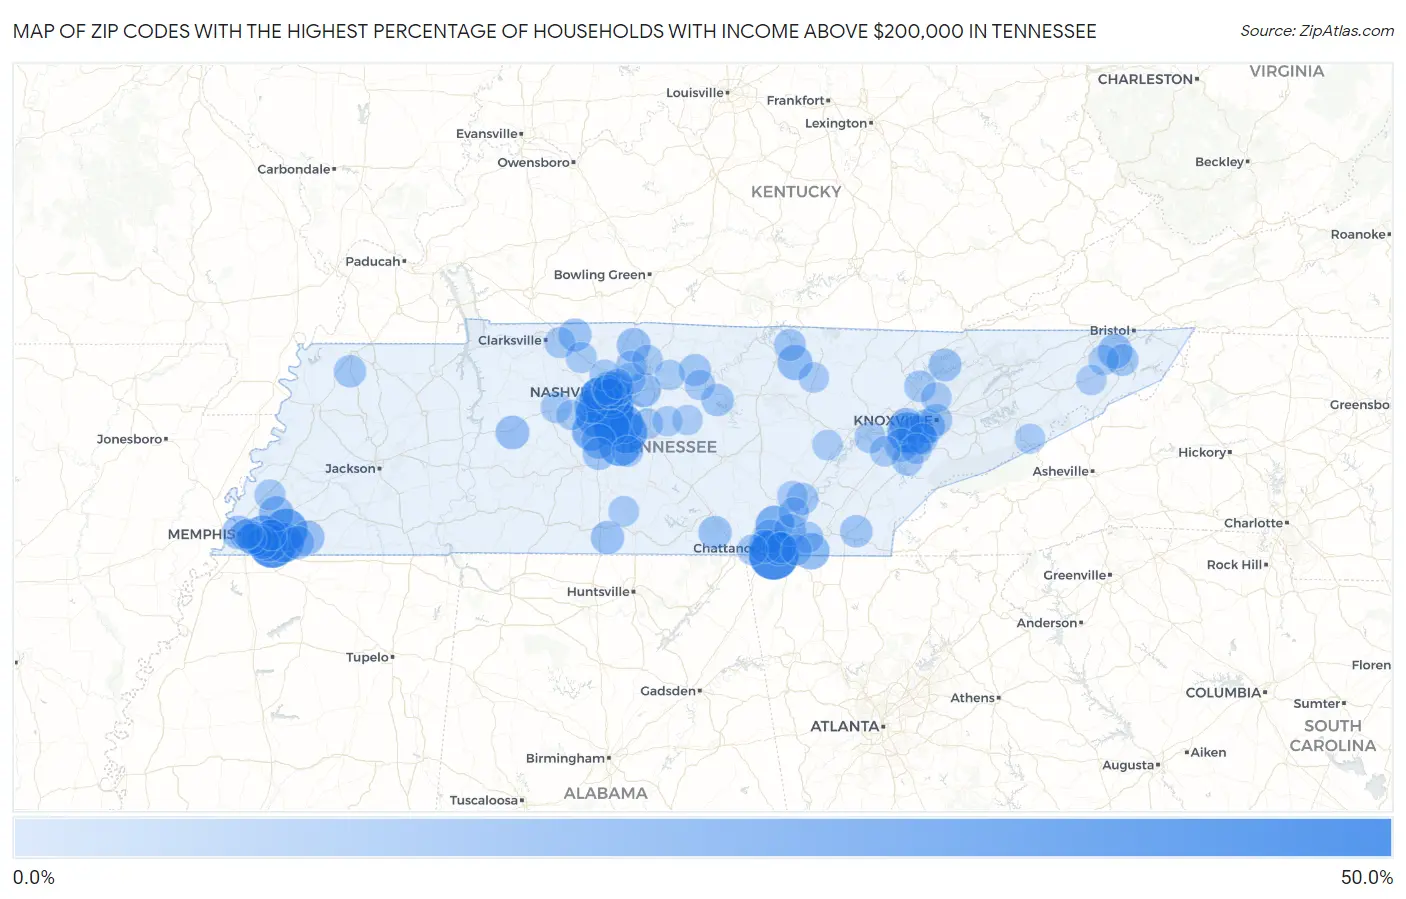
Map of Zip Codes with the Highest Percentage of Households with Income Above $200,000 in Tennessee
0.0%
50.0%
Zip Codes with the Highest Percentage of Households with Income Above $200,000 in Tennessee
| Zip Code | Households with Income > $200k | vs State | vs National | |
| 1. | 37350 | 46.9% | 7.3%(+39.6)#1 | 11.4%(+35.5)#362 |
| 2. | 38139 | 43.7% | 7.3%(+36.4)#2 | 11.4%(+32.3)#470 |
| 3. | 37215 | 38.4% | 7.3%(+31.1)#3 | 11.4%(+27.0)#751 |
| 4. | 37027 | 37.3% | 7.3%(+30.0)#4 | 11.4%(+25.9)#815 |
| 5. | 37220 | 36.8% | 7.3%(+29.5)#5 | 11.4%(+25.4)#850 |
| 6. | 37069 | 35.4% | 7.3%(+28.1)#6 | 11.4%(+24.0)#950 |
| 7. | 37205 | 34.5% | 7.3%(+27.2)#7 | 11.4%(+23.1)#1,013 |
| 8. | 38028 | 32.8% | 7.3%(+25.5)#8 | 11.4%(+21.4)#1,172 |
| 9. | 37046 | 31.7% | 7.3%(+24.4)#9 | 11.4%(+20.3)#1,277 |
| 10. | 37014 | 31.5% | 7.3%(+24.2)#10 | 11.4%(+20.1)#1,299 |
| 11. | 38120 | 30.2% | 7.3%(+22.9)#11 | 11.4%(+18.8)#1,435 |
| 12. | 37934 | 28.5% | 7.3%(+21.2)#12 | 11.4%(+17.1)#1,648 |
| 13. | 38017 | 27.7% | 7.3%(+20.4)#13 | 11.4%(+16.3)#1,769 |
| 14. | 37135 | 25.7% | 7.3%(+18.4)#14 | 11.4%(+14.3)#2,063 |
| 15. | 37922 | 25.2% | 7.3%(+17.9)#15 | 11.4%(+13.8)#2,144 |
| 16. | 37204 | 25.2% | 7.3%(+17.9)#16 | 11.4%(+13.8)#2,151 |
| 17. | 37064 | 25.1% | 7.3%(+17.8)#17 | 11.4%(+13.7)#2,164 |
| 18. | 37377 | 25.1% | 7.3%(+17.8)#18 | 11.4%(+13.7)#2,174 |
| 19. | 37201 | 24.1% | 7.3%(+16.8)#19 | 11.4%(+12.7)#2,356 |
| 20. | 38138 | 23.8% | 7.3%(+16.5)#20 | 11.4%(+12.4)#2,407 |
| 21. | 37212 | 22.2% | 7.3%(+14.9)#21 | 11.4%(+10.8)#2,734 |
| 22. | 37067 | 21.3% | 7.3%(+14.0)#22 | 11.4%(+9.90)#2,930 |
| 23. | 37302 | 20.3% | 7.3%(+13.0)#23 | 11.4%(+8.90)#3,215 |
| 24. | 38543 | 17.7% | 7.3%(+10.4)#24 | 11.4%(+6.30)#3,948 |
| 25. | 38002 | 17.3% | 7.3%(+10.0)#25 | 11.4%(+5.90)#4,064 |
| 26. | 37179 | 17.1% | 7.3%(+9.80)#26 | 11.4%(+5.70)#4,151 |
| 27. | 37919 | 16.6% | 7.3%(+9.30)#27 | 11.4%(+5.20)#4,328 |
| 28. | 37686 | 16.6% | 7.3%(+9.30)#28 | 11.4%(+5.20)#4,339 |
| 29. | 37122 | 16.5% | 7.3%(+9.20)#29 | 11.4%(+5.10)#4,357 |
| 30. | 38117 | 15.9% | 7.3%(+8.60)#30 | 11.4%(+4.50)#4,606 |
| 31. | 37932 | 15.7% | 7.3%(+8.40)#31 | 11.4%(+4.30)#4,689 |
| 32. | 38076 | 15.6% | 7.3%(+8.30)#32 | 11.4%(+4.20)#4,744 |
| 33. | 37221 | 15.3% | 7.3%(+8.00)#33 | 11.4%(+3.90)#4,840 |
| 34. | 37048 | 15.3% | 7.3%(+8.00)#34 | 11.4%(+3.90)#4,864 |
| 35. | 38103 | 15.0% | 7.3%(+7.70)#35 | 11.4%(+3.60)#4,987 |
| 36. | 37140 | 15.0% | 7.3%(+7.70)#36 | 11.4%(+3.60)#5,003 |
| 37. | 37405 | 14.7% | 7.3%(+7.40)#37 | 11.4%(+3.30)#5,131 |
| 38. | 37408 | 14.7% | 7.3%(+7.40)#38 | 11.4%(+3.30)#5,150 |
| 39. | 37206 | 14.3% | 7.3%(+7.00)#39 | 11.4%(+2.90)#5,305 |
| 40. | 37772 | 14.3% | 7.3%(+7.00)#40 | 11.4%(+2.90)#5,311 |
| 41. | 38453 | 14.2% | 7.3%(+6.90)#41 | 11.4%(+2.80)#5,395 |
| 42. | 37375 | 14.1% | 7.3%(+6.80)#42 | 11.4%(+2.70)#5,435 |
| 43. | 38066 | 14.0% | 7.3%(+6.70)#43 | 11.4%(+2.60)#5,482 |
| 44. | 38119 | 13.8% | 7.3%(+6.50)#44 | 11.4%(+2.40)#5,566 |
| 45. | 37419 | 13.8% | 7.3%(+6.50)#45 | 11.4%(+2.40)#5,583 |
| 46. | 37010 | 13.7% | 7.3%(+6.40)#46 | 11.4%(+2.30)#5,644 |
| 47. | 37228 | 13.3% | 7.3%(+6.00)#47 | 11.4%(+1.90)#5,869 |
| 48. | 37866 | 13.2% | 7.3%(+5.90)#48 | 11.4%(+1.80)#5,926 |
| 49. | 37174 | 12.6% | 7.3%(+5.30)#49 | 11.4%(+1.20)#6,250 |
| 50. | 38569 | 12.5% | 7.3%(+5.20)#50 | 11.4%(+1.10)#6,389 |
| 51. | 37307 | 12.4% | 7.3%(+5.10)#51 | 11.4%(+1.000)#6,429 |
| 52. | 38253 | 12.3% | 7.3%(+5.00)#52 | 11.4%(+0.900)#6,512 |
| 53. | 37343 | 11.7% | 7.3%(+4.40)#53 | 11.4%(+0.300)#6,848 |
| 54. | 37209 | 11.7% | 7.3%(+4.40)#54 | 11.4%(+0.300)#6,850 |
| 55. | 38573 | 11.7% | 7.3%(+4.40)#55 | 11.4%(+0.300)#6,892 |
| 56. | 37373 | 11.6% | 7.3%(+4.30)#56 | 11.4%(+0.200)#6,966 |
| 57. | 37902 | 11.6% | 7.3%(+4.30)#57 | 11.4%(+0.200)#6,972 |
| 58. | 37694 | 11.6% | 7.3%(+4.30)#58 | 11.4%(+0.200)#6,976 |
| 59. | 37151 | 11.6% | 7.3%(+4.30)#59 | 11.4%(+0.200)#6,992 |
| 60. | 37138 | 11.0% | 7.3%(+3.70)#60 | 11.4%(-0.400)#7,404 |
| 61. | 37828 | 10.8% | 7.3%(+3.50)#61 | 11.4%(-0.600)#7,575 |
| 62. | 37363 | 10.7% | 7.3%(+3.40)#62 | 11.4%(-0.700)#7,611 |
| 63. | 37029 | 10.6% | 7.3%(+3.30)#63 | 11.4%(-0.800)#7,722 |
| 64. | 37742 | 10.5% | 7.3%(+3.20)#64 | 11.4%(-0.900)#7,801 |
| 65. | 37075 | 10.4% | 7.3%(+3.10)#65 | 11.4%(-1.000)#7,856 |
| 66. | 37060 | 10.4% | 7.3%(+3.10)#66 | 11.4%(-1.000)#7,906 |
| 67. | 37763 | 10.2% | 7.3%(+2.90)#67 | 11.4%(-1.20)#8,067 |
| 68. | 37043 | 10.1% | 7.3%(+2.80)#68 | 11.4%(-1.30)#8,132 |
| 69. | 37403 | 10.1% | 7.3%(+2.80)#69 | 11.4%(-1.30)#8,173 |
| 70. | 37421 | 9.9% | 7.3%(+2.60)#70 | 11.4%(-1.50)#8,340 |
| 71. | 38004 | 9.9% | 7.3%(+2.60)#71 | 11.4%(-1.50)#8,368 |
| 72. | 37777 | 9.8% | 7.3%(+2.50)#72 | 11.4%(-1.60)#8,465 |
| 73. | 37146 | 9.8% | 7.3%(+2.50)#73 | 11.4%(-1.60)#8,474 |
| 74. | 37340 | 9.7% | 7.3%(+2.40)#74 | 11.4%(-1.70)#8,616 |
| 75. | 37129 | 9.6% | 7.3%(+2.30)#75 | 11.4%(-1.80)#8,619 |
| 76. | 37189 | 9.6% | 7.3%(+2.30)#76 | 11.4%(-1.80)#8,661 |
| 77. | 37203 | 9.5% | 7.3%(+2.20)#77 | 11.4%(-1.90)#8,732 |
| 78. | 38018 | 9.4% | 7.3%(+2.10)#78 | 11.4%(-2.00)#8,832 |
| 79. | 38104 | 9.4% | 7.3%(+2.10)#79 | 11.4%(-2.00)#8,850 |
| 80. | 37208 | 9.4% | 7.3%(+2.10)#80 | 11.4%(-2.00)#8,853 |
| 81. | 37737 | 9.3% | 7.3%(+2.00)#81 | 11.4%(-2.10)#8,962 |
| 82. | 37774 | 9.2% | 7.3%(+1.90)#82 | 11.4%(-2.20)#9,048 |
| 83. | 37338 | 9.2% | 7.3%(+1.90)#83 | 11.4%(-2.20)#9,081 |
| 84. | 37066 | 9.1% | 7.3%(+1.80)#84 | 11.4%(-2.30)#9,114 |
| 85. | 37938 | 9.1% | 7.3%(+1.80)#85 | 11.4%(-2.30)#9,143 |
| 86. | 37144 | 9.0% | 7.3%(+1.70)#86 | 11.4%(-2.40)#9,260 |
| 87. | 37379 | 8.9% | 7.3%(+1.60)#87 | 11.4%(-2.50)#9,319 |
| 88. | 38563 | 8.8% | 7.3%(+1.50)#88 | 11.4%(-2.60)#9,468 |
| 89. | 38565 | 8.8% | 7.3%(+1.50)#89 | 11.4%(-2.60)#9,483 |
| 90. | 37337 | 8.8% | 7.3%(+1.50)#90 | 11.4%(-2.60)#9,485 |
| 91. | 37615 | 8.7% | 7.3%(+1.40)#91 | 11.4%(-2.70)#9,534 |
| 92. | 37016 | 8.7% | 7.3%(+1.40)#92 | 11.4%(-2.70)#9,607 |
| 93. | 37087 | 8.6% | 7.3%(+1.30)#93 | 11.4%(-2.80)#9,629 |
| 94. | 38111 | 8.6% | 7.3%(+1.30)#94 | 11.4%(-2.80)#9,632 |
| 95. | 37216 | 8.6% | 7.3%(+1.30)#95 | 11.4%(-2.80)#9,648 |
| 96. | 38112 | 8.6% | 7.3%(+1.30)#96 | 11.4%(-2.80)#9,650 |
| 97. | 37062 | 8.6% | 7.3%(+1.30)#97 | 11.4%(-2.80)#9,657 |
| 98. | 37690 | 8.5% | 7.3%(+1.20)#98 | 11.4%(-2.90)#9,790 |
| 99. | 37085 | 8.4% | 7.3%(+1.10)#99 | 11.4%(-3.00)#9,913 |
| 100. | 37753 | 8.4% | 7.3%(+1.10)#100 | 11.4%(-3.00)#9,948 |
Common Questions
What are the Top 10 Zip Codes with the Highest Percentage of Households with Income Above $200,000 in Tennessee?
Top 10 Zip Codes with the Highest Percentage of Households with Income Above $200,000 in Tennessee are:
What zip code has the Highest Percentage of Households with Income Above $200,000 in Tennessee?
37350 has the Highest Percentage of Households with Income Above $200,000 in Tennessee with 46.9%.
What is the Percentage of Households with Income Above $200,000 in the State of Tennessee?
Percentage of Households with Income Above $200,000 in Tennessee is 7.3%.
What is the Percentage of Households with Income Above $200,000 in the United States?
Percentage of Households with Income Above $200,000 in the United States is 11.4%.