Zip Codes with the Highest Percentage of Population Employed in Sales & Related in Tennessee
RELATED REPORTS & OPTIONS
Sales & Related
Tennessee
Compare Zip Codes
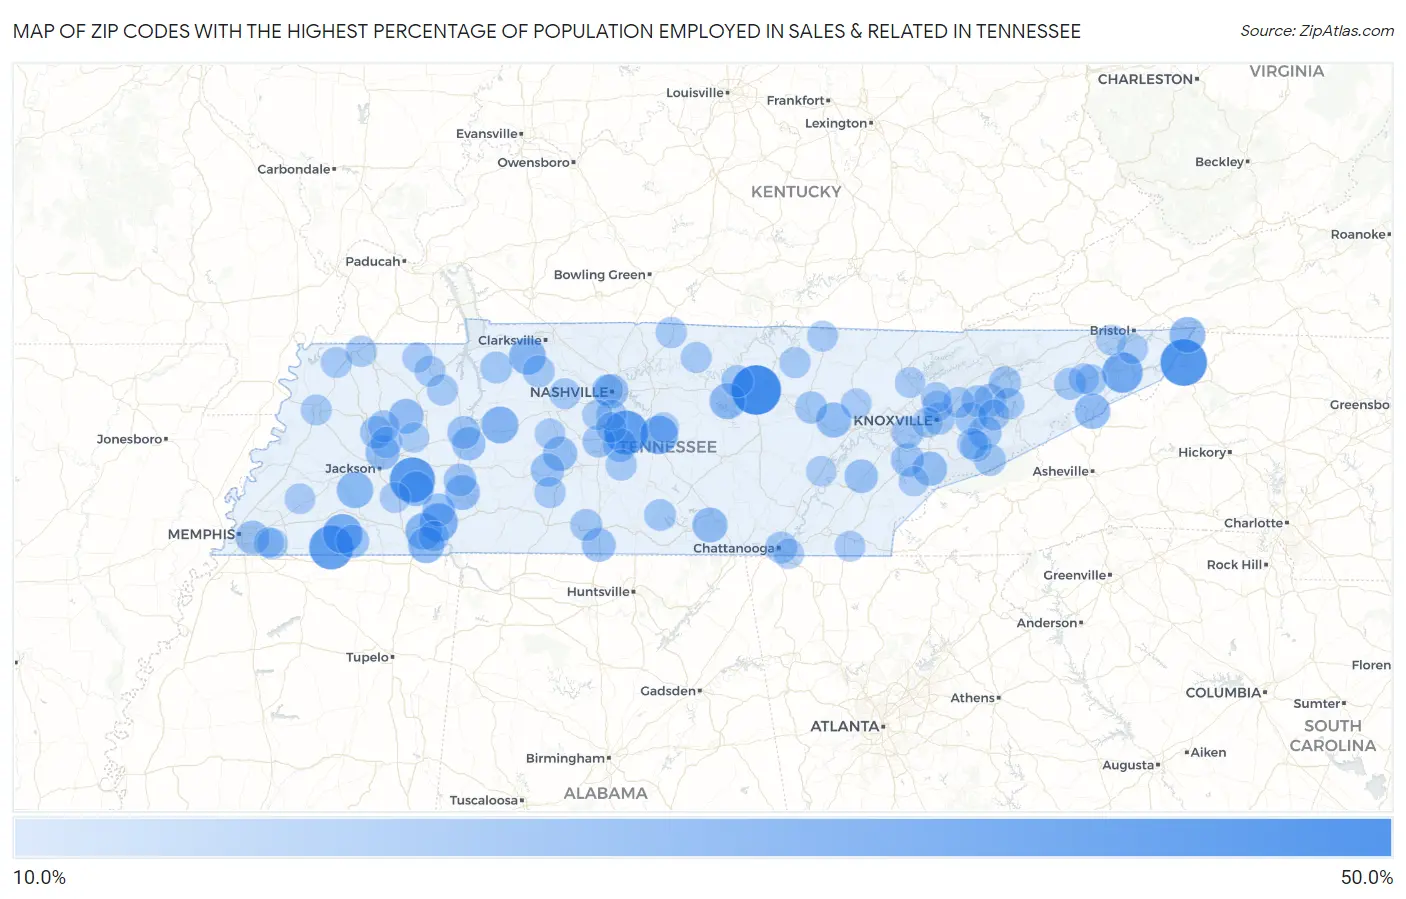
Map of Zip Codes with the Highest Percentage of Population Employed in Sales & Related in Tennessee
10.0%
50.0%
Zip Codes with the Highest Percentage of Population Employed in Sales & Related in Tennessee
| Zip Code | % Employed | vs State | vs National | |
| 1. | 38505 | 42.0% | 9.8%(+32.2)#1 | 9.6%(+32.4)#184 |
| 2. | 37691 | 37.3% | 9.8%(+27.5)#2 | 9.6%(+27.7)#234 |
| 3. | 38352 | 35.1% | 9.8%(+25.3)#3 | 9.6%(+25.5)#271 |
| 4. | 38046 | 33.3% | 9.8%(+23.5)#4 | 9.6%(+23.7)#310 |
| 5. | 37014 | 33.0% | 9.8%(+23.2)#5 | 9.6%(+23.4)#315 |
| 6. | 37682 | 27.7% | 9.8%(+17.9)#6 | 9.6%(+18.1)#491 |
| 7. | 38042 | 26.4% | 9.8%(+16.5)#7 | 9.6%(+16.8)#550 |
| 8. | 37132 | 24.7% | 9.8%(+14.9)#8 | 9.6%(+15.1)#664 |
| 9. | 38327 | 24.2% | 9.8%(+14.4)#9 | 9.6%(+14.6)#701 |
| 10. | 37142 | 22.1% | 9.8%(+12.3)#10 | 9.6%(+12.6)#887 |
| 11. | 37078 | 22.1% | 9.8%(+12.3)#11 | 9.6%(+12.5)#889 |
| 12. | 38379 | 21.9% | 9.8%(+12.0)#12 | 9.6%(+12.3)#912 |
| 13. | 38392 | 21.4% | 9.8%(+11.6)#13 | 9.6%(+11.8)#975 |
| 14. | 38357 | 21.3% | 9.8%(+11.5)#14 | 9.6%(+11.7)#983 |
| 15. | 38582 | 20.8% | 9.8%(+11.0)#15 | 9.6%(+11.2)#1,041 |
| 16. | 37680 | 20.6% | 9.8%(+10.8)#16 | 9.6%(+11.0)#1,082 |
| 17. | 37657 | 19.9% | 9.8%(+10.1)#17 | 9.6%(+10.3)#1,171 |
| 18. | 37723 | 19.6% | 9.8%(+9.74)#18 | 9.6%(+9.98)#1,220 |
| 19. | 38347 | 19.4% | 9.8%(+9.60)#19 | 9.6%(+9.84)#1,253 |
| 20. | 37383 | 19.3% | 9.8%(+9.46)#20 | 9.6%(+9.70)#1,279 |
| 21. | 38235 | 18.9% | 9.8%(+9.11)#21 | 9.6%(+9.35)#1,354 |
| 22. | 38311 | 18.9% | 9.8%(+9.11)#22 | 9.6%(+9.34)#1,356 |
| 23. | 38487 | 18.5% | 9.8%(+8.63)#23 | 9.6%(+8.87)#1,445 |
| 24. | 37878 | 18.2% | 9.8%(+8.35)#24 | 9.6%(+8.59)#1,521 |
| 25. | 38362 | 18.1% | 9.8%(+8.29)#25 | 9.6%(+8.53)#1,547 |
| 26. | 37219 | 18.0% | 9.8%(+8.13)#26 | 9.6%(+8.37)#1,574 |
| 27. | 38455 | 17.6% | 9.8%(+7.73)#27 | 9.6%(+7.97)#1,673 |
| 28. | 38152 | 17.3% | 9.8%(+7.42)#28 | 9.6%(+7.66)#1,756 |
| 29. | 37046 | 17.2% | 9.8%(+7.37)#29 | 9.6%(+7.61)#1,772 |
| 30. | 37826 | 17.2% | 9.8%(+7.34)#30 | 9.6%(+7.58)#1,784 |
| 31. | 38461 | 17.1% | 9.8%(+7.30)#31 | 9.6%(+7.53)#1,797 |
| 32. | 38380 | 16.8% | 9.8%(+6.96)#32 | 9.6%(+7.20)#1,898 |
| 33. | 38067 | 16.7% | 9.8%(+6.89)#33 | 9.6%(+7.13)#1,919 |
| 34. | 37876 | 16.7% | 9.8%(+6.82)#34 | 9.6%(+7.06)#1,962 |
| 35. | 37742 | 16.6% | 9.8%(+6.77)#35 | 9.6%(+7.00)#1,982 |
| 36. | 38361 | 16.3% | 9.8%(+6.48)#36 | 9.6%(+6.72)#2,094 |
| 37. | 38341 | 16.3% | 9.8%(+6.45)#37 | 9.6%(+6.69)#2,107 |
| 38. | 37760 | 15.7% | 9.8%(+5.86)#38 | 9.6%(+6.10)#2,383 |
| 39. | 38338 | 15.6% | 9.8%(+5.79)#39 | 9.6%(+6.03)#2,414 |
| 40. | 37179 | 15.6% | 9.8%(+5.76)#40 | 9.6%(+6.00)#2,424 |
| 41. | 38329 | 15.6% | 9.8%(+5.75)#41 | 9.6%(+5.99)#2,428 |
| 42. | 37934 | 15.4% | 9.8%(+5.53)#42 | 9.6%(+5.77)#2,544 |
| 43. | 38571 | 15.3% | 9.8%(+5.44)#43 | 9.6%(+5.68)#2,577 |
| 44. | 38545 | 15.3% | 9.8%(+5.44)#44 | 9.6%(+5.68)#2,582 |
| 45. | 37764 | 15.2% | 9.8%(+5.32)#45 | 9.6%(+5.56)#2,652 |
| 46. | 37814 | 15.1% | 9.8%(+5.25)#46 | 9.6%(+5.49)#2,680 |
| 47. | 37051 | 14.8% | 9.8%(+4.96)#47 | 9.6%(+5.20)#2,871 |
| 48. | 37178 | 14.8% | 9.8%(+4.92)#48 | 9.6%(+5.16)#2,898 |
| 49. | 38478 | 14.7% | 9.8%(+4.91)#49 | 9.6%(+5.14)#2,907 |
| 50. | 37403 | 14.7% | 9.8%(+4.86)#50 | 9.6%(+5.10)#2,947 |
| 51. | 37915 | 14.7% | 9.8%(+4.85)#51 | 9.6%(+5.09)#2,953 |
| 52. | 37616 | 14.6% | 9.8%(+4.78)#52 | 9.6%(+5.01)#3,006 |
| 53. | 37820 | 14.6% | 9.8%(+4.73)#53 | 9.6%(+4.97)#3,040 |
| 54. | 38358 | 14.6% | 9.8%(+4.72)#54 | 9.6%(+4.96)#3,044 |
| 55. | 37738 | 14.5% | 9.8%(+4.67)#55 | 9.6%(+4.91)#3,081 |
| 56. | 37352 | 14.4% | 9.8%(+4.58)#56 | 9.6%(+4.81)#3,150 |
| 57. | 38355 | 14.1% | 9.8%(+4.27)#57 | 9.6%(+4.51)#3,389 |
| 58. | 37890 | 13.8% | 9.8%(+3.99)#58 | 9.6%(+4.23)#3,617 |
| 59. | 37863 | 13.7% | 9.8%(+3.89)#59 | 9.6%(+4.13)#3,724 |
| 60. | 38483 | 13.7% | 9.8%(+3.88)#60 | 9.6%(+4.12)#3,739 |
| 61. | 38543 | 13.7% | 9.8%(+3.87)#61 | 9.6%(+4.10)#3,749 |
| 62. | 38257 | 13.7% | 9.8%(+3.84)#62 | 9.6%(+4.07)#3,778 |
| 63. | 37034 | 13.6% | 9.8%(+3.79)#63 | 9.6%(+4.03)#3,823 |
| 64. | 37690 | 13.6% | 9.8%(+3.79)#64 | 9.6%(+4.02)#3,825 |
| 65. | 37186 | 13.6% | 9.8%(+3.78)#65 | 9.6%(+4.02)#3,828 |
| 66. | 37862 | 13.5% | 9.8%(+3.68)#66 | 9.6%(+3.92)#3,923 |
| 67. | 38236 | 13.5% | 9.8%(+3.65)#67 | 9.6%(+3.89)#3,957 |
| 68. | 37725 | 13.4% | 9.8%(+3.61)#68 | 9.6%(+3.85)#3,996 |
| 69. | 38260 | 13.4% | 9.8%(+3.55)#69 | 9.6%(+3.79)#4,049 |
| 70. | 37208 | 13.4% | 9.8%(+3.53)#70 | 9.6%(+3.77)#4,081 |
| 71. | 37806 | 13.3% | 9.8%(+3.47)#71 | 9.6%(+3.71)#4,160 |
| 72. | 37057 | 13.3% | 9.8%(+3.43)#72 | 9.6%(+3.67)#4,199 |
| 73. | 38242 | 13.2% | 9.8%(+3.40)#73 | 9.6%(+3.64)#4,241 |
| 74. | 37187 | 13.2% | 9.8%(+3.37)#74 | 9.6%(+3.61)#4,268 |
| 75. | 38024 | 13.2% | 9.8%(+3.34)#75 | 9.6%(+3.58)#4,307 |
| 76. | 38139 | 13.2% | 9.8%(+3.33)#76 | 9.6%(+3.57)#4,320 |
| 77. | 37918 | 13.1% | 9.8%(+3.29)#77 | 9.6%(+3.53)#4,353 |
| 78. | 38577 | 13.1% | 9.8%(+3.25)#78 | 9.6%(+3.49)#4,399 |
| 79. | 37027 | 13.0% | 9.8%(+3.18)#79 | 9.6%(+3.42)#4,468 |
| 80. | 37887 | 13.0% | 9.8%(+3.13)#80 | 9.6%(+3.37)#4,522 |
| 81. | 38340 | 12.9% | 9.8%(+3.10)#81 | 9.6%(+3.34)#4,555 |
| 82. | 37681 | 12.9% | 9.8%(+3.08)#82 | 9.6%(+3.32)#4,580 |
| 83. | 37938 | 12.9% | 9.8%(+3.03)#83 | 9.6%(+3.27)#4,652 |
| 84. | 37362 | 12.9% | 9.8%(+3.02)#84 | 9.6%(+3.26)#4,669 |
| 85. | 38049 | 12.8% | 9.8%(+3.00)#85 | 9.6%(+3.24)#4,693 |
| 86. | 38376 | 12.8% | 9.8%(+3.00)#86 | 9.6%(+3.24)#4,699 |
| 87. | 37618 | 12.8% | 9.8%(+2.93)#87 | 9.6%(+3.16)#4,811 |
| 88. | 37769 | 12.7% | 9.8%(+2.91)#88 | 9.6%(+3.14)#4,836 |
| 89. | 37098 | 12.7% | 9.8%(+2.90)#89 | 9.6%(+3.14)#4,838 |
| 90. | 37069 | 12.7% | 9.8%(+2.88)#90 | 9.6%(+3.12)#4,863 |
| 91. | 38224 | 12.7% | 9.8%(+2.82)#91 | 9.6%(+3.06)#4,948 |
| 92. | 38138 | 12.6% | 9.8%(+2.72)#92 | 9.6%(+2.96)#5,074 |
| 93. | 38321 | 12.5% | 9.8%(+2.71)#93 | 9.6%(+2.95)#5,093 |
| 94. | 37067 | 12.5% | 9.8%(+2.71)#94 | 9.6%(+2.95)#5,098 |
| 95. | 37332 | 12.5% | 9.8%(+2.70)#95 | 9.6%(+2.94)#5,119 |
| 96. | 37130 | 12.5% | 9.8%(+2.63)#96 | 9.6%(+2.87)#5,226 |
| 97. | 37617 | 12.4% | 9.8%(+2.61)#97 | 9.6%(+2.85)#5,267 |
| 98. | 37412 | 12.4% | 9.8%(+2.59)#98 | 9.6%(+2.83)#5,290 |
| 99. | 37909 | 12.3% | 9.8%(+2.49)#99 | 9.6%(+2.73)#5,449 |
| 100. | 37885 | 12.3% | 9.8%(+2.44)#100 | 9.6%(+2.68)#5,532 |
Common Questions
What are the Top 10 Zip Codes with the Highest Percentage of Population Employed in Sales & Related in Tennessee?
Top 10 Zip Codes with the Highest Percentage of Population Employed in Sales & Related in Tennessee are:
What zip code has the Highest Percentage of Population Employed in Sales & Related in Tennessee?
38505 has the Highest Percentage of Population Employed in Sales & Related in Tennessee with 42.0%.
What is the Percentage of Population Employed in Sales & Related in the State of Tennessee?
Percentage of Population Employed in Sales & Related in Tennessee is 9.8%.
What is the Percentage of Population Employed in Sales & Related in the United States?
Percentage of Population Employed in Sales & Related in the United States is 9.6%.