Zip Codes with the Highest Percentage of Population with a Degree in Education in New Hampshire
RELATED REPORTS & OPTIONS
Education
New Hampshire
Compare Zip Codes
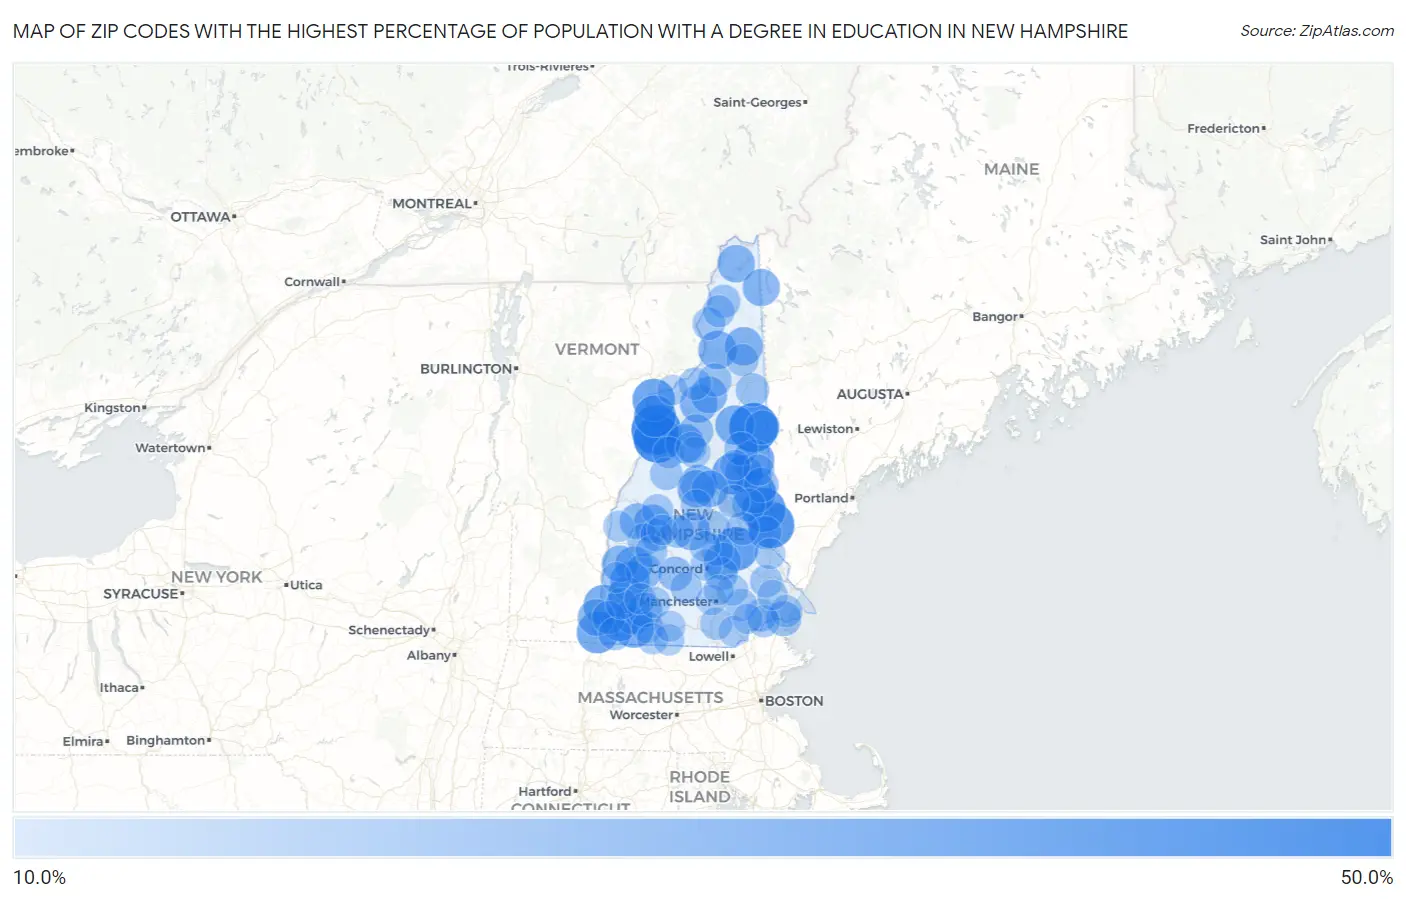
Map of Zip Codes with the Highest Percentage of Population with a Degree in Education in New Hampshire
10.0%
50.0%
Zip Codes with the Highest Percentage of Population with a Degree in Education in New Hampshire
| Zip Code | % Graduates | vs State | vs National | |
| 1. | 03774 | 40.2% | 10.4%(+29.8)#1 | 11.1%(+29.1)#2,110 |
| 2. | 03845 | 39.4% | 10.4%(+29.0)#2 | 11.1%(+28.3)#2,241 |
| 3. | 03780 | 37.8% | 10.4%(+27.4)#3 | 11.1%(+26.8)#2,514 |
| 4. | 03852 | 35.3% | 10.4%(+24.9)#4 | 11.1%(+24.2)#2,962 |
| 5. | 03872 | 32.1% | 10.4%(+21.8)#5 | 11.1%(+21.1)#3,786 |
| 6. | 03218 | 31.4% | 10.4%(+21.0)#6 | 11.1%(+20.3)#4,014 |
| 7. | 03771 | 29.9% | 10.4%(+19.5)#7 | 11.1%(+18.8)#4,524 |
| 8. | 03740 | 29.0% | 10.4%(+18.6)#8 | 11.1%(+17.9)#4,884 |
| 9. | 03864 | 28.9% | 10.4%(+18.5)#9 | 11.1%(+17.8)#4,923 |
| 10. | 03451 | 28.5% | 10.4%(+18.1)#10 | 11.1%(+17.4)#5,136 |
| 11. | 03849 | 27.9% | 10.4%(+17.6)#11 | 11.1%(+16.9)#5,342 |
| 12. | 03883 | 27.7% | 10.4%(+17.3)#12 | 11.1%(+16.6)#5,469 |
| 13. | 03465 | 26.9% | 10.4%(+16.5)#13 | 11.1%(+15.8)#5,836 |
| 14. | 03467 | 26.6% | 10.4%(+16.2)#14 | 11.1%(+15.6)#5,981 |
| 15. | 03456 | 25.3% | 10.4%(+14.9)#15 | 11.1%(+14.3)#6,700 |
| 16. | 03812 | 25.1% | 10.4%(+14.7)#16 | 11.1%(+14.0)#6,800 |
| 17. | 03262 | 24.1% | 10.4%(+13.7)#17 | 11.1%(+13.0)#7,505 |
| 18. | 03582 | 23.9% | 10.4%(+13.5)#18 | 11.1%(+12.8)#7,606 |
| 19. | 03890 | 23.5% | 10.4%(+13.1)#19 | 11.1%(+12.5)#7,852 |
| 20. | 03588 | 23.5% | 10.4%(+13.1)#20 | 11.1%(+12.4)#7,877 |
| 21. | 03284 | 23.3% | 10.4%(+13.0)#21 | 11.1%(+12.3)#7,970 |
| 22. | 03235 | 23.1% | 10.4%(+12.7)#22 | 11.1%(+12.1)#8,109 |
| 23. | 03245 | 23.0% | 10.4%(+12.6)#23 | 11.1%(+11.9)#8,217 |
| 24. | 03574 | 22.8% | 10.4%(+12.4)#24 | 11.1%(+11.7)#8,350 |
| 25. | 03592 | 22.5% | 10.4%(+12.1)#25 | 11.1%(+11.4)#8,591 |
| 26. | 03217 | 22.4% | 10.4%(+12.0)#26 | 11.1%(+11.3)#8,664 |
| 27. | 03446 | 22.2% | 10.4%(+11.8)#27 | 11.1%(+11.1)#8,806 |
| 28. | 03579 | 22.0% | 10.4%(+11.6)#28 | 11.1%(+10.9)#8,968 |
| 29. | 03605 | 21.8% | 10.4%(+11.4)#29 | 11.1%(+10.8)#9,044 |
| 30. | 03258 | 21.8% | 10.4%(+11.4)#30 | 11.1%(+10.8)#9,049 |
| 31. | 03455 | 21.6% | 10.4%(+11.2)#31 | 11.1%(+10.6)#9,215 |
| 32. | 03466 | 21.6% | 10.4%(+11.2)#32 | 11.1%(+10.5)#9,262 |
| 33. | 03448 | 21.4% | 10.4%(+11.0)#33 | 11.1%(+10.4)#9,366 |
| 34. | 03595 | 21.4% | 10.4%(+11.0)#34 | 11.1%(+10.3)#9,402 |
| 35. | 03226 | 21.3% | 10.4%(+10.9)#35 | 11.1%(+10.3)#9,458 |
| 36. | 03601 | 21.0% | 10.4%(+10.6)#36 | 11.1%(+9.93)#9,721 |
| 37. | 03280 | 20.6% | 10.4%(+10.2)#37 | 11.1%(+9.50)#10,053 |
| 38. | 03753 | 20.1% | 10.4%(+9.70)#38 | 11.1%(+9.04)#10,446 |
| 39. | 03874 | 18.7% | 10.4%(+8.35)#39 | 11.1%(+7.68)#11,661 |
| 40. | 03882 | 18.5% | 10.4%(+8.08)#40 | 11.1%(+7.42)#11,901 |
| 41. | 03450 | 18.4% | 10.4%(+7.99)#41 | 11.1%(+7.32)#11,999 |
| 42. | 03813 | 17.8% | 10.4%(+7.41)#42 | 11.1%(+6.75)#12,567 |
| 43. | 03242 | 17.7% | 10.4%(+7.31)#43 | 11.1%(+6.65)#12,665 |
| 44. | 03251 | 17.6% | 10.4%(+7.23)#44 | 11.1%(+6.56)#12,743 |
| 45. | 03818 | 16.9% | 10.4%(+6.49)#45 | 11.1%(+5.83)#13,556 |
| 46. | 03581 | 16.7% | 10.4%(+6.29)#46 | 11.1%(+5.63)#13,746 |
| 47. | 03583 | 16.5% | 10.4%(+6.15)#47 | 11.1%(+5.49)#13,953 |
| 48. | 03275 | 16.5% | 10.4%(+6.13)#48 | 11.1%(+5.47)#13,968 |
| 49. | 03894 | 16.5% | 10.4%(+6.07)#49 | 11.1%(+5.41)#14,044 |
| 50. | 03462 | 16.4% | 10.4%(+5.97)#50 | 11.1%(+5.31)#14,138 |
| 51. | 03851 | 16.3% | 10.4%(+5.86)#51 | 11.1%(+5.20)#14,245 |
| 52. | 03576 | 16.3% | 10.4%(+5.86)#52 | 11.1%(+5.20)#14,246 |
| 53. | 03782 | 16.0% | 10.4%(+5.63)#53 | 11.1%(+4.96)#14,480 |
| 54. | 03216 | 15.9% | 10.4%(+5.53)#54 | 11.1%(+4.87)#14,582 |
| 55. | 03809 | 15.9% | 10.4%(+5.47)#55 | 11.1%(+4.80)#14,664 |
| 56. | 03220 | 15.6% | 10.4%(+5.17)#56 | 11.1%(+4.51)#14,991 |
| 57. | 03470 | 15.6% | 10.4%(+5.17)#57 | 11.1%(+4.50)#14,996 |
| 58. | 03590 | 15.5% | 10.4%(+5.08)#58 | 11.1%(+4.42)#15,078 |
| 59. | 03853 | 15.4% | 10.4%(+5.03)#59 | 11.1%(+4.37)#15,135 |
| 60. | 03266 | 15.3% | 10.4%(+4.94)#60 | 11.1%(+4.27)#15,269 |
| 61. | 03848 | 15.2% | 10.4%(+4.85)#61 | 11.1%(+4.18)#15,362 |
| 62. | 03598 | 15.2% | 10.4%(+4.80)#62 | 11.1%(+4.13)#15,431 |
| 63. | 03257 | 15.0% | 10.4%(+4.62)#63 | 11.1%(+3.95)#15,659 |
| 64. | 03861 | 15.0% | 10.4%(+4.56)#64 | 11.1%(+3.90)#15,757 |
| 65. | 03052 | 14.9% | 10.4%(+4.47)#65 | 11.1%(+3.81)#15,877 |
| 66. | 03570 | 14.8% | 10.4%(+4.39)#66 | 11.1%(+3.72)#15,989 |
| 67. | 03842 | 14.7% | 10.4%(+4.32)#67 | 11.1%(+3.65)#16,069 |
| 68. | 03597 | 14.7% | 10.4%(+4.31)#68 | 11.1%(+3.65)#16,079 |
| 69. | 03036 | 14.7% | 10.4%(+4.30)#69 | 11.1%(+3.63)#16,100 |
| 70. | 03858 | 14.3% | 10.4%(+3.94)#70 | 11.1%(+3.28)#16,541 |
| 71. | 03279 | 14.3% | 10.4%(+3.89)#71 | 11.1%(+3.23)#16,639 |
| 72. | 03255 | 14.2% | 10.4%(+3.83)#72 | 11.1%(+3.16)#16,754 |
| 73. | 03452 | 14.1% | 10.4%(+3.70)#73 | 11.1%(+3.04)#16,899 |
| 74. | 03281 | 14.1% | 10.4%(+3.69)#74 | 11.1%(+3.02)#16,912 |
| 75. | 03307 | 14.0% | 10.4%(+3.59)#75 | 11.1%(+2.92)#17,042 |
| 76. | 03240 | 13.9% | 10.4%(+3.55)#76 | 11.1%(+2.89)#17,089 |
| 77. | 03301 | 13.8% | 10.4%(+3.42)#77 | 11.1%(+2.75)#17,254 |
| 78. | 03431 | 13.7% | 10.4%(+3.29)#78 | 11.1%(+2.63)#17,430 |
| 79. | 03457 | 13.6% | 10.4%(+3.17)#79 | 11.1%(+2.51)#17,557 |
| 80. | 03836 | 13.5% | 10.4%(+3.08)#80 | 11.1%(+2.41)#17,677 |
| 81. | 03034 | 13.5% | 10.4%(+3.07)#81 | 11.1%(+2.41)#17,682 |
| 82. | 03449 | 13.3% | 10.4%(+2.95)#82 | 11.1%(+2.28)#17,817 |
| 83. | 03285 | 13.3% | 10.4%(+2.95)#83 | 11.1%(+2.28)#17,819 |
| 84. | 03256 | 13.3% | 10.4%(+2.94)#84 | 11.1%(+2.27)#17,824 |
| 85. | 03293 | 13.3% | 10.4%(+2.94)#85 | 11.1%(+2.27)#17,855 |
| 86. | 03461 | 13.3% | 10.4%(+2.93)#86 | 11.1%(+2.27)#17,861 |
| 87. | 03224 | 13.1% | 10.4%(+2.70)#87 | 11.1%(+2.04)#18,130 |
| 88. | 03071 | 13.0% | 10.4%(+2.59)#88 | 11.1%(+1.92)#18,273 |
| 89. | 03867 | 13.0% | 10.4%(+2.59)#89 | 11.1%(+1.92)#18,275 |
| 90. | 03745 | 13.0% | 10.4%(+2.57)#90 | 11.1%(+1.90)#18,296 |
| 91. | 03084 | 12.9% | 10.4%(+2.50)#91 | 11.1%(+1.84)#18,393 |
| 92. | 03087 | 12.6% | 10.4%(+2.24)#92 | 11.1%(+1.58)#18,710 |
| 93. | 03602 | 12.6% | 10.4%(+2.20)#93 | 11.1%(+1.54)#18,771 |
| 94. | 03287 | 12.5% | 10.4%(+2.07)#94 | 11.1%(+1.41)#18,981 |
| 95. | 03886 | 12.4% | 10.4%(+2.00)#95 | 11.1%(+1.34)#19,068 |
| 96. | 03856 | 12.3% | 10.4%(+1.91)#96 | 11.1%(+1.25)#19,192 |
| 97. | 03102 | 12.3% | 10.4%(+1.91)#97 | 11.1%(+1.25)#19,200 |
| 98. | 03561 | 12.3% | 10.4%(+1.87)#98 | 11.1%(+1.20)#19,248 |
| 99. | 03106 | 12.2% | 10.4%(+1.79)#99 | 11.1%(+1.13)#19,349 |
| 100. | 03841 | 12.1% | 10.4%(+1.69)#100 | 11.1%(+1.02)#19,495 |
Common Questions
What are the Top 10 Zip Codes with the Highest Percentage of Population with a Degree in Education in New Hampshire?
Top 10 Zip Codes with the Highest Percentage of Population with a Degree in Education in New Hampshire are:
What zip code has the Highest Percentage of Population with a Degree in Education in New Hampshire?
03774 has the Highest Percentage of Population with a Degree in Education in New Hampshire with 40.2%.
What is the Percentage of Population with a Degree in Education in the State of New Hampshire?
Percentage of Population with a Degree in Education in New Hampshire is 10.4%.
What is the Percentage of Population with a Degree in Education in the United States?
Percentage of Population with a Degree in Education in the United States is 11.1%.