Webster County, KY Map & Demographics
Webster County Overview
$25,177
PER CAPITA INCOME
$63,719
AVG FAMILY INCOME
$55,451
AVG HOUSEHOLD INCOME
31.5%
WAGE / INCOME GAP [ % ]
68.5¢/ $1
WAGE / INCOME GAP [ $ ]
$7,066
FAMILY INCOME DEFICIT
0.42
INEQUALITY / GINI INDEX
12,951
TOTAL POPULATION
6,488
MALE POPULATION
6,463
FEMALE POPULATION
100.39
MALES / 100 FEMALES
99.61
FEMALES / 100 MALES
39.7
MEDIAN AGE
3.0
AVG FAMILY SIZE
2.6
AVG HOUSEHOLD SIZE
5,681
LABOR FORCE [ PEOPLE ]
55.2%
PERCENT IN LABOR FORCE
5.9%
UNEMPLOYMENT RATE
Webster County Area Codes
Income in Webster County
Income Overview in Webster County
Per Capita Income in Webster County is $25,177, while median incomes of families and households are $63,719 and $55,451 respectively.
| Characteristic | Number | Measure |
| Per Capita Income | 12,951 | $25,177 |
| Median Family Income | 3,434 | $63,719 |
| Mean Family Income | 3,434 | $76,703 |
| Median Household Income | 4,819 | $55,451 |
| Mean Household Income | 4,819 | $65,556 |
| Income Deficit | 3,434 | $7,066 |
| Wage / Income Gap (%) | 12,951 | 31.49% |
| Wage / Income Gap ($) | 12,951 | 68.51¢ per $1 |
| Gini / Inequality Index | 12,951 | 0.42 |
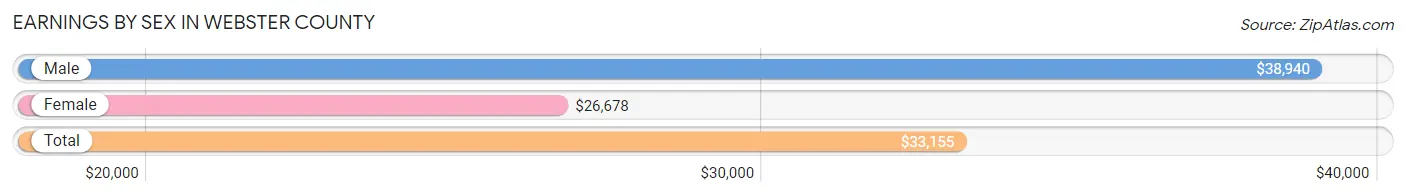
Earnings by Sex in Webster County
Average Earnings in Webster County are $33,155, $38,940 for men and $26,678 for women, a difference of 31.5%.
| Sex | Number | Average Earnings |
| Male | 3,147 (52.6%) | $38,940 |
| Female | 2,837 (47.4%) | $26,678 |
| Total | 5,984 (100.0%) | $33,155 |
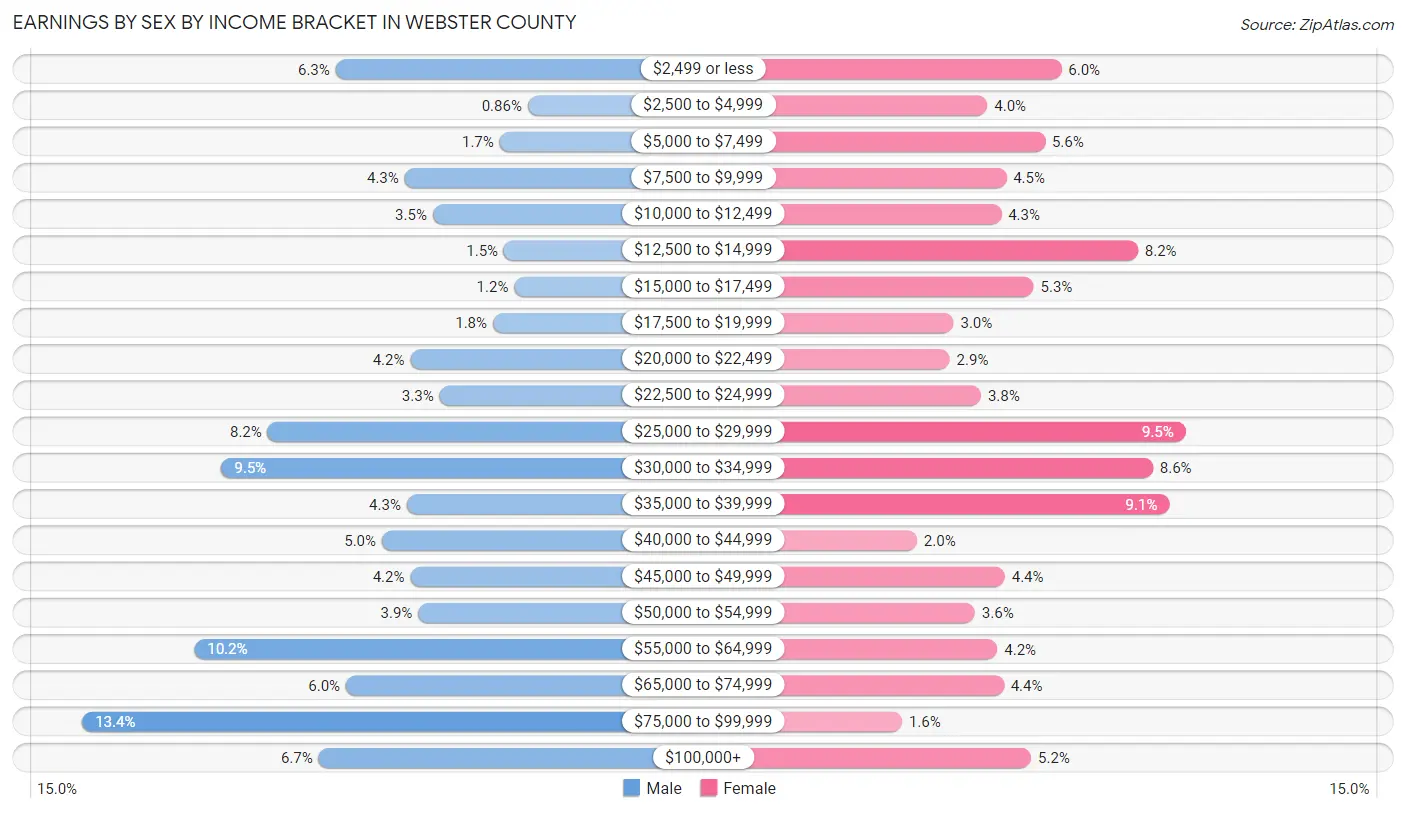
Earnings by Sex by Income Bracket in Webster County
The most common earnings brackets in Webster County are $75,000 to $99,999 for men (421 | 13.4%) and $25,000 to $29,999 for women (270 | 9.5%).
| Income | Male | Female |
| $2,499 or less | 197 (6.3%) | 171 (6.0%) |
| $2,500 to $4,999 | 27 (0.9%) | 112 (4.0%) |
| $5,000 to $7,499 | 52 (1.7%) | 158 (5.6%) |
| $7,500 to $9,999 | 136 (4.3%) | 127 (4.5%) |
| $10,000 to $12,499 | 111 (3.5%) | 123 (4.3%) |
| $12,500 to $14,999 | 48 (1.5%) | 232 (8.2%) |
| $15,000 to $17,499 | 39 (1.2%) | 149 (5.2%) |
| $17,500 to $19,999 | 58 (1.8%) | 85 (3.0%) |
| $20,000 to $22,499 | 131 (4.2%) | 82 (2.9%) |
| $22,500 to $24,999 | 105 (3.3%) | 107 (3.8%) |
| $25,000 to $29,999 | 257 (8.2%) | 270 (9.5%) |
| $30,000 to $34,999 | 298 (9.5%) | 244 (8.6%) |
| $35,000 to $39,999 | 134 (4.3%) | 257 (9.1%) |
| $40,000 to $44,999 | 156 (5.0%) | 56 (2.0%) |
| $45,000 to $49,999 | 131 (4.2%) | 126 (4.4%) |
| $50,000 to $54,999 | 124 (3.9%) | 102 (3.6%) |
| $55,000 to $64,999 | 322 (10.2%) | 120 (4.2%) |
| $65,000 to $74,999 | 188 (6.0%) | 125 (4.4%) |
| $75,000 to $99,999 | 421 (13.4%) | 44 (1.5%) |
| $100,000+ | 212 (6.7%) | 147 (5.2%) |
| Total | 3,147 (100.0%) | 2,837 (100.0%) |
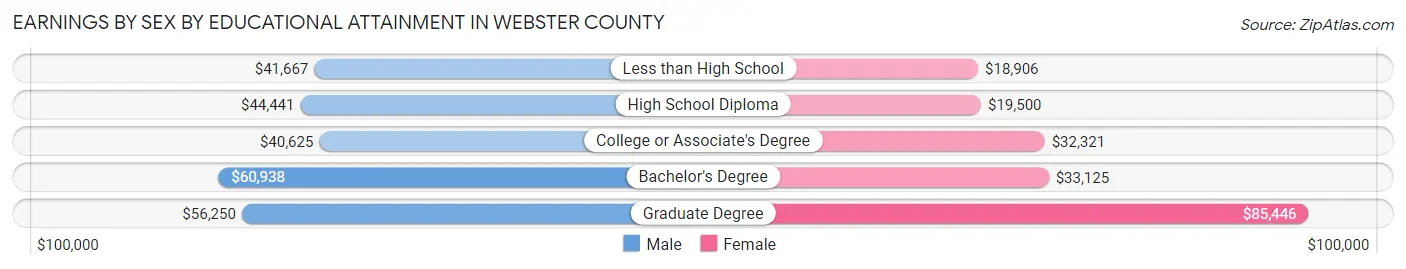
Earnings by Sex by Educational Attainment in Webster County
Average earnings in Webster County are $44,877 for men and $29,065 for women, a difference of 35.2%. Men with an educational attainment of bachelor's degree enjoy the highest average annual earnings of $60,938, while those with college or associate's degree education earn the least with $40,625. Women with an educational attainment of graduate degree earn the most with the average annual earnings of $85,446, while those with less than high school education have the smallest earnings of $18,906.
| Educational Attainment | Male Income | Female Income |
| Less than High School | $41,667 | $18,906 |
| High School Diploma | $44,441 | $19,500 |
| College or Associate's Degree | $40,625 | $32,321 |
| Bachelor's Degree | $60,938 | $33,125 |
| Graduate Degree | $56,250 | $85,446 |
| Total | $44,877 | $29,065 |
Family Income in Webster County
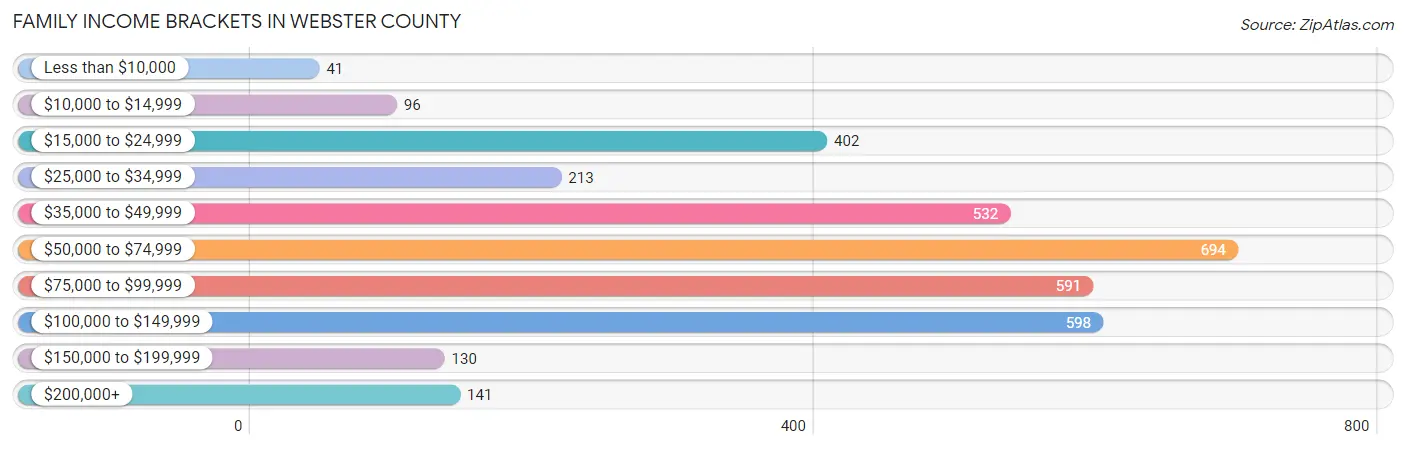
Family Income Brackets in Webster County
According to the Webster County family income data, there are 694 families falling into the $50,000 to $74,999 income range, which is the most common income bracket and makes up 20.2% of all families. Conversely, the less than $10,000 income bracket is the least frequent group with only 41 families (1.2%) belonging to this category.
| Income Bracket | # Families | % Families |
| Less than $10,000 | 41 | 1.2% |
| $10,000 to $14,999 | 96 | 2.8% |
| $15,000 to $24,999 | 402 | 11.7% |
| $25,000 to $34,999 | 213 | 6.2% |
| $35,000 to $49,999 | 532 | 15.5% |
| $50,000 to $74,999 | 694 | 20.2% |
| $75,000 to $99,999 | 591 | 17.2% |
| $100,000 to $149,999 | 598 | 17.4% |
| $150,000 to $199,999 | 130 | 3.8% |
| $200,000+ | 141 | 4.1% |
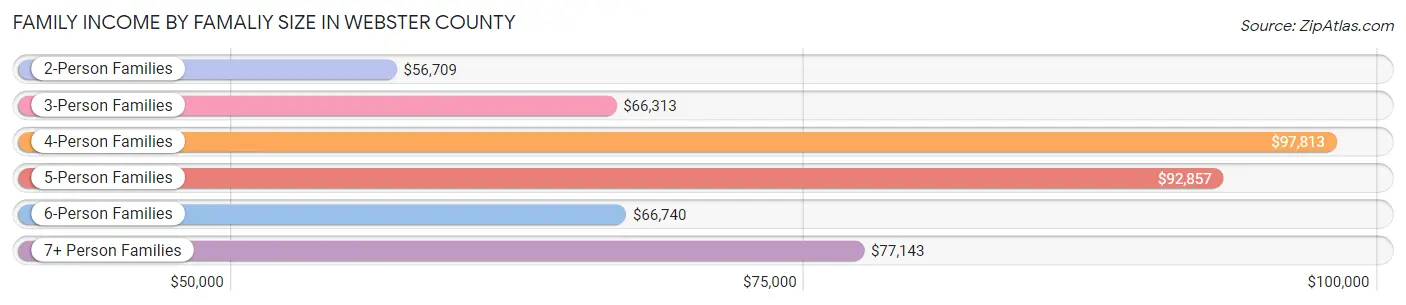
Family Income by Famaliy Size in Webster County
4-person families (368 | 10.7%) account for the highest median family income in Webster County with $97,813 per family, while 2-person families (1,874 | 54.6%) have the highest median income of $28,354 per family member.
| Income Bracket | # Families | Median Income |
| 2-Person Families | 1,874 (54.6%) | $56,709 |
| 3-Person Families | 785 (22.9%) | $66,313 |
| 4-Person Families | 368 (10.7%) | $97,813 |
| 5-Person Families | 180 (5.2%) | $92,857 |
| 6-Person Families | 169 (4.9%) | $66,740 |
| 7+ Person Families | 58 (1.7%) | $77,143 |
| Total | 3,434 (100.0%) | $63,719 |
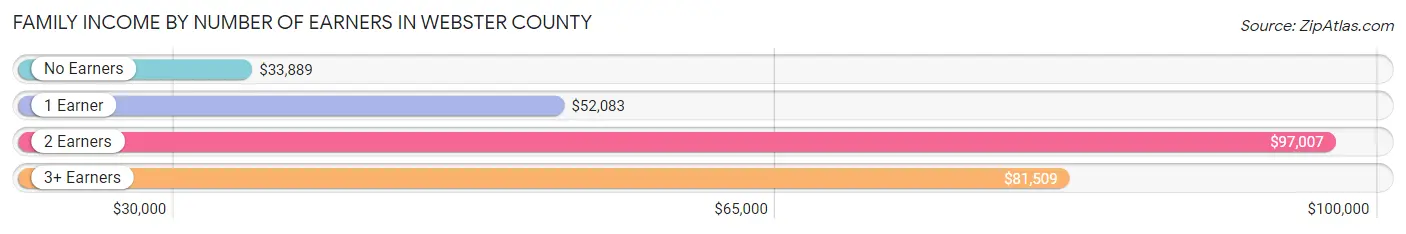
Family Income by Number of Earners in Webster County
The median family income in Webster County is $63,719, with families comprising 2 earners (1,131) having the highest median family income of $97,007, while families with no earners (714) have the lowest median family income of $33,889, accounting for 32.9% and 20.8% of families, respectively.
| Number of Earners | # Families | Median Income |
| No Earners | 714 (20.8%) | $33,889 |
| 1 Earner | 1,162 (33.8%) | $52,083 |
| 2 Earners | 1,131 (32.9%) | $97,007 |
| 3+ Earners | 427 (12.4%) | $81,509 |
| Total | 3,434 (100.0%) | $63,719 |
Household Income in Webster County
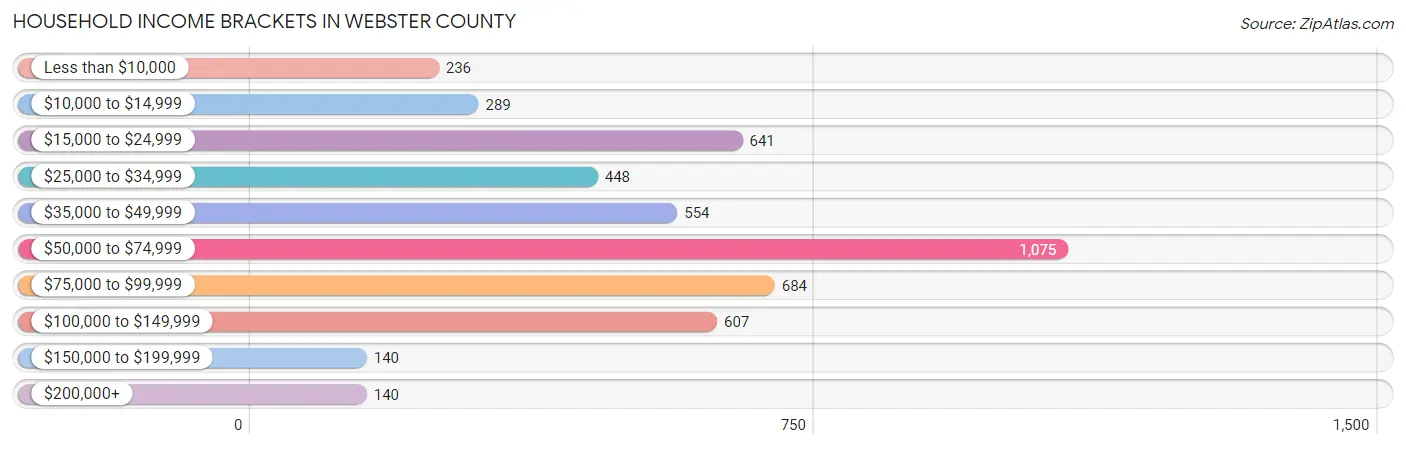
Household Income Brackets in Webster County
With 1,075 households falling in the category, the $50,000 to $74,999 income range is the most frequent in Webster County, accounting for 22.3% of all households. In contrast, only 140 households (2.9%) fall into the $150,000 to $199,999 income bracket, making it the least populous group.
| Income Bracket | # Households | % Households |
| Less than $10,000 | 236 | 4.9% |
| $10,000 to $14,999 | 289 | 6.0% |
| $15,000 to $24,999 | 641 | 13.3% |
| $25,000 to $34,999 | 448 | 9.3% |
| $35,000 to $49,999 | 554 | 11.5% |
| $50,000 to $74,999 | 1,075 | 22.3% |
| $75,000 to $99,999 | 684 | 14.2% |
| $100,000 to $149,999 | 607 | 12.6% |
| $150,000 to $199,999 | 140 | 2.9% |
| $200,000+ | 140 | 2.9% |
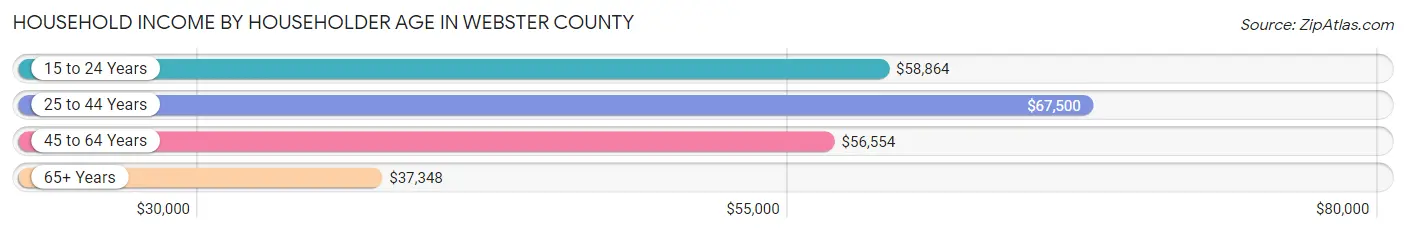
Household Income by Householder Age in Webster County
The median household income in Webster County is $55,451, with the highest median household income of $67,500 found in the 25 to 44 years age bracket for the primary householder. A total of 1,266 households (26.3%) fall into this category. Meanwhile, the 65+ years age bracket for the primary householder has the lowest median household income of $37,348, with 1,510 households (31.3%) in this group.
| Income Bracket | # Households | Median Income |
| 15 to 24 Years | 206 (4.3%) | $58,864 |
| 25 to 44 Years | 1,266 (26.3%) | $67,500 |
| 45 to 64 Years | 1,837 (38.1%) | $56,554 |
| 65+ Years | 1,510 (31.3%) | $37,348 |
| Total | 4,819 (100.0%) | $55,451 |
Poverty in Webster County
Income Below Poverty by Sex and Age in Webster County
With 16.5% poverty level for males and 15.6% for females among the residents of Webster County, 15 year old males and 75 year old and over females are the most vulnerable to poverty, with 42 males (54.5%) and 129 females (29.0%) in their respective age groups living below the poverty level.
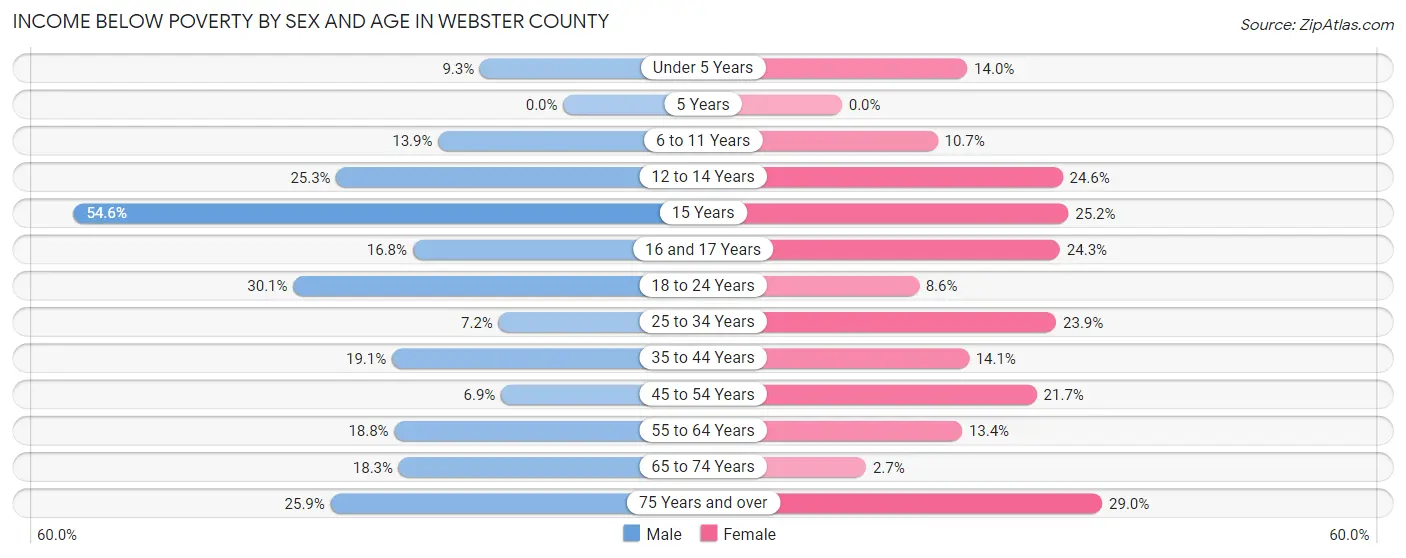
| Age Bracket | Male | Female |
| Under 5 Years | 36 (9.3%) | 55 (14.0%) |
| 5 Years | 0 (0.0%) | 0 (0.0%) |
| 6 to 11 Years | 73 (13.9%) | 60 (10.7%) |
| 12 to 14 Years | 47 (25.3%) | 44 (24.6%) |
| 15 Years | 42 (54.5%) | 28 (25.2%) |
| 16 and 17 Years | 29 (16.8%) | 43 (24.3%) |
| 18 to 24 Years | 178 (30.1%) | 46 (8.6%) |
| 25 to 34 Years | 53 (7.2%) | 164 (23.9%) |
| 35 to 44 Years | 141 (19.1%) | 104 (14.1%) |
| 45 to 54 Years | 57 (6.9%) | 174 (21.7%) |
| 55 to 64 Years | 167 (18.8%) | 118 (13.4%) |
| 65 to 74 Years | 122 (18.3%) | 20 (2.7%) |
| 75 Years and over | 92 (25.9%) | 129 (29.0%) |
| Total | 1,037 (16.5%) | 985 (15.6%) |
Income Above Poverty by Sex and Age in Webster County
According to the poverty statistics in Webster County, males aged 5 years and females aged 5 years are the age groups that are most secure financially, with 100.0% of males and 100.0% of females in these age groups living above the poverty line.
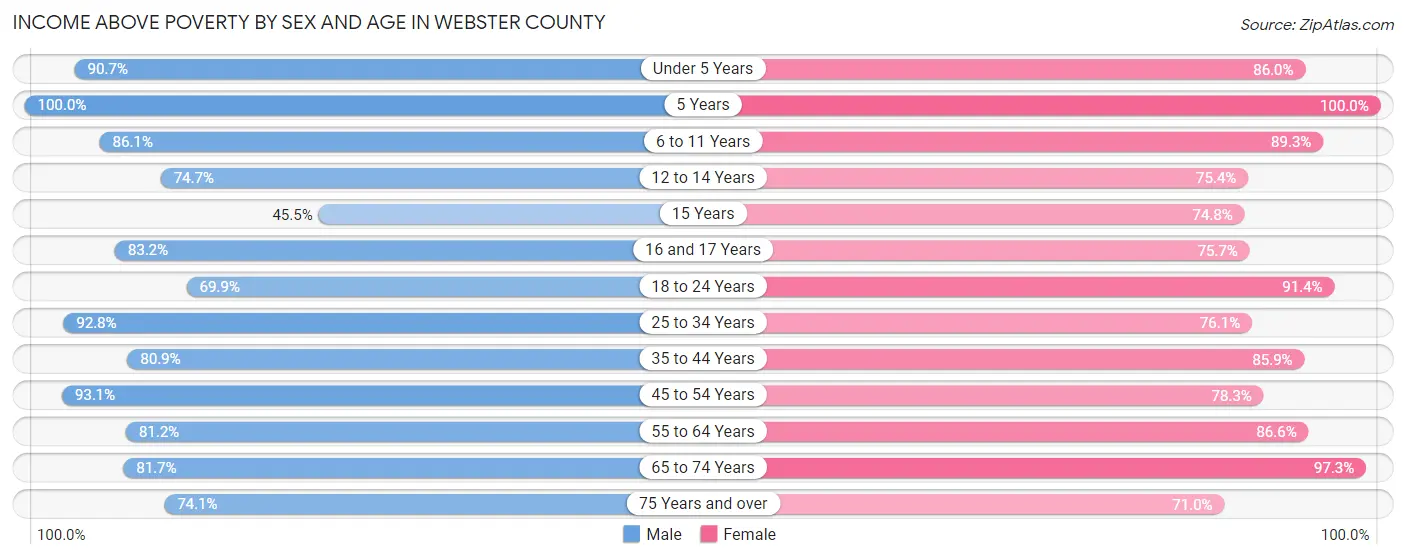
| Age Bracket | Male | Female |
| Under 5 Years | 352 (90.7%) | 339 (86.0%) |
| 5 Years | 121 (100.0%) | 64 (100.0%) |
| 6 to 11 Years | 451 (86.1%) | 503 (89.3%) |
| 12 to 14 Years | 139 (74.7%) | 135 (75.4%) |
| 15 Years | 35 (45.5%) | 83 (74.8%) |
| 16 and 17 Years | 144 (83.2%) | 134 (75.7%) |
| 18 to 24 Years | 414 (69.9%) | 491 (91.4%) |
| 25 to 34 Years | 683 (92.8%) | 523 (76.1%) |
| 35 to 44 Years | 598 (80.9%) | 632 (85.9%) |
| 45 to 54 Years | 767 (93.1%) | 628 (78.3%) |
| 55 to 64 Years | 721 (81.2%) | 764 (86.6%) |
| 65 to 74 Years | 544 (81.7%) | 723 (97.3%) |
| 75 Years and over | 263 (74.1%) | 316 (71.0%) |
| Total | 5,232 (83.5%) | 5,335 (84.4%) |
Income Below Poverty Among Married-Couple Families in Webster County
The poverty statistics for married-couple families in Webster County show that 9.1% or 227 of the total 2,480 families live below the poverty line. Families with no children have the highest poverty rate of 10.4%, comprising of 176 families. On the other hand, families with 5 or more children have the lowest poverty rate of 0.0%, which includes 0 families.
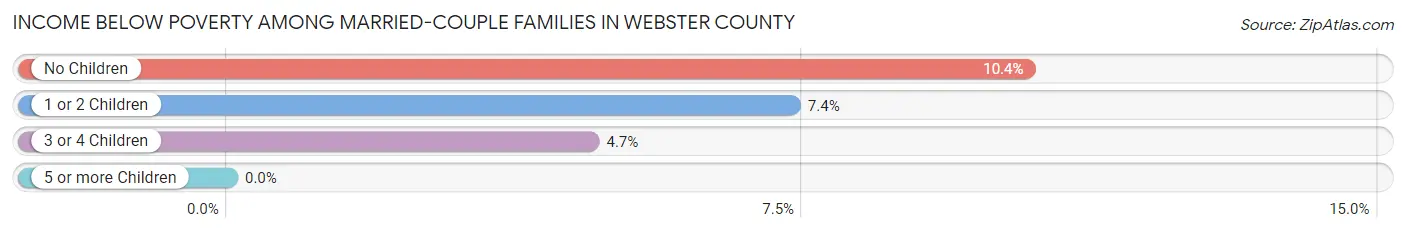
| Children | Above Poverty | Below Poverty |
| No Children | 1,514 (89.6%) | 176 (10.4%) |
| 1 or 2 Children | 517 (92.6%) | 41 (7.3%) |
| 3 or 4 Children | 202 (95.3%) | 10 (4.7%) |
| 5 or more Children | 20 (100.0%) | 0 (0.0%) |
| Total | 2,253 (90.8%) | 227 (9.1%) |
Income Below Poverty Among Single-Parent Households in Webster County
According to the poverty data in Webster County, 14.0% or 57 single-father households and 27.4% or 150 single-mother households are living below the poverty line. Among single-father households, those with 3 or 4 children have the highest poverty rate, with 12 households (32.4%) experiencing poverty. Likewise, among single-mother households, those with 1 or 2 children have the highest poverty rate, with 101 households (30.5%) falling below the poverty line.
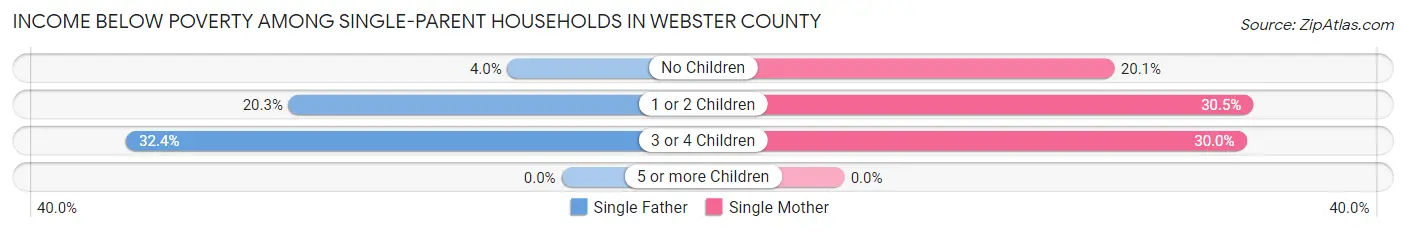
| Children | Single Father | Single Mother |
| No Children | 7 (4.0%) | 31 (20.1%) |
| 1 or 2 Children | 38 (20.3%) | 101 (30.5%) |
| 3 or 4 Children | 12 (32.4%) | 18 (30.0%) |
| 5 or more Children | 0 (0.0%) | 0 (0.0%) |
| Total | 57 (14.0%) | 150 (27.4%) |
Income Below Poverty Among Married-Couple vs Single-Parent Households in Webster County
The poverty data for Webster County shows that 227 of the married-couple family households (9.1%) and 207 of the single-parent households (21.7%) are living below the poverty level. Within the married-couple family households, those with no children have the highest poverty rate, with 176 households (10.4%) falling below the poverty line. Among the single-parent households, those with 3 or 4 children have the highest poverty rate, with 30 household (30.9%) living below poverty.
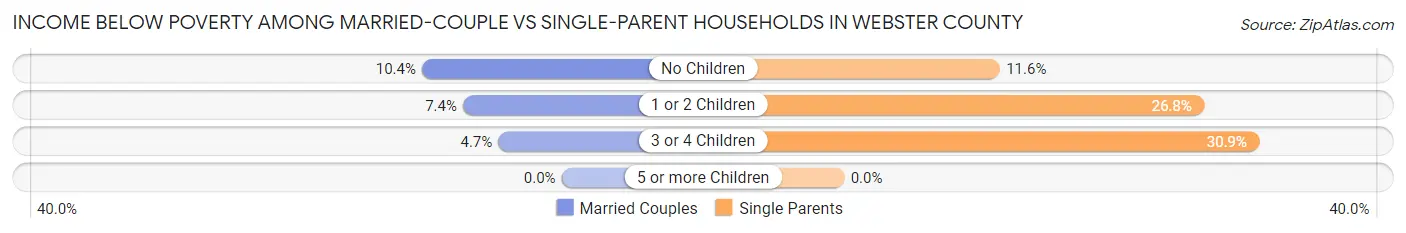
| Children | Married-Couple Families | Single-Parent Households |
| No Children | 176 (10.4%) | 38 (11.6%) |
| 1 or 2 Children | 41 (7.3%) | 139 (26.8%) |
| 3 or 4 Children | 10 (4.7%) | 30 (30.9%) |
| 5 or more Children | 0 (0.0%) | 0 (0.0%) |
| Total | 227 (9.1%) | 207 (21.7%) |
Race in Webster County
The most populous races in Webster County are White / Caucasian (11,643 | 89.9%), Hispanic or Latino (752 | 5.8%), and Black / African American (534 | 4.1%).
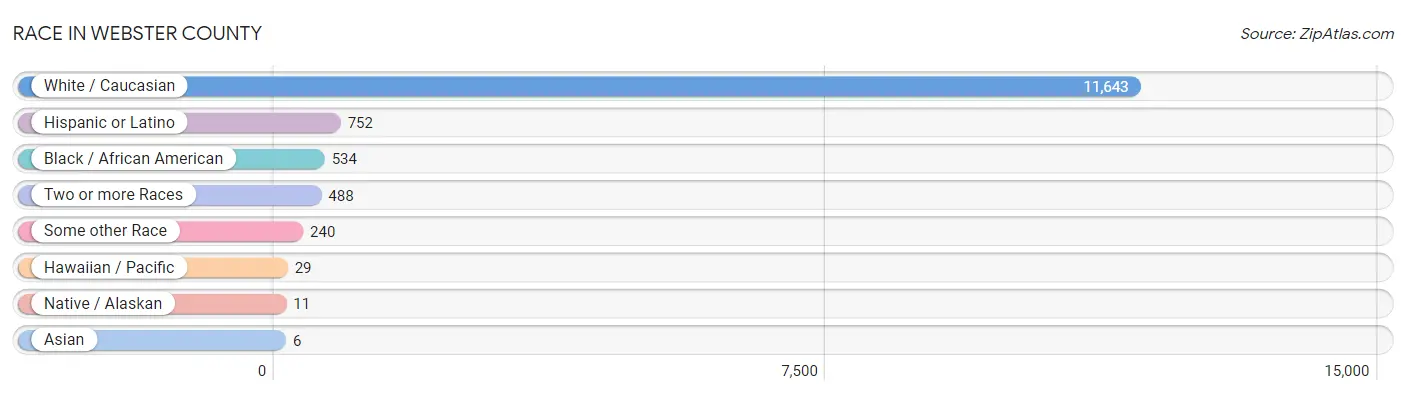
| Race | # Population | % Population |
| Asian | 6 | 0.1% |
| Black / African American | 534 | 4.1% |
| Hawaiian / Pacific | 29 | 0.2% |
| Hispanic or Latino | 752 | 5.8% |
| Native / Alaskan | 11 | 0.1% |
| White / Caucasian | 11,643 | 89.9% |
| Two or more Races | 488 | 3.8% |
| Some other Race | 240 | 1.8% |
| Total | 12,951 | 100.0% |
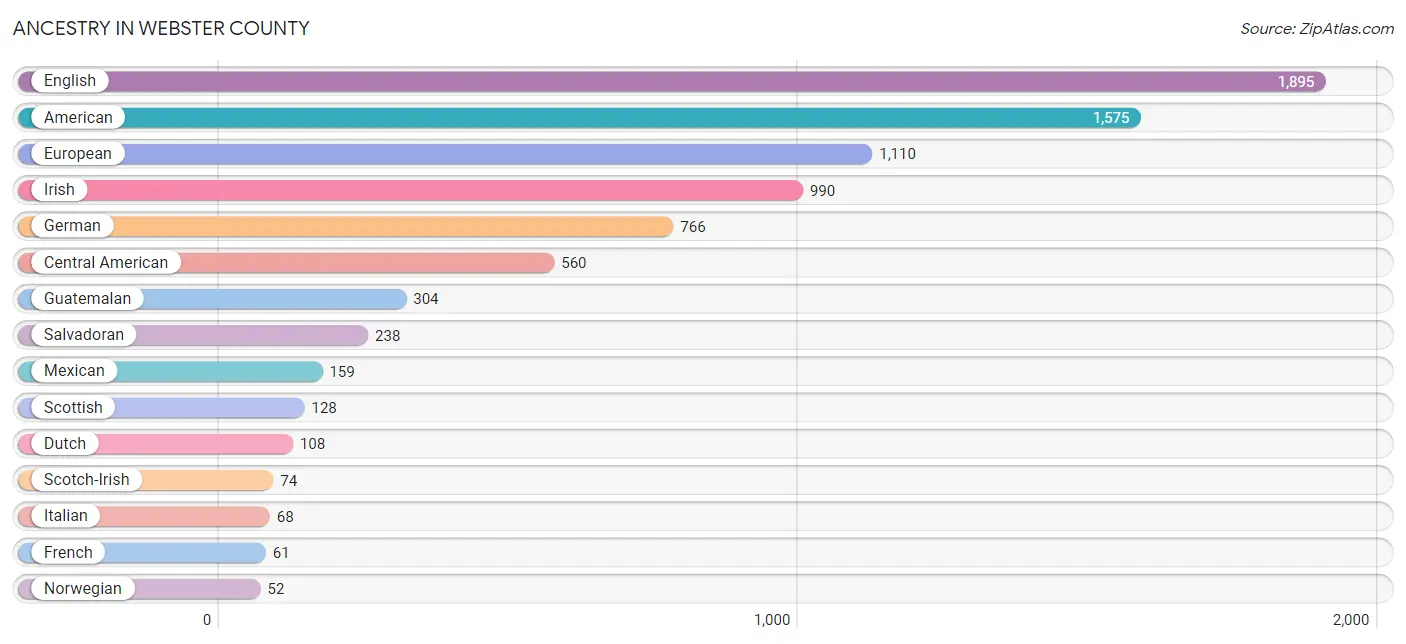
Ancestry in Webster County
The most populous ancestries reported in Webster County are English (1,895 | 14.6%), American (1,575 | 12.2%), European (1,110 | 8.6%), Irish (990 | 7.6%), and German (766 | 5.9%), together accounting for 48.9% of all Webster County residents.
| Ancestry | # Population | % Population |
| African | 8 | 0.1% |
| American | 1,575 | 12.2% |
| Arab | 1 | 0.0% |
| Blackfeet | 3 | 0.0% |
| British | 16 | 0.1% |
| Burmese | 4 | 0.0% |
| Canadian | 41 | 0.3% |
| Central American | 560 | 4.3% |
| Central American Indian | 13 | 0.1% |
| Cherokee | 14 | 0.1% |
| Danish | 8 | 0.1% |
| Dutch | 108 | 0.8% |
| English | 1,895 | 14.6% |
| European | 1,110 | 8.6% |
| French | 61 | 0.5% |
| French Canadian | 3 | 0.0% |
| German | 766 | 5.9% |
| Greek | 34 | 0.3% |
| Guatemalan | 304 | 2.4% |
| Honduran | 6 | 0.1% |
| Indian (Asian) | 2 | 0.0% |
| Irish | 990 | 7.6% |
| Italian | 68 | 0.5% |
| Lebanese | 1 | 0.0% |
| Mexican | 159 | 1.2% |
| Native Hawaiian | 29 | 0.2% |
| Nicaraguan | 12 | 0.1% |
| Norwegian | 52 | 0.4% |
| Peruvian | 3 | 0.0% |
| Polish | 24 | 0.2% |
| Portuguese | 30 | 0.2% |
| Salvadoran | 238 | 1.8% |
| Samoan | 29 | 0.2% |
| Scotch-Irish | 74 | 0.6% |
| Scottish | 128 | 1.0% |
| South American | 3 | 0.0% |
| South American Indian | 3 | 0.0% |
| Spanish | 1 | 0.0% |
| Subsaharan African | 8 | 0.1% |
| Swedish | 14 | 0.1% |
| Ukrainian | 9 | 0.1% |
| Welsh | 29 | 0.2% | View All 42 Rows |
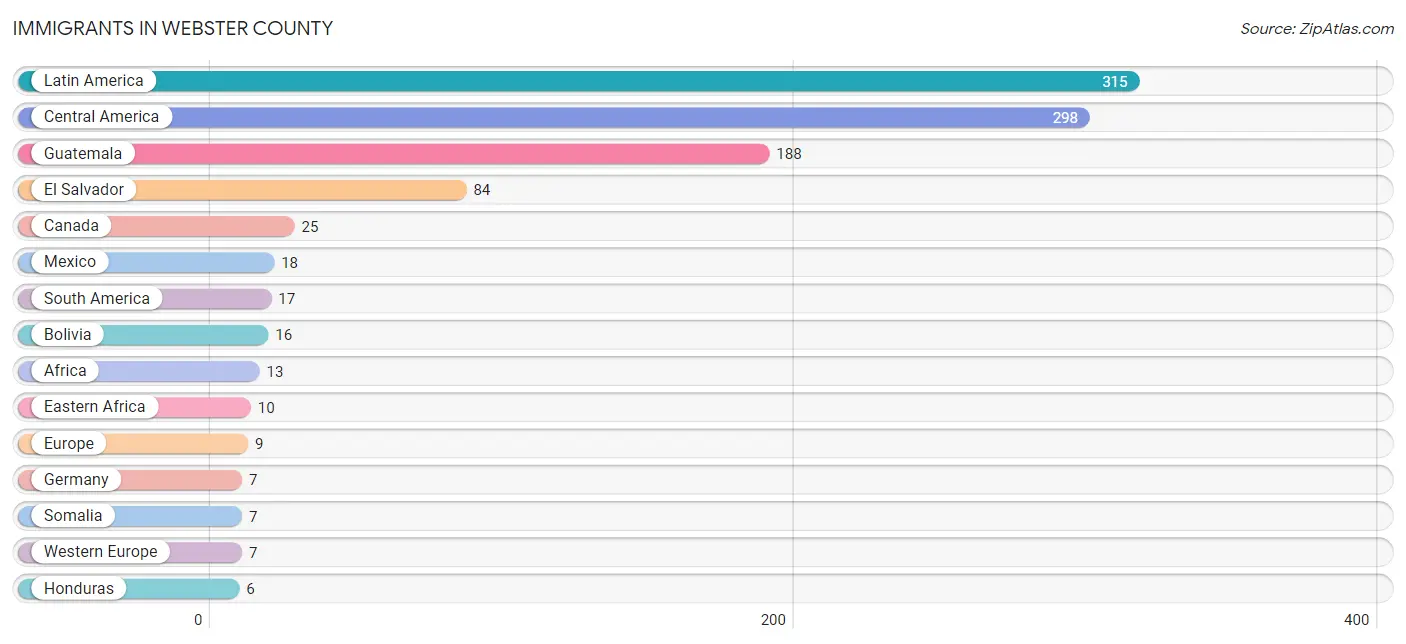
Immigrants in Webster County
The most numerous immigrant groups reported in Webster County came from Latin America (315 | 2.4%), Central America (298 | 2.3%), Guatemala (188 | 1.5%), El Salvador (84 | 0.6%), and Canada (25 | 0.2%), together accounting for 7.0% of all Webster County residents.
| Immigration Origin | # Population | % Population |
| Africa | 13 | 0.1% |
| Asia | 5 | 0.0% |
| Bolivia | 16 | 0.1% |
| Canada | 25 | 0.2% |
| Central America | 298 | 2.3% |
| Eastern Africa | 10 | 0.1% |
| Eastern Asia | 5 | 0.0% |
| El Salvador | 84 | 0.6% |
| Europe | 9 | 0.1% |
| Germany | 7 | 0.1% |
| Guatemala | 188 | 1.5% |
| Honduras | 6 | 0.1% |
| Ireland | 2 | 0.0% |
| Korea | 5 | 0.0% |
| Latin America | 315 | 2.4% |
| Mexico | 18 | 0.1% |
| Nicaragua | 2 | 0.0% |
| Northern Europe | 2 | 0.0% |
| Peru | 1 | 0.0% |
| Somalia | 7 | 0.1% |
| South America | 17 | 0.1% |
| Western Europe | 7 | 0.1% | View All 22 Rows |
Sex and Age in Webster County
Sex and Age in Webster County
The most populous age groups in Webster County are 60 to 64 Years (583 | 9.0%) for men and 60 to 64 Years (562 | 8.7%) for women.
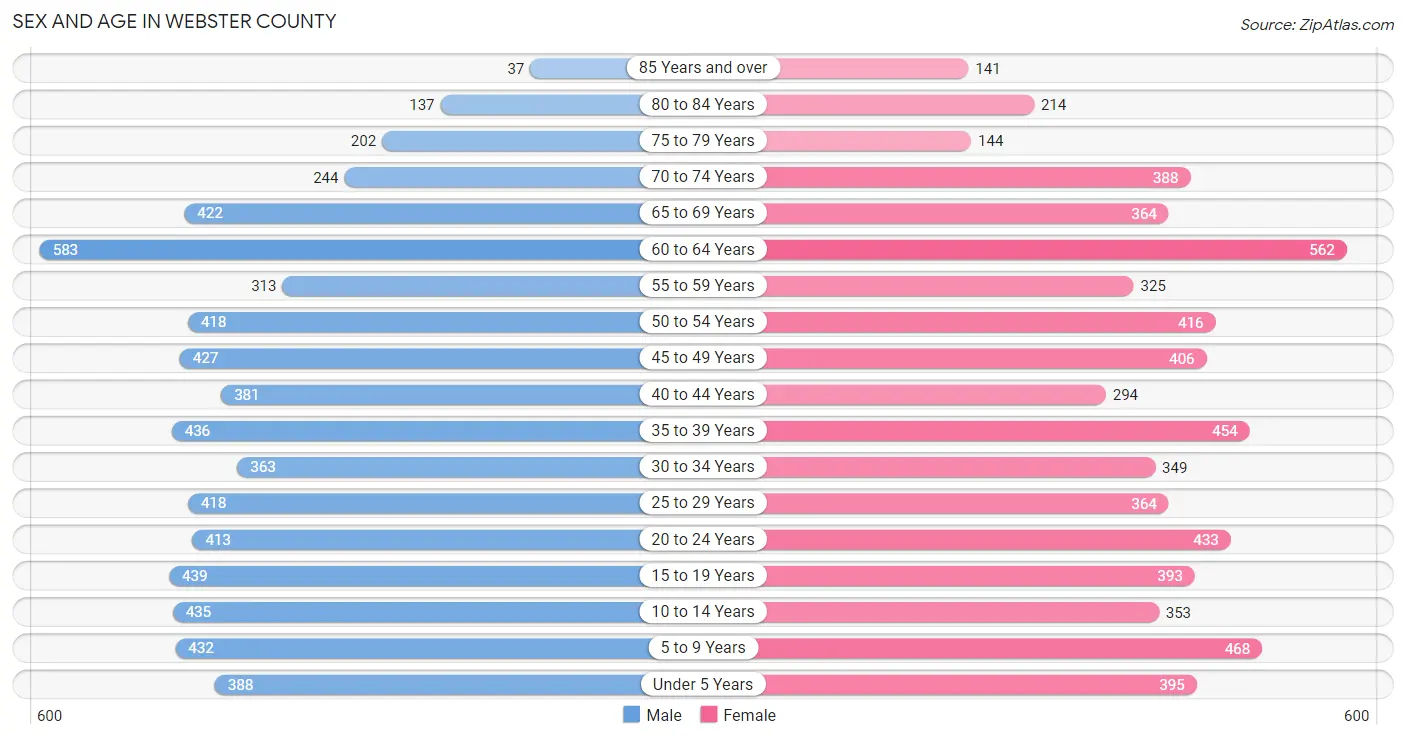
| Age Bracket | Male | Female |
| Under 5 Years | 388 (6.0%) | 395 (6.1%) |
| 5 to 9 Years | 432 (6.7%) | 468 (7.2%) |
| 10 to 14 Years | 435 (6.7%) | 353 (5.5%) |
| 15 to 19 Years | 439 (6.8%) | 393 (6.1%) |
| 20 to 24 Years | 413 (6.4%) | 433 (6.7%) |
| 25 to 29 Years | 418 (6.4%) | 364 (5.6%) |
| 30 to 34 Years | 363 (5.6%) | 349 (5.4%) |
| 35 to 39 Years | 436 (6.7%) | 454 (7.0%) |
| 40 to 44 Years | 381 (5.9%) | 294 (4.5%) |
| 45 to 49 Years | 427 (6.6%) | 406 (6.3%) |
| 50 to 54 Years | 418 (6.4%) | 416 (6.4%) |
| 55 to 59 Years | 313 (4.8%) | 325 (5.0%) |
| 60 to 64 Years | 583 (9.0%) | 562 (8.7%) |
| 65 to 69 Years | 422 (6.5%) | 364 (5.6%) |
| 70 to 74 Years | 244 (3.8%) | 388 (6.0%) |
| 75 to 79 Years | 202 (3.1%) | 144 (2.2%) |
| 80 to 84 Years | 137 (2.1%) | 214 (3.3%) |
| 85 Years and over | 37 (0.6%) | 141 (2.2%) |
| Total | 6,488 (100.0%) | 6,463 (100.0%) |
Families and Households in Webster County
Median Family Size in Webster County
The median family size in Webster County is 3.04 persons per family, with single female/mother families (547 | 15.9%) accounting for the largest median family size of 3.2 persons per family. On the other hand, single male/father families (407 | 11.8%) represent the smallest median family size with 2.76 persons per family.
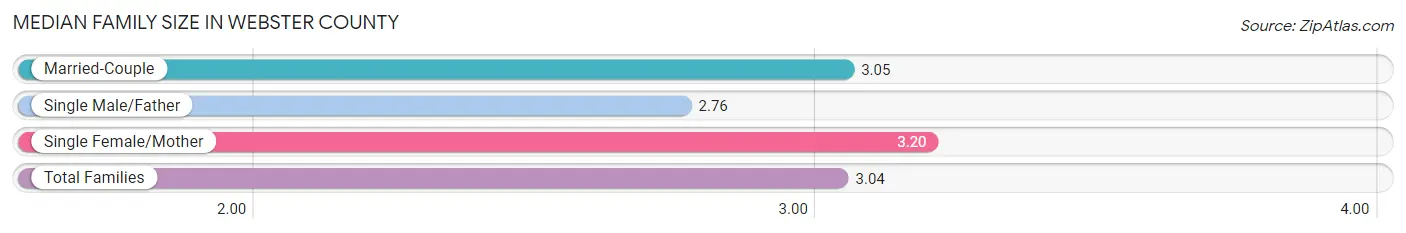
| Family Type | # Families | Family Size |
| Married-Couple | 2,480 (72.2%) | 3.05 |
| Single Male/Father | 407 (11.8%) | 2.76 |
| Single Female/Mother | 547 (15.9%) | 3.20 |
| Total Families | 3,434 (100.0%) | 3.04 |
Median Household Size in Webster County
The median household size in Webster County is 2.60 persons per household, with single female/mother households (547 | 11.4%) accounting for the largest median household size of 3.57 persons per household. non-family households (1,385 | 28.7%) represent the smallest median household size with 1.16 persons per household.
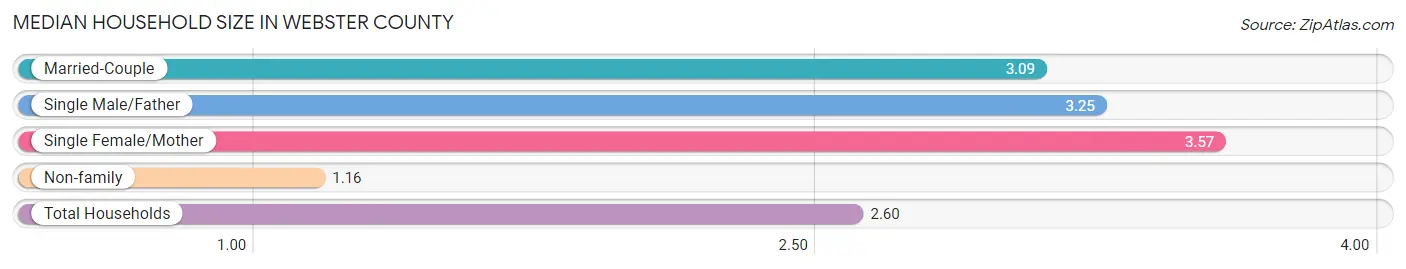
| Household Type | # Households | Household Size |
| Married-Couple | 2,480 (51.5%) | 3.09 |
| Single Male/Father | 407 (8.5%) | 3.25 |
| Single Female/Mother | 547 (11.4%) | 3.57 |
| Non-family | 1,385 (28.7%) | 1.16 |
| Total Households | 4,819 (100.0%) | 2.60 |
Household Size by Marriage Status in Webster County
Out of a total of 4,819 households in Webster County, 3,434 (71.3%) are family households, while 1,385 (28.7%) are nonfamily households. The most numerous type of family households are 2-person households, comprising 1,707, and the most common type of nonfamily households are 1-person households, comprising 1,181.
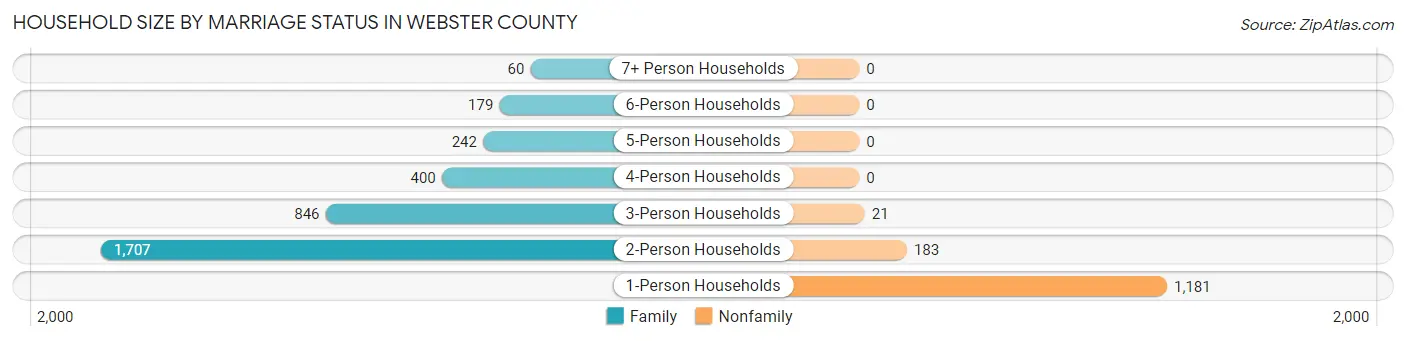
| Household Size | Family Households | Nonfamily Households |
| 1-Person Households | - | 1,181 (24.5%) |
| 2-Person Households | 1,707 (35.4%) | 183 (3.8%) |
| 3-Person Households | 846 (17.6%) | 21 (0.4%) |
| 4-Person Households | 400 (8.3%) | 0 (0.0%) |
| 5-Person Households | 242 (5.0%) | 0 (0.0%) |
| 6-Person Households | 179 (3.7%) | 0 (0.0%) |
| 7+ Person Households | 60 (1.3%) | 0 (0.0%) |
| Total | 3,434 (71.3%) | 1,385 (28.7%) |
Female Fertility in Webster County
Fertility by Age in Webster County
Average fertility rate in Webster County is 68.0 births per 1,000 women. Women in the age bracket of 20 to 34 years have the highest fertility rate with 133.0 births per 1,000 women. Women in the age bracket of 20 to 34 years acount for 80.4% of all women with births.
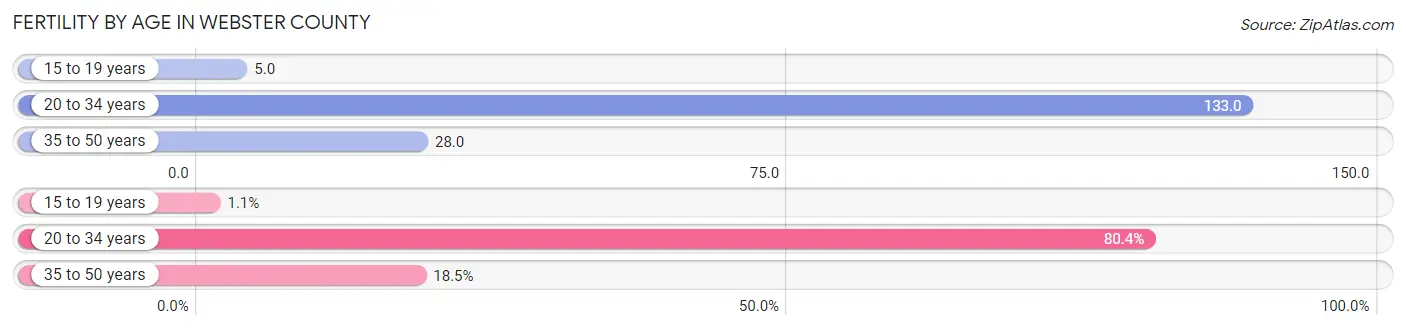
| Age Bracket | Women with Births | Births / 1,000 Women |
| 15 to 19 years | 2 (1.1%) | 5.0 |
| 20 to 34 years | 152 (80.4%) | 133.0 |
| 35 to 50 years | 35 (18.5%) | 28.0 |
| Total | 189 (100.0%) | 68.0 |
Fertility by Age by Marriage Status in Webster County
55.6% of women with births (189) in Webster County are married. The highest percentage of unmarried women with births falls into 15 to 19 years age bracket with 100.0% of them unmarried at the time of birth, while the lowest percentage of unmarried women with births belong to 35 to 50 years age bracket with 0.0% of them unmarried.
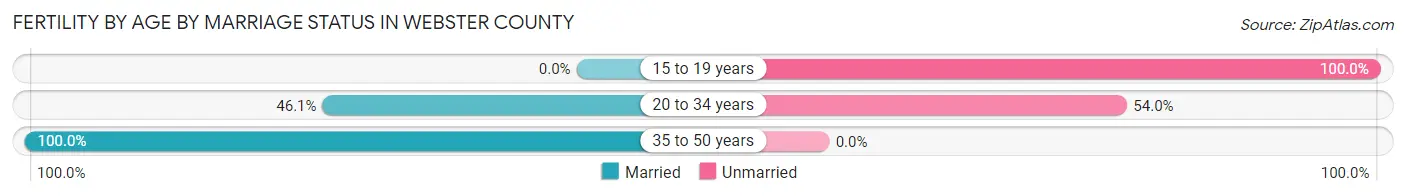
| Age Bracket | Married | Unmarried |
| 15 to 19 years | 0 (0.0%) | 2 (100.0%) |
| 20 to 34 years | 70 (46.1%) | 82 (53.9%) |
| 35 to 50 years | 35 (100.0%) | 0 (0.0%) |
| Total | 105 (55.6%) | 84 (44.4%) |
Fertility by Education in Webster County
Average fertility rate in Webster County is 68.0 births per 1,000 women. Women with the education attainment of graduate degree have the highest fertility rate of 216.0 births per 1,000 women, while women with the education attainment of college or associate's degree have the lowest fertility at 16.0 births per 1,000 women. Women with the education attainment of high school diploma represent 58.7% of all women with births.
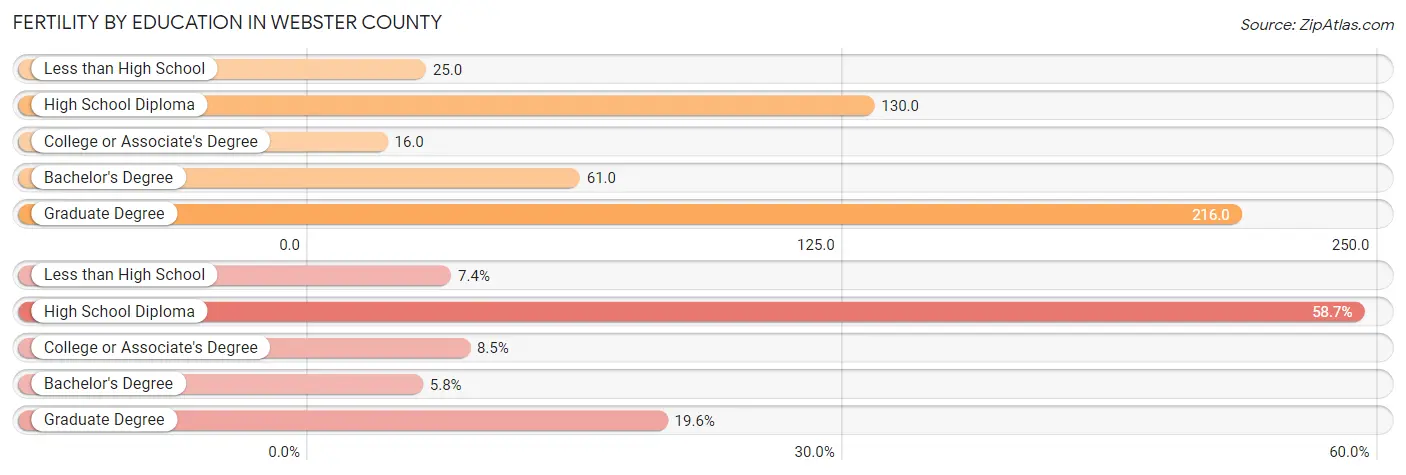
| Educational Attainment | Women with Births | Births / 1,000 Women |
| Less than High School | 14 (7.4%) | 25.0 |
| High School Diploma | 111 (58.7%) | 130.0 |
| College or Associate's Degree | 16 (8.5%) | 16.0 |
| Bachelor's Degree | 11 (5.8%) | 61.0 |
| Graduate Degree | 37 (19.6%) | 216.0 |
| Total | 189 (100.0%) | 68.0 |
Fertility by Education by Marriage Status in Webster County
44.4% of women with births in Webster County are unmarried. Women with the educational attainment of bachelor's degree are most likely to be married with 100.0% of them married at childbirth, while women with the educational attainment of high school diploma are least likely to be married with 70.3% of them unmarried at childbirth.
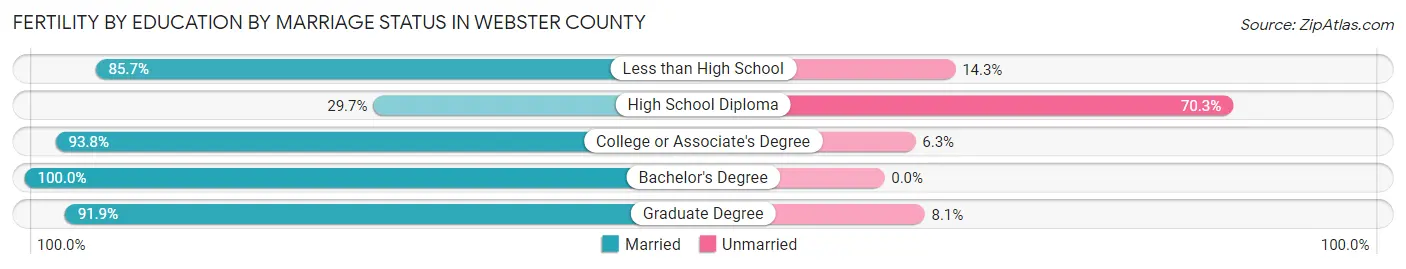
| Educational Attainment | Married | Unmarried |
| Less than High School | 12 (85.7%) | 2 (14.3%) |
| High School Diploma | 33 (29.7%) | 78 (70.3%) |
| College or Associate's Degree | 15 (93.8%) | 1 (6.2%) |
| Bachelor's Degree | 11 (100.0%) | 0 (0.0%) |
| Graduate Degree | 34 (91.9%) | 3 (8.1%) |
| Total | 105 (55.6%) | 84 (44.4%) |
Employment Characteristics in Webster County
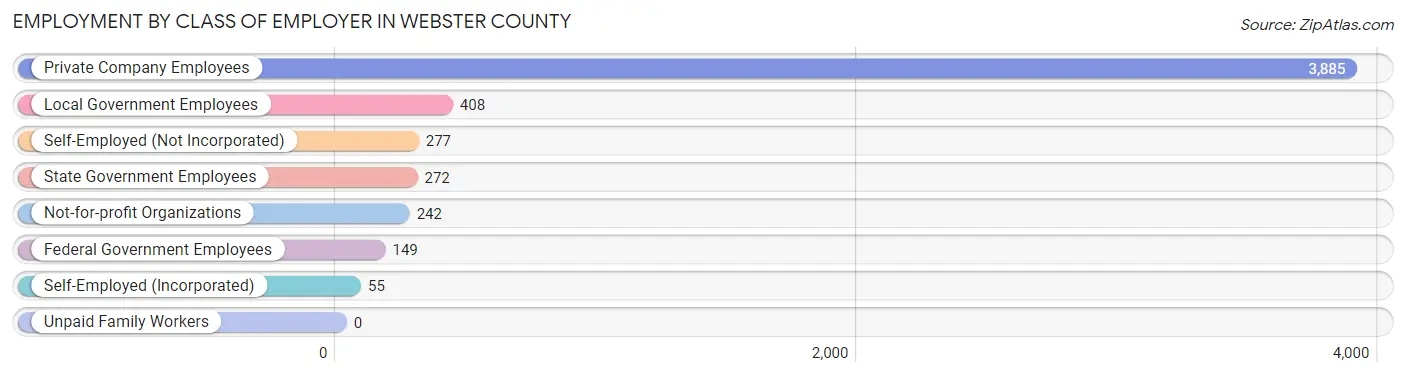
Employment by Class of Employer in Webster County
Among the 5,288 employed individuals in Webster County, private company employees (3,885 | 73.5%), local government employees (408 | 7.7%), and self-employed (not incorporated) (277 | 5.2%) make up the most common classes of employment.
| Employer Class | # Employees | % Employees |
| Private Company Employees | 3,885 | 73.5% |
| Self-Employed (Incorporated) | 55 | 1.0% |
| Self-Employed (Not Incorporated) | 277 | 5.2% |
| Not-for-profit Organizations | 242 | 4.6% |
| Local Government Employees | 408 | 7.7% |
| State Government Employees | 272 | 5.1% |
| Federal Government Employees | 149 | 2.8% |
| Unpaid Family Workers | 0 | 0.0% |
| Total | 5,288 | 100.0% |
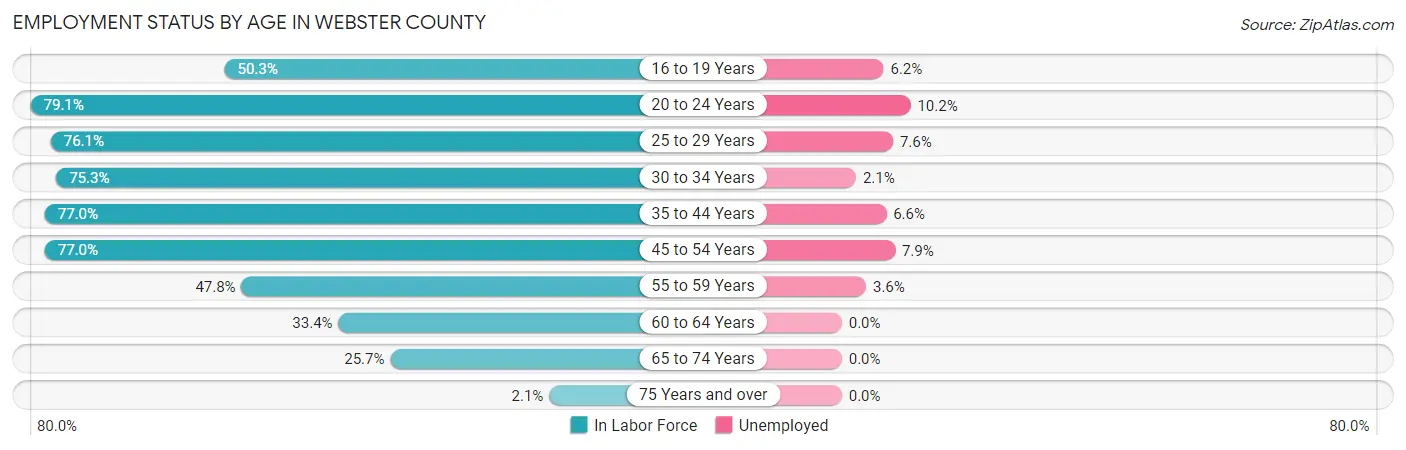
Employment Status by Age in Webster County
According to the labor force statistics for Webster County, out of the total population over 16 years of age (10,292), 55.2% or 5,681 individuals are in the labor force, with 5.9% or 335 of them unemployed. The age group with the highest labor force participation rate is 20 to 24 years, with 79.1% or 669 individuals in the labor force. Within the labor force, the 20 to 24 years age range has the highest percentage of unemployed individuals, with 10.2% or 68 of them being unemployed.
| Age Bracket | In Labor Force | Unemployed |
| 16 to 19 Years | 324 (50.3%) | 20 (6.2%) |
| 20 to 24 Years | 669 (79.1%) | 68 (10.2%) |
| 25 to 29 Years | 595 (76.1%) | 45 (7.6%) |
| 30 to 34 Years | 536 (75.3%) | 11 (2.1%) |
| 35 to 44 Years | 1,205 (77.0%) | 80 (6.6%) |
| 45 to 54 Years | 1,284 (77.0%) | 101 (7.9%) |
| 55 to 59 Years | 305 (47.8%) | 11 (3.6%) |
| 60 to 64 Years | 382 (33.4%) | 0 (0.0%) |
| 65 to 74 Years | 364 (25.7%) | 0 (0.0%) |
| 75 Years and over | 18 (2.1%) | 0 (0.0%) |
| Total | 5,681 (55.2%) | 335 (5.9%) |
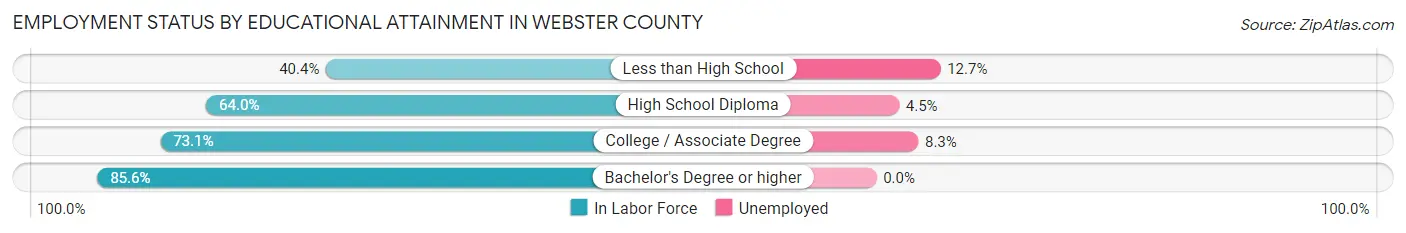
Employment Status by Educational Attainment in Webster County
According to labor force statistics for Webster County, 66.2% of individuals (4,309) out of the total population between 25 and 64 years of age (6,509) are in the labor force, with 5.8% or 250 of them being unemployed. The group with the highest labor force participation rate are those with the educational attainment of bachelor's degree or higher, with 85.6% or 662 individuals in the labor force. Within the labor force, individuals with less than high school education have the highest percentage of unemployment, with 12.7% or 45 of them being unemployed.
| Educational Attainment | In Labor Force | Unemployed |
| Less than High School | 354 (40.4%) | 111 (12.7%) |
| High School Diploma | 1,845 (64.0%) | 130 (4.5%) |
| College / Associate Degree | 1,445 (73.1%) | 164 (8.3%) |
| Bachelor's Degree or higher | 662 (85.6%) | 0 (0.0%) |
| Total | 4,309 (66.2%) | 378 (5.8%) |
Employment Occupations by Sex in Webster County
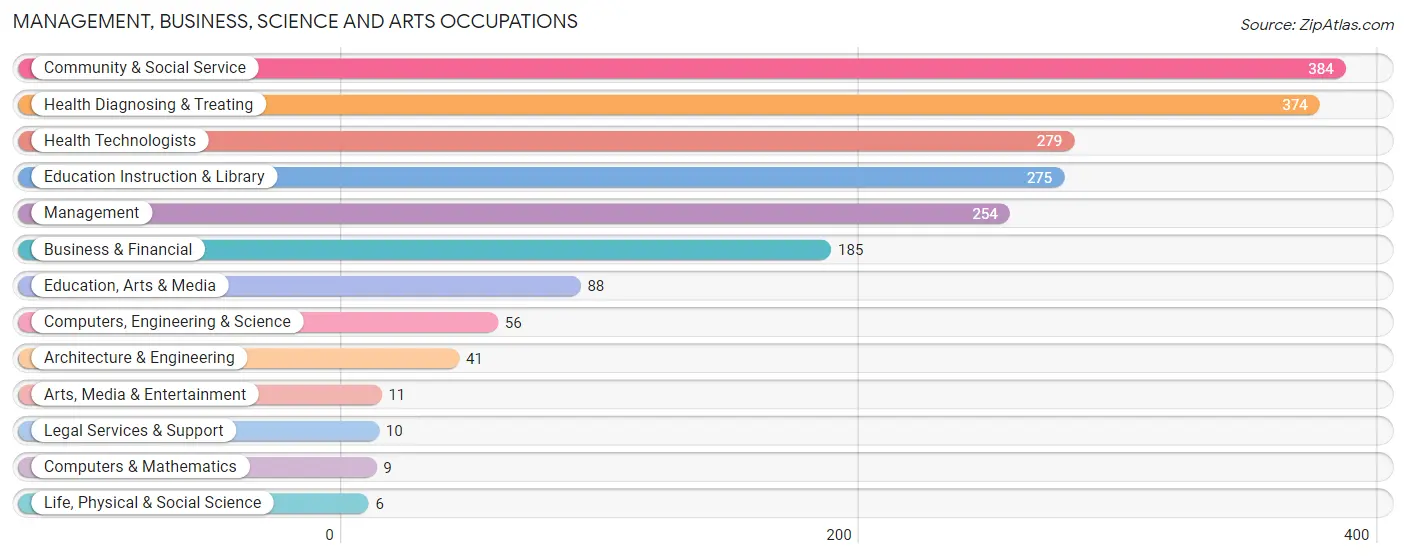
Management, Business, Science and Arts Occupations
The most common Management, Business, Science and Arts occupations in Webster County are Community & Social Service (384 | 7.2%), Health Diagnosing & Treating (374 | 7.0%), Health Technologists (279 | 5.2%), Education Instruction & Library (275 | 5.1%), and Management (254 | 4.8%).
Management, Business, Science and Arts Occupations by Sex
Within the Management, Business, Science and Arts occupations in Webster County, the most male-oriented occupations are Architecture & Engineering (100.0%), Life, Physical & Social Science (100.0%), and Computers, Engineering & Science (98.2%), while the most female-oriented occupations are Education Instruction & Library (92.4%), Health Diagnosing & Treating (90.9%), and Health Technologists (90.7%).
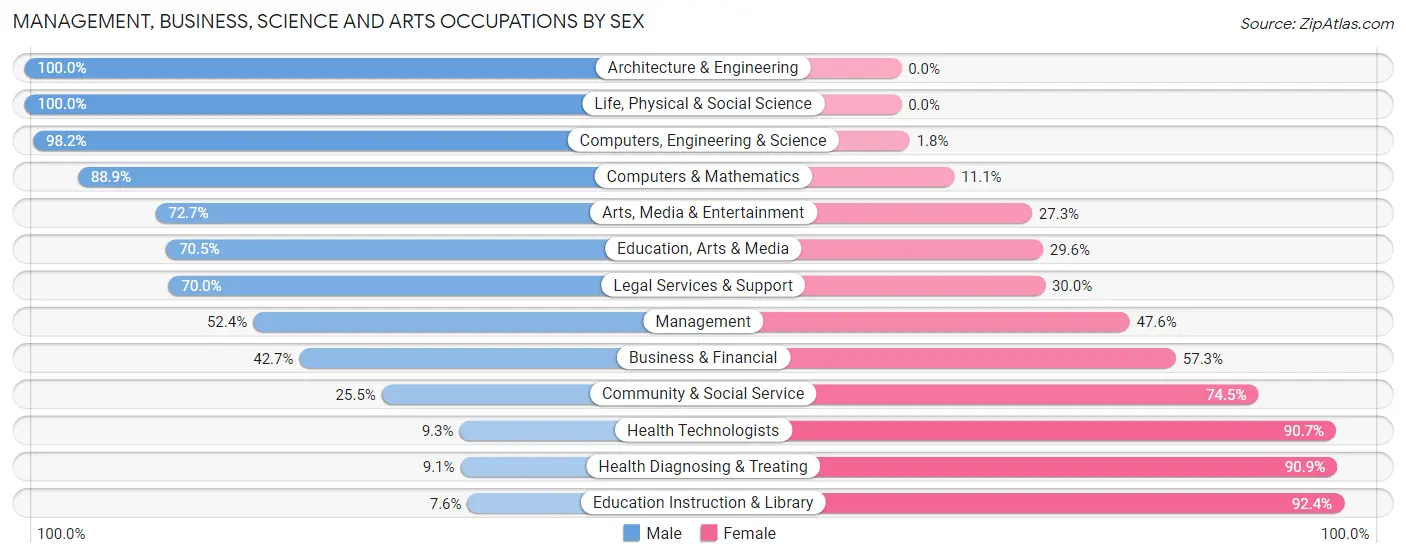
| Occupation | Male | Female |
| Management | 133 (52.4%) | 121 (47.6%) |
| Business & Financial | 79 (42.7%) | 106 (57.3%) |
| Computers, Engineering & Science | 55 (98.2%) | 1 (1.8%) |
| Computers & Mathematics | 8 (88.9%) | 1 (11.1%) |
| Architecture & Engineering | 41 (100.0%) | 0 (0.0%) |
| Life, Physical & Social Science | 6 (100.0%) | 0 (0.0%) |
| Community & Social Service | 98 (25.5%) | 286 (74.5%) |
| Education, Arts & Media | 62 (70.5%) | 26 (29.5%) |
| Legal Services & Support | 7 (70.0%) | 3 (30.0%) |
| Education Instruction & Library | 21 (7.6%) | 254 (92.4%) |
| Arts, Media & Entertainment | 8 (72.7%) | 3 (27.3%) |
| Health Diagnosing & Treating | 34 (9.1%) | 340 (90.9%) |
| Health Technologists | 26 (9.3%) | 253 (90.7%) |
| Total (Category) | 399 (31.8%) | 854 (68.2%) |
| Total (Overall) | 2,767 (51.7%) | 2,581 (48.3%) |
Services Occupations
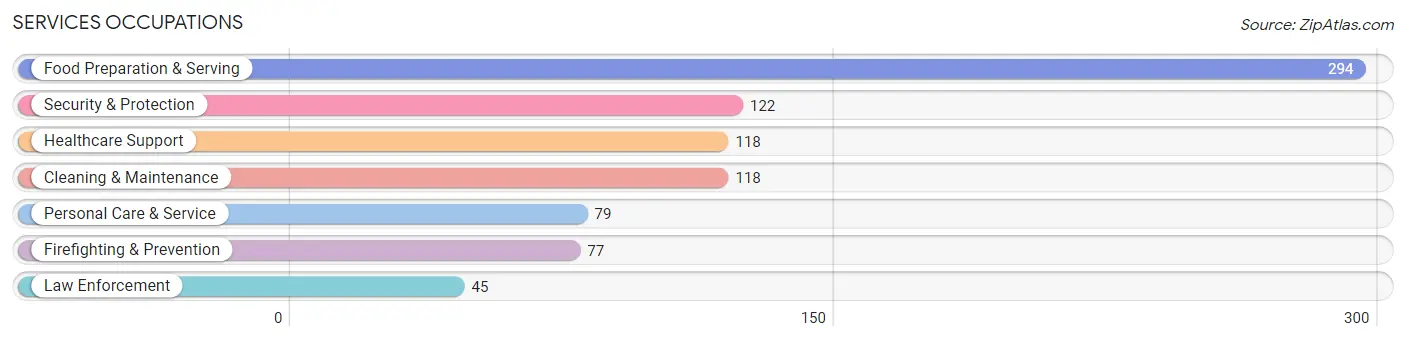
The most common Services occupations in Webster County are Food Preparation & Serving (294 | 5.5%), Security & Protection (122 | 2.3%), Healthcare Support (118 | 2.2%), Cleaning & Maintenance (118 | 2.2%), and Personal Care & Service (79 | 1.5%).
Services Occupations by Sex
Within the Services occupations in Webster County, the most male-oriented occupations are Law Enforcement (100.0%), Security & Protection (73.0%), and Firefighting & Prevention (57.1%), while the most female-oriented occupations are Healthcare Support (97.5%), Personal Care & Service (78.5%), and Food Preparation & Serving (73.1%).
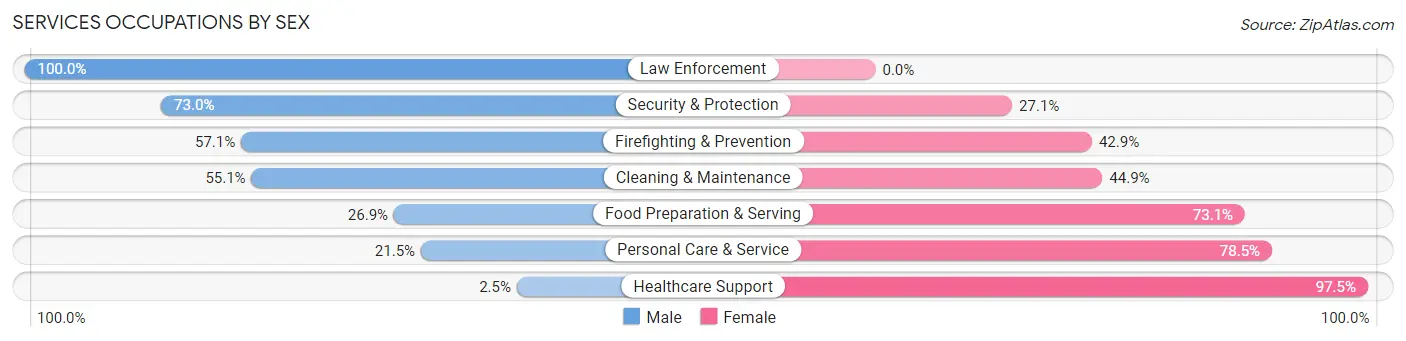
| Occupation | Male | Female |
| Healthcare Support | 3 (2.5%) | 115 (97.5%) |
| Security & Protection | 89 (73.0%) | 33 (27.1%) |
| Firefighting & Prevention | 44 (57.1%) | 33 (42.9%) |
| Law Enforcement | 45 (100.0%) | 0 (0.0%) |
| Food Preparation & Serving | 79 (26.9%) | 215 (73.1%) |
| Cleaning & Maintenance | 65 (55.1%) | 53 (44.9%) |
| Personal Care & Service | 17 (21.5%) | 62 (78.5%) |
| Total (Category) | 253 (34.6%) | 478 (65.4%) |
| Total (Overall) | 2,767 (51.7%) | 2,581 (48.3%) |
Sales and Office Occupations
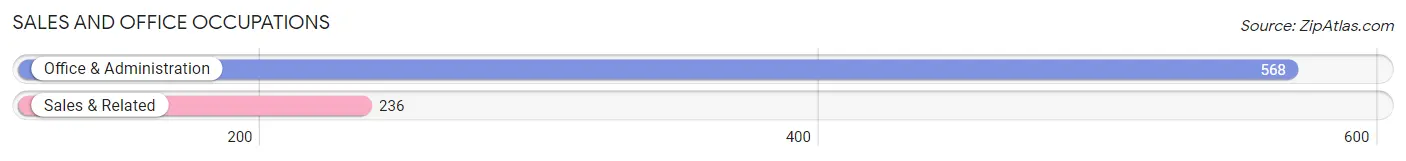
The most common Sales and Office occupations in Webster County are Office & Administration (568 | 10.6%), and Sales & Related (236 | 4.4%).
Sales and Office Occupations by Sex

| Occupation | Male | Female |
| Sales & Related | 79 (33.5%) | 157 (66.5%) |
| Office & Administration | 99 (17.4%) | 469 (82.6%) |
| Total (Category) | 178 (22.1%) | 626 (77.9%) |
| Total (Overall) | 2,767 (51.7%) | 2,581 (48.3%) |
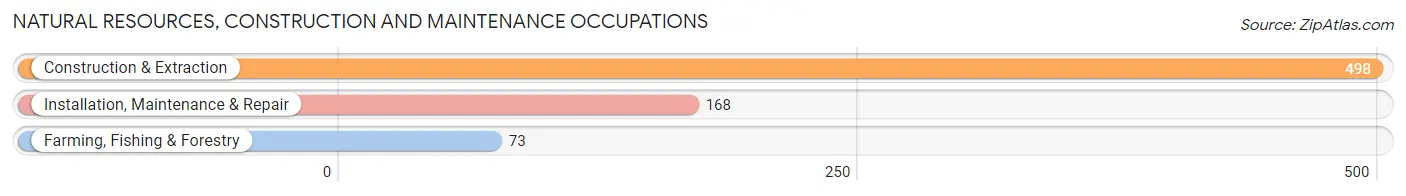
Natural Resources, Construction and Maintenance Occupations
The most common Natural Resources, Construction and Maintenance occupations in Webster County are Construction & Extraction (498 | 9.3%), Installation, Maintenance & Repair (168 | 3.1%), and Farming, Fishing & Forestry (73 | 1.4%).
Natural Resources, Construction and Maintenance Occupations by Sex
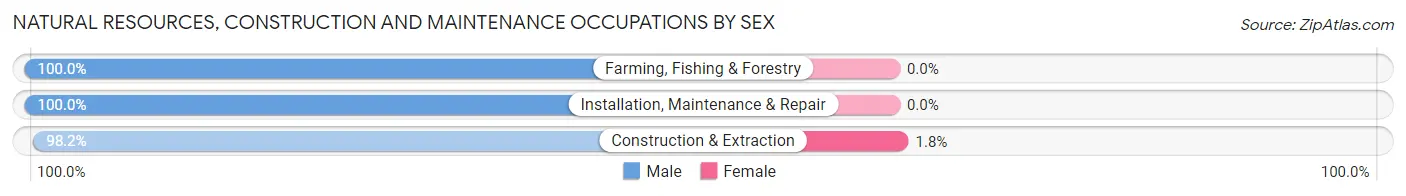
| Occupation | Male | Female |
| Farming, Fishing & Forestry | 73 (100.0%) | 0 (0.0%) |
| Construction & Extraction | 489 (98.2%) | 9 (1.8%) |
| Installation, Maintenance & Repair | 168 (100.0%) | 0 (0.0%) |
| Total (Category) | 730 (98.8%) | 9 (1.2%) |
| Total (Overall) | 2,767 (51.7%) | 2,581 (48.3%) |
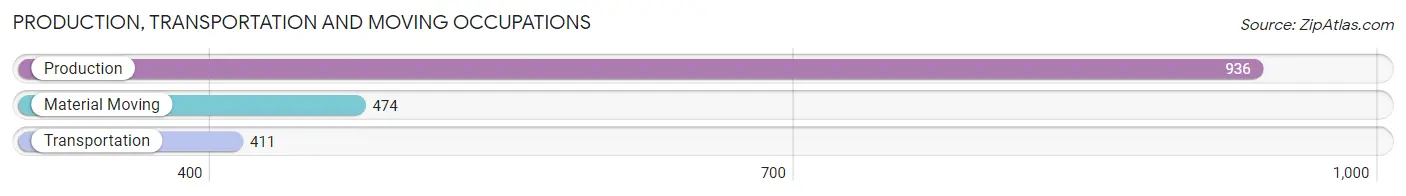
Production, Transportation and Moving Occupations
The most common Production, Transportation and Moving occupations in Webster County are Production (936 | 17.5%), Material Moving (474 | 8.9%), and Transportation (411 | 7.7%).
Production, Transportation and Moving Occupations by Sex
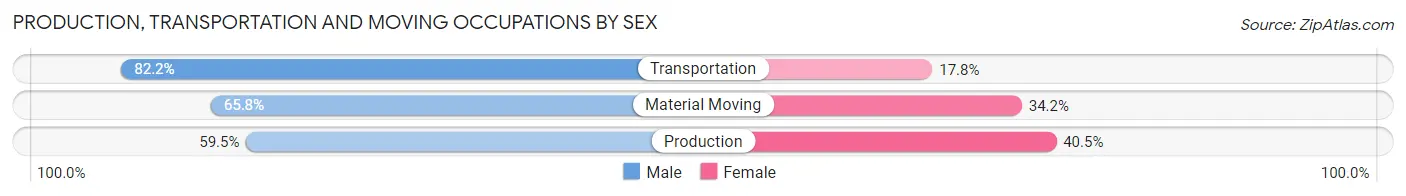
| Occupation | Male | Female |
| Production | 557 (59.5%) | 379 (40.5%) |
| Transportation | 338 (82.2%) | 73 (17.8%) |
| Material Moving | 312 (65.8%) | 162 (34.2%) |
| Total (Category) | 1,207 (66.3%) | 614 (33.7%) |
| Total (Overall) | 2,767 (51.7%) | 2,581 (48.3%) |
Employment Industries by Sex in Webster County
Employment Industries in Webster County
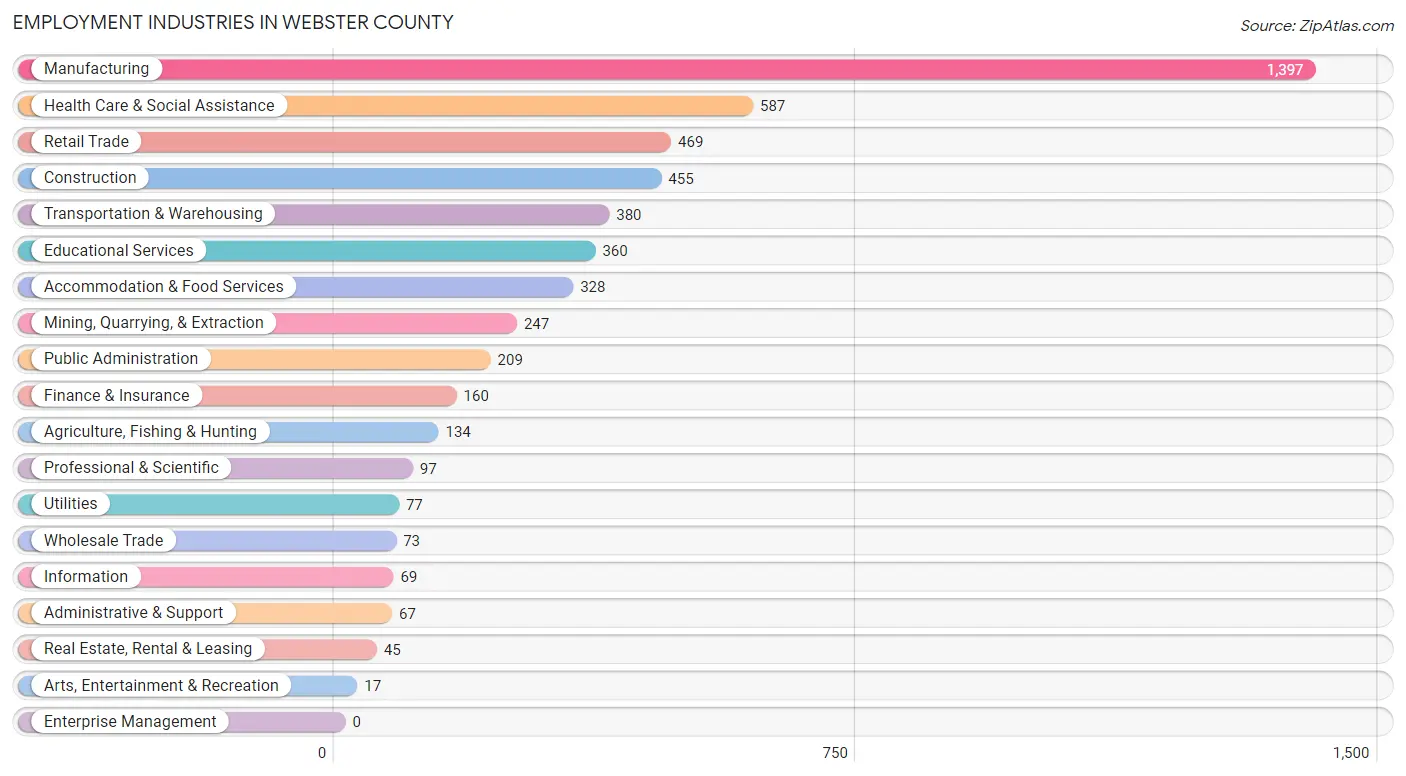
The major employment industries in Webster County include Manufacturing (1,397 | 26.1%), Health Care & Social Assistance (587 | 11.0%), Retail Trade (469 | 8.8%), Construction (455 | 8.5%), and Transportation & Warehousing (380 | 7.1%).
Employment Industries by Sex in Webster County
The Webster County industries that see more men than women are Mining, Quarrying, & Extraction (100.0%), Agriculture, Fishing & Hunting (99.3%), and Administrative & Support (91.0%), whereas the industries that tend to have a higher number of women are Information (92.7%), Professional & Scientific (90.7%), and Educational Services (90.0%).
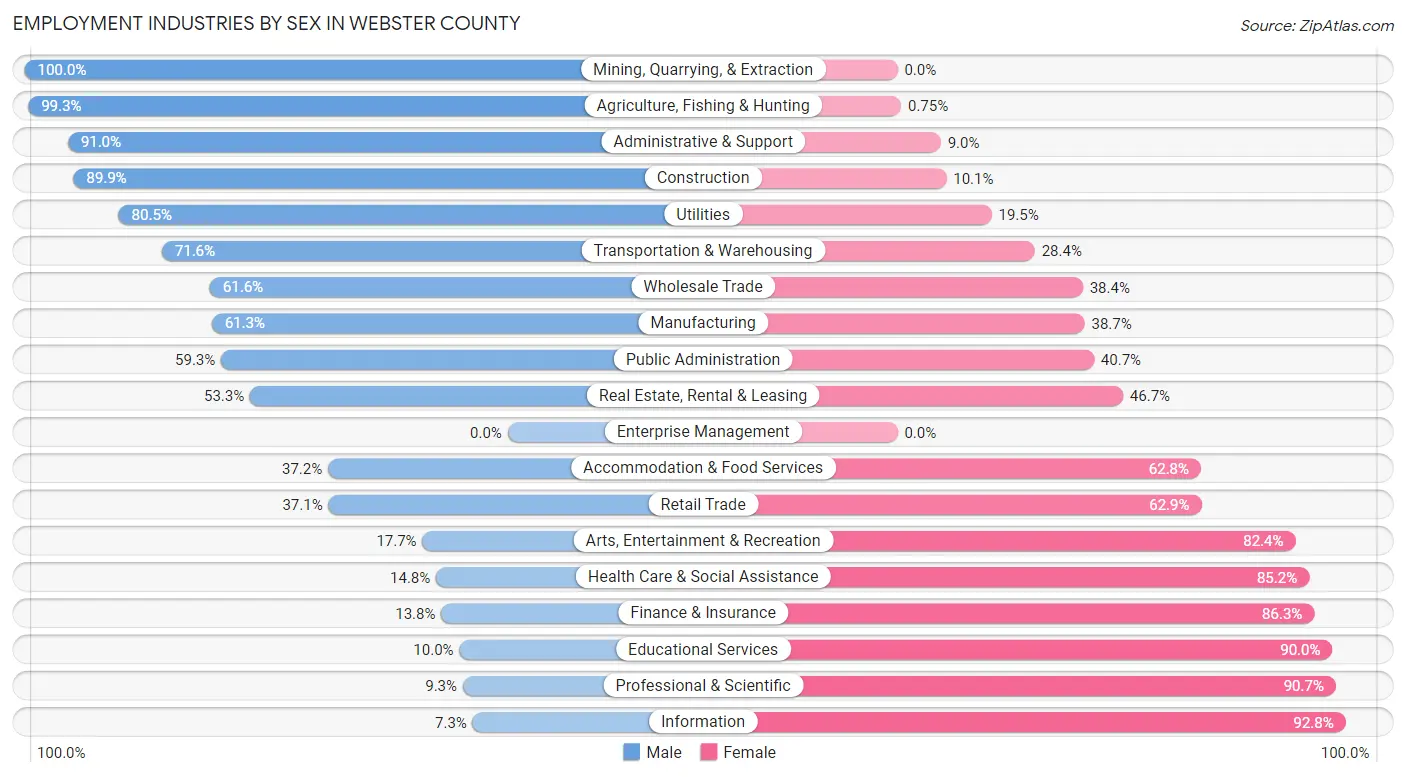
| Industry | Male | Female |
| Agriculture, Fishing & Hunting | 133 (99.3%) | 1 (0.7%) |
| Mining, Quarrying, & Extraction | 247 (100.0%) | 0 (0.0%) |
| Construction | 409 (89.9%) | 46 (10.1%) |
| Manufacturing | 856 (61.3%) | 541 (38.7%) |
| Wholesale Trade | 45 (61.6%) | 28 (38.4%) |
| Retail Trade | 174 (37.1%) | 295 (62.9%) |
| Transportation & Warehousing | 272 (71.6%) | 108 (28.4%) |
| Utilities | 62 (80.5%) | 15 (19.5%) |
| Information | 5 (7.2%) | 64 (92.7%) |
| Finance & Insurance | 22 (13.8%) | 138 (86.3%) |
| Real Estate, Rental & Leasing | 24 (53.3%) | 21 (46.7%) |
| Professional & Scientific | 9 (9.3%) | 88 (90.7%) |
| Enterprise Management | 0 (0.0%) | 0 (0.0%) |
| Administrative & Support | 61 (91.0%) | 6 (9.0%) |
| Educational Services | 36 (10.0%) | 324 (90.0%) |
| Health Care & Social Assistance | 87 (14.8%) | 500 (85.2%) |
| Arts, Entertainment & Recreation | 3 (17.6%) | 14 (82.4%) |
| Accommodation & Food Services | 122 (37.2%) | 206 (62.8%) |
| Public Administration | 124 (59.3%) | 85 (40.7%) |
| Total | 2,767 (51.7%) | 2,581 (48.3%) |
Education in Webster County
School Enrollment in Webster County
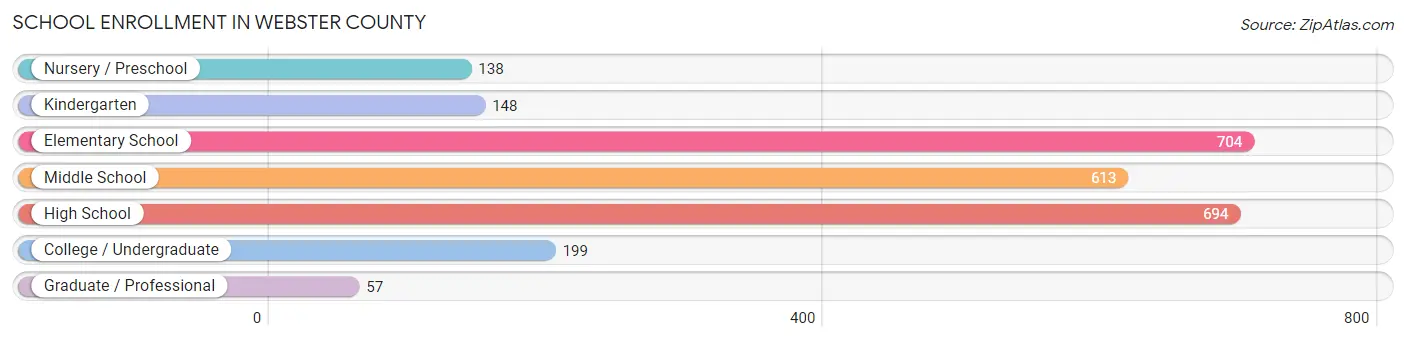
The most common levels of schooling among the 2,553 students in Webster County are elementary school (704 | 27.6%), high school (694 | 27.2%), and middle school (613 | 24.0%).
| School Level | # Students | % Students |
| Nursery / Preschool | 138 | 5.4% |
| Kindergarten | 148 | 5.8% |
| Elementary School | 704 | 27.6% |
| Middle School | 613 | 24.0% |
| High School | 694 | 27.2% |
| College / Undergraduate | 199 | 7.8% |
| Graduate / Professional | 57 | 2.2% |
| Total | 2,553 | 100.0% |
School Enrollment by Age by Funding Source in Webster County
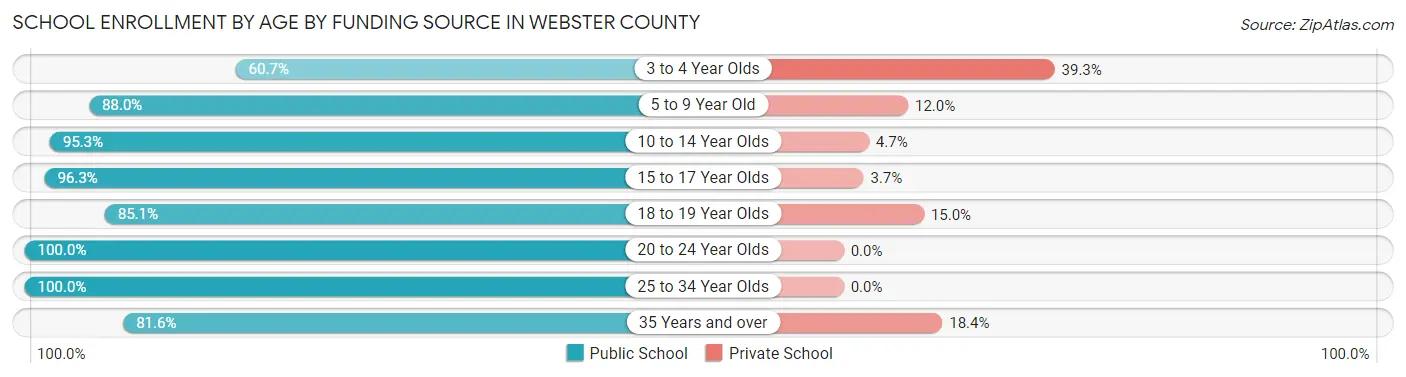
Out of a total of 2,553 students who are enrolled in schools in Webster County, 212 (8.3%) attend a private institution, while the remaining 2,341 (91.7%) are enrolled in public schools. The age group of 3 to 4 year olds has the highest likelihood of being enrolled in private schools, with 33 (39.3% in the age bracket) enrolled. Conversely, the age group of 20 to 24 year olds has the lowest likelihood of being enrolled in a private school, with 79 (100.0% in the age bracket) attending a public institution.
| Age Bracket | Public School | Private School |
| 3 to 4 Year Olds | 51 (60.7%) | 33 (39.3%) |
| 5 to 9 Year Old | 712 (88.0%) | 97 (12.0%) |
| 10 to 14 Year Olds | 751 (95.3%) | 37 (4.7%) |
| 15 to 17 Year Olds | 495 (96.3%) | 19 (3.7%) |
| 18 to 19 Year Olds | 91 (85.1%) | 16 (14.9%) |
| 20 to 24 Year Olds | 79 (100.0%) | 0 (0.0%) |
| 25 to 34 Year Olds | 123 (100.0%) | 0 (0.0%) |
| 35 Years and over | 40 (81.6%) | 9 (18.4%) |
| Total | 2,341 (91.7%) | 212 (8.3%) |
Educational Attainment by Field of Study in Webster County
Education (255 | 23.5%), business (201 | 18.5%), science & technology (183 | 16.9%), arts & humanities (135 | 12.4%), and psychology (59 | 5.4%) are the most common fields of study among 1,085 individuals in Webster County who have obtained a bachelor's degree or higher.
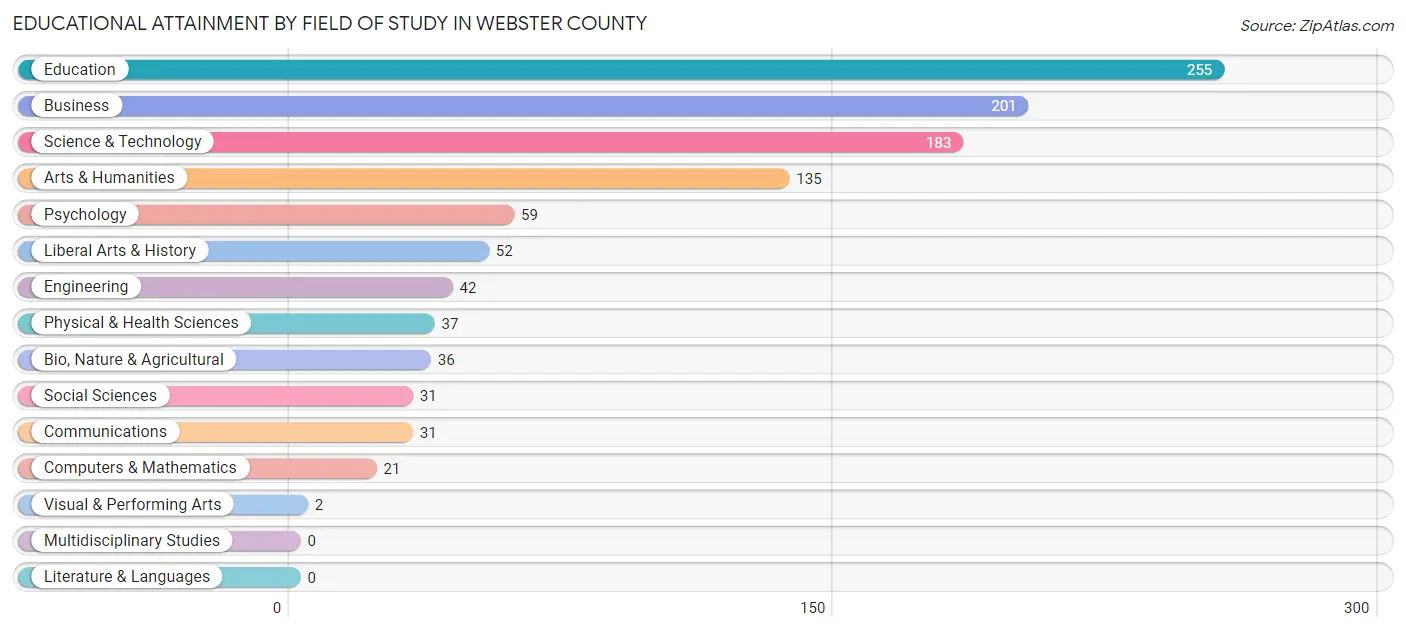
| Field of Study | # Graduates | % Graduates |
| Computers & Mathematics | 21 | 1.9% |
| Bio, Nature & Agricultural | 36 | 3.3% |
| Physical & Health Sciences | 37 | 3.4% |
| Psychology | 59 | 5.4% |
| Social Sciences | 31 | 2.9% |
| Engineering | 42 | 3.9% |
| Multidisciplinary Studies | 0 | 0.0% |
| Science & Technology | 183 | 16.9% |
| Business | 201 | 18.5% |
| Education | 255 | 23.5% |
| Literature & Languages | 0 | 0.0% |
| Liberal Arts & History | 52 | 4.8% |
| Visual & Performing Arts | 2 | 0.2% |
| Communications | 31 | 2.9% |
| Arts & Humanities | 135 | 12.4% |
| Total | 1,085 | 100.0% |
Transportation & Commute in Webster County
Vehicle Availability by Sex in Webster County
The most prevalent vehicle ownership categories in Webster County are males with 2 vehicles (1,059, accounting for 38.6%) and females with 2 vehicles (745, making up 41.7%).
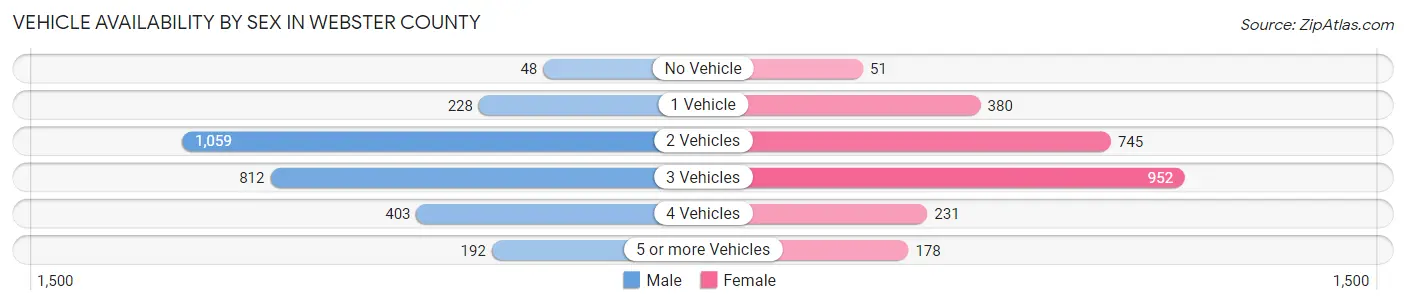
| Vehicles Available | Male | Female |
| No Vehicle | 48 (1.8%) | 51 (2.0%) |
| 1 Vehicle | 228 (8.3%) | 380 (15.0%) |
| 2 Vehicles | 1,059 (38.6%) | 745 (29.4%) |
| 3 Vehicles | 812 (29.6%) | 952 (37.5%) |
| 4 Vehicles | 403 (14.7%) | 231 (9.1%) |
| 5 or more Vehicles | 192 (7.0%) | 178 (7.0%) |
| Total | 2,742 (100.0%) | 2,537 (100.0%) |
Commute Time in Webster County
The most frequently occuring commute durations in Webster County are 30 to 34 minutes (831 commuters, 16.1%), 5 to 9 minutes (695 commuters, 13.4%), and 20 to 24 minutes (571 commuters, 11.0%).
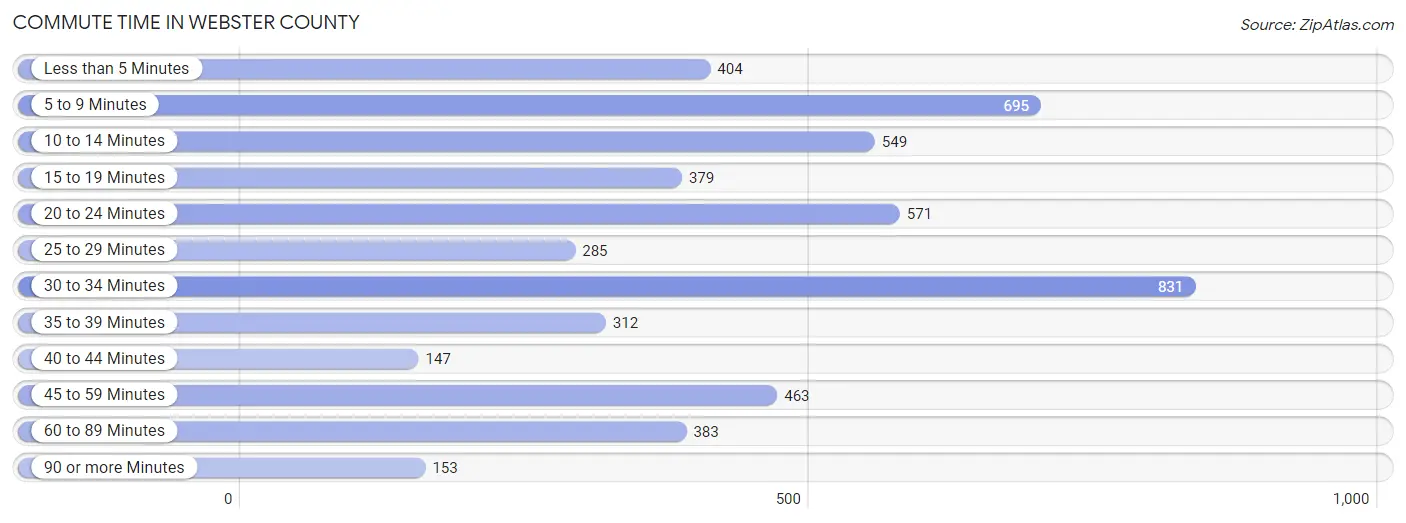
| Commute Time | # Commuters | % Commuters |
| Less than 5 Minutes | 404 | 7.8% |
| 5 to 9 Minutes | 695 | 13.4% |
| 10 to 14 Minutes | 549 | 10.6% |
| 15 to 19 Minutes | 379 | 7.3% |
| 20 to 24 Minutes | 571 | 11.0% |
| 25 to 29 Minutes | 285 | 5.5% |
| 30 to 34 Minutes | 831 | 16.1% |
| 35 to 39 Minutes | 312 | 6.0% |
| 40 to 44 Minutes | 147 | 2.8% |
| 45 to 59 Minutes | 463 | 8.9% |
| 60 to 89 Minutes | 383 | 7.4% |
| 90 or more Minutes | 153 | 3.0% |
Commute Time by Sex in Webster County
The most common commute times in Webster County are 30 to 34 minutes (395 commuters, 14.6%) for males and 30 to 34 minutes (436 commuters, 17.7%) for females.
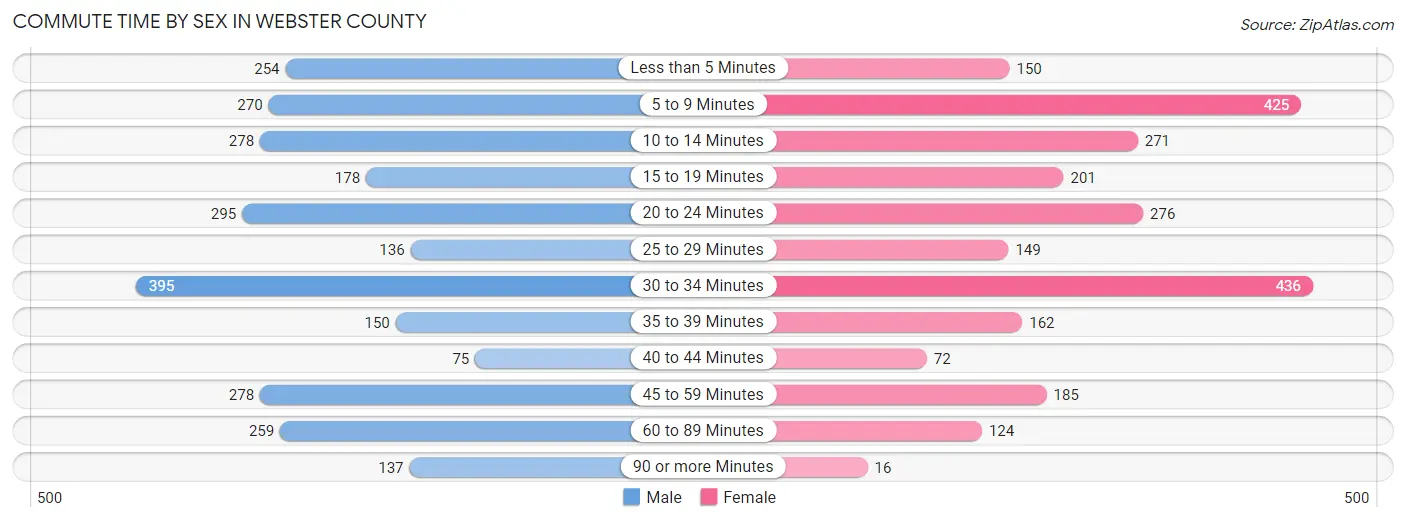
| Commute Time | Male | Female |
| Less than 5 Minutes | 254 (9.4%) | 150 (6.1%) |
| 5 to 9 Minutes | 270 (10.0%) | 425 (17.2%) |
| 10 to 14 Minutes | 278 (10.3%) | 271 (11.0%) |
| 15 to 19 Minutes | 178 (6.6%) | 201 (8.2%) |
| 20 to 24 Minutes | 295 (10.9%) | 276 (11.2%) |
| 25 to 29 Minutes | 136 (5.0%) | 149 (6.0%) |
| 30 to 34 Minutes | 395 (14.6%) | 436 (17.7%) |
| 35 to 39 Minutes | 150 (5.6%) | 162 (6.6%) |
| 40 to 44 Minutes | 75 (2.8%) | 72 (2.9%) |
| 45 to 59 Minutes | 278 (10.3%) | 185 (7.5%) |
| 60 to 89 Minutes | 259 (9.6%) | 124 (5.0%) |
| 90 or more Minutes | 137 (5.1%) | 16 (0.6%) |
Time of Departure to Work by Sex in Webster County
The most frequent times of departure to work in Webster County are 6:00 AM to 6:29 AM (614, 22.7%) for males and 7:00 AM to 7:29 AM (334, 13.5%) for females.
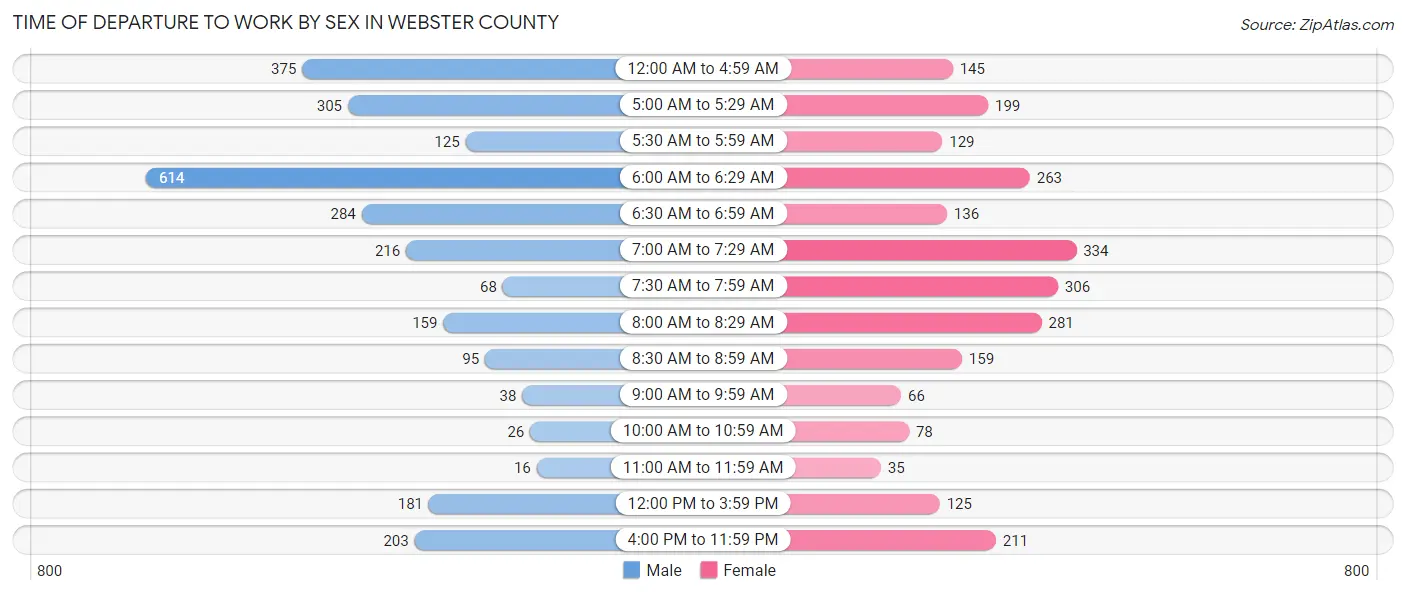
| Time of Departure | Male | Female |
| 12:00 AM to 4:59 AM | 375 (13.9%) | 145 (5.9%) |
| 5:00 AM to 5:29 AM | 305 (11.3%) | 199 (8.1%) |
| 5:30 AM to 5:59 AM | 125 (4.6%) | 129 (5.2%) |
| 6:00 AM to 6:29 AM | 614 (22.7%) | 263 (10.7%) |
| 6:30 AM to 6:59 AM | 284 (10.5%) | 136 (5.5%) |
| 7:00 AM to 7:29 AM | 216 (8.0%) | 334 (13.5%) |
| 7:30 AM to 7:59 AM | 68 (2.5%) | 306 (12.4%) |
| 8:00 AM to 8:29 AM | 159 (5.9%) | 281 (11.4%) |
| 8:30 AM to 8:59 AM | 95 (3.5%) | 159 (6.5%) |
| 9:00 AM to 9:59 AM | 38 (1.4%) | 66 (2.7%) |
| 10:00 AM to 10:59 AM | 26 (1.0%) | 78 (3.2%) |
| 11:00 AM to 11:59 AM | 16 (0.6%) | 35 (1.4%) |
| 12:00 PM to 3:59 PM | 181 (6.7%) | 125 (5.1%) |
| 4:00 PM to 11:59 PM | 203 (7.5%) | 211 (8.6%) |
| Total | 2,705 (100.0%) | 2,467 (100.0%) |
Housing Occupancy in Webster County
Occupancy by Ownership in Webster County
Of the total 4,819 dwellings in Webster County, owner-occupied units account for 3,454 (71.7%), while renter-occupied units make up 1,365 (28.3%).
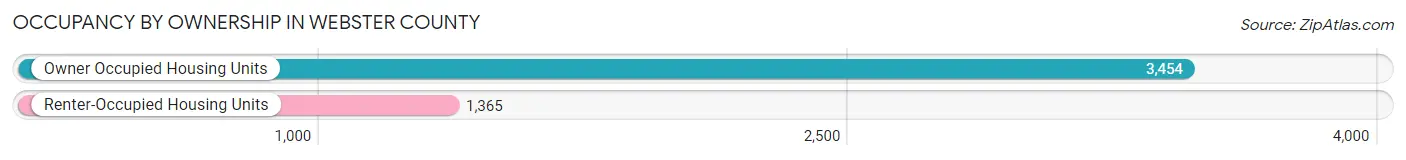
| Occupancy | # Housing Units | % Housing Units |
| Owner Occupied Housing Units | 3,454 | 71.7% |
| Renter-Occupied Housing Units | 1,365 | 28.3% |
| Total Occupied Housing Units | 4,819 | 100.0% |
Occupancy by Household Size in Webster County
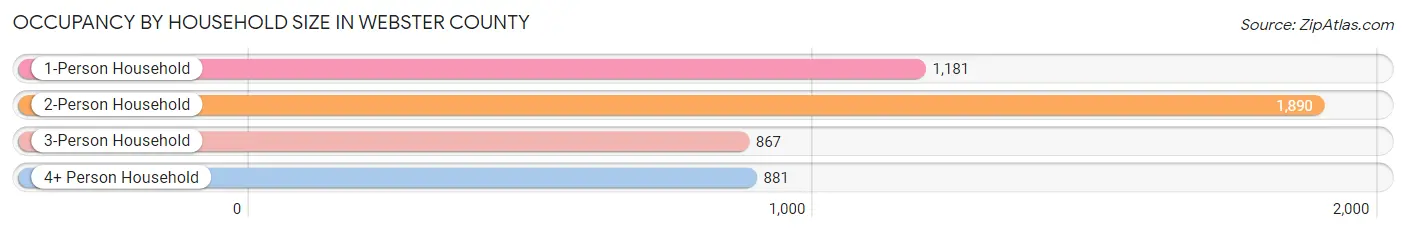
| Household Size | # Housing Units | % Housing Units |
| 1-Person Household | 1,181 | 24.5% |
| 2-Person Household | 1,890 | 39.2% |
| 3-Person Household | 867 | 18.0% |
| 4+ Person Household | 881 | 18.3% |
| Total Housing Units | 4,819 | 100.0% |
Occupancy by Ownership by Household Size in Webster County
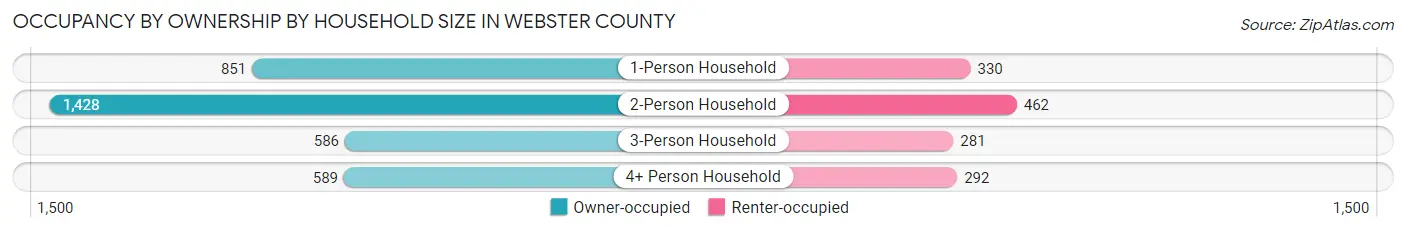
| Household Size | Owner-occupied | Renter-occupied |
| 1-Person Household | 851 (72.1%) | 330 (27.9%) |
| 2-Person Household | 1,428 (75.6%) | 462 (24.4%) |
| 3-Person Household | 586 (67.6%) | 281 (32.4%) |
| 4+ Person Household | 589 (66.9%) | 292 (33.1%) |
| Total Housing Units | 3,454 (71.7%) | 1,365 (28.3%) |
Occupancy by Educational Attainment in Webster County
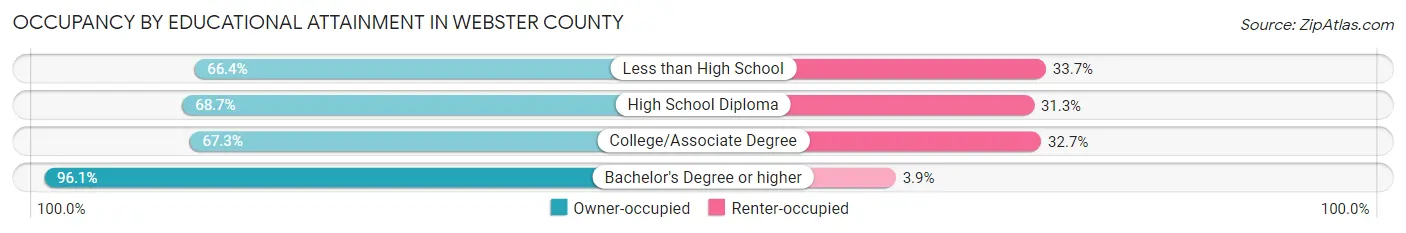
| Household Size | Owner-occupied | Renter-occupied |
| Less than High School | 424 (66.3%) | 215 (33.7%) |
| High School Diploma | 1,507 (68.7%) | 686 (31.3%) |
| College/Associate Degree | 903 (67.3%) | 439 (32.7%) |
| Bachelor's Degree or higher | 620 (96.1%) | 25 (3.9%) |
Occupancy by Age of Householder in Webster County
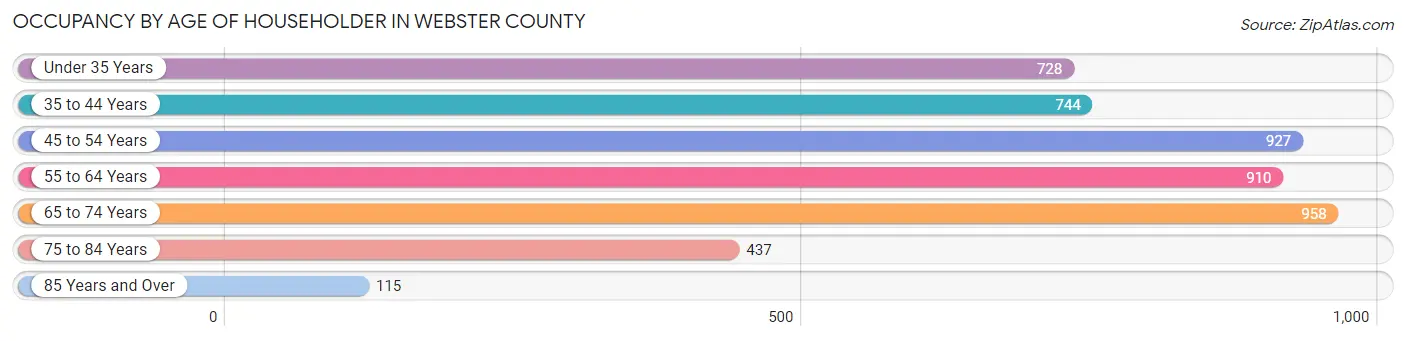
| Age Bracket | # Households | % Households |
| Under 35 Years | 728 | 15.1% |
| 35 to 44 Years | 744 | 15.4% |
| 45 to 54 Years | 927 | 19.2% |
| 55 to 64 Years | 910 | 18.9% |
| 65 to 74 Years | 958 | 19.9% |
| 75 to 84 Years | 437 | 9.1% |
| 85 Years and Over | 115 | 2.4% |
| Total | 4,819 | 100.0% |
Housing Finances in Webster County
Median Income by Occupancy in Webster County
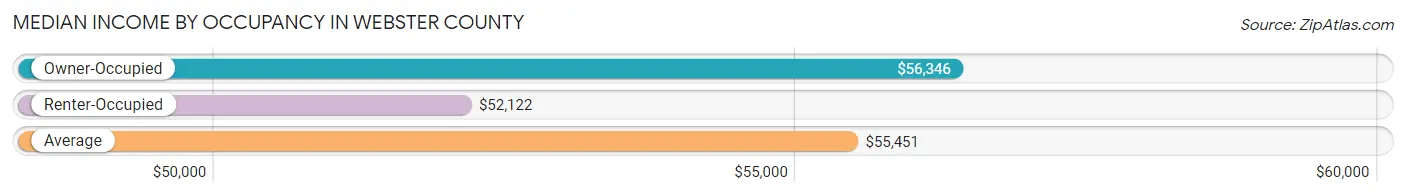
| Occupancy Type | # Households | Median Income |
| Owner-Occupied | 3,454 (71.7%) | $56,346 |
| Renter-Occupied | 1,365 (28.3%) | $52,122 |
| Average | 4,819 (100.0%) | $55,451 |
Occupancy by Householder Income Bracket in Webster County
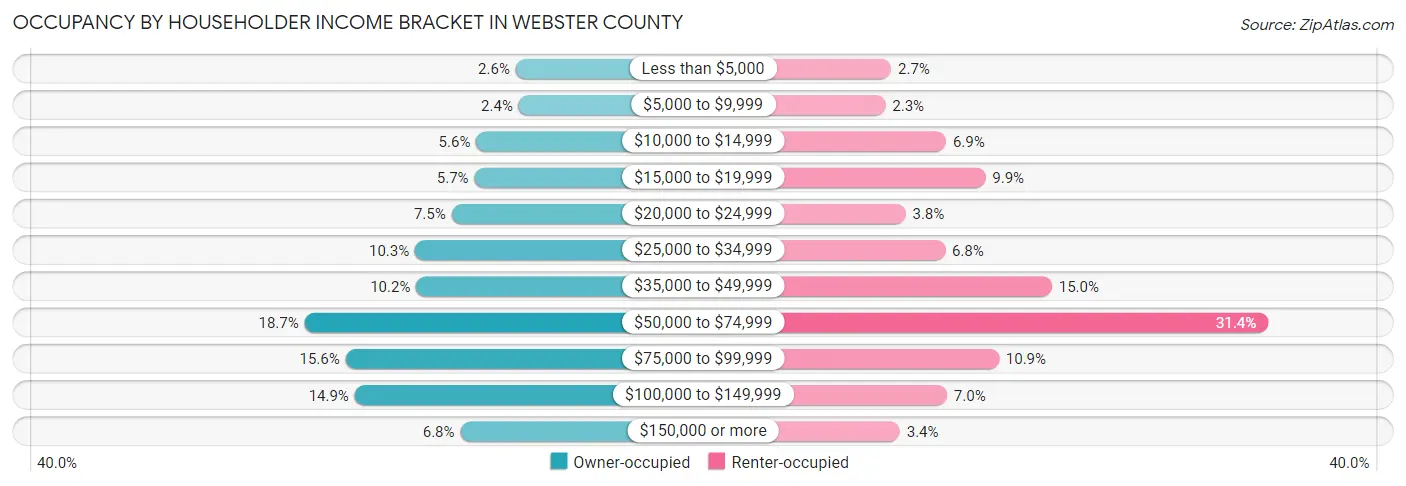
| Income Bracket | Owner-occupied | Renter-occupied |
| Less than $5,000 | 89 (2.6%) | 37 (2.7%) |
| $5,000 to $9,999 | 81 (2.4%) | 31 (2.3%) |
| $10,000 to $14,999 | 193 (5.6%) | 94 (6.9%) |
| $15,000 to $19,999 | 198 (5.7%) | 135 (9.9%) |
| $20,000 to $24,999 | 258 (7.5%) | 52 (3.8%) |
| $25,000 to $34,999 | 354 (10.2%) | 93 (6.8%) |
| $35,000 to $49,999 | 351 (10.2%) | 204 (14.9%) |
| $50,000 to $74,999 | 645 (18.7%) | 429 (31.4%) |
| $75,000 to $99,999 | 537 (15.5%) | 149 (10.9%) |
| $100,000 to $149,999 | 513 (14.8%) | 95 (7.0%) |
| $150,000 or more | 235 (6.8%) | 46 (3.4%) |
| Total | 3,454 (100.0%) | 1,365 (100.0%) |
Monthly Housing Cost Tiers in Webster County
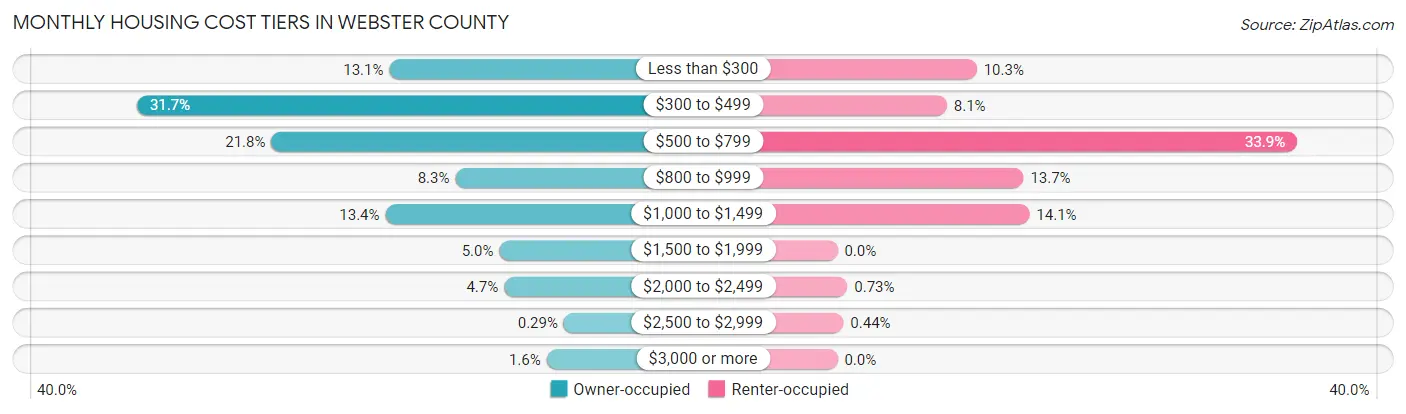
| Monthly Cost | Owner-occupied | Renter-occupied |
| Less than $300 | 454 (13.1%) | 140 (10.3%) |
| $300 to $499 | 1,096 (31.7%) | 110 (8.1%) |
| $500 to $799 | 754 (21.8%) | 462 (33.9%) |
| $800 to $999 | 286 (8.3%) | 187 (13.7%) |
| $1,000 to $1,499 | 464 (13.4%) | 193 (14.1%) |
| $1,500 to $1,999 | 174 (5.0%) | 0 (0.0%) |
| $2,000 to $2,499 | 162 (4.7%) | 10 (0.7%) |
| $2,500 to $2,999 | 10 (0.3%) | 6 (0.4%) |
| $3,000 or more | 54 (1.6%) | 0 (0.0%) |
| Total | 3,454 (100.0%) | 1,365 (100.0%) |
Physical Housing Characteristics in Webster County
Housing Structures in Webster County
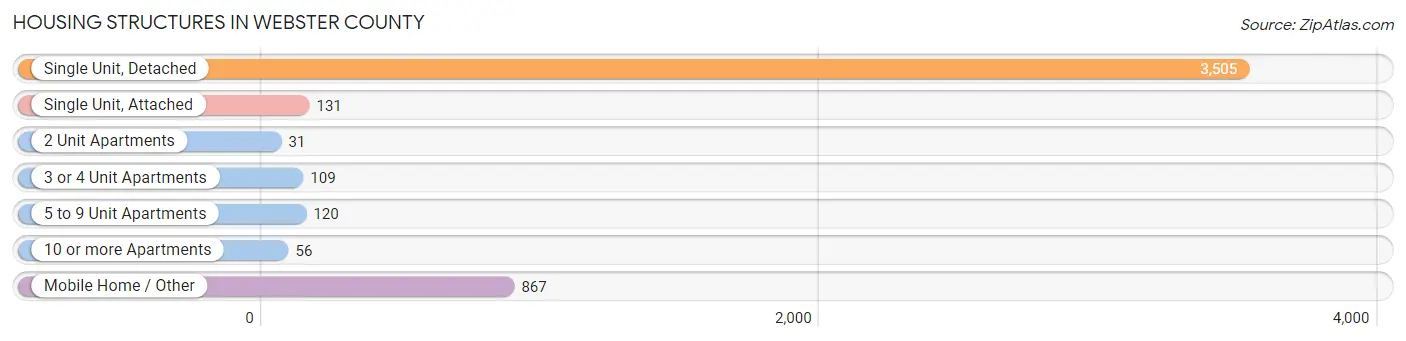
| Structure Type | # Housing Units | % Housing Units |
| Single Unit, Detached | 3,505 | 72.7% |
| Single Unit, Attached | 131 | 2.7% |
| 2 Unit Apartments | 31 | 0.6% |
| 3 or 4 Unit Apartments | 109 | 2.3% |
| 5 to 9 Unit Apartments | 120 | 2.5% |
| 10 or more Apartments | 56 | 1.2% |
| Mobile Home / Other | 867 | 18.0% |
| Total | 4,819 | 100.0% |
Housing Structures by Occupancy in Webster County
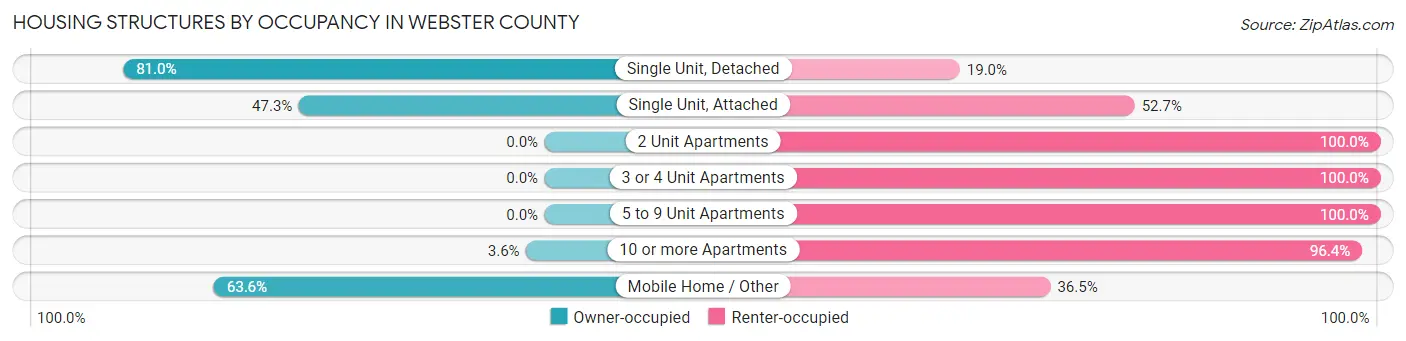
| Structure Type | Owner-occupied | Renter-occupied |
| Single Unit, Detached | 2,839 (81.0%) | 666 (19.0%) |
| Single Unit, Attached | 62 (47.3%) | 69 (52.7%) |
| 2 Unit Apartments | 0 (0.0%) | 31 (100.0%) |
| 3 or 4 Unit Apartments | 0 (0.0%) | 109 (100.0%) |
| 5 to 9 Unit Apartments | 0 (0.0%) | 120 (100.0%) |
| 10 or more Apartments | 2 (3.6%) | 54 (96.4%) |
| Mobile Home / Other | 551 (63.5%) | 316 (36.4%) |
| Total | 3,454 (71.7%) | 1,365 (28.3%) |
Housing Structures by Number of Rooms in Webster County
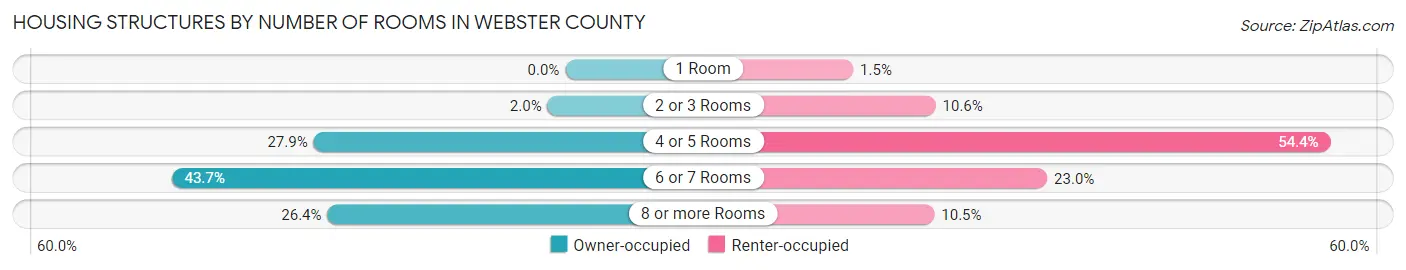
| Number of Rooms | Owner-occupied | Renter-occupied |
| 1 Room | 0 (0.0%) | 20 (1.5%) |
| 2 or 3 Rooms | 68 (2.0%) | 145 (10.6%) |
| 4 or 5 Rooms | 965 (27.9%) | 743 (54.4%) |
| 6 or 7 Rooms | 1,509 (43.7%) | 314 (23.0%) |
| 8 or more Rooms | 912 (26.4%) | 143 (10.5%) |
| Total | 3,454 (100.0%) | 1,365 (100.0%) |
Housing Structure by Heating Type in Webster County
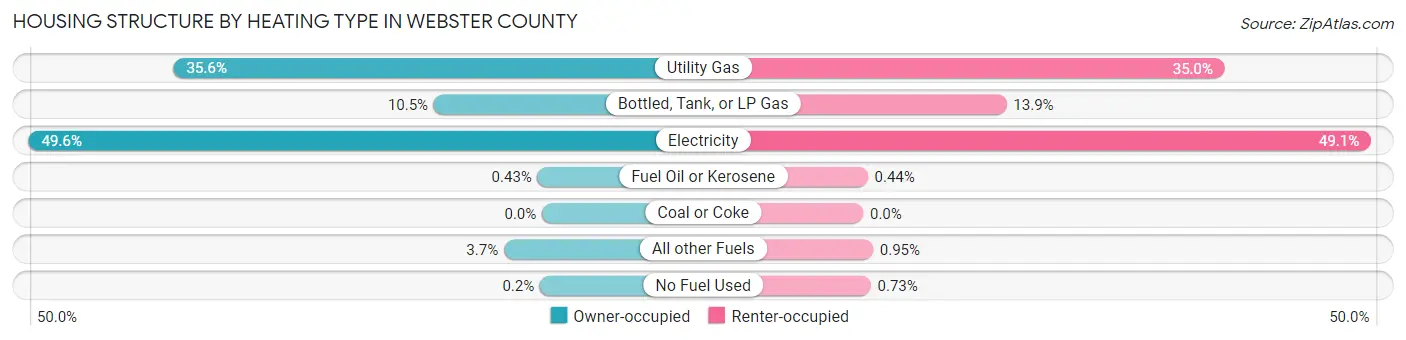
| Heating Type | Owner-occupied | Renter-occupied |
| Utility Gas | 1,230 (35.6%) | 477 (34.9%) |
| Bottled, Tank, or LP Gas | 361 (10.4%) | 189 (13.9%) |
| Electricity | 1,714 (49.6%) | 670 (49.1%) |
| Fuel Oil or Kerosene | 15 (0.4%) | 6 (0.4%) |
| Coal or Coke | 0 (0.0%) | 0 (0.0%) |
| All other Fuels | 127 (3.7%) | 13 (0.9%) |
| No Fuel Used | 7 (0.2%) | 10 (0.7%) |
| Total | 3,454 (100.0%) | 1,365 (100.0%) |
Household Vehicle Usage in Webster County
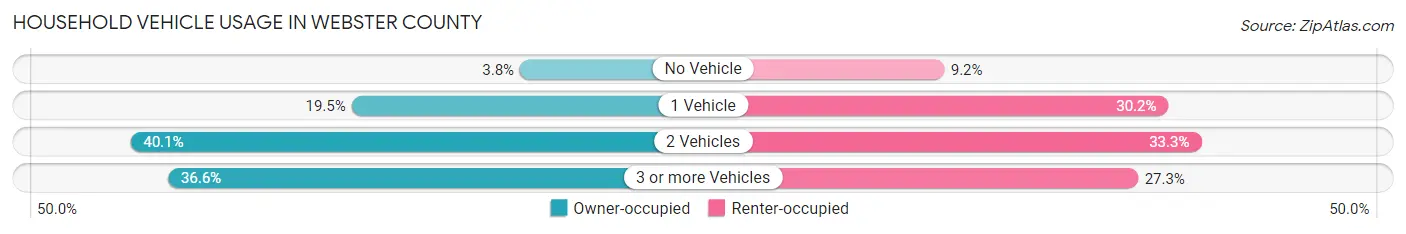
| Vehicles per Household | Owner-occupied | Renter-occupied |
| No Vehicle | 130 (3.8%) | 126 (9.2%) |
| 1 Vehicle | 673 (19.5%) | 412 (30.2%) |
| 2 Vehicles | 1,386 (40.1%) | 454 (33.3%) |
| 3 or more Vehicles | 1,265 (36.6%) | 373 (27.3%) |
| Total | 3,454 (100.0%) | 1,365 (100.0%) |
Real Estate & Mortgages in Webster County
Real Estate and Mortgage Overview in Webster County
| Characteristic | Without Mortgage | With Mortgage |
| Housing Units | 2,061 | 1,393 |
| Median Property Value | $72,300 | $133,100 |
| Median Household Income | $44,894 | $177 |
| Monthly Housing Costs | $390 | $52 |
| Real Estate Taxes | $570 | $175 |
Property Value by Mortgage Status in Webster County
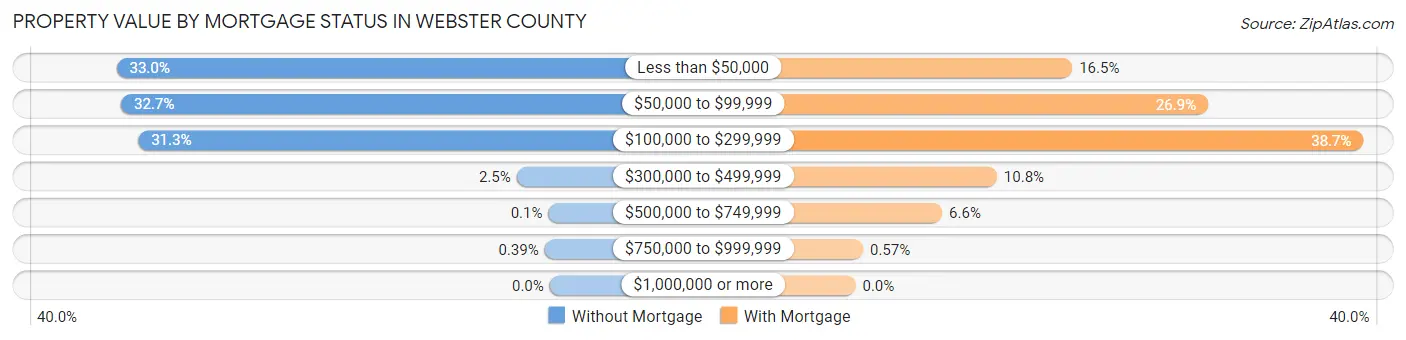
| Property Value | Without Mortgage | With Mortgage |
| Less than $50,000 | 680 (33.0%) | 230 (16.5%) |
| $50,000 to $99,999 | 673 (32.7%) | 374 (26.9%) |
| $100,000 to $299,999 | 646 (31.3%) | 539 (38.7%) |
| $300,000 to $499,999 | 52 (2.5%) | 150 (10.8%) |
| $500,000 to $749,999 | 2 (0.1%) | 92 (6.6%) |
| $750,000 to $999,999 | 8 (0.4%) | 8 (0.6%) |
| $1,000,000 or more | 0 (0.0%) | 0 (0.0%) |
| Total | 2,061 (100.0%) | 1,393 (100.0%) |
Household Income by Mortgage Status in Webster County
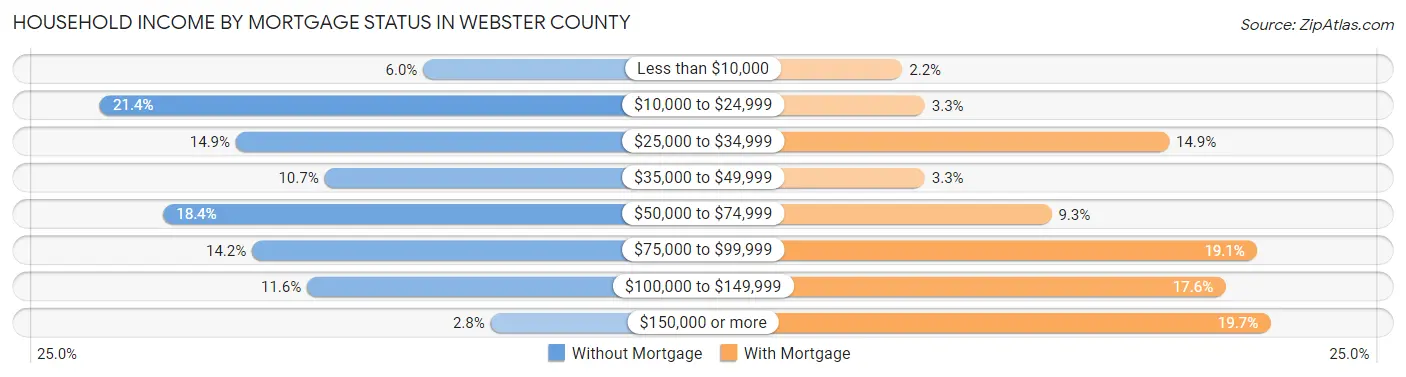
| Household Income | Without Mortgage | With Mortgage |
| Less than $10,000 | 124 (6.0%) | 31 (2.2%) |
| $10,000 to $24,999 | 441 (21.4%) | 46 (3.3%) |
| $25,000 to $34,999 | 308 (14.9%) | 208 (14.9%) |
| $35,000 to $49,999 | 221 (10.7%) | 46 (3.3%) |
| $50,000 to $74,999 | 379 (18.4%) | 130 (9.3%) |
| $75,000 to $99,999 | 292 (14.2%) | 266 (19.1%) |
| $100,000 to $149,999 | 238 (11.6%) | 245 (17.6%) |
| $150,000 or more | 58 (2.8%) | 275 (19.7%) |
| Total | 2,061 (100.0%) | 1,393 (100.0%) |
Property Value to Household Income Ratio in Webster County
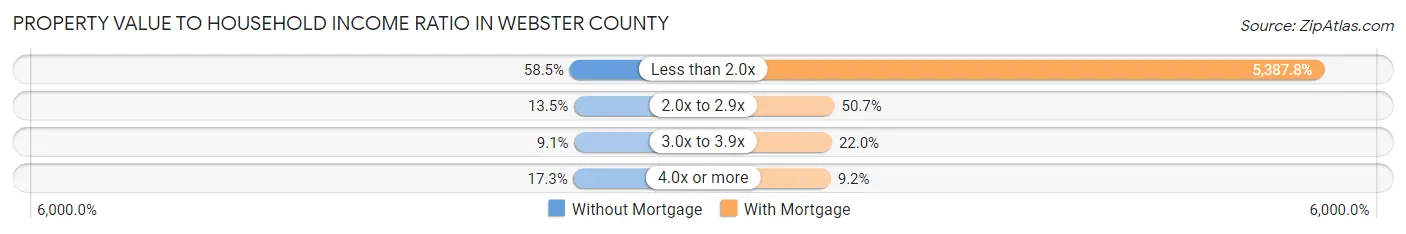
| Value-to-Income Ratio | Without Mortgage | With Mortgage |
| Less than 2.0x | 1,206 (58.5%) | 75,052 (5,387.8%) |
| 2.0x to 2.9x | 278 (13.5%) | 706 (50.7%) |
| 3.0x to 3.9x | 187 (9.1%) | 307 (22.0%) |
| 4.0x or more | 357 (17.3%) | 128 (9.2%) |
| Total | 2,061 (100.0%) | 1,393 (100.0%) |
Real Estate Taxes by Mortgage Status in Webster County
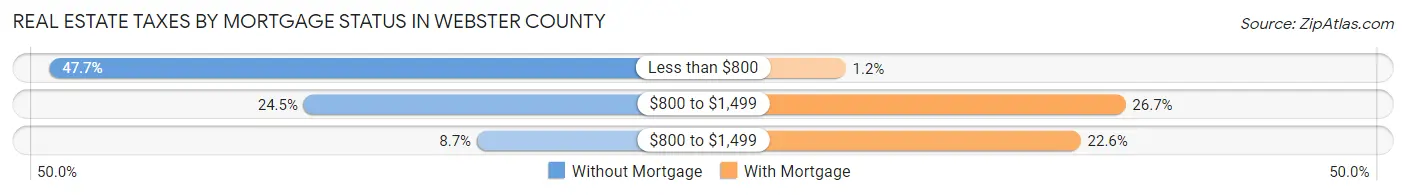
| Property Taxes | Without Mortgage | With Mortgage |
| Less than $800 | 984 (47.7%) | 16 (1.1%) |
| $800 to $1,499 | 505 (24.5%) | 372 (26.7%) |
| $800 to $1,499 | 179 (8.7%) | 315 (22.6%) |
| Total | 2,061 (100.0%) | 1,393 (100.0%) |
Health & Disability in Webster County
Health Insurance Coverage by Age in Webster County
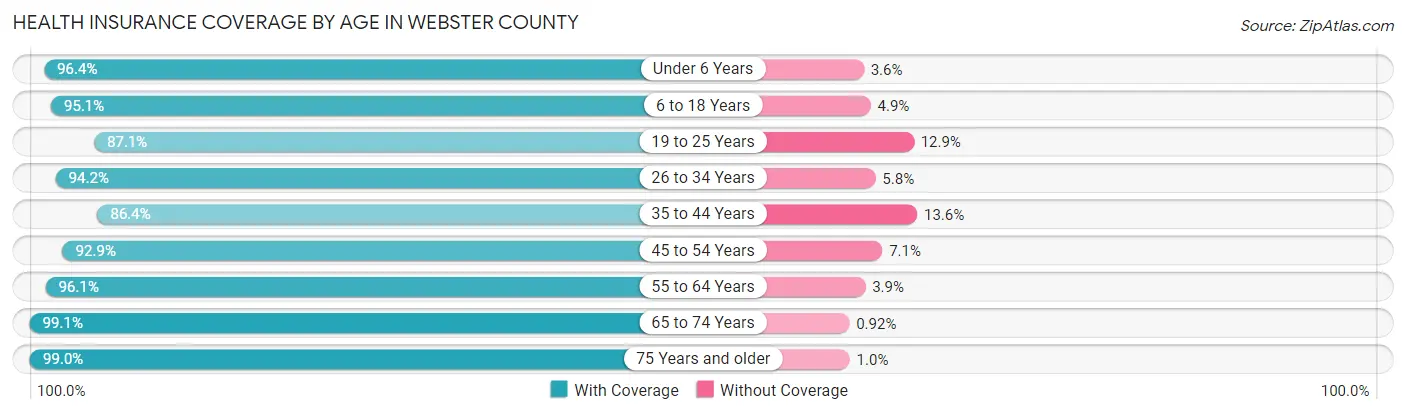
| Age Bracket | With Coverage | Without Coverage |
| Under 6 Years | 933 (96.4%) | 35 (3.6%) |
| 6 to 18 Years | 2,039 (95.1%) | 105 (4.9%) |
| 19 to 25 Years | 1,016 (87.1%) | 151 (12.9%) |
| 26 to 34 Years | 1,201 (94.2%) | 74 (5.8%) |
| 35 to 44 Years | 1,275 (86.4%) | 200 (13.6%) |
| 45 to 54 Years | 1,511 (92.9%) | 115 (7.1%) |
| 55 to 64 Years | 1,701 (96.1%) | 69 (3.9%) |
| 65 to 74 Years | 1,396 (99.1%) | 13 (0.9%) |
| 75 Years and older | 792 (99.0%) | 8 (1.0%) |
| Total | 11,864 (93.9%) | 770 (6.1%) |
Health Insurance Coverage by Citizenship Status in Webster County
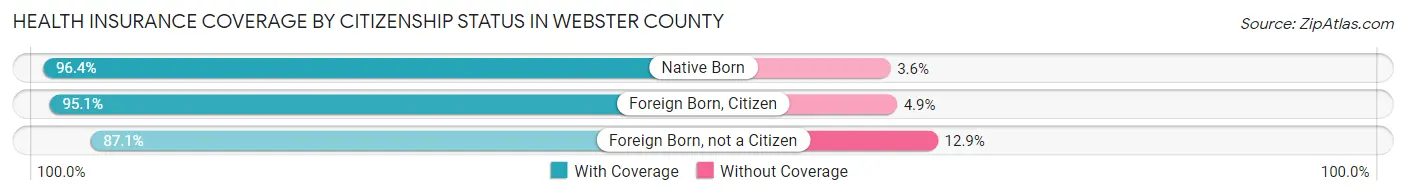
| Citizenship Status | With Coverage | Without Coverage |
| Native Born | 933 (96.4%) | 35 (3.6%) |
| Foreign Born, Citizen | 2,039 (95.1%) | 105 (4.9%) |
| Foreign Born, not a Citizen | 1,016 (87.1%) | 151 (12.9%) |
Health Insurance Coverage by Household Income in Webster County
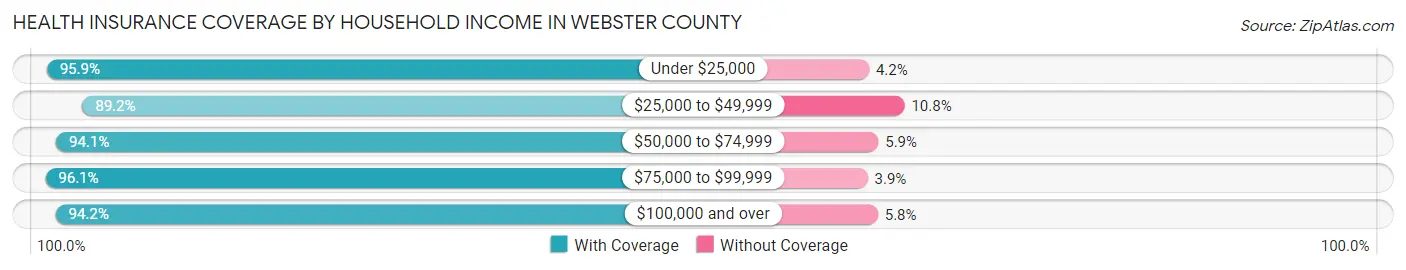
| Household Income | With Coverage | Without Coverage |
| Under $25,000 | 1,942 (95.9%) | 84 (4.2%) |
| $25,000 to $49,999 | 2,038 (89.2%) | 247 (10.8%) |
| $50,000 to $74,999 | 2,757 (94.1%) | 173 (5.9%) |
| $75,000 to $99,999 | 2,241 (96.1%) | 91 (3.9%) |
| $100,000 and over | 2,795 (94.2%) | 172 (5.8%) |
Public vs Private Health Insurance Coverage by Age in Webster County
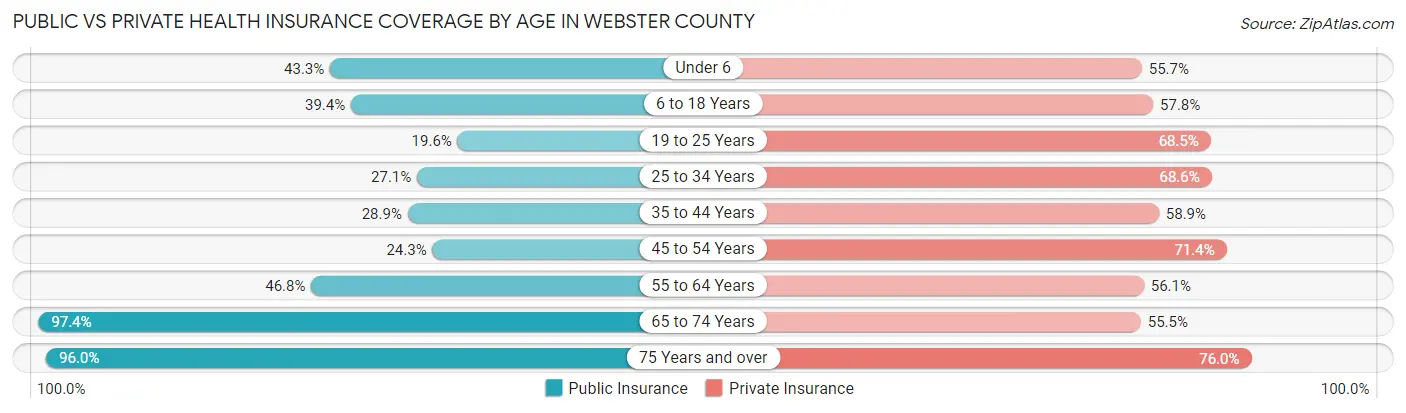
| Age Bracket | Public Insurance | Private Insurance |
| Under 6 | 419 (43.3%) | 539 (55.7%) |
| 6 to 18 Years | 845 (39.4%) | 1,239 (57.8%) |
| 19 to 25 Years | 229 (19.6%) | 799 (68.5%) |
| 25 to 34 Years | 346 (27.1%) | 875 (68.6%) |
| 35 to 44 Years | 426 (28.9%) | 868 (58.9%) |
| 45 to 54 Years | 395 (24.3%) | 1,161 (71.4%) |
| 55 to 64 Years | 828 (46.8%) | 992 (56.0%) |
| 65 to 74 Years | 1,373 (97.4%) | 782 (55.5%) |
| 75 Years and over | 768 (96.0%) | 608 (76.0%) |
| Total | 5,629 (44.6%) | 7,863 (62.2%) |
Disability Status by Sex by Age in Webster County
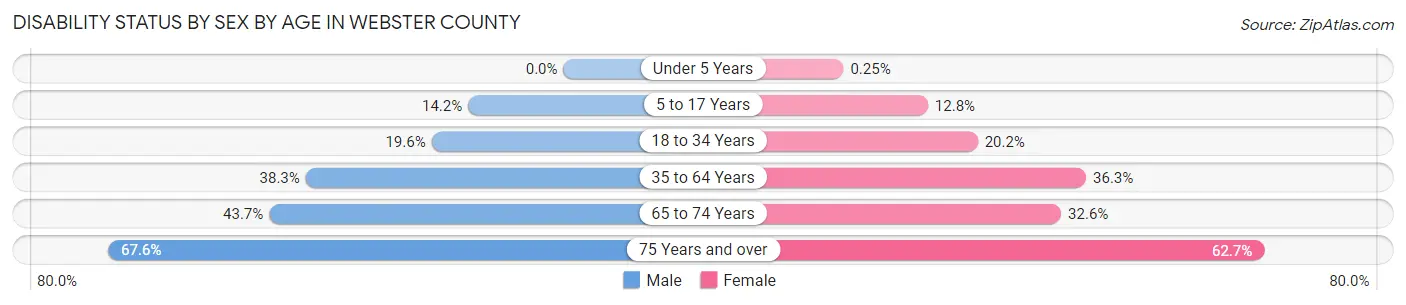
| Age Bracket | Male | Female |
| Under 5 Years | 0 (0.0%) | 1 (0.3%) |
| 5 to 17 Years | 158 (14.1%) | 141 (12.8%) |
| 18 to 34 Years | 260 (19.6%) | 247 (20.2%) |
| 35 to 64 Years | 938 (38.3%) | 878 (36.3%) |
| 65 to 74 Years | 291 (43.7%) | 242 (32.6%) |
| 75 Years and over | 240 (67.6%) | 279 (62.7%) |
Disability Class by Sex by Age in Webster County
Disability Class: Hearing Difficulty
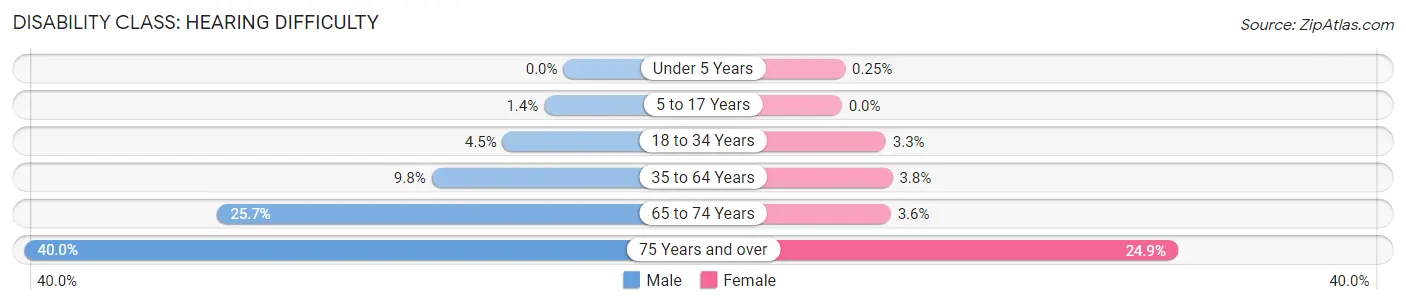
| Age Bracket | Male | Female |
| Under 5 Years | 0 (0.0%) | 1 (0.3%) |
| 5 to 17 Years | 16 (1.4%) | 0 (0.0%) |
| 18 to 34 Years | 60 (4.5%) | 40 (3.3%) |
| 35 to 64 Years | 240 (9.8%) | 91 (3.8%) |
| 65 to 74 Years | 171 (25.7%) | 27 (3.6%) |
| 75 Years and over | 142 (40.0%) | 111 (24.9%) |
Disability Class: Vision Difficulty
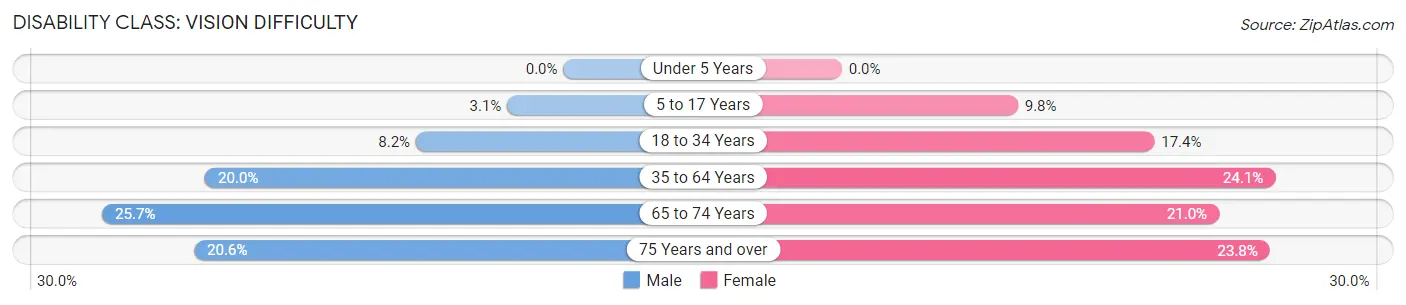
| Age Bracket | Male | Female |
| Under 5 Years | 0 (0.0%) | 0 (0.0%) |
| 5 to 17 Years | 35 (3.1%) | 108 (9.8%) |
| 18 to 34 Years | 109 (8.2%) | 213 (17.4%) |
| 35 to 64 Years | 489 (20.0%) | 584 (24.1%) |
| 65 to 74 Years | 171 (25.7%) | 156 (21.0%) |
| 75 Years and over | 73 (20.6%) | 106 (23.8%) |
Disability Class: Cognitive Difficulty
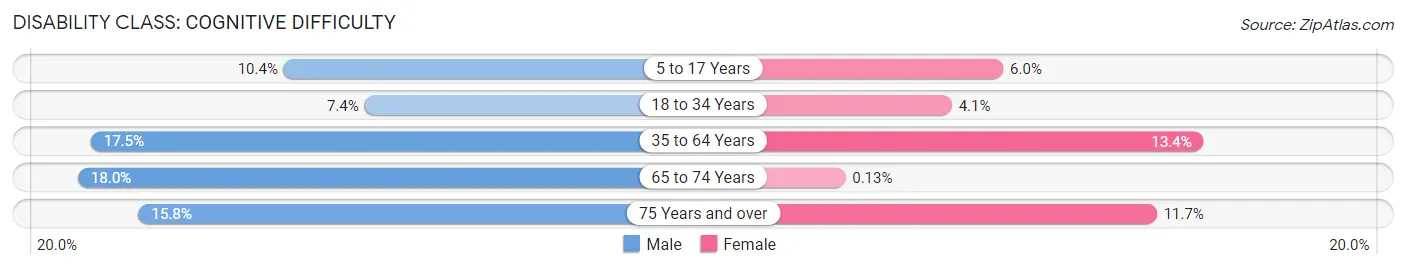
| Age Bracket | Male | Female |
| 5 to 17 Years | 116 (10.4%) | 66 (6.0%) |
| 18 to 34 Years | 98 (7.4%) | 50 (4.1%) |
| 35 to 64 Years | 430 (17.5%) | 325 (13.4%) |
| 65 to 74 Years | 120 (18.0%) | 1 (0.1%) |
| 75 Years and over | 56 (15.8%) | 52 (11.7%) |
Disability Class: Ambulatory Difficulty
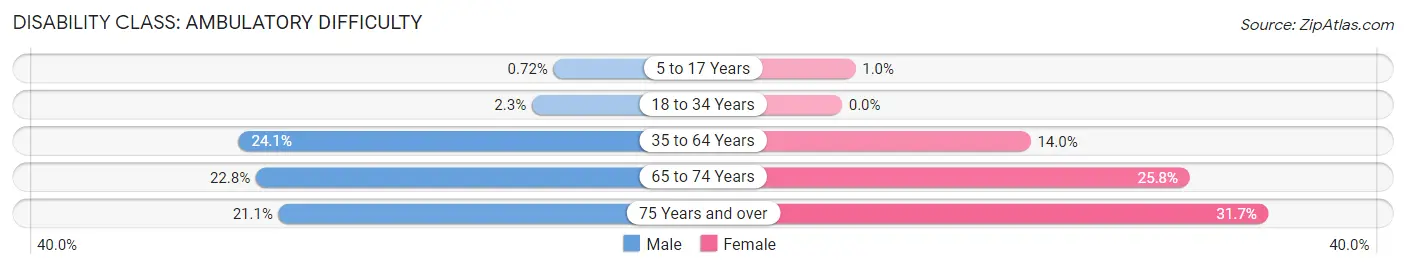
| Age Bracket | Male | Female |
| 5 to 17 Years | 8 (0.7%) | 11 (1.0%) |
| 18 to 34 Years | 31 (2.3%) | 0 (0.0%) |
| 35 to 64 Years | 591 (24.1%) | 339 (14.0%) |
| 65 to 74 Years | 152 (22.8%) | 192 (25.8%) |
| 75 Years and over | 75 (21.1%) | 141 (31.7%) |
Disability Class: Self-Care Difficulty
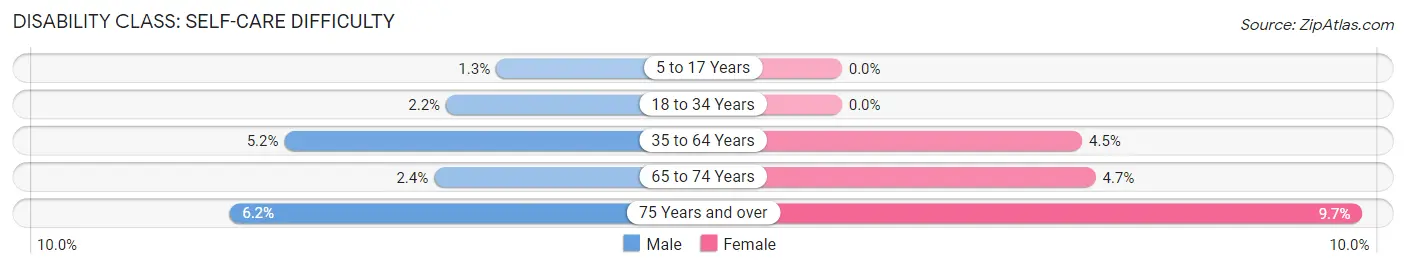
| Age Bracket | Male | Female |
| 5 to 17 Years | 14 (1.3%) | 0 (0.0%) |
| 18 to 34 Years | 29 (2.2%) | 0 (0.0%) |
| 35 to 64 Years | 127 (5.2%) | 108 (4.5%) |
| 65 to 74 Years | 16 (2.4%) | 35 (4.7%) |
| 75 Years and over | 22 (6.2%) | 43 (9.7%) |
Technology Access in Webster County
Computing Device Access in Webster County
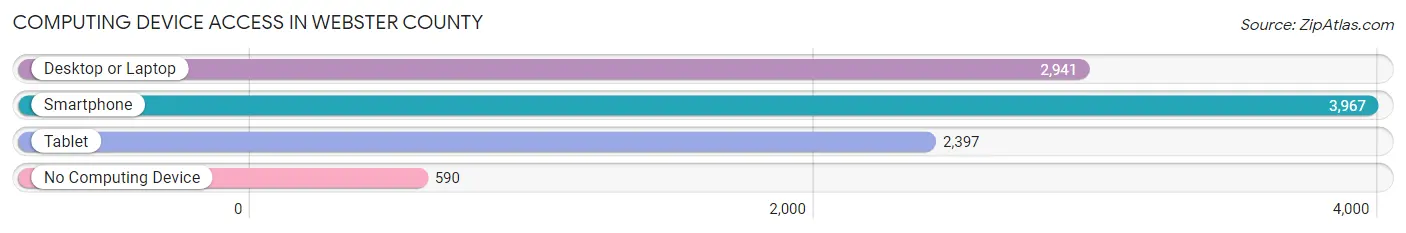
| Device Type | # Households | % Households |
| Desktop or Laptop | 2,941 | 61.0% |
| Smartphone | 3,967 | 82.3% |
| Tablet | 2,397 | 49.7% |
| No Computing Device | 590 | 12.2% |
| Total | 4,819 | 100.0% |
Internet Access in Webster County
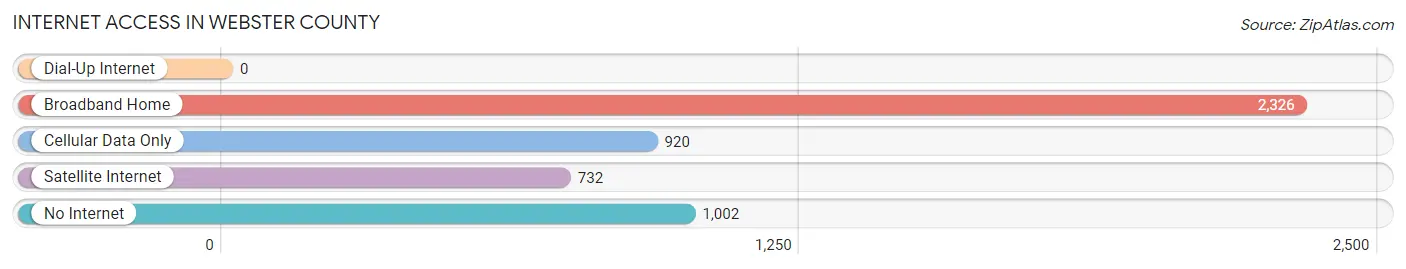
| Internet Type | # Households | % Households |
| Dial-Up Internet | 0 | 0.0% |
| Broadband Home | 2,326 | 48.3% |
| Cellular Data Only | 920 | 19.1% |
| Satellite Internet | 732 | 15.2% |
| No Internet | 1,002 | 20.8% |
| Total | 4,819 | 100.0% |
Webster County Summary
Webster County is located in the western part of Kentucky, and is part of the Pennyrile region. It is bordered by Hopkins County to the north, Union County to the east, McLean County to the south, and Henderson County to the west. The county seat is Dixon, and the county was formed in 1860 from parts of Hopkins and Union counties. The county is named for Daniel Webster, a prominent American statesman.
Geography
Webster County has an area of 437 square miles, of which 434 square miles is land and 3 square miles is water. The county is located in the Pennyrile region of Kentucky, and is characterized by rolling hills and valleys. The highest point in the county is located in the northwest corner, at an elevation of 645 feet. The county is drained by the Green River, which forms the western boundary of the county. Other major waterways include the Tradewater River, which flows through the center of the county, and the Pond River, which forms the eastern boundary.
The county is mostly rural, with the majority of the population living in small towns and villages. The largest town is Dixon, which is the county seat. Other towns include Clay, Sebree, Slaughters, and Wheatcroft.
Economy
The economy of Webster County is largely based on agriculture. The county is home to a variety of crops, including corn, soybeans, wheat, hay, and tobacco. Livestock production is also important, with cattle, hogs, and poultry being the main animals raised.
The county is also home to several manufacturing companies, including a furniture factory, a plastics plant, and a metal fabrication plant. The county is also home to a number of small businesses, including restaurants, retail stores, and service providers.
Demographics
As of the 2010 census, the population of Webster County was 13,621. The population has remained relatively stable over the past decade, with a slight decrease of 0.3% since 2000. The population is spread out, with the largest age group being 45-54 years old, followed by 35-44 years old. The median age is 41.7 years.
The racial makeup of the county is 97.2% White, 1.2% African American, 0.3% Native American, 0.2% Asian, 0.1% Pacific Islander, and 0.9% from other races. The Hispanic or Latino population is 1.2%.
The median household income in the county is $37,945, and the median family income is $45,945. The per capita income is $19,945. The poverty rate is 17.2%.
Education
Webster County is served by the Webster County School District, which consists of four elementary schools, one middle school, and one high school. The district also operates a vocational-technical school. The county is also home to a number of private schools, including a Catholic school and a Christian school.
The county is home to two post-secondary institutions, Webster County Community College and the University of Kentucky at Madisonville. The University of Kentucky at Madisonville offers a variety of degree programs, including business, education, engineering, and nursing.
Conclusion
Webster County is a rural county located in the western part of Kentucky. The county is characterized by rolling hills and valleys, and is home to a variety of crops and livestock. The economy is largely based on agriculture, but there are also a number of manufacturing and small businesses in the county. The population is mostly White, with a median age of 41.7 years. The county is served by the Webster County School District, as well as two post-secondary institutions.
Common Questions
What is Per Capita Income in Webster County?
Per Capita income in Webster County is $25,177.
What is the Median Family Income in Webster County?
Median Family Income in Webster County is $63,719.
What is the Median Household income in Webster County?
Median Household Income in Webster County is $55,451.
What is Income or Wage Gap in Webster County?
Income or Wage Gap in Webster County is 31.5%.
Women in Webster County earn 68.5 cents for every dollar earned by a man.
What is Family Income Deficit in Webster County?
Family Income Deficit in Webster County is $7,066.
Families that are below poverty line in Webster County earn $7,066 less on average than the poverty threshold level.
What is Inequality or Gini Index in Webster County?
Inequality or Gini Index in Webster County is 0.42.
What is the Total Population of Webster County?
Total Population of Webster County is 12,951.
What is the Total Male Population of Webster County?
Total Male Population of Webster County is 6,488.
What is the Total Female Population of Webster County?
Total Female Population of Webster County is 6,463.
What is the Ratio of Males per 100 Females in Webster County?
There are 100.39 Males per 100 Females in Webster County.
What is the Ratio of Females per 100 Males in Webster County?
There are 99.61 Females per 100 Males in Webster County.
What is the Median Population Age in Webster County?
Median Population Age in Webster County is 39.7 Years.
What is the Average Family Size in Webster County
Average Family Size in Webster County is 3.0 People.
What is the Average Household Size in Webster County
Average Household Size in Webster County is 2.6 People.
How Large is the Labor Force in Webster County?
There are 5,681 People in the Labor Forcein in Webster County.
What is the Percentage of People in the Labor Force in Webster County?
55.2% of People are in the Labor Force in Webster County.
What is the Unemployment Rate in Webster County?
Unemployment Rate in Webster County is 5.9%.