Washington County, KY Map & Demographics
Washington County Map
Washington County Overview
$30,217
PER CAPITA INCOME
$86,053
AVG FAMILY INCOME
$65,456
AVG HOUSEHOLD INCOME
13.4%
WAGE / INCOME GAP [ % ]
86.6¢/ $1
WAGE / INCOME GAP [ $ ]
0.42
INEQUALITY / GINI INDEX
12,025
TOTAL POPULATION
6,026
MALE POPULATION
5,999
FEMALE POPULATION
100.45
MALES / 100 FEMALES
99.55
FEMALES / 100 MALES
42.3
MEDIAN AGE
3.2
AVG FAMILY SIZE
2.5
AVG HOUSEHOLD SIZE
5,856
LABOR FORCE [ PEOPLE ]
60.6%
PERCENT IN LABOR FORCE
2.3%
UNEMPLOYMENT RATE
Washington County Area Codes
Income in Washington County
Income Overview in Washington County
Per Capita Income in Washington County is $30,217, while median incomes of families and households are $86,053 and $65,456 respectively.
| Characteristic | Number | Measure |
| Per Capita Income | 12,025 | $30,217 |
| Median Family Income | 2,930 | $86,053 |
| Mean Family Income | 2,930 | $94,118 |
| Median Household Income | 4,635 | $65,456 |
| Mean Household Income | 4,635 | $76,390 |
| Income Deficit | 2,930 | $0 |
| Wage / Income Gap (%) | 12,025 | 13.41% |
| Wage / Income Gap ($) | 12,025 | 86.59¢ per $1 |
| Gini / Inequality Index | 12,025 | 0.42 |
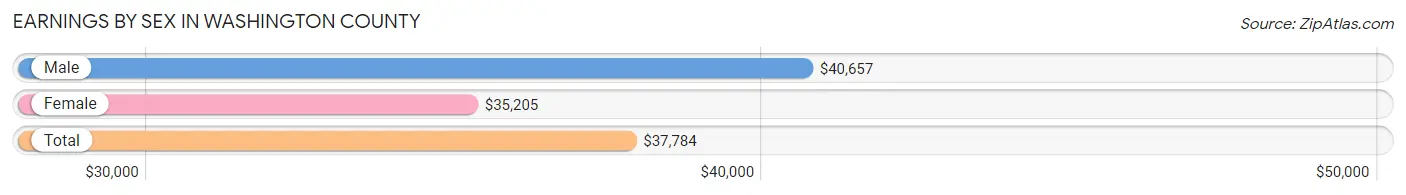
Earnings by Sex in Washington County
Average Earnings in Washington County are $37,784, $40,657 for men and $35,205 for women, a difference of 13.4%.
| Sex | Number | Average Earnings |
| Male | 3,496 (55.7%) | $40,657 |
| Female | 2,780 (44.3%) | $35,205 |
| Total | 6,276 (100.0%) | $37,784 |
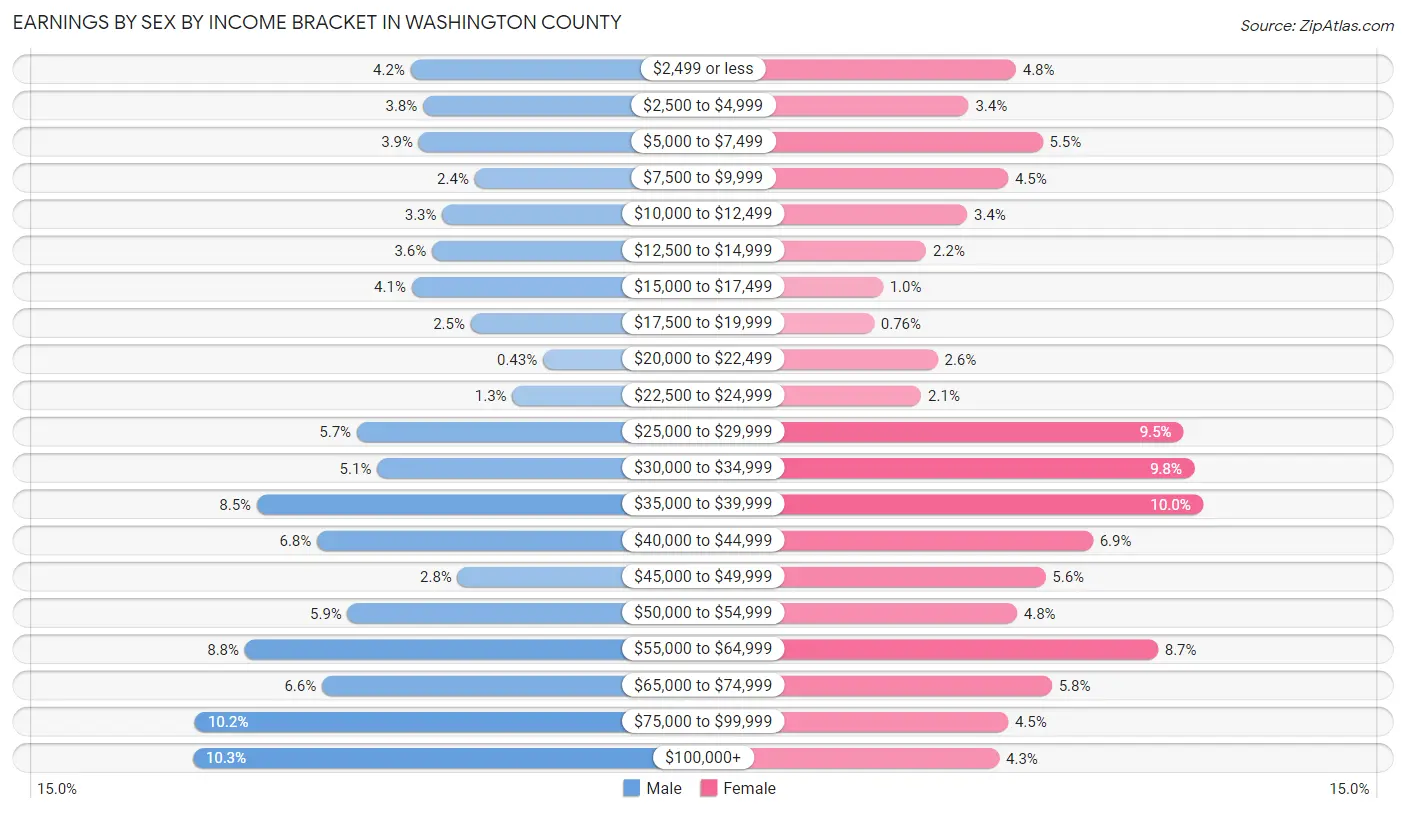
Earnings by Sex by Income Bracket in Washington County
The most common earnings brackets in Washington County are $100,000+ for men (359 | 10.3%) and $35,000 to $39,999 for women (278 | 10.0%).
| Income | Male | Female |
| $2,499 or less | 145 (4.2%) | 132 (4.8%) |
| $2,500 to $4,999 | 133 (3.8%) | 95 (3.4%) |
| $5,000 to $7,499 | 137 (3.9%) | 153 (5.5%) |
| $7,500 to $9,999 | 82 (2.4%) | 126 (4.5%) |
| $10,000 to $12,499 | 114 (3.3%) | 94 (3.4%) |
| $12,500 to $14,999 | 124 (3.5%) | 62 (2.2%) |
| $15,000 to $17,499 | 144 (4.1%) | 28 (1.0%) |
| $17,500 to $19,999 | 86 (2.5%) | 21 (0.8%) |
| $20,000 to $22,499 | 15 (0.4%) | 71 (2.5%) |
| $22,500 to $24,999 | 45 (1.3%) | 58 (2.1%) |
| $25,000 to $29,999 | 198 (5.7%) | 263 (9.5%) |
| $30,000 to $34,999 | 178 (5.1%) | 271 (9.8%) |
| $35,000 to $39,999 | 296 (8.5%) | 278 (10.0%) |
| $40,000 to $44,999 | 237 (6.8%) | 192 (6.9%) |
| $45,000 to $49,999 | 99 (2.8%) | 155 (5.6%) |
| $50,000 to $54,999 | 207 (5.9%) | 133 (4.8%) |
| $55,000 to $64,999 | 308 (8.8%) | 243 (8.7%) |
| $65,000 to $74,999 | 232 (6.6%) | 160 (5.8%) |
| $75,000 to $99,999 | 357 (10.2%) | 126 (4.5%) |
| $100,000+ | 359 (10.3%) | 119 (4.3%) |
| Total | 3,496 (100.0%) | 2,780 (100.0%) |
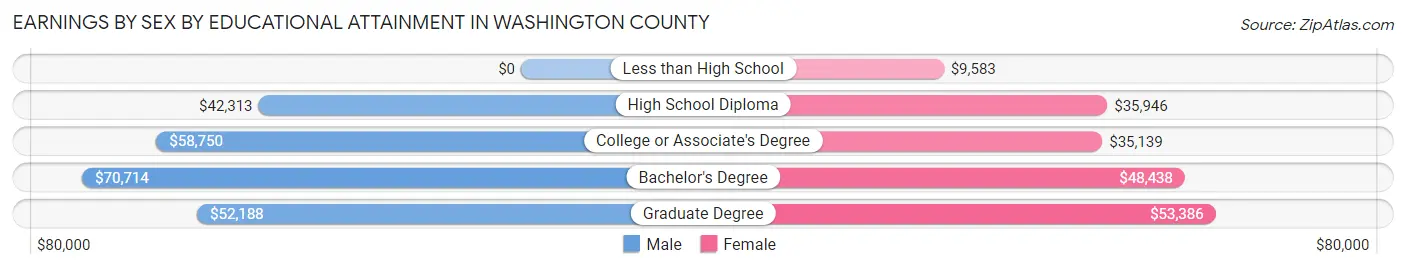
Earnings by Sex by Educational Attainment in Washington County
Average earnings in Washington County are $47,333 for men and $37,184 for women, a difference of 21.4%. Men with an educational attainment of bachelor's degree enjoy the highest average annual earnings of $70,714, while those with high school diploma education earn the least with $42,313. Women with an educational attainment of graduate degree earn the most with the average annual earnings of $53,386, while those with less than high school education have the smallest earnings of $9,583.
| Educational Attainment | Male Income | Female Income |
| Less than High School | - | - |
| High School Diploma | $42,313 | $35,946 |
| College or Associate's Degree | $58,750 | $35,139 |
| Bachelor's Degree | $70,714 | $48,438 |
| Graduate Degree | $52,188 | $53,386 |
| Total | $47,333 | $37,184 |
Family Income in Washington County
Family Income Brackets in Washington County
According to the Washington County family income data, there are 665 families falling into the $75,000 to $99,999 income range, which is the most common income bracket and makes up 22.7% of all families. Conversely, the less than $10,000 income bracket is the least frequent group with only 67 families (2.3%) belonging to this category.
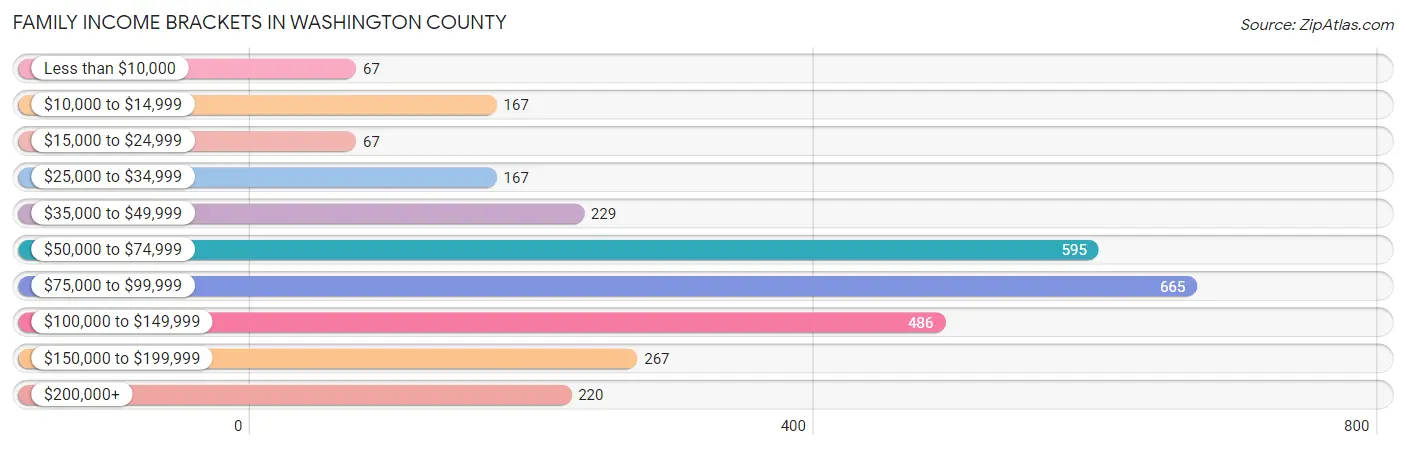
| Income Bracket | # Families | % Families |
| Less than $10,000 | 67 | 2.3% |
| $10,000 to $14,999 | 167 | 5.7% |
| $15,000 to $24,999 | 67 | 2.3% |
| $25,000 to $34,999 | 167 | 5.7% |
| $35,000 to $49,999 | 229 | 7.8% |
| $50,000 to $74,999 | 595 | 20.3% |
| $75,000 to $99,999 | 665 | 22.7% |
| $100,000 to $149,999 | 486 | 16.6% |
| $150,000 to $199,999 | 267 | 9.1% |
| $200,000+ | 220 | 7.5% |
Family Income by Famaliy Size in Washington County
5-person families (230 | 7.9%) account for the highest median family income in Washington County with $118,409 per family, while 2-person families (1,396 | 47.6%) have the highest median income of $32,786 per family member.
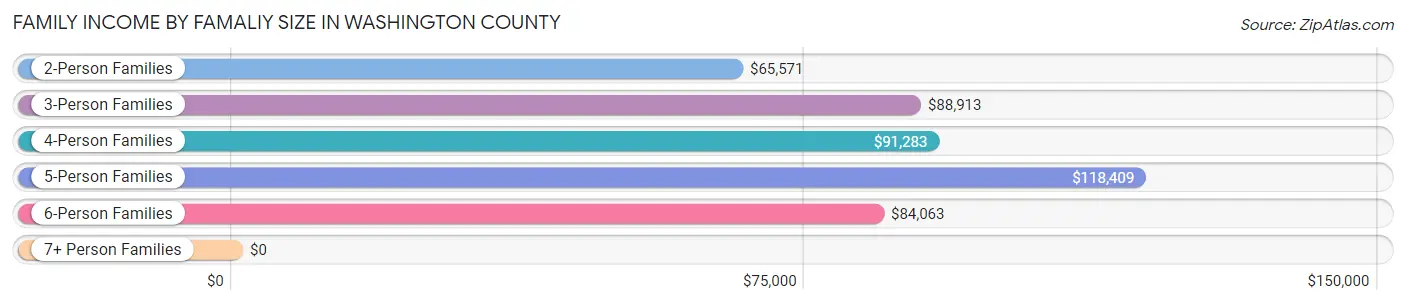
| Income Bracket | # Families | Median Income |
| 2-Person Families | 1,396 (47.6%) | $65,571 |
| 3-Person Families | 470 (16.0%) | $88,913 |
| 4-Person Families | 741 (25.3%) | $91,283 |
| 5-Person Families | 230 (7.9%) | $118,409 |
| 6-Person Families | 56 (1.9%) | $84,063 |
| 7+ Person Families | 37 (1.3%) | $0 |
| Total | 2,930 (100.0%) | $86,053 |
Family Income by Number of Earners in Washington County
The median family income in Washington County is $86,053, with families comprising 3+ earners (425) having the highest median family income of $151,927, while families with no earners (434) have the lowest median family income of $30,288, accounting for 14.5% and 14.8% of families, respectively.
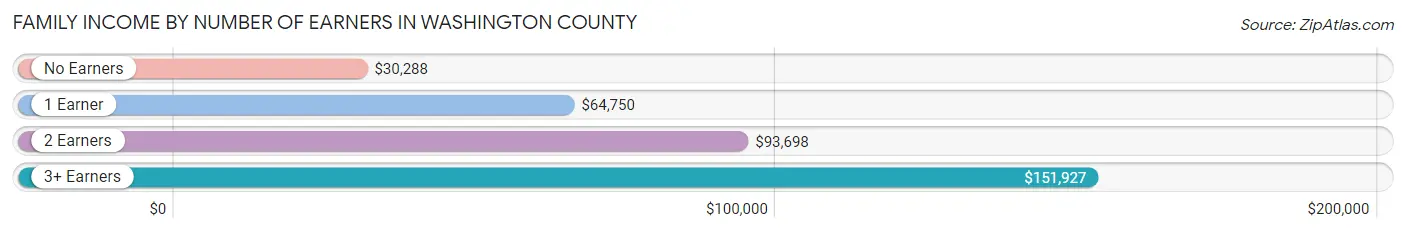
| Number of Earners | # Families | Median Income |
| No Earners | 434 (14.8%) | $30,288 |
| 1 Earner | 743 (25.4%) | $64,750 |
| 2 Earners | 1,328 (45.3%) | $93,698 |
| 3+ Earners | 425 (14.5%) | $151,927 |
| Total | 2,930 (100.0%) | $86,053 |
Household Income in Washington County
Household Income Brackets in Washington County
With 913 households falling in the category, the $75,000 to $99,999 income range is the most frequent in Washington County, accounting for 19.7% of all households. In contrast, only 158 households (3.4%) fall into the less than $10,000 income bracket, making it the least populous group.
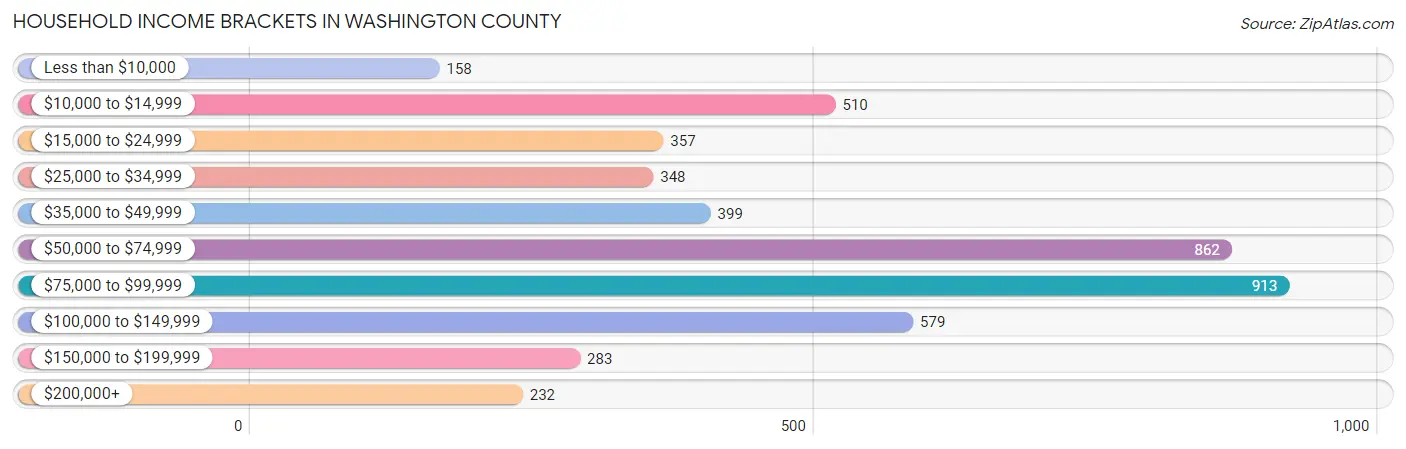
| Income Bracket | # Households | % Households |
| Less than $10,000 | 158 | 3.4% |
| $10,000 to $14,999 | 510 | 11.0% |
| $15,000 to $24,999 | 357 | 7.7% |
| $25,000 to $34,999 | 348 | 7.5% |
| $35,000 to $49,999 | 399 | 8.6% |
| $50,000 to $74,999 | 862 | 18.6% |
| $75,000 to $99,999 | 913 | 19.7% |
| $100,000 to $149,999 | 579 | 12.5% |
| $150,000 to $199,999 | 283 | 6.1% |
| $200,000+ | 232 | 5.0% |
Household Income by Householder Age in Washington County
The median household income in Washington County is $65,456, with the highest median household income of $89,247 found in the 45 to 64 years age bracket for the primary householder. A total of 1,894 households (40.9%) fall into this category. Meanwhile, the 15 to 24 years age bracket for the primary householder has the lowest median household income of $0, with 54 households (1.2%) in this group.
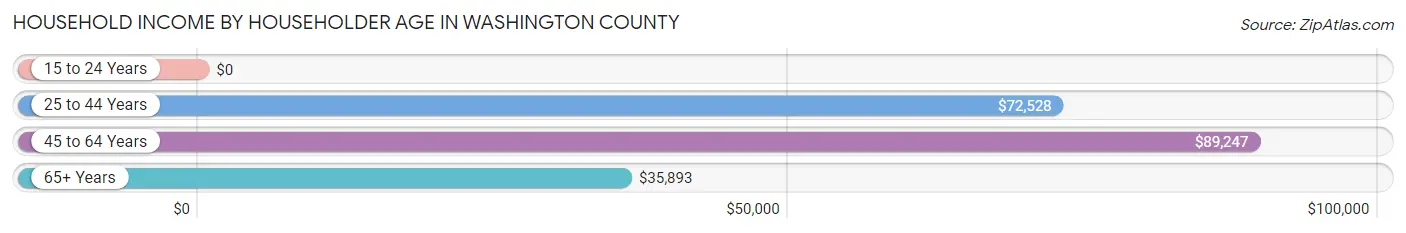
| Income Bracket | # Households | Median Income |
| 15 to 24 Years | 54 (1.2%) | $0 |
| 25 to 44 Years | 1,289 (27.8%) | $72,528 |
| 45 to 64 Years | 1,894 (40.9%) | $89,247 |
| 65+ Years | 1,398 (30.2%) | $35,893 |
| Total | 4,635 (100.0%) | $65,456 |
Poverty in Washington County
Income Below Poverty by Sex and Age in Washington County
With 13.7% poverty level for males and 14.6% for females among the residents of Washington County, 6 to 11 year old males and 5 year old females are the most vulnerable to poverty, with 99 males (22.1%) and 11 females (28.9%) in their respective age groups living below the poverty level.
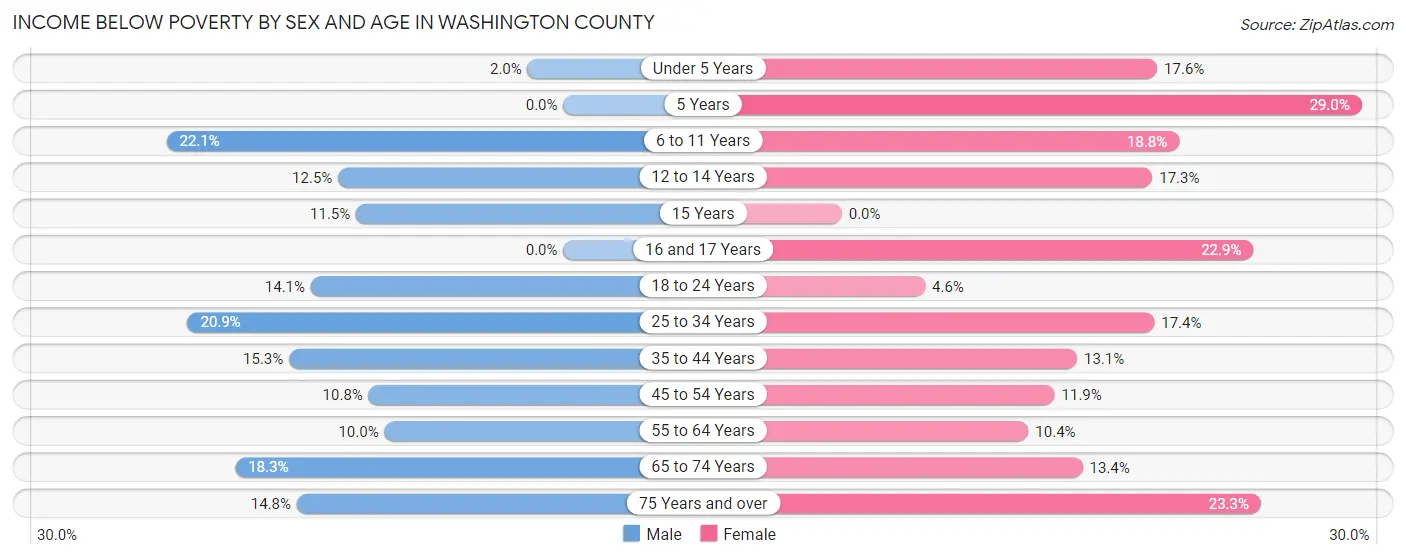
| Age Bracket | Male | Female |
| Under 5 Years | 7 (2.0%) | 59 (17.6%) |
| 5 Years | 0 (0.0%) | 11 (28.9%) |
| 6 to 11 Years | 99 (22.1%) | 83 (18.8%) |
| 12 to 14 Years | 39 (12.5%) | 37 (17.3%) |
| 15 Years | 3 (11.5%) | 0 (0.0%) |
| 16 and 17 Years | 0 (0.0%) | 41 (22.9%) |
| 18 to 24 Years | 54 (14.1%) | 18 (4.6%) |
| 25 to 34 Years | 153 (20.9%) | 122 (17.4%) |
| 35 to 44 Years | 111 (15.3%) | 85 (13.1%) |
| 45 to 54 Years | 85 (10.8%) | 93 (11.8%) |
| 55 to 64 Years | 92 (10.0%) | 83 (10.4%) |
| 65 to 74 Years | 116 (18.3%) | 87 (13.4%) |
| 75 Years and over | 46 (14.8%) | 133 (23.3%) |
| Total | 805 (13.7%) | 852 (14.6%) |
Income Above Poverty by Sex and Age in Washington County
According to the poverty statistics in Washington County, males aged 5 years and females aged 15 years are the age groups that are most secure financially, with 100.0% of males and 100.0% of females in these age groups living above the poverty line.
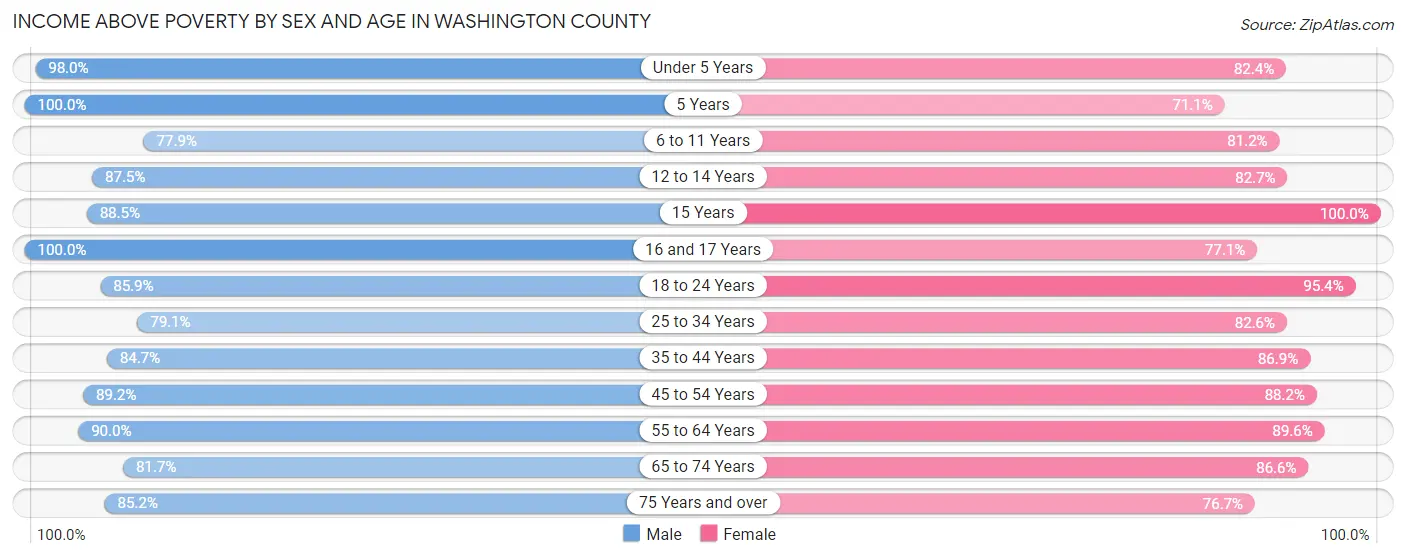
| Age Bracket | Male | Female |
| Under 5 Years | 345 (98.0%) | 277 (82.4%) |
| 5 Years | 55 (100.0%) | 27 (71.1%) |
| 6 to 11 Years | 349 (77.9%) | 359 (81.2%) |
| 12 to 14 Years | 272 (87.5%) | 177 (82.7%) |
| 15 Years | 23 (88.5%) | 88 (100.0%) |
| 16 and 17 Years | 201 (100.0%) | 138 (77.1%) |
| 18 to 24 Years | 330 (85.9%) | 370 (95.4%) |
| 25 to 34 Years | 578 (79.1%) | 579 (82.6%) |
| 35 to 44 Years | 616 (84.7%) | 564 (86.9%) |
| 45 to 54 Years | 699 (89.2%) | 692 (88.1%) |
| 55 to 64 Years | 832 (90.0%) | 716 (89.6%) |
| 65 to 74 Years | 519 (81.7%) | 562 (86.6%) |
| 75 Years and over | 264 (85.2%) | 437 (76.7%) |
| Total | 5,083 (86.3%) | 4,986 (85.4%) |
Income Below Poverty Among Married-Couple Families in Washington County
The poverty statistics for married-couple families in Washington County show that 4.0% or 96 of the total 2,424 families live below the poverty line. Families with 3 or 4 children have the highest poverty rate of 6.7%, comprising of 11 families. On the other hand, families with 5 or more children have the lowest poverty rate of 0.0%, which includes 0 families.
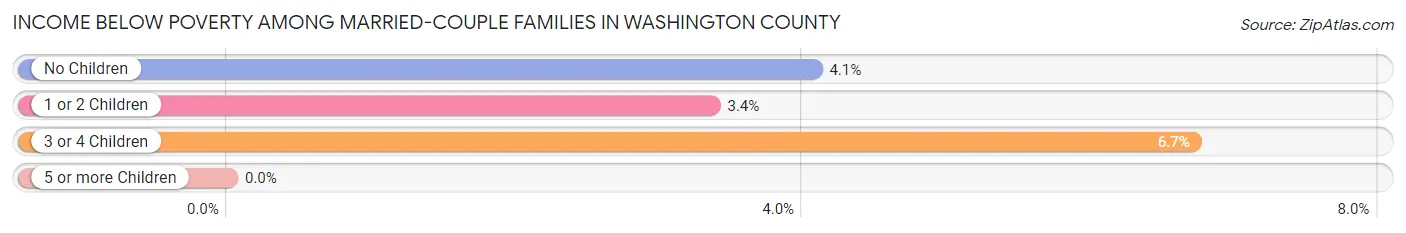
| Children | Above Poverty | Below Poverty |
| No Children | 1,368 (95.9%) | 58 (4.1%) |
| 1 or 2 Children | 776 (96.6%) | 27 (3.4%) |
| 3 or 4 Children | 153 (93.3%) | 11 (6.7%) |
| 5 or more Children | 31 (100.0%) | 0 (0.0%) |
| Total | 2,328 (96.0%) | 96 (4.0%) |
Income Below Poverty Among Single-Parent Households in Washington County
According to the poverty data in Washington County, 38.5% or 55 single-father households and 39.9% or 145 single-mother households are living below the poverty line. Among single-father households, those with no children have the highest poverty rate, with 40 households (69.0%) experiencing poverty. Likewise, among single-mother households, those with 3 or 4 children have the highest poverty rate, with 50 households (50.5%) falling below the poverty line.
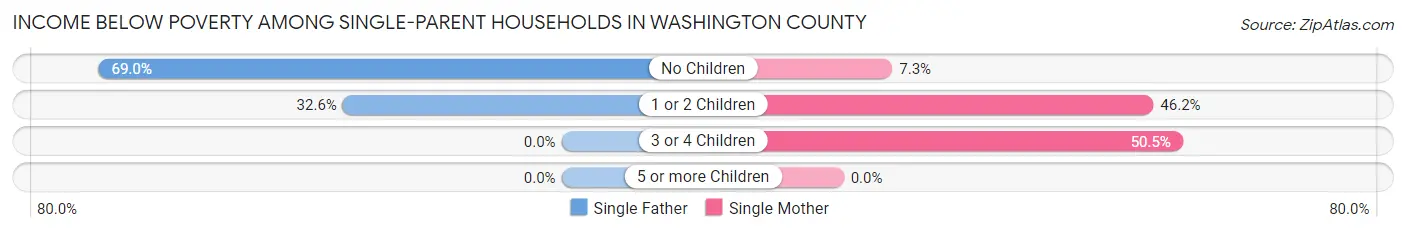
| Children | Single Father | Single Mother |
| No Children | 40 (69.0%) | 5 (7.2%) |
| 1 or 2 Children | 15 (32.6%) | 90 (46.2%) |
| 3 or 4 Children | 0 (0.0%) | 50 (50.5%) |
| 5 or more Children | 0 (0.0%) | 0 (0.0%) |
| Total | 55 (38.5%) | 145 (39.9%) |
Income Below Poverty Among Married-Couple vs Single-Parent Households in Washington County
The poverty data for Washington County shows that 96 of the married-couple family households (4.0%) and 200 of the single-parent households (39.5%) are living below the poverty level. Within the married-couple family households, those with 3 or 4 children have the highest poverty rate, with 11 households (6.7%) falling below the poverty line. Among the single-parent households, those with 1 or 2 children have the highest poverty rate, with 105 household (43.6%) living below poverty.
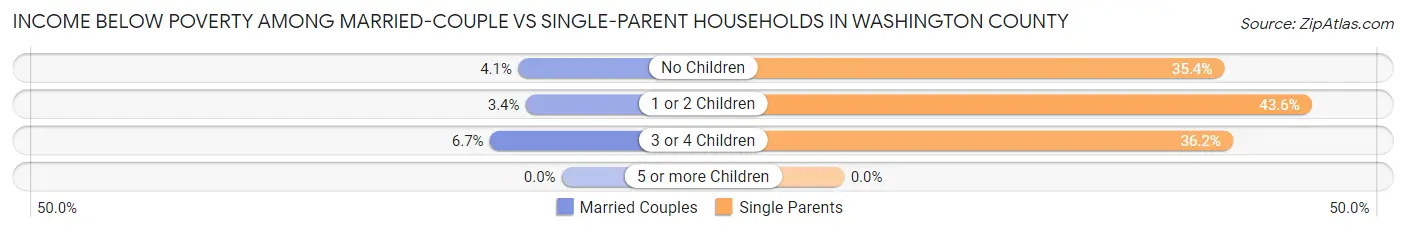
| Children | Married-Couple Families | Single-Parent Households |
| No Children | 58 (4.1%) | 45 (35.4%) |
| 1 or 2 Children | 27 (3.4%) | 105 (43.6%) |
| 3 or 4 Children | 11 (6.7%) | 50 (36.2%) |
| 5 or more Children | 0 (0.0%) | 0 (0.0%) |
| Total | 96 (4.0%) | 200 (39.5%) |
Race in Washington County
The most populous races in Washington County are White / Caucasian (10,603 | 88.2%), Two or more Races (664 | 5.5%), and Black / African American (660 | 5.5%).
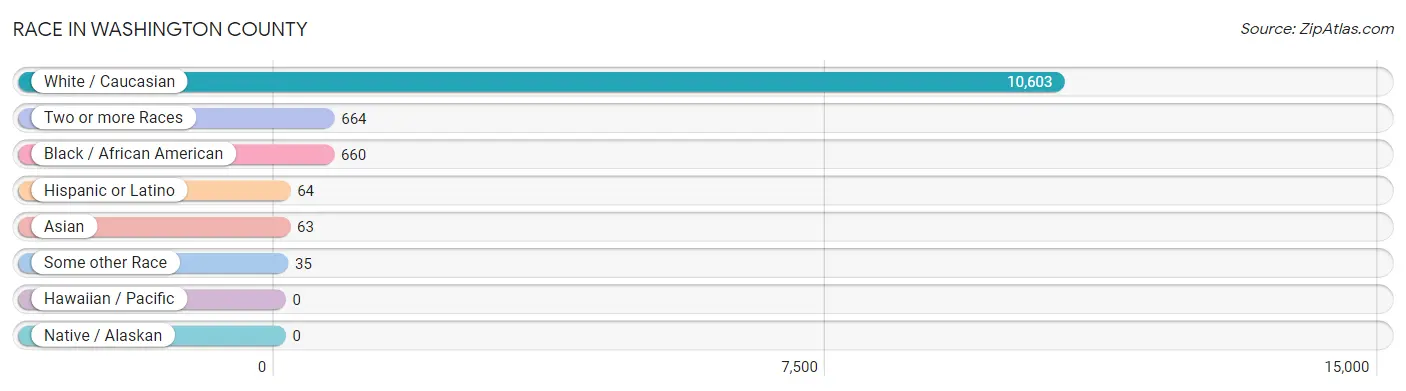
| Race | # Population | % Population |
| Asian | 63 | 0.5% |
| Black / African American | 660 | 5.5% |
| Hawaiian / Pacific | 0 | 0.0% |
| Hispanic or Latino | 64 | 0.5% |
| Native / Alaskan | 0 | 0.0% |
| White / Caucasian | 10,603 | 88.2% |
| Two or more Races | 664 | 5.5% |
| Some other Race | 35 | 0.3% |
| Total | 12,025 | 100.0% |
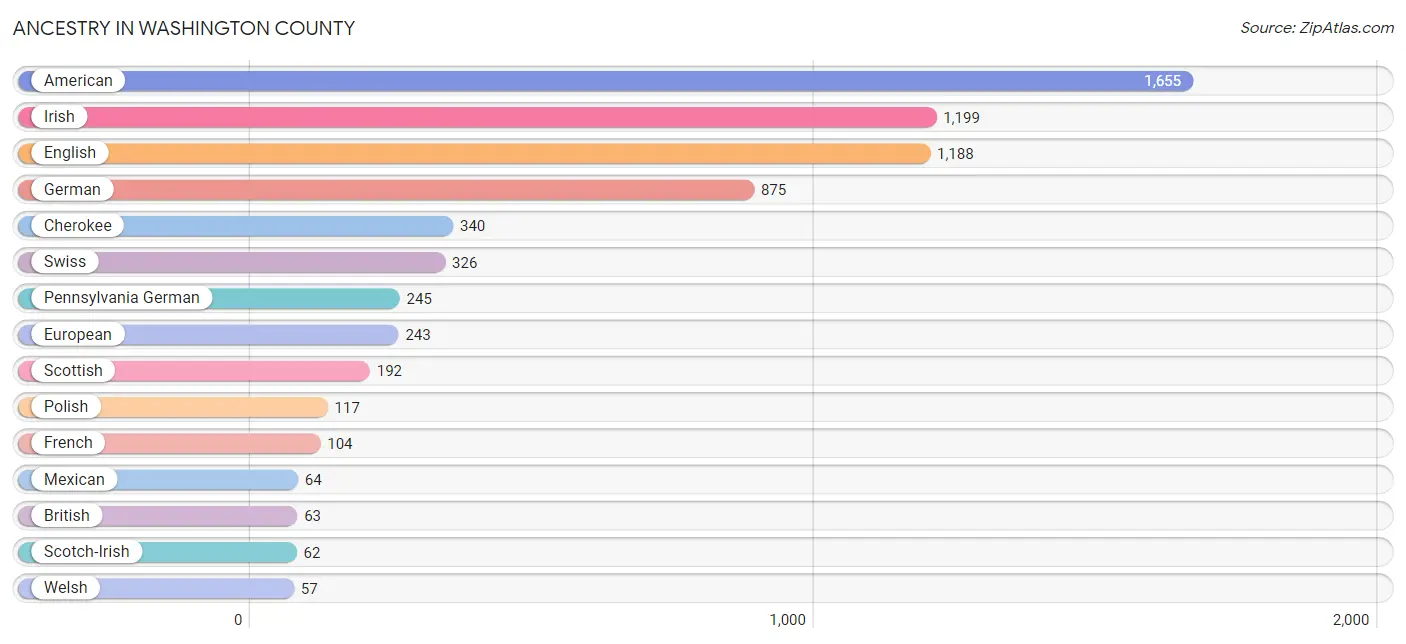
Ancestry in Washington County
The most populous ancestries reported in Washington County are American (1,655 | 13.8%), Irish (1,199 | 10.0%), English (1,188 | 9.9%), German (875 | 7.3%), and Cherokee (340 | 2.8%), together accounting for 43.7% of all Washington County residents.
| Ancestry | # Population | % Population |
| African | 41 | 0.3% |
| American | 1,655 | 13.8% |
| Arab | 29 | 0.2% |
| Australian | 10 | 0.1% |
| Bhutanese | 34 | 0.3% |
| British | 63 | 0.5% |
| Cherokee | 340 | 2.8% |
| Crow | 4 | 0.0% |
| Dutch | 49 | 0.4% |
| English | 1,188 | 9.9% |
| European | 243 | 2.0% |
| French | 104 | 0.9% |
| French Canadian | 23 | 0.2% |
| German | 875 | 7.3% |
| Irish | 1,199 | 10.0% |
| Italian | 41 | 0.3% |
| Malaysian | 15 | 0.1% |
| Mexican | 64 | 0.5% |
| Northern European | 3 | 0.0% |
| Norwegian | 19 | 0.2% |
| Pakistani | 7 | 0.1% |
| Pennsylvania German | 245 | 2.0% |
| Polish | 117 | 1.0% |
| Potawatomi | 10 | 0.1% |
| Russian | 37 | 0.3% |
| Scotch-Irish | 62 | 0.5% |
| Scottish | 192 | 1.6% |
| Sri Lankan | 28 | 0.2% |
| Subsaharan African | 41 | 0.3% |
| Swedish | 25 | 0.2% |
| Swiss | 326 | 2.7% |
| Thai | 7 | 0.1% |
| Welsh | 57 | 0.5% | View All 33 Rows |
Immigrants in Washington County
The most numerous immigrant groups reported in Washington County came from Latin America (52 | 0.4%), Central America (45 | 0.4%), Mexico (45 | 0.4%), Asia (41 | 0.3%), and Eastern Asia (34 | 0.3%), together accounting for 1.8% of all Washington County residents.
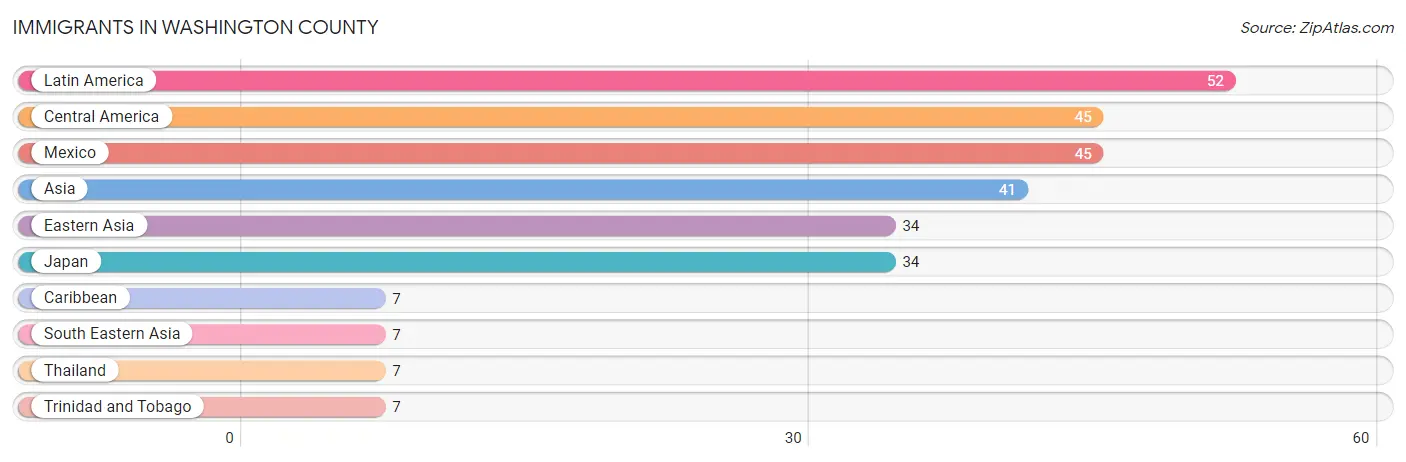
| Immigration Origin | # Population | % Population |
| Asia | 41 | 0.3% |
| Caribbean | 7 | 0.1% |
| Central America | 45 | 0.4% |
| Eastern Asia | 34 | 0.3% |
| Japan | 34 | 0.3% |
| Latin America | 52 | 0.4% |
| Mexico | 45 | 0.4% |
| South Eastern Asia | 7 | 0.1% |
| Thailand | 7 | 0.1% |
| Trinidad and Tobago | 7 | 0.1% | View All 10 Rows |
Sex and Age in Washington County
Sex and Age in Washington County
The most populous age groups in Washington County are 55 to 59 Years (585 | 9.7%) for men and 55 to 59 Years (507 | 8.5%) for women.
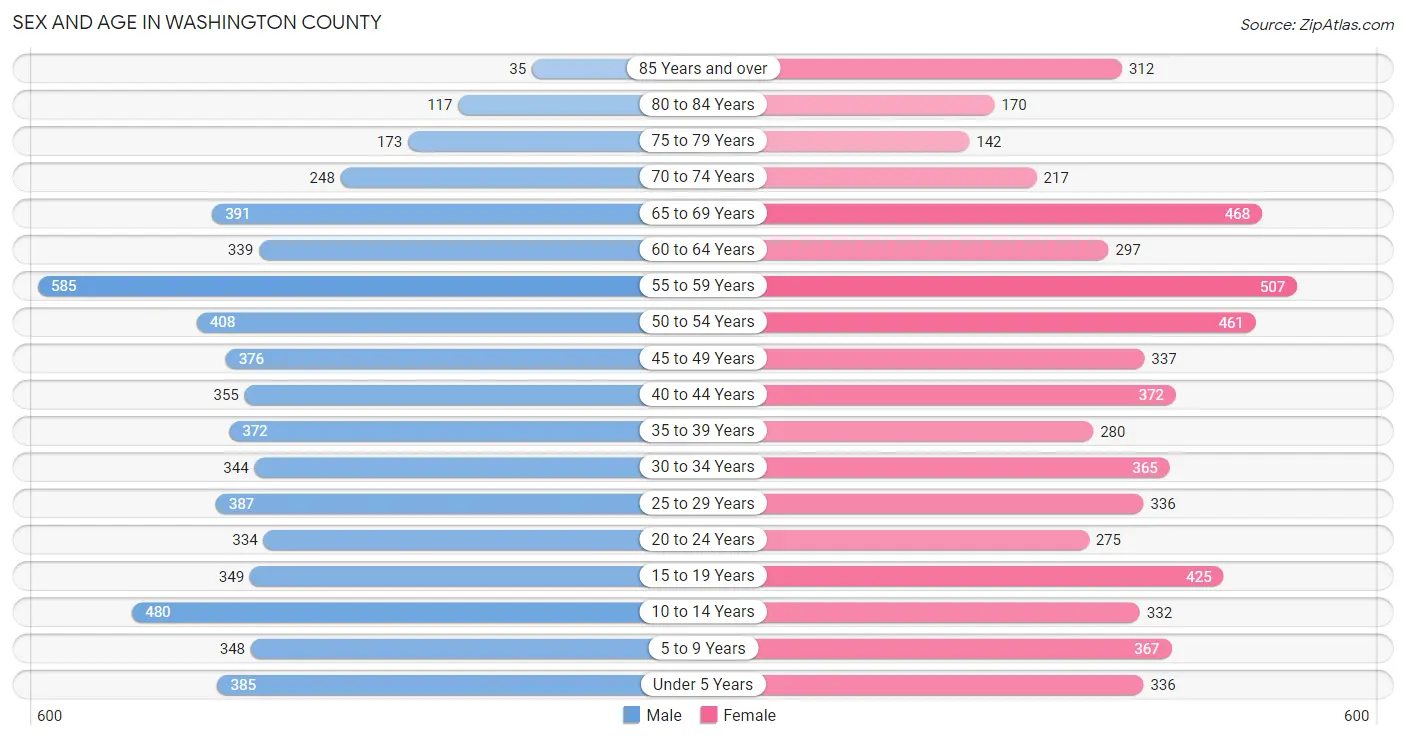
| Age Bracket | Male | Female |
| Under 5 Years | 385 (6.4%) | 336 (5.6%) |
| 5 to 9 Years | 348 (5.8%) | 367 (6.1%) |
| 10 to 14 Years | 480 (8.0%) | 332 (5.5%) |
| 15 to 19 Years | 349 (5.8%) | 425 (7.1%) |
| 20 to 24 Years | 334 (5.5%) | 275 (4.6%) |
| 25 to 29 Years | 387 (6.4%) | 336 (5.6%) |
| 30 to 34 Years | 344 (5.7%) | 365 (6.1%) |
| 35 to 39 Years | 372 (6.2%) | 280 (4.7%) |
| 40 to 44 Years | 355 (5.9%) | 372 (6.2%) |
| 45 to 49 Years | 376 (6.2%) | 337 (5.6%) |
| 50 to 54 Years | 408 (6.8%) | 461 (7.7%) |
| 55 to 59 Years | 585 (9.7%) | 507 (8.5%) |
| 60 to 64 Years | 339 (5.6%) | 297 (5.0%) |
| 65 to 69 Years | 391 (6.5%) | 468 (7.8%) |
| 70 to 74 Years | 248 (4.1%) | 217 (3.6%) |
| 75 to 79 Years | 173 (2.9%) | 142 (2.4%) |
| 80 to 84 Years | 117 (1.9%) | 170 (2.8%) |
| 85 Years and over | 35 (0.6%) | 312 (5.2%) |
| Total | 6,026 (100.0%) | 5,999 (100.0%) |
Families and Households in Washington County
Median Family Size in Washington County
The median family size in Washington County is 3.18 persons per family, with single female/mother families (363 | 12.4%) accounting for the largest median family size of 3.63 persons per family. On the other hand, single male/father families (143 | 4.9%) represent the smallest median family size with 2.20 persons per family.
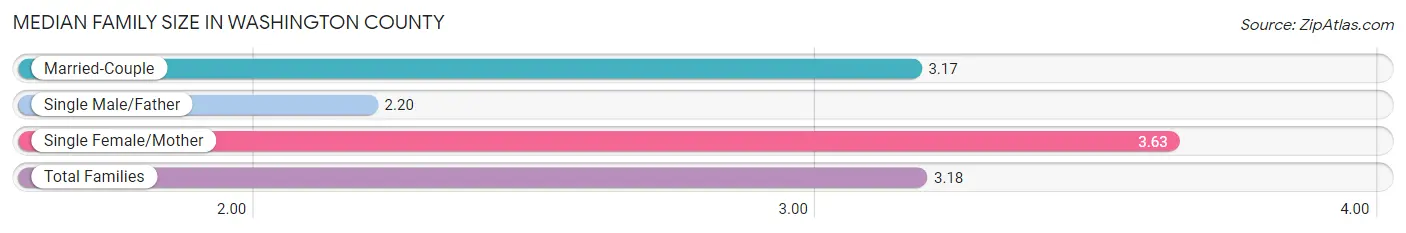
| Family Type | # Families | Family Size |
| Married-Couple | 2,424 (82.7%) | 3.17 |
| Single Male/Father | 143 (4.9%) | 2.20 |
| Single Female/Mother | 363 (12.4%) | 3.63 |
| Total Families | 2,930 (100.0%) | 3.18 |
Median Household Size in Washington County
The median household size in Washington County is 2.50 persons per household, with single female/mother households (363 | 7.8%) accounting for the largest median household size of 3.94 persons per household. non-family households (1,705 | 36.8%) represent the smallest median household size with 1.21 persons per household.
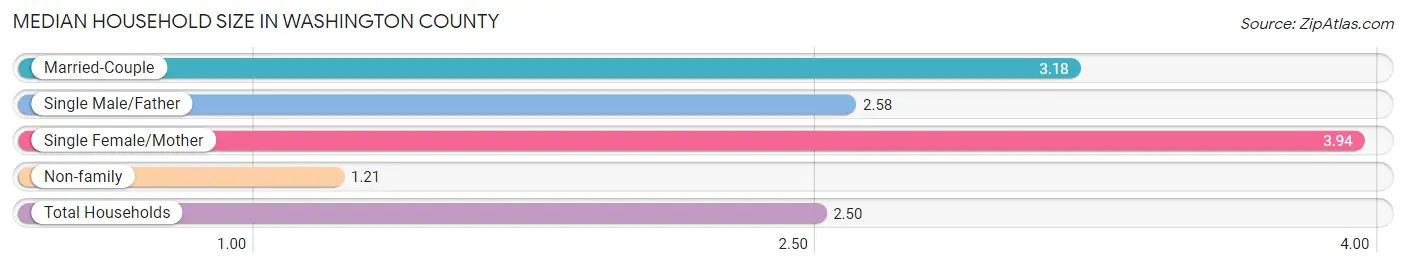
| Household Type | # Households | Household Size |
| Married-Couple | 2,424 (52.3%) | 3.18 |
| Single Male/Father | 143 (3.1%) | 2.58 |
| Single Female/Mother | 363 (7.8%) | 3.94 |
| Non-family | 1,705 (36.8%) | 1.21 |
| Total Households | 4,635 (100.0%) | 2.50 |
Household Size by Marriage Status in Washington County
Out of a total of 4,635 households in Washington County, 2,930 (63.2%) are family households, while 1,705 (36.8%) are nonfamily households. The most numerous type of family households are 2-person households, comprising 1,310, and the most common type of nonfamily households are 1-person households, comprising 1,425.
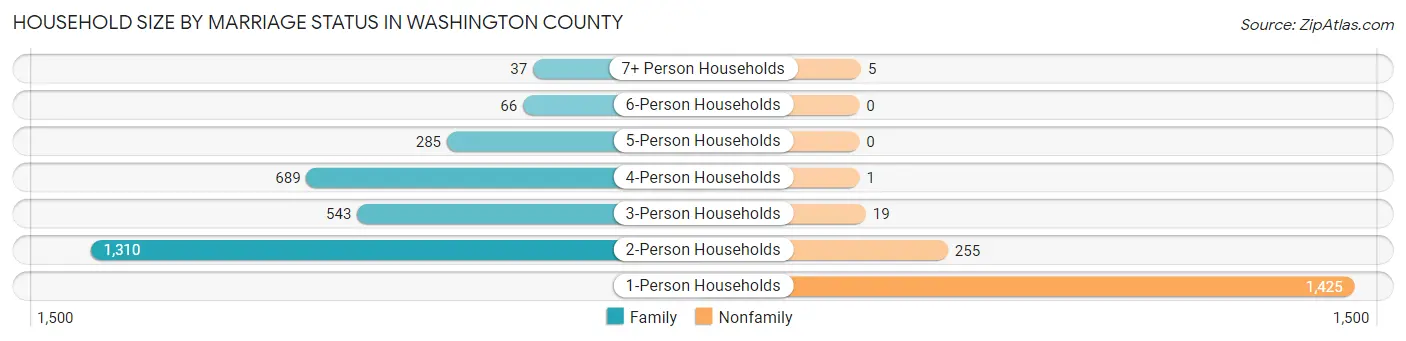
| Household Size | Family Households | Nonfamily Households |
| 1-Person Households | - | 1,425 (30.7%) |
| 2-Person Households | 1,310 (28.3%) | 255 (5.5%) |
| 3-Person Households | 543 (11.7%) | 19 (0.4%) |
| 4-Person Households | 689 (14.9%) | 1 (0.0%) |
| 5-Person Households | 285 (6.1%) | 0 (0.0%) |
| 6-Person Households | 66 (1.4%) | 0 (0.0%) |
| 7+ Person Households | 37 (0.8%) | 5 (0.1%) |
| Total | 2,930 (63.2%) | 1,705 (36.8%) |
Female Fertility in Washington County
Fertility by Age in Washington County
Average fertility rate in Washington County is 38.0 births per 1,000 women. Women in the age bracket of 20 to 34 years have the highest fertility rate with 99.0 births per 1,000 women. Women in the age bracket of 20 to 34 years acount for 100.0% of all women with births.
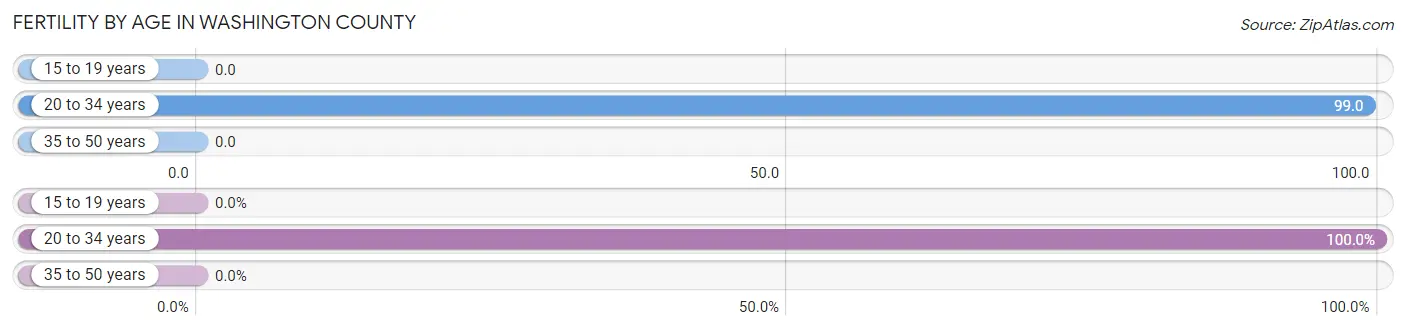
| Age Bracket | Women with Births | Births / 1,000 Women |
| 15 to 19 years | 0 (0.0%) | 0.0 |
| 20 to 34 years | 97 (100.0%) | 99.0 |
| 35 to 50 years | 0 (0.0%) | 0.0 |
| Total | 97 (100.0%) | 38.0 |
Fertility by Age by Marriage Status in Washington County
96.9% of women with births (97) in Washington County are married. The highest percentage of unmarried women with births falls into 20 to 34 years age bracket with 3.1% of them unmarried at the time of birth, while the lowest percentage of unmarried women with births belong to 20 to 34 years age bracket with 3.1% of them unmarried.
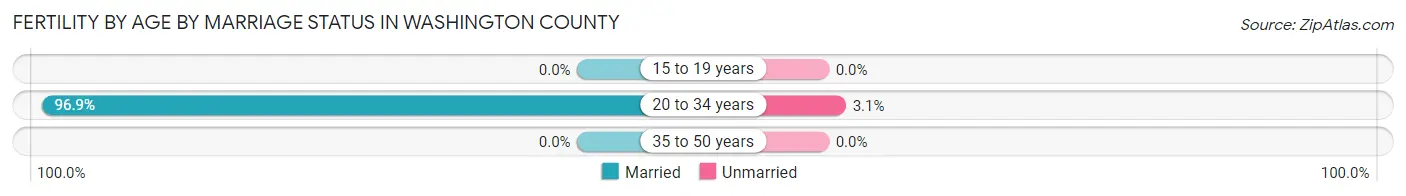
| Age Bracket | Married | Unmarried |
| 15 to 19 years | 0 (0.0%) | 0 (0.0%) |
| 20 to 34 years | 94 (96.9%) | 3 (3.1%) |
| 35 to 50 years | 0 (0.0%) | 0 (0.0%) |
| Total | 94 (96.9%) | 3 (3.1%) |
Fertility by Education in Washington County
Average fertility rate in Washington County is 38.0 births per 1,000 women. Women with the education attainment of less than high school have the highest fertility rate of 72.0 births per 1,000 women, while women with the education attainment of college or associate's degree have the lowest fertility at 4.0 births per 1,000 women. Women with the education attainment of less than high school represent 37.1% of all women with births.
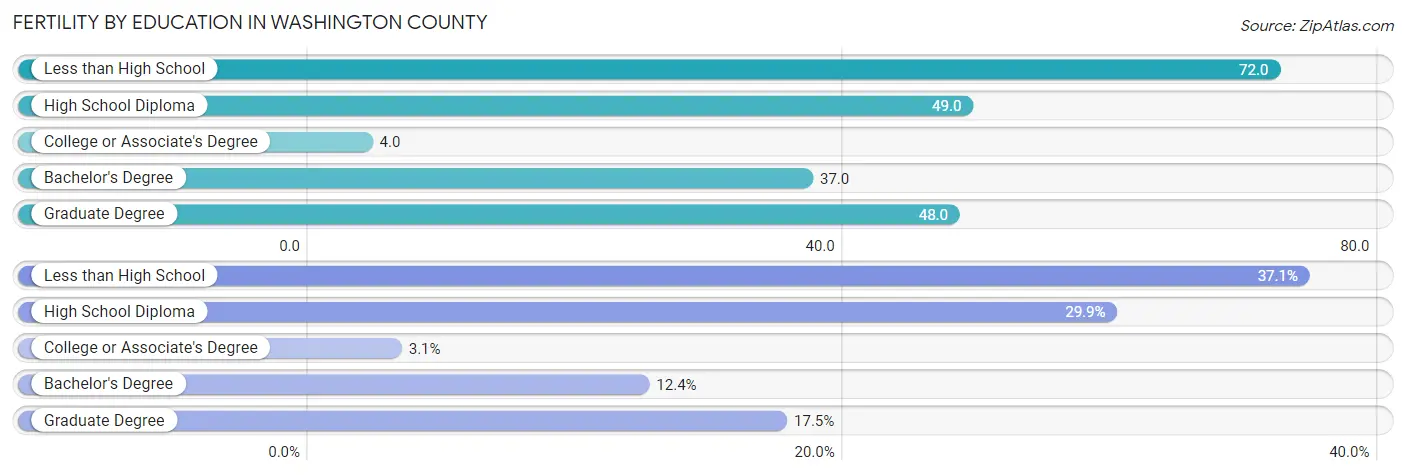
| Educational Attainment | Women with Births | Births / 1,000 Women |
| Less than High School | 36 (37.1%) | 72.0 |
| High School Diploma | 29 (29.9%) | 49.0 |
| College or Associate's Degree | 3 (3.1%) | 4.0 |
| Bachelor's Degree | 12 (12.4%) | 37.0 |
| Graduate Degree | 17 (17.5%) | 48.0 |
| Total | 97 (100.0%) | 38.0 |
Fertility by Education by Marriage Status in Washington County
3.1% of women with births in Washington County are unmarried. Women with the educational attainment of less than high school are most likely to be married with 100.0% of them married at childbirth, while women with the educational attainment of college or associate's degree are least likely to be married with 100.0% of them unmarried at childbirth.
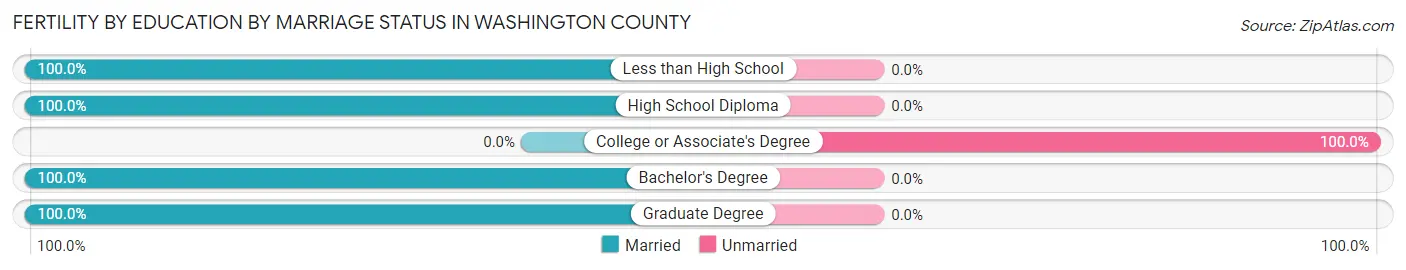
| Educational Attainment | Married | Unmarried |
| Less than High School | 36 (100.0%) | 0 (0.0%) |
| High School Diploma | 29 (100.0%) | 0 (0.0%) |
| College or Associate's Degree | 0 (0.0%) | 3 (100.0%) |
| Bachelor's Degree | 12 (100.0%) | 0 (0.0%) |
| Graduate Degree | 17 (100.0%) | 0 (0.0%) |
| Total | 94 (96.9%) | 3 (3.1%) |
Employment Characteristics in Washington County
Employment by Class of Employer in Washington County
Among the 5,686 employed individuals in Washington County, private company employees (3,892 | 68.4%), self-employed (not incorporated) (530 | 9.3%), and local government employees (473 | 8.3%) make up the most common classes of employment.
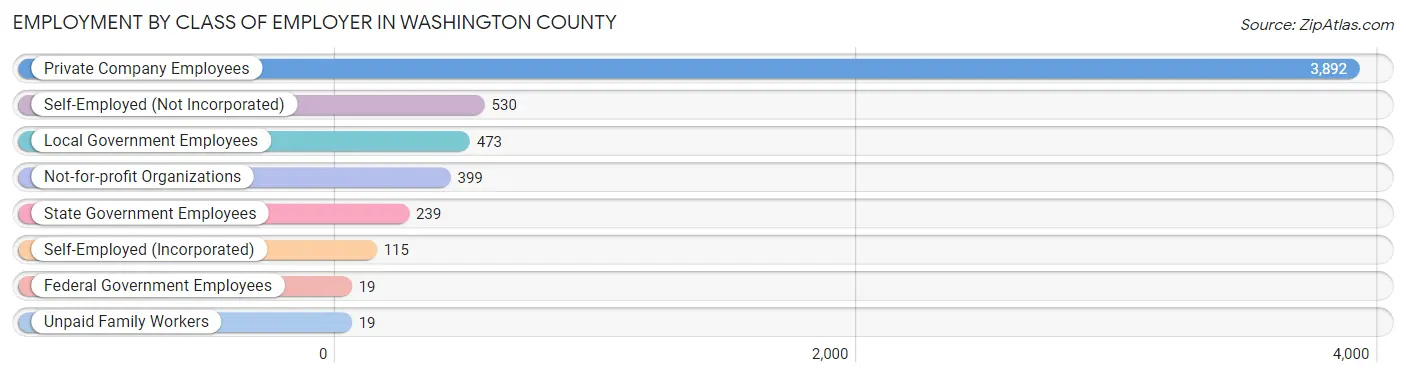
| Employer Class | # Employees | % Employees |
| Private Company Employees | 3,892 | 68.4% |
| Self-Employed (Incorporated) | 115 | 2.0% |
| Self-Employed (Not Incorporated) | 530 | 9.3% |
| Not-for-profit Organizations | 399 | 7.0% |
| Local Government Employees | 473 | 8.3% |
| State Government Employees | 239 | 4.2% |
| Federal Government Employees | 19 | 0.3% |
| Unpaid Family Workers | 19 | 0.3% |
| Total | 5,686 | 100.0% |
Employment Status by Age in Washington County
According to the labor force statistics for Washington County, out of the total population over 16 years of age (9,663), 60.6% or 5,856 individuals are in the labor force, with 2.3% or 135 of them unemployed. The age group with the highest labor force participation rate is 25 to 29 years, with 86.9% or 628 individuals in the labor force. Within the labor force, the 75 years and over age range has the highest percentage of unemployed individuals, with 14.0% or 14 of them being unemployed.
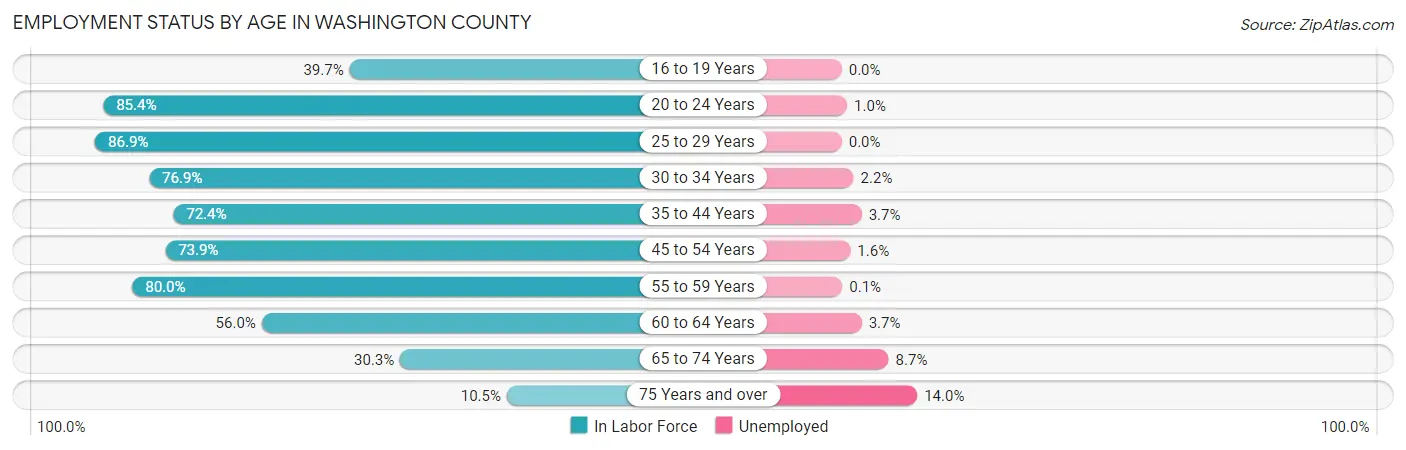
| Age Bracket | In Labor Force | Unemployed |
| 16 to 19 Years | 262 (39.7%) | 0 (0.0%) |
| 20 to 24 Years | 520 (85.4%) | 5 (1.0%) |
| 25 to 29 Years | 628 (86.9%) | 0 (0.0%) |
| 30 to 34 Years | 545 (76.9%) | 12 (2.2%) |
| 35 to 44 Years | 998 (72.4%) | 37 (3.7%) |
| 45 to 54 Years | 1,169 (73.9%) | 19 (1.6%) |
| 55 to 59 Years | 874 (80.0%) | 1 (0.1%) |
| 60 to 64 Years | 356 (56.0%) | 13 (3.7%) |
| 65 to 74 Years | 401 (30.3%) | 35 (8.7%) |
| 75 Years and over | 100 (10.5%) | 14 (14.0%) |
| Total | 5,856 (60.6%) | 135 (2.3%) |
Employment Status by Educational Attainment in Washington County
According to labor force statistics for Washington County, 74.7% of individuals (4,572) out of the total population between 25 and 64 years of age (6,121) are in the labor force, with 1.8% or 82 of them being unemployed. The group with the highest labor force participation rate are those with the educational attainment of bachelor's degree or higher, with 88.4% or 1,198 individuals in the labor force. Within the labor force, individuals with high school diploma education have the highest percentage of unemployment, with 2.8% or 50 of them being unemployed.
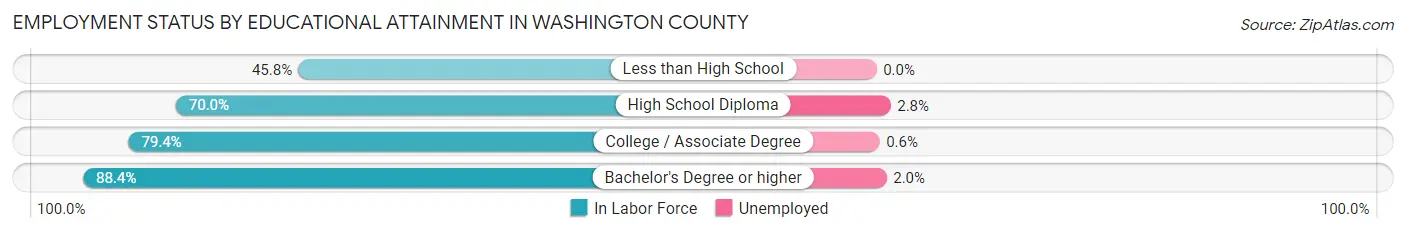
| Educational Attainment | In Labor Force | Unemployed |
| Less than High School | 237 (45.8%) | 0 (0.0%) |
| High School Diploma | 1,782 (70.0%) | 71 (2.8%) |
| College / Associate Degree | 1,352 (79.4%) | 10 (0.6%) |
| Bachelor's Degree or higher | 1,198 (88.4%) | 27 (2.0%) |
| Total | 4,572 (74.7%) | 110 (1.8%) |
Employment Occupations by Sex in Washington County
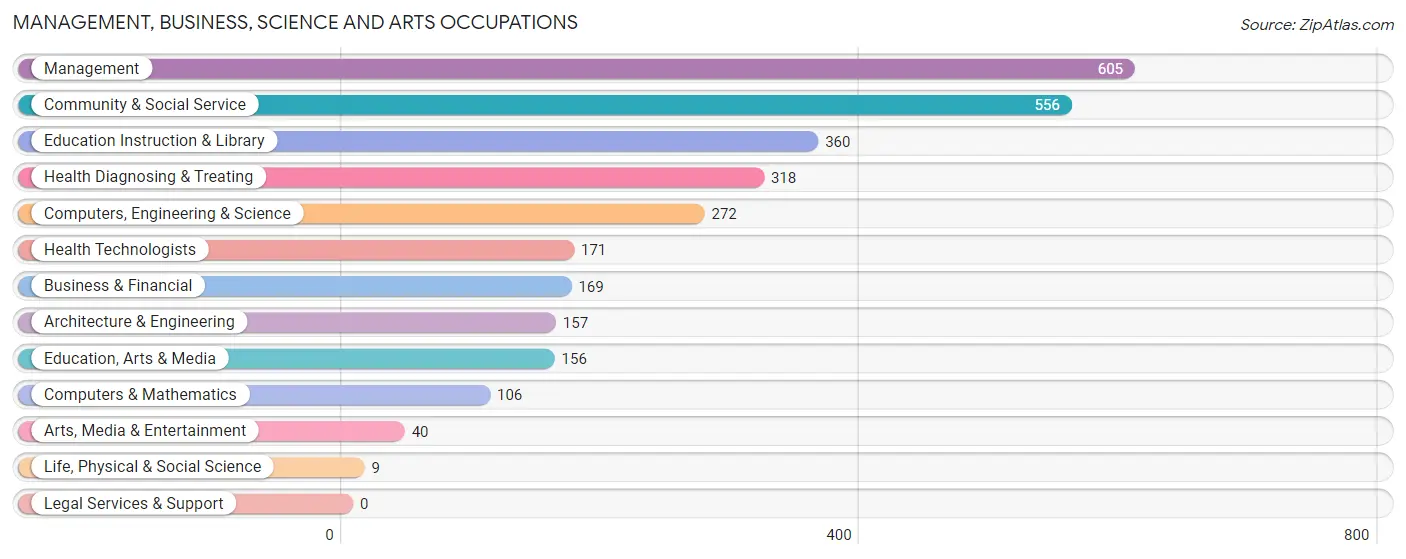
Management, Business, Science and Arts Occupations
The most common Management, Business, Science and Arts occupations in Washington County are Management (605 | 10.6%), Community & Social Service (556 | 9.7%), Education Instruction & Library (360 | 6.3%), Health Diagnosing & Treating (318 | 5.6%), and Computers, Engineering & Science (272 | 4.8%).
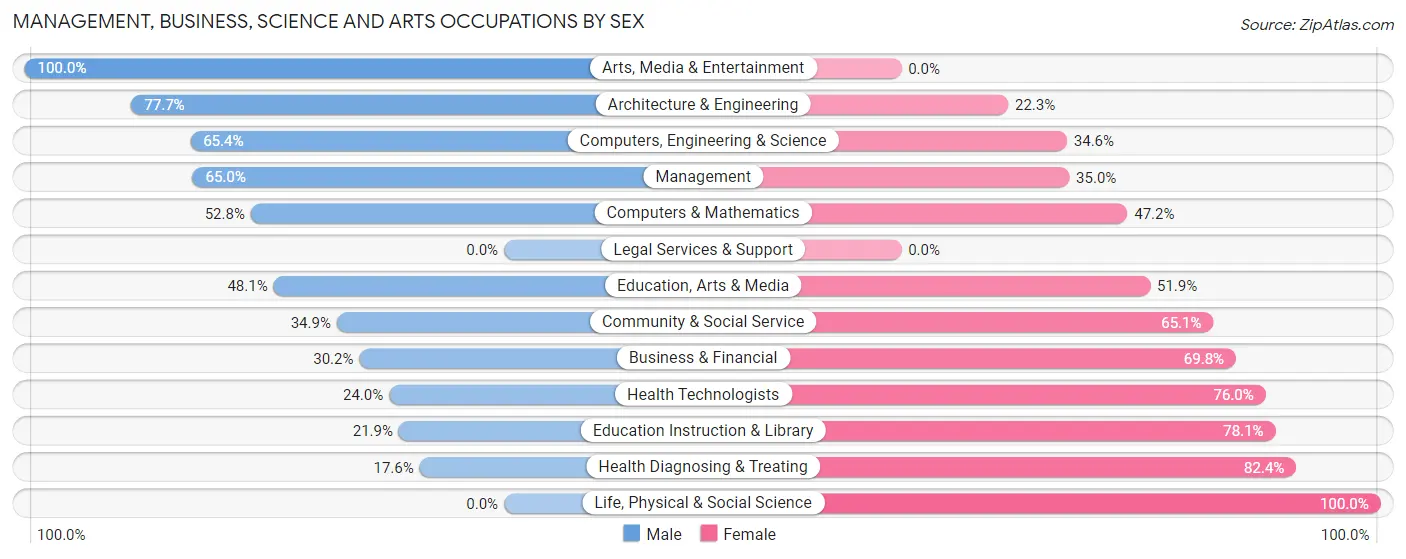
Management, Business, Science and Arts Occupations by Sex
Within the Management, Business, Science and Arts occupations in Washington County, the most male-oriented occupations are Arts, Media & Entertainment (100.0%), Architecture & Engineering (77.7%), and Computers, Engineering & Science (65.4%), while the most female-oriented occupations are Life, Physical & Social Science (100.0%), Health Diagnosing & Treating (82.4%), and Education Instruction & Library (78.1%).
| Occupation | Male | Female |
| Management | 393 (65.0%) | 212 (35.0%) |
| Business & Financial | 51 (30.2%) | 118 (69.8%) |
| Computers, Engineering & Science | 178 (65.4%) | 94 (34.6%) |
| Computers & Mathematics | 56 (52.8%) | 50 (47.2%) |
| Architecture & Engineering | 122 (77.7%) | 35 (22.3%) |
| Life, Physical & Social Science | 0 (0.0%) | 9 (100.0%) |
| Community & Social Service | 194 (34.9%) | 362 (65.1%) |
| Education, Arts & Media | 75 (48.1%) | 81 (51.9%) |
| Legal Services & Support | 0 (0.0%) | 0 (0.0%) |
| Education Instruction & Library | 79 (21.9%) | 281 (78.1%) |
| Arts, Media & Entertainment | 40 (100.0%) | 0 (0.0%) |
| Health Diagnosing & Treating | 56 (17.6%) | 262 (82.4%) |
| Health Technologists | 41 (24.0%) | 130 (76.0%) |
| Total (Category) | 872 (45.4%) | 1,048 (54.6%) |
| Total (Overall) | 3,165 (55.4%) | 2,552 (44.6%) |
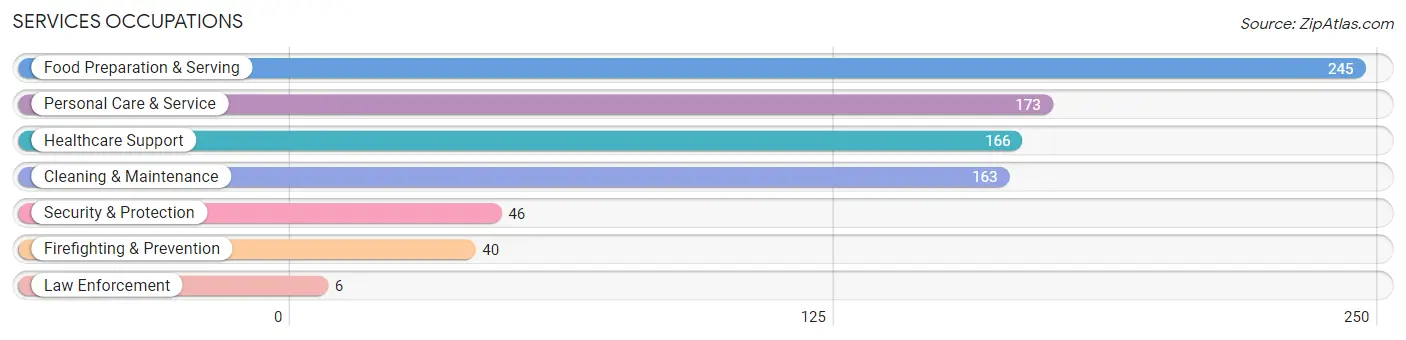
Services Occupations
The most common Services occupations in Washington County are Food Preparation & Serving (245 | 4.3%), Personal Care & Service (173 | 3.0%), Healthcare Support (166 | 2.9%), Cleaning & Maintenance (163 | 2.9%), and Security & Protection (46 | 0.8%).
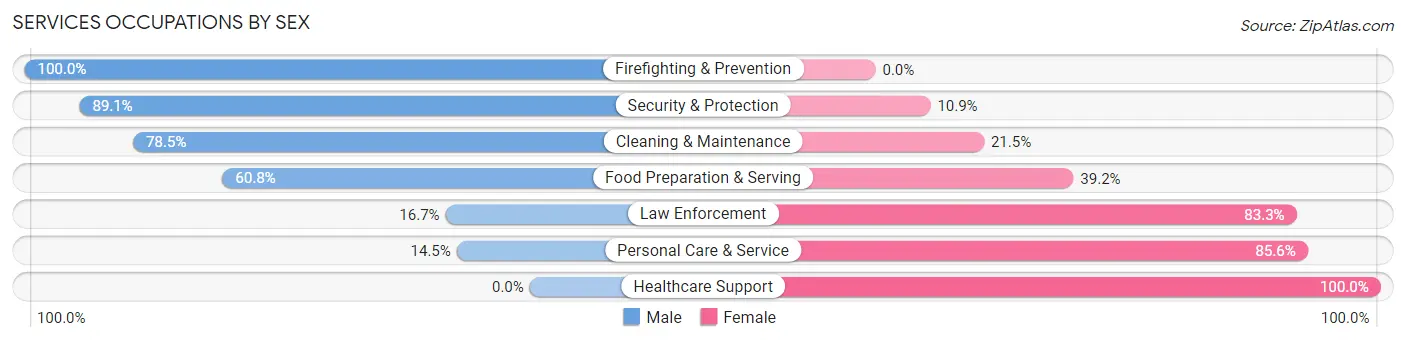
Services Occupations by Sex
Within the Services occupations in Washington County, the most male-oriented occupations are Firefighting & Prevention (100.0%), Security & Protection (89.1%), and Cleaning & Maintenance (78.5%), while the most female-oriented occupations are Healthcare Support (100.0%), Personal Care & Service (85.6%), and Law Enforcement (83.3%).
| Occupation | Male | Female |
| Healthcare Support | 0 (0.0%) | 166 (100.0%) |
| Security & Protection | 41 (89.1%) | 5 (10.9%) |
| Firefighting & Prevention | 40 (100.0%) | 0 (0.0%) |
| Law Enforcement | 1 (16.7%) | 5 (83.3%) |
| Food Preparation & Serving | 149 (60.8%) | 96 (39.2%) |
| Cleaning & Maintenance | 128 (78.5%) | 35 (21.5%) |
| Personal Care & Service | 25 (14.4%) | 148 (85.6%) |
| Total (Category) | 343 (43.2%) | 450 (56.8%) |
| Total (Overall) | 3,165 (55.4%) | 2,552 (44.6%) |
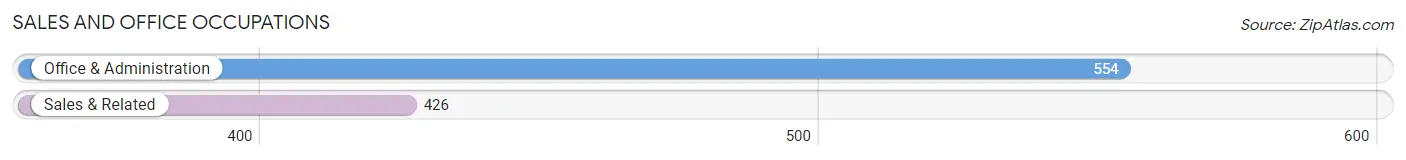
Sales and Office Occupations
The most common Sales and Office occupations in Washington County are Office & Administration (554 | 9.7%), and Sales & Related (426 | 7.4%).
Sales and Office Occupations by Sex
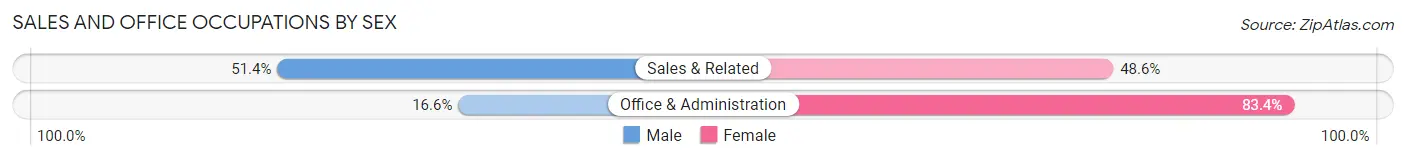
| Occupation | Male | Female |
| Sales & Related | 219 (51.4%) | 207 (48.6%) |
| Office & Administration | 92 (16.6%) | 462 (83.4%) |
| Total (Category) | 311 (31.7%) | 669 (68.3%) |
| Total (Overall) | 3,165 (55.4%) | 2,552 (44.6%) |
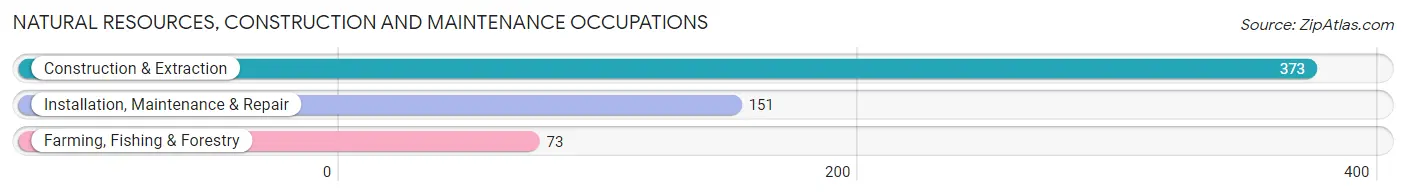
Natural Resources, Construction and Maintenance Occupations
The most common Natural Resources, Construction and Maintenance occupations in Washington County are Construction & Extraction (373 | 6.5%), Installation, Maintenance & Repair (151 | 2.6%), and Farming, Fishing & Forestry (73 | 1.3%).
Natural Resources, Construction and Maintenance Occupations by Sex
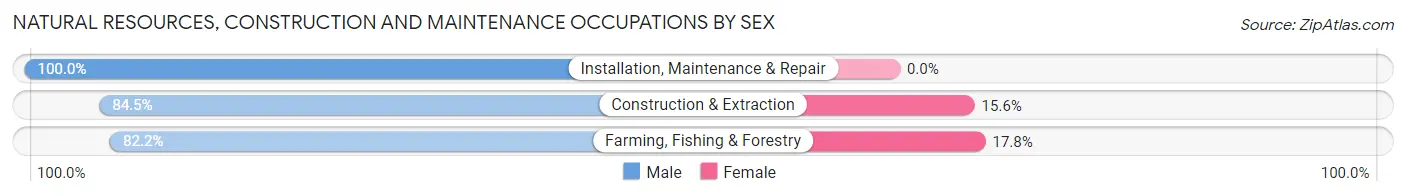
| Occupation | Male | Female |
| Farming, Fishing & Forestry | 60 (82.2%) | 13 (17.8%) |
| Construction & Extraction | 315 (84.5%) | 58 (15.5%) |
| Installation, Maintenance & Repair | 151 (100.0%) | 0 (0.0%) |
| Total (Category) | 526 (88.1%) | 71 (11.9%) |
| Total (Overall) | 3,165 (55.4%) | 2,552 (44.6%) |
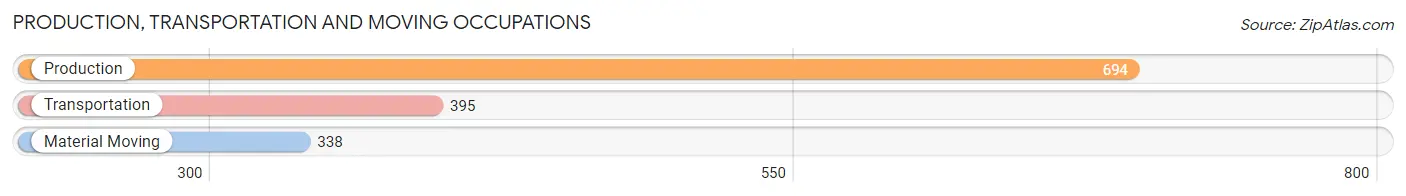
Production, Transportation and Moving Occupations
The most common Production, Transportation and Moving occupations in Washington County are Production (694 | 12.1%), Transportation (395 | 6.9%), and Material Moving (338 | 5.9%).
Production, Transportation and Moving Occupations by Sex
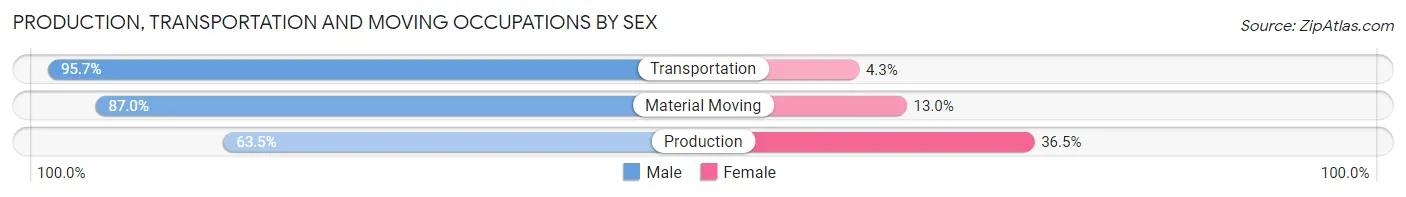
| Occupation | Male | Female |
| Production | 441 (63.5%) | 253 (36.5%) |
| Transportation | 378 (95.7%) | 17 (4.3%) |
| Material Moving | 294 (87.0%) | 44 (13.0%) |
| Total (Category) | 1,113 (78.0%) | 314 (22.0%) |
| Total (Overall) | 3,165 (55.4%) | 2,552 (44.6%) |
Employment Industries by Sex in Washington County
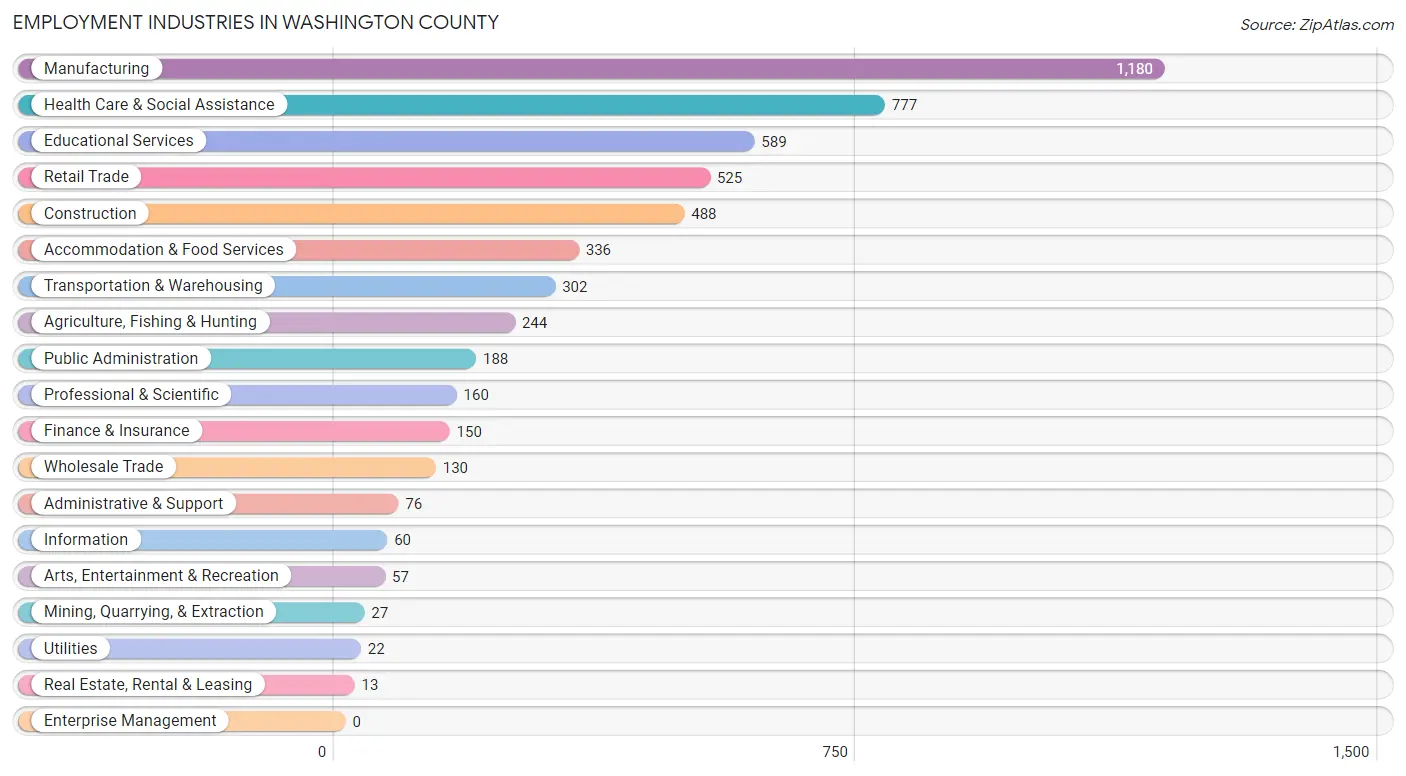
Employment Industries in Washington County
The major employment industries in Washington County include Manufacturing (1,180 | 20.6%), Health Care & Social Assistance (777 | 13.6%), Educational Services (589 | 10.3%), Retail Trade (525 | 9.2%), and Construction (488 | 8.5%).
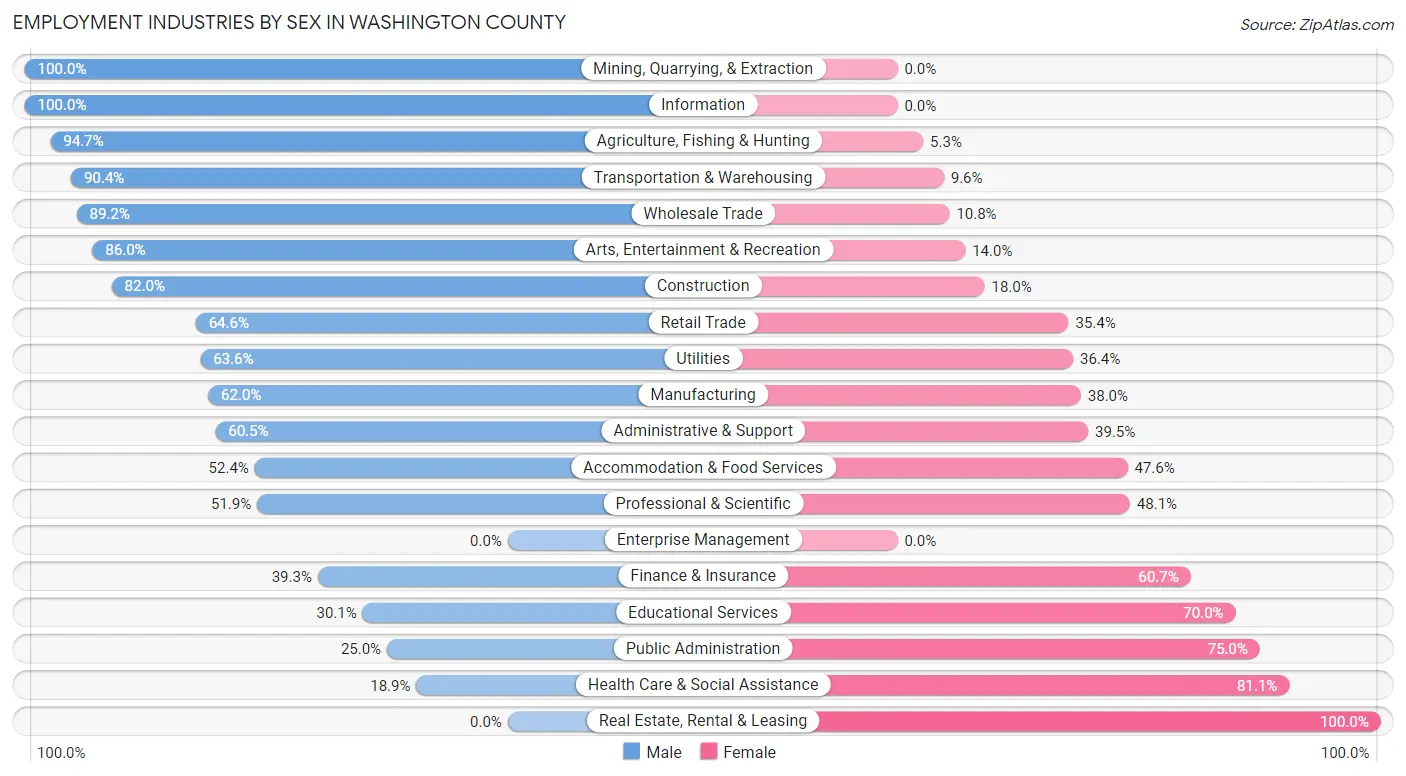
Employment Industries by Sex in Washington County
The Washington County industries that see more men than women are Mining, Quarrying, & Extraction (100.0%), Information (100.0%), and Agriculture, Fishing & Hunting (94.7%), whereas the industries that tend to have a higher number of women are Real Estate, Rental & Leasing (100.0%), Health Care & Social Assistance (81.1%), and Public Administration (75.0%).
| Industry | Male | Female |
| Agriculture, Fishing & Hunting | 231 (94.7%) | 13 (5.3%) |
| Mining, Quarrying, & Extraction | 27 (100.0%) | 0 (0.0%) |
| Construction | 400 (82.0%) | 88 (18.0%) |
| Manufacturing | 732 (62.0%) | 448 (38.0%) |
| Wholesale Trade | 116 (89.2%) | 14 (10.8%) |
| Retail Trade | 339 (64.6%) | 186 (35.4%) |
| Transportation & Warehousing | 273 (90.4%) | 29 (9.6%) |
| Utilities | 14 (63.6%) | 8 (36.4%) |
| Information | 60 (100.0%) | 0 (0.0%) |
| Finance & Insurance | 59 (39.3%) | 91 (60.7%) |
| Real Estate, Rental & Leasing | 0 (0.0%) | 13 (100.0%) |
| Professional & Scientific | 83 (51.9%) | 77 (48.1%) |
| Enterprise Management | 0 (0.0%) | 0 (0.0%) |
| Administrative & Support | 46 (60.5%) | 30 (39.5%) |
| Educational Services | 177 (30.0%) | 412 (70.0%) |
| Health Care & Social Assistance | 147 (18.9%) | 630 (81.1%) |
| Arts, Entertainment & Recreation | 49 (86.0%) | 8 (14.0%) |
| Accommodation & Food Services | 176 (52.4%) | 160 (47.6%) |
| Public Administration | 47 (25.0%) | 141 (75.0%) |
| Total | 3,165 (55.4%) | 2,552 (44.6%) |
Education in Washington County
School Enrollment in Washington County
The most common levels of schooling among the 2,477 students in Washington County are middle school (697 | 28.1%), elementary school (561 | 22.7%), and high school (511 | 20.6%).
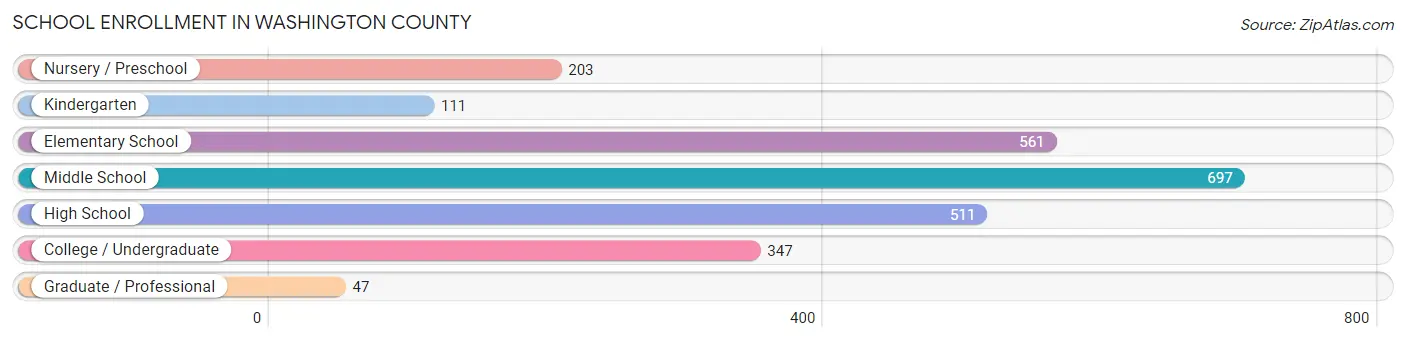
| School Level | # Students | % Students |
| Nursery / Preschool | 203 | 8.2% |
| Kindergarten | 111 | 4.5% |
| Elementary School | 561 | 22.7% |
| Middle School | 697 | 28.1% |
| High School | 511 | 20.6% |
| College / Undergraduate | 347 | 14.0% |
| Graduate / Professional | 47 | 1.9% |
| Total | 2,477 | 100.0% |
School Enrollment by Age by Funding Source in Washington County
Out of a total of 2,477 students who are enrolled in schools in Washington County, 530 (21.4%) attend a private institution, while the remaining 1,947 (78.6%) are enrolled in public schools. The age group of 3 to 4 year olds has the highest likelihood of being enrolled in private schools, with 70 (36.6% in the age bracket) enrolled. Conversely, the age group of 20 to 24 year olds has the lowest likelihood of being enrolled in a private school, with 144 (98.6% in the age bracket) attending a public institution.
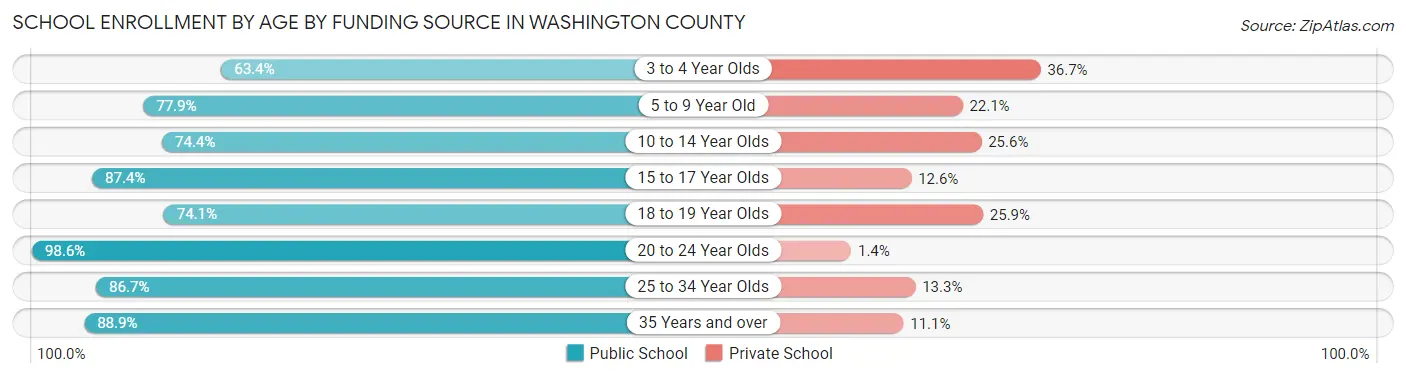
| Age Bracket | Public School | Private School |
| 3 to 4 Year Olds | 121 (63.3%) | 70 (36.6%) |
| 5 to 9 Year Old | 500 (77.9%) | 142 (22.1%) |
| 10 to 14 Year Olds | 569 (74.4%) | 196 (25.6%) |
| 15 to 17 Year Olds | 389 (87.4%) | 56 (12.6%) |
| 18 to 19 Year Olds | 160 (74.1%) | 56 (25.9%) |
| 20 to 24 Year Olds | 144 (98.6%) | 2 (1.4%) |
| 25 to 34 Year Olds | 39 (86.7%) | 6 (13.3%) |
| 35 Years and over | 24 (88.9%) | 3 (11.1%) |
| Total | 1,947 (78.6%) | 530 (21.4%) |
Educational Attainment by Field of Study in Washington County
Education (454 | 25.3%), science & technology (249 | 13.9%), business (234 | 13.1%), bio, nature & agricultural (220 | 12.3%), and computers & mathematics (102 | 5.7%) are the most common fields of study among 1,792 individuals in Washington County who have obtained a bachelor's degree or higher.
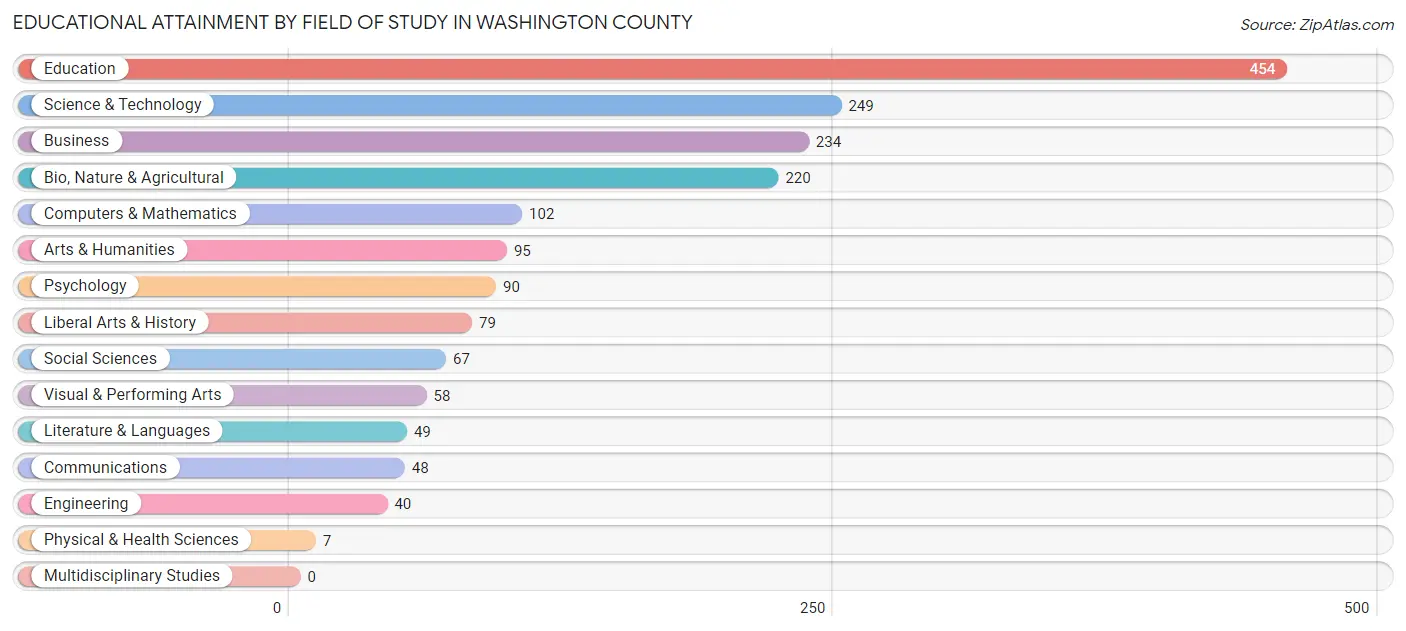
| Field of Study | # Graduates | % Graduates |
| Computers & Mathematics | 102 | 5.7% |
| Bio, Nature & Agricultural | 220 | 12.3% |
| Physical & Health Sciences | 7 | 0.4% |
| Psychology | 90 | 5.0% |
| Social Sciences | 67 | 3.7% |
| Engineering | 40 | 2.2% |
| Multidisciplinary Studies | 0 | 0.0% |
| Science & Technology | 249 | 13.9% |
| Business | 234 | 13.1% |
| Education | 454 | 25.3% |
| Literature & Languages | 49 | 2.7% |
| Liberal Arts & History | 79 | 4.4% |
| Visual & Performing Arts | 58 | 3.2% |
| Communications | 48 | 2.7% |
| Arts & Humanities | 95 | 5.3% |
| Total | 1,792 | 100.0% |
Transportation & Commute in Washington County
Vehicle Availability by Sex in Washington County
The most prevalent vehicle ownership categories in Washington County are males with 2 vehicles (1,062, accounting for 34.3%) and females with 2 vehicles (835, making up 42.3%).
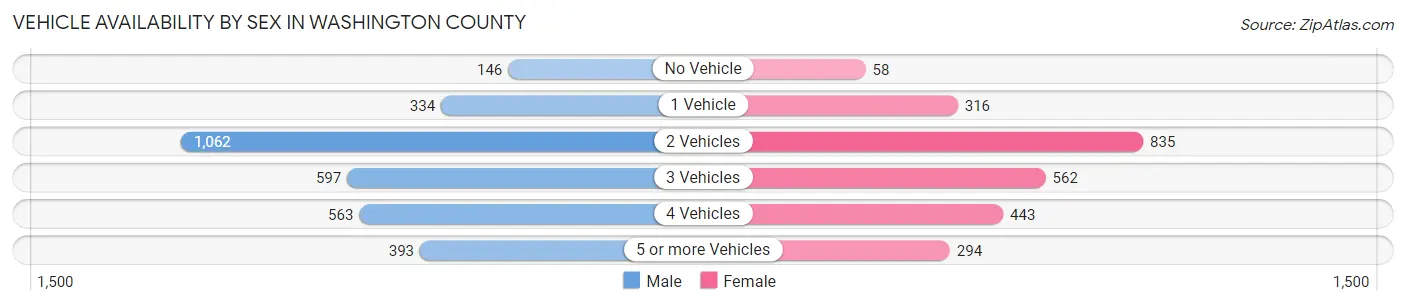
| Vehicles Available | Male | Female |
| No Vehicle | 146 (4.7%) | 58 (2.3%) |
| 1 Vehicle | 334 (10.8%) | 316 (12.6%) |
| 2 Vehicles | 1,062 (34.3%) | 835 (33.3%) |
| 3 Vehicles | 597 (19.3%) | 562 (22.4%) |
| 4 Vehicles | 563 (18.2%) | 443 (17.7%) |
| 5 or more Vehicles | 393 (12.7%) | 294 (11.7%) |
| Total | 3,095 (100.0%) | 2,508 (100.0%) |
Commute Time in Washington County
The most frequently occuring commute durations in Washington County are 15 to 19 minutes (834 commuters, 15.9%), 5 to 9 minutes (780 commuters, 14.9%), and 20 to 24 minutes (628 commuters, 12.0%).
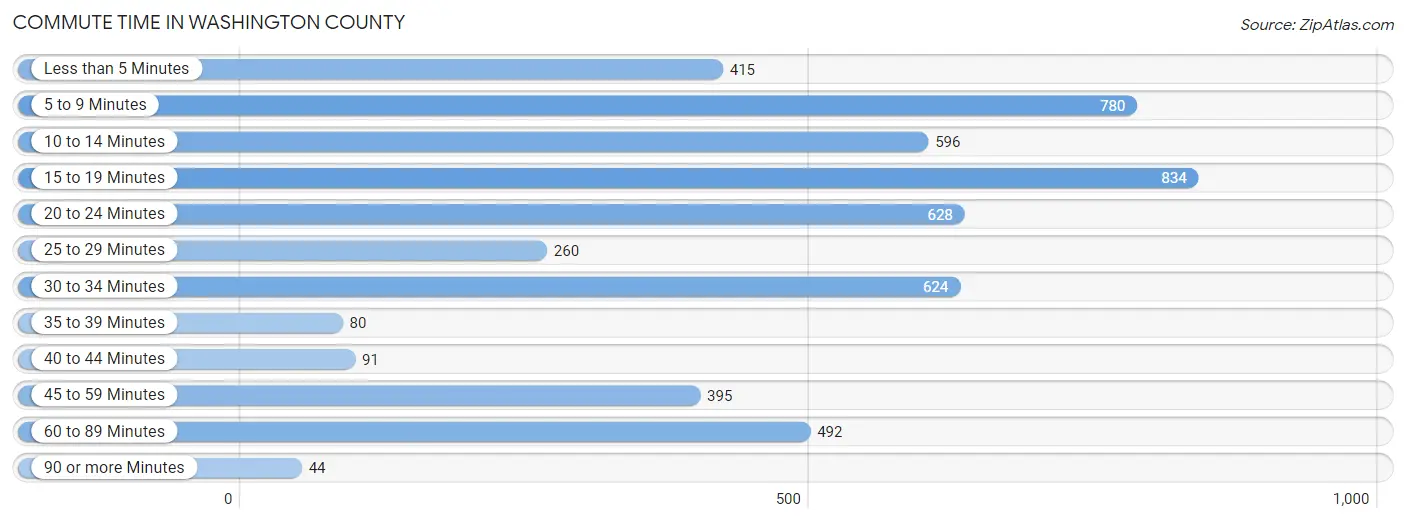
| Commute Time | # Commuters | % Commuters |
| Less than 5 Minutes | 415 | 7.9% |
| 5 to 9 Minutes | 780 | 14.9% |
| 10 to 14 Minutes | 596 | 11.4% |
| 15 to 19 Minutes | 834 | 15.9% |
| 20 to 24 Minutes | 628 | 12.0% |
| 25 to 29 Minutes | 260 | 5.0% |
| 30 to 34 Minutes | 624 | 11.9% |
| 35 to 39 Minutes | 80 | 1.5% |
| 40 to 44 Minutes | 91 | 1.7% |
| 45 to 59 Minutes | 395 | 7.5% |
| 60 to 89 Minutes | 492 | 9.4% |
| 90 or more Minutes | 44 | 0.8% |
Commute Time by Sex in Washington County
The most common commute times in Washington County are 5 to 9 minutes (489 commuters, 16.1%) for males and 15 to 19 minutes (394 commuters, 17.8%) for females.
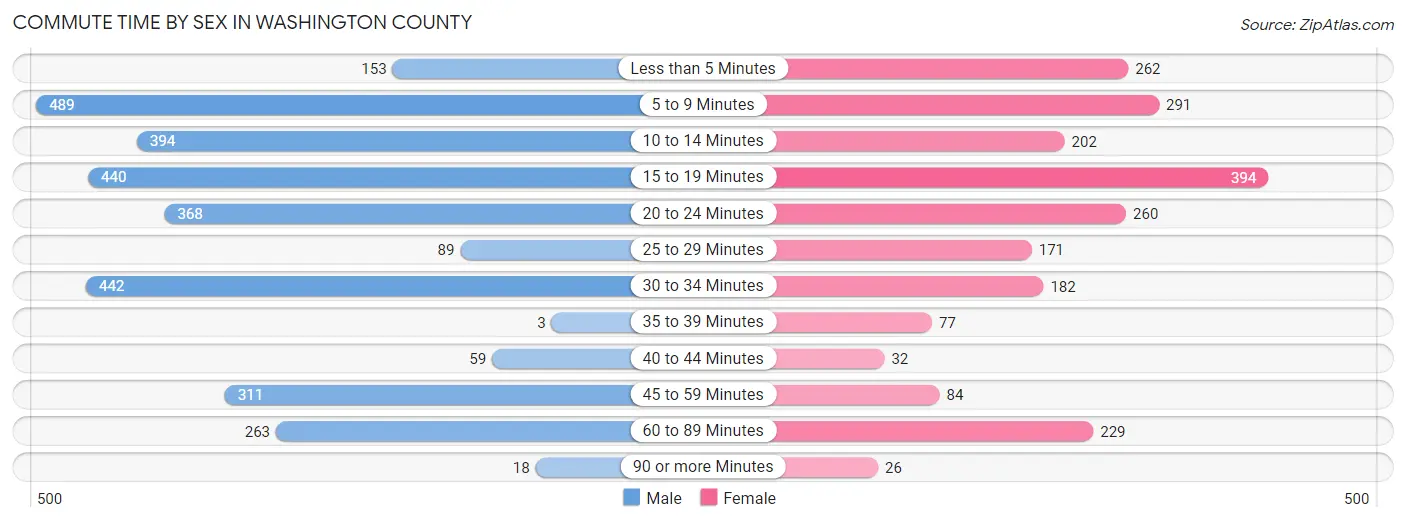
| Commute Time | Male | Female |
| Less than 5 Minutes | 153 (5.1%) | 262 (11.9%) |
| 5 to 9 Minutes | 489 (16.1%) | 291 (13.2%) |
| 10 to 14 Minutes | 394 (13.0%) | 202 (9.1%) |
| 15 to 19 Minutes | 440 (14.5%) | 394 (17.8%) |
| 20 to 24 Minutes | 368 (12.1%) | 260 (11.8%) |
| 25 to 29 Minutes | 89 (2.9%) | 171 (7.7%) |
| 30 to 34 Minutes | 442 (14.6%) | 182 (8.2%) |
| 35 to 39 Minutes | 3 (0.1%) | 77 (3.5%) |
| 40 to 44 Minutes | 59 (1.9%) | 32 (1.5%) |
| 45 to 59 Minutes | 311 (10.3%) | 84 (3.8%) |
| 60 to 89 Minutes | 263 (8.7%) | 229 (10.4%) |
| 90 or more Minutes | 18 (0.6%) | 26 (1.2%) |
Time of Departure to Work by Sex in Washington County
The most frequent times of departure to work in Washington County are 7:00 AM to 7:29 AM (618, 20.4%) for males and 7:30 AM to 7:59 AM (474, 21.4%) for females.
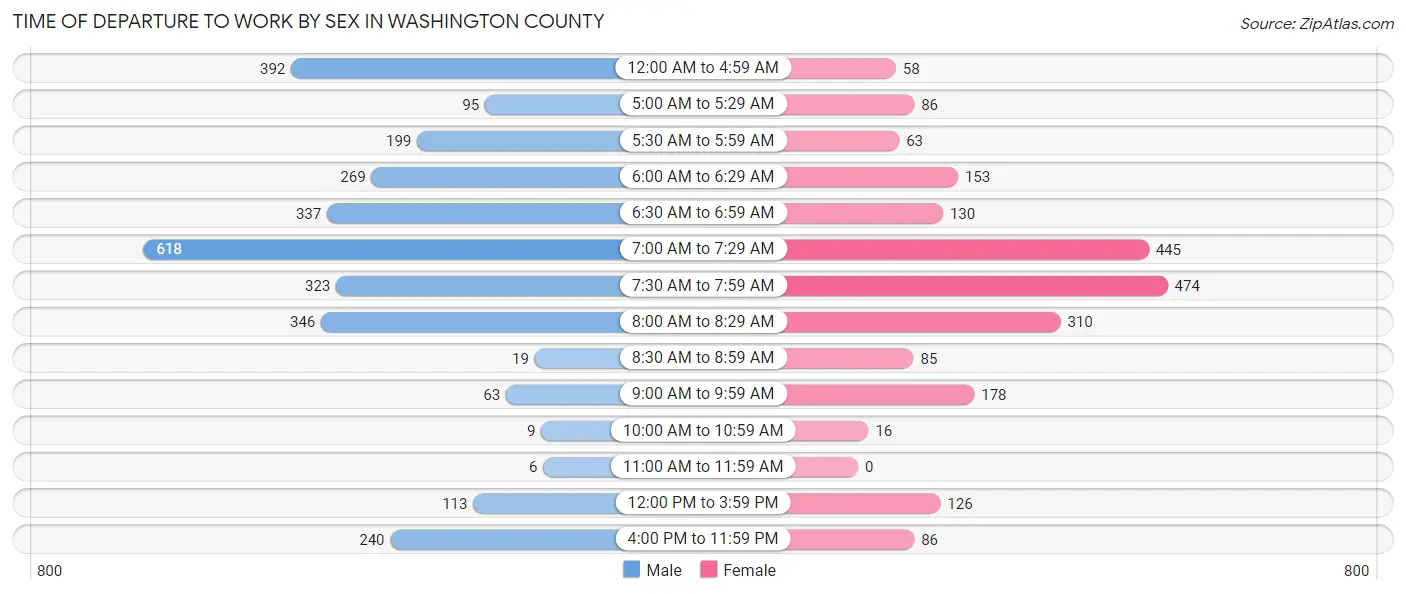
| Time of Departure | Male | Female |
| 12:00 AM to 4:59 AM | 392 (12.9%) | 58 (2.6%) |
| 5:00 AM to 5:29 AM | 95 (3.1%) | 86 (3.9%) |
| 5:30 AM to 5:59 AM | 199 (6.6%) | 63 (2.9%) |
| 6:00 AM to 6:29 AM | 269 (8.9%) | 153 (6.9%) |
| 6:30 AM to 6:59 AM | 337 (11.1%) | 130 (5.9%) |
| 7:00 AM to 7:29 AM | 618 (20.4%) | 445 (20.1%) |
| 7:30 AM to 7:59 AM | 323 (10.7%) | 474 (21.4%) |
| 8:00 AM to 8:29 AM | 346 (11.4%) | 310 (14.0%) |
| 8:30 AM to 8:59 AM | 19 (0.6%) | 85 (3.8%) |
| 9:00 AM to 9:59 AM | 63 (2.1%) | 178 (8.1%) |
| 10:00 AM to 10:59 AM | 9 (0.3%) | 16 (0.7%) |
| 11:00 AM to 11:59 AM | 6 (0.2%) | 0 (0.0%) |
| 12:00 PM to 3:59 PM | 113 (3.7%) | 126 (5.7%) |
| 4:00 PM to 11:59 PM | 240 (7.9%) | 86 (3.9%) |
| Total | 3,029 (100.0%) | 2,210 (100.0%) |
Housing Occupancy in Washington County
Occupancy by Ownership in Washington County
Of the total 4,635 dwellings in Washington County, owner-occupied units account for 3,682 (79.4%), while renter-occupied units make up 953 (20.6%).
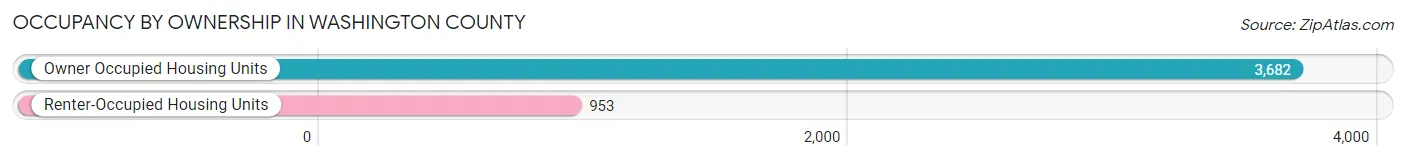
| Occupancy | # Housing Units | % Housing Units |
| Owner Occupied Housing Units | 3,682 | 79.4% |
| Renter-Occupied Housing Units | 953 | 20.6% |
| Total Occupied Housing Units | 4,635 | 100.0% |
Occupancy by Household Size in Washington County
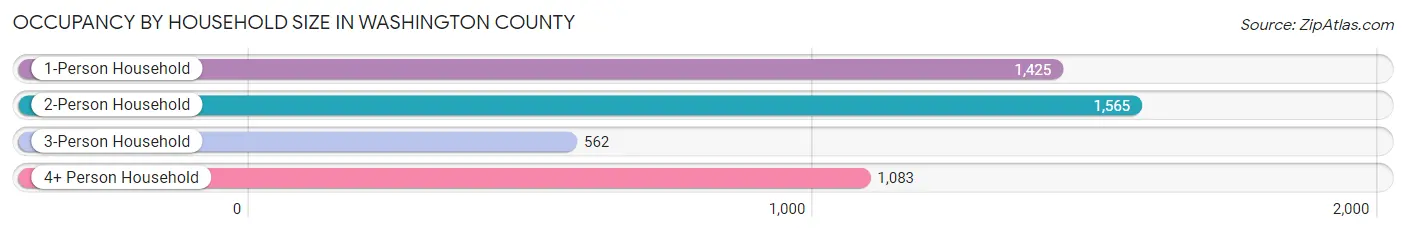
| Household Size | # Housing Units | % Housing Units |
| 1-Person Household | 1,425 | 30.7% |
| 2-Person Household | 1,565 | 33.8% |
| 3-Person Household | 562 | 12.1% |
| 4+ Person Household | 1,083 | 23.4% |
| Total Housing Units | 4,635 | 100.0% |
Occupancy by Ownership by Household Size in Washington County
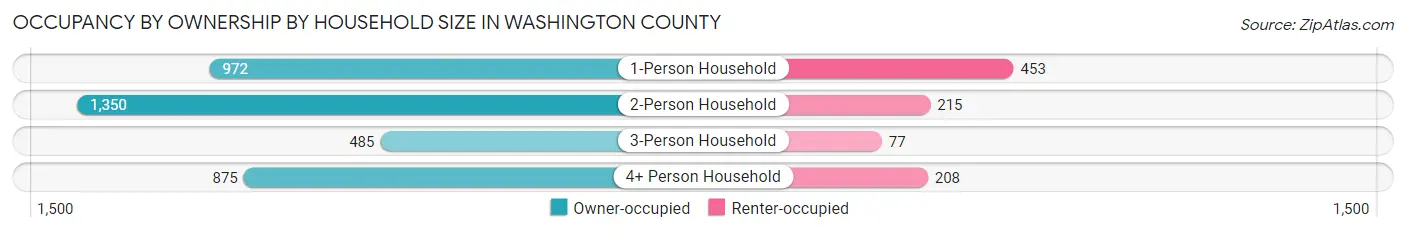
| Household Size | Owner-occupied | Renter-occupied |
| 1-Person Household | 972 (68.2%) | 453 (31.8%) |
| 2-Person Household | 1,350 (86.3%) | 215 (13.7%) |
| 3-Person Household | 485 (86.3%) | 77 (13.7%) |
| 4+ Person Household | 875 (80.8%) | 208 (19.2%) |
| Total Housing Units | 3,682 (79.4%) | 953 (20.6%) |
Occupancy by Educational Attainment in Washington County
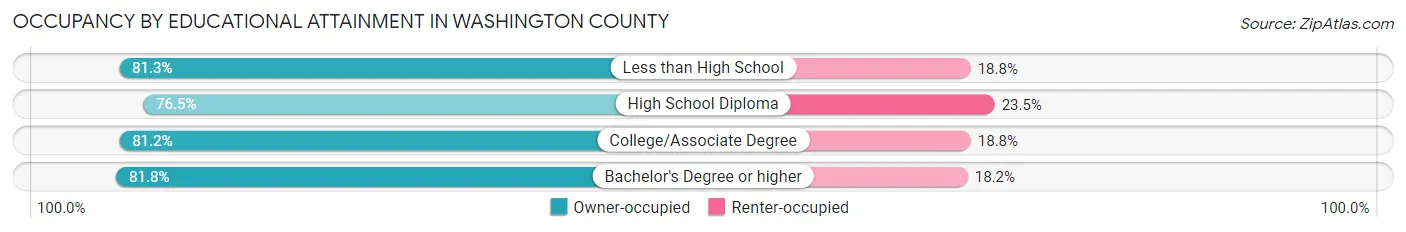
| Household Size | Owner-occupied | Renter-occupied |
| Less than High School | 403 (81.2%) | 93 (18.8%) |
| High School Diploma | 1,445 (76.5%) | 444 (23.5%) |
| College/Associate Degree | 978 (81.2%) | 226 (18.8%) |
| Bachelor's Degree or higher | 856 (81.8%) | 190 (18.2%) |
Occupancy by Age of Householder in Washington County
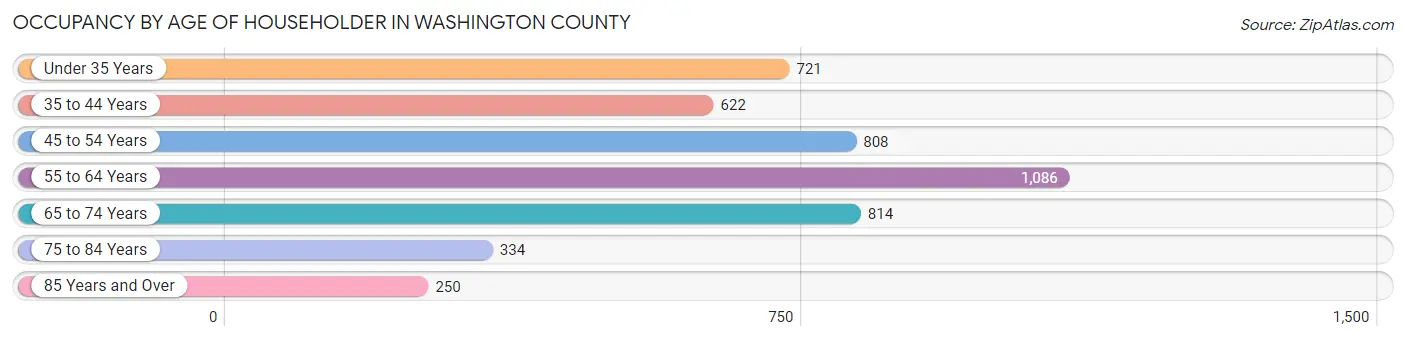
| Age Bracket | # Households | % Households |
| Under 35 Years | 721 | 15.6% |
| 35 to 44 Years | 622 | 13.4% |
| 45 to 54 Years | 808 | 17.4% |
| 55 to 64 Years | 1,086 | 23.4% |
| 65 to 74 Years | 814 | 17.6% |
| 75 to 84 Years | 334 | 7.2% |
| 85 Years and Over | 250 | 5.4% |
| Total | 4,635 | 100.0% |
Housing Finances in Washington County
Median Income by Occupancy in Washington County
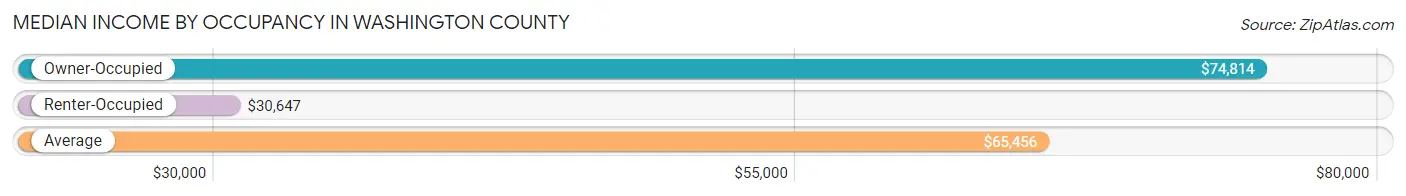
| Occupancy Type | # Households | Median Income |
| Owner-Occupied | 3,682 (79.4%) | $74,814 |
| Renter-Occupied | 953 (20.6%) | $30,647 |
| Average | 4,635 (100.0%) | $65,456 |
Occupancy by Householder Income Bracket in Washington County
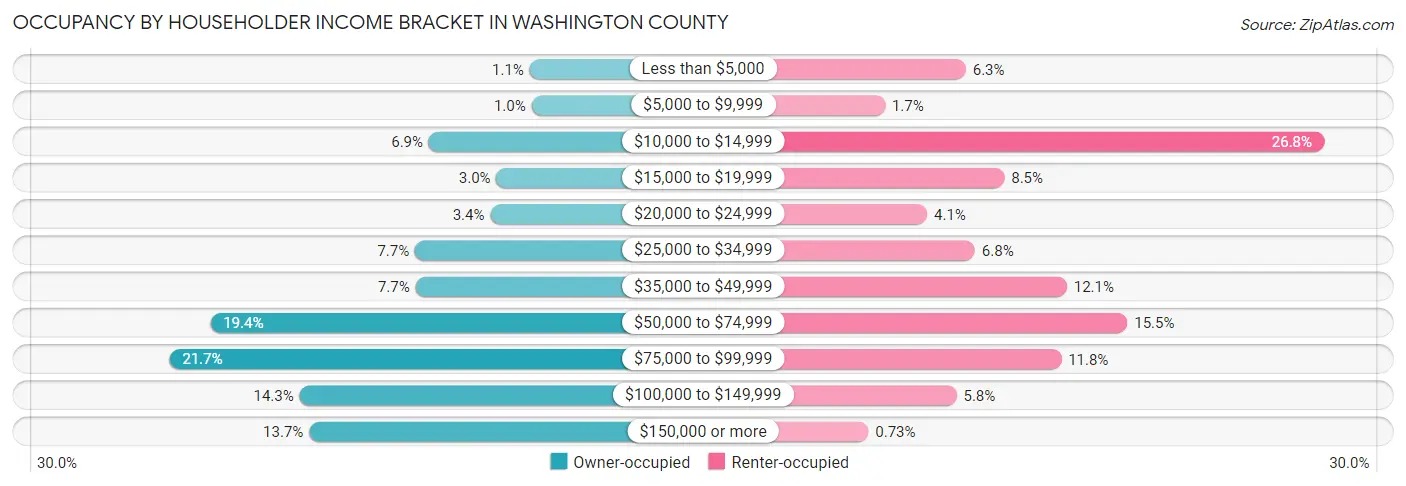
| Income Bracket | Owner-occupied | Renter-occupied |
| Less than $5,000 | 42 (1.1%) | 60 (6.3%) |
| $5,000 to $9,999 | 38 (1.0%) | 16 (1.7%) |
| $10,000 to $14,999 | 254 (6.9%) | 255 (26.8%) |
| $15,000 to $19,999 | 112 (3.0%) | 81 (8.5%) |
| $20,000 to $24,999 | 125 (3.4%) | 39 (4.1%) |
| $25,000 to $34,999 | 283 (7.7%) | 65 (6.8%) |
| $35,000 to $49,999 | 282 (7.7%) | 115 (12.1%) |
| $50,000 to $74,999 | 714 (19.4%) | 148 (15.5%) |
| $75,000 to $99,999 | 800 (21.7%) | 112 (11.7%) |
| $100,000 to $149,999 | 526 (14.3%) | 55 (5.8%) |
| $150,000 or more | 506 (13.7%) | 7 (0.7%) |
| Total | 3,682 (100.0%) | 953 (100.0%) |
Monthly Housing Cost Tiers in Washington County
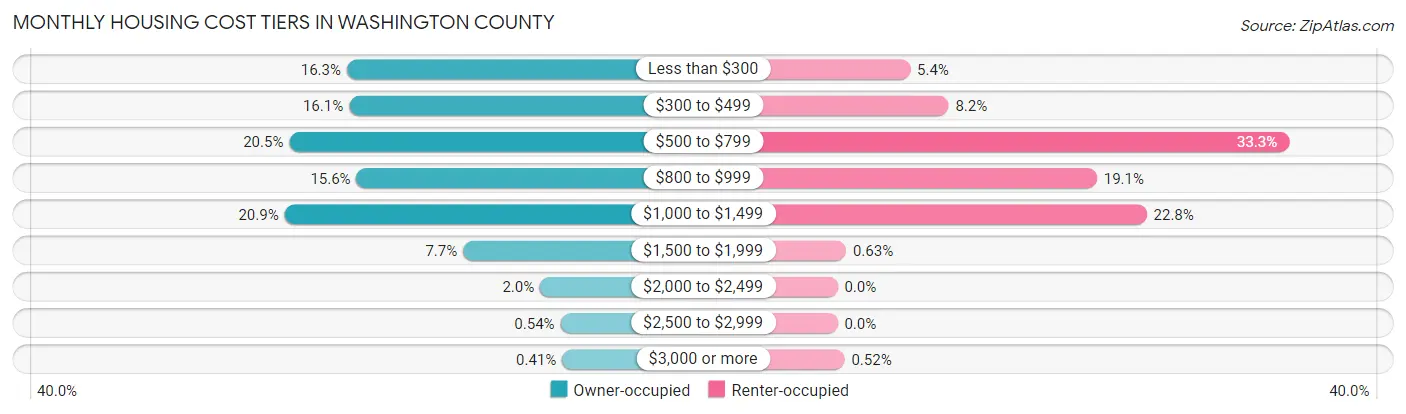
| Monthly Cost | Owner-occupied | Renter-occupied |
| Less than $300 | 599 (16.3%) | 51 (5.3%) |
| $300 to $499 | 593 (16.1%) | 78 (8.2%) |
| $500 to $799 | 755 (20.5%) | 317 (33.3%) |
| $800 to $999 | 573 (15.6%) | 182 (19.1%) |
| $1,000 to $1,499 | 768 (20.9%) | 217 (22.8%) |
| $1,500 to $1,999 | 284 (7.7%) | 6 (0.6%) |
| $2,000 to $2,499 | 75 (2.0%) | 0 (0.0%) |
| $2,500 to $2,999 | 20 (0.5%) | 0 (0.0%) |
| $3,000 or more | 15 (0.4%) | 5 (0.5%) |
| Total | 3,682 (100.0%) | 953 (100.0%) |
Physical Housing Characteristics in Washington County
Housing Structures in Washington County
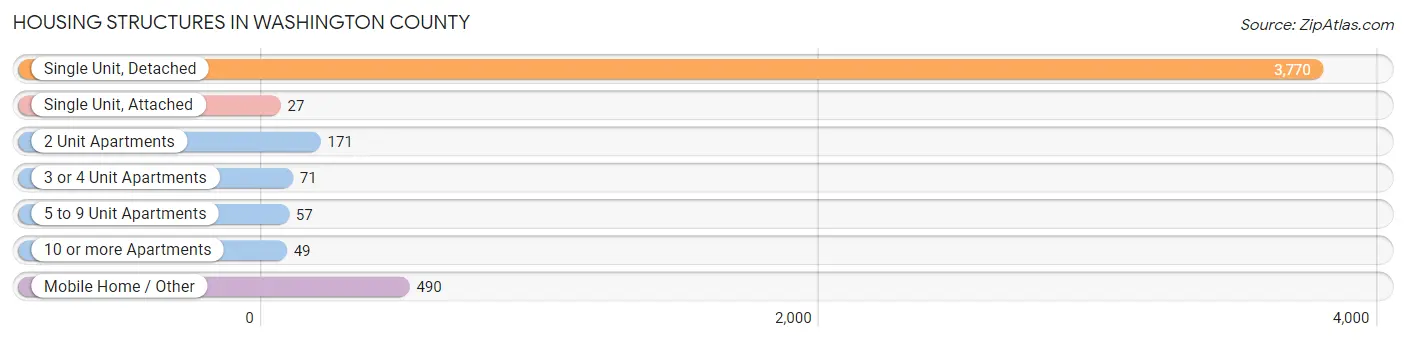
| Structure Type | # Housing Units | % Housing Units |
| Single Unit, Detached | 3,770 | 81.3% |
| Single Unit, Attached | 27 | 0.6% |
| 2 Unit Apartments | 171 | 3.7% |
| 3 or 4 Unit Apartments | 71 | 1.5% |
| 5 to 9 Unit Apartments | 57 | 1.2% |
| 10 or more Apartments | 49 | 1.1% |
| Mobile Home / Other | 490 | 10.6% |
| Total | 4,635 | 100.0% |
Housing Structures by Occupancy in Washington County
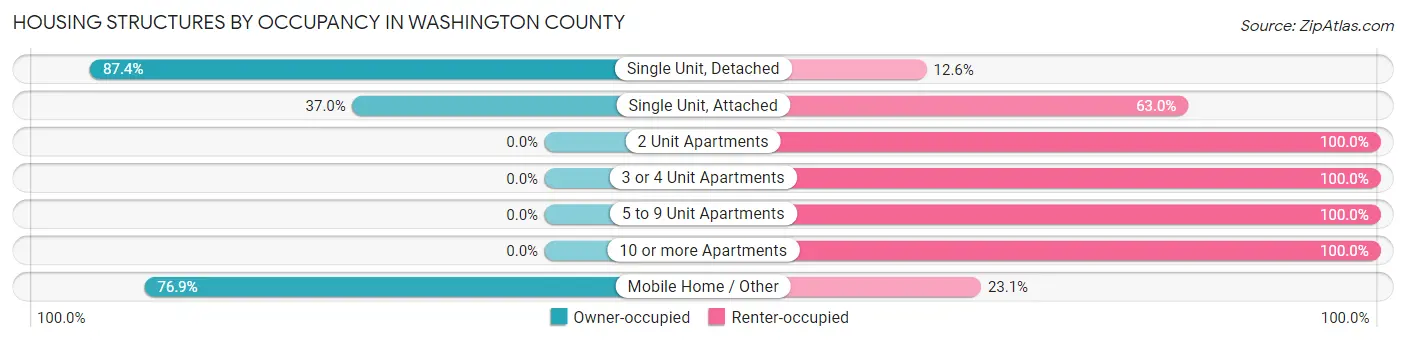
| Structure Type | Owner-occupied | Renter-occupied |
| Single Unit, Detached | 3,295 (87.4%) | 475 (12.6%) |
| Single Unit, Attached | 10 (37.0%) | 17 (63.0%) |
| 2 Unit Apartments | 0 (0.0%) | 171 (100.0%) |
| 3 or 4 Unit Apartments | 0 (0.0%) | 71 (100.0%) |
| 5 to 9 Unit Apartments | 0 (0.0%) | 57 (100.0%) |
| 10 or more Apartments | 0 (0.0%) | 49 (100.0%) |
| Mobile Home / Other | 377 (76.9%) | 113 (23.1%) |
| Total | 3,682 (79.4%) | 953 (20.6%) |
Housing Structures by Number of Rooms in Washington County
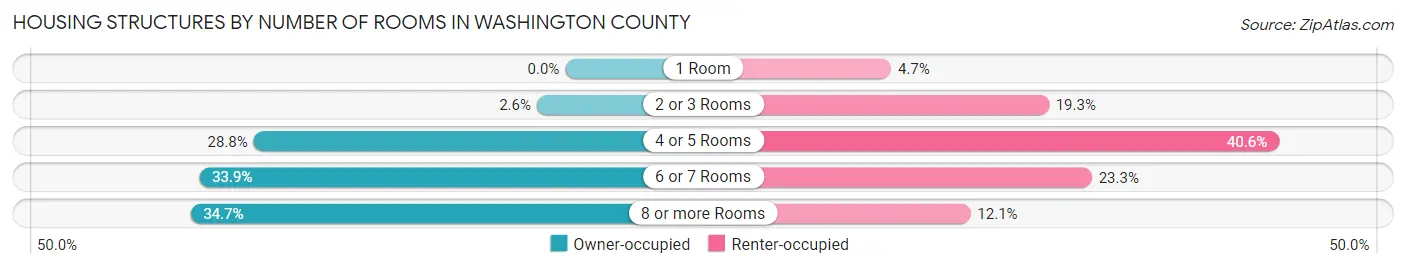
| Number of Rooms | Owner-occupied | Renter-occupied |
| 1 Room | 0 (0.0%) | 45 (4.7%) |
| 2 or 3 Rooms | 97 (2.6%) | 184 (19.3%) |
| 4 or 5 Rooms | 1,061 (28.8%) | 387 (40.6%) |
| 6 or 7 Rooms | 1,247 (33.9%) | 222 (23.3%) |
| 8 or more Rooms | 1,277 (34.7%) | 115 (12.1%) |
| Total | 3,682 (100.0%) | 953 (100.0%) |
Housing Structure by Heating Type in Washington County
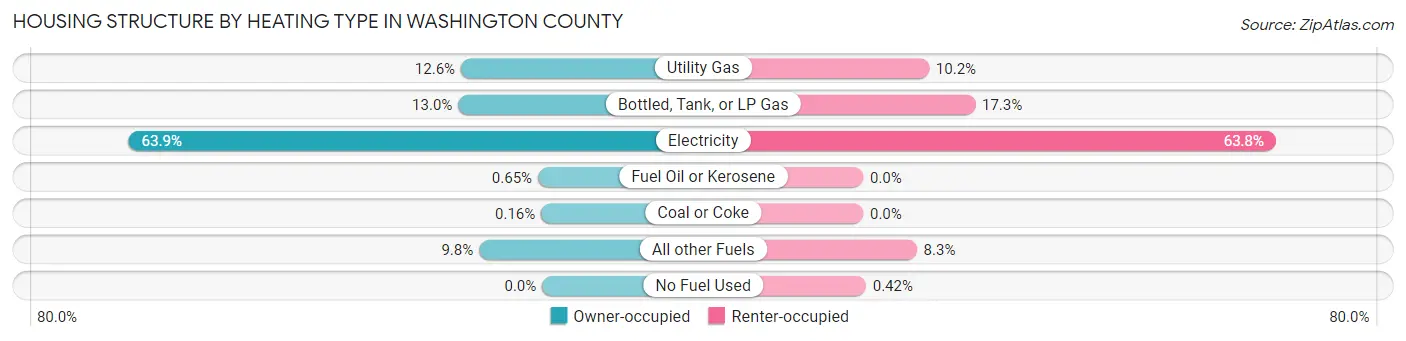
| Heating Type | Owner-occupied | Renter-occupied |
| Utility Gas | 462 (12.6%) | 97 (10.2%) |
| Bottled, Tank, or LP Gas | 478 (13.0%) | 165 (17.3%) |
| Electricity | 2,353 (63.9%) | 608 (63.8%) |
| Fuel Oil or Kerosene | 24 (0.6%) | 0 (0.0%) |
| Coal or Coke | 6 (0.2%) | 0 (0.0%) |
| All other Fuels | 359 (9.8%) | 79 (8.3%) |
| No Fuel Used | 0 (0.0%) | 4 (0.4%) |
| Total | 3,682 (100.0%) | 953 (100.0%) |
Household Vehicle Usage in Washington County
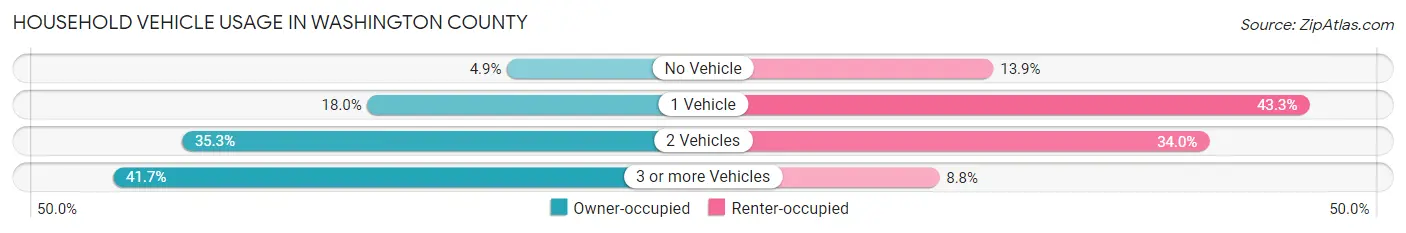
| Vehicles per Household | Owner-occupied | Renter-occupied |
| No Vehicle | 182 (4.9%) | 132 (13.9%) |
| 1 Vehicle | 662 (18.0%) | 413 (43.3%) |
| 2 Vehicles | 1,301 (35.3%) | 324 (34.0%) |
| 3 or more Vehicles | 1,537 (41.7%) | 84 (8.8%) |
| Total | 3,682 (100.0%) | 953 (100.0%) |
Real Estate & Mortgages in Washington County
Real Estate and Mortgage Overview in Washington County
| Characteristic | Without Mortgage | With Mortgage |
| Housing Units | 1,670 | 2,012 |
| Median Property Value | $163,300 | $156,300 |
| Median Household Income | $58,882 | $329 |
| Monthly Housing Costs | $389 | $15 |
| Real Estate Taxes | $944 | $10 |
Property Value by Mortgage Status in Washington County
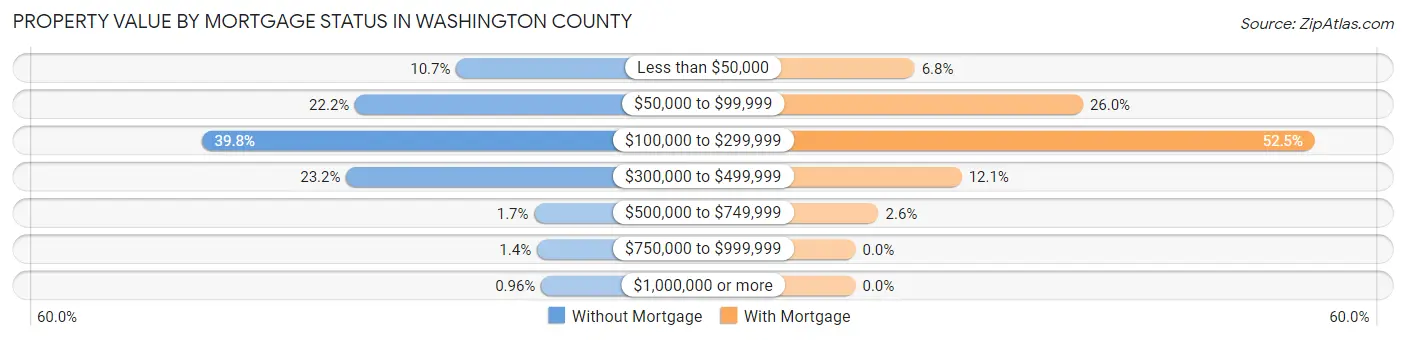
| Property Value | Without Mortgage | With Mortgage |
| Less than $50,000 | 178 (10.7%) | 136 (6.8%) |
| $50,000 to $99,999 | 371 (22.2%) | 523 (26.0%) |
| $100,000 to $299,999 | 664 (39.8%) | 1,056 (52.5%) |
| $300,000 to $499,999 | 388 (23.2%) | 244 (12.1%) |
| $500,000 to $749,999 | 29 (1.7%) | 53 (2.6%) |
| $750,000 to $999,999 | 24 (1.4%) | 0 (0.0%) |
| $1,000,000 or more | 16 (1.0%) | 0 (0.0%) |
| Total | 1,670 (100.0%) | 2,012 (100.0%) |
Household Income by Mortgage Status in Washington County
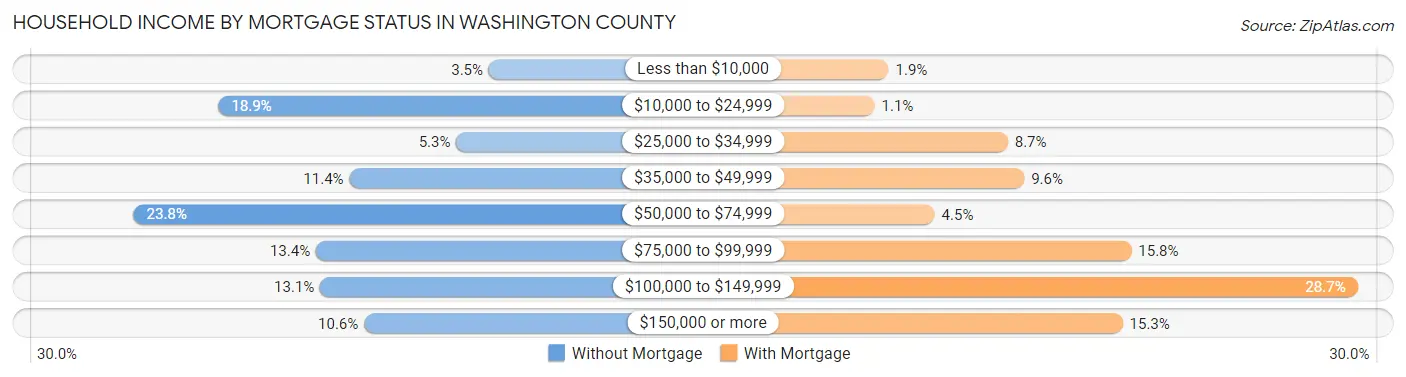
| Household Income | Without Mortgage | With Mortgage |
| Less than $10,000 | 58 (3.5%) | 38 (1.9%) |
| $10,000 to $24,999 | 316 (18.9%) | 22 (1.1%) |
| $25,000 to $34,999 | 89 (5.3%) | 175 (8.7%) |
| $35,000 to $49,999 | 191 (11.4%) | 194 (9.6%) |
| $50,000 to $74,999 | 397 (23.8%) | 91 (4.5%) |
| $75,000 to $99,999 | 223 (13.4%) | 317 (15.8%) |
| $100,000 to $149,999 | 219 (13.1%) | 577 (28.7%) |
| $150,000 or more | 177 (10.6%) | 307 (15.3%) |
| Total | 1,670 (100.0%) | 2,012 (100.0%) |
Property Value to Household Income Ratio in Washington County

| Value-to-Income Ratio | Without Mortgage | With Mortgage |
| Less than 2.0x | 547 (32.8%) | 89,113 (4,429.1%) |
| 2.0x to 2.9x | 405 (24.2%) | 1,018 (50.6%) |
| 3.0x to 3.9x | 116 (7.0%) | 522 (25.9%) |
| 4.0x or more | 599 (35.9%) | 199 (9.9%) |
| Total | 1,670 (100.0%) | 2,012 (100.0%) |
Real Estate Taxes by Mortgage Status in Washington County
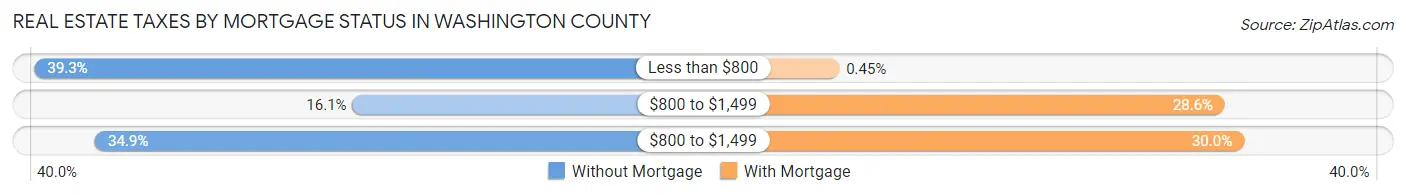
| Property Taxes | Without Mortgage | With Mortgage |
| Less than $800 | 656 (39.3%) | 9 (0.4%) |
| $800 to $1,499 | 268 (16.1%) | 576 (28.6%) |
| $800 to $1,499 | 582 (34.8%) | 604 (30.0%) |
| Total | 1,670 (100.0%) | 2,012 (100.0%) |
Health & Disability in Washington County
Health Insurance Coverage by Age in Washington County
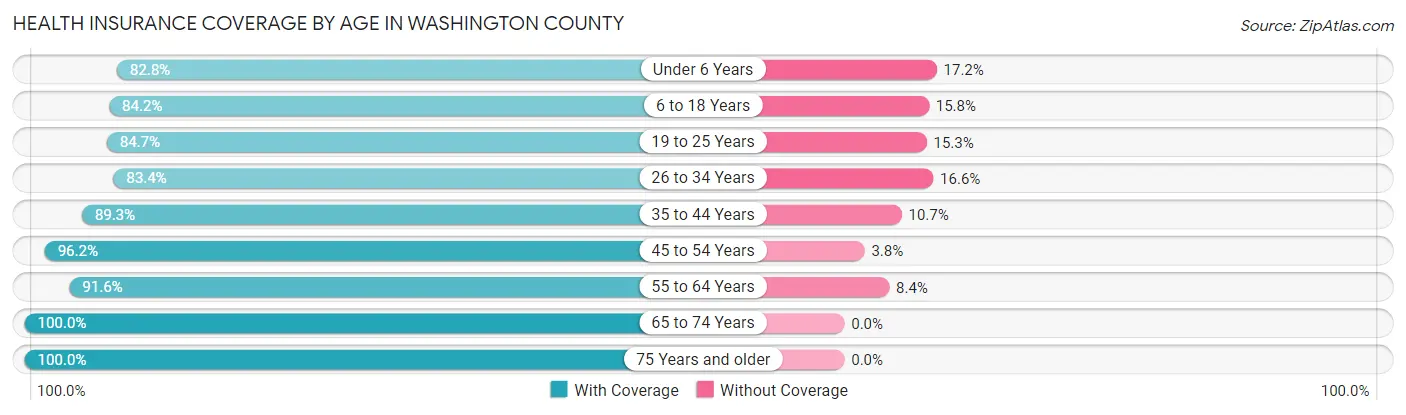
| Age Bracket | With Coverage | Without Coverage |
| Under 6 Years | 678 (82.8%) | 141 (17.2%) |
| 6 to 18 Years | 1,726 (84.2%) | 323 (15.8%) |
| 19 to 25 Years | 734 (84.7%) | 133 (15.3%) |
| 26 to 34 Years | 1,108 (83.4%) | 220 (16.6%) |
| 35 to 44 Years | 1,229 (89.3%) | 147 (10.7%) |
| 45 to 54 Years | 1,510 (96.2%) | 59 (3.8%) |
| 55 to 64 Years | 1,579 (91.6%) | 144 (8.4%) |
| 65 to 74 Years | 1,284 (100.0%) | 0 (0.0%) |
| 75 Years and older | 880 (100.0%) | 0 (0.0%) |
| Total | 10,728 (90.2%) | 1,167 (9.8%) |
Health Insurance Coverage by Citizenship Status in Washington County
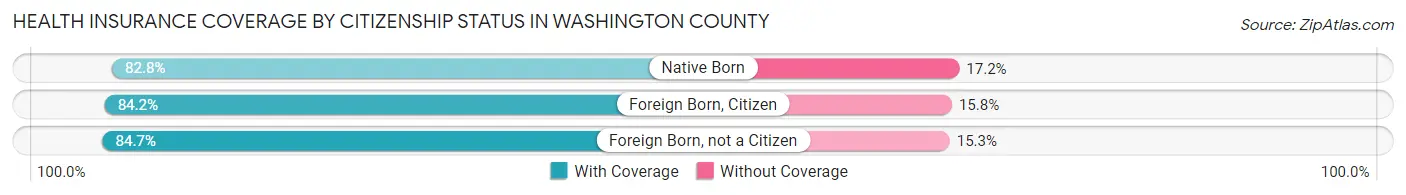
| Citizenship Status | With Coverage | Without Coverage |
| Native Born | 678 (82.8%) | 141 (17.2%) |
| Foreign Born, Citizen | 1,726 (84.2%) | 323 (15.8%) |
| Foreign Born, not a Citizen | 734 (84.7%) | 133 (15.3%) |
Health Insurance Coverage by Household Income in Washington County
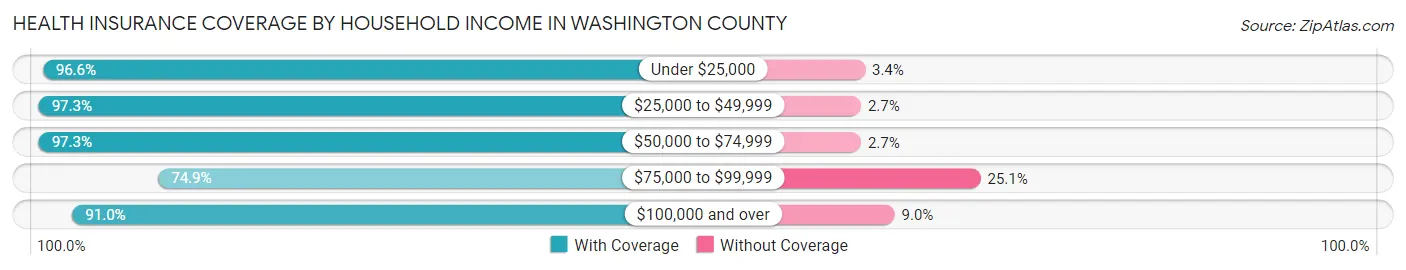
| Household Income | With Coverage | Without Coverage |
| Under $25,000 | 1,468 (96.6%) | 52 (3.4%) |
| $25,000 to $49,999 | 1,498 (97.3%) | 41 (2.7%) |
| $50,000 to $74,999 | 2,082 (97.3%) | 57 (2.7%) |
| $75,000 to $99,999 | 2,063 (74.9%) | 690 (25.1%) |
| $100,000 and over | 3,293 (91.0%) | 324 (9.0%) |
Public vs Private Health Insurance Coverage by Age in Washington County
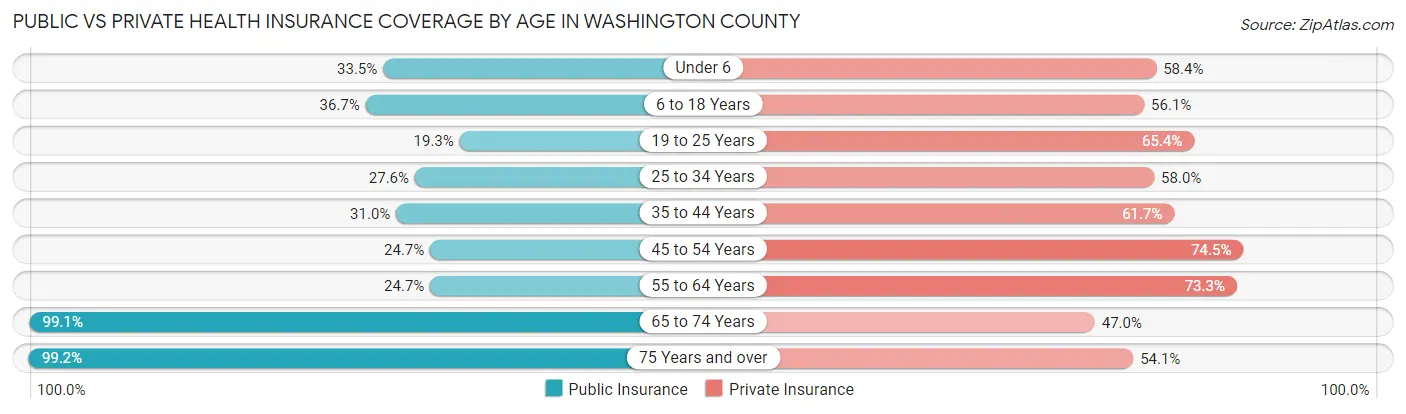
| Age Bracket | Public Insurance | Private Insurance |
| Under 6 | 274 (33.5%) | 478 (58.4%) |
| 6 to 18 Years | 752 (36.7%) | 1,150 (56.1%) |
| 19 to 25 Years | 167 (19.3%) | 567 (65.4%) |
| 25 to 34 Years | 366 (27.6%) | 770 (58.0%) |
| 35 to 44 Years | 427 (31.0%) | 849 (61.7%) |
| 45 to 54 Years | 388 (24.7%) | 1,169 (74.5%) |
| 55 to 64 Years | 426 (24.7%) | 1,263 (73.3%) |
| 65 to 74 Years | 1,272 (99.1%) | 603 (47.0%) |
| 75 Years and over | 873 (99.2%) | 476 (54.1%) |
| Total | 4,945 (41.6%) | 7,325 (61.6%) |
Disability Status by Sex by Age in Washington County
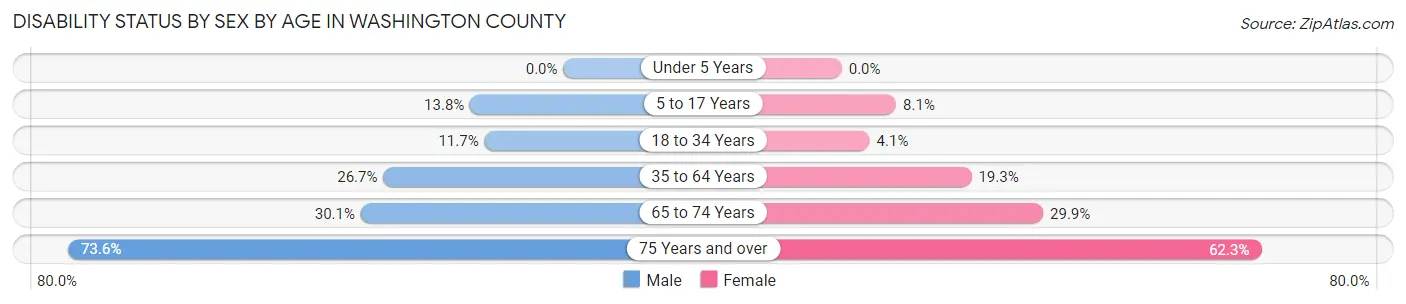
| Age Bracket | Male | Female |
| Under 5 Years | 0 (0.0%) | 0 (0.0%) |
| 5 to 17 Years | 146 (13.8%) | 78 (8.1%) |
| 18 to 34 Years | 139 (11.7%) | 47 (4.1%) |
| 35 to 64 Years | 651 (26.7%) | 430 (19.3%) |
| 65 to 74 Years | 191 (30.1%) | 194 (29.9%) |
| 75 Years and over | 228 (73.6%) | 355 (62.3%) |
Disability Class by Sex by Age in Washington County
Disability Class: Hearing Difficulty
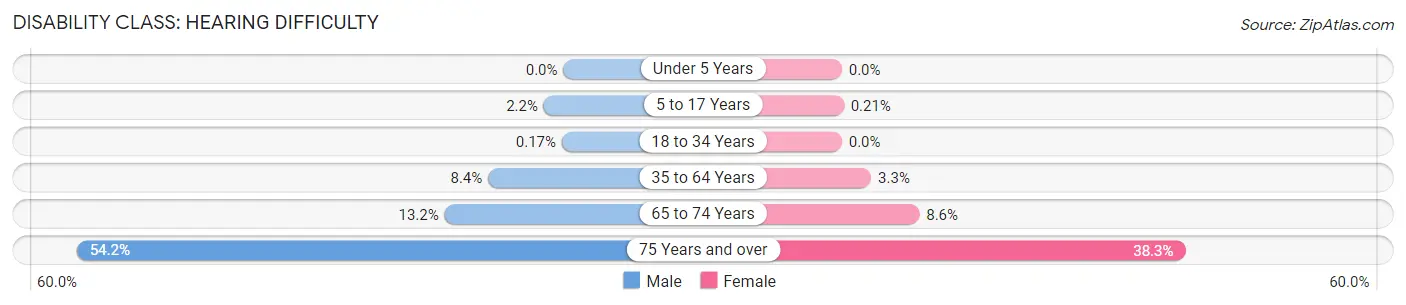
| Age Bracket | Male | Female |
| Under 5 Years | 0 (0.0%) | 0 (0.0%) |
| 5 to 17 Years | 23 (2.2%) | 2 (0.2%) |
| 18 to 34 Years | 2 (0.2%) | 0 (0.0%) |
| 35 to 64 Years | 204 (8.4%) | 73 (3.3%) |
| 65 to 74 Years | 84 (13.2%) | 56 (8.6%) |
| 75 Years and over | 168 (54.2%) | 218 (38.3%) |
Disability Class: Vision Difficulty
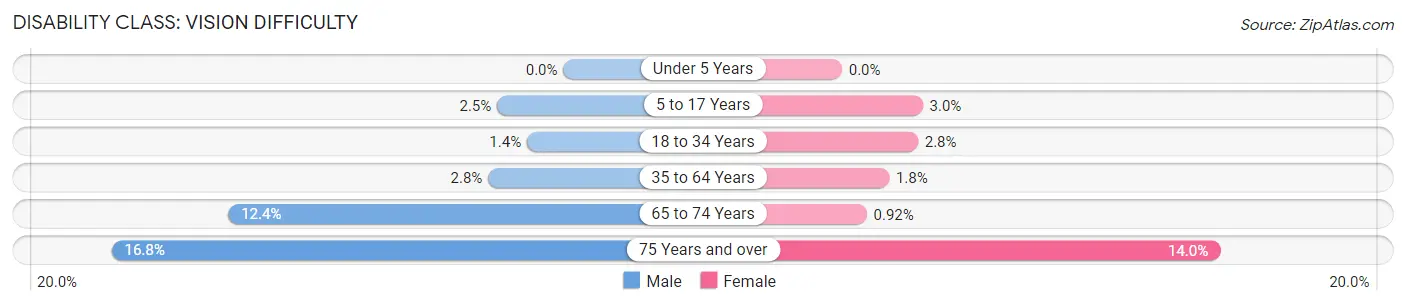
| Age Bracket | Male | Female |
| Under 5 Years | 0 (0.0%) | 0 (0.0%) |
| 5 to 17 Years | 26 (2.5%) | 29 (3.0%) |
| 18 to 34 Years | 16 (1.3%) | 32 (2.8%) |
| 35 to 64 Years | 68 (2.8%) | 39 (1.8%) |
| 65 to 74 Years | 79 (12.4%) | 6 (0.9%) |
| 75 Years and over | 52 (16.8%) | 80 (14.0%) |
Disability Class: Cognitive Difficulty
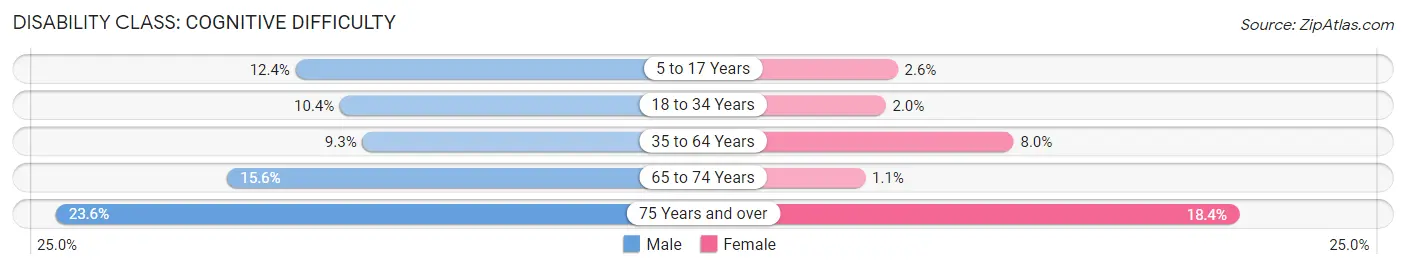
| Age Bracket | Male | Female |
| 5 to 17 Years | 131 (12.4%) | 25 (2.6%) |
| 18 to 34 Years | 123 (10.4%) | 23 (2.0%) |
| 35 to 64 Years | 227 (9.3%) | 178 (8.0%) |
| 65 to 74 Years | 99 (15.6%) | 7 (1.1%) |
| 75 Years and over | 73 (23.5%) | 105 (18.4%) |
Disability Class: Ambulatory Difficulty
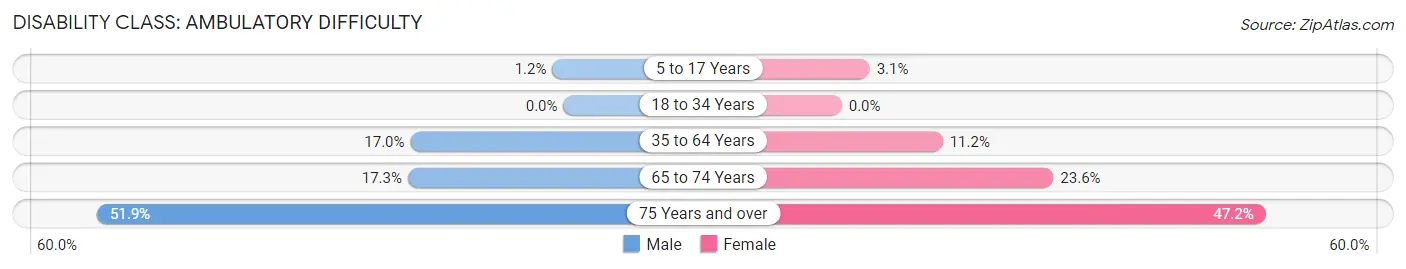
| Age Bracket | Male | Female |
| 5 to 17 Years | 13 (1.2%) | 30 (3.1%) |
| 18 to 34 Years | 0 (0.0%) | 0 (0.0%) |
| 35 to 64 Years | 415 (17.0%) | 251 (11.2%) |
| 65 to 74 Years | 110 (17.3%) | 153 (23.6%) |
| 75 Years and over | 161 (51.9%) | 269 (47.2%) |
Disability Class: Self-Care Difficulty
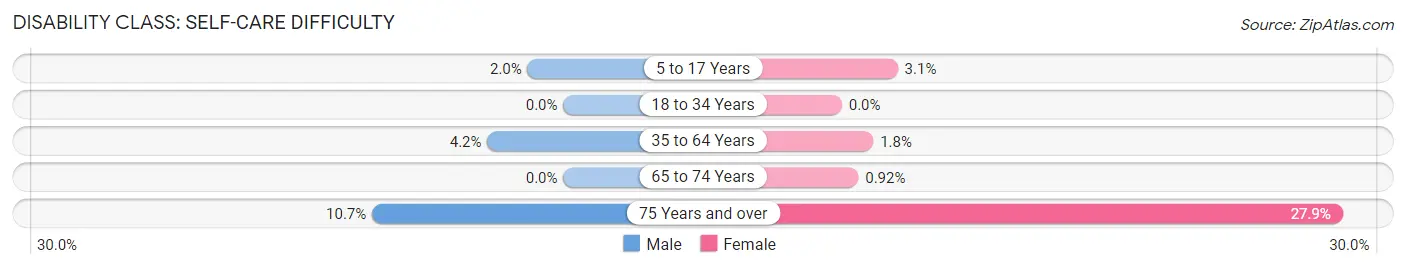
| Age Bracket | Male | Female |
| 5 to 17 Years | 21 (2.0%) | 30 (3.1%) |
| 18 to 34 Years | 0 (0.0%) | 0 (0.0%) |
| 35 to 64 Years | 103 (4.2%) | 39 (1.8%) |
| 65 to 74 Years | 0 (0.0%) | 6 (0.9%) |
| 75 Years and over | 33 (10.6%) | 159 (27.9%) |
Technology Access in Washington County
Computing Device Access in Washington County
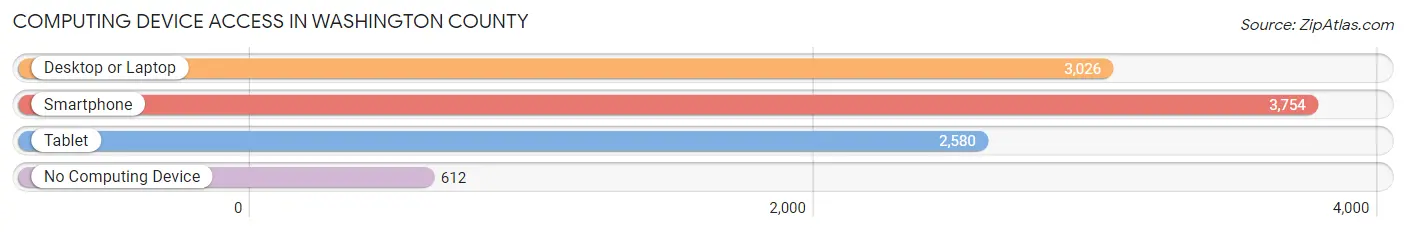
| Device Type | # Households | % Households |
| Desktop or Laptop | 3,026 | 65.3% |
| Smartphone | 3,754 | 81.0% |
| Tablet | 2,580 | 55.7% |
| No Computing Device | 612 | 13.2% |
| Total | 4,635 | 100.0% |
Internet Access in Washington County
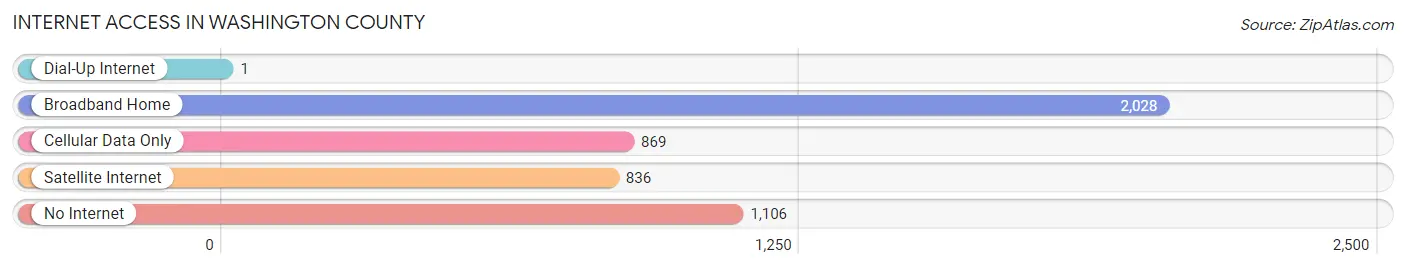
| Internet Type | # Households | % Households |
| Dial-Up Internet | 1 | 0.0% |
| Broadband Home | 2,028 | 43.8% |
| Cellular Data Only | 869 | 18.8% |
| Satellite Internet | 836 | 18.0% |
| No Internet | 1,106 | 23.9% |
| Total | 4,635 | 100.0% |
Washington County Summary
Introduction
Washington County is located in the eastern part of Kentucky, and is part of the Bluegrass Region. It is bordered by the counties of Pulaski, Laurel, Whitley, McCreary, and Wayne. The county seat is Springfield, and the county was established in 1792. The county is named after George Washington, the first president of the United States.
History
Washington County was formed in 1792 from parts of Pulaski and Nelson counties. The county was named after George Washington, the first president of the United States. The county was originally part of a larger area known as the District of Kentucky, which was created in 1776. The district was divided into three counties in 1780, and Washington County was one of them.
The county was initially settled by pioneers from Virginia, North Carolina, and South Carolina. The first settlers arrived in the late 1700s and early 1800s. The county was primarily an agricultural area, and the main crops were corn, wheat, and tobacco.
The county was also home to several Native American tribes, including the Cherokee, Shawnee, and Chickasaw. The county was also home to several forts, including Fort Washington, which was built in 1792.
Geography
Washington County is located in the eastern part of Kentucky, and is part of the Bluegrass Region. It is bordered by the counties of Pulaski, Laurel, Whitley, McCreary, and Wayne. The county has a total area of 441 square miles, of which 439 square miles is land and 2 square miles is water.
The county is mostly hilly, with some flat areas in the northern and eastern parts. The highest point in the county is located in the northern part, at an elevation of 1,068 feet. The county is drained by the Cumberland River, which flows through the western part of the county.
Economy
The economy of Washington County is primarily based on agriculture. The main crops are corn, wheat, and tobacco. The county also has a large livestock industry, with cattle, hogs, and poultry being the main animals raised.
The county also has a large manufacturing sector, with several factories located in the county. The main industries are furniture manufacturing, automotive parts manufacturing, and food processing.
Demographics
As of the 2010 census, the population of Washington County was 11,717. The population density was 26.5 people per square mile. The racial makeup of the county was 95.3% White, 2.7% African American, 0.2% Native American, 0.2% Asian, 0.1% Pacific Islander, 0.5% from other races, and 0.9% from two or more races.
The median income for a household in the county was $30,945, and the median income for a family was $37,917. The per capita income for the county was $16,845. About 17.2% of the population was below the poverty line.
Conclusion
Washington County is located in the eastern part of Kentucky, and is part of the Bluegrass Region. The county was established in 1792 and is named after George Washington, the first president of the United States. The economy of the county is primarily based on agriculture, with corn, wheat, and tobacco being the main crops. The county also has a large manufacturing sector, with several factories located in the county. The population of the county was 11,717 as of the 2010 census, and the median income for a household was $30,945.
Common Questions
What is Per Capita Income in Washington County?
Per Capita income in Washington County is $30,217.
What is the Median Family Income in Washington County?
Median Family Income in Washington County is $86,053.
What is the Median Household income in Washington County?
Median Household Income in Washington County is $65,456.
What is Income or Wage Gap in Washington County?
Income or Wage Gap in Washington County is 13.4%.
Women in Washington County earn 86.6 cents for every dollar earned by a man.
What is Inequality or Gini Index in Washington County?
Inequality or Gini Index in Washington County is 0.42.
What is the Total Population of Washington County?
Total Population of Washington County is 12,025.
What is the Total Male Population of Washington County?
Total Male Population of Washington County is 6,026.
What is the Total Female Population of Washington County?
Total Female Population of Washington County is 5,999.
What is the Ratio of Males per 100 Females in Washington County?
There are 100.45 Males per 100 Females in Washington County.
What is the Ratio of Females per 100 Males in Washington County?
There are 99.55 Females per 100 Males in Washington County.
What is the Median Population Age in Washington County?
Median Population Age in Washington County is 42.3 Years.
What is the Average Family Size in Washington County
Average Family Size in Washington County is 3.2 People.
What is the Average Household Size in Washington County
Average Household Size in Washington County is 2.5 People.
How Large is the Labor Force in Washington County?
There are 5,856 People in the Labor Forcein in Washington County.
What is the Percentage of People in the Labor Force in Washington County?
60.6% of People are in the Labor Force in Washington County.
What is the Unemployment Rate in Washington County?
Unemployment Rate in Washington County is 2.3%.