Trigg County, KY Map & Demographics
Trigg County Map
Trigg County Overview
$30,172
PER CAPITA INCOME
$67,580
AVG FAMILY INCOME
$55,864
AVG HOUSEHOLD INCOME
25.1%
WAGE / INCOME GAP [ % ]
74.9¢/ $1
WAGE / INCOME GAP [ $ ]
$9,018
FAMILY INCOME DEFICIT
0.44
INEQUALITY / GINI INDEX
14,154
TOTAL POPULATION
7,031
MALE POPULATION
7,123
FEMALE POPULATION
98.71
MALES / 100 FEMALES
101.31
FEMALES / 100 MALES
45.8
MEDIAN AGE
3.0
AVG FAMILY SIZE
2.4
AVG HOUSEHOLD SIZE
6,033
LABOR FORCE [ PEOPLE ]
52.8%
PERCENT IN LABOR FORCE
4.0%
UNEMPLOYMENT RATE
Trigg County Area Codes
Income in Trigg County
Income Overview in Trigg County
Per Capita Income in Trigg County is $30,172, while median incomes of families and households are $67,580 and $55,864 respectively.
| Characteristic | Number | Measure |
| Per Capita Income | 14,154 | $30,172 |
| Median Family Income | 3,909 | $67,580 |
| Mean Family Income | 3,909 | $85,408 |
| Median Household Income | 5,818 | $55,864 |
| Mean Household Income | 5,818 | $70,898 |
| Income Deficit | 3,909 | $9,018 |
| Wage / Income Gap (%) | 14,154 | 25.11% |
| Wage / Income Gap ($) | 14,154 | 74.89¢ per $1 |
| Gini / Inequality Index | 14,154 | 0.44 |
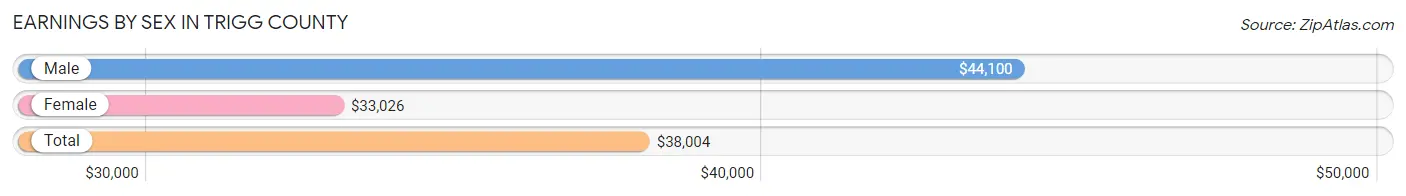
Earnings by Sex in Trigg County
Average Earnings in Trigg County are $38,004, $44,100 for men and $33,026 for women, a difference of 25.1%.
| Sex | Number | Average Earnings |
| Male | 3,362 (53.3%) | $44,100 |
| Female | 2,951 (46.7%) | $33,026 |
| Total | 6,313 (100.0%) | $38,004 |
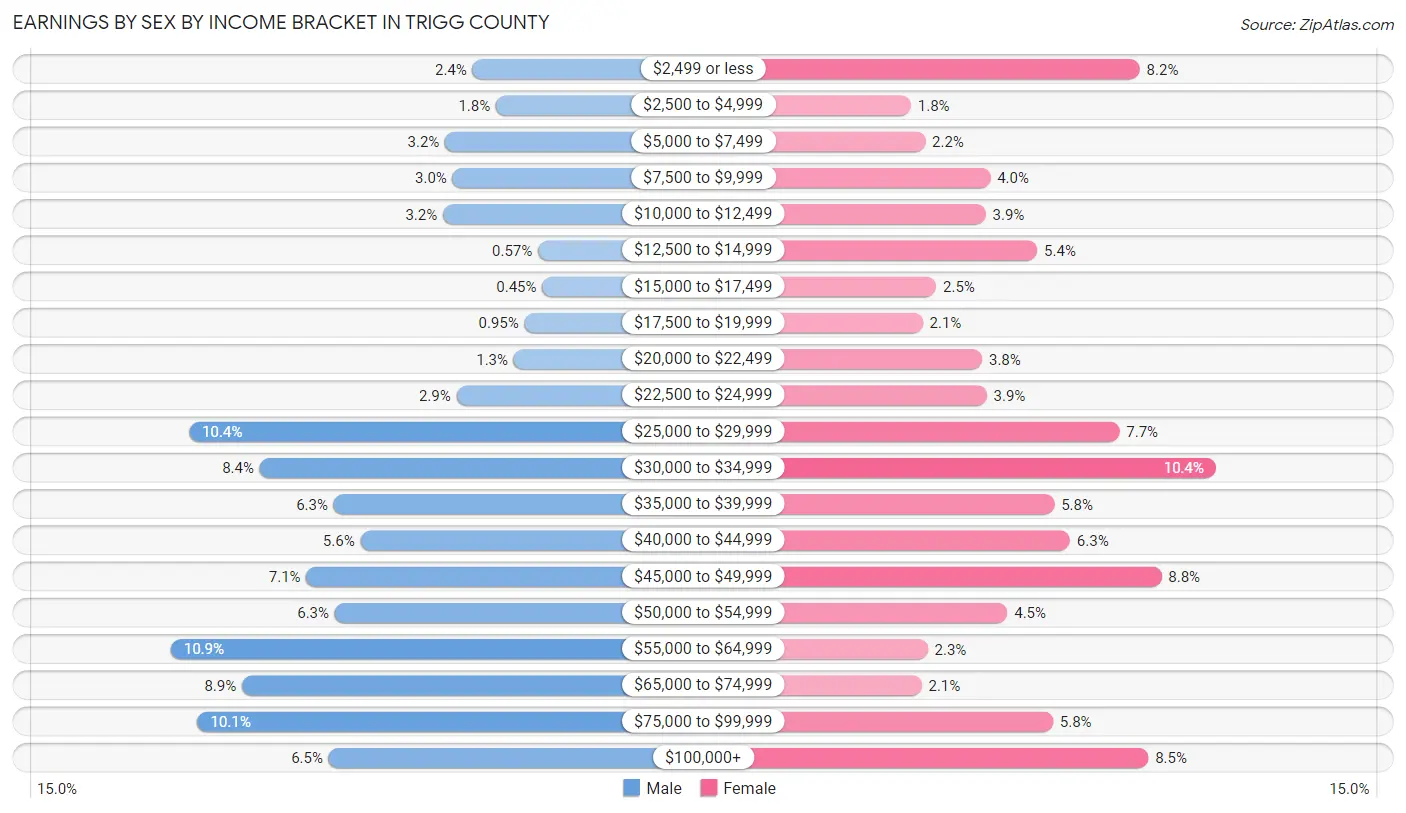
Earnings by Sex by Income Bracket in Trigg County
The most common earnings brackets in Trigg County are $55,000 to $64,999 for men (366 | 10.9%) and $30,000 to $34,999 for women (306 | 10.4%).
| Income | Male | Female |
| $2,499 or less | 81 (2.4%) | 243 (8.2%) |
| $2,500 to $4,999 | 59 (1.8%) | 53 (1.8%) |
| $5,000 to $7,499 | 107 (3.2%) | 65 (2.2%) |
| $7,500 to $9,999 | 100 (3.0%) | 119 (4.0%) |
| $10,000 to $12,499 | 109 (3.2%) | 115 (3.9%) |
| $12,500 to $14,999 | 19 (0.6%) | 158 (5.3%) |
| $15,000 to $17,499 | 15 (0.4%) | 74 (2.5%) |
| $17,500 to $19,999 | 32 (0.9%) | 63 (2.1%) |
| $20,000 to $22,499 | 42 (1.3%) | 112 (3.8%) |
| $22,500 to $24,999 | 96 (2.9%) | 116 (3.9%) |
| $25,000 to $29,999 | 349 (10.4%) | 226 (7.7%) |
| $30,000 to $34,999 | 282 (8.4%) | 306 (10.4%) |
| $35,000 to $39,999 | 212 (6.3%) | 172 (5.8%) |
| $40,000 to $44,999 | 187 (5.6%) | 185 (6.3%) |
| $45,000 to $49,999 | 238 (7.1%) | 261 (8.8%) |
| $50,000 to $54,999 | 211 (6.3%) | 133 (4.5%) |
| $55,000 to $64,999 | 366 (10.9%) | 67 (2.3%) |
| $65,000 to $74,999 | 299 (8.9%) | 62 (2.1%) |
| $75,000 to $99,999 | 341 (10.1%) | 171 (5.8%) |
| $100,000+ | 217 (6.5%) | 250 (8.5%) |
| Total | 3,362 (100.0%) | 2,951 (100.0%) |
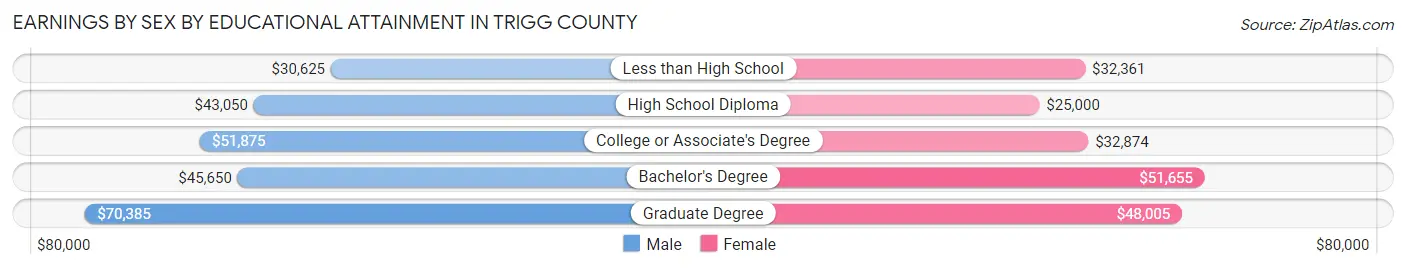
Earnings by Sex by Educational Attainment in Trigg County
Average earnings in Trigg County are $48,552 for men and $34,566 for women, a difference of 28.8%. Men with an educational attainment of graduate degree enjoy the highest average annual earnings of $70,385, while those with less than high school education earn the least with $30,625. Women with an educational attainment of bachelor's degree earn the most with the average annual earnings of $51,655, while those with high school diploma education have the smallest earnings of $25,000.
| Educational Attainment | Male Income | Female Income |
| Less than High School | $30,625 | $32,361 |
| High School Diploma | $43,050 | $25,000 |
| College or Associate's Degree | $51,875 | $32,874 |
| Bachelor's Degree | $45,650 | $51,655 |
| Graduate Degree | $70,385 | $48,005 |
| Total | $48,552 | $34,566 |
Family Income in Trigg County
Family Income Brackets in Trigg County
According to the Trigg County family income data, there are 895 families falling into the $50,000 to $74,999 income range, which is the most common income bracket and makes up 22.9% of all families. Conversely, the less than $10,000 income bracket is the least frequent group with only 129 families (3.3%) belonging to this category.
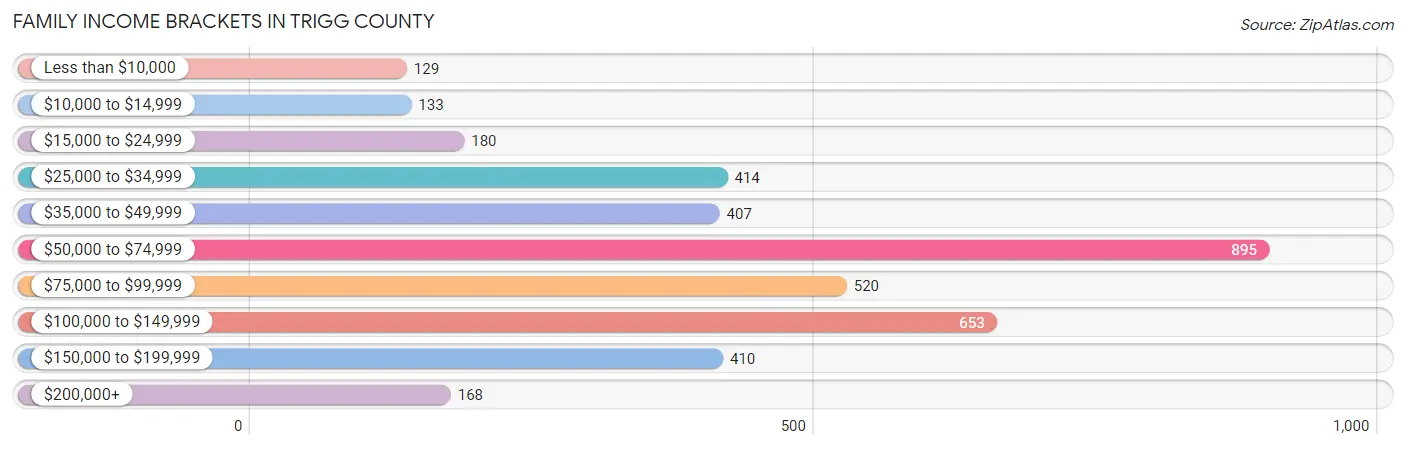
| Income Bracket | # Families | % Families |
| Less than $10,000 | 129 | 3.3% |
| $10,000 to $14,999 | 133 | 3.4% |
| $15,000 to $24,999 | 180 | 4.6% |
| $25,000 to $34,999 | 414 | 10.6% |
| $35,000 to $49,999 | 407 | 10.4% |
| $50,000 to $74,999 | 895 | 22.9% |
| $75,000 to $99,999 | 520 | 13.3% |
| $100,000 to $149,999 | 653 | 16.7% |
| $150,000 to $199,999 | 410 | 10.5% |
| $200,000+ | 168 | 4.3% |
Family Income by Famaliy Size in Trigg County
4-person families (398 | 10.2%) account for the highest median family income in Trigg County with $108,226 per family, while 2-person families (2,211 | 56.6%) have the highest median income of $32,356 per family member.
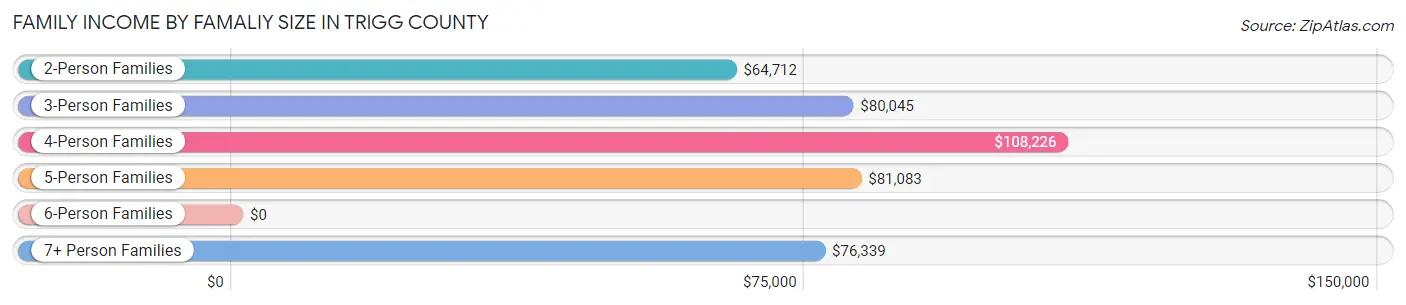
| Income Bracket | # Families | Median Income |
| 2-Person Families | 2,211 (56.6%) | $64,712 |
| 3-Person Families | 793 (20.3%) | $80,045 |
| 4-Person Families | 398 (10.2%) | $108,226 |
| 5-Person Families | 341 (8.7%) | $81,083 |
| 6-Person Families | 73 (1.9%) | $0 |
| 7+ Person Families | 93 (2.4%) | $76,339 |
| Total | 3,909 (100.0%) | $67,580 |
Family Income by Number of Earners in Trigg County
The median family income in Trigg County is $67,580, with families comprising 3+ earners (341) having the highest median family income of $166,467, while families with no earners (933) have the lowest median family income of $50,625, accounting for 8.7% and 23.9% of families, respectively.
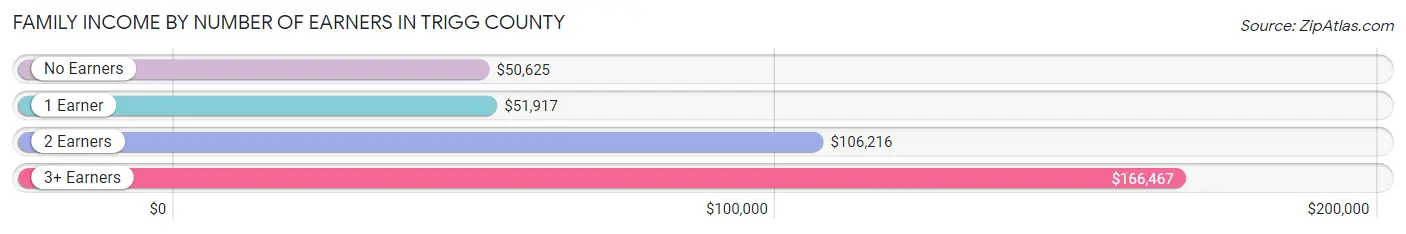
| Number of Earners | # Families | Median Income |
| No Earners | 933 (23.9%) | $50,625 |
| 1 Earner | 1,387 (35.5%) | $51,917 |
| 2 Earners | 1,248 (31.9%) | $106,216 |
| 3+ Earners | 341 (8.7%) | $166,467 |
| Total | 3,909 (100.0%) | $67,580 |
Household Income in Trigg County
Household Income Brackets in Trigg County
With 1,135 households falling in the category, the $50,000 to $74,999 income range is the most frequent in Trigg County, accounting for 19.5% of all households. In contrast, only 250 households (4.3%) fall into the $200,000+ income bracket, making it the least populous group.
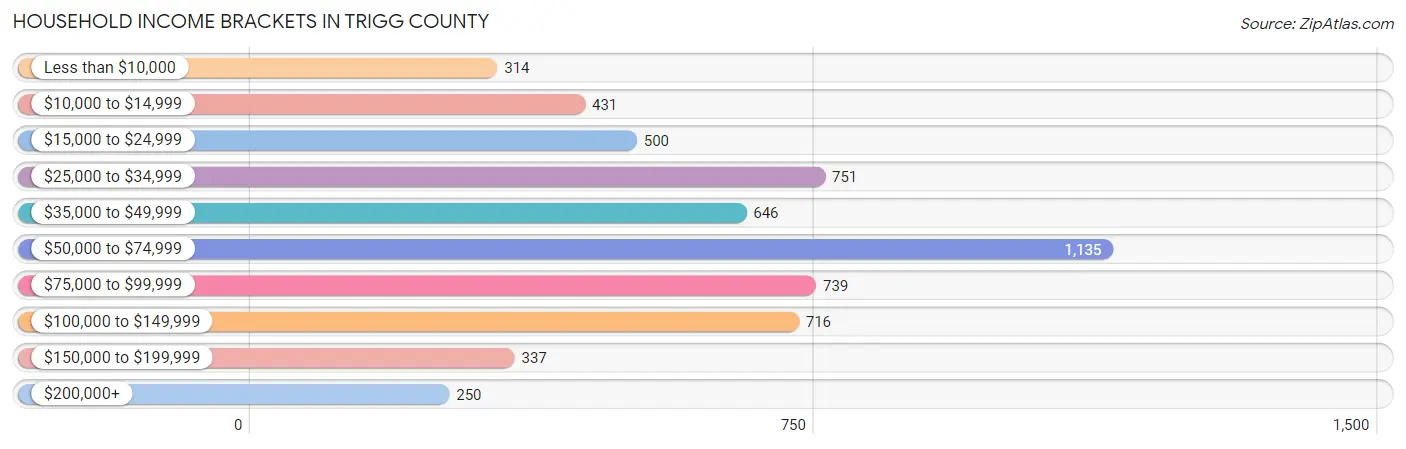
| Income Bracket | # Households | % Households |
| Less than $10,000 | 314 | 5.4% |
| $10,000 to $14,999 | 431 | 7.4% |
| $15,000 to $24,999 | 500 | 8.6% |
| $25,000 to $34,999 | 751 | 12.9% |
| $35,000 to $49,999 | 646 | 11.1% |
| $50,000 to $74,999 | 1,135 | 19.5% |
| $75,000 to $99,999 | 739 | 12.7% |
| $100,000 to $149,999 | 716 | 12.3% |
| $150,000 to $199,999 | 337 | 5.8% |
| $200,000+ | 250 | 4.3% |
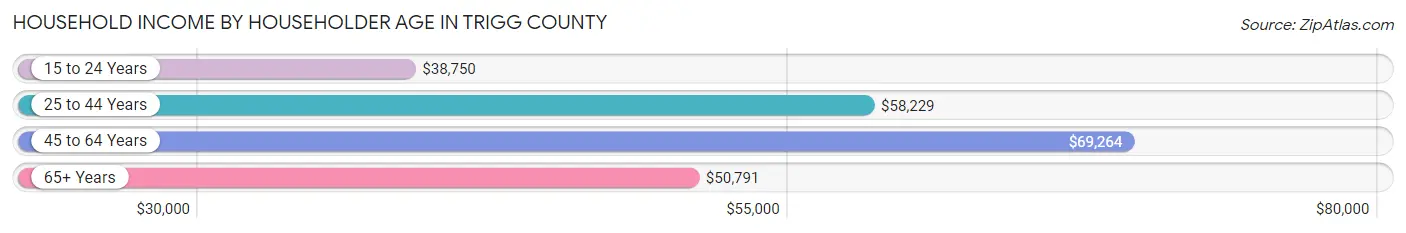
Household Income by Householder Age in Trigg County
The median household income in Trigg County is $55,864, with the highest median household income of $69,264 found in the 45 to 64 years age bracket for the primary householder. A total of 2,317 households (39.8%) fall into this category. Meanwhile, the 15 to 24 years age bracket for the primary householder has the lowest median household income of $38,750, with 103 households (1.8%) in this group.
| Income Bracket | # Households | Median Income |
| 15 to 24 Years | 103 (1.8%) | $38,750 |
| 25 to 44 Years | 1,349 (23.2%) | $58,229 |
| 45 to 64 Years | 2,317 (39.8%) | $69,264 |
| 65+ Years | 2,049 (35.2%) | $50,791 |
| Total | 5,818 (100.0%) | $55,864 |
Poverty in Trigg County
Income Below Poverty by Sex and Age in Trigg County
With 16.6% poverty level for males and 19.7% for females among the residents of Trigg County, under 5 year old males and under 5 year old females are the most vulnerable to poverty, with 212 males (49.3%) and 121 females (34.7%) in their respective age groups living below the poverty level.
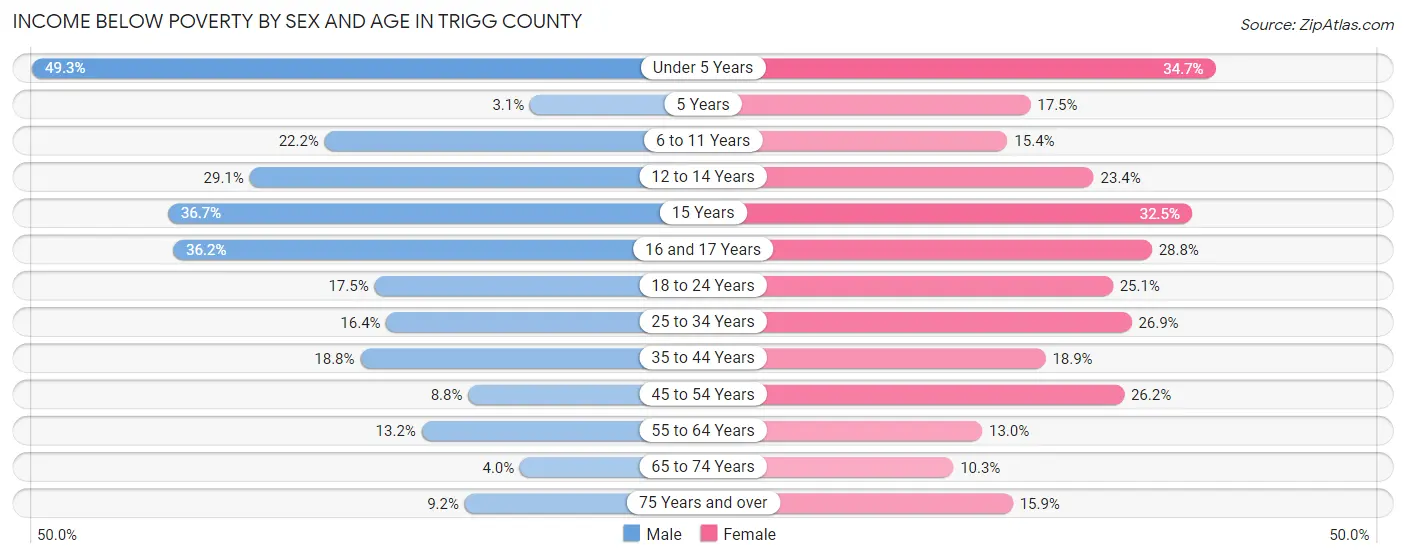
| Age Bracket | Male | Female |
| Under 5 Years | 212 (49.3%) | 121 (34.7%) |
| 5 Years | 3 (3.1%) | 7 (17.5%) |
| 6 to 11 Years | 99 (22.2%) | 79 (15.4%) |
| 12 to 14 Years | 83 (29.1%) | 68 (23.4%) |
| 15 Years | 40 (36.7%) | 38 (32.5%) |
| 16 and 17 Years | 67 (36.2%) | 44 (28.8%) |
| 18 to 24 Years | 85 (17.5%) | 131 (25.1%) |
| 25 to 34 Years | 112 (16.4%) | 186 (26.9%) |
| 35 to 44 Years | 152 (18.8%) | 141 (18.9%) |
| 45 to 54 Years | 78 (8.8%) | 226 (26.2%) |
| 55 to 64 Years | 135 (13.2%) | 153 (13.0%) |
| 65 to 74 Years | 38 (4.0%) | 102 (10.3%) |
| 75 Years and over | 54 (9.1%) | 102 (15.9%) |
| Total | 1,158 (16.6%) | 1,398 (19.7%) |
Income Above Poverty by Sex and Age in Trigg County
According to the poverty statistics in Trigg County, males aged 5 years and females aged 65 to 74 years are the age groups that are most secure financially, with 96.9% of males and 89.7% of females in these age groups living above the poverty line.
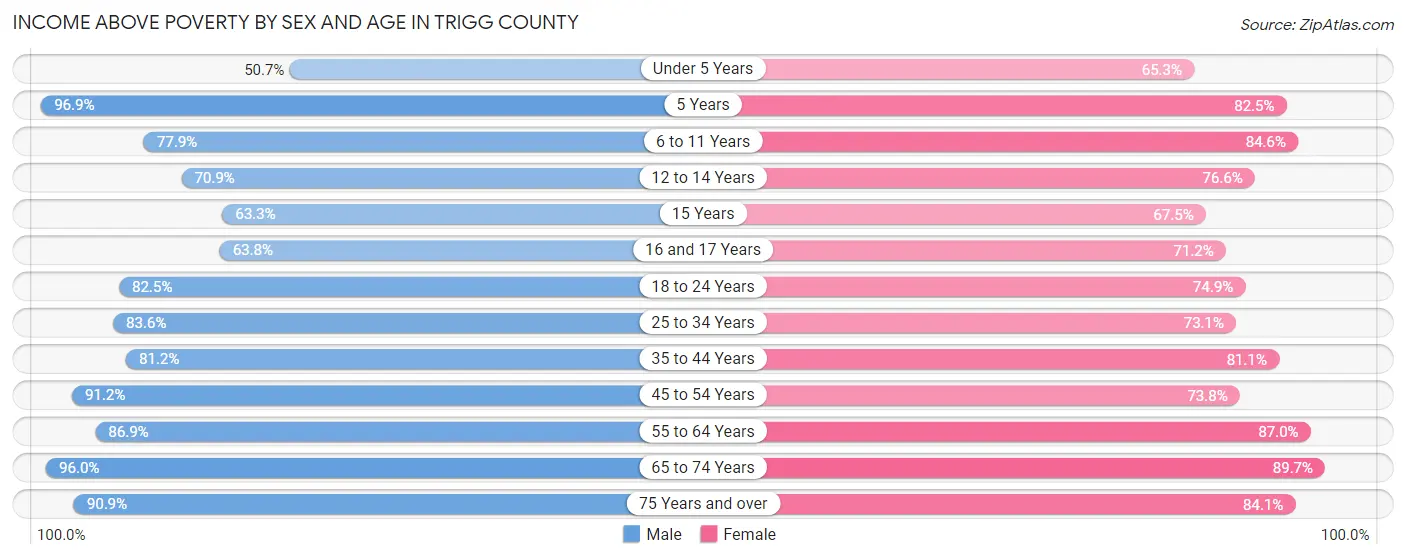
| Age Bracket | Male | Female |
| Under 5 Years | 218 (50.7%) | 228 (65.3%) |
| 5 Years | 94 (96.9%) | 33 (82.5%) |
| 6 to 11 Years | 348 (77.8%) | 435 (84.6%) |
| 12 to 14 Years | 202 (70.9%) | 223 (76.6%) |
| 15 Years | 69 (63.3%) | 79 (67.5%) |
| 16 and 17 Years | 118 (63.8%) | 109 (71.2%) |
| 18 to 24 Years | 400 (82.5%) | 390 (74.9%) |
| 25 to 34 Years | 570 (83.6%) | 506 (73.1%) |
| 35 to 44 Years | 655 (81.2%) | 605 (81.1%) |
| 45 to 54 Years | 806 (91.2%) | 637 (73.8%) |
| 55 to 64 Years | 892 (86.9%) | 1,022 (87.0%) |
| 65 to 74 Years | 909 (96.0%) | 884 (89.7%) |
| 75 Years and over | 536 (90.8%) | 541 (84.1%) |
| Total | 5,817 (83.4%) | 5,692 (80.3%) |
Income Below Poverty Among Married-Couple Families in Trigg County
The poverty statistics for married-couple families in Trigg County show that 6.7% or 201 of the total 3,016 families live below the poverty line. Families with 3 or 4 children have the highest poverty rate of 26.6%, comprising of 91 families. On the other hand, families with no children have the lowest poverty rate of 3.5%, which includes 68 families.
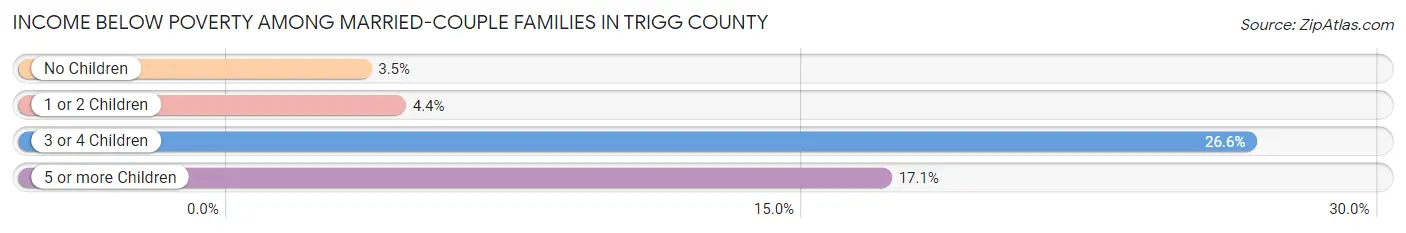
| Children | Above Poverty | Below Poverty |
| No Children | 1,885 (96.5%) | 68 (3.5%) |
| 1 or 2 Children | 611 (95.6%) | 28 (4.4%) |
| 3 or 4 Children | 251 (73.4%) | 91 (26.6%) |
| 5 or more Children | 68 (82.9%) | 14 (17.1%) |
| Total | 2,815 (93.3%) | 201 (6.7%) |
Income Below Poverty Among Single-Parent Households in Trigg County
According to the poverty data in Trigg County, 14.7% or 37 single-father households and 47.3% or 304 single-mother households are living below the poverty line. Among single-father households, those with 1 or 2 children have the highest poverty rate, with 22 households (22.0%) experiencing poverty. Likewise, among single-mother households, those with 3 or 4 children have the highest poverty rate, with 61 households (100.0%) falling below the poverty line.
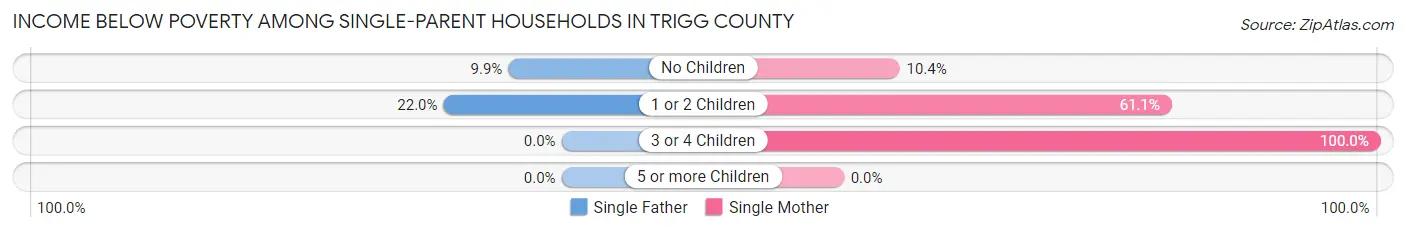
| Children | Single Father | Single Mother |
| No Children | 15 (9.9%) | 23 (10.4%) |
| 1 or 2 Children | 22 (22.0%) | 220 (61.1%) |
| 3 or 4 Children | 0 (0.0%) | 61 (100.0%) |
| 5 or more Children | 0 (0.0%) | 0 (0.0%) |
| Total | 37 (14.7%) | 304 (47.3%) |
Income Below Poverty Among Married-Couple vs Single-Parent Households in Trigg County
The poverty data for Trigg County shows that 201 of the married-couple family households (6.7%) and 341 of the single-parent households (38.2%) are living below the poverty level. Within the married-couple family households, those with 3 or 4 children have the highest poverty rate, with 91 households (26.6%) falling below the poverty line. Among the single-parent households, those with 3 or 4 children have the highest poverty rate, with 61 household (100.0%) living below poverty.
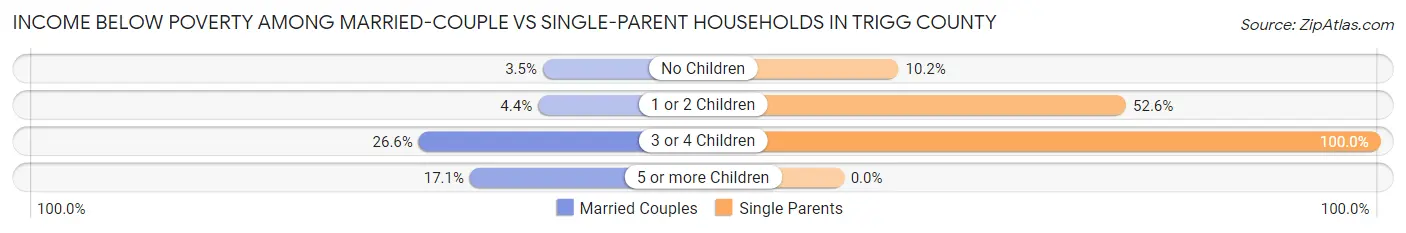
| Children | Married-Couple Families | Single-Parent Households |
| No Children | 68 (3.5%) | 38 (10.2%) |
| 1 or 2 Children | 28 (4.4%) | 242 (52.6%) |
| 3 or 4 Children | 91 (26.6%) | 61 (100.0%) |
| 5 or more Children | 14 (17.1%) | 0 (0.0%) |
| Total | 201 (6.7%) | 341 (38.2%) |
Race in Trigg County
The most populous races in Trigg County are White / Caucasian (12,457 | 88.0%), Black / African American (896 | 6.3%), and Two or more Races (695 | 4.9%).
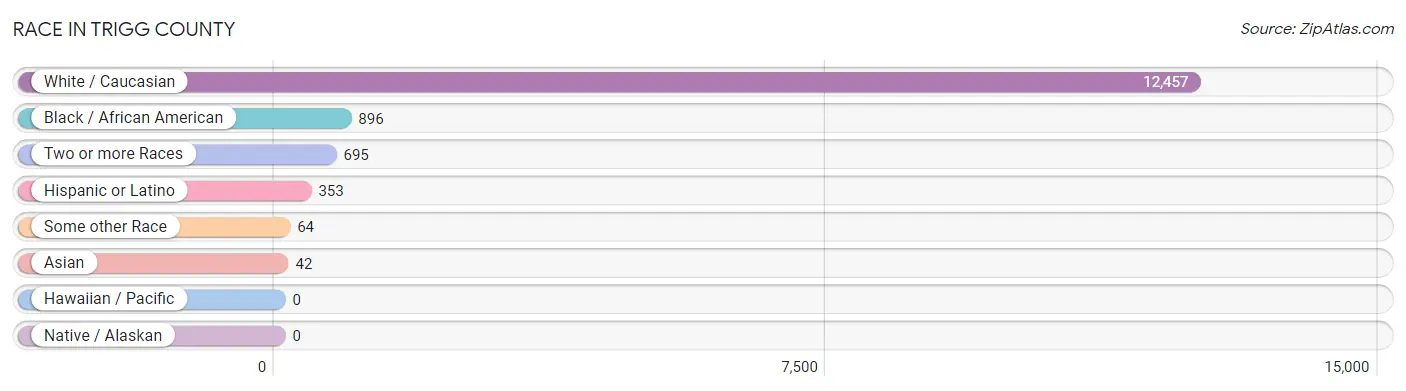
| Race | # Population | % Population |
| Asian | 42 | 0.3% |
| Black / African American | 896 | 6.3% |
| Hawaiian / Pacific | 0 | 0.0% |
| Hispanic or Latino | 353 | 2.5% |
| Native / Alaskan | 0 | 0.0% |
| White / Caucasian | 12,457 | 88.0% |
| Two or more Races | 695 | 4.9% |
| Some other Race | 64 | 0.4% |
| Total | 14,154 | 100.0% |
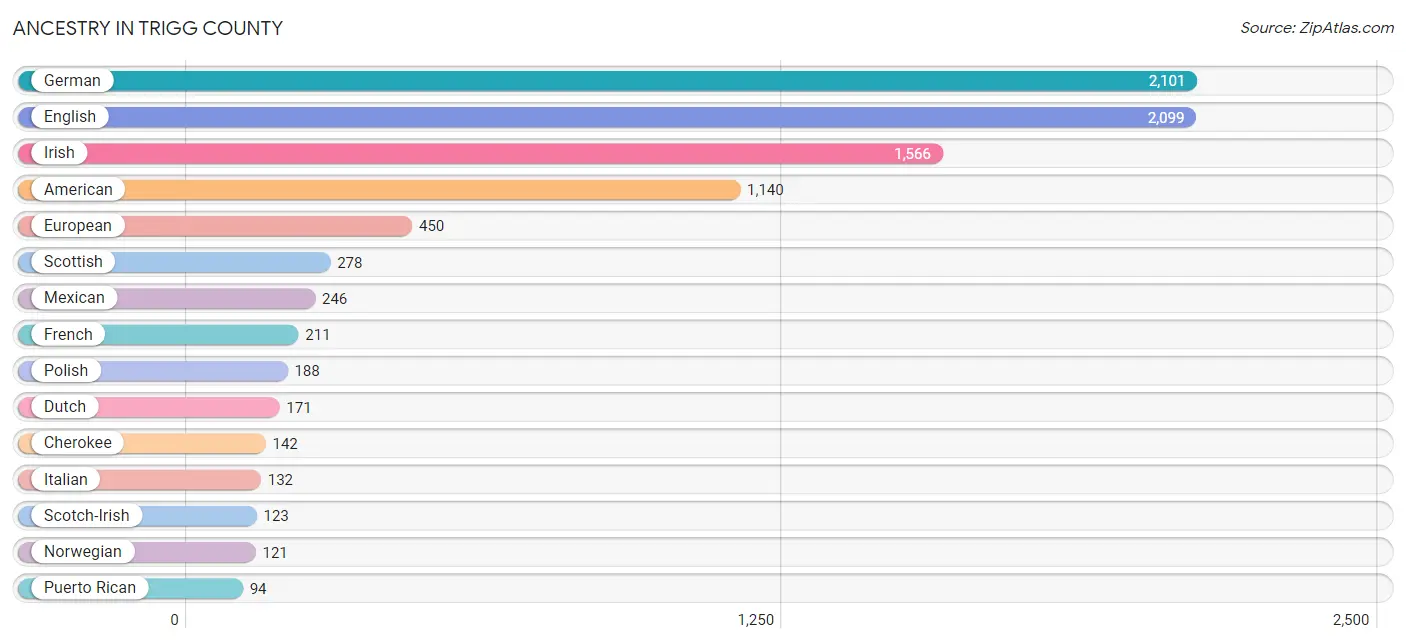
Ancestry in Trigg County
The most populous ancestries reported in Trigg County are German (2,101 | 14.8%), English (2,099 | 14.8%), Irish (1,566 | 11.1%), American (1,140 | 8.1%), and European (450 | 3.2%), together accounting for 52.0% of all Trigg County residents.
| Ancestry | # Population | % Population |
| African | 75 | 0.5% |
| American | 1,140 | 8.1% |
| Arab | 5 | 0.0% |
| British | 69 | 0.5% |
| Canadian | 20 | 0.1% |
| Central American | 13 | 0.1% |
| Cherokee | 142 | 1.0% |
| Croatian | 7 | 0.1% |
| Czech | 9 | 0.1% |
| Czechoslovakian | 11 | 0.1% |
| Danish | 16 | 0.1% |
| Dutch | 171 | 1.2% |
| Eastern European | 10 | 0.1% |
| English | 2,099 | 14.8% |
| European | 450 | 3.2% |
| French | 211 | 1.5% |
| French Canadian | 76 | 0.5% |
| German | 2,101 | 14.8% |
| Guatemalan | 13 | 0.1% |
| Indonesian | 32 | 0.2% |
| Irish | 1,566 | 11.1% |
| Italian | 132 | 0.9% |
| Korean | 21 | 0.2% |
| Lithuanian | 6 | 0.0% |
| Mexican | 246 | 1.7% |
| Northern European | 29 | 0.2% |
| Norwegian | 121 | 0.9% |
| Pennsylvania German | 60 | 0.4% |
| Polish | 188 | 1.3% |
| Portuguese | 24 | 0.2% |
| Puerto Rican | 94 | 0.7% |
| Russian | 20 | 0.1% |
| Scandinavian | 1 | 0.0% |
| Scotch-Irish | 123 | 0.9% |
| Scottish | 278 | 2.0% |
| Shoshone | 1 | 0.0% |
| Sri Lankan | 28 | 0.2% |
| Subsaharan African | 75 | 0.5% |
| Swedish | 44 | 0.3% |
| Swiss | 68 | 0.5% |
| Welsh | 45 | 0.3% | View All 41 Rows |
Immigrants in Trigg County
The most numerous immigrant groups reported in Trigg County came from Central America (113 | 0.8%), Latin America (113 | 0.8%), Mexico (100 | 0.7%), Europe (70 | 0.5%), and Germany (57 | 0.4%), together accounting for 3.2% of all Trigg County residents.
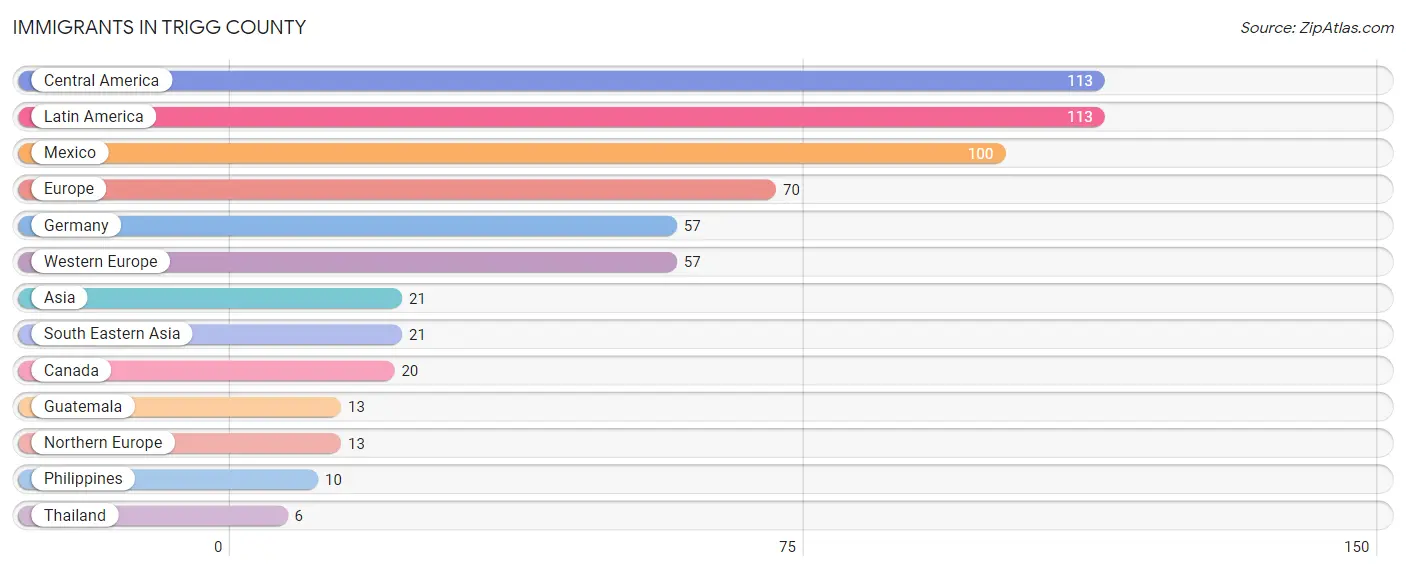
| Immigration Origin | # Population | % Population |
| Asia | 21 | 0.2% |
| Canada | 20 | 0.1% |
| Central America | 113 | 0.8% |
| Europe | 70 | 0.5% |
| Germany | 57 | 0.4% |
| Guatemala | 13 | 0.1% |
| Latin America | 113 | 0.8% |
| Mexico | 100 | 0.7% |
| Northern Europe | 13 | 0.1% |
| Philippines | 10 | 0.1% |
| South Eastern Asia | 21 | 0.2% |
| Thailand | 6 | 0.0% |
| Western Europe | 57 | 0.4% | View All 13 Rows |
Sex and Age in Trigg County
Sex and Age in Trigg County
The most populous age groups in Trigg County are 60 to 64 Years (664 | 9.4%) for men and 60 to 64 Years (712 | 10.0%) for women.
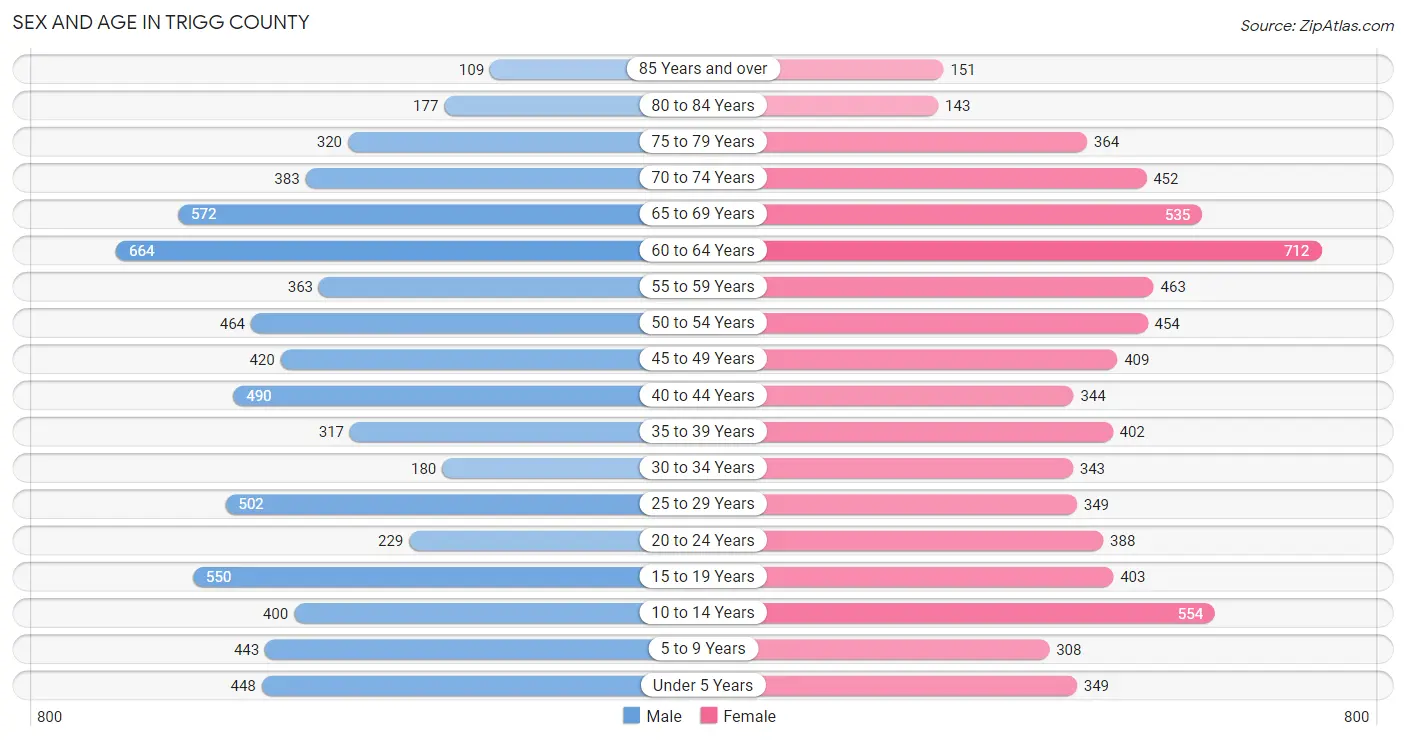
| Age Bracket | Male | Female |
| Under 5 Years | 448 (6.4%) | 349 (4.9%) |
| 5 to 9 Years | 443 (6.3%) | 308 (4.3%) |
| 10 to 14 Years | 400 (5.7%) | 554 (7.8%) |
| 15 to 19 Years | 550 (7.8%) | 403 (5.7%) |
| 20 to 24 Years | 229 (3.3%) | 388 (5.4%) |
| 25 to 29 Years | 502 (7.1%) | 349 (4.9%) |
| 30 to 34 Years | 180 (2.6%) | 343 (4.8%) |
| 35 to 39 Years | 317 (4.5%) | 402 (5.6%) |
| 40 to 44 Years | 490 (7.0%) | 344 (4.8%) |
| 45 to 49 Years | 420 (6.0%) | 409 (5.7%) |
| 50 to 54 Years | 464 (6.6%) | 454 (6.4%) |
| 55 to 59 Years | 363 (5.2%) | 463 (6.5%) |
| 60 to 64 Years | 664 (9.4%) | 712 (10.0%) |
| 65 to 69 Years | 572 (8.1%) | 535 (7.5%) |
| 70 to 74 Years | 383 (5.4%) | 452 (6.4%) |
| 75 to 79 Years | 320 (4.5%) | 364 (5.1%) |
| 80 to 84 Years | 177 (2.5%) | 143 (2.0%) |
| 85 Years and over | 109 (1.5%) | 151 (2.1%) |
| Total | 7,031 (100.0%) | 7,123 (100.0%) |
Families and Households in Trigg County
Median Family Size in Trigg County
The median family size in Trigg County is 3.01 persons per family, with married-couple families (3,016 | 77.2%) accounting for the largest median family size of 3.09 persons per family. On the other hand, single male/father families (251 | 6.4%) represent the smallest median family size with 2.63 persons per family.
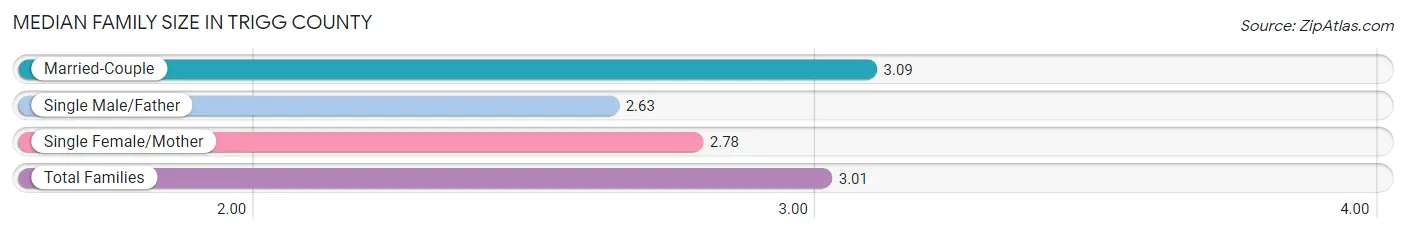
| Family Type | # Families | Family Size |
| Married-Couple | 3,016 (77.2%) | 3.09 |
| Single Male/Father | 251 (6.4%) | 2.63 |
| Single Female/Mother | 642 (16.4%) | 2.78 |
| Total Families | 3,909 (100.0%) | 3.01 |
Median Household Size in Trigg County
The median household size in Trigg County is 2.42 persons per household, with married-couple households (3,016 | 51.8%) accounting for the largest median household size of 3.14 persons per household. non-family households (1,909 | 32.8%) represent the smallest median household size with 1.10 persons per household.
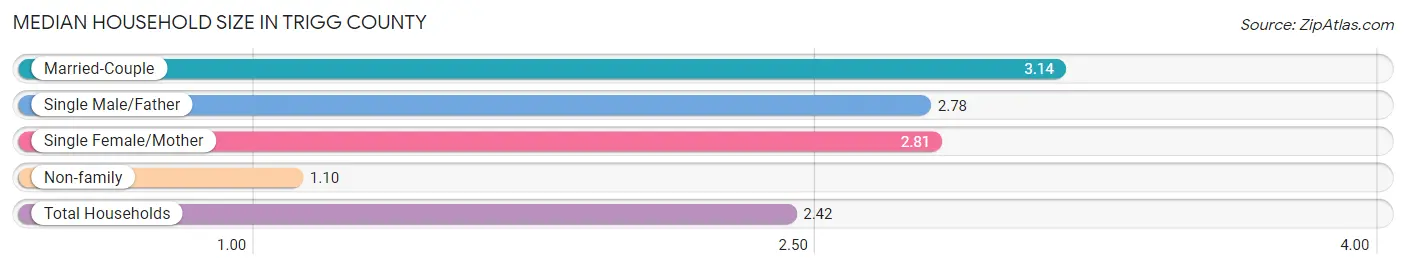
| Household Type | # Households | Household Size |
| Married-Couple | 3,016 (51.8%) | 3.14 |
| Single Male/Father | 251 (4.3%) | 2.78 |
| Single Female/Mother | 642 (11.0%) | 2.81 |
| Non-family | 1,909 (32.8%) | 1.10 |
| Total Households | 5,818 (100.0%) | 2.42 |
Household Size by Marriage Status in Trigg County
Out of a total of 5,818 households in Trigg County, 3,909 (67.2%) are family households, while 1,909 (32.8%) are nonfamily households. The most numerous type of family households are 2-person households, comprising 2,165, and the most common type of nonfamily households are 1-person households, comprising 1,711.
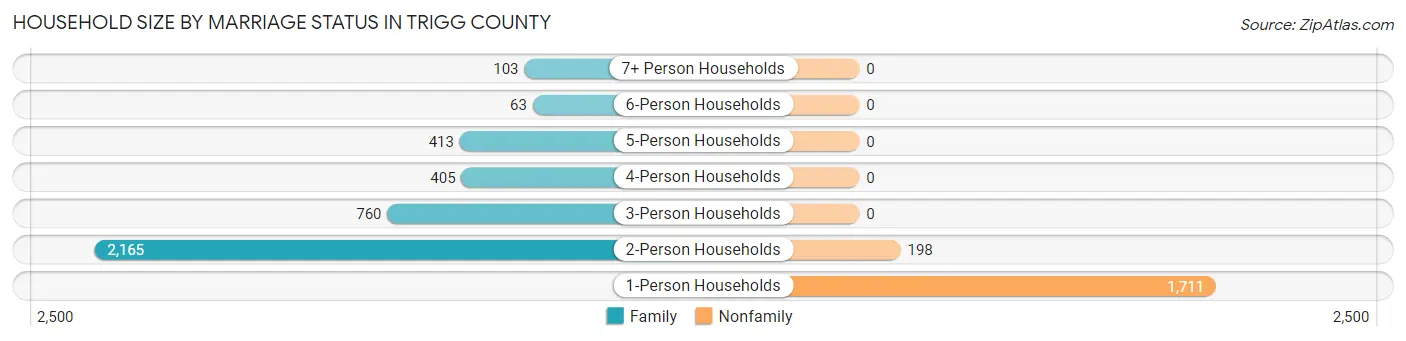
| Household Size | Family Households | Nonfamily Households |
| 1-Person Households | - | 1,711 (29.4%) |
| 2-Person Households | 2,165 (37.2%) | 198 (3.4%) |
| 3-Person Households | 760 (13.1%) | 0 (0.0%) |
| 4-Person Households | 405 (7.0%) | 0 (0.0%) |
| 5-Person Households | 413 (7.1%) | 0 (0.0%) |
| 6-Person Households | 63 (1.1%) | 0 (0.0%) |
| 7+ Person Households | 103 (1.8%) | 0 (0.0%) |
| Total | 3,909 (67.2%) | 1,909 (32.8%) |
Female Fertility in Trigg County
Fertility by Age in Trigg County
Average fertility rate in Trigg County is 56.0 births per 1,000 women. Women in the age bracket of 15 to 19 years have the highest fertility rate with 72.0 births per 1,000 women. Women in the age bracket of 20 to 34 years acount for 48.3% of all women with births.
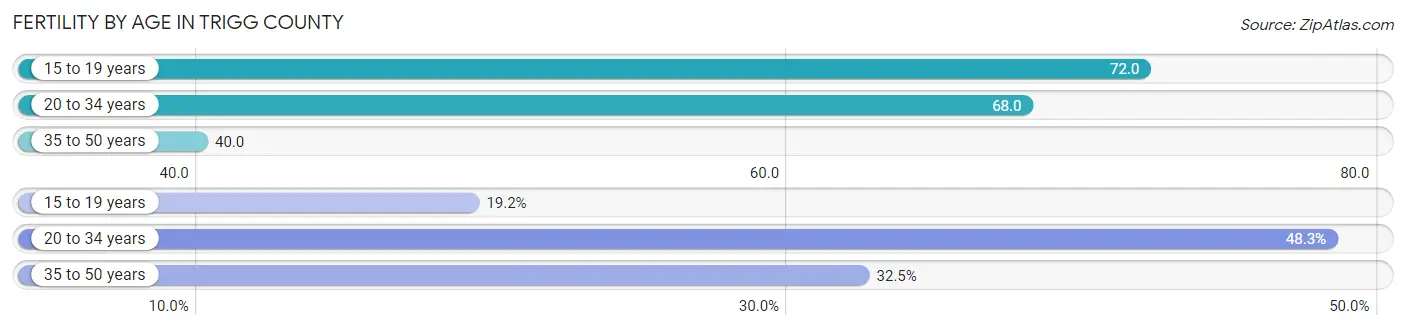
| Age Bracket | Women with Births | Births / 1,000 Women |
| 15 to 19 years | 29 (19.2%) | 72.0 |
| 20 to 34 years | 73 (48.3%) | 68.0 |
| 35 to 50 years | 49 (32.5%) | 40.0 |
| Total | 151 (100.0%) | 56.0 |
Fertility by Age by Marriage Status in Trigg County
76.2% of women with births (151) in Trigg County are married. The highest percentage of unmarried women with births falls into 15 to 19 years age bracket with 100.0% of them unmarried at the time of birth, while the lowest percentage of unmarried women with births belong to 35 to 50 years age bracket with 0.0% of them unmarried.
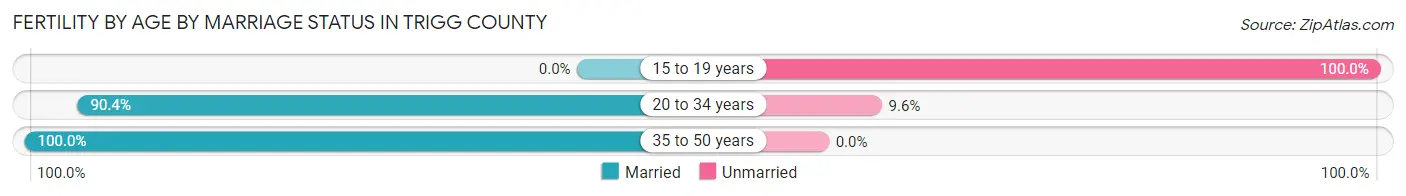
| Age Bracket | Married | Unmarried |
| 15 to 19 years | 0 (0.0%) | 29 (100.0%) |
| 20 to 34 years | 66 (90.4%) | 7 (9.6%) |
| 35 to 50 years | 49 (100.0%) | 0 (0.0%) |
| Total | 115 (76.2%) | 36 (23.8%) |
Fertility by Education in Trigg County
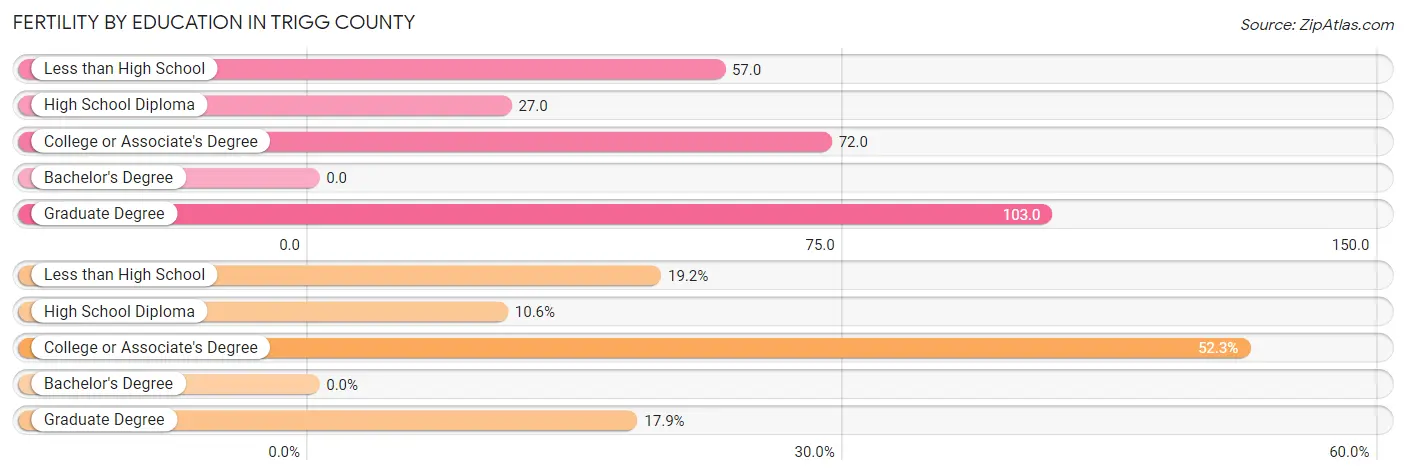
| Educational Attainment | Women with Births | Births / 1,000 Women |
| Less than High School | 29 (19.2%) | 57.0 |
| High School Diploma | 16 (10.6%) | 27.0 |
| College or Associate's Degree | 79 (52.3%) | 72.0 |
| Bachelor's Degree | 0 (0.0%) | 0.0 |
| Graduate Degree | 27 (17.9%) | 103.0 |
| Total | 151 (100.0%) | 56.0 |
Fertility by Education by Marriage Status in Trigg County
23.8% of women with births in Trigg County are unmarried. Women with the educational attainment of graduate degree are most likely to be married with 100.0% of them married at childbirth, while women with the educational attainment of less than high school are least likely to be married with 100.0% of them unmarried at childbirth.
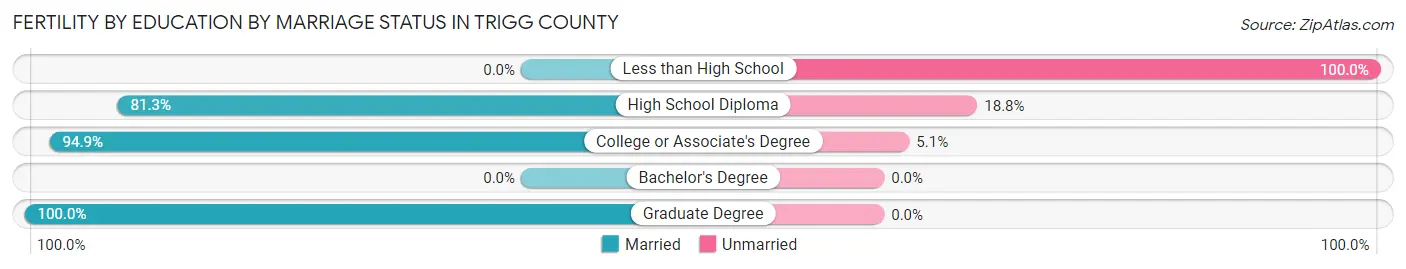
| Educational Attainment | Married | Unmarried |
| Less than High School | 0 (0.0%) | 29 (100.0%) |
| High School Diploma | 13 (81.2%) | 3 (18.8%) |
| College or Associate's Degree | 75 (94.9%) | 4 (5.1%) |
| Bachelor's Degree | 0 (0.0%) | 0 (0.0%) |
| Graduate Degree | 27 (100.0%) | 0 (0.0%) |
| Total | 115 (76.2%) | 36 (23.8%) |
Employment Characteristics in Trigg County
Employment by Class of Employer in Trigg County
Among the 5,676 employed individuals in Trigg County, private company employees (3,172 | 55.9%), self-employed (not incorporated) (547 | 9.6%), and state government employees (536 | 9.4%) make up the most common classes of employment.
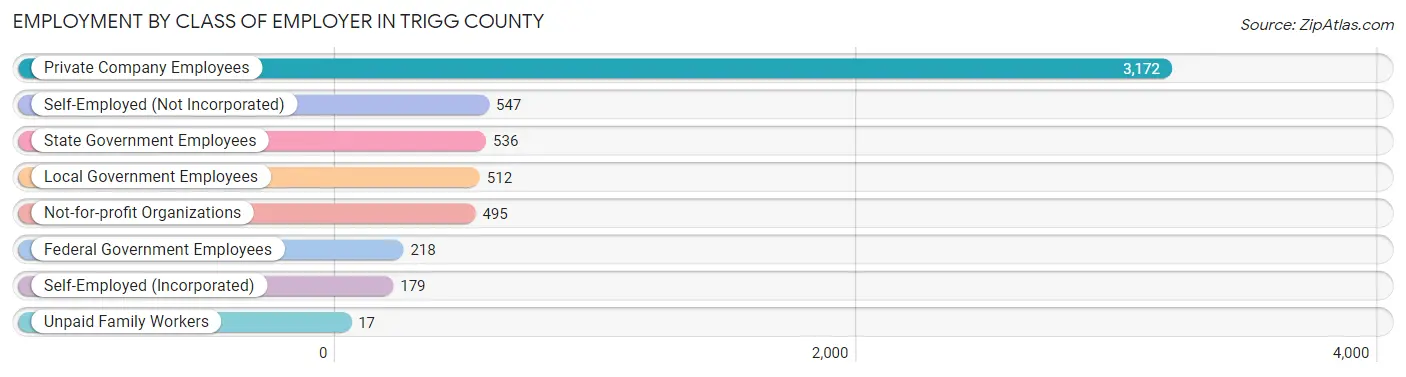
| Employer Class | # Employees | % Employees |
| Private Company Employees | 3,172 | 55.9% |
| Self-Employed (Incorporated) | 179 | 3.2% |
| Self-Employed (Not Incorporated) | 547 | 9.6% |
| Not-for-profit Organizations | 495 | 8.7% |
| Local Government Employees | 512 | 9.0% |
| State Government Employees | 536 | 9.4% |
| Federal Government Employees | 218 | 3.8% |
| Unpaid Family Workers | 17 | 0.3% |
| Total | 5,676 | 100.0% |
Employment Status by Age in Trigg County
According to the labor force statistics for Trigg County, out of the total population over 16 years of age (11,426), 52.8% or 6,033 individuals are in the labor force, with 4.0% or 241 of them unemployed. The age group with the highest labor force participation rate is 25 to 29 years, with 85.5% or 728 individuals in the labor force. Within the labor force, the 16 to 19 years age range has the highest percentage of unemployed individuals, with 13.7% or 54 of them being unemployed.
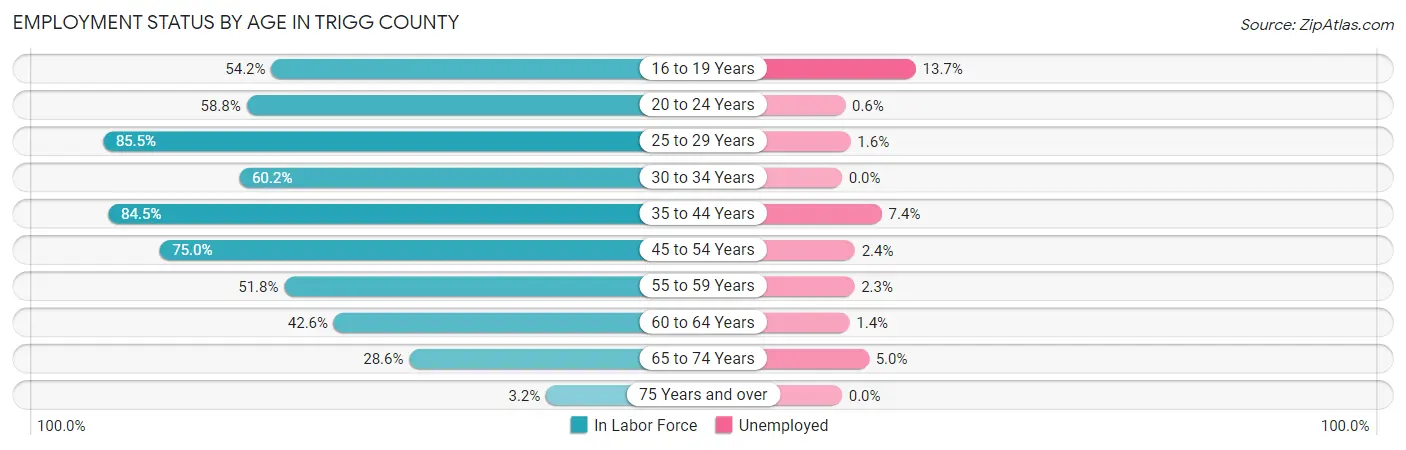
| Age Bracket | In Labor Force | Unemployed |
| 16 to 19 Years | 394 (54.2%) | 54 (13.7%) |
| 20 to 24 Years | 363 (58.8%) | 2 (0.6%) |
| 25 to 29 Years | 728 (85.5%) | 12 (1.6%) |
| 30 to 34 Years | 315 (60.2%) | 0 (0.0%) |
| 35 to 44 Years | 1,312 (84.5%) | 97 (7.4%) |
| 45 to 54 Years | 1,310 (75.0%) | 31 (2.4%) |
| 55 to 59 Years | 428 (51.8%) | 10 (2.3%) |
| 60 to 64 Years | 586 (42.6%) | 8 (1.4%) |
| 65 to 74 Years | 555 (28.6%) | 28 (5.0%) |
| 75 Years and over | 40 (3.2%) | 0 (0.0%) |
| Total | 6,033 (52.8%) | 241 (4.0%) |
Employment Status by Educational Attainment in Trigg County
According to labor force statistics for Trigg County, 68.1% of individuals (4,683) out of the total population between 25 and 64 years of age (6,876) are in the labor force, with 3.3% or 155 of them being unemployed. The group with the highest labor force participation rate are those with the educational attainment of college / associate degree, with 79.5% or 2,093 individuals in the labor force. Within the labor force, individuals with high school diploma education have the highest percentage of unemployment, with 7.3% or 82 of them being unemployed.
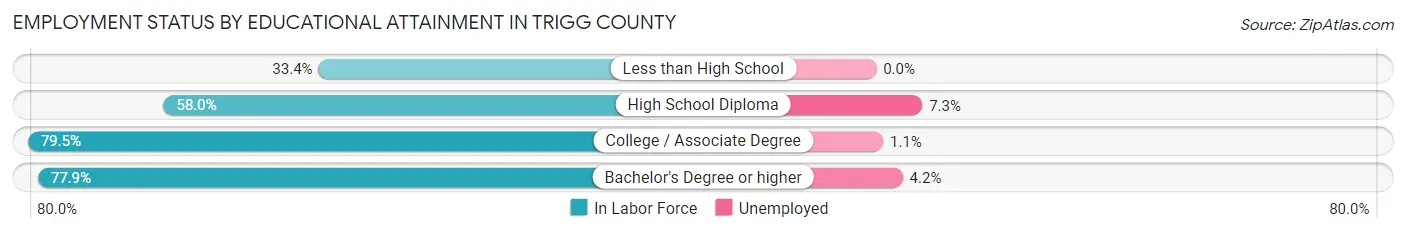
| Educational Attainment | In Labor Force | Unemployed |
| Less than High School | 250 (33.4%) | 0 (0.0%) |
| High School Diploma | 1,124 (58.0%) | 141 (7.3%) |
| College / Associate Degree | 2,093 (79.5%) | 29 (1.1%) |
| Bachelor's Degree or higher | 1,213 (77.9%) | 65 (4.2%) |
| Total | 4,683 (68.1%) | 227 (3.3%) |
Employment Occupations by Sex in Trigg County
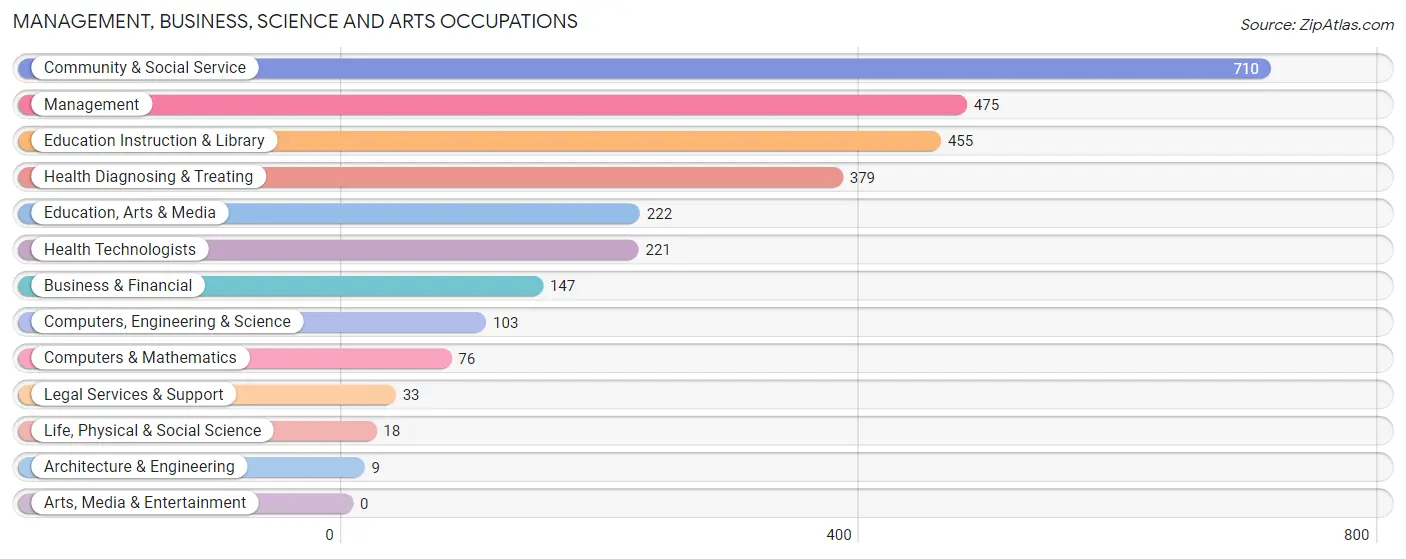
Management, Business, Science and Arts Occupations
The most common Management, Business, Science and Arts occupations in Trigg County are Community & Social Service (710 | 12.4%), Management (475 | 8.3%), Education Instruction & Library (455 | 7.9%), Health Diagnosing & Treating (379 | 6.6%), and Education, Arts & Media (222 | 3.9%).
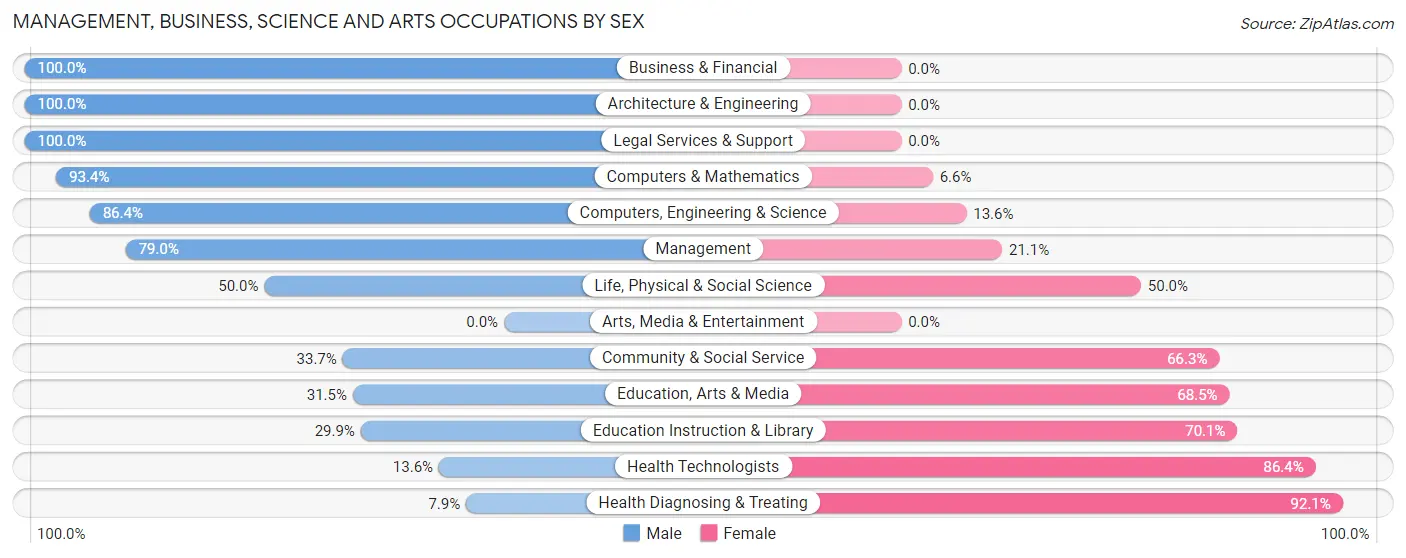
Management, Business, Science and Arts Occupations by Sex
Within the Management, Business, Science and Arts occupations in Trigg County, the most male-oriented occupations are Business & Financial (100.0%), Architecture & Engineering (100.0%), and Legal Services & Support (100.0%), while the most female-oriented occupations are Health Diagnosing & Treating (92.1%), Health Technologists (86.4%), and Education Instruction & Library (70.1%).
| Occupation | Male | Female |
| Management | 375 (78.9%) | 100 (21.0%) |
| Business & Financial | 147 (100.0%) | 0 (0.0%) |
| Computers, Engineering & Science | 89 (86.4%) | 14 (13.6%) |
| Computers & Mathematics | 71 (93.4%) | 5 (6.6%) |
| Architecture & Engineering | 9 (100.0%) | 0 (0.0%) |
| Life, Physical & Social Science | 9 (50.0%) | 9 (50.0%) |
| Community & Social Service | 239 (33.7%) | 471 (66.3%) |
| Education, Arts & Media | 70 (31.5%) | 152 (68.5%) |
| Legal Services & Support | 33 (100.0%) | 0 (0.0%) |
| Education Instruction & Library | 136 (29.9%) | 319 (70.1%) |
| Arts, Media & Entertainment | 0 (0.0%) | 0 (0.0%) |
| Health Diagnosing & Treating | 30 (7.9%) | 349 (92.1%) |
| Health Technologists | 30 (13.6%) | 191 (86.4%) |
| Total (Category) | 880 (48.5%) | 934 (51.5%) |
| Total (Overall) | 3,043 (53.0%) | 2,700 (47.0%) |
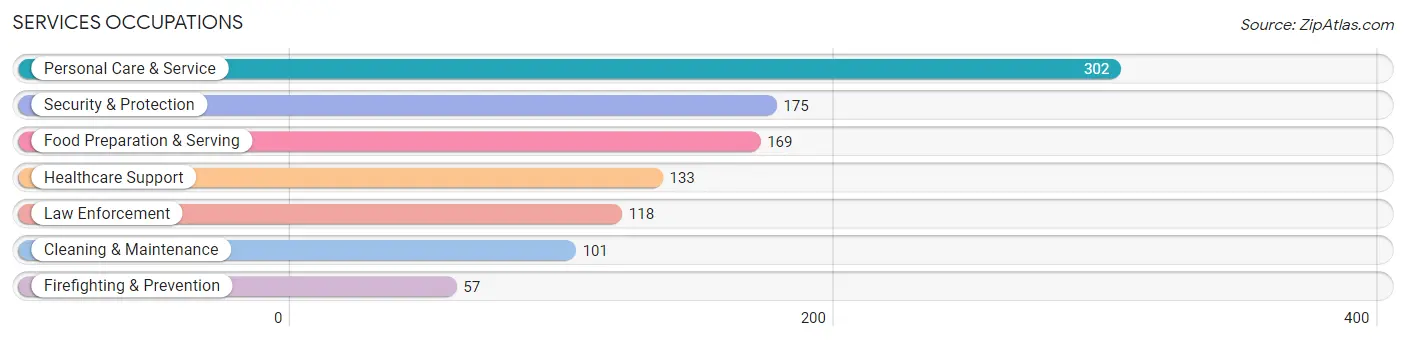
Services Occupations
The most common Services occupations in Trigg County are Personal Care & Service (302 | 5.3%), Security & Protection (175 | 3.0%), Food Preparation & Serving (169 | 2.9%), Healthcare Support (133 | 2.3%), and Law Enforcement (118 | 2.1%).
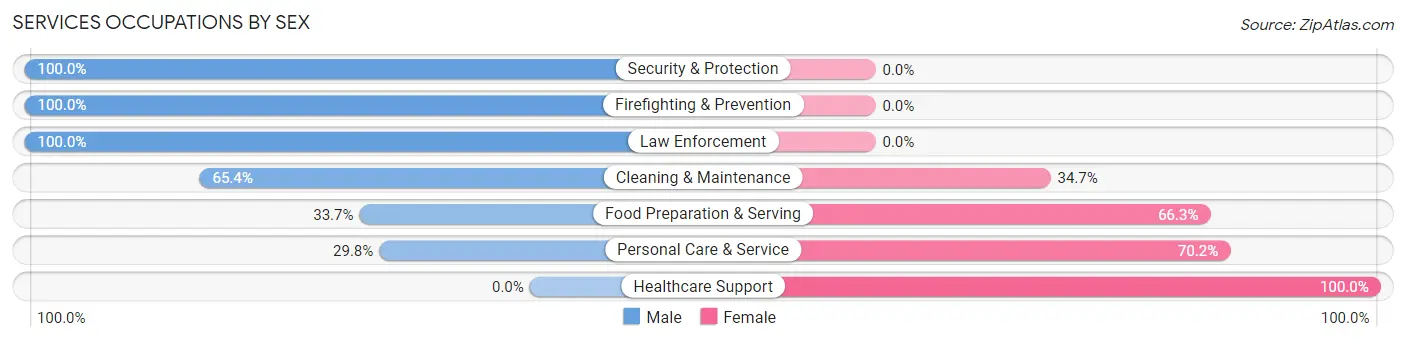
Services Occupations by Sex
Within the Services occupations in Trigg County, the most male-oriented occupations are Security & Protection (100.0%), Firefighting & Prevention (100.0%), and Law Enforcement (100.0%), while the most female-oriented occupations are Healthcare Support (100.0%), Personal Care & Service (70.2%), and Food Preparation & Serving (66.3%).
| Occupation | Male | Female |
| Healthcare Support | 0 (0.0%) | 133 (100.0%) |
| Security & Protection | 175 (100.0%) | 0 (0.0%) |
| Firefighting & Prevention | 57 (100.0%) | 0 (0.0%) |
| Law Enforcement | 118 (100.0%) | 0 (0.0%) |
| Food Preparation & Serving | 57 (33.7%) | 112 (66.3%) |
| Cleaning & Maintenance | 66 (65.3%) | 35 (34.6%) |
| Personal Care & Service | 90 (29.8%) | 212 (70.2%) |
| Total (Category) | 388 (44.1%) | 492 (55.9%) |
| Total (Overall) | 3,043 (53.0%) | 2,700 (47.0%) |
Sales and Office Occupations
The most common Sales and Office occupations in Trigg County are Office & Administration (486 | 8.5%), and Sales & Related (430 | 7.5%).
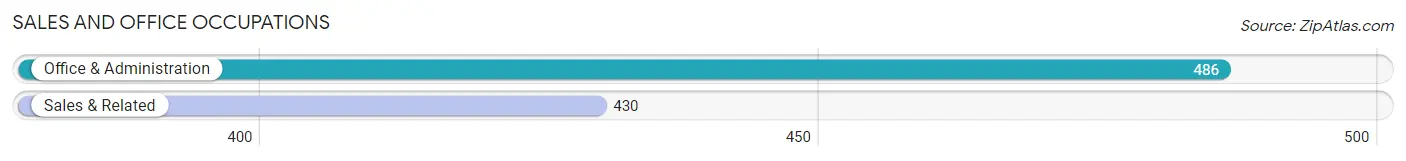
Sales and Office Occupations by Sex
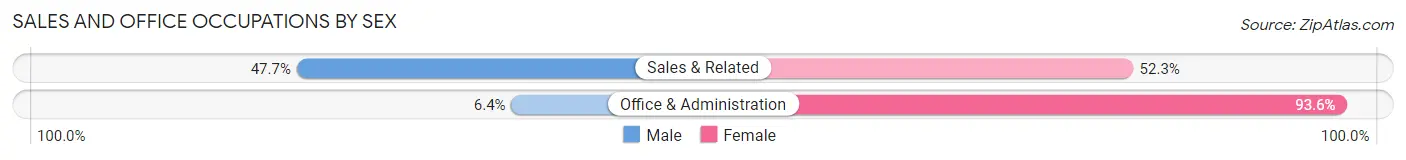
| Occupation | Male | Female |
| Sales & Related | 205 (47.7%) | 225 (52.3%) |
| Office & Administration | 31 (6.4%) | 455 (93.6%) |
| Total (Category) | 236 (25.8%) | 680 (74.2%) |
| Total (Overall) | 3,043 (53.0%) | 2,700 (47.0%) |
Natural Resources, Construction and Maintenance Occupations
The most common Natural Resources, Construction and Maintenance occupations in Trigg County are Installation, Maintenance & Repair (353 | 6.1%), Construction & Extraction (287 | 5.0%), and Farming, Fishing & Forestry (132 | 2.3%).
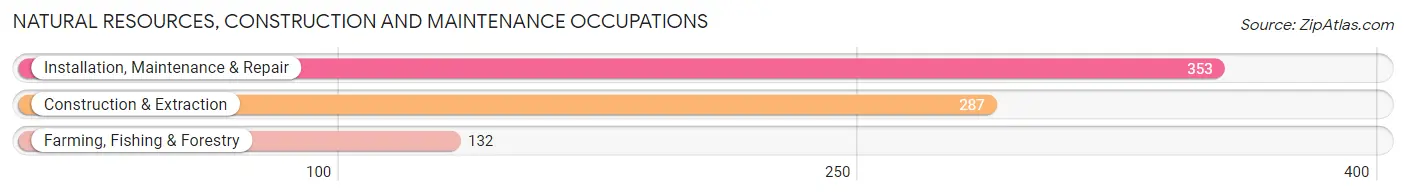
Natural Resources, Construction and Maintenance Occupations by Sex
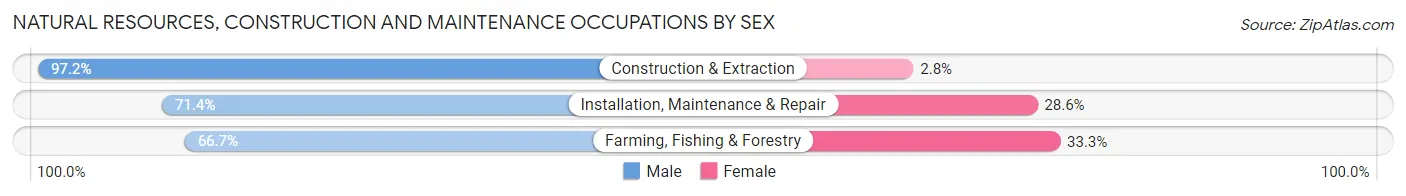
| Occupation | Male | Female |
| Farming, Fishing & Forestry | 88 (66.7%) | 44 (33.3%) |
| Construction & Extraction | 279 (97.2%) | 8 (2.8%) |
| Installation, Maintenance & Repair | 252 (71.4%) | 101 (28.6%) |
| Total (Category) | 619 (80.2%) | 153 (19.8%) |
| Total (Overall) | 3,043 (53.0%) | 2,700 (47.0%) |
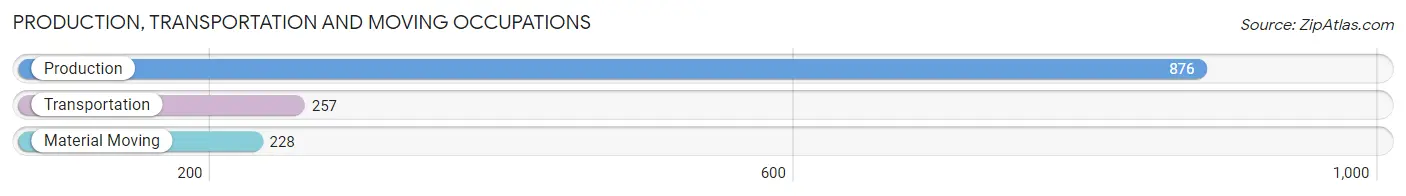
Production, Transportation and Moving Occupations
The most common Production, Transportation and Moving occupations in Trigg County are Production (876 | 15.2%), Transportation (257 | 4.5%), and Material Moving (228 | 4.0%).
Production, Transportation and Moving Occupations by Sex
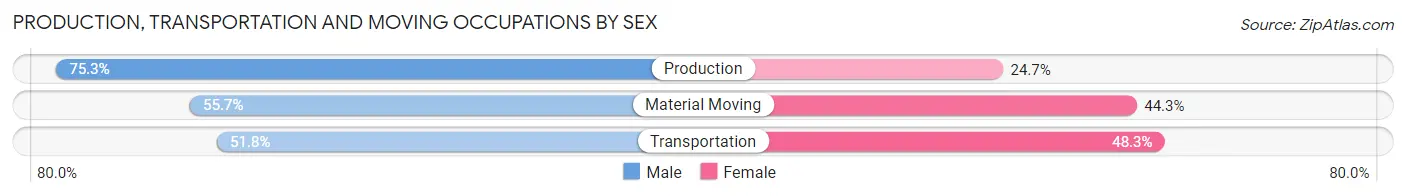
| Occupation | Male | Female |
| Production | 660 (75.3%) | 216 (24.7%) |
| Transportation | 133 (51.7%) | 124 (48.2%) |
| Material Moving | 127 (55.7%) | 101 (44.3%) |
| Total (Category) | 920 (67.6%) | 441 (32.4%) |
| Total (Overall) | 3,043 (53.0%) | 2,700 (47.0%) |
Employment Industries by Sex in Trigg County
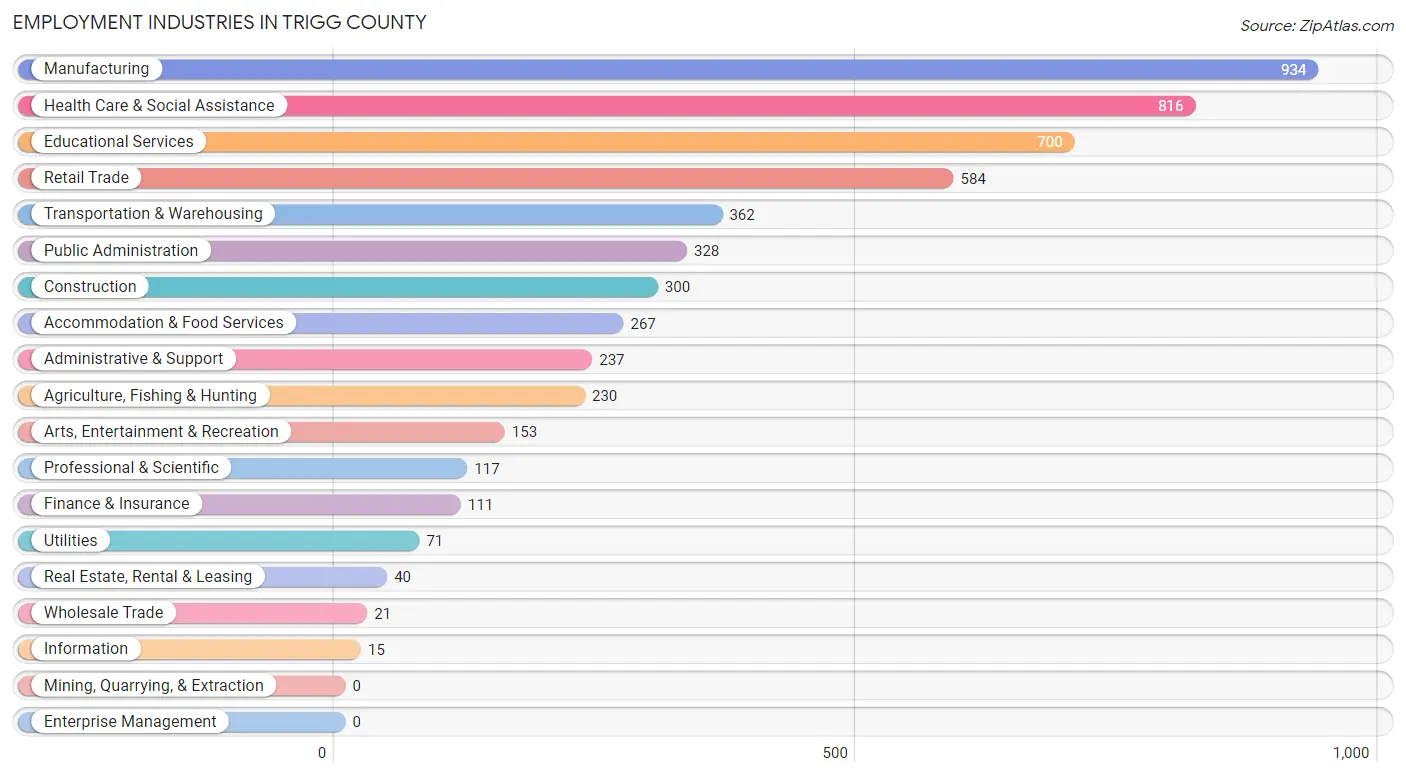
Employment Industries in Trigg County
The major employment industries in Trigg County include Manufacturing (934 | 16.3%), Health Care & Social Assistance (816 | 14.2%), Educational Services (700 | 12.2%), Retail Trade (584 | 10.2%), and Transportation & Warehousing (362 | 6.3%).
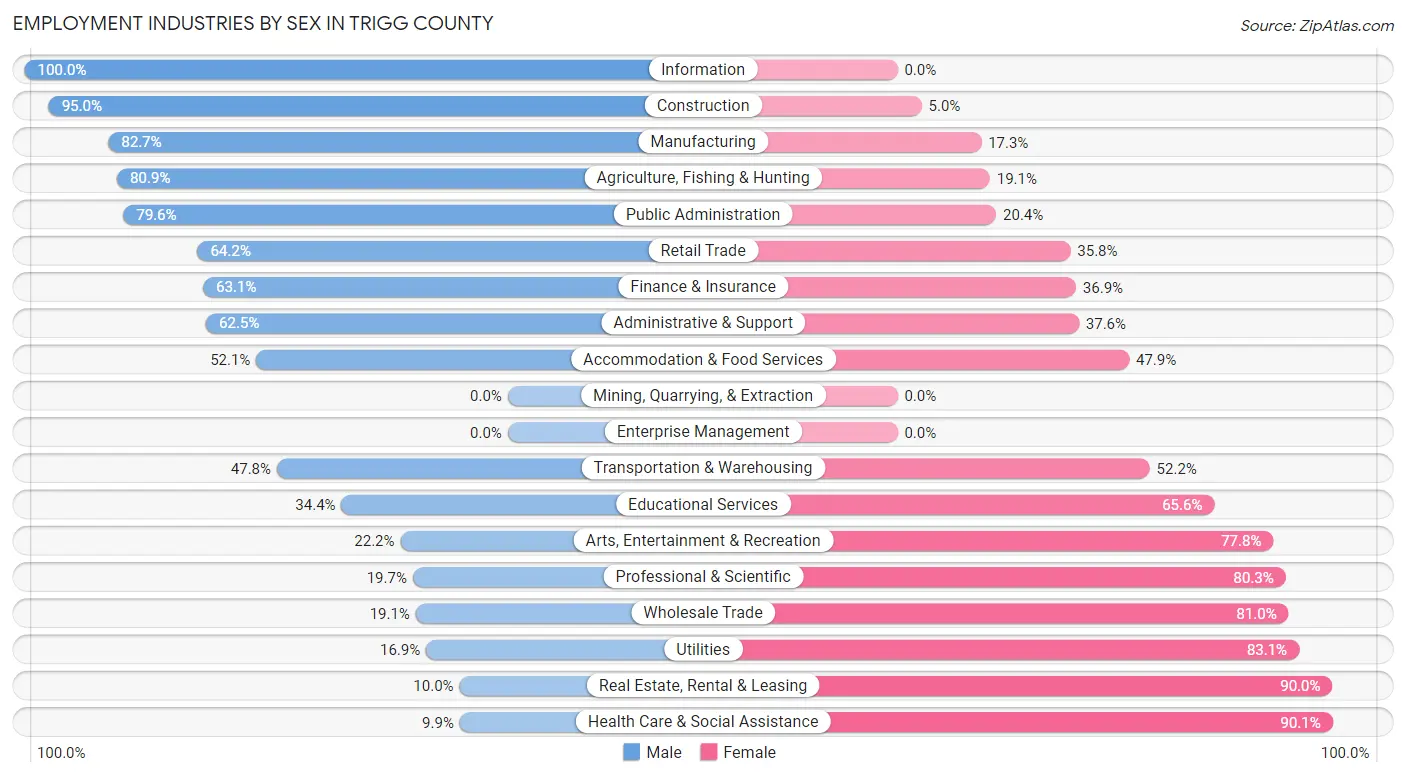
Employment Industries by Sex in Trigg County
The Trigg County industries that see more men than women are Information (100.0%), Construction (95.0%), and Manufacturing (82.7%), whereas the industries that tend to have a higher number of women are Health Care & Social Assistance (90.1%), Real Estate, Rental & Leasing (90.0%), and Utilities (83.1%).
| Industry | Male | Female |
| Agriculture, Fishing & Hunting | 186 (80.9%) | 44 (19.1%) |
| Mining, Quarrying, & Extraction | 0 (0.0%) | 0 (0.0%) |
| Construction | 285 (95.0%) | 15 (5.0%) |
| Manufacturing | 772 (82.7%) | 162 (17.3%) |
| Wholesale Trade | 4 (19.1%) | 17 (80.9%) |
| Retail Trade | 375 (64.2%) | 209 (35.8%) |
| Transportation & Warehousing | 173 (47.8%) | 189 (52.2%) |
| Utilities | 12 (16.9%) | 59 (83.1%) |
| Information | 15 (100.0%) | 0 (0.0%) |
| Finance & Insurance | 70 (63.1%) | 41 (36.9%) |
| Real Estate, Rental & Leasing | 4 (10.0%) | 36 (90.0%) |
| Professional & Scientific | 23 (19.7%) | 94 (80.3%) |
| Enterprise Management | 0 (0.0%) | 0 (0.0%) |
| Administrative & Support | 148 (62.5%) | 89 (37.6%) |
| Educational Services | 241 (34.4%) | 459 (65.6%) |
| Health Care & Social Assistance | 81 (9.9%) | 735 (90.1%) |
| Arts, Entertainment & Recreation | 34 (22.2%) | 119 (77.8%) |
| Accommodation & Food Services | 139 (52.1%) | 128 (47.9%) |
| Public Administration | 261 (79.6%) | 67 (20.4%) |
| Total | 3,043 (53.0%) | 2,700 (47.0%) |
Education in Trigg County
School Enrollment in Trigg County
The most common levels of schooling among the 2,709 students in Trigg County are middle school (756 | 27.9%), high school (642 | 23.7%), and elementary school (602 | 22.2%).
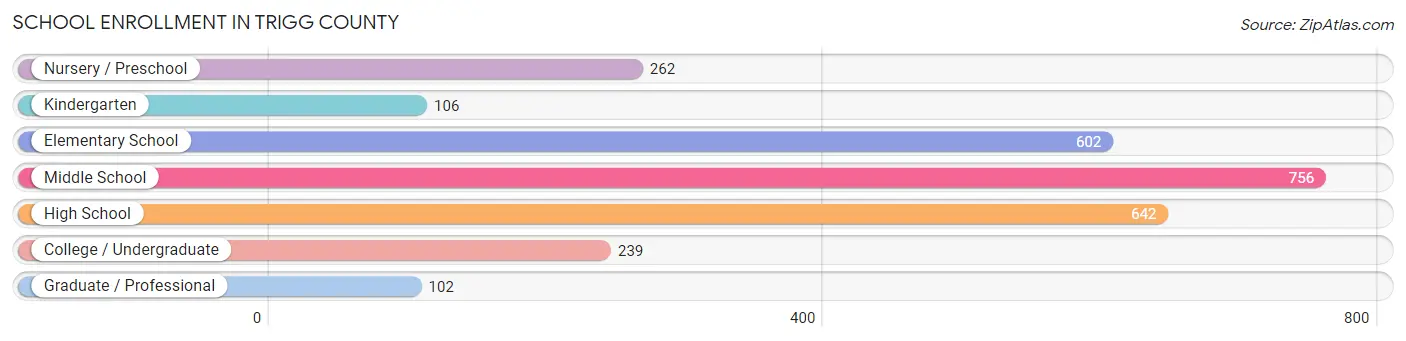
| School Level | # Students | % Students |
| Nursery / Preschool | 262 | 9.7% |
| Kindergarten | 106 | 3.9% |
| Elementary School | 602 | 22.2% |
| Middle School | 756 | 27.9% |
| High School | 642 | 23.7% |
| College / Undergraduate | 239 | 8.8% |
| Graduate / Professional | 102 | 3.8% |
| Total | 2,709 | 100.0% |
School Enrollment by Age by Funding Source in Trigg County
Out of a total of 2,709 students who are enrolled in schools in Trigg County, 469 (17.3%) attend a private institution, while the remaining 2,240 (82.7%) are enrolled in public schools. The age group of 3 to 4 year olds has the highest likelihood of being enrolled in private schools, with 57 (39.3% in the age bracket) enrolled. Conversely, the age group of 15 to 17 year olds has the lowest likelihood of being enrolled in a private school, with 467 (93.2% in the age bracket) attending a public institution.
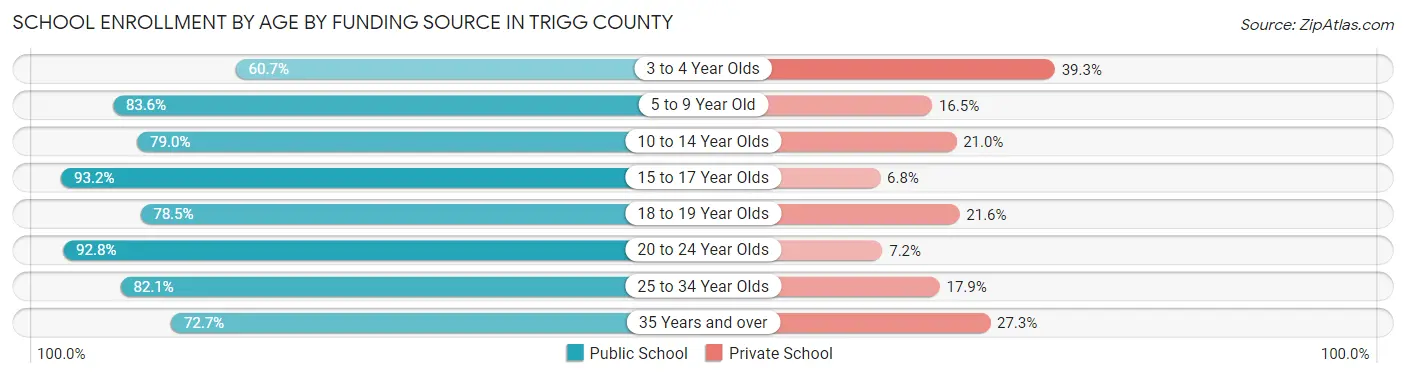
| Age Bracket | Public School | Private School |
| 3 to 4 Year Olds | 88 (60.7%) | 57 (39.3%) |
| 5 to 9 Year Old | 589 (83.6%) | 116 (16.5%) |
| 10 to 14 Year Olds | 709 (79.0%) | 188 (21.0%) |
| 15 to 17 Year Olds | 467 (93.2%) | 34 (6.8%) |
| 18 to 19 Year Olds | 91 (78.4%) | 25 (21.5%) |
| 20 to 24 Year Olds | 155 (92.8%) | 12 (7.2%) |
| 25 to 34 Year Olds | 92 (82.1%) | 20 (17.9%) |
| 35 Years and over | 48 (72.7%) | 18 (27.3%) |
| Total | 2,240 (82.7%) | 469 (17.3%) |
Educational Attainment by Field of Study in Trigg County
Education (734 | 33.8%), business (318 | 14.6%), science & technology (278 | 12.8%), arts & humanities (208 | 9.6%), and bio, nature & agricultural (199 | 9.2%) are the most common fields of study among 2,171 individuals in Trigg County who have obtained a bachelor's degree or higher.
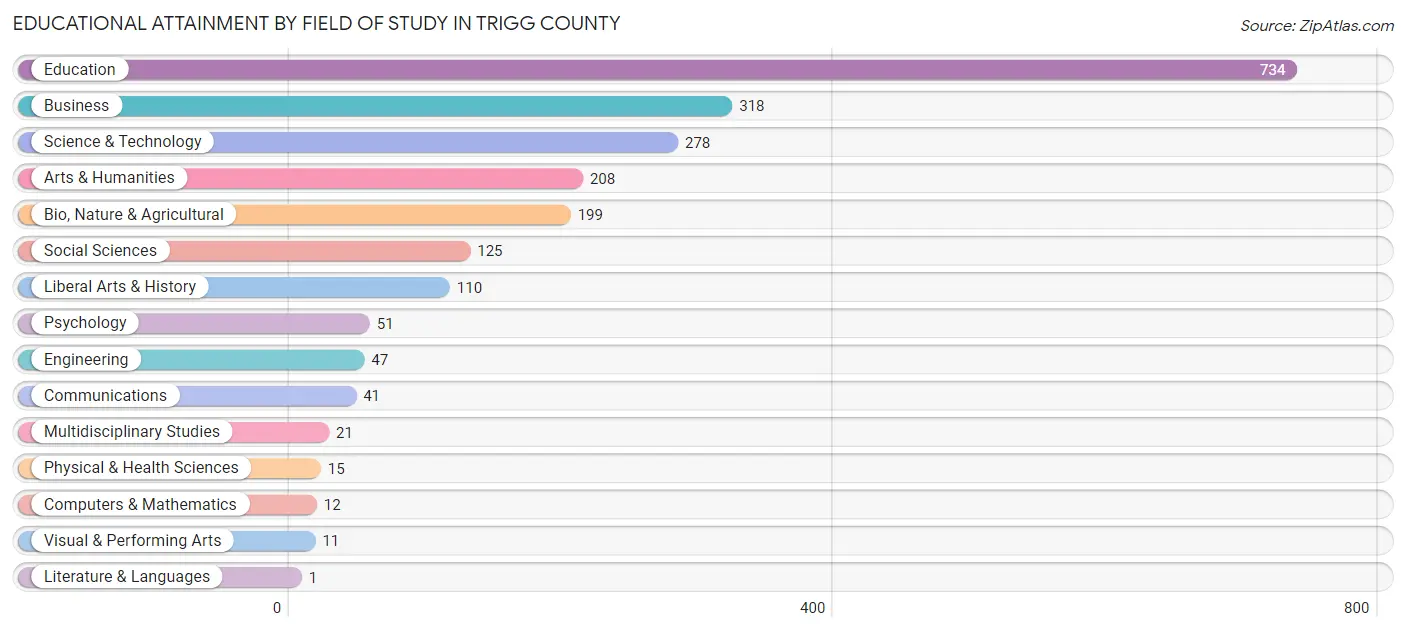
| Field of Study | # Graduates | % Graduates |
| Computers & Mathematics | 12 | 0.5% |
| Bio, Nature & Agricultural | 199 | 9.2% |
| Physical & Health Sciences | 15 | 0.7% |
| Psychology | 51 | 2.4% |
| Social Sciences | 125 | 5.8% |
| Engineering | 47 | 2.2% |
| Multidisciplinary Studies | 21 | 1.0% |
| Science & Technology | 278 | 12.8% |
| Business | 318 | 14.6% |
| Education | 734 | 33.8% |
| Literature & Languages | 1 | 0.1% |
| Liberal Arts & History | 110 | 5.1% |
| Visual & Performing Arts | 11 | 0.5% |
| Communications | 41 | 1.9% |
| Arts & Humanities | 208 | 9.6% |
| Total | 2,171 | 100.0% |
Transportation & Commute in Trigg County
Vehicle Availability by Sex in Trigg County
The most prevalent vehicle ownership categories in Trigg County are males with 3 vehicles (1,028, accounting for 34.5%) and females with 3 vehicles (823, making up 38.6%).
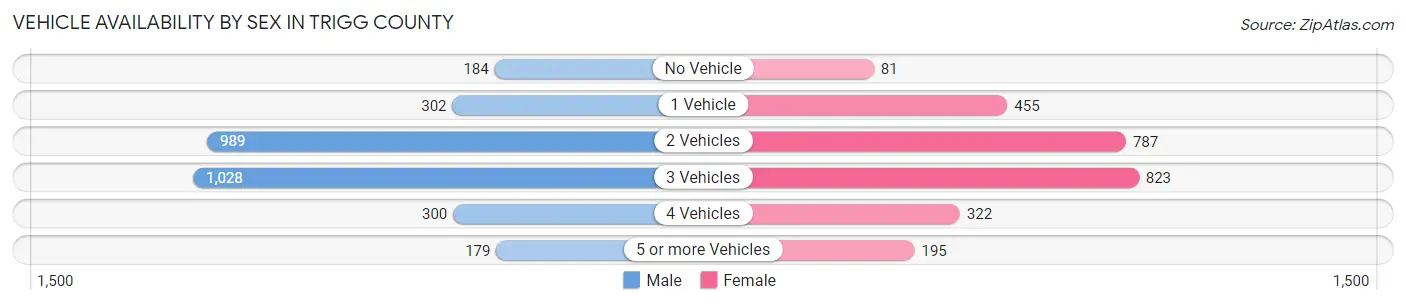
| Vehicles Available | Male | Female |
| No Vehicle | 184 (6.2%) | 81 (3.0%) |
| 1 Vehicle | 302 (10.1%) | 455 (17.1%) |
| 2 Vehicles | 989 (33.2%) | 787 (29.5%) |
| 3 Vehicles | 1,028 (34.5%) | 823 (30.9%) |
| 4 Vehicles | 300 (10.1%) | 322 (12.1%) |
| 5 or more Vehicles | 179 (6.0%) | 195 (7.3%) |
| Total | 2,982 (100.0%) | 2,663 (100.0%) |
Commute Time in Trigg County
The most frequently occuring commute durations in Trigg County are 30 to 34 minutes (1,005 commuters, 19.2%), 15 to 19 minutes (691 commuters, 13.2%), and 20 to 24 minutes (620 commuters, 11.9%).
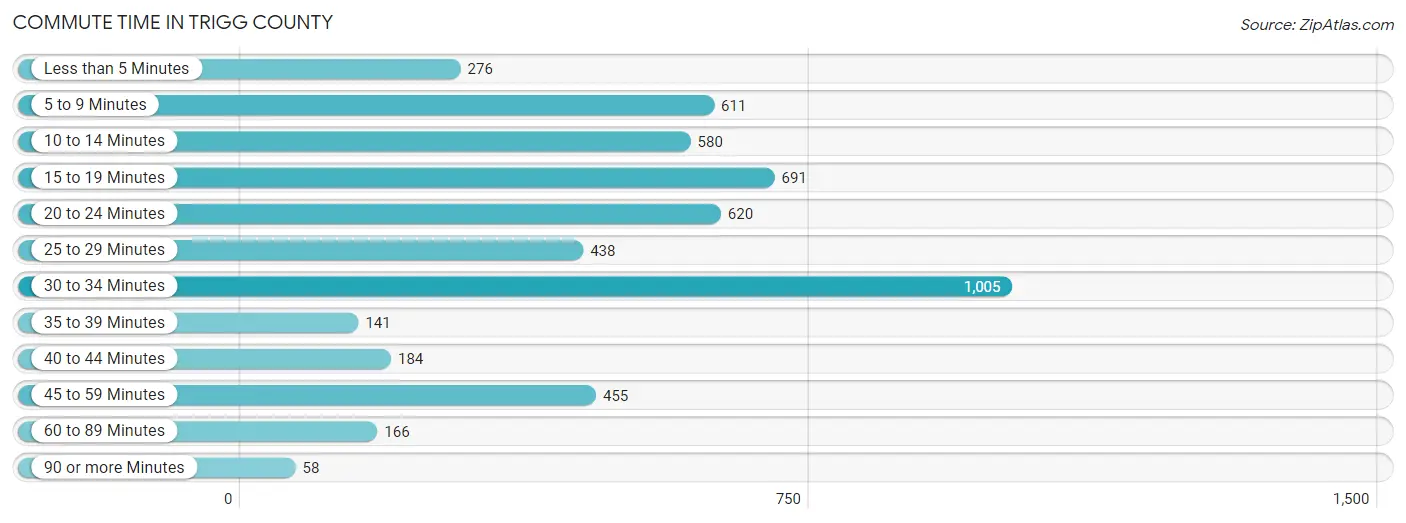
| Commute Time | # Commuters | % Commuters |
| Less than 5 Minutes | 276 | 5.3% |
| 5 to 9 Minutes | 611 | 11.7% |
| 10 to 14 Minutes | 580 | 11.1% |
| 15 to 19 Minutes | 691 | 13.2% |
| 20 to 24 Minutes | 620 | 11.9% |
| 25 to 29 Minutes | 438 | 8.4% |
| 30 to 34 Minutes | 1,005 | 19.2% |
| 35 to 39 Minutes | 141 | 2.7% |
| 40 to 44 Minutes | 184 | 3.5% |
| 45 to 59 Minutes | 455 | 8.7% |
| 60 to 89 Minutes | 166 | 3.2% |
| 90 or more Minutes | 58 | 1.1% |
Commute Time by Sex in Trigg County
The most common commute times in Trigg County are 30 to 34 minutes (539 commuters, 19.2%) for males and 30 to 34 minutes (466 commuters, 19.3%) for females.
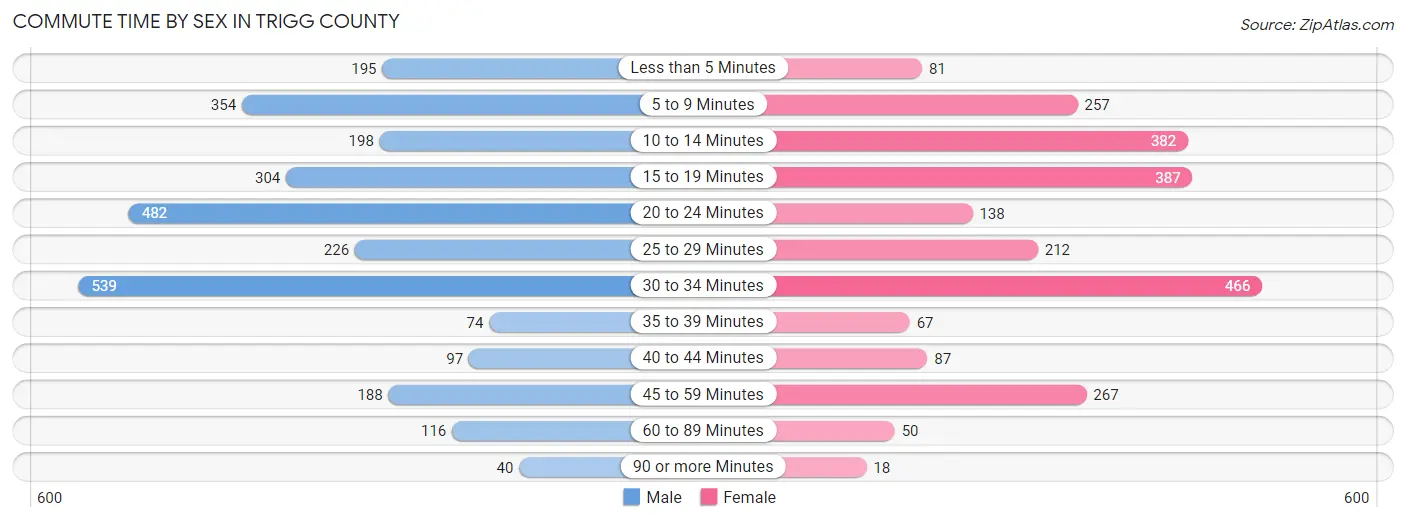
| Commute Time | Male | Female |
| Less than 5 Minutes | 195 (6.9%) | 81 (3.4%) |
| 5 to 9 Minutes | 354 (12.6%) | 257 (10.7%) |
| 10 to 14 Minutes | 198 (7.0%) | 382 (15.8%) |
| 15 to 19 Minutes | 304 (10.8%) | 387 (16.0%) |
| 20 to 24 Minutes | 482 (17.1%) | 138 (5.7%) |
| 25 to 29 Minutes | 226 (8.0%) | 212 (8.8%) |
| 30 to 34 Minutes | 539 (19.2%) | 466 (19.3%) |
| 35 to 39 Minutes | 74 (2.6%) | 67 (2.8%) |
| 40 to 44 Minutes | 97 (3.5%) | 87 (3.6%) |
| 45 to 59 Minutes | 188 (6.7%) | 267 (11.1%) |
| 60 to 89 Minutes | 116 (4.1%) | 50 (2.1%) |
| 90 or more Minutes | 40 (1.4%) | 18 (0.7%) |
Time of Departure to Work by Sex in Trigg County
The most frequent times of departure to work in Trigg County are 6:00 AM to 6:29 AM (481, 17.1%) for males and 7:30 AM to 7:59 AM (517, 21.4%) for females.
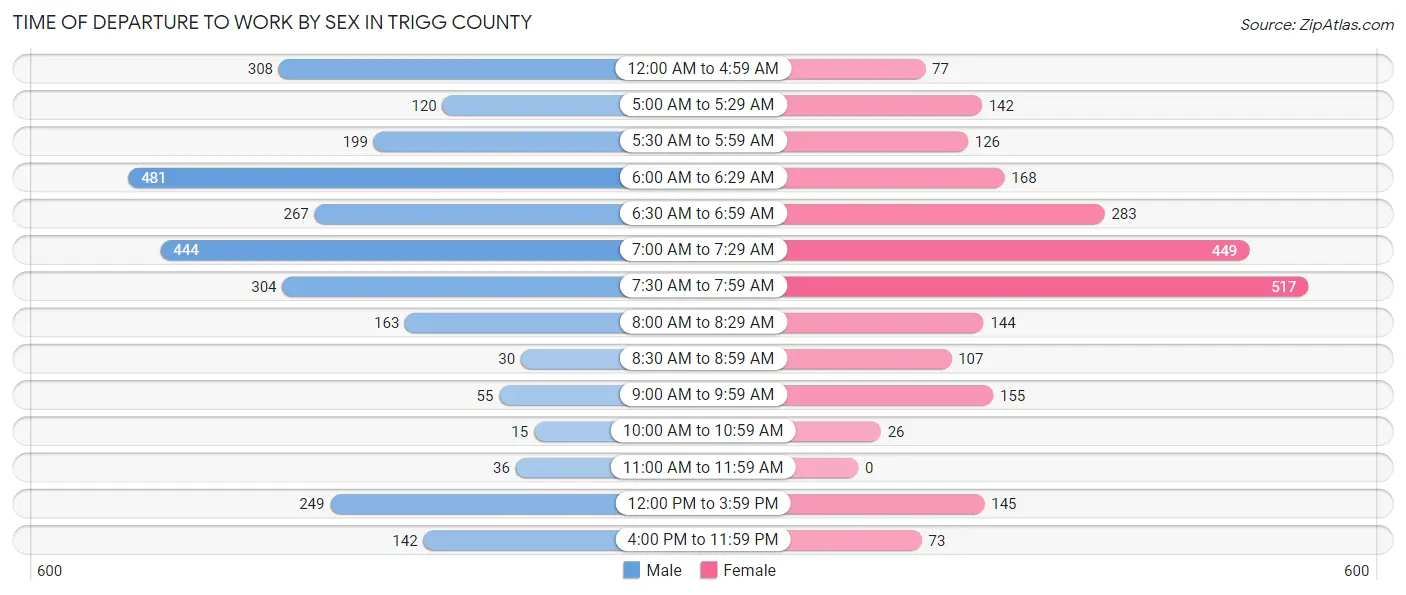
| Time of Departure | Male | Female |
| 12:00 AM to 4:59 AM | 308 (11.0%) | 77 (3.2%) |
| 5:00 AM to 5:29 AM | 120 (4.3%) | 142 (5.9%) |
| 5:30 AM to 5:59 AM | 199 (7.1%) | 126 (5.2%) |
| 6:00 AM to 6:29 AM | 481 (17.1%) | 168 (7.0%) |
| 6:30 AM to 6:59 AM | 267 (9.5%) | 283 (11.7%) |
| 7:00 AM to 7:29 AM | 444 (15.8%) | 449 (18.6%) |
| 7:30 AM to 7:59 AM | 304 (10.8%) | 517 (21.4%) |
| 8:00 AM to 8:29 AM | 163 (5.8%) | 144 (6.0%) |
| 8:30 AM to 8:59 AM | 30 (1.1%) | 107 (4.4%) |
| 9:00 AM to 9:59 AM | 55 (2.0%) | 155 (6.4%) |
| 10:00 AM to 10:59 AM | 15 (0.5%) | 26 (1.1%) |
| 11:00 AM to 11:59 AM | 36 (1.3%) | 0 (0.0%) |
| 12:00 PM to 3:59 PM | 249 (8.8%) | 145 (6.0%) |
| 4:00 PM to 11:59 PM | 142 (5.1%) | 73 (3.0%) |
| Total | 2,813 (100.0%) | 2,412 (100.0%) |
Housing Occupancy in Trigg County
Occupancy by Ownership in Trigg County
Of the total 5,818 dwellings in Trigg County, owner-occupied units account for 4,575 (78.6%), while renter-occupied units make up 1,243 (21.4%).
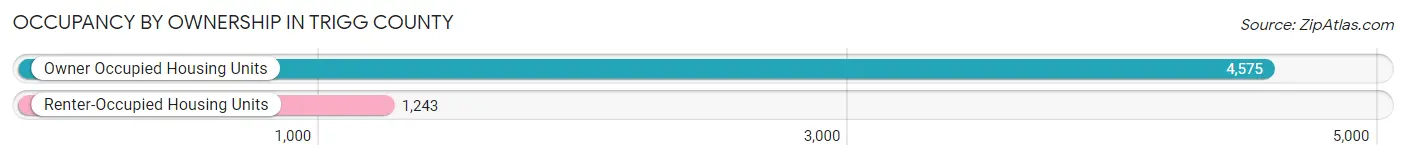
| Occupancy | # Housing Units | % Housing Units |
| Owner Occupied Housing Units | 4,575 | 78.6% |
| Renter-Occupied Housing Units | 1,243 | 21.4% |
| Total Occupied Housing Units | 5,818 | 100.0% |
Occupancy by Household Size in Trigg County
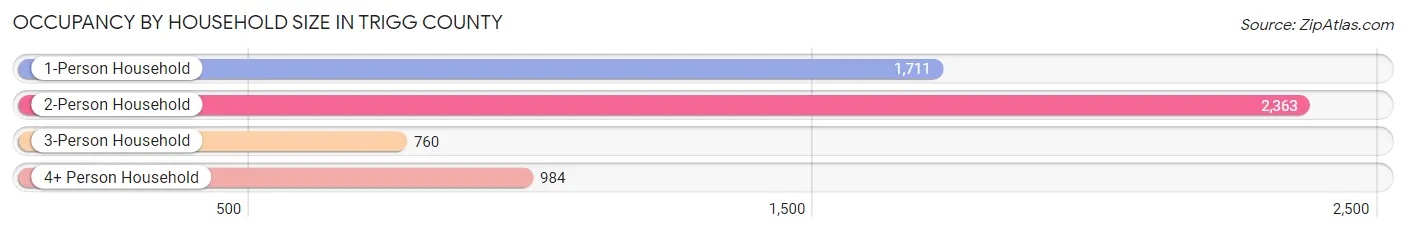
| Household Size | # Housing Units | % Housing Units |
| 1-Person Household | 1,711 | 29.4% |
| 2-Person Household | 2,363 | 40.6% |
| 3-Person Household | 760 | 13.1% |
| 4+ Person Household | 984 | 16.9% |
| Total Housing Units | 5,818 | 100.0% |
Occupancy by Ownership by Household Size in Trigg County
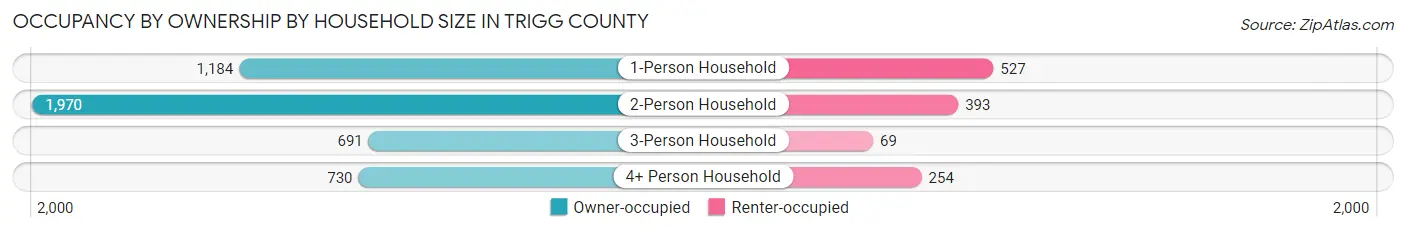
| Household Size | Owner-occupied | Renter-occupied |
| 1-Person Household | 1,184 (69.2%) | 527 (30.8%) |
| 2-Person Household | 1,970 (83.4%) | 393 (16.6%) |
| 3-Person Household | 691 (90.9%) | 69 (9.1%) |
| 4+ Person Household | 730 (74.2%) | 254 (25.8%) |
| Total Housing Units | 4,575 (78.6%) | 1,243 (21.4%) |
Occupancy by Educational Attainment in Trigg County
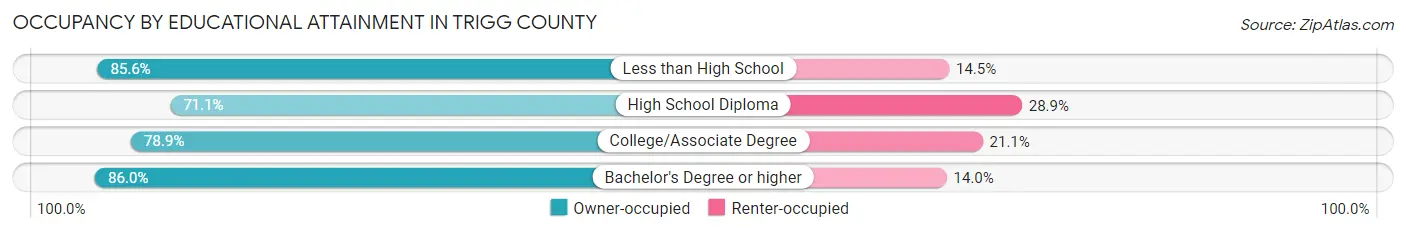
| Household Size | Owner-occupied | Renter-occupied |
| Less than High School | 521 (85.6%) | 88 (14.4%) |
| High School Diploma | 1,380 (71.1%) | 560 (28.9%) |
| College/Associate Degree | 1,529 (78.9%) | 409 (21.1%) |
| Bachelor's Degree or higher | 1,145 (86.0%) | 186 (14.0%) |
Occupancy by Age of Householder in Trigg County
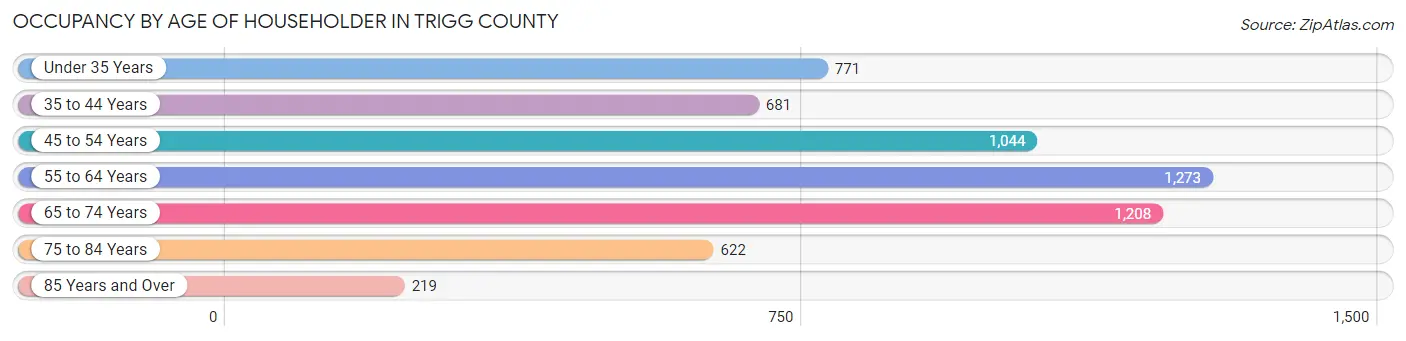
| Age Bracket | # Households | % Households |
| Under 35 Years | 771 | 13.3% |
| 35 to 44 Years | 681 | 11.7% |
| 45 to 54 Years | 1,044 | 17.9% |
| 55 to 64 Years | 1,273 | 21.9% |
| 65 to 74 Years | 1,208 | 20.8% |
| 75 to 84 Years | 622 | 10.7% |
| 85 Years and Over | 219 | 3.8% |
| Total | 5,818 | 100.0% |
Housing Finances in Trigg County
Median Income by Occupancy in Trigg County
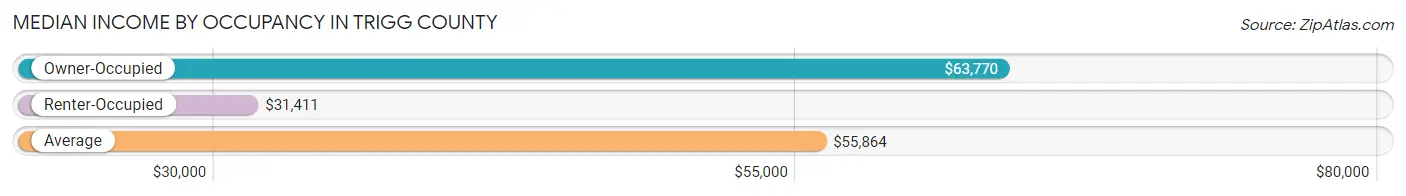
| Occupancy Type | # Households | Median Income |
| Owner-Occupied | 4,575 (78.6%) | $63,770 |
| Renter-Occupied | 1,243 (21.4%) | $31,411 |
| Average | 5,818 (100.0%) | $55,864 |
Occupancy by Householder Income Bracket in Trigg County
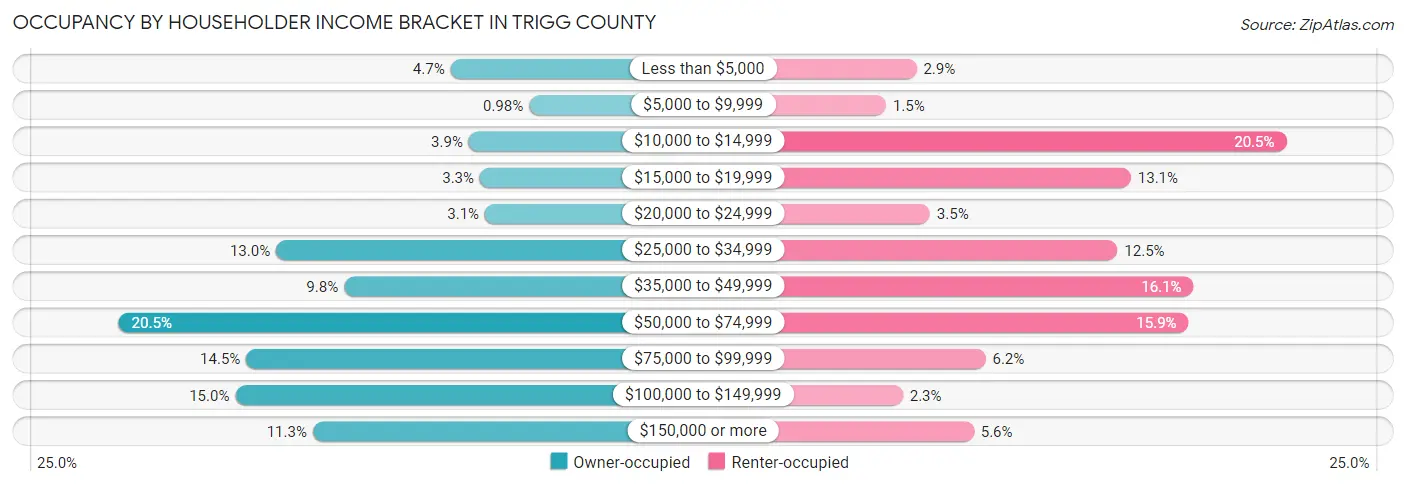
| Income Bracket | Owner-occupied | Renter-occupied |
| Less than $5,000 | 216 (4.7%) | 36 (2.9%) |
| $5,000 to $9,999 | 45 (1.0%) | 18 (1.5%) |
| $10,000 to $14,999 | 176 (3.8%) | 255 (20.5%) |
| $15,000 to $19,999 | 152 (3.3%) | 163 (13.1%) |
| $20,000 to $24,999 | 141 (3.1%) | 44 (3.5%) |
| $25,000 to $34,999 | 596 (13.0%) | 155 (12.5%) |
| $35,000 to $49,999 | 448 (9.8%) | 200 (16.1%) |
| $50,000 to $74,999 | 939 (20.5%) | 197 (15.9%) |
| $75,000 to $99,999 | 661 (14.4%) | 77 (6.2%) |
| $100,000 to $149,999 | 685 (15.0%) | 28 (2.2%) |
| $150,000 or more | 516 (11.3%) | 70 (5.6%) |
| Total | 4,575 (100.0%) | 1,243 (100.0%) |
Monthly Housing Cost Tiers in Trigg County
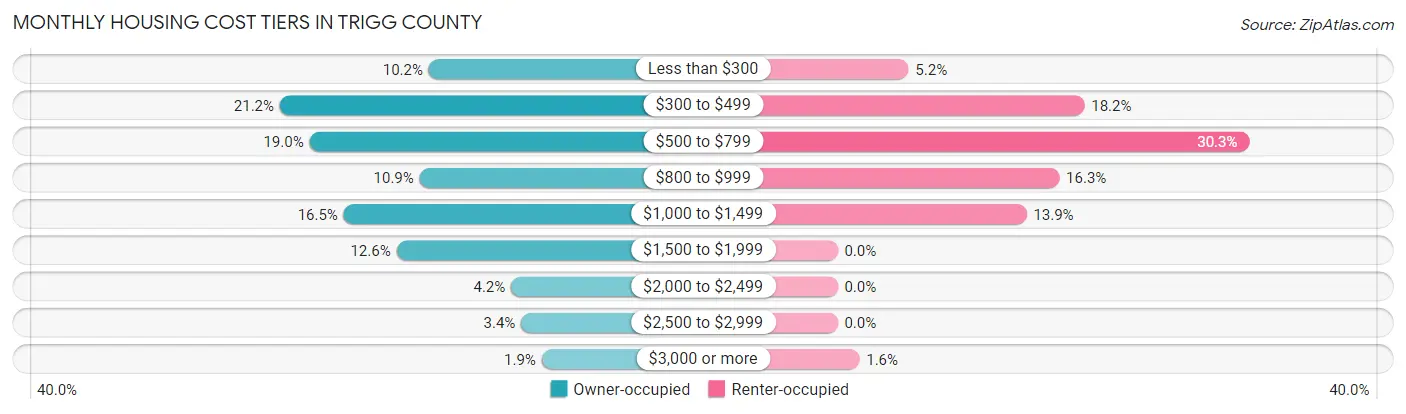
| Monthly Cost | Owner-occupied | Renter-occupied |
| Less than $300 | 468 (10.2%) | 65 (5.2%) |
| $300 to $499 | 970 (21.2%) | 226 (18.2%) |
| $500 to $799 | 870 (19.0%) | 377 (30.3%) |
| $800 to $999 | 499 (10.9%) | 203 (16.3%) |
| $1,000 to $1,499 | 755 (16.5%) | 173 (13.9%) |
| $1,500 to $1,999 | 577 (12.6%) | 0 (0.0%) |
| $2,000 to $2,499 | 191 (4.2%) | 0 (0.0%) |
| $2,500 to $2,999 | 157 (3.4%) | 0 (0.0%) |
| $3,000 or more | 88 (1.9%) | 20 (1.6%) |
| Total | 4,575 (100.0%) | 1,243 (100.0%) |
Physical Housing Characteristics in Trigg County
Housing Structures in Trigg County
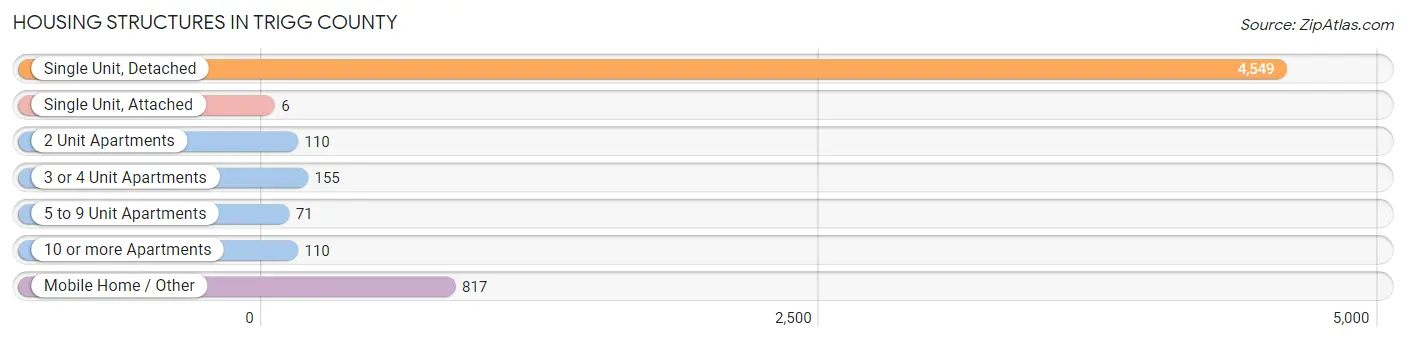
| Structure Type | # Housing Units | % Housing Units |
| Single Unit, Detached | 4,549 | 78.2% |
| Single Unit, Attached | 6 | 0.1% |
| 2 Unit Apartments | 110 | 1.9% |
| 3 or 4 Unit Apartments | 155 | 2.7% |
| 5 to 9 Unit Apartments | 71 | 1.2% |
| 10 or more Apartments | 110 | 1.9% |
| Mobile Home / Other | 817 | 14.0% |
| Total | 5,818 | 100.0% |
Housing Structures by Occupancy in Trigg County
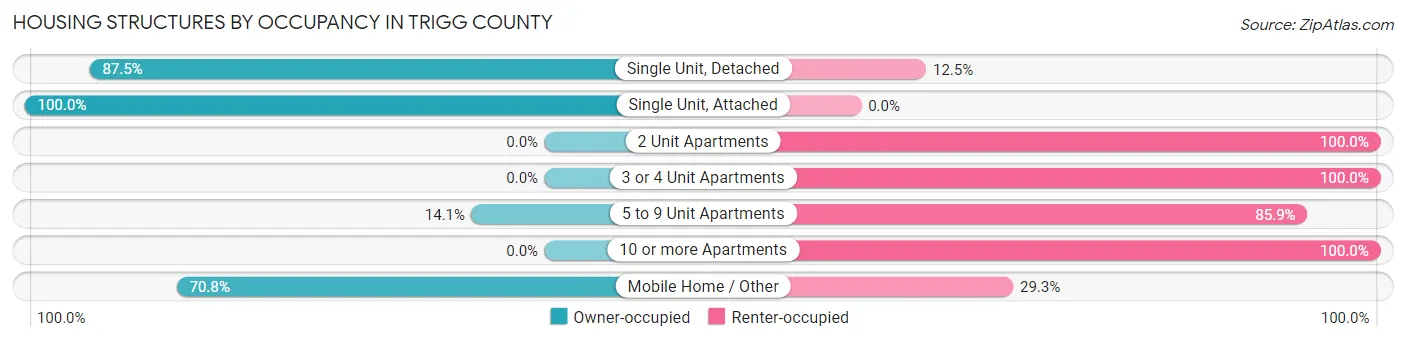
| Structure Type | Owner-occupied | Renter-occupied |
| Single Unit, Detached | 3,981 (87.5%) | 568 (12.5%) |
| Single Unit, Attached | 6 (100.0%) | 0 (0.0%) |
| 2 Unit Apartments | 0 (0.0%) | 110 (100.0%) |
| 3 or 4 Unit Apartments | 0 (0.0%) | 155 (100.0%) |
| 5 to 9 Unit Apartments | 10 (14.1%) | 61 (85.9%) |
| 10 or more Apartments | 0 (0.0%) | 110 (100.0%) |
| Mobile Home / Other | 578 (70.8%) | 239 (29.2%) |
| Total | 4,575 (78.6%) | 1,243 (21.4%) |
Housing Structures by Number of Rooms in Trigg County
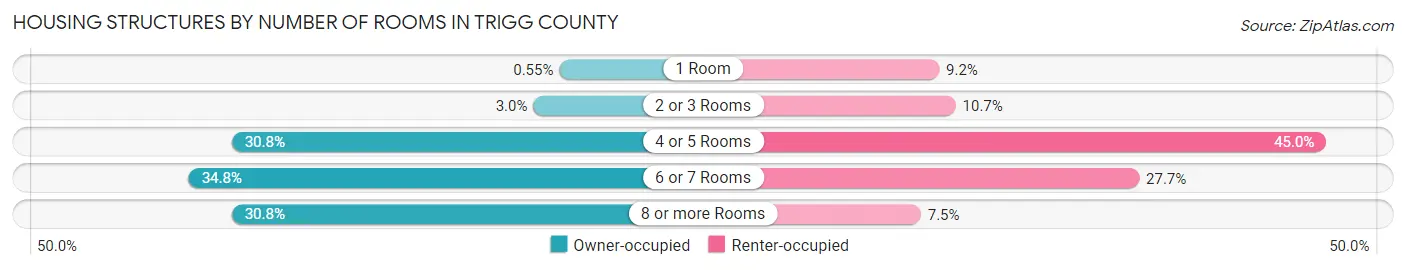
| Number of Rooms | Owner-occupied | Renter-occupied |
| 1 Room | 25 (0.5%) | 114 (9.2%) |
| 2 or 3 Rooms | 135 (2.9%) | 133 (10.7%) |
| 4 or 5 Rooms | 1,411 (30.8%) | 559 (45.0%) |
| 6 or 7 Rooms | 1,593 (34.8%) | 344 (27.7%) |
| 8 or more Rooms | 1,411 (30.8%) | 93 (7.5%) |
| Total | 4,575 (100.0%) | 1,243 (100.0%) |
Housing Structure by Heating Type in Trigg County
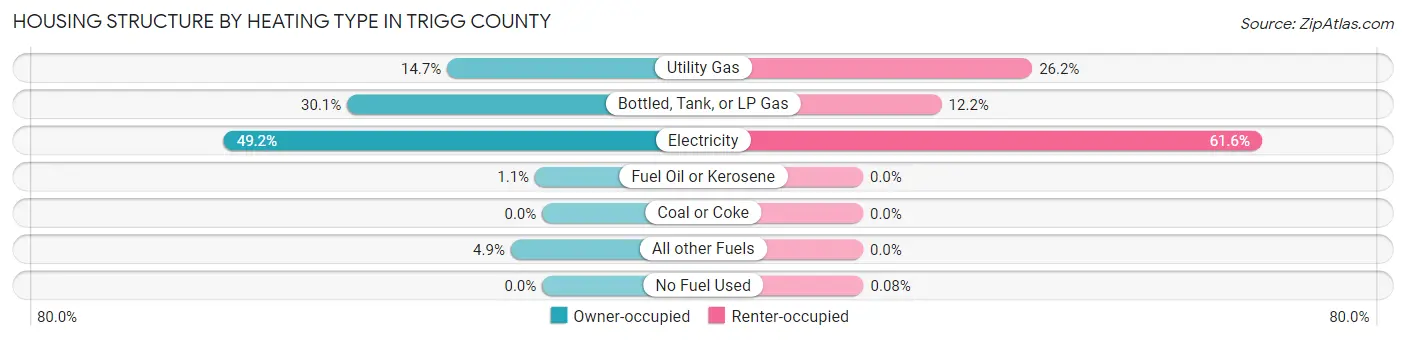
| Heating Type | Owner-occupied | Renter-occupied |
| Utility Gas | 672 (14.7%) | 325 (26.2%) |
| Bottled, Tank, or LP Gas | 1,379 (30.1%) | 151 (12.1%) |
| Electricity | 2,251 (49.2%) | 766 (61.6%) |
| Fuel Oil or Kerosene | 51 (1.1%) | 0 (0.0%) |
| Coal or Coke | 0 (0.0%) | 0 (0.0%) |
| All other Fuels | 222 (4.9%) | 0 (0.0%) |
| No Fuel Used | 0 (0.0%) | 1 (0.1%) |
| Total | 4,575 (100.0%) | 1,243 (100.0%) |
Household Vehicle Usage in Trigg County
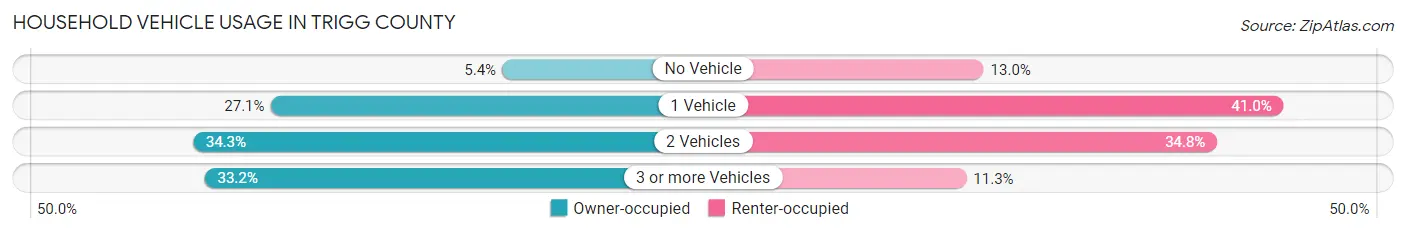
| Vehicles per Household | Owner-occupied | Renter-occupied |
| No Vehicle | 249 (5.4%) | 161 (13.0%) |
| 1 Vehicle | 1,238 (27.1%) | 509 (40.9%) |
| 2 Vehicles | 1,569 (34.3%) | 432 (34.7%) |
| 3 or more Vehicles | 1,519 (33.2%) | 141 (11.3%) |
| Total | 4,575 (100.0%) | 1,243 (100.0%) |
Real Estate & Mortgages in Trigg County
Real Estate and Mortgage Overview in Trigg County
| Characteristic | Without Mortgage | With Mortgage |
| Housing Units | 2,045 | 2,530 |
| Median Property Value | $134,700 | $195,500 |
| Median Household Income | $52,614 | $398 |
| Monthly Housing Costs | $413 | $83 |
| Real Estate Taxes | $718 | $99 |
Property Value by Mortgage Status in Trigg County
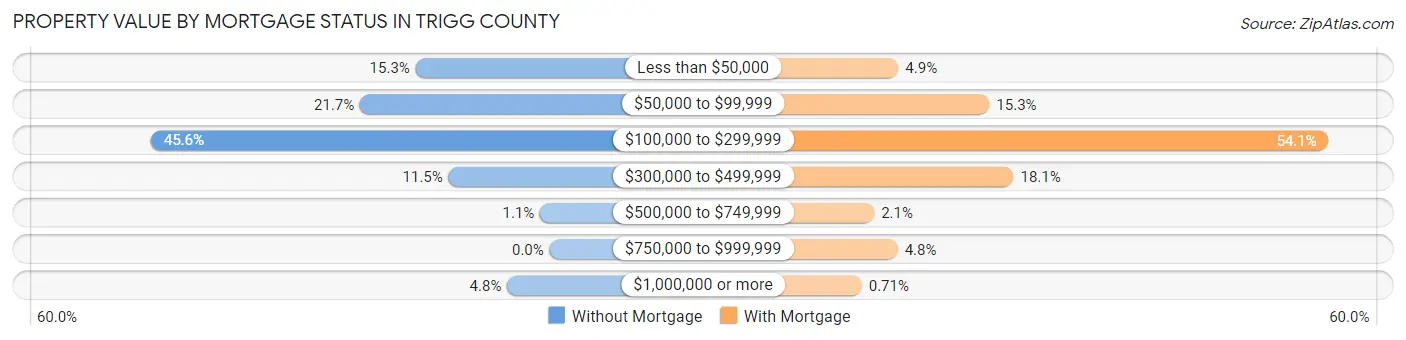
| Property Value | Without Mortgage | With Mortgage |
| Less than $50,000 | 313 (15.3%) | 124 (4.9%) |
| $50,000 to $99,999 | 443 (21.7%) | 387 (15.3%) |
| $100,000 to $299,999 | 932 (45.6%) | 1,368 (54.1%) |
| $300,000 to $499,999 | 236 (11.5%) | 457 (18.1%) |
| $500,000 to $749,999 | 22 (1.1%) | 54 (2.1%) |
| $750,000 to $999,999 | 0 (0.0%) | 122 (4.8%) |
| $1,000,000 or more | 99 (4.8%) | 18 (0.7%) |
| Total | 2,045 (100.0%) | 2,530 (100.0%) |
Household Income by Mortgage Status in Trigg County
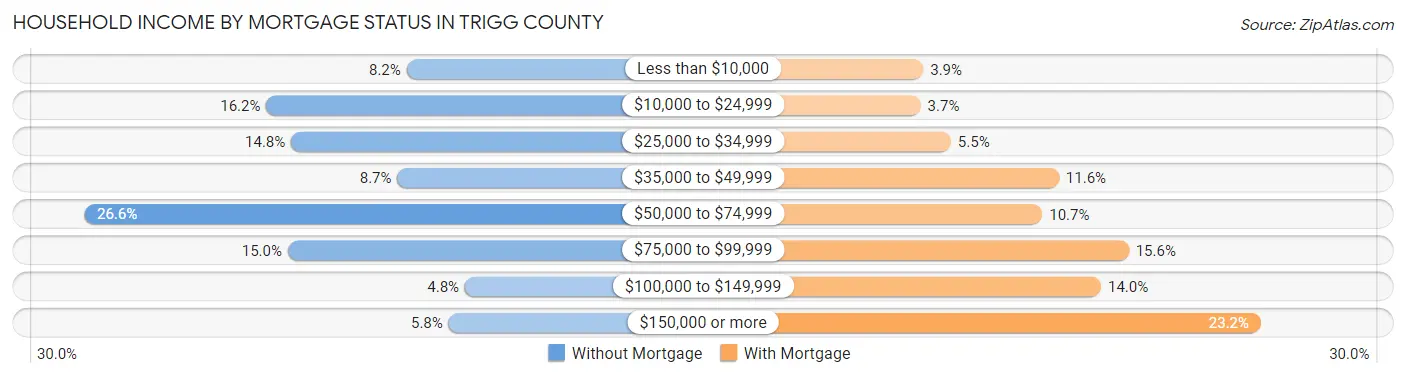
| Household Income | Without Mortgage | With Mortgage |
| Less than $10,000 | 167 (8.2%) | 98 (3.9%) |
| $10,000 to $24,999 | 331 (16.2%) | 94 (3.7%) |
| $25,000 to $34,999 | 302 (14.8%) | 138 (5.4%) |
| $35,000 to $49,999 | 178 (8.7%) | 294 (11.6%) |
| $50,000 to $74,999 | 544 (26.6%) | 270 (10.7%) |
| $75,000 to $99,999 | 306 (15.0%) | 395 (15.6%) |
| $100,000 to $149,999 | 99 (4.8%) | 355 (14.0%) |
| $150,000 or more | 118 (5.8%) | 586 (23.2%) |
| Total | 2,045 (100.0%) | 2,530 (100.0%) |
Property Value to Household Income Ratio in Trigg County
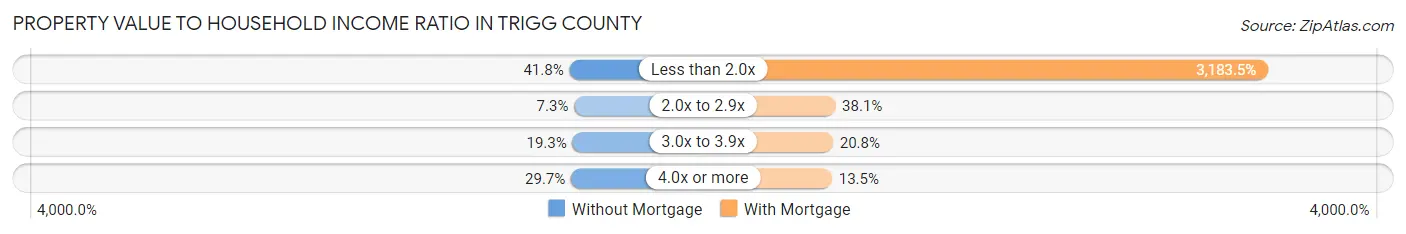
| Value-to-Income Ratio | Without Mortgage | With Mortgage |
| Less than 2.0x | 854 (41.8%) | 80,543 (3,183.5%) |
| 2.0x to 2.9x | 150 (7.3%) | 965 (38.1%) |
| 3.0x to 3.9x | 394 (19.3%) | 527 (20.8%) |
| 4.0x or more | 608 (29.7%) | 342 (13.5%) |
| Total | 2,045 (100.0%) | 2,530 (100.0%) |
Real Estate Taxes by Mortgage Status in Trigg County
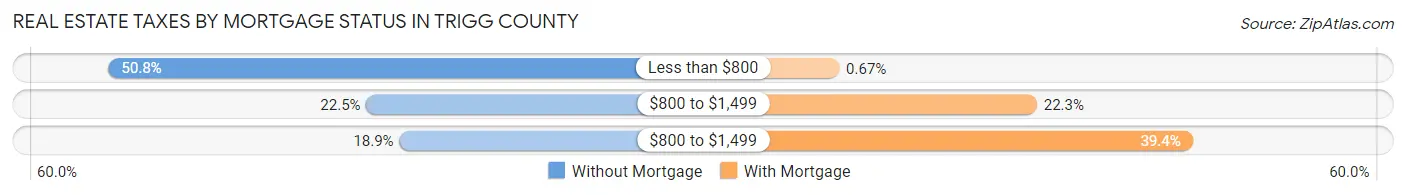
| Property Taxes | Without Mortgage | With Mortgage |
| Less than $800 | 1,039 (50.8%) | 17 (0.7%) |
| $800 to $1,499 | 461 (22.5%) | 565 (22.3%) |
| $800 to $1,499 | 387 (18.9%) | 997 (39.4%) |
| Total | 2,045 (100.0%) | 2,530 (100.0%) |
Health & Disability in Trigg County
Health Insurance Coverage by Age in Trigg County
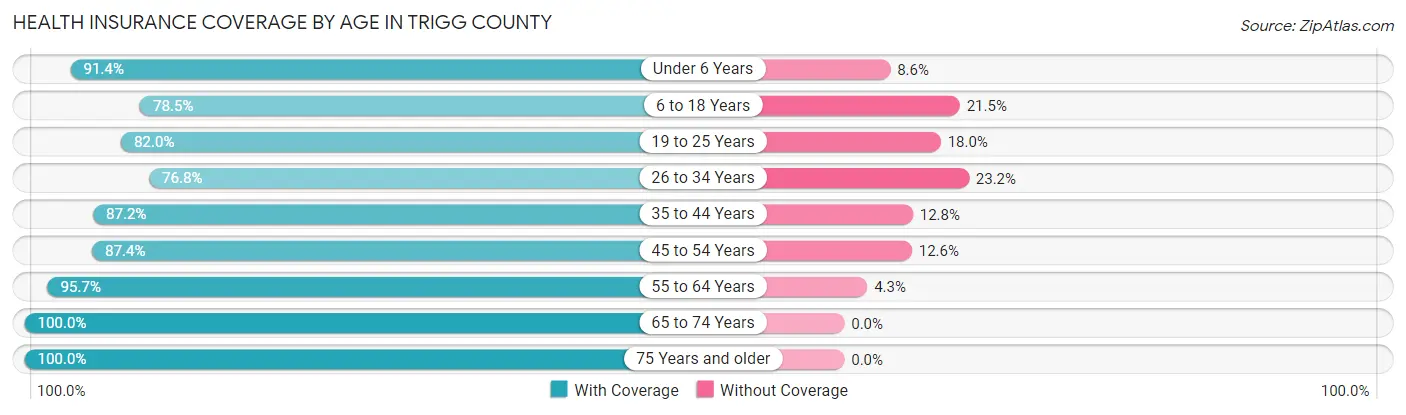
| Age Bracket | With Coverage | Without Coverage |
| Under 6 Years | 854 (91.4%) | 80 (8.6%) |
| 6 to 18 Years | 1,822 (78.5%) | 500 (21.5%) |
| 19 to 25 Years | 716 (82.0%) | 157 (18.0%) |
| 26 to 34 Years | 1,011 (76.8%) | 306 (23.2%) |
| 35 to 44 Years | 1,310 (87.2%) | 192 (12.8%) |
| 45 to 54 Years | 1,527 (87.4%) | 220 (12.6%) |
| 55 to 64 Years | 2,108 (95.7%) | 94 (4.3%) |
| 65 to 74 Years | 1,933 (100.0%) | 0 (0.0%) |
| 75 Years and older | 1,233 (100.0%) | 0 (0.0%) |
| Total | 12,514 (89.0%) | 1,549 (11.0%) |
Health Insurance Coverage by Citizenship Status in Trigg County
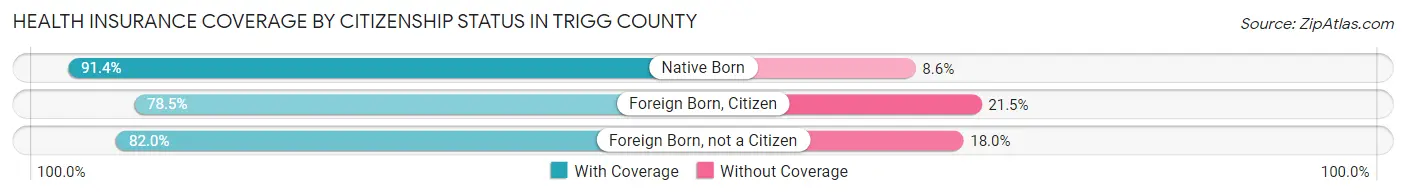
| Citizenship Status | With Coverage | Without Coverage |
| Native Born | 854 (91.4%) | 80 (8.6%) |
| Foreign Born, Citizen | 1,822 (78.5%) | 500 (21.5%) |
| Foreign Born, not a Citizen | 716 (82.0%) | 157 (18.0%) |
Health Insurance Coverage by Household Income in Trigg County
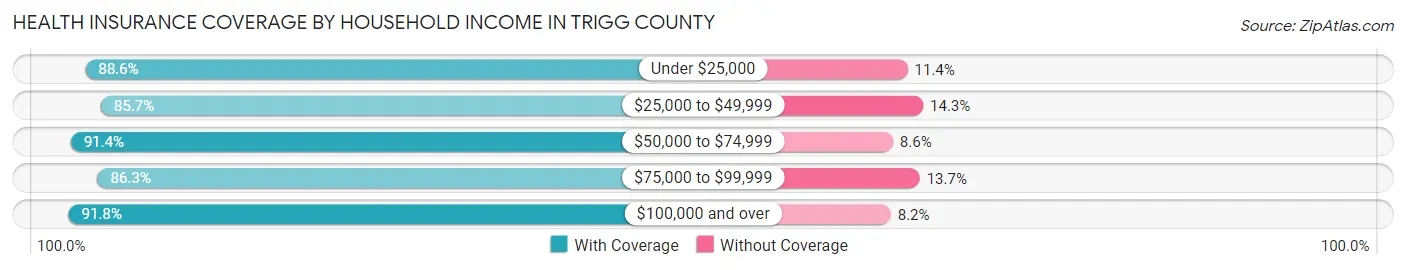
| Household Income | With Coverage | Without Coverage |
| Under $25,000 | 1,892 (88.6%) | 243 (11.4%) |
| $25,000 to $49,999 | 2,578 (85.7%) | 430 (14.3%) |
| $50,000 to $74,999 | 2,622 (91.4%) | 248 (8.6%) |
| $75,000 to $99,999 | 1,751 (86.3%) | 277 (13.7%) |
| $100,000 and over | 3,641 (91.8%) | 327 (8.2%) |
Public vs Private Health Insurance Coverage by Age in Trigg County
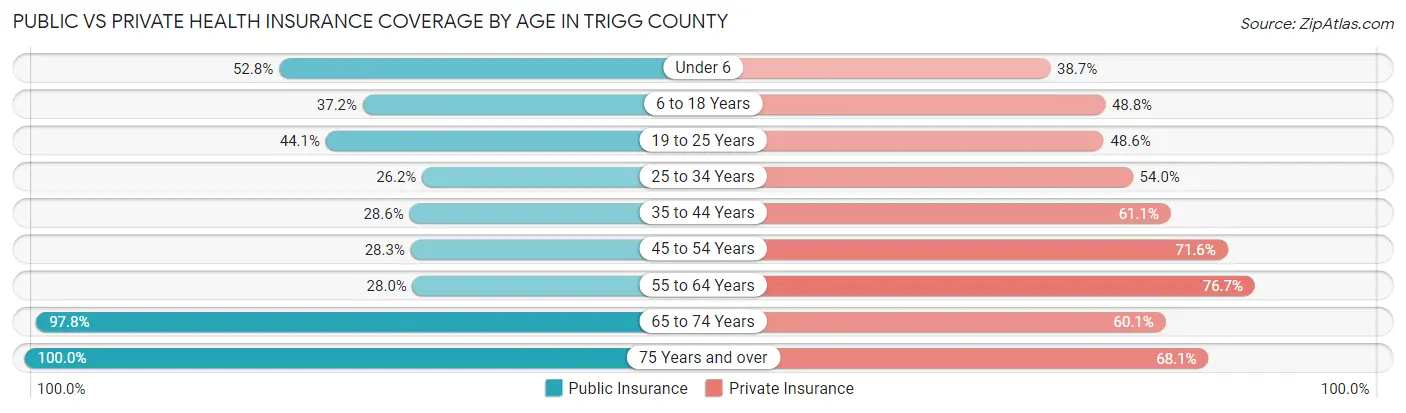
| Age Bracket | Public Insurance | Private Insurance |
| Under 6 | 493 (52.8%) | 361 (38.7%) |
| 6 to 18 Years | 864 (37.2%) | 1,134 (48.8%) |
| 19 to 25 Years | 385 (44.1%) | 424 (48.6%) |
| 25 to 34 Years | 345 (26.2%) | 711 (54.0%) |
| 35 to 44 Years | 429 (28.6%) | 917 (61.1%) |
| 45 to 54 Years | 495 (28.3%) | 1,251 (71.6%) |
| 55 to 64 Years | 616 (28.0%) | 1,688 (76.7%) |
| 65 to 74 Years | 1,891 (97.8%) | 1,162 (60.1%) |
| 75 Years and over | 1,233 (100.0%) | 839 (68.0%) |
| Total | 6,751 (48.0%) | 8,487 (60.4%) |
Disability Status by Sex by Age in Trigg County
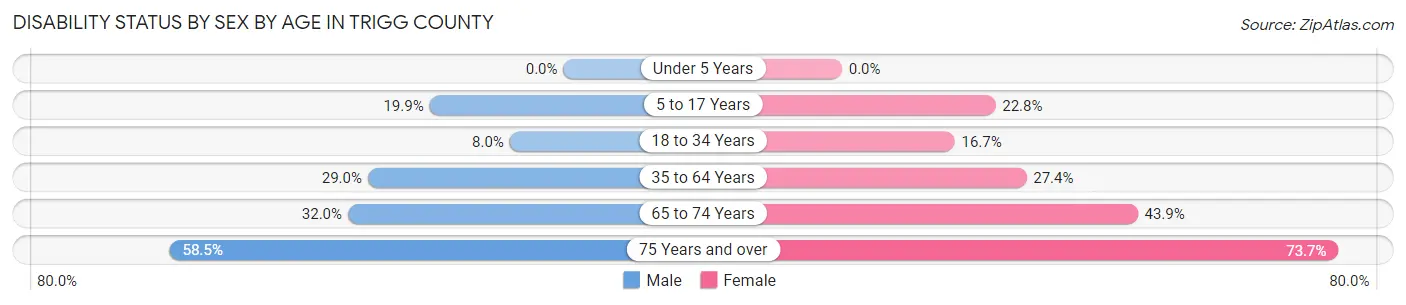
| Age Bracket | Male | Female |
| Under 5 Years | 0 (0.0%) | 0 (0.0%) |
| 5 to 17 Years | 226 (19.9%) | 258 (22.8%) |
| 18 to 34 Years | 93 (8.0%) | 203 (16.7%) |
| 35 to 64 Years | 775 (29.0%) | 762 (27.4%) |
| 65 to 74 Years | 303 (32.0%) | 433 (43.9%) |
| 75 Years and over | 345 (58.5%) | 474 (73.7%) |
Disability Class by Sex by Age in Trigg County
Disability Class: Hearing Difficulty
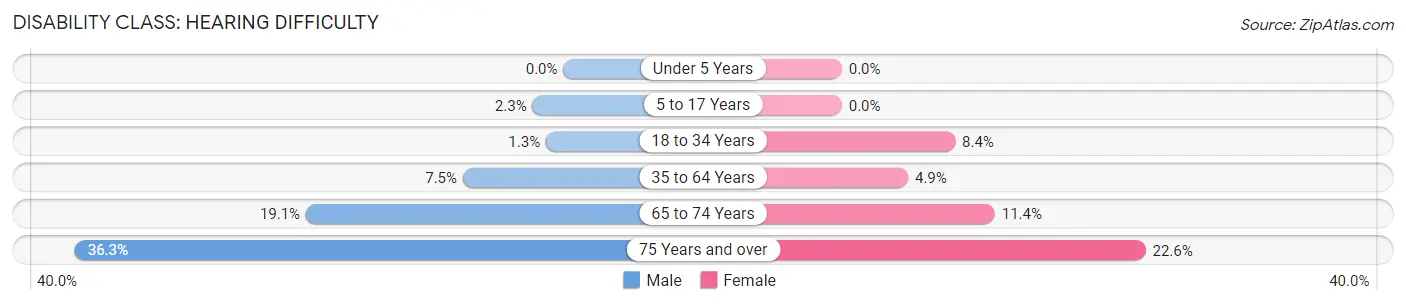
| Age Bracket | Male | Female |
| Under 5 Years | 0 (0.0%) | 0 (0.0%) |
| 5 to 17 Years | 26 (2.3%) | 0 (0.0%) |
| 18 to 34 Years | 15 (1.3%) | 102 (8.4%) |
| 35 to 64 Years | 199 (7.5%) | 137 (4.9%) |
| 65 to 74 Years | 181 (19.1%) | 112 (11.4%) |
| 75 Years and over | 214 (36.3%) | 145 (22.6%) |
Disability Class: Vision Difficulty
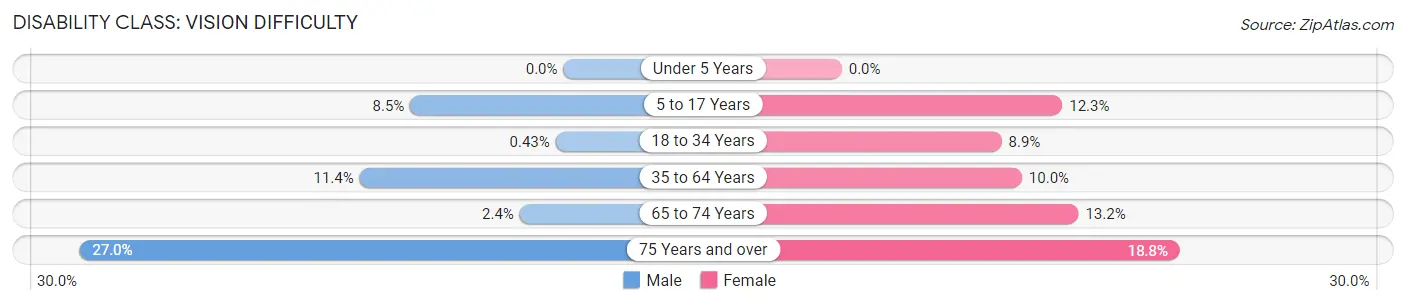
| Age Bracket | Male | Female |
| Under 5 Years | 0 (0.0%) | 0 (0.0%) |
| 5 to 17 Years | 97 (8.5%) | 139 (12.3%) |
| 18 to 34 Years | 5 (0.4%) | 108 (8.9%) |
| 35 to 64 Years | 303 (11.4%) | 279 (10.0%) |
| 65 to 74 Years | 23 (2.4%) | 130 (13.2%) |
| 75 Years and over | 159 (27.0%) | 121 (18.8%) |
Disability Class: Cognitive Difficulty
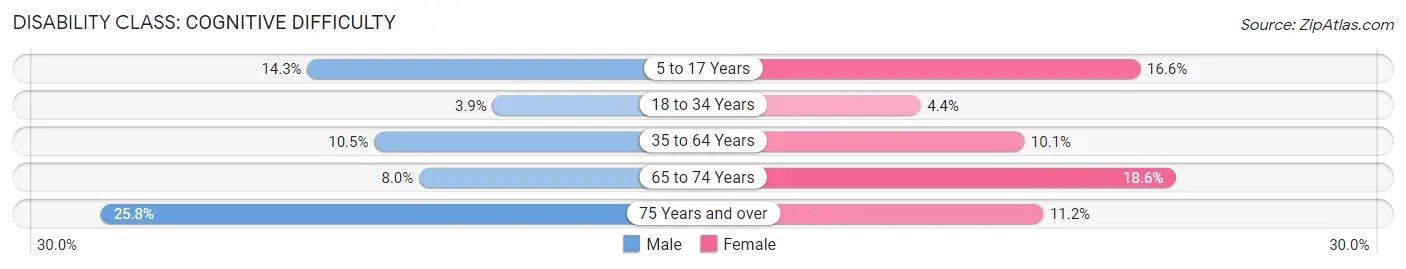
| Age Bracket | Male | Female |
| 5 to 17 Years | 162 (14.2%) | 188 (16.6%) |
| 18 to 34 Years | 46 (3.9%) | 53 (4.4%) |
| 35 to 64 Years | 281 (10.5%) | 282 (10.1%) |
| 65 to 74 Years | 76 (8.0%) | 183 (18.6%) |
| 75 Years and over | 152 (25.8%) | 72 (11.2%) |
Disability Class: Ambulatory Difficulty
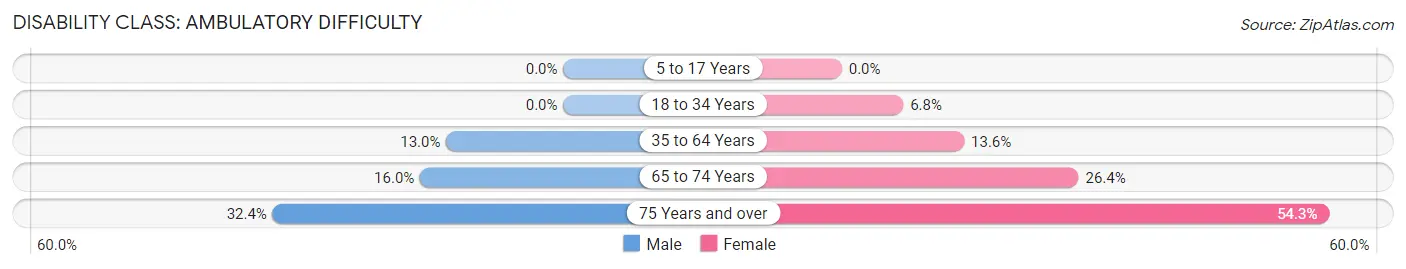
| Age Bracket | Male | Female |
| 5 to 17 Years | 0 (0.0%) | 0 (0.0%) |
| 18 to 34 Years | 0 (0.0%) | 83 (6.8%) |
| 35 to 64 Years | 348 (13.0%) | 379 (13.6%) |
| 65 to 74 Years | 151 (16.0%) | 260 (26.4%) |
| 75 Years and over | 191 (32.4%) | 349 (54.3%) |
Disability Class: Self-Care Difficulty
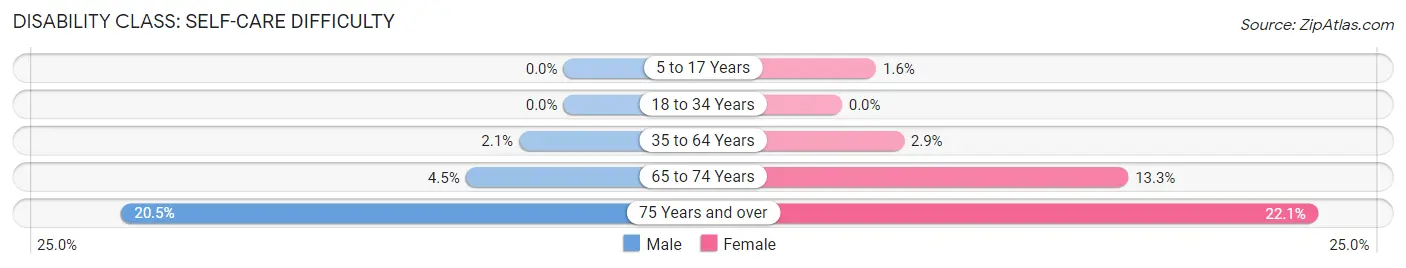
| Age Bracket | Male | Female |
| 5 to 17 Years | 0 (0.0%) | 18 (1.6%) |
| 18 to 34 Years | 0 (0.0%) | 0 (0.0%) |
| 35 to 64 Years | 55 (2.1%) | 80 (2.9%) |
| 65 to 74 Years | 43 (4.5%) | 131 (13.3%) |
| 75 Years and over | 121 (20.5%) | 142 (22.1%) |
Technology Access in Trigg County
Computing Device Access in Trigg County
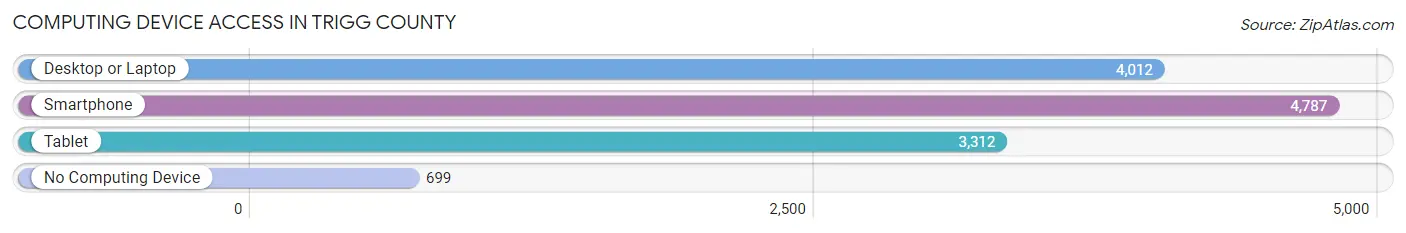
| Device Type | # Households | % Households |
| Desktop or Laptop | 4,012 | 69.0% |
| Smartphone | 4,787 | 82.3% |
| Tablet | 3,312 | 56.9% |
| No Computing Device | 699 | 12.0% |
| Total | 5,818 | 100.0% |
Internet Access in Trigg County
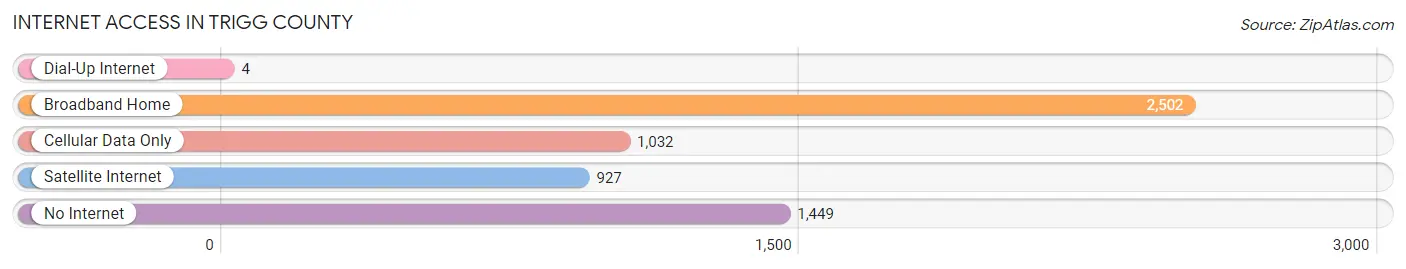
| Internet Type | # Households | % Households |
| Dial-Up Internet | 4 | 0.1% |
| Broadband Home | 2,502 | 43.0% |
| Cellular Data Only | 1,032 | 17.7% |
| Satellite Internet | 927 | 15.9% |
| No Internet | 1,449 | 24.9% |
| Total | 5,818 | 100.0% |
Trigg County Summary
Trigg County is a county located in the western part of the state of Kentucky, in the United States. As of the 2010 census, the population was 14,339. The county seat is Cadiz. The county was formed in 1820 and named for Stephen Trigg, a Revolutionary War soldier and Kentucky state legislator.
Geography
Trigg County is located in the Pennyroyal region of Kentucky, which is known for its rolling hills and limestone outcroppings. The county is bordered by Christian County to the north, Caldwell County to the east, Lyon County to the south, and Stewart County, Tennessee to the west. The county is approximately 545 square miles in size and is divided into two distinct regions: the Pennyroyal Plateau in the north and the Highland Rim in the south. The highest point in the county is located in the Highland Rim, at an elevation of 890 feet.
The county is drained by the Little River, which flows through the county from north to south. Other major waterways include the Red River, which forms the western border of the county, and the Tennessee River, which forms the eastern border.
The county is home to several state parks, including Land Between the Lakes National Recreation Area, which is located in the northern part of the county. The area is also home to several wildlife refuges, including the Trigg County Wildlife Management Area.
Demographics
As of the 2010 census, there were 14,339 people, 5,845 households, and 4,093 families residing in the county. The population density was 26.3 people per square mile. The racial makeup of the county was 92.3% White, 5.2% Black or African American, 0.3% Native American, 0.2% Asian, 0.1% Pacific Islander, 0.6% from other races, and 1.3% from two or more races. 1.7% of the population were Hispanic or Latino of any race.
The median income for a household in the county was $37,945, and the median income for a family was $45,945. The per capita income for the county was $19,845. About 13.2% of families and 16.2% of the population were below the poverty line, including 22.2% of those under age 18 and 13.2% of those age 65 or over.
Economy
Trigg County is largely rural and agricultural. The county is home to several large farms, as well as several small family farms. The county is also home to several manufacturing companies, including a large furniture manufacturer and a large automotive parts manufacturer.
The county is also home to several tourist attractions, including Land Between the Lakes National Recreation Area, which is located in the northern part of the county. The area is also home to several state parks, including the Trigg County Wildlife Management Area.
The county is served by two major highways, US Highway 68 and Kentucky Route 45. The county is also served by several smaller roads, including state highways and county roads. The county is served by two airports, the Cadiz-Trigg County Airport and the Land Between the Lakes Airport.
Conclusion
Trigg County is a rural county located in the western part of Kentucky. The county is home to several large farms, as well as several small family farms. The county is also home to several manufacturing companies, as well as several tourist attractions. The county is served by two major highways, US Highway 68 and Kentucky Route 45, as well as several smaller roads. The county is also served by two airports, the Cadiz-Trigg County Airport and the Land Between the Lakes Airport. The county has a population of 14,339, with a median household income of $37,945 and a median family income of $45,945.
Common Questions
What is Per Capita Income in Trigg County?
Per Capita income in Trigg County is $30,172.
What is the Median Family Income in Trigg County?
Median Family Income in Trigg County is $67,580.
What is the Median Household income in Trigg County?
Median Household Income in Trigg County is $55,864.
What is Income or Wage Gap in Trigg County?
Income or Wage Gap in Trigg County is 25.1%.
Women in Trigg County earn 74.9 cents for every dollar earned by a man.
What is Family Income Deficit in Trigg County?
Family Income Deficit in Trigg County is $9,018.
Families that are below poverty line in Trigg County earn $9,018 less on average than the poverty threshold level.
What is Inequality or Gini Index in Trigg County?
Inequality or Gini Index in Trigg County is 0.44.
What is the Total Population of Trigg County?
Total Population of Trigg County is 14,154.
What is the Total Male Population of Trigg County?
Total Male Population of Trigg County is 7,031.
What is the Total Female Population of Trigg County?
Total Female Population of Trigg County is 7,123.
What is the Ratio of Males per 100 Females in Trigg County?
There are 98.71 Males per 100 Females in Trigg County.
What is the Ratio of Females per 100 Males in Trigg County?
There are 101.31 Females per 100 Males in Trigg County.
What is the Median Population Age in Trigg County?
Median Population Age in Trigg County is 45.8 Years.
What is the Average Family Size in Trigg County
Average Family Size in Trigg County is 3.0 People.
What is the Average Household Size in Trigg County
Average Household Size in Trigg County is 2.4 People.
How Large is the Labor Force in Trigg County?
There are 6,033 People in the Labor Forcein in Trigg County.
What is the Percentage of People in the Labor Force in Trigg County?
52.8% of People are in the Labor Force in Trigg County.
What is the Unemployment Rate in Trigg County?
Unemployment Rate in Trigg County is 4.0%.