Todd County, KY Map & Demographics
Todd County Map
Todd County Overview
$30,252
PER CAPITA INCOME
$68,983
AVG FAMILY INCOME
$57,891
AVG HOUSEHOLD INCOME
33.6%
WAGE / INCOME GAP [ % ]
66.4¢/ $1
WAGE / INCOME GAP [ $ ]
0.49
INEQUALITY / GINI INDEX
12,281
TOTAL POPULATION
6,269
MALE POPULATION
6,012
FEMALE POPULATION
104.27
MALES / 100 FEMALES
95.90
FEMALES / 100 MALES
36.6
MEDIAN AGE
3.2
AVG FAMILY SIZE
2.7
AVG HOUSEHOLD SIZE
5,282
LABOR FORCE [ PEOPLE ]
56.0%
PERCENT IN LABOR FORCE
4.3%
UNEMPLOYMENT RATE
Todd County Area Codes
Income in Todd County
Income Overview in Todd County
Per Capita Income in Todd County is $30,252, while median incomes of families and households are $68,983 and $57,891 respectively.
| Characteristic | Number | Measure |
| Per Capita Income | 12,281 | $30,252 |
| Median Family Income | 3,220 | $68,983 |
| Mean Family Income | 3,220 | $96,910 |
| Median Household Income | 4,476 | $57,891 |
| Mean Household Income | 4,476 | $81,451 |
| Income Deficit | 3,220 | $0 |
| Wage / Income Gap (%) | 12,281 | 33.63% |
| Wage / Income Gap ($) | 12,281 | 66.37¢ per $1 |
| Gini / Inequality Index | 12,281 | 0.49 |
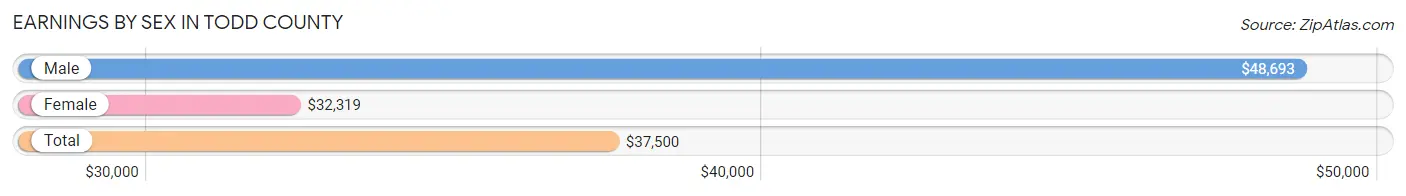
Earnings by Sex in Todd County
Average Earnings in Todd County are $37,500, $48,693 for men and $32,319 for women, a difference of 33.6%.
| Sex | Number | Average Earnings |
| Male | 3,115 (58.1%) | $48,693 |
| Female | 2,249 (41.9%) | $32,319 |
| Total | 5,364 (100.0%) | $37,500 |
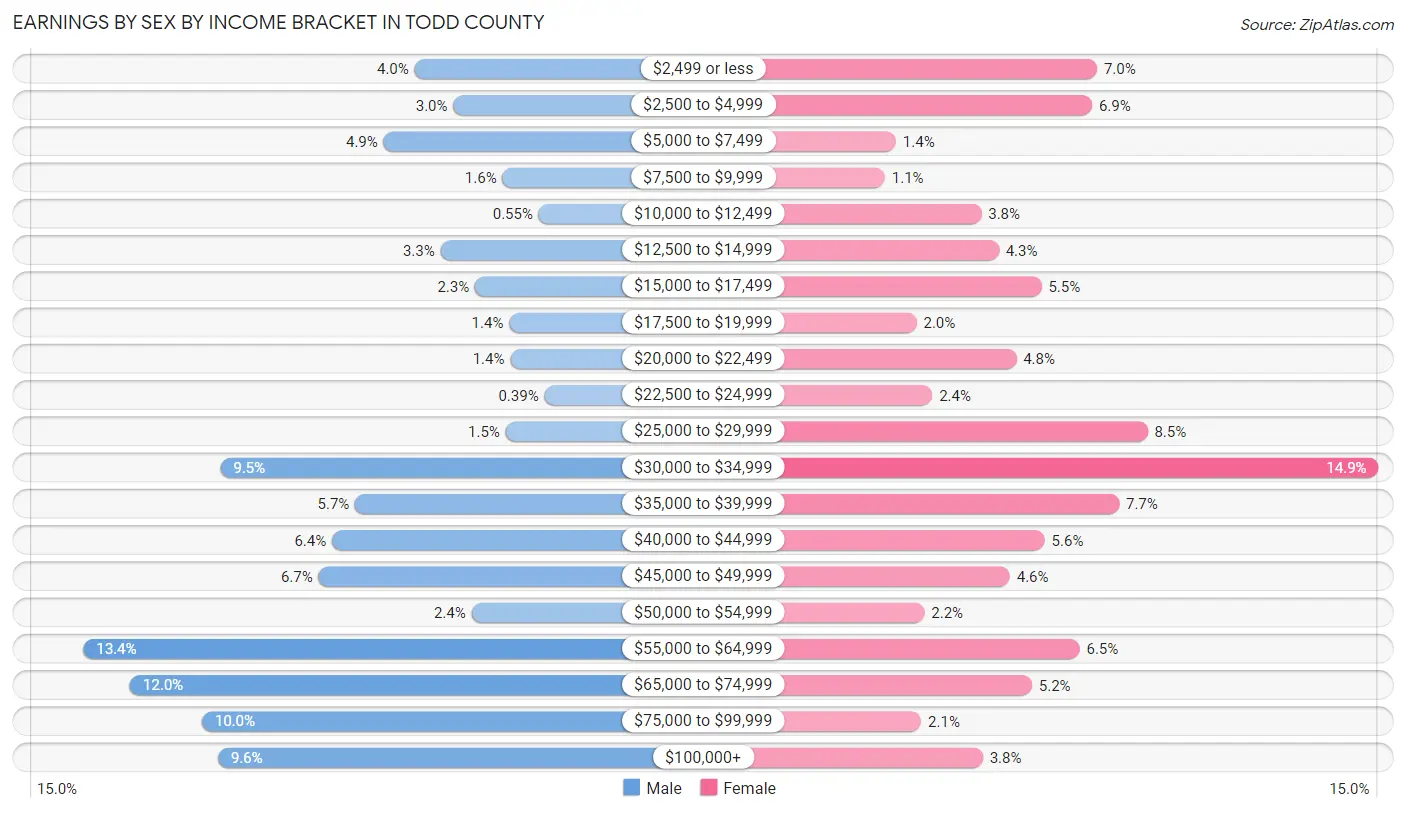
Earnings by Sex by Income Bracket in Todd County
The most common earnings brackets in Todd County are $55,000 to $64,999 for men (416 | 13.4%) and $30,000 to $34,999 for women (336 | 14.9%).
| Income | Male | Female |
| $2,499 or less | 126 (4.0%) | 158 (7.0%) |
| $2,500 to $4,999 | 92 (2.9%) | 155 (6.9%) |
| $5,000 to $7,499 | 153 (4.9%) | 31 (1.4%) |
| $7,500 to $9,999 | 49 (1.6%) | 24 (1.1%) |
| $10,000 to $12,499 | 17 (0.5%) | 85 (3.8%) |
| $12,500 to $14,999 | 103 (3.3%) | 96 (4.3%) |
| $15,000 to $17,499 | 73 (2.3%) | 123 (5.5%) |
| $17,500 to $19,999 | 43 (1.4%) | 44 (2.0%) |
| $20,000 to $22,499 | 42 (1.3%) | 107 (4.8%) |
| $22,500 to $24,999 | 12 (0.4%) | 54 (2.4%) |
| $25,000 to $29,999 | 46 (1.5%) | 190 (8.5%) |
| $30,000 to $34,999 | 296 (9.5%) | 336 (14.9%) |
| $35,000 to $39,999 | 178 (5.7%) | 172 (7.6%) |
| $40,000 to $44,999 | 198 (6.4%) | 125 (5.6%) |
| $45,000 to $49,999 | 210 (6.7%) | 103 (4.6%) |
| $50,000 to $54,999 | 76 (2.4%) | 49 (2.2%) |
| $55,000 to $64,999 | 416 (13.4%) | 147 (6.5%) |
| $65,000 to $74,999 | 375 (12.0%) | 117 (5.2%) |
| $75,000 to $99,999 | 312 (10.0%) | 47 (2.1%) |
| $100,000+ | 298 (9.6%) | 86 (3.8%) |
| Total | 3,115 (100.0%) | 2,249 (100.0%) |
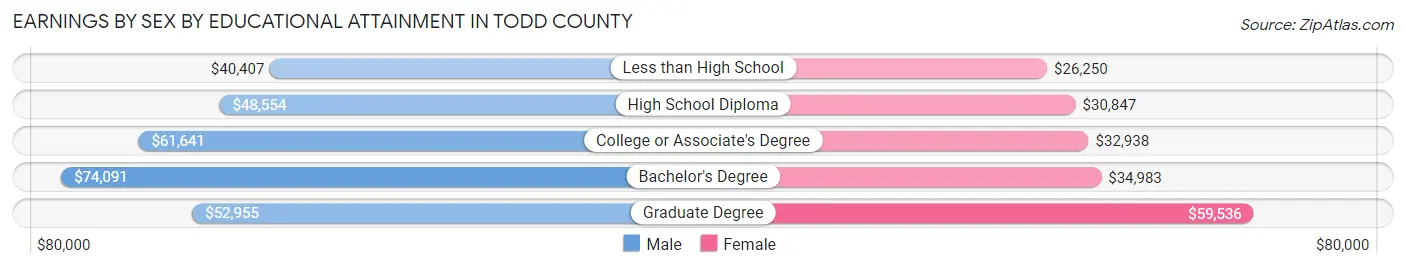
Earnings by Sex by Educational Attainment in Todd County
Average earnings in Todd County are $55,084 for men and $33,799 for women, a difference of 38.6%. Men with an educational attainment of bachelor's degree enjoy the highest average annual earnings of $74,091, while those with less than high school education earn the least with $40,407. Women with an educational attainment of graduate degree earn the most with the average annual earnings of $59,536, while those with less than high school education have the smallest earnings of $26,250.
| Educational Attainment | Male Income | Female Income |
| Less than High School | $40,407 | $26,250 |
| High School Diploma | $48,554 | $30,847 |
| College or Associate's Degree | $61,641 | $32,938 |
| Bachelor's Degree | $74,091 | $34,983 |
| Graduate Degree | $52,955 | $59,536 |
| Total | $55,084 | $33,799 |
Family Income in Todd County
Family Income Brackets in Todd County
According to the Todd County family income data, there are 805 families falling into the $50,000 to $74,999 income range, which is the most common income bracket and makes up 25.0% of all families. Conversely, the $10,000 to $14,999 income bracket is the least frequent group with only 45 families (1.4%) belonging to this category.
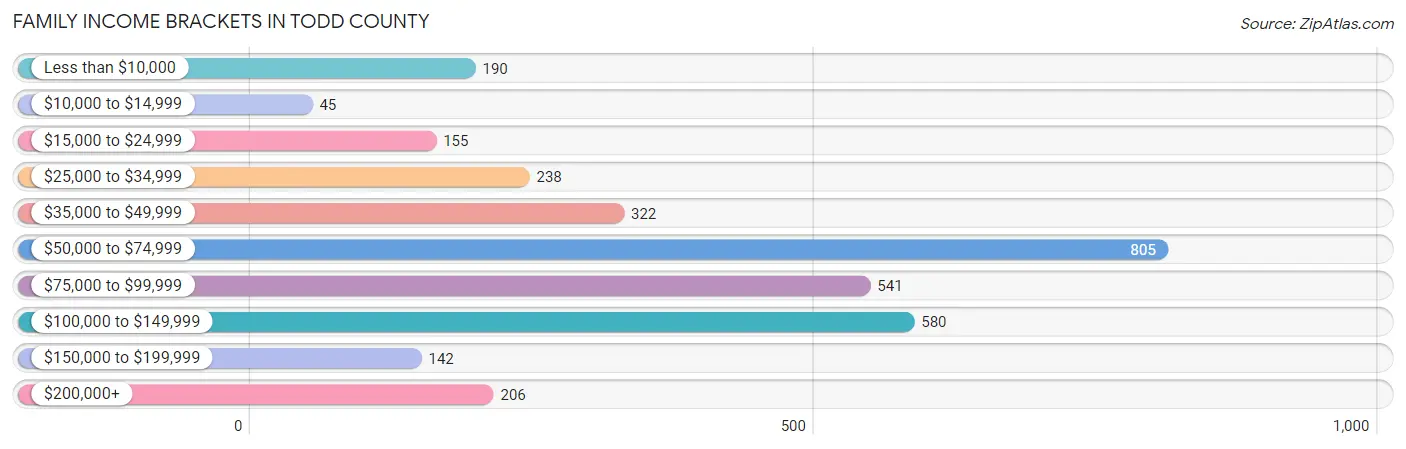
| Income Bracket | # Families | % Families |
| Less than $10,000 | 190 | 5.9% |
| $10,000 to $14,999 | 45 | 1.4% |
| $15,000 to $24,999 | 155 | 4.8% |
| $25,000 to $34,999 | 238 | 7.4% |
| $35,000 to $49,999 | 322 | 10.0% |
| $50,000 to $74,999 | 805 | 25.0% |
| $75,000 to $99,999 | 541 | 16.8% |
| $100,000 to $149,999 | 580 | 18.0% |
| $150,000 to $199,999 | 142 | 4.4% |
| $200,000+ | 206 | 6.4% |
Family Income by Famaliy Size in Todd County
5-person families (236 | 7.3%) account for the highest median family income in Todd County with $118,276 per family, while 2-person families (1,291 | 40.1%) have the highest median income of $30,047 per family member.
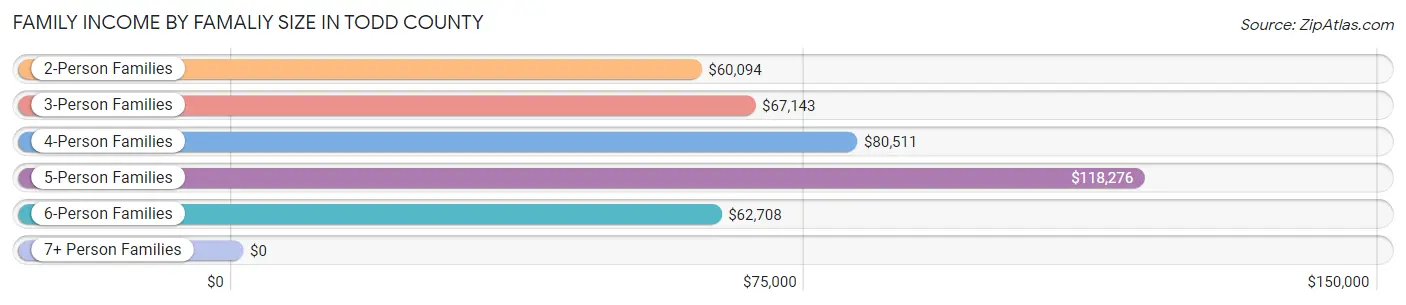
| Income Bracket | # Families | Median Income |
| 2-Person Families | 1,291 (40.1%) | $60,094 |
| 3-Person Families | 808 (25.1%) | $67,143 |
| 4-Person Families | 531 (16.5%) | $80,511 |
| 5-Person Families | 236 (7.3%) | $118,276 |
| 6-Person Families | 79 (2.5%) | $62,708 |
| 7+ Person Families | 275 (8.5%) | $0 |
| Total | 3,220 (100.0%) | $68,983 |
Family Income by Number of Earners in Todd County
The median family income in Todd County is $68,983, with families comprising 3+ earners (379) having the highest median family income of $130,129, while families with no earners (523) have the lowest median family income of $41,531, accounting for 11.8% and 16.2% of families, respectively.
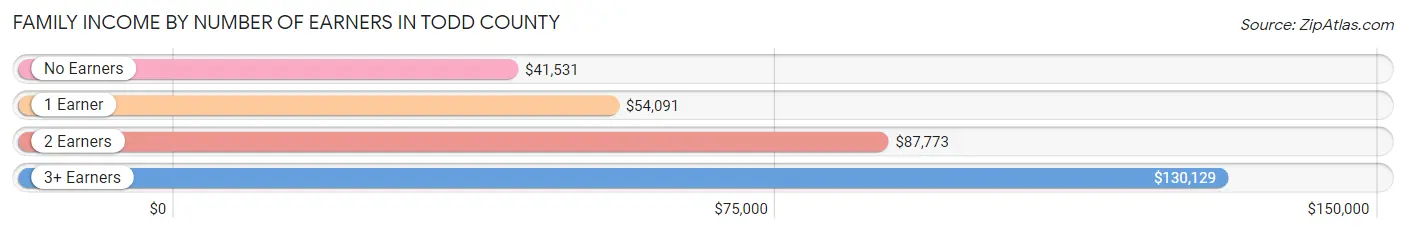
| Number of Earners | # Families | Median Income |
| No Earners | 523 (16.2%) | $41,531 |
| 1 Earner | 1,166 (36.2%) | $54,091 |
| 2 Earners | 1,152 (35.8%) | $87,773 |
| 3+ Earners | 379 (11.8%) | $130,129 |
| Total | 3,220 (100.0%) | $68,983 |
Household Income in Todd County
Household Income Brackets in Todd County
With 1,021 households falling in the category, the $50,000 to $74,999 income range is the most frequent in Todd County, accounting for 22.8% of all households. In contrast, only 143 households (3.2%) fall into the $150,000 to $199,999 income bracket, making it the least populous group.
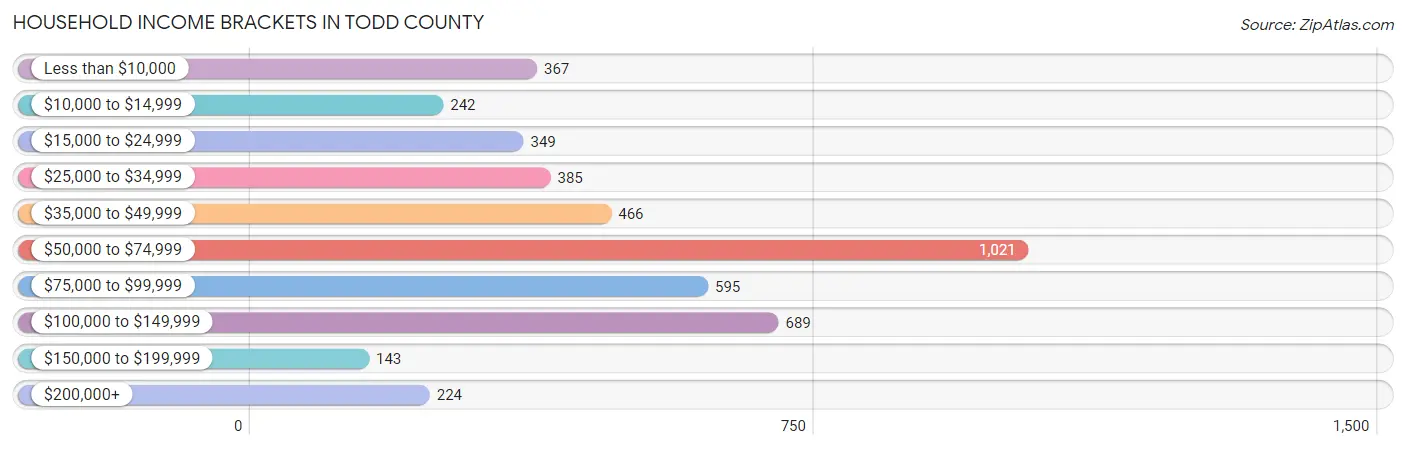
| Income Bracket | # Households | % Households |
| Less than $10,000 | 367 | 8.2% |
| $10,000 to $14,999 | 242 | 5.4% |
| $15,000 to $24,999 | 349 | 7.8% |
| $25,000 to $34,999 | 385 | 8.6% |
| $35,000 to $49,999 | 466 | 10.4% |
| $50,000 to $74,999 | 1,021 | 22.8% |
| $75,000 to $99,999 | 595 | 13.3% |
| $100,000 to $149,999 | 689 | 15.4% |
| $150,000 to $199,999 | 143 | 3.2% |
| $200,000+ | 224 | 5.0% |
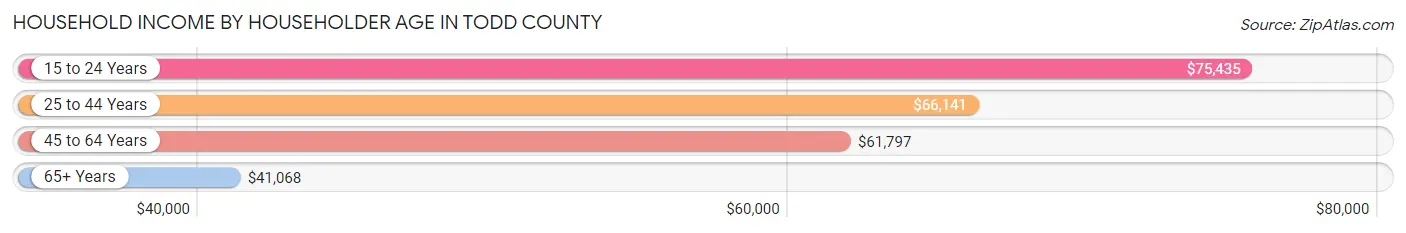
Household Income by Householder Age in Todd County
The median household income in Todd County is $57,891, with the highest median household income of $75,435 found in the 15 to 24 years age bracket for the primary householder. A total of 120 households (2.7%) fall into this category. Meanwhile, the 65+ years age bracket for the primary householder has the lowest median household income of $41,068, with 1,293 households (28.9%) in this group.
| Income Bracket | # Households | Median Income |
| 15 to 24 Years | 120 (2.7%) | $75,435 |
| 25 to 44 Years | 1,292 (28.9%) | $66,141 |
| 45 to 64 Years | 1,771 (39.6%) | $61,797 |
| 65+ Years | 1,293 (28.9%) | $41,068 |
| Total | 4,476 (100.0%) | $57,891 |
Poverty in Todd County
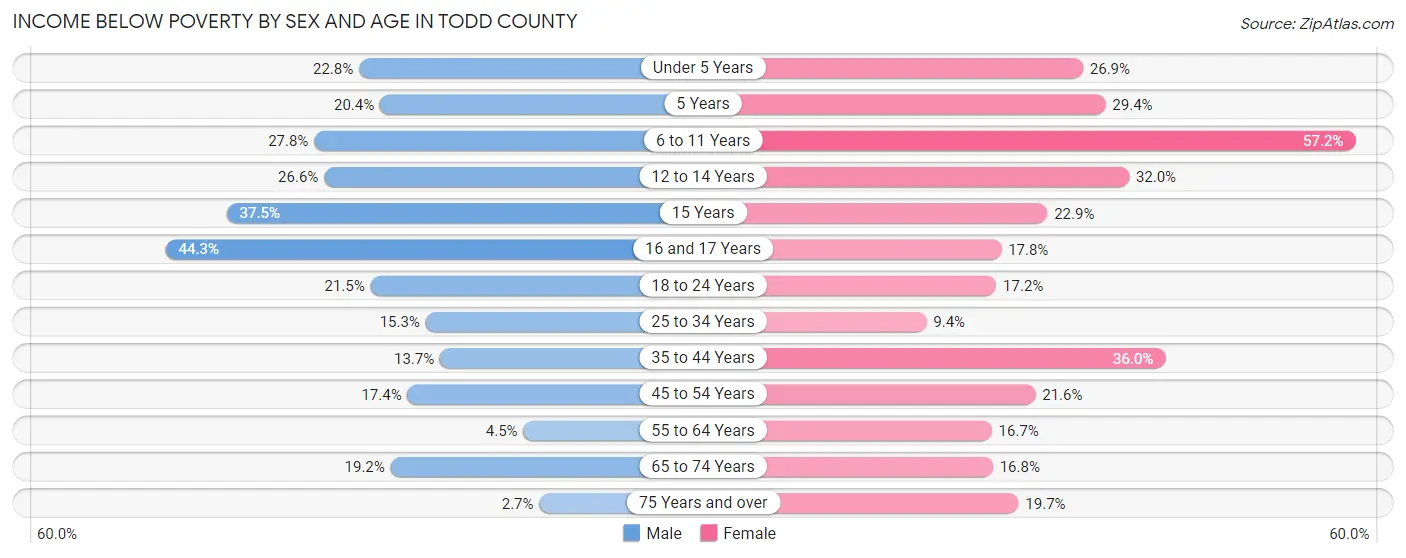
Income Below Poverty by Sex and Age in Todd County
With 18.1% poverty level for males and 24.2% for females among the residents of Todd County, 16 and 17 year old males and 6 to 11 year old females are the most vulnerable to poverty, with 124 males (44.3%) and 319 females (57.2%) in their respective age groups living below the poverty level.
| Age Bracket | Male | Female |
| Under 5 Years | 96 (22.8%) | 109 (26.9%) |
| 5 Years | 20 (20.4%) | 32 (29.4%) |
| 6 to 11 Years | 159 (27.8%) | 319 (57.2%) |
| 12 to 14 Years | 69 (26.6%) | 55 (32.0%) |
| 15 Years | 30 (37.5%) | 27 (22.9%) |
| 16 and 17 Years | 124 (44.3%) | 30 (17.7%) |
| 18 to 24 Years | 126 (21.5%) | 71 (17.2%) |
| 25 to 34 Years | 101 (15.3%) | 71 (9.4%) |
| 35 to 44 Years | 92 (13.7%) | 251 (36.0%) |
| 45 to 54 Years | 126 (17.4%) | 153 (21.5%) |
| 55 to 64 Years | 35 (4.4%) | 137 (16.7%) |
| 65 to 74 Years | 126 (19.2%) | 96 (16.8%) |
| 75 Years and over | 9 (2.7%) | 84 (19.7%) |
| Total | 1,113 (18.1%) | 1,435 (24.2%) |
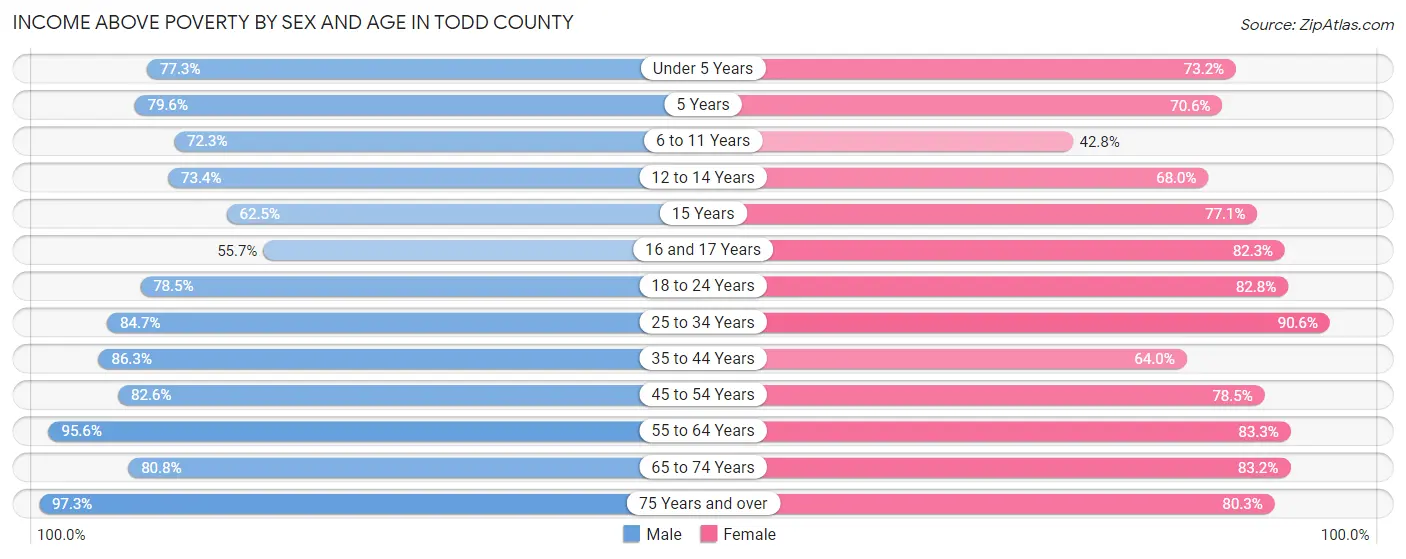
Income Above Poverty by Sex and Age in Todd County
According to the poverty statistics in Todd County, males aged 75 years and over and females aged 25 to 34 years are the age groups that are most secure financially, with 97.3% of males and 90.6% of females in these age groups living above the poverty line.
| Age Bracket | Male | Female |
| Under 5 Years | 326 (77.2%) | 297 (73.2%) |
| 5 Years | 78 (79.6%) | 77 (70.6%) |
| 6 to 11 Years | 414 (72.3%) | 239 (42.8%) |
| 12 to 14 Years | 190 (73.4%) | 117 (68.0%) |
| 15 Years | 50 (62.5%) | 91 (77.1%) |
| 16 and 17 Years | 156 (55.7%) | 139 (82.3%) |
| 18 to 24 Years | 461 (78.5%) | 342 (82.8%) |
| 25 to 34 Years | 558 (84.7%) | 683 (90.6%) |
| 35 to 44 Years | 578 (86.3%) | 446 (64.0%) |
| 45 to 54 Years | 600 (82.6%) | 557 (78.4%) |
| 55 to 64 Years | 752 (95.6%) | 684 (83.3%) |
| 65 to 74 Years | 529 (80.8%) | 475 (83.2%) |
| 75 Years and over | 328 (97.3%) | 343 (80.3%) |
| Total | 5,020 (81.9%) | 4,490 (75.8%) |
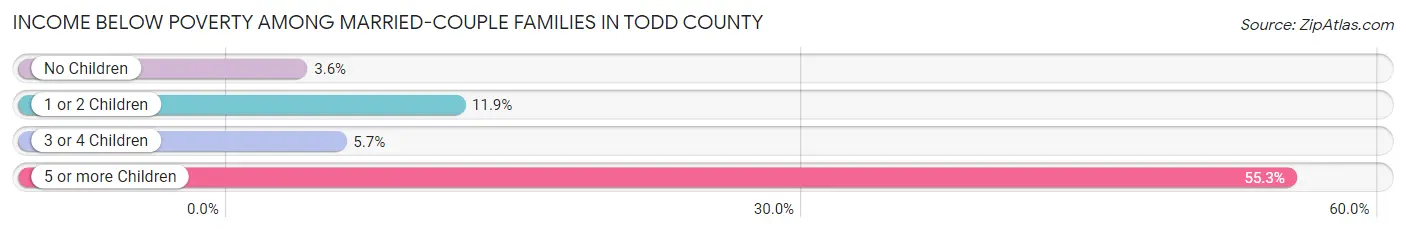
Income Below Poverty Among Married-Couple Families in Todd County
The poverty statistics for married-couple families in Todd County show that 9.5% or 253 of the total 2,657 families live below the poverty line. Families with 5 or more children have the highest poverty rate of 55.3%, comprising of 94 families. On the other hand, families with no children have the lowest poverty rate of 3.6%, which includes 54 families.
| Children | Above Poverty | Below Poverty |
| No Children | 1,437 (96.4%) | 54 (3.6%) |
| 1 or 2 Children | 691 (88.1%) | 93 (11.9%) |
| 3 or 4 Children | 200 (94.3%) | 12 (5.7%) |
| 5 or more Children | 76 (44.7%) | 94 (55.3%) |
| Total | 2,404 (90.5%) | 253 (9.5%) |
Income Below Poverty Among Single-Parent Households in Todd County
According to the poverty data in Todd County, 11.7% or 21 single-father households and 41.2% or 158 single-mother households are living below the poverty line. Among single-father households, those with no children have the highest poverty rate, with 21 households (17.5%) experiencing poverty. Likewise, among single-mother households, those with 3 or 4 children have the highest poverty rate, with 60 households (88.2%) falling below the poverty line.
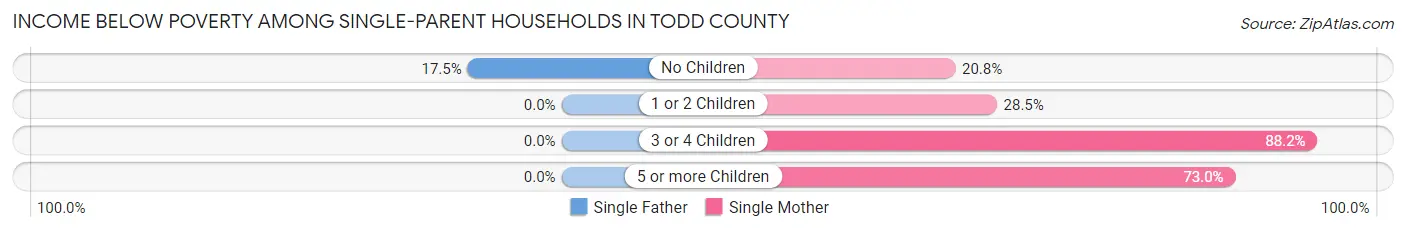
| Children | Single Father | Single Mother |
| No Children | 21 (17.5%) | 22 (20.7%) |
| 1 or 2 Children | 0 (0.0%) | 49 (28.5%) |
| 3 or 4 Children | 0 (0.0%) | 60 (88.2%) |
| 5 or more Children | 0 (0.0%) | 27 (73.0%) |
| Total | 21 (11.7%) | 158 (41.2%) |
Income Below Poverty Among Married-Couple vs Single-Parent Households in Todd County
The poverty data for Todd County shows that 253 of the married-couple family households (9.5%) and 179 of the single-parent households (31.8%) are living below the poverty level. Within the married-couple family households, those with 5 or more children have the highest poverty rate, with 94 households (55.3%) falling below the poverty line. Among the single-parent households, those with 3 or 4 children have the highest poverty rate, with 60 household (82.2%) living below poverty.
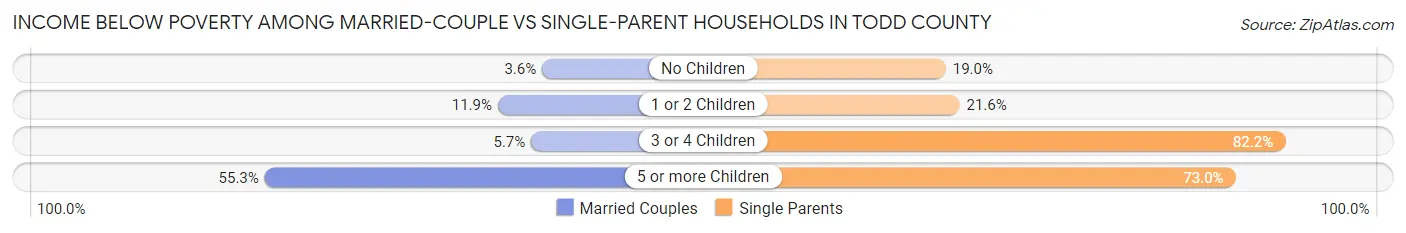
| Children | Married-Couple Families | Single-Parent Households |
| No Children | 54 (3.6%) | 43 (19.0%) |
| 1 or 2 Children | 93 (11.9%) | 49 (21.6%) |
| 3 or 4 Children | 12 (5.7%) | 60 (82.2%) |
| 5 or more Children | 94 (55.3%) | 27 (73.0%) |
| Total | 253 (9.5%) | 179 (31.8%) |
Race in Todd County
The most populous races in Todd County are White / Caucasian (10,560 | 86.0%), Black / African American (987 | 8.0%), and Hispanic or Latino (589 | 4.8%).
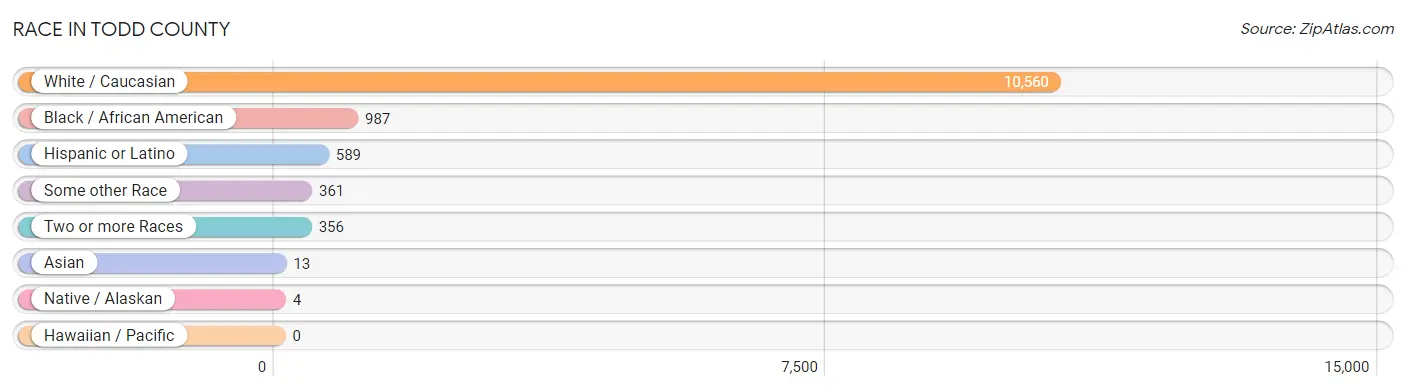
| Race | # Population | % Population |
| Asian | 13 | 0.1% |
| Black / African American | 987 | 8.0% |
| Hawaiian / Pacific | 0 | 0.0% |
| Hispanic or Latino | 589 | 4.8% |
| Native / Alaskan | 4 | 0.0% |
| White / Caucasian | 10,560 | 86.0% |
| Two or more Races | 356 | 2.9% |
| Some other Race | 361 | 2.9% |
| Total | 12,281 | 100.0% |
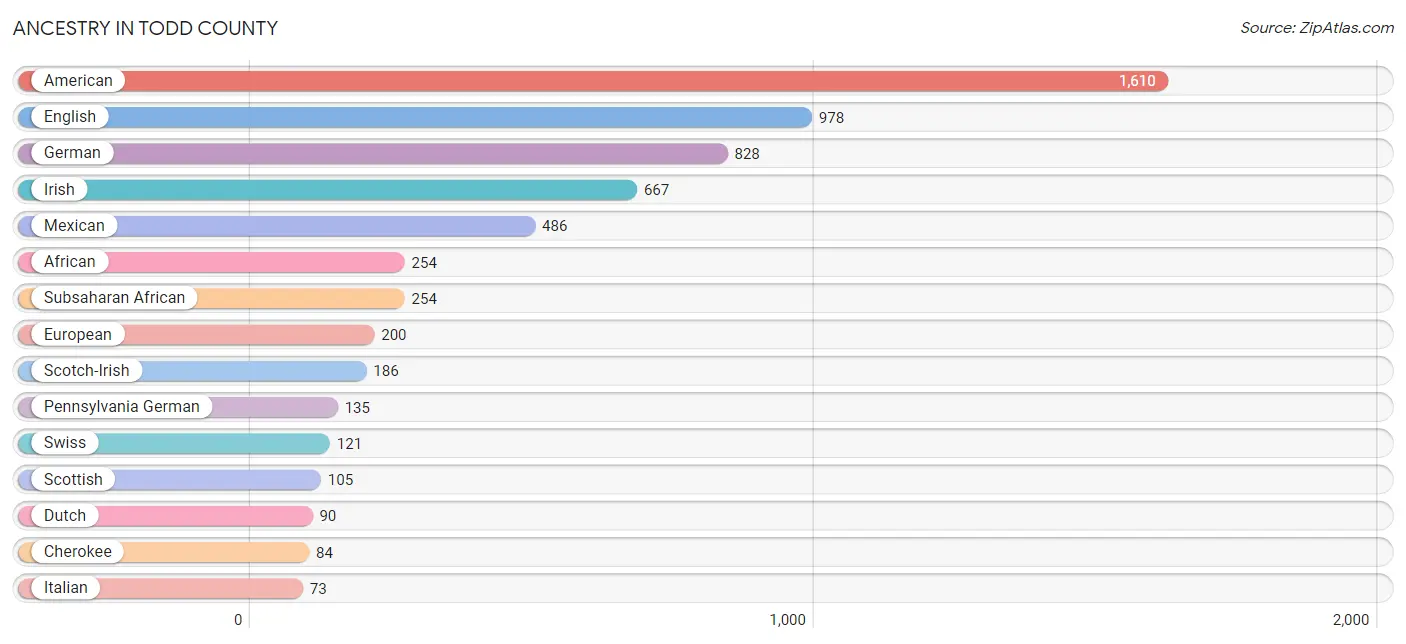
Ancestry in Todd County
The most populous ancestries reported in Todd County are American (1,610 | 13.1%), English (978 | 8.0%), German (828 | 6.7%), Irish (667 | 5.4%), and Mexican (486 | 4.0%), together accounting for 37.2% of all Todd County residents.
| Ancestry | # Population | % Population |
| African | 254 | 2.1% |
| American | 1,610 | 13.1% |
| Apache | 4 | 0.0% |
| Australian | 14 | 0.1% |
| Austrian | 2 | 0.0% |
| British | 13 | 0.1% |
| Central American | 20 | 0.2% |
| Cherokee | 84 | 0.7% |
| Creek | 68 | 0.5% |
| Cuban | 45 | 0.4% |
| Danish | 7 | 0.1% |
| Dutch | 90 | 0.7% |
| English | 978 | 8.0% |
| European | 200 | 1.6% |
| French | 42 | 0.3% |
| French Canadian | 10 | 0.1% |
| German | 828 | 6.7% |
| Indian (Asian) | 13 | 0.1% |
| Irish | 667 | 5.4% |
| Italian | 73 | 0.6% |
| Mexican | 486 | 4.0% |
| Native Hawaiian | 4 | 0.0% |
| Northern European | 2 | 0.0% |
| Norwegian | 37 | 0.3% |
| Pennsylvania German | 135 | 1.1% |
| Peruvian | 4 | 0.0% |
| Polish | 11 | 0.1% |
| Portuguese | 13 | 0.1% |
| Puerto Rican | 34 | 0.3% |
| Salvadoran | 20 | 0.2% |
| Scandinavian | 11 | 0.1% |
| Scotch-Irish | 186 | 1.5% |
| Scottish | 105 | 0.9% |
| Seminole | 17 | 0.1% |
| South American | 4 | 0.0% |
| Subsaharan African | 254 | 2.1% |
| Swedish | 12 | 0.1% |
| Swiss | 121 | 1.0% |
| Tlingit-Haida | 5 | 0.0% |
| Welsh | 29 | 0.2% | View All 40 Rows |
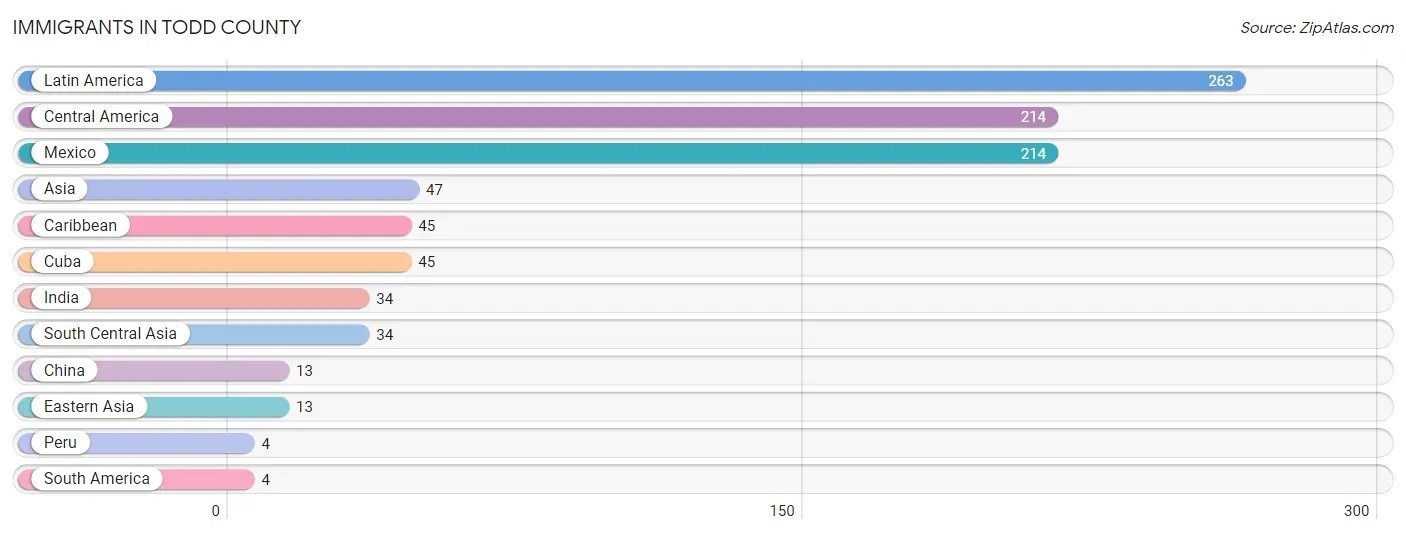
Immigrants in Todd County
The most numerous immigrant groups reported in Todd County came from Latin America (263 | 2.1%), Central America (214 | 1.7%), Mexico (214 | 1.7%), Asia (47 | 0.4%), and Caribbean (45 | 0.4%), together accounting for 6.4% of all Todd County residents.
| Immigration Origin | # Population | % Population |
| Asia | 47 | 0.4% |
| Caribbean | 45 | 0.4% |
| Central America | 214 | 1.7% |
| China | 13 | 0.1% |
| Cuba | 45 | 0.4% |
| Eastern Asia | 13 | 0.1% |
| India | 34 | 0.3% |
| Latin America | 263 | 2.1% |
| Mexico | 214 | 1.7% |
| Peru | 4 | 0.0% |
| South America | 4 | 0.0% |
| South Central Asia | 34 | 0.3% | View All 12 Rows |
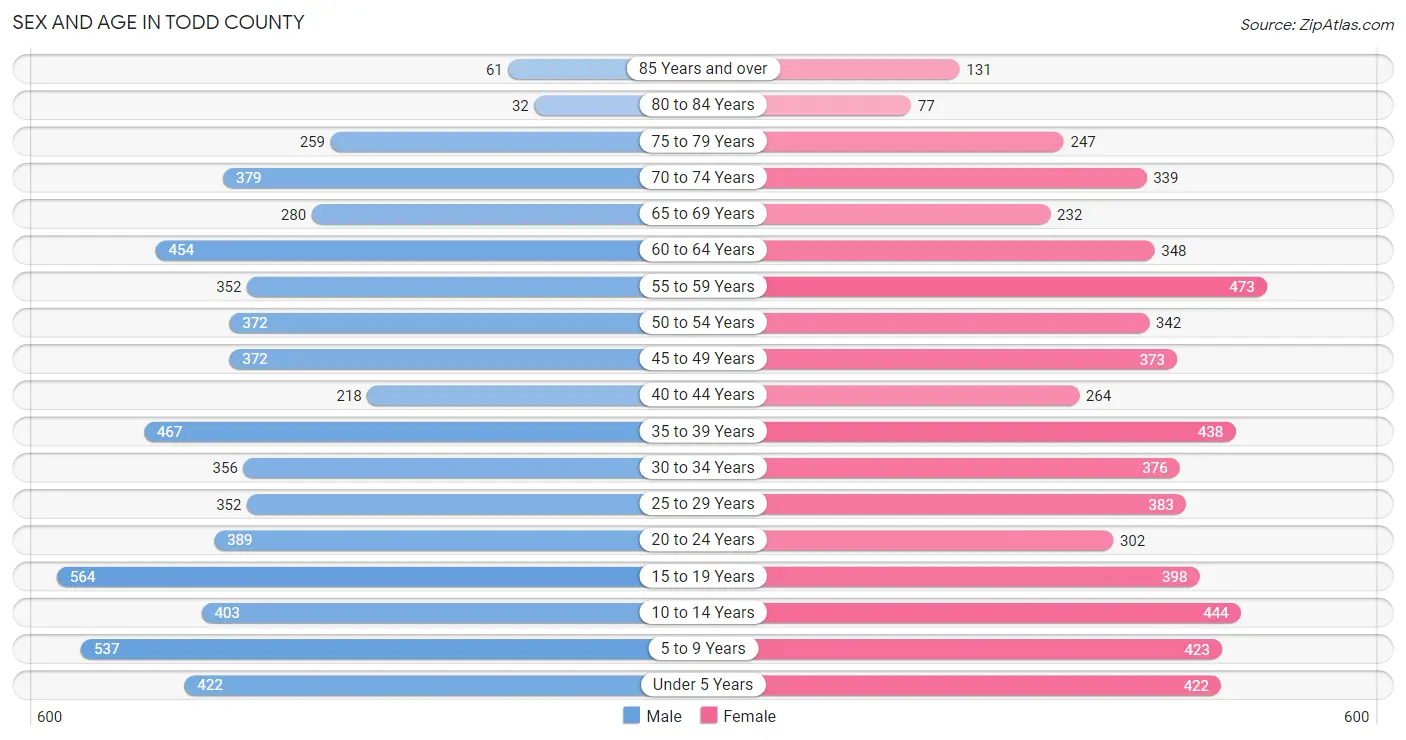
Sex and Age in Todd County
Sex and Age in Todd County
The most populous age groups in Todd County are 15 to 19 Years (564 | 9.0%) for men and 55 to 59 Years (473 | 7.9%) for women.
| Age Bracket | Male | Female |
| Under 5 Years | 422 (6.7%) | 422 (7.0%) |
| 5 to 9 Years | 537 (8.6%) | 423 (7.0%) |
| 10 to 14 Years | 403 (6.4%) | 444 (7.4%) |
| 15 to 19 Years | 564 (9.0%) | 398 (6.6%) |
| 20 to 24 Years | 389 (6.2%) | 302 (5.0%) |
| 25 to 29 Years | 352 (5.6%) | 383 (6.4%) |
| 30 to 34 Years | 356 (5.7%) | 376 (6.2%) |
| 35 to 39 Years | 467 (7.4%) | 438 (7.3%) |
| 40 to 44 Years | 218 (3.5%) | 264 (4.4%) |
| 45 to 49 Years | 372 (5.9%) | 373 (6.2%) |
| 50 to 54 Years | 372 (5.9%) | 342 (5.7%) |
| 55 to 59 Years | 352 (5.6%) | 473 (7.9%) |
| 60 to 64 Years | 454 (7.2%) | 348 (5.8%) |
| 65 to 69 Years | 280 (4.5%) | 232 (3.9%) |
| 70 to 74 Years | 379 (6.0%) | 339 (5.6%) |
| 75 to 79 Years | 259 (4.1%) | 247 (4.1%) |
| 80 to 84 Years | 32 (0.5%) | 77 (1.3%) |
| 85 Years and over | 61 (1.0%) | 131 (2.2%) |
| Total | 6,269 (100.0%) | 6,012 (100.0%) |
Families and Households in Todd County
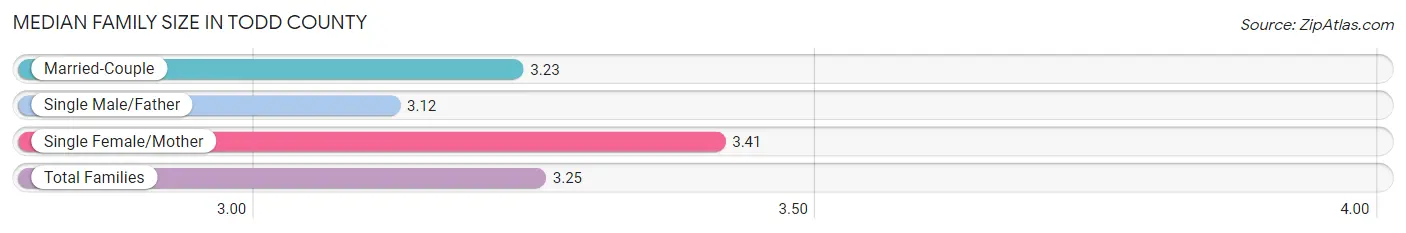
Median Family Size in Todd County
The median family size in Todd County is 3.25 persons per family, with single female/mother families (383 | 11.9%) accounting for the largest median family size of 3.41 persons per family. On the other hand, single male/father families (180 | 5.6%) represent the smallest median family size with 3.12 persons per family.
| Family Type | # Families | Family Size |
| Married-Couple | 2,657 (82.5%) | 3.23 |
| Single Male/Father | 180 (5.6%) | 3.12 |
| Single Female/Mother | 383 (11.9%) | 3.41 |
| Total Families | 3,220 (100.0%) | 3.25 |
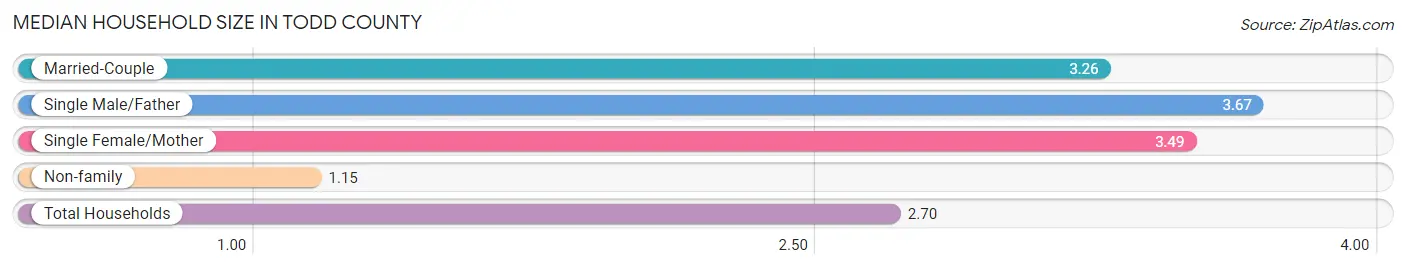
Median Household Size in Todd County
The median household size in Todd County is 2.70 persons per household, with single male/father households (180 | 4.0%) accounting for the largest median household size of 3.67 persons per household. non-family households (1,256 | 28.1%) represent the smallest median household size with 1.15 persons per household.
| Household Type | # Households | Household Size |
| Married-Couple | 2,657 (59.4%) | 3.26 |
| Single Male/Father | 180 (4.0%) | 3.67 |
| Single Female/Mother | 383 (8.6%) | 3.49 |
| Non-family | 1,256 (28.1%) | 1.15 |
| Total Households | 4,476 (100.0%) | 2.70 |
Household Size by Marriage Status in Todd County
Out of a total of 4,476 households in Todd County, 3,220 (71.9%) are family households, while 1,256 (28.1%) are nonfamily households. The most numerous type of family households are 2-person households, comprising 1,242, and the most common type of nonfamily households are 1-person households, comprising 1,049.
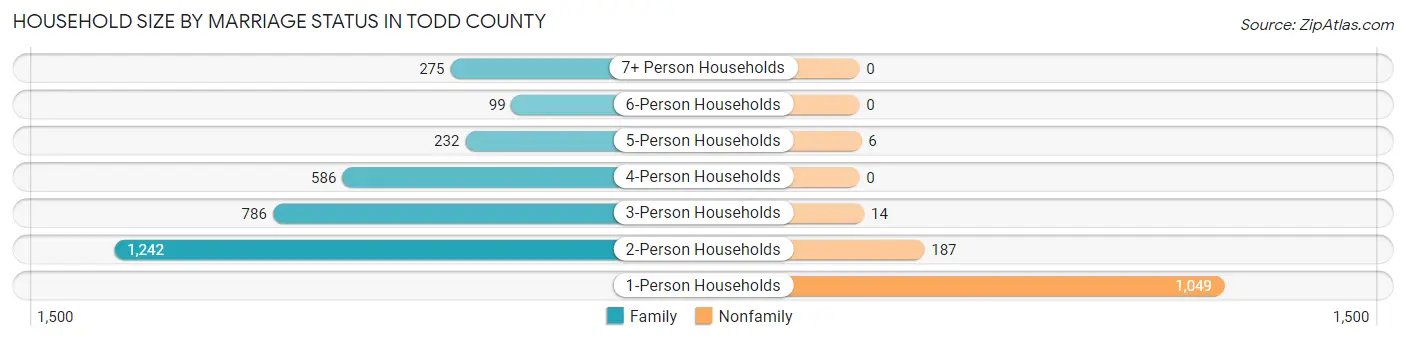
| Household Size | Family Households | Nonfamily Households |
| 1-Person Households | - | 1,049 (23.4%) |
| 2-Person Households | 1,242 (27.8%) | 187 (4.2%) |
| 3-Person Households | 786 (17.6%) | 14 (0.3%) |
| 4-Person Households | 586 (13.1%) | 0 (0.0%) |
| 5-Person Households | 232 (5.2%) | 6 (0.1%) |
| 6-Person Households | 99 (2.2%) | 0 (0.0%) |
| 7+ Person Households | 275 (6.1%) | 0 (0.0%) |
| Total | 3,220 (71.9%) | 1,256 (28.1%) |
Female Fertility in Todd County
Fertility by Age in Todd County
Average fertility rate in Todd County is 63.0 births per 1,000 women. Women in the age bracket of 20 to 34 years have the highest fertility rate with 143.0 births per 1,000 women. Women in the age bracket of 20 to 34 years acount for 93.8% of all women with births.
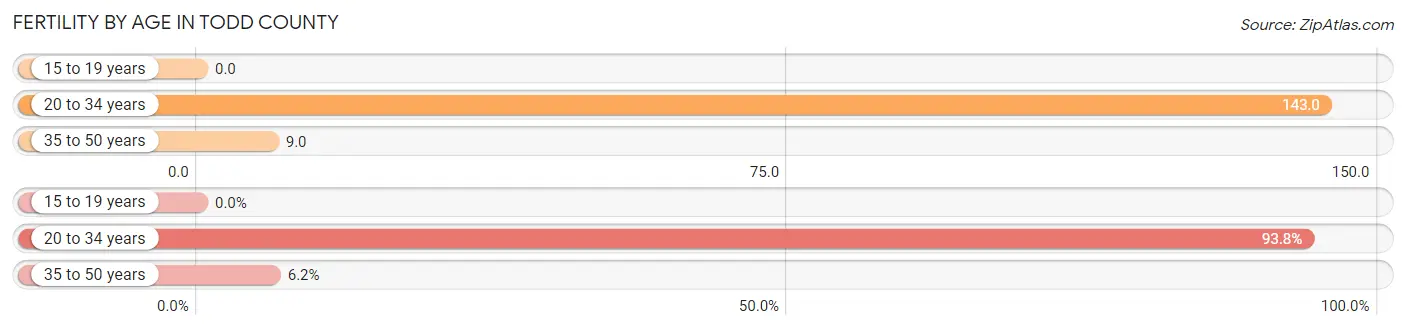
| Age Bracket | Women with Births | Births / 1,000 Women |
| 15 to 19 years | 0 (0.0%) | 0.0 |
| 20 to 34 years | 152 (93.8%) | 143.0 |
| 35 to 50 years | 10 (6.2%) | 9.0 |
| Total | 162 (100.0%) | 63.0 |
Fertility by Age by Marriage Status in Todd County
95.7% of women with births (162) in Todd County are married. The highest percentage of unmarried women with births falls into 35 to 50 years age bracket with 70.0% of them unmarried at the time of birth, while the lowest percentage of unmarried women with births belong to 20 to 34 years age bracket with 0.0% of them unmarried.
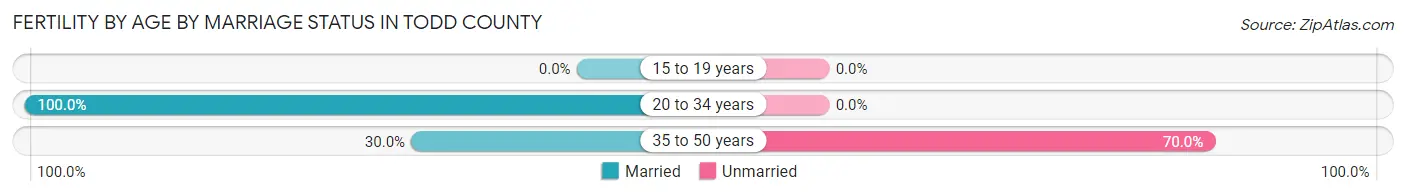
| Age Bracket | Married | Unmarried |
| 15 to 19 years | 0 (0.0%) | 0 (0.0%) |
| 20 to 34 years | 152 (100.0%) | 0 (0.0%) |
| 35 to 50 years | 3 (30.0%) | 7 (70.0%) |
| Total | 155 (95.7%) | 7 (4.3%) |
Fertility by Education in Todd County
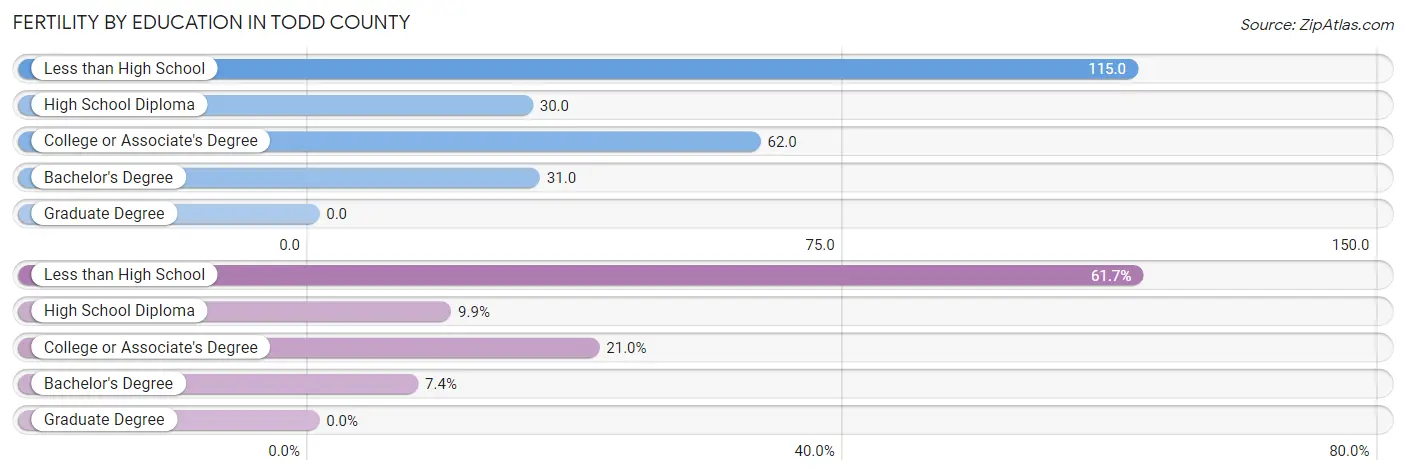
| Educational Attainment | Women with Births | Births / 1,000 Women |
| Less than High School | 100 (61.7%) | 115.0 |
| High School Diploma | 16 (9.9%) | 30.0 |
| College or Associate's Degree | 34 (21.0%) | 62.0 |
| Bachelor's Degree | 12 (7.4%) | 31.0 |
| Graduate Degree | 0 (0.0%) | 0.0 |
| Total | 162 (100.0%) | 63.0 |
Fertility by Education by Marriage Status in Todd County
4.3% of women with births in Todd County are unmarried. Women with the educational attainment of less than high school are most likely to be married with 100.0% of them married at childbirth, while women with the educational attainment of high school diploma are least likely to be married with 43.8% of them unmarried at childbirth.
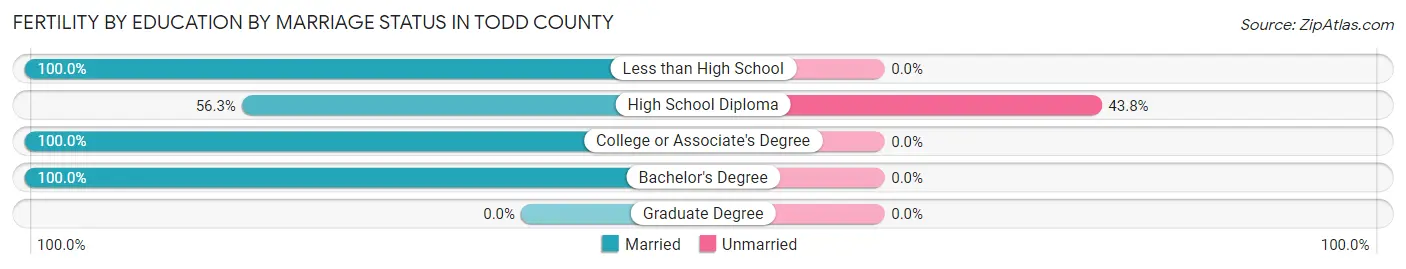
| Educational Attainment | Married | Unmarried |
| Less than High School | 100 (100.0%) | 0 (0.0%) |
| High School Diploma | 9 (56.2%) | 7 (43.8%) |
| College or Associate's Degree | 34 (100.0%) | 0 (0.0%) |
| Bachelor's Degree | 12 (100.0%) | 0 (0.0%) |
| Graduate Degree | 0 (0.0%) | 0 (0.0%) |
| Total | 155 (95.7%) | 7 (4.3%) |
Employment Characteristics in Todd County
Employment by Class of Employer in Todd County
Among the 4,967 employed individuals in Todd County, private company employees (3,100 | 62.4%), self-employed (not incorporated) (605 | 12.2%), and local government employees (511 | 10.3%) make up the most common classes of employment.
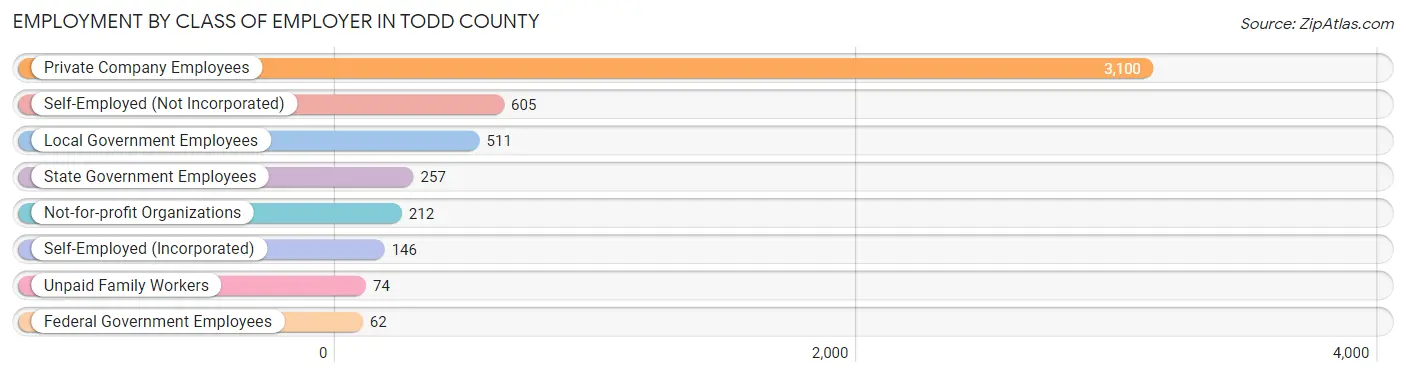
| Employer Class | # Employees | % Employees |
| Private Company Employees | 3,100 | 62.4% |
| Self-Employed (Incorporated) | 146 | 2.9% |
| Self-Employed (Not Incorporated) | 605 | 12.2% |
| Not-for-profit Organizations | 212 | 4.3% |
| Local Government Employees | 511 | 10.3% |
| State Government Employees | 257 | 5.2% |
| Federal Government Employees | 62 | 1.3% |
| Unpaid Family Workers | 74 | 1.5% |
| Total | 4,967 | 100.0% |
Employment Status by Age in Todd County
According to the labor force statistics for Todd County, out of the total population over 16 years of age (9,432), 56.0% or 5,282 individuals are in the labor force, with 4.3% or 227 of them unemployed. The age group with the highest labor force participation rate is 25 to 29 years, with 89.7% or 659 individuals in the labor force. Within the labor force, the 16 to 19 years age range has the highest percentage of unemployed individuals, with 16.8% or 63 of them being unemployed.
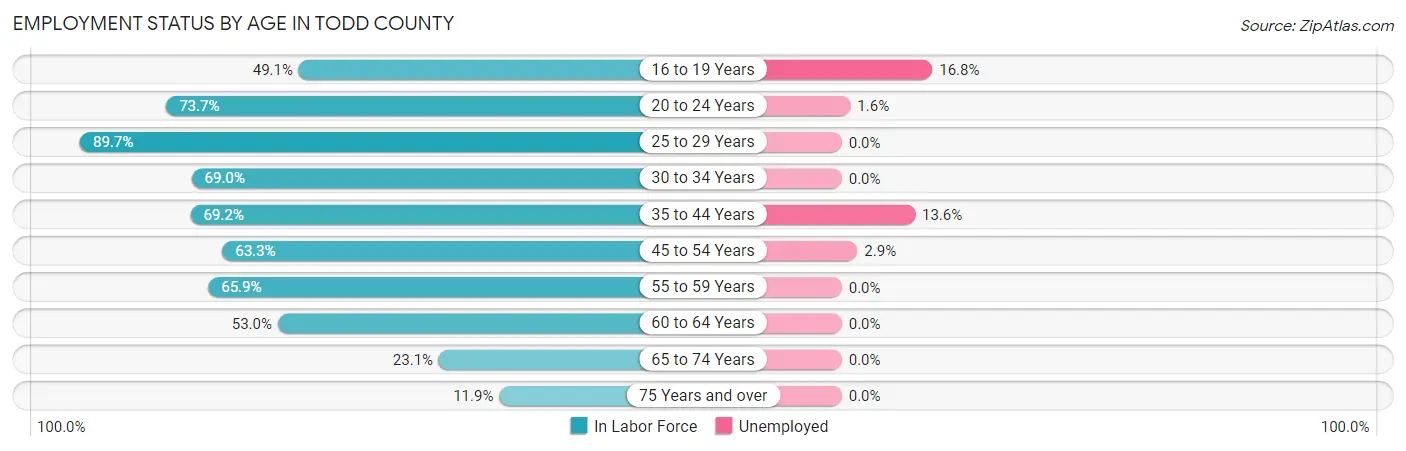
| Age Bracket | In Labor Force | Unemployed |
| 16 to 19 Years | 375 (49.1%) | 63 (16.8%) |
| 20 to 24 Years | 509 (73.7%) | 8 (1.6%) |
| 25 to 29 Years | 659 (89.7%) | 0 (0.0%) |
| 30 to 34 Years | 505 (69.0%) | 0 (0.0%) |
| 35 to 44 Years | 960 (69.2%) | 131 (13.6%) |
| 45 to 54 Years | 924 (63.3%) | 27 (2.9%) |
| 55 to 59 Years | 544 (65.9%) | 0 (0.0%) |
| 60 to 64 Years | 425 (53.0%) | 0 (0.0%) |
| 65 to 74 Years | 284 (23.1%) | 0 (0.0%) |
| 75 Years and over | 96 (11.9%) | 0 (0.0%) |
| Total | 5,282 (56.0%) | 227 (4.3%) |
Employment Status by Educational Attainment in Todd County
According to labor force statistics for Todd County, 67.6% of individuals (4,015) out of the total population between 25 and 64 years of age (5,940) are in the labor force, with 3.9% or 157 of them being unemployed. The group with the highest labor force participation rate are those with the educational attainment of bachelor's degree or higher, with 77.0% or 812 individuals in the labor force. Within the labor force, individuals with less than high school education have the highest percentage of unemployment, with 8.2% or 47 of them being unemployed.
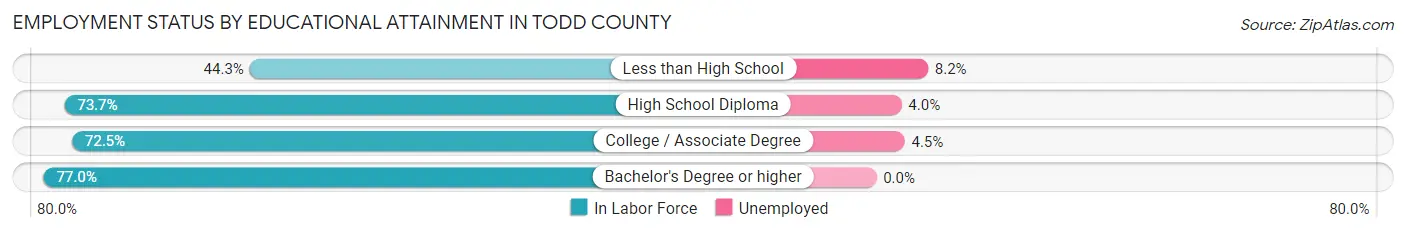
| Educational Attainment | In Labor Force | Unemployed |
| Less than High School | 572 (44.3%) | 106 (8.2%) |
| High School Diploma | 1,591 (73.7%) | 86 (4.0%) |
| College / Associate Degree | 1,040 (72.5%) | 65 (4.5%) |
| Bachelor's Degree or higher | 812 (77.0%) | 0 (0.0%) |
| Total | 4,015 (67.6%) | 232 (3.9%) |
Employment Occupations by Sex in Todd County
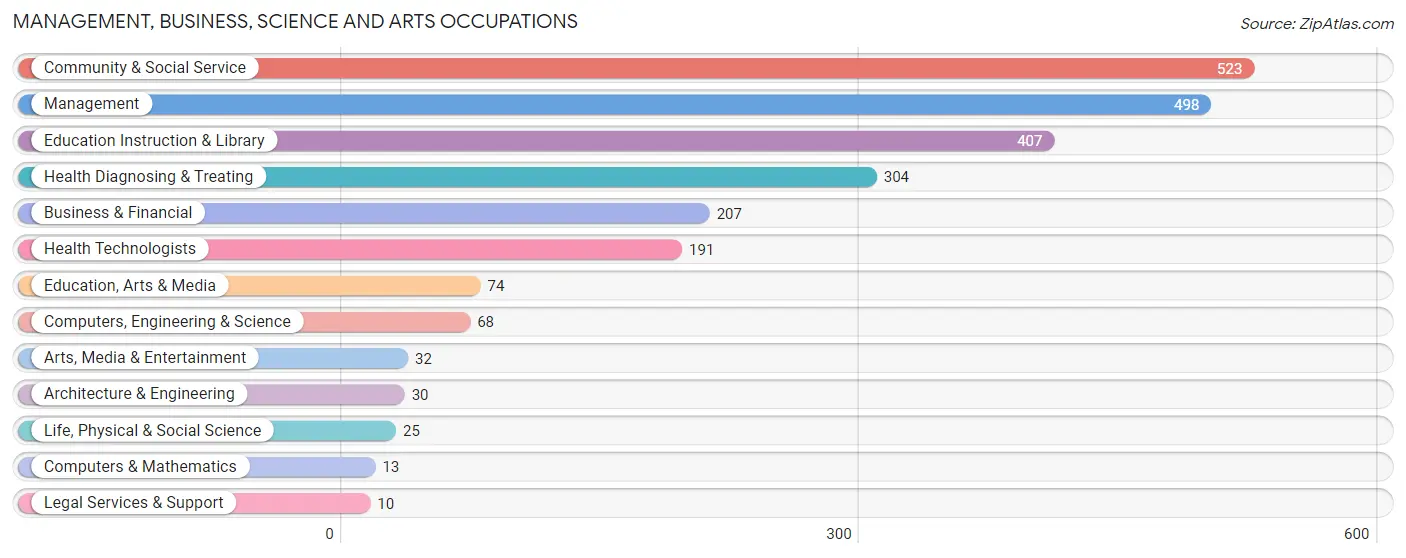
Management, Business, Science and Arts Occupations
The most common Management, Business, Science and Arts occupations in Todd County are Community & Social Service (523 | 10.4%), Management (498 | 9.9%), Education Instruction & Library (407 | 8.1%), Health Diagnosing & Treating (304 | 6.0%), and Business & Financial (207 | 4.1%).
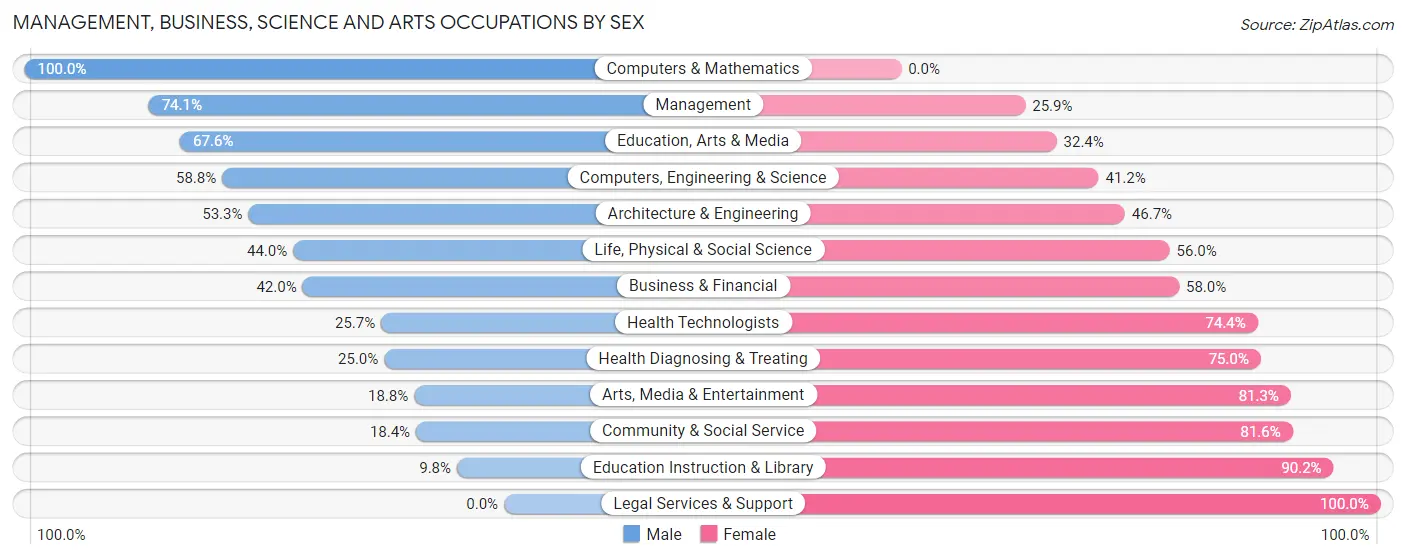
Management, Business, Science and Arts Occupations by Sex
Within the Management, Business, Science and Arts occupations in Todd County, the most male-oriented occupations are Computers & Mathematics (100.0%), Management (74.1%), and Education, Arts & Media (67.6%), while the most female-oriented occupations are Legal Services & Support (100.0%), Education Instruction & Library (90.2%), and Community & Social Service (81.6%).
| Occupation | Male | Female |
| Management | 369 (74.1%) | 129 (25.9%) |
| Business & Financial | 87 (42.0%) | 120 (58.0%) |
| Computers, Engineering & Science | 40 (58.8%) | 28 (41.2%) |
| Computers & Mathematics | 13 (100.0%) | 0 (0.0%) |
| Architecture & Engineering | 16 (53.3%) | 14 (46.7%) |
| Life, Physical & Social Science | 11 (44.0%) | 14 (56.0%) |
| Community & Social Service | 96 (18.4%) | 427 (81.6%) |
| Education, Arts & Media | 50 (67.6%) | 24 (32.4%) |
| Legal Services & Support | 0 (0.0%) | 10 (100.0%) |
| Education Instruction & Library | 40 (9.8%) | 367 (90.2%) |
| Arts, Media & Entertainment | 6 (18.8%) | 26 (81.2%) |
| Health Diagnosing & Treating | 76 (25.0%) | 228 (75.0%) |
| Health Technologists | 49 (25.7%) | 142 (74.4%) |
| Total (Category) | 668 (41.7%) | 932 (58.3%) |
| Total (Overall) | 2,925 (57.9%) | 2,123 (42.1%) |
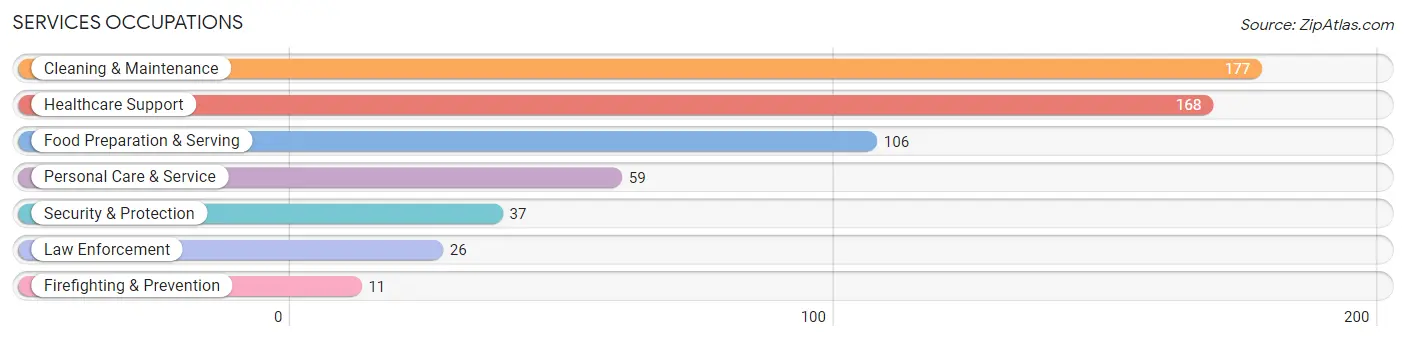
Services Occupations
The most common Services occupations in Todd County are Cleaning & Maintenance (177 | 3.5%), Healthcare Support (168 | 3.3%), Food Preparation & Serving (106 | 2.1%), Personal Care & Service (59 | 1.2%), and Security & Protection (37 | 0.7%).
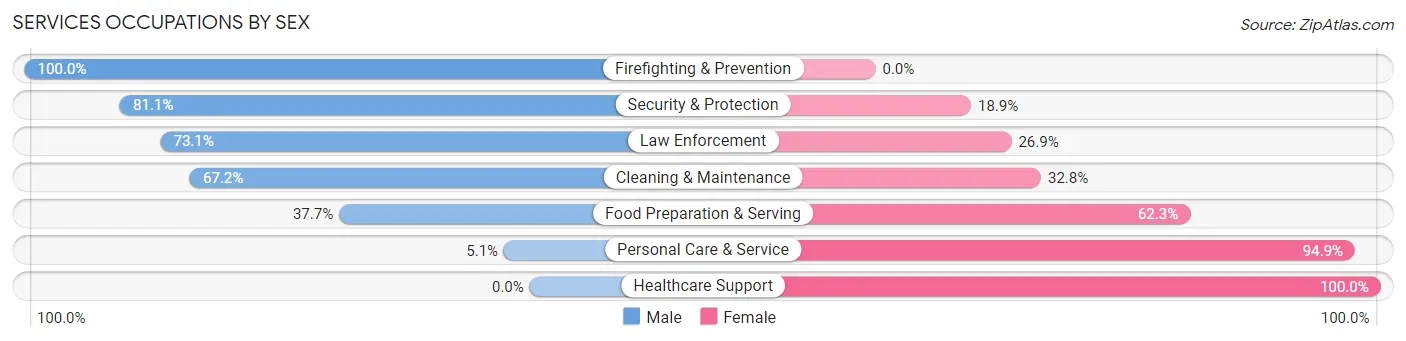
Services Occupations by Sex
Within the Services occupations in Todd County, the most male-oriented occupations are Firefighting & Prevention (100.0%), Security & Protection (81.1%), and Law Enforcement (73.1%), while the most female-oriented occupations are Healthcare Support (100.0%), Personal Care & Service (94.9%), and Food Preparation & Serving (62.3%).
| Occupation | Male | Female |
| Healthcare Support | 0 (0.0%) | 168 (100.0%) |
| Security & Protection | 30 (81.1%) | 7 (18.9%) |
| Firefighting & Prevention | 11 (100.0%) | 0 (0.0%) |
| Law Enforcement | 19 (73.1%) | 7 (26.9%) |
| Food Preparation & Serving | 40 (37.7%) | 66 (62.3%) |
| Cleaning & Maintenance | 119 (67.2%) | 58 (32.8%) |
| Personal Care & Service | 3 (5.1%) | 56 (94.9%) |
| Total (Category) | 192 (35.1%) | 355 (64.9%) |
| Total (Overall) | 2,925 (57.9%) | 2,123 (42.1%) |
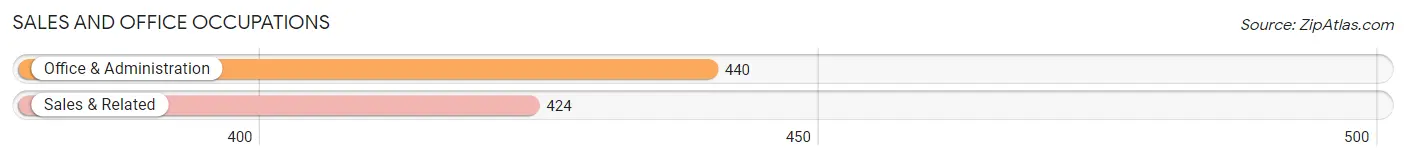
Sales and Office Occupations
The most common Sales and Office occupations in Todd County are Office & Administration (440 | 8.7%), and Sales & Related (424 | 8.4%).
Sales and Office Occupations by Sex
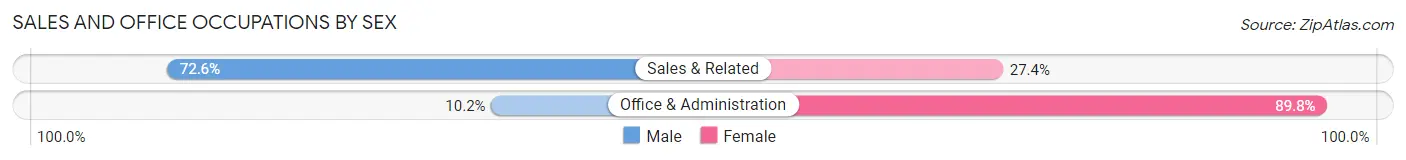
| Occupation | Male | Female |
| Sales & Related | 308 (72.6%) | 116 (27.4%) |
| Office & Administration | 45 (10.2%) | 395 (89.8%) |
| Total (Category) | 353 (40.9%) | 511 (59.1%) |
| Total (Overall) | 2,925 (57.9%) | 2,123 (42.1%) |
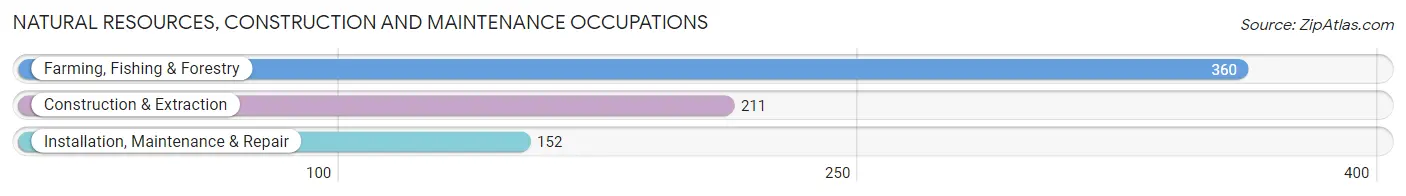
Natural Resources, Construction and Maintenance Occupations
The most common Natural Resources, Construction and Maintenance occupations in Todd County are Farming, Fishing & Forestry (360 | 7.1%), Construction & Extraction (211 | 4.2%), and Installation, Maintenance & Repair (152 | 3.0%).
Natural Resources, Construction and Maintenance Occupations by Sex
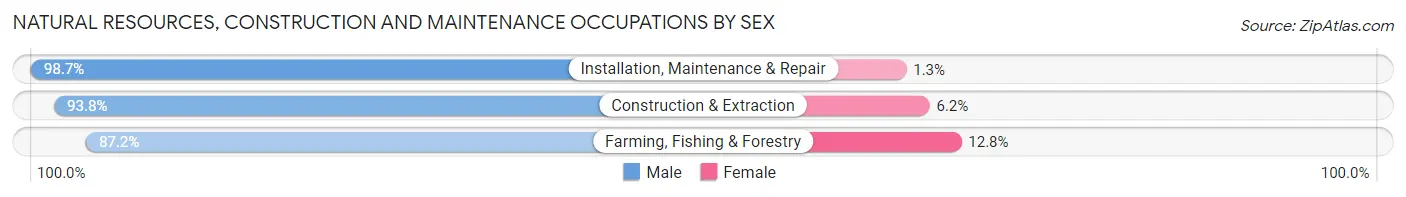
| Occupation | Male | Female |
| Farming, Fishing & Forestry | 314 (87.2%) | 46 (12.8%) |
| Construction & Extraction | 198 (93.8%) | 13 (6.2%) |
| Installation, Maintenance & Repair | 150 (98.7%) | 2 (1.3%) |
| Total (Category) | 662 (91.6%) | 61 (8.4%) |
| Total (Overall) | 2,925 (57.9%) | 2,123 (42.1%) |
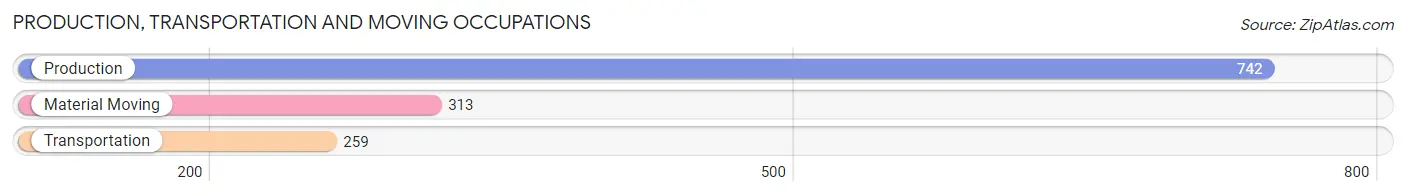
Production, Transportation and Moving Occupations
The most common Production, Transportation and Moving occupations in Todd County are Production (742 | 14.7%), Material Moving (313 | 6.2%), and Transportation (259 | 5.1%).
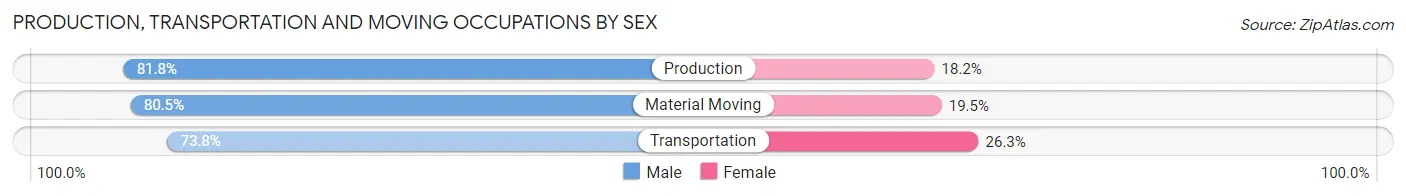
Production, Transportation and Moving Occupations by Sex
| Occupation | Male | Female |
| Production | 607 (81.8%) | 135 (18.2%) |
| Transportation | 191 (73.8%) | 68 (26.3%) |
| Material Moving | 252 (80.5%) | 61 (19.5%) |
| Total (Category) | 1,050 (79.9%) | 264 (20.1%) |
| Total (Overall) | 2,925 (57.9%) | 2,123 (42.1%) |
Employment Industries by Sex in Todd County
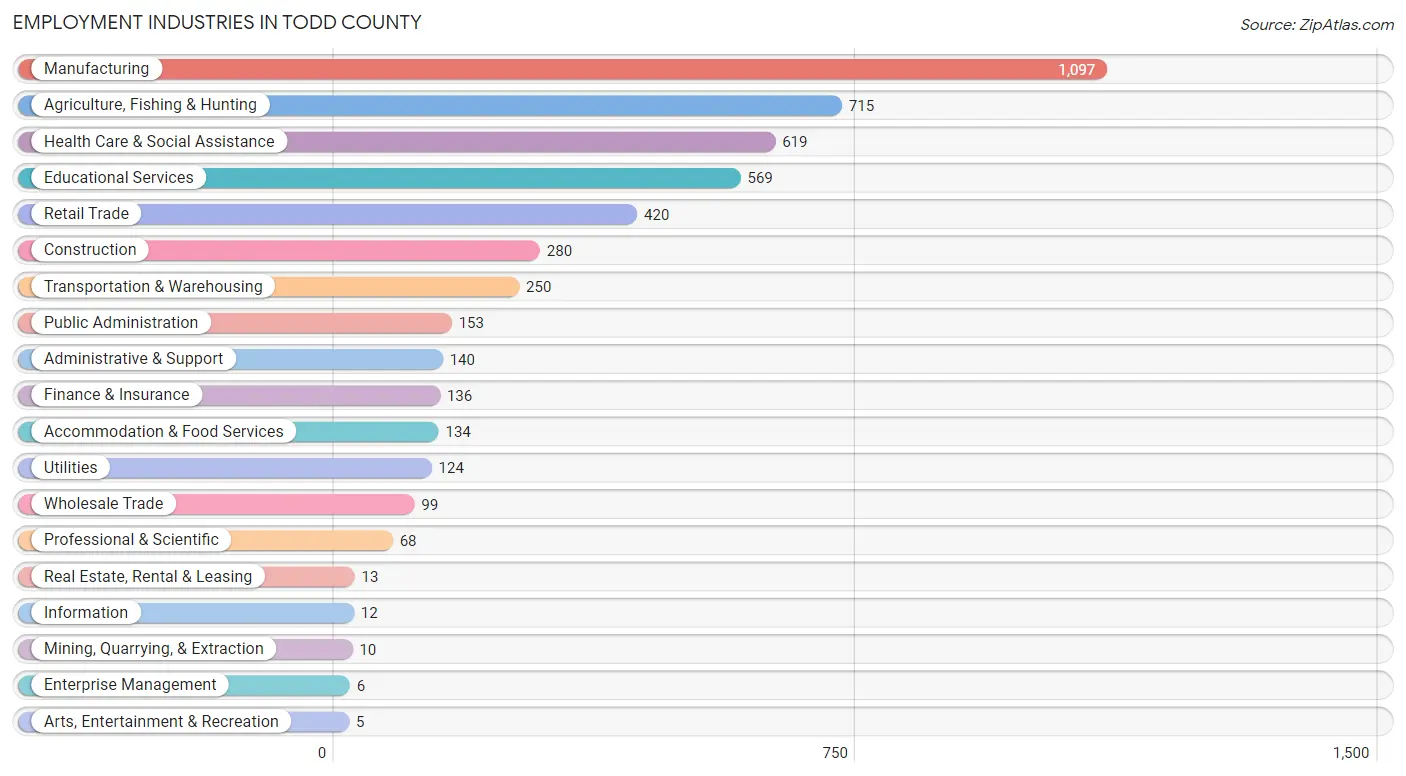
Employment Industries in Todd County
The major employment industries in Todd County include Manufacturing (1,097 | 21.7%), Agriculture, Fishing & Hunting (715 | 14.2%), Health Care & Social Assistance (619 | 12.3%), Educational Services (569 | 11.3%), and Retail Trade (420 | 8.3%).
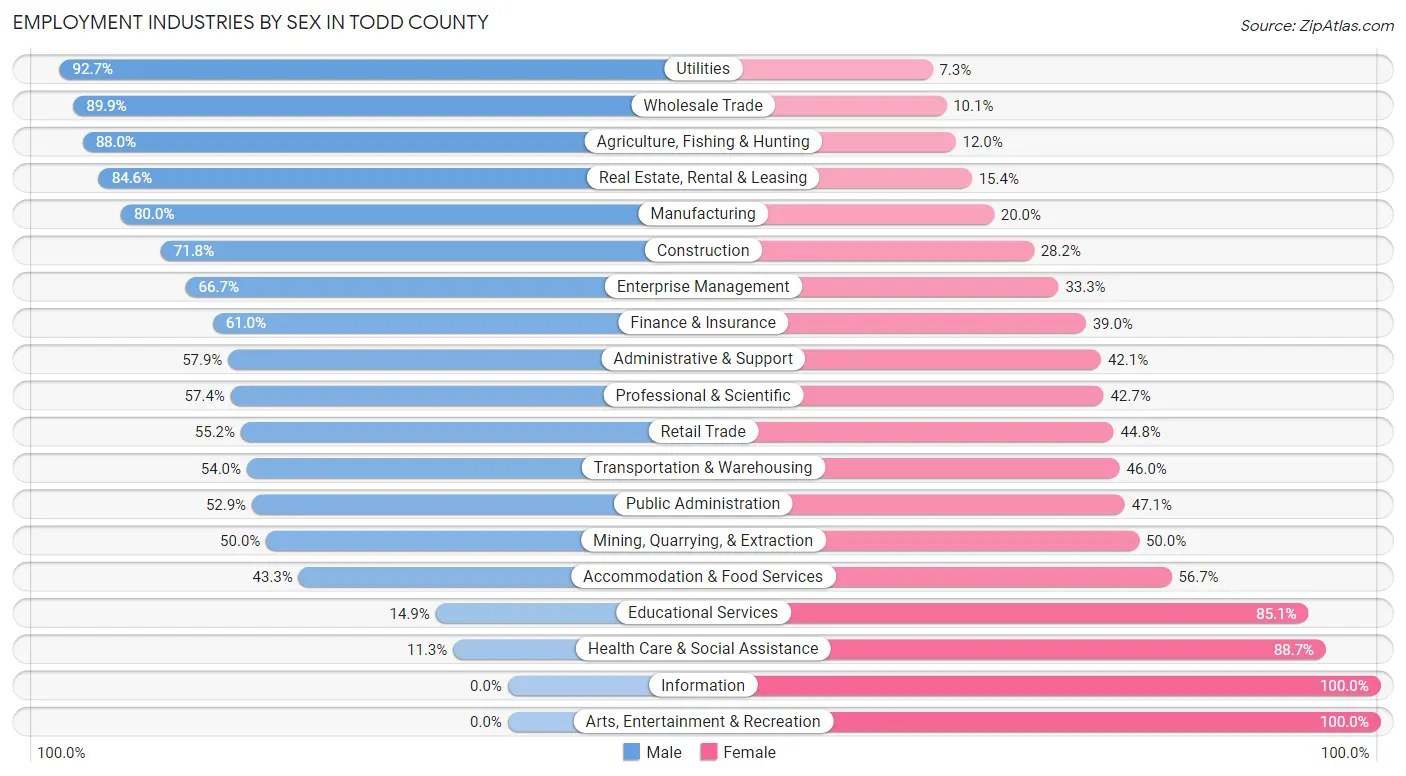
Employment Industries by Sex in Todd County
The Todd County industries that see more men than women are Utilities (92.7%), Wholesale Trade (89.9%), and Agriculture, Fishing & Hunting (88.0%), whereas the industries that tend to have a higher number of women are Information (100.0%), Arts, Entertainment & Recreation (100.0%), and Health Care & Social Assistance (88.7%).
| Industry | Male | Female |
| Agriculture, Fishing & Hunting | 629 (88.0%) | 86 (12.0%) |
| Mining, Quarrying, & Extraction | 5 (50.0%) | 5 (50.0%) |
| Construction | 201 (71.8%) | 79 (28.2%) |
| Manufacturing | 878 (80.0%) | 219 (20.0%) |
| Wholesale Trade | 89 (89.9%) | 10 (10.1%) |
| Retail Trade | 232 (55.2%) | 188 (44.8%) |
| Transportation & Warehousing | 135 (54.0%) | 115 (46.0%) |
| Utilities | 115 (92.7%) | 9 (7.3%) |
| Information | 0 (0.0%) | 12 (100.0%) |
| Finance & Insurance | 83 (61.0%) | 53 (39.0%) |
| Real Estate, Rental & Leasing | 11 (84.6%) | 2 (15.4%) |
| Professional & Scientific | 39 (57.4%) | 29 (42.6%) |
| Enterprise Management | 4 (66.7%) | 2 (33.3%) |
| Administrative & Support | 81 (57.9%) | 59 (42.1%) |
| Educational Services | 85 (14.9%) | 484 (85.1%) |
| Health Care & Social Assistance | 70 (11.3%) | 549 (88.7%) |
| Arts, Entertainment & Recreation | 0 (0.0%) | 5 (100.0%) |
| Accommodation & Food Services | 58 (43.3%) | 76 (56.7%) |
| Public Administration | 81 (52.9%) | 72 (47.1%) |
| Total | 2,925 (57.9%) | 2,123 (42.1%) |
Education in Todd County
School Enrollment in Todd County
The most common levels of schooling among the 2,671 students in Todd County are high school (706 | 26.4%), middle school (664 | 24.9%), and elementary school (659 | 24.7%).
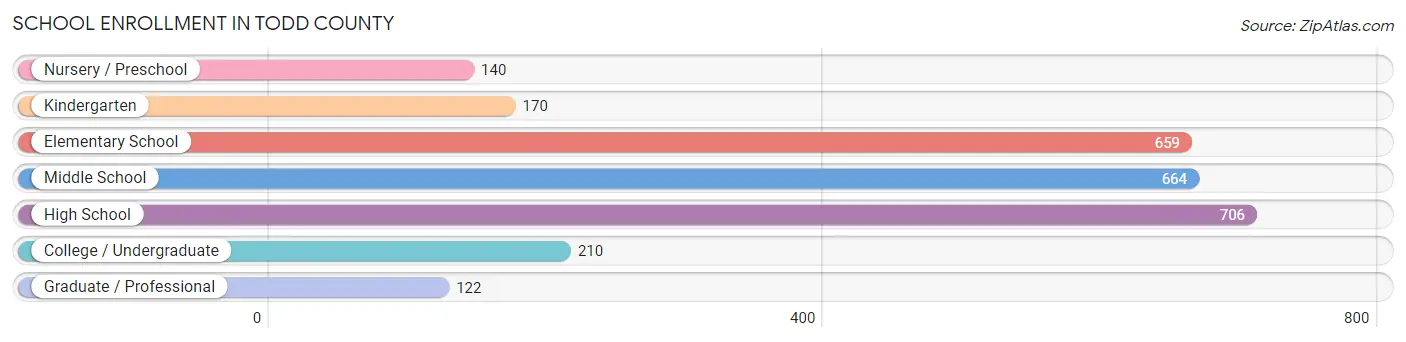
| School Level | # Students | % Students |
| Nursery / Preschool | 140 | 5.2% |
| Kindergarten | 170 | 6.4% |
| Elementary School | 659 | 24.7% |
| Middle School | 664 | 24.9% |
| High School | 706 | 26.4% |
| College / Undergraduate | 210 | 7.9% |
| Graduate / Professional | 122 | 4.6% |
| Total | 2,671 | 100.0% |
School Enrollment by Age by Funding Source in Todd County
Out of a total of 2,671 students who are enrolled in schools in Todd County, 617 (23.1%) attend a private institution, while the remaining 2,054 (76.9%) are enrolled in public schools. The age group of 35 years and over has the highest likelihood of being enrolled in private schools, with 33 (44.6% in the age bracket) enrolled. Conversely, the age group of 15 to 17 year olds has the lowest likelihood of being enrolled in a private school, with 514 (95.4% in the age bracket) attending a public institution.
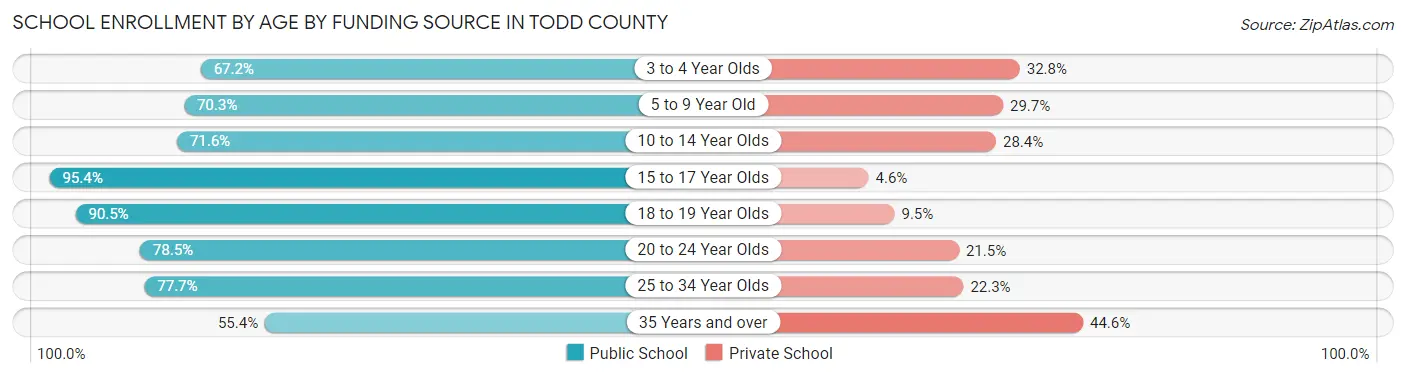
| Age Bracket | Public School | Private School |
| 3 to 4 Year Olds | 43 (67.2%) | 21 (32.8%) |
| 5 to 9 Year Old | 573 (70.3%) | 242 (29.7%) |
| 10 to 14 Year Olds | 578 (71.6%) | 229 (28.4%) |
| 15 to 17 Year Olds | 514 (95.4%) | 25 (4.6%) |
| 18 to 19 Year Olds | 105 (90.5%) | 11 (9.5%) |
| 20 to 24 Year Olds | 106 (78.5%) | 29 (21.5%) |
| 25 to 34 Year Olds | 94 (77.7%) | 27 (22.3%) |
| 35 Years and over | 41 (55.4%) | 33 (44.6%) |
| Total | 2,054 (76.9%) | 617 (23.1%) |
Educational Attainment by Field of Study in Todd County
Education (241 | 17.1%), bio, nature & agricultural (224 | 15.9%), science & technology (215 | 15.3%), business (204 | 14.5%), and social sciences (85 | 6.0%) are the most common fields of study among 1,406 individuals in Todd County who have obtained a bachelor's degree or higher.
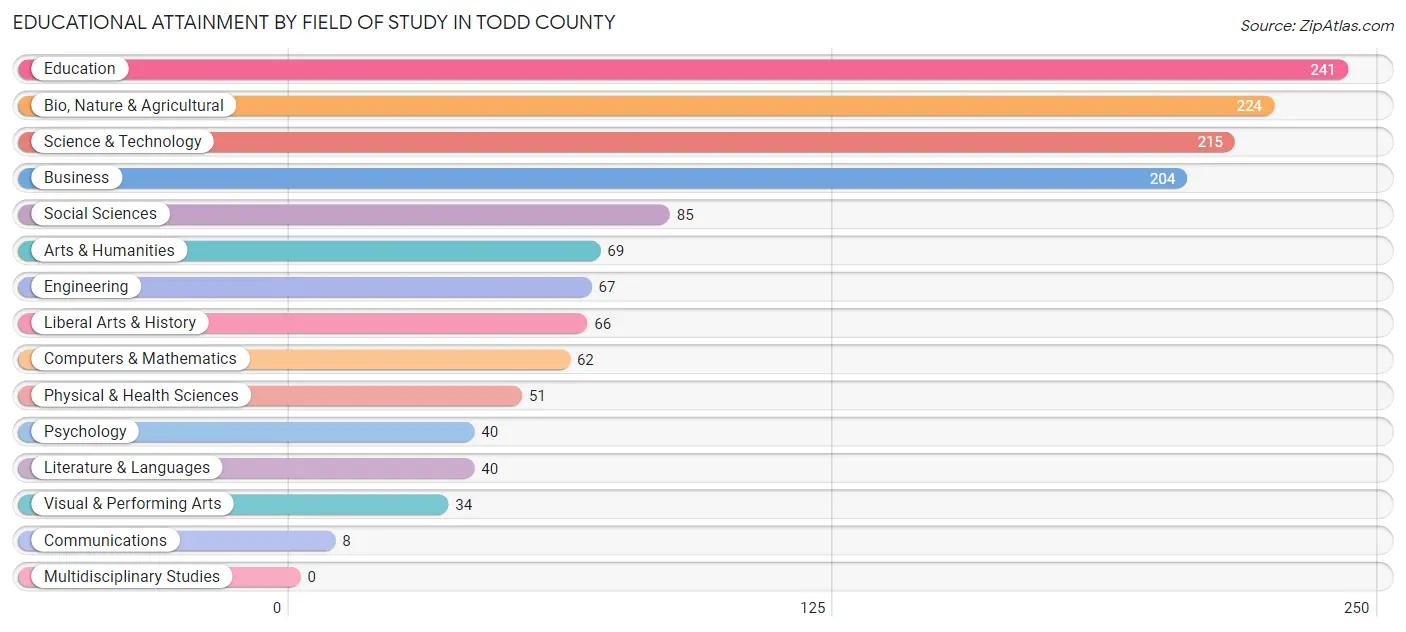
| Field of Study | # Graduates | % Graduates |
| Computers & Mathematics | 62 | 4.4% |
| Bio, Nature & Agricultural | 224 | 15.9% |
| Physical & Health Sciences | 51 | 3.6% |
| Psychology | 40 | 2.8% |
| Social Sciences | 85 | 6.0% |
| Engineering | 67 | 4.8% |
| Multidisciplinary Studies | 0 | 0.0% |
| Science & Technology | 215 | 15.3% |
| Business | 204 | 14.5% |
| Education | 241 | 17.1% |
| Literature & Languages | 40 | 2.8% |
| Liberal Arts & History | 66 | 4.7% |
| Visual & Performing Arts | 34 | 2.4% |
| Communications | 8 | 0.6% |
| Arts & Humanities | 69 | 4.9% |
| Total | 1,406 | 100.0% |
Transportation & Commute in Todd County
Vehicle Availability by Sex in Todd County
The most prevalent vehicle ownership categories in Todd County are males with 3 vehicles (794, accounting for 27.4%) and females with 3 vehicles (627, making up 38.4%).
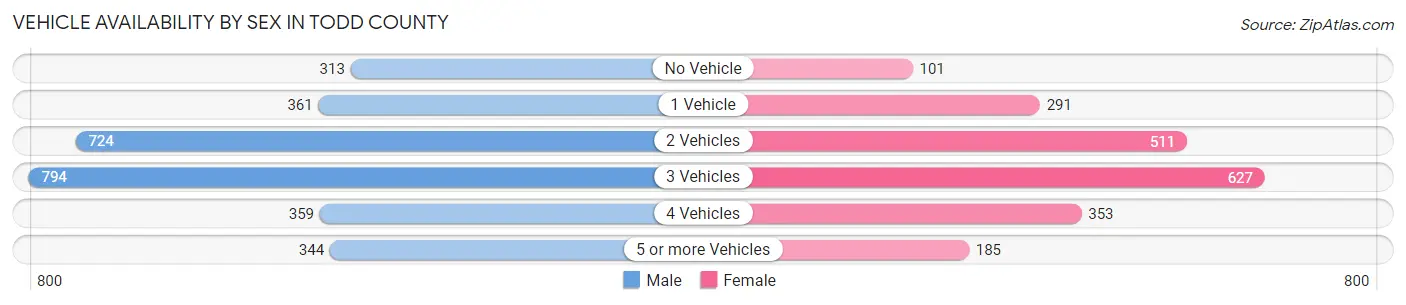
| Vehicles Available | Male | Female |
| No Vehicle | 313 (10.8%) | 101 (4.9%) |
| 1 Vehicle | 361 (12.5%) | 291 (14.1%) |
| 2 Vehicles | 724 (25.0%) | 511 (24.7%) |
| 3 Vehicles | 794 (27.4%) | 627 (30.3%) |
| 4 Vehicles | 359 (12.4%) | 353 (17.1%) |
| 5 or more Vehicles | 344 (11.9%) | 185 (8.9%) |
| Total | 2,895 (100.0%) | 2,068 (100.0%) |
Commute Time in Todd County
The most frequently occuring commute durations in Todd County are 30 to 34 minutes (839 commuters, 18.6%), 20 to 24 minutes (584 commuters, 13.0%), and 25 to 29 minutes (573 commuters, 12.7%).
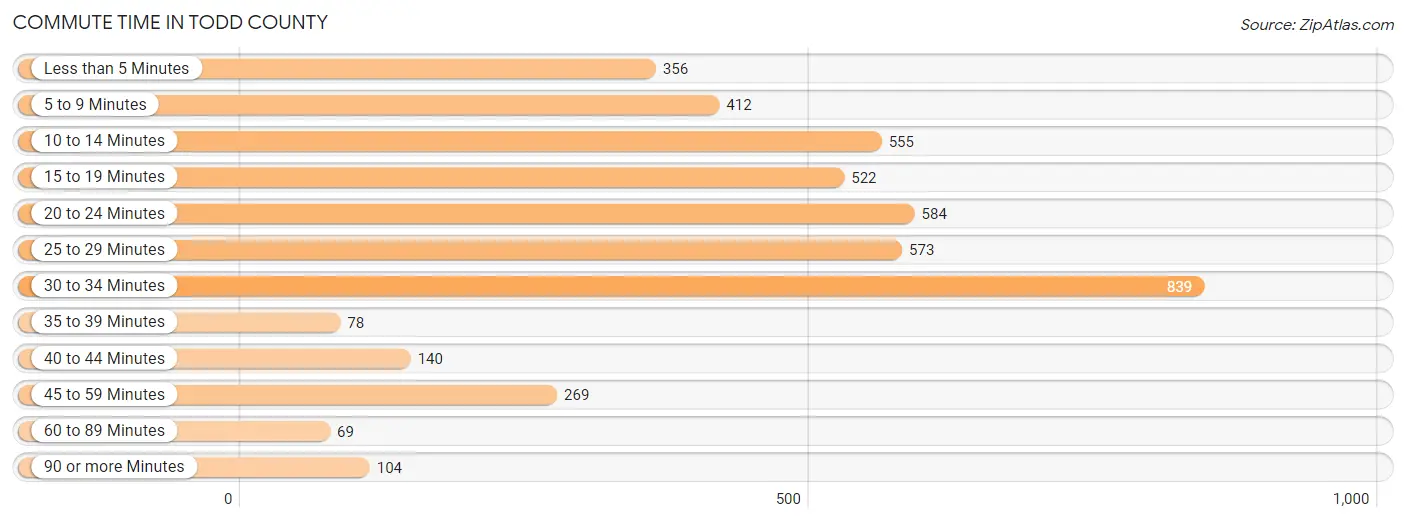
| Commute Time | # Commuters | % Commuters |
| Less than 5 Minutes | 356 | 7.9% |
| 5 to 9 Minutes | 412 | 9.1% |
| 10 to 14 Minutes | 555 | 12.3% |
| 15 to 19 Minutes | 522 | 11.6% |
| 20 to 24 Minutes | 584 | 13.0% |
| 25 to 29 Minutes | 573 | 12.7% |
| 30 to 34 Minutes | 839 | 18.6% |
| 35 to 39 Minutes | 78 | 1.7% |
| 40 to 44 Minutes | 140 | 3.1% |
| 45 to 59 Minutes | 269 | 6.0% |
| 60 to 89 Minutes | 69 | 1.5% |
| 90 or more Minutes | 104 | 2.3% |
Commute Time by Sex in Todd County
The most common commute times in Todd County are 30 to 34 minutes (445 commuters, 17.3%) for males and 30 to 34 minutes (394 commuters, 20.5%) for females.
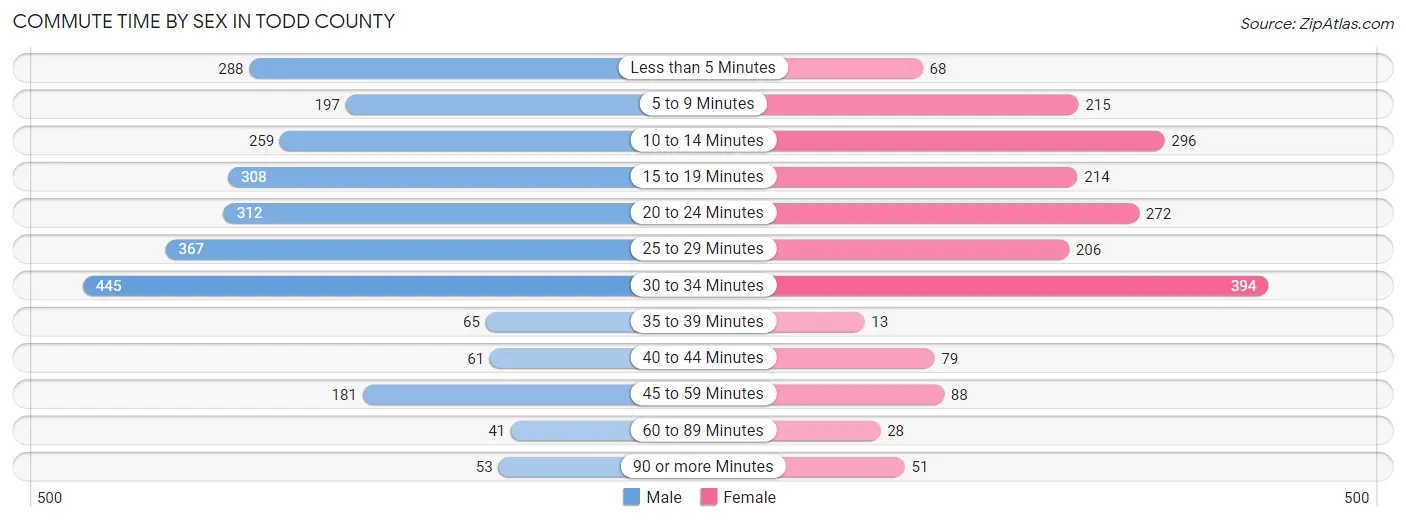
| Commute Time | Male | Female |
| Less than 5 Minutes | 288 (11.2%) | 68 (3.5%) |
| 5 to 9 Minutes | 197 (7.6%) | 215 (11.2%) |
| 10 to 14 Minutes | 259 (10.1%) | 296 (15.4%) |
| 15 to 19 Minutes | 308 (11.9%) | 214 (11.1%) |
| 20 to 24 Minutes | 312 (12.1%) | 272 (14.1%) |
| 25 to 29 Minutes | 367 (14.2%) | 206 (10.7%) |
| 30 to 34 Minutes | 445 (17.3%) | 394 (20.5%) |
| 35 to 39 Minutes | 65 (2.5%) | 13 (0.7%) |
| 40 to 44 Minutes | 61 (2.4%) | 79 (4.1%) |
| 45 to 59 Minutes | 181 (7.0%) | 88 (4.6%) |
| 60 to 89 Minutes | 41 (1.6%) | 28 (1.5%) |
| 90 or more Minutes | 53 (2.1%) | 51 (2.6%) |
Time of Departure to Work by Sex in Todd County
The most frequent times of departure to work in Todd County are 7:00 AM to 7:29 AM (421, 16.3%) for males and 7:00 AM to 7:29 AM (409, 21.3%) for females.
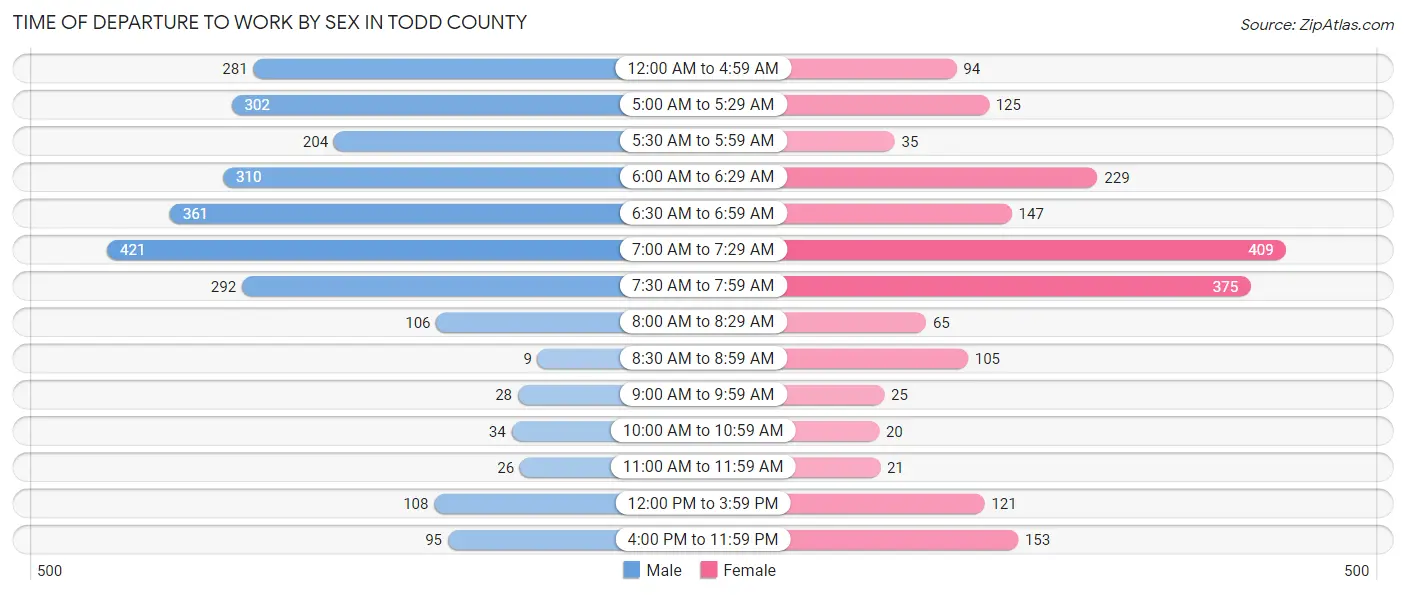
| Time of Departure | Male | Female |
| 12:00 AM to 4:59 AM | 281 (10.9%) | 94 (4.9%) |
| 5:00 AM to 5:29 AM | 302 (11.7%) | 125 (6.5%) |
| 5:30 AM to 5:59 AM | 204 (7.9%) | 35 (1.8%) |
| 6:00 AM to 6:29 AM | 310 (12.0%) | 229 (11.9%) |
| 6:30 AM to 6:59 AM | 361 (14.0%) | 147 (7.6%) |
| 7:00 AM to 7:29 AM | 421 (16.3%) | 409 (21.3%) |
| 7:30 AM to 7:59 AM | 292 (11.3%) | 375 (19.5%) |
| 8:00 AM to 8:29 AM | 106 (4.1%) | 65 (3.4%) |
| 8:30 AM to 8:59 AM | 9 (0.4%) | 105 (5.5%) |
| 9:00 AM to 9:59 AM | 28 (1.1%) | 25 (1.3%) |
| 10:00 AM to 10:59 AM | 34 (1.3%) | 20 (1.0%) |
| 11:00 AM to 11:59 AM | 26 (1.0%) | 21 (1.1%) |
| 12:00 PM to 3:59 PM | 108 (4.2%) | 121 (6.3%) |
| 4:00 PM to 11:59 PM | 95 (3.7%) | 153 (8.0%) |
| Total | 2,577 (100.0%) | 1,924 (100.0%) |
Housing Occupancy in Todd County
Occupancy by Ownership in Todd County
Of the total 4,476 dwellings in Todd County, owner-occupied units account for 3,346 (74.8%), while renter-occupied units make up 1,130 (25.3%).
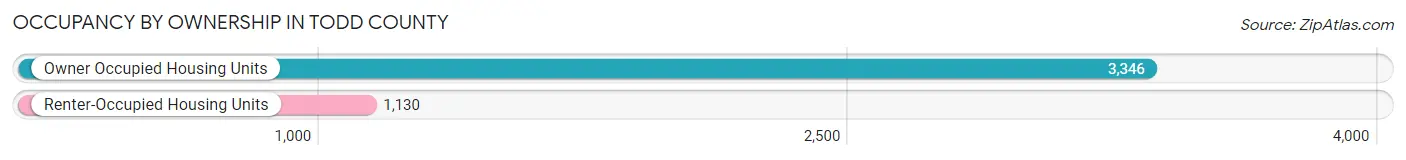
| Occupancy | # Housing Units | % Housing Units |
| Owner Occupied Housing Units | 3,346 | 74.8% |
| Renter-Occupied Housing Units | 1,130 | 25.3% |
| Total Occupied Housing Units | 4,476 | 100.0% |
Occupancy by Household Size in Todd County
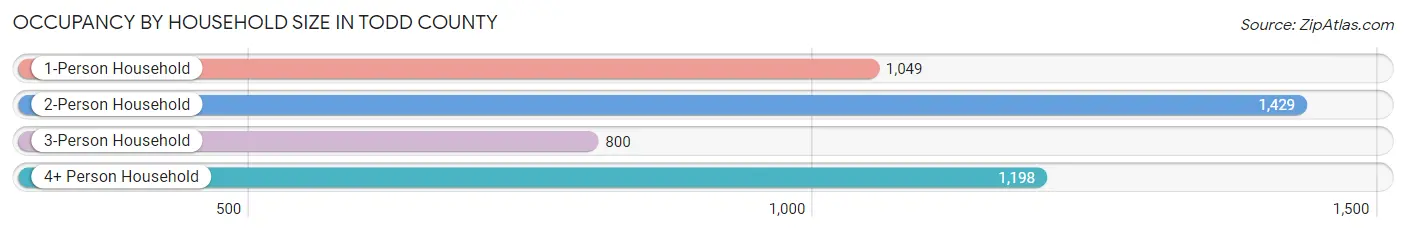
| Household Size | # Housing Units | % Housing Units |
| 1-Person Household | 1,049 | 23.4% |
| 2-Person Household | 1,429 | 31.9% |
| 3-Person Household | 800 | 17.9% |
| 4+ Person Household | 1,198 | 26.8% |
| Total Housing Units | 4,476 | 100.0% |
Occupancy by Ownership by Household Size in Todd County
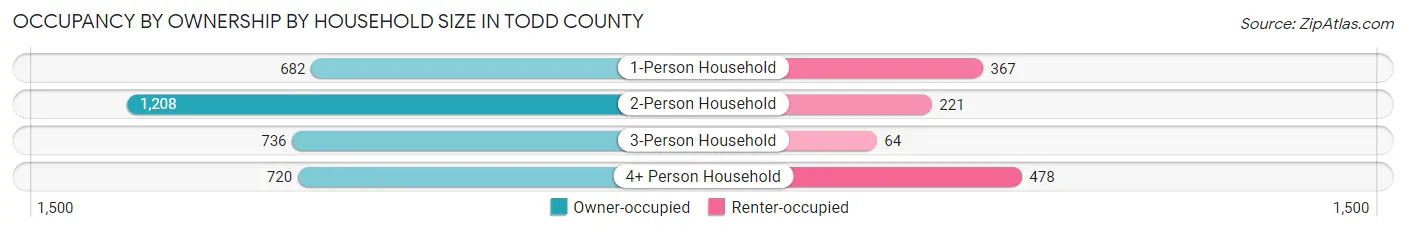
| Household Size | Owner-occupied | Renter-occupied |
| 1-Person Household | 682 (65.0%) | 367 (35.0%) |
| 2-Person Household | 1,208 (84.5%) | 221 (15.5%) |
| 3-Person Household | 736 (92.0%) | 64 (8.0%) |
| 4+ Person Household | 720 (60.1%) | 478 (39.9%) |
| Total Housing Units | 3,346 (74.8%) | 1,130 (25.3%) |
Occupancy by Educational Attainment in Todd County
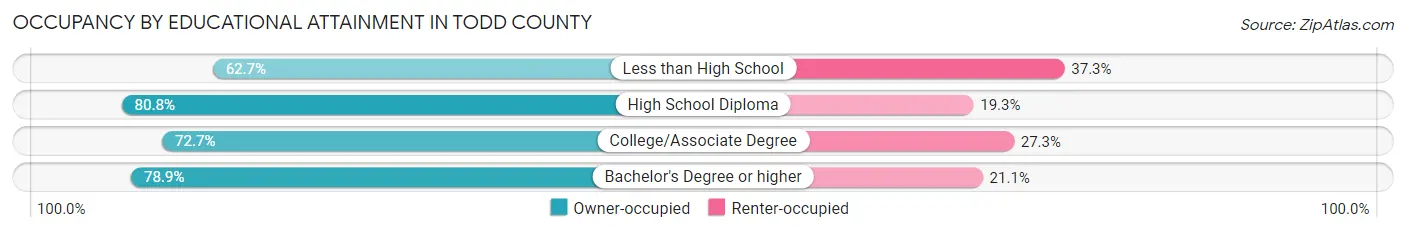
| Household Size | Owner-occupied | Renter-occupied |
| Less than High School | 615 (62.7%) | 366 (37.3%) |
| High School Diploma | 1,502 (80.7%) | 358 (19.3%) |
| College/Associate Degree | 717 (72.7%) | 269 (27.3%) |
| Bachelor's Degree or higher | 512 (78.9%) | 137 (21.1%) |
Occupancy by Age of Householder in Todd County
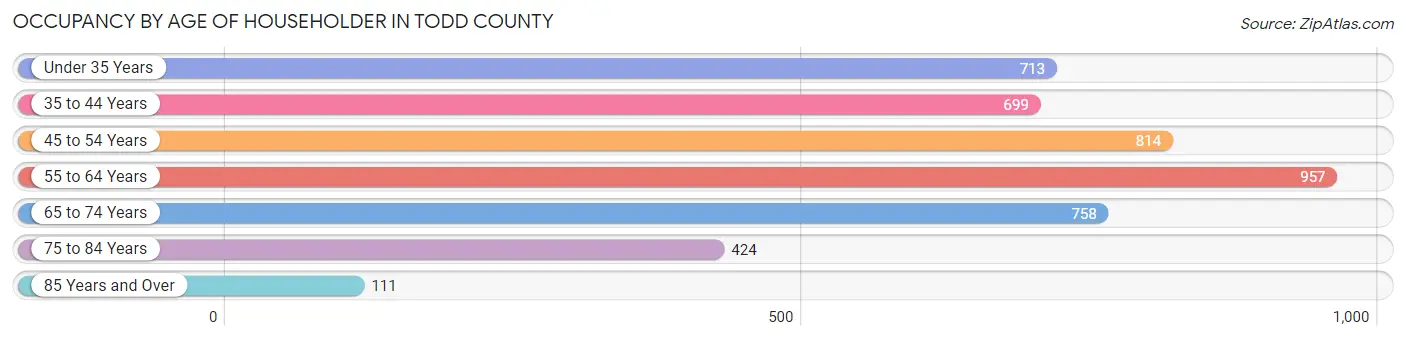
| Age Bracket | # Households | % Households |
| Under 35 Years | 713 | 15.9% |
| 35 to 44 Years | 699 | 15.6% |
| 45 to 54 Years | 814 | 18.2% |
| 55 to 64 Years | 957 | 21.4% |
| 65 to 74 Years | 758 | 16.9% |
| 75 to 84 Years | 424 | 9.5% |
| 85 Years and Over | 111 | 2.5% |
| Total | 4,476 | 100.0% |
Housing Finances in Todd County
Median Income by Occupancy in Todd County
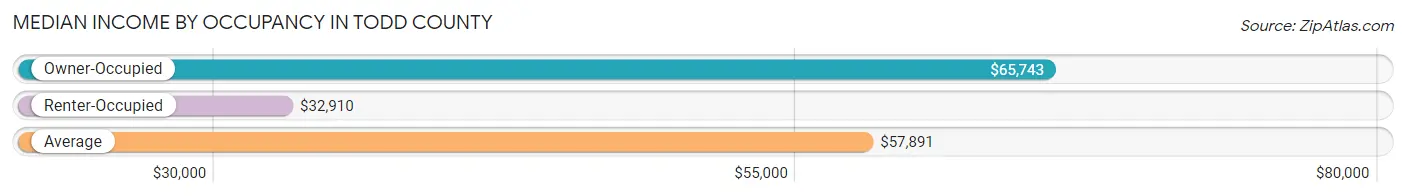
| Occupancy Type | # Households | Median Income |
| Owner-Occupied | 3,346 (74.8%) | $65,743 |
| Renter-Occupied | 1,130 (25.3%) | $32,910 |
| Average | 4,476 (100.0%) | $57,891 |
Occupancy by Householder Income Bracket in Todd County
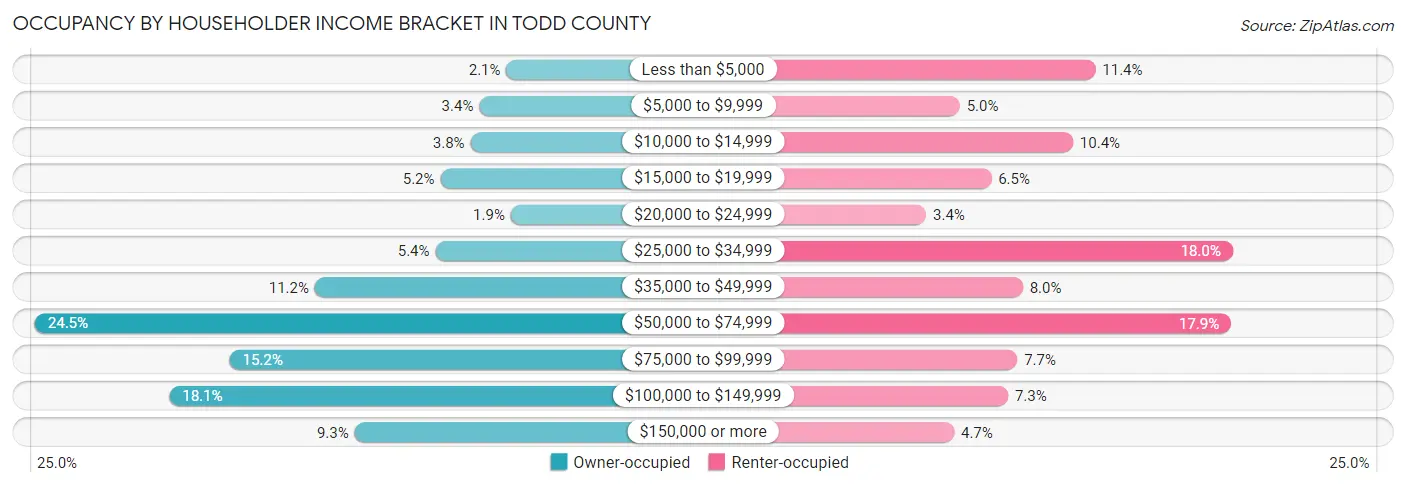
| Income Bracket | Owner-occupied | Renter-occupied |
| Less than $5,000 | 69 (2.1%) | 129 (11.4%) |
| $5,000 to $9,999 | 112 (3.4%) | 56 (5.0%) |
| $10,000 to $14,999 | 126 (3.8%) | 117 (10.3%) |
| $15,000 to $19,999 | 174 (5.2%) | 73 (6.5%) |
| $20,000 to $24,999 | 62 (1.8%) | 38 (3.4%) |
| $25,000 to $34,999 | 182 (5.4%) | 203 (18.0%) |
| $35,000 to $49,999 | 374 (11.2%) | 90 (8.0%) |
| $50,000 to $74,999 | 820 (24.5%) | 202 (17.9%) |
| $75,000 to $99,999 | 510 (15.2%) | 87 (7.7%) |
| $100,000 to $149,999 | 606 (18.1%) | 82 (7.3%) |
| $150,000 or more | 311 (9.3%) | 53 (4.7%) |
| Total | 3,346 (100.0%) | 1,130 (100.0%) |
Monthly Housing Cost Tiers in Todd County
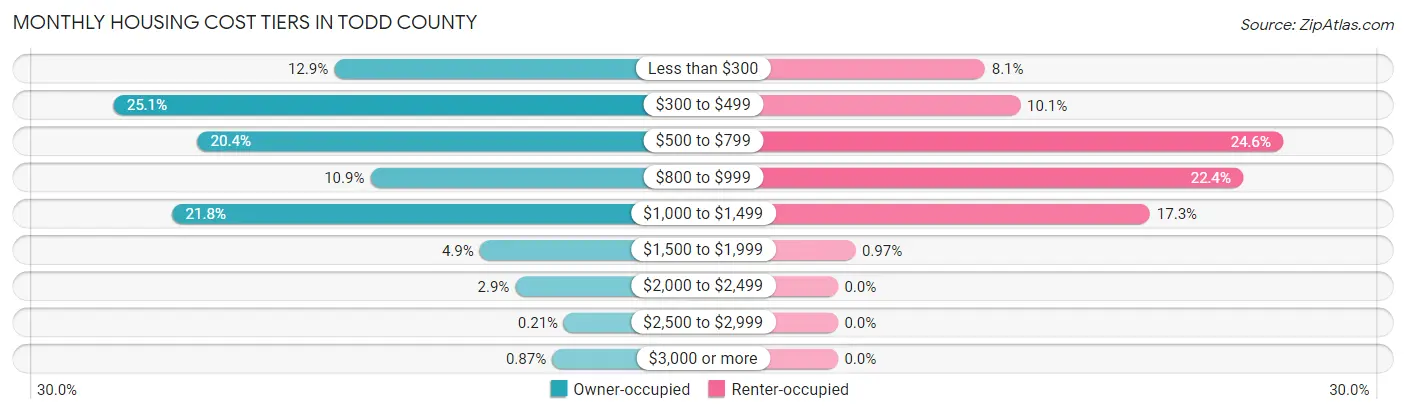
| Monthly Cost | Owner-occupied | Renter-occupied |
| Less than $300 | 432 (12.9%) | 92 (8.1%) |
| $300 to $499 | 839 (25.1%) | 114 (10.1%) |
| $500 to $799 | 684 (20.4%) | 278 (24.6%) |
| $800 to $999 | 365 (10.9%) | 253 (22.4%) |
| $1,000 to $1,499 | 730 (21.8%) | 195 (17.3%) |
| $1,500 to $1,999 | 163 (4.9%) | 11 (1.0%) |
| $2,000 to $2,499 | 97 (2.9%) | 0 (0.0%) |
| $2,500 to $2,999 | 7 (0.2%) | 0 (0.0%) |
| $3,000 or more | 29 (0.9%) | 0 (0.0%) |
| Total | 3,346 (100.0%) | 1,130 (100.0%) |
Physical Housing Characteristics in Todd County
Housing Structures in Todd County
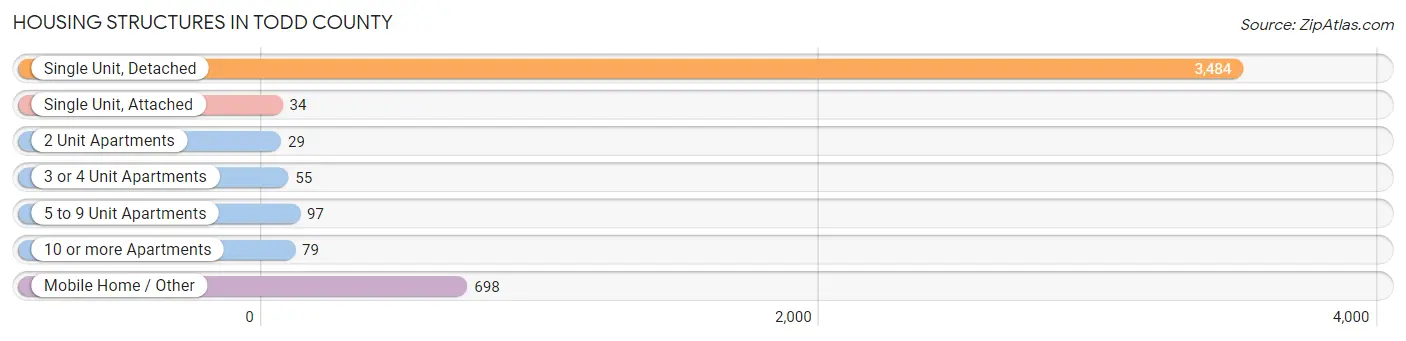
| Structure Type | # Housing Units | % Housing Units |
| Single Unit, Detached | 3,484 | 77.8% |
| Single Unit, Attached | 34 | 0.8% |
| 2 Unit Apartments | 29 | 0.6% |
| 3 or 4 Unit Apartments | 55 | 1.2% |
| 5 to 9 Unit Apartments | 97 | 2.2% |
| 10 or more Apartments | 79 | 1.8% |
| Mobile Home / Other | 698 | 15.6% |
| Total | 4,476 | 100.0% |
Housing Structures by Occupancy in Todd County
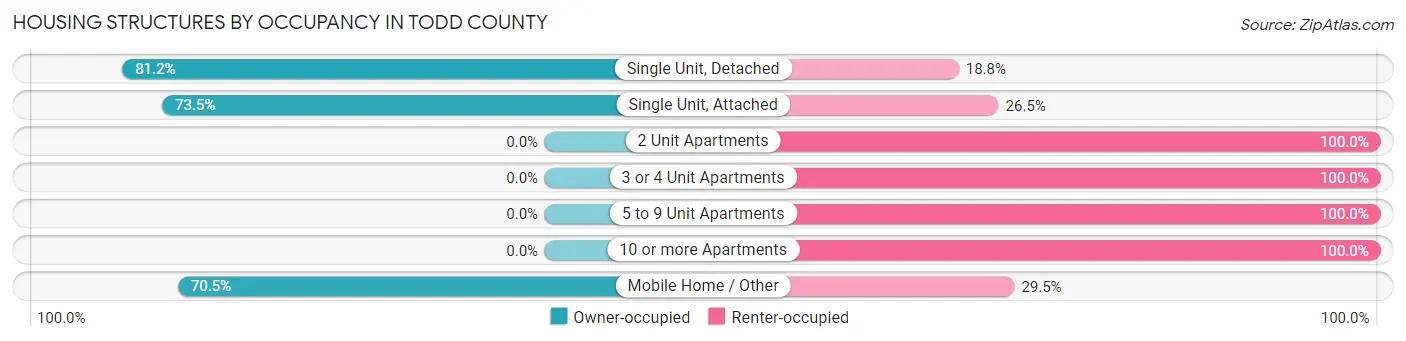
| Structure Type | Owner-occupied | Renter-occupied |
| Single Unit, Detached | 2,829 (81.2%) | 655 (18.8%) |
| Single Unit, Attached | 25 (73.5%) | 9 (26.5%) |
| 2 Unit Apartments | 0 (0.0%) | 29 (100.0%) |
| 3 or 4 Unit Apartments | 0 (0.0%) | 55 (100.0%) |
| 5 to 9 Unit Apartments | 0 (0.0%) | 97 (100.0%) |
| 10 or more Apartments | 0 (0.0%) | 79 (100.0%) |
| Mobile Home / Other | 492 (70.5%) | 206 (29.5%) |
| Total | 3,346 (74.8%) | 1,130 (25.3%) |
Housing Structures by Number of Rooms in Todd County
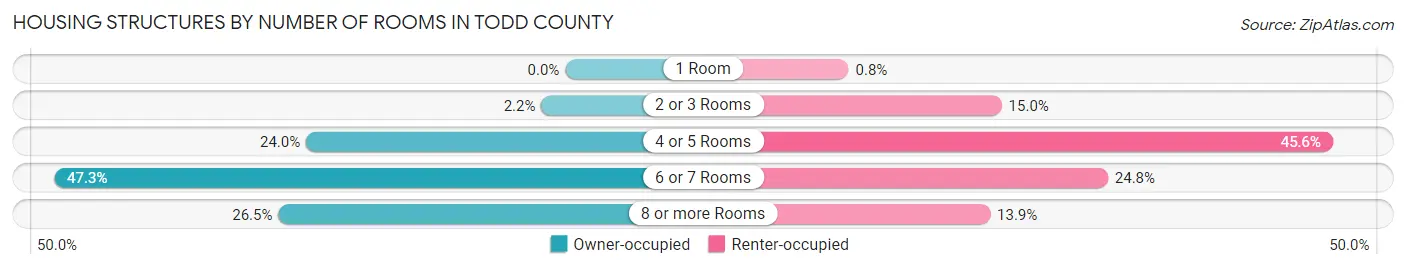
| Number of Rooms | Owner-occupied | Renter-occupied |
| 1 Room | 0 (0.0%) | 9 (0.8%) |
| 2 or 3 Rooms | 74 (2.2%) | 169 (15.0%) |
| 4 or 5 Rooms | 802 (24.0%) | 515 (45.6%) |
| 6 or 7 Rooms | 1,582 (47.3%) | 280 (24.8%) |
| 8 or more Rooms | 888 (26.5%) | 157 (13.9%) |
| Total | 3,346 (100.0%) | 1,130 (100.0%) |
Housing Structure by Heating Type in Todd County
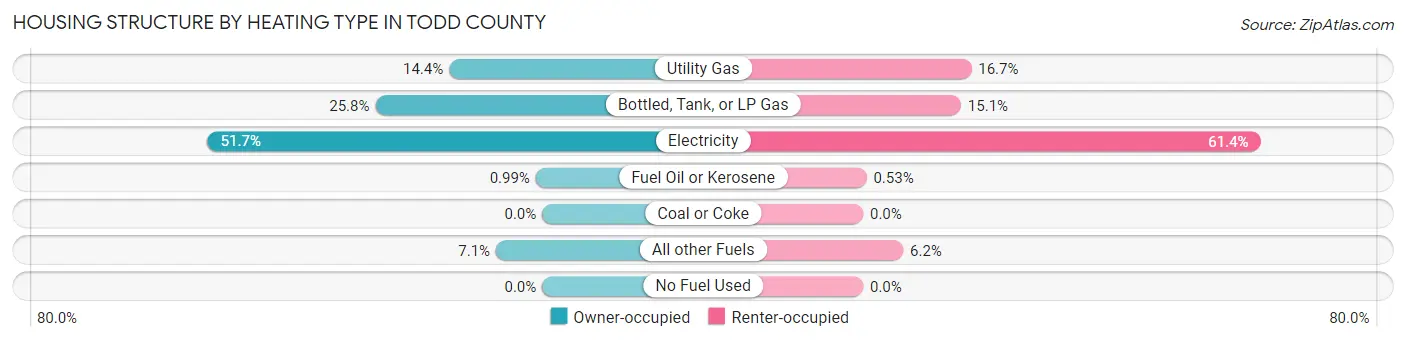
| Heating Type | Owner-occupied | Renter-occupied |
| Utility Gas | 481 (14.4%) | 189 (16.7%) |
| Bottled, Tank, or LP Gas | 863 (25.8%) | 171 (15.1%) |
| Electricity | 1,730 (51.7%) | 694 (61.4%) |
| Fuel Oil or Kerosene | 33 (1.0%) | 6 (0.5%) |
| Coal or Coke | 0 (0.0%) | 0 (0.0%) |
| All other Fuels | 239 (7.1%) | 70 (6.2%) |
| No Fuel Used | 0 (0.0%) | 0 (0.0%) |
| Total | 3,346 (100.0%) | 1,130 (100.0%) |
Household Vehicle Usage in Todd County
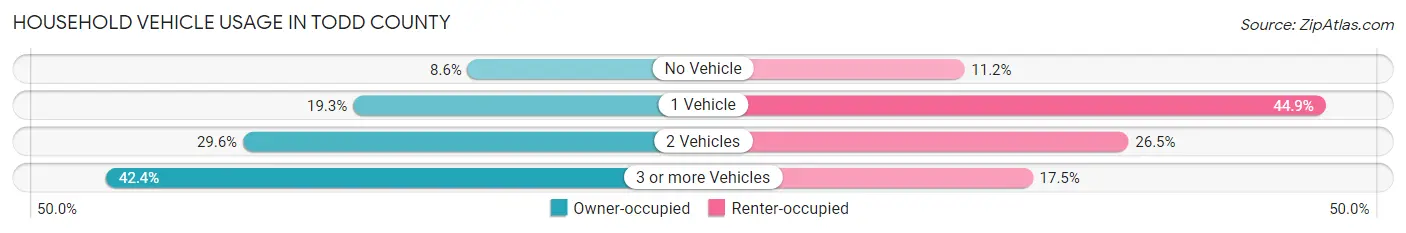
| Vehicles per Household | Owner-occupied | Renter-occupied |
| No Vehicle | 289 (8.6%) | 126 (11.2%) |
| 1 Vehicle | 647 (19.3%) | 507 (44.9%) |
| 2 Vehicles | 991 (29.6%) | 299 (26.5%) |
| 3 or more Vehicles | 1,419 (42.4%) | 198 (17.5%) |
| Total | 3,346 (100.0%) | 1,130 (100.0%) |
Real Estate & Mortgages in Todd County
Real Estate and Mortgage Overview in Todd County
| Characteristic | Without Mortgage | With Mortgage |
| Housing Units | 1,588 | 1,758 |
| Median Property Value | $111,100 | $156,600 |
| Median Household Income | $50,761 | $202 |
| Monthly Housing Costs | $378 | $29 |
| Real Estate Taxes | $515 | $186 |
Property Value by Mortgage Status in Todd County
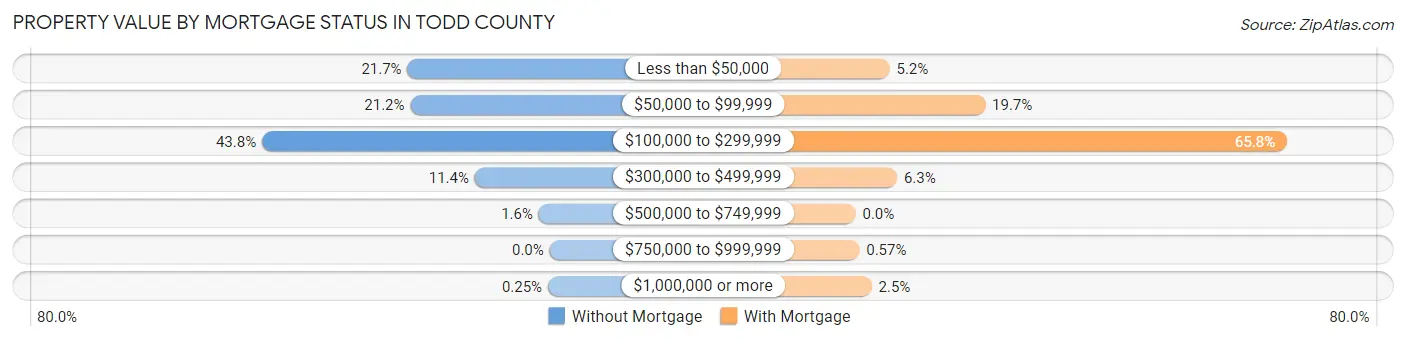
| Property Value | Without Mortgage | With Mortgage |
| Less than $50,000 | 344 (21.7%) | 91 (5.2%) |
| $50,000 to $99,999 | 337 (21.2%) | 347 (19.7%) |
| $100,000 to $299,999 | 696 (43.8%) | 1,156 (65.8%) |
| $300,000 to $499,999 | 181 (11.4%) | 111 (6.3%) |
| $500,000 to $749,999 | 26 (1.6%) | 0 (0.0%) |
| $750,000 to $999,999 | 0 (0.0%) | 10 (0.6%) |
| $1,000,000 or more | 4 (0.3%) | 43 (2.5%) |
| Total | 1,588 (100.0%) | 1,758 (100.0%) |
Household Income by Mortgage Status in Todd County
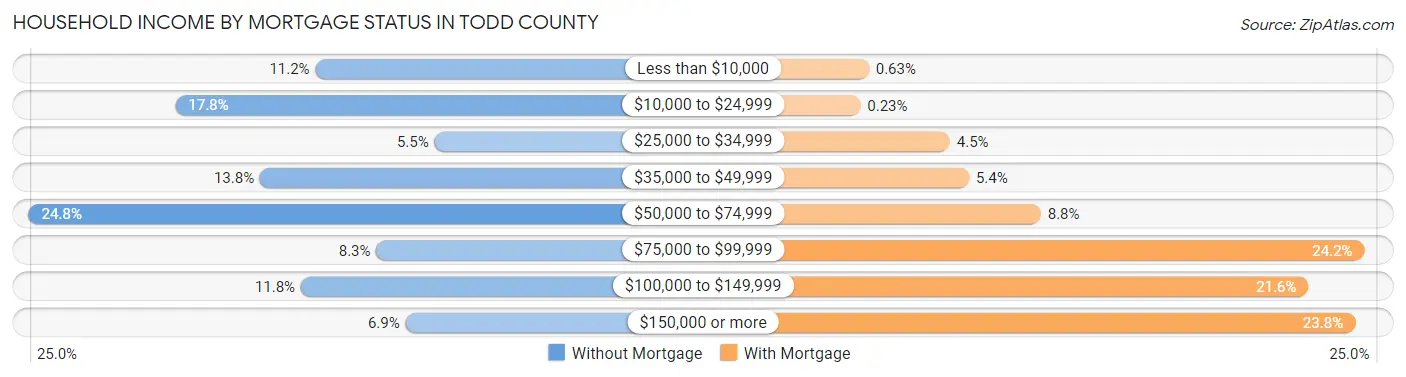
| Household Income | Without Mortgage | With Mortgage |
| Less than $10,000 | 177 (11.2%) | 11 (0.6%) |
| $10,000 to $24,999 | 283 (17.8%) | 4 (0.2%) |
| $25,000 to $34,999 | 87 (5.5%) | 79 (4.5%) |
| $35,000 to $49,999 | 219 (13.8%) | 95 (5.4%) |
| $50,000 to $74,999 | 394 (24.8%) | 155 (8.8%) |
| $75,000 to $99,999 | 131 (8.3%) | 426 (24.2%) |
| $100,000 to $149,999 | 188 (11.8%) | 379 (21.6%) |
| $150,000 or more | 109 (6.9%) | 418 (23.8%) |
| Total | 1,588 (100.0%) | 1,758 (100.0%) |
Property Value to Household Income Ratio in Todd County
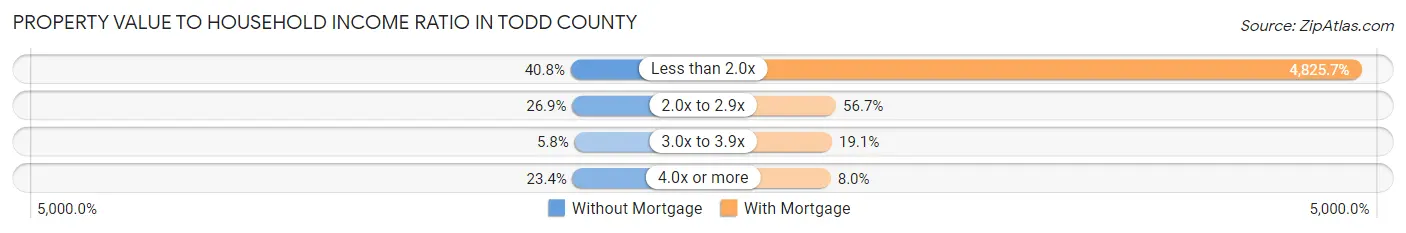
| Value-to-Income Ratio | Without Mortgage | With Mortgage |
| Less than 2.0x | 648 (40.8%) | 84,836 (4,825.7%) |
| 2.0x to 2.9x | 427 (26.9%) | 997 (56.7%) |
| 3.0x to 3.9x | 92 (5.8%) | 335 (19.1%) |
| 4.0x or more | 372 (23.4%) | 141 (8.0%) |
| Total | 1,588 (100.0%) | 1,758 (100.0%) |
Real Estate Taxes by Mortgage Status in Todd County
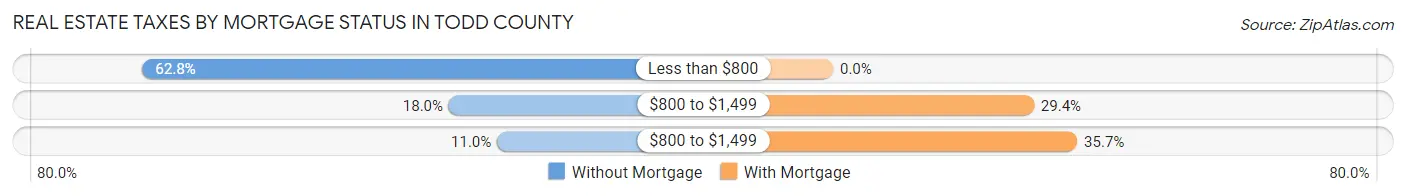
| Property Taxes | Without Mortgage | With Mortgage |
| Less than $800 | 997 (62.8%) | 0 (0.0%) |
| $800 to $1,499 | 286 (18.0%) | 516 (29.3%) |
| $800 to $1,499 | 174 (11.0%) | 627 (35.7%) |
| Total | 1,588 (100.0%) | 1,758 (100.0%) |
Health & Disability in Todd County
Health Insurance Coverage by Age in Todd County
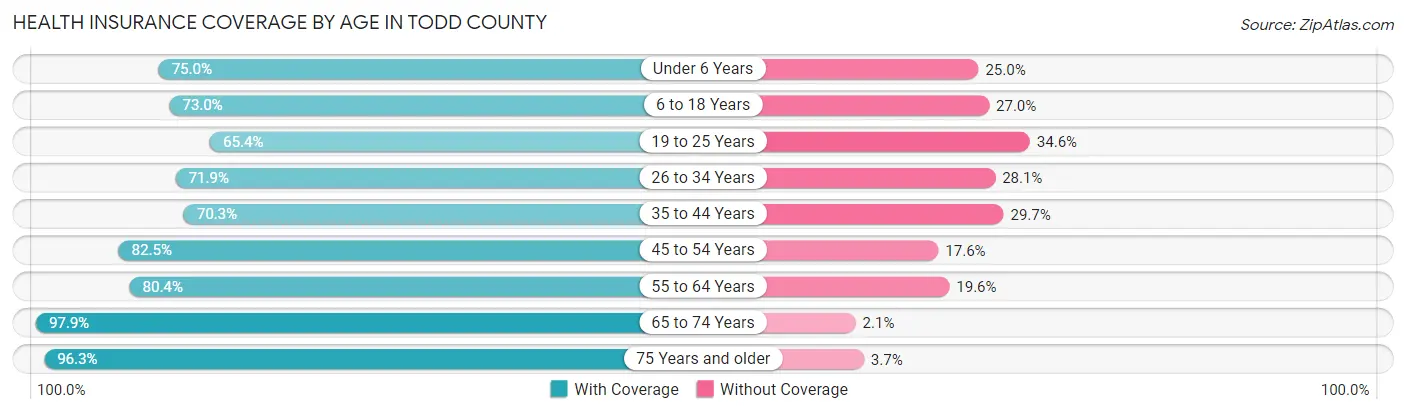
| Age Bracket | With Coverage | Without Coverage |
| Under 6 Years | 809 (75.0%) | 270 (25.0%) |
| 6 to 18 Years | 1,716 (73.0%) | 635 (27.0%) |
| 19 to 25 Years | 616 (65.4%) | 326 (34.6%) |
| 26 to 34 Years | 960 (71.9%) | 376 (28.1%) |
| 35 to 44 Years | 961 (70.3%) | 406 (29.7%) |
| 45 to 54 Years | 1,184 (82.5%) | 252 (17.5%) |
| 55 to 64 Years | 1,293 (80.4%) | 315 (19.6%) |
| 65 to 74 Years | 1,200 (97.9%) | 26 (2.1%) |
| 75 Years and older | 736 (96.3%) | 28 (3.7%) |
| Total | 9,475 (78.2%) | 2,634 (21.7%) |
Health Insurance Coverage by Citizenship Status in Todd County
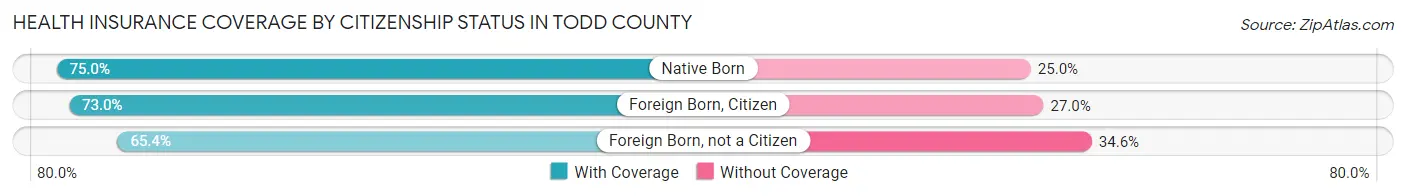
| Citizenship Status | With Coverage | Without Coverage |
| Native Born | 809 (75.0%) | 270 (25.0%) |
| Foreign Born, Citizen | 1,716 (73.0%) | 635 (27.0%) |
| Foreign Born, not a Citizen | 616 (65.4%) | 326 (34.6%) |
Health Insurance Coverage by Household Income in Todd County
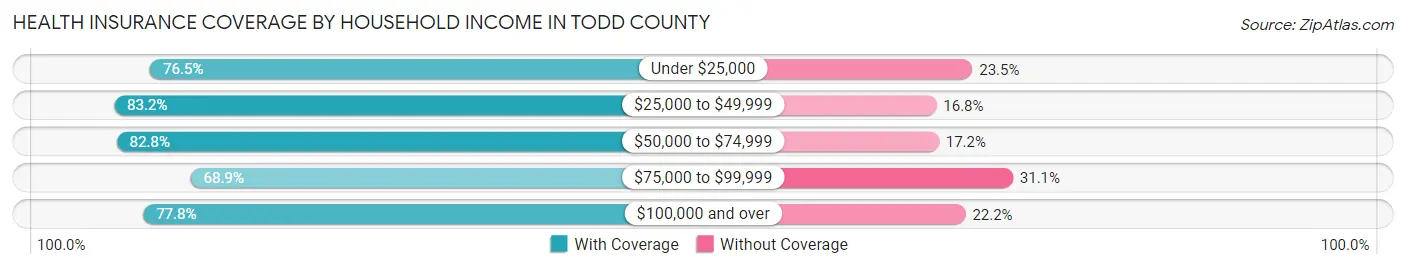
| Household Income | With Coverage | Without Coverage |
| Under $25,000 | 1,684 (76.5%) | 518 (23.5%) |
| $25,000 to $49,999 | 1,617 (83.2%) | 326 (16.8%) |
| $50,000 to $74,999 | 2,161 (82.8%) | 450 (17.2%) |
| $75,000 to $99,999 | 1,178 (68.9%) | 532 (31.1%) |
| $100,000 and over | 2,827 (77.8%) | 808 (22.2%) |
Public vs Private Health Insurance Coverage by Age in Todd County
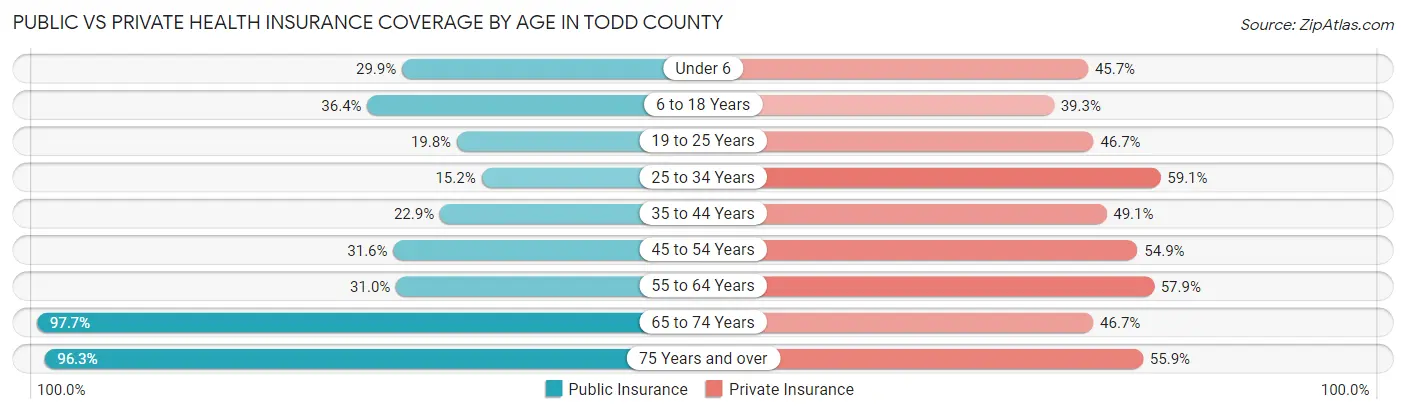
| Age Bracket | Public Insurance | Private Insurance |
| Under 6 | 323 (29.9%) | 493 (45.7%) |
| 6 to 18 Years | 855 (36.4%) | 925 (39.3%) |
| 19 to 25 Years | 186 (19.8%) | 440 (46.7%) |
| 25 to 34 Years | 203 (15.2%) | 790 (59.1%) |
| 35 to 44 Years | 313 (22.9%) | 671 (49.1%) |
| 45 to 54 Years | 453 (31.6%) | 788 (54.9%) |
| 55 to 64 Years | 499 (31.0%) | 931 (57.9%) |
| 65 to 74 Years | 1,198 (97.7%) | 572 (46.7%) |
| 75 Years and over | 736 (96.3%) | 427 (55.9%) |
| Total | 4,766 (39.4%) | 6,037 (49.9%) |
Disability Status by Sex by Age in Todd County
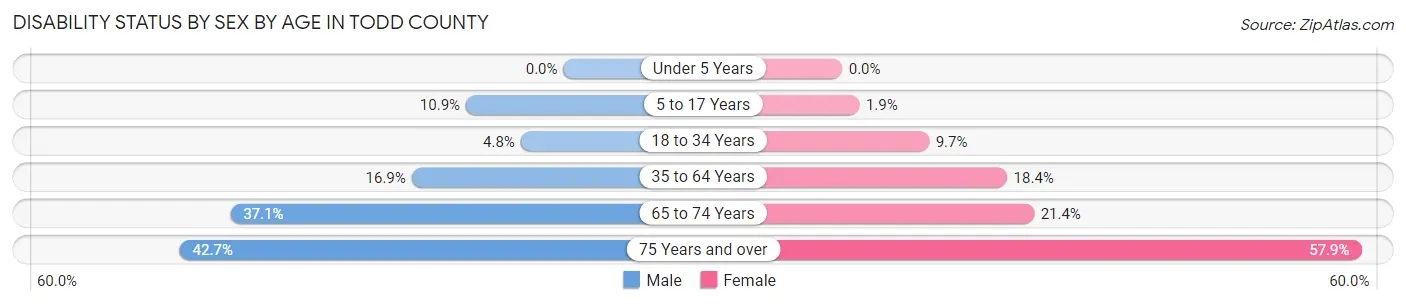
| Age Bracket | Male | Female |
| Under 5 Years | 0 (0.0%) | 0 (0.0%) |
| 5 to 17 Years | 141 (10.8%) | 22 (1.9%) |
| 18 to 34 Years | 59 (4.8%) | 113 (9.7%) |
| 35 to 64 Years | 369 (16.9%) | 409 (18.4%) |
| 65 to 74 Years | 243 (37.1%) | 122 (21.4%) |
| 75 Years and over | 144 (42.7%) | 247 (57.9%) |
Disability Class by Sex by Age in Todd County
Disability Class: Hearing Difficulty
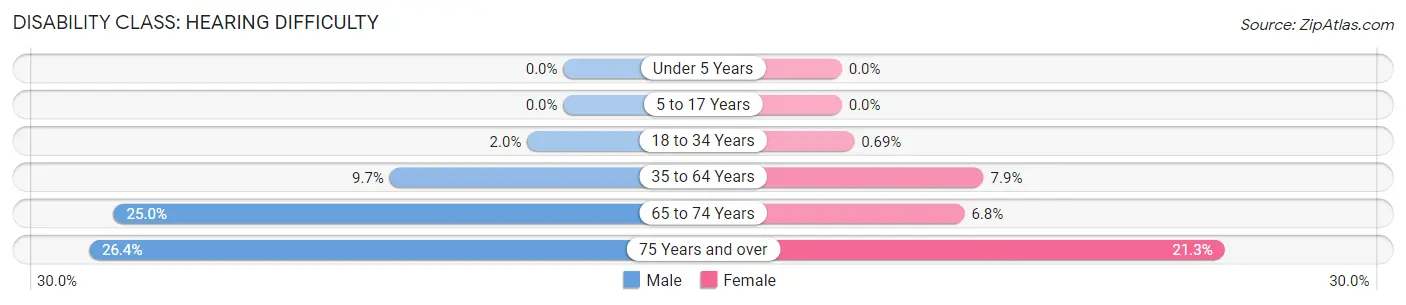
| Age Bracket | Male | Female |
| Under 5 Years | 0 (0.0%) | 0 (0.0%) |
| 5 to 17 Years | 0 (0.0%) | 0 (0.0%) |
| 18 to 34 Years | 25 (2.0%) | 8 (0.7%) |
| 35 to 64 Years | 211 (9.7%) | 176 (7.9%) |
| 65 to 74 Years | 164 (25.0%) | 39 (6.8%) |
| 75 Years and over | 89 (26.4%) | 91 (21.3%) |
Disability Class: Vision Difficulty
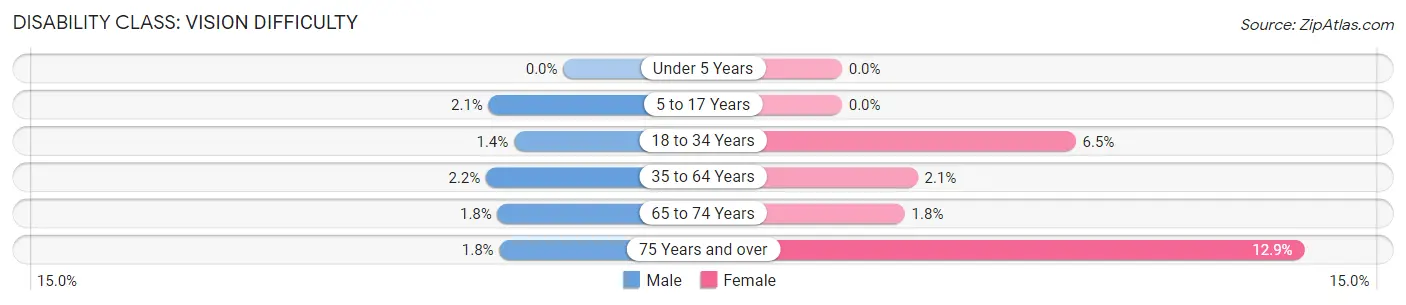
| Age Bracket | Male | Female |
| Under 5 Years | 0 (0.0%) | 0 (0.0%) |
| 5 to 17 Years | 27 (2.1%) | 0 (0.0%) |
| 18 to 34 Years | 17 (1.4%) | 76 (6.5%) |
| 35 to 64 Years | 47 (2.1%) | 47 (2.1%) |
| 65 to 74 Years | 12 (1.8%) | 10 (1.8%) |
| 75 Years and over | 6 (1.8%) | 55 (12.9%) |
Disability Class: Cognitive Difficulty
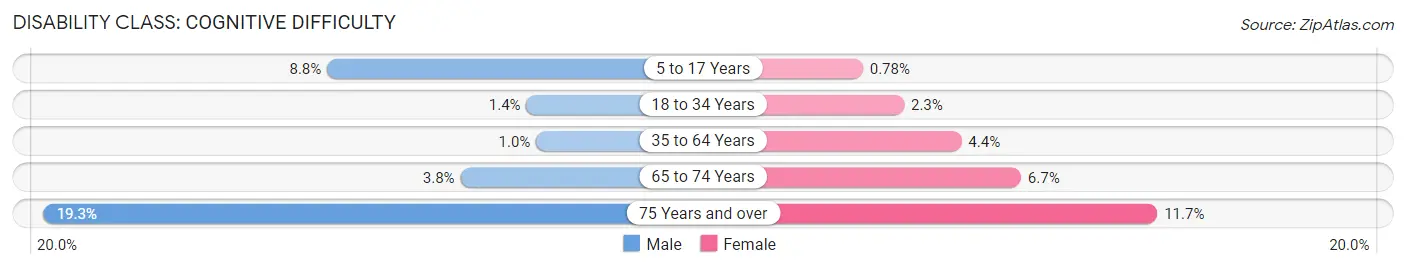
| Age Bracket | Male | Female |
| 5 to 17 Years | 114 (8.8%) | 9 (0.8%) |
| 18 to 34 Years | 17 (1.4%) | 27 (2.3%) |
| 35 to 64 Years | 22 (1.0%) | 99 (4.4%) |
| 65 to 74 Years | 25 (3.8%) | 38 (6.7%) |
| 75 Years and over | 65 (19.3%) | 50 (11.7%) |
Disability Class: Ambulatory Difficulty
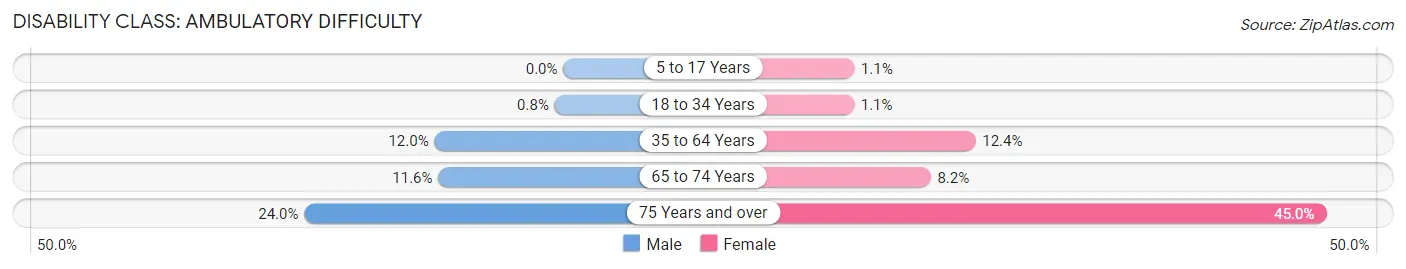
| Age Bracket | Male | Female |
| 5 to 17 Years | 0 (0.0%) | 13 (1.1%) |
| 18 to 34 Years | 10 (0.8%) | 13 (1.1%) |
| 35 to 64 Years | 261 (12.0%) | 276 (12.4%) |
| 65 to 74 Years | 76 (11.6%) | 47 (8.2%) |
| 75 Years and over | 81 (24.0%) | 192 (45.0%) |
Disability Class: Self-Care Difficulty
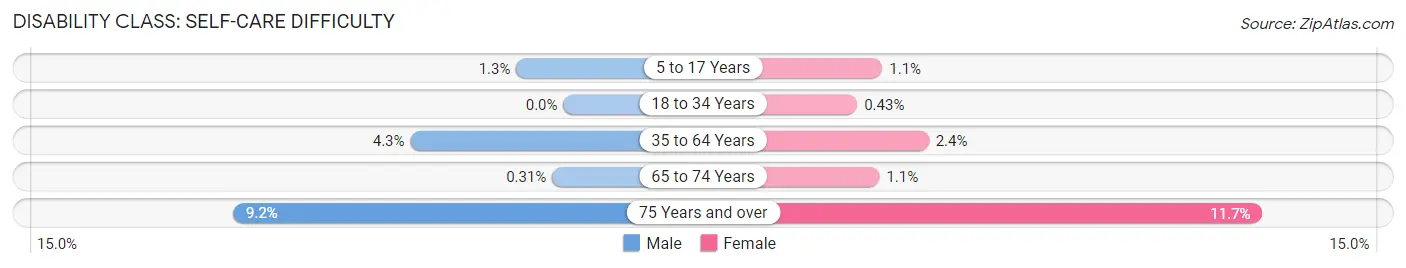
| Age Bracket | Male | Female |
| 5 to 17 Years | 17 (1.3%) | 13 (1.1%) |
| 18 to 34 Years | 0 (0.0%) | 5 (0.4%) |
| 35 to 64 Years | 93 (4.3%) | 54 (2.4%) |
| 65 to 74 Years | 2 (0.3%) | 6 (1.1%) |
| 75 Years and over | 31 (9.2%) | 50 (11.7%) |
Technology Access in Todd County
Computing Device Access in Todd County
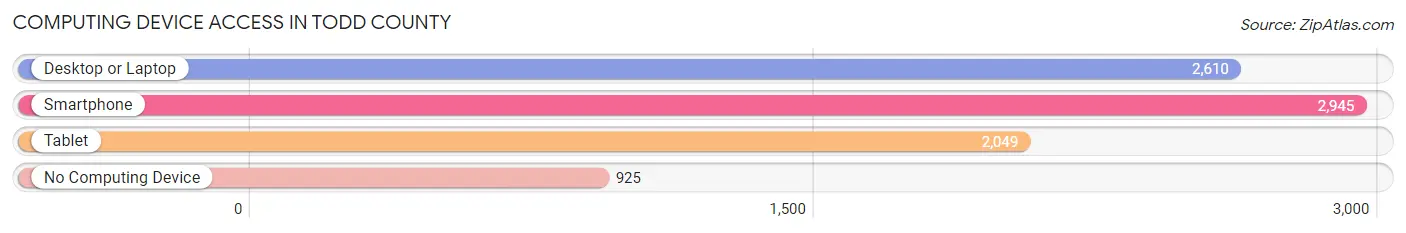
| Device Type | # Households | % Households |
| Desktop or Laptop | 2,610 | 58.3% |
| Smartphone | 2,945 | 65.8% |
| Tablet | 2,049 | 45.8% |
| No Computing Device | 925 | 20.7% |
| Total | 4,476 | 100.0% |
Internet Access in Todd County
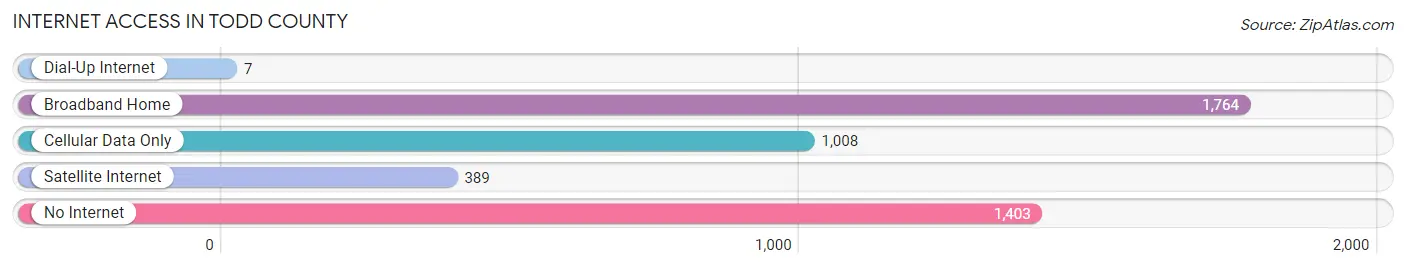
| Internet Type | # Households | % Households |
| Dial-Up Internet | 7 | 0.2% |
| Broadband Home | 1,764 | 39.4% |
| Cellular Data Only | 1,008 | 22.5% |
| Satellite Internet | 389 | 8.7% |
| No Internet | 1,403 | 31.3% |
| Total | 4,476 | 100.0% |
Todd County Summary
Todd County is located in the western part of Kentucky, and is part of the Jackson Purchase region. It is bordered by Christian County to the north, Logan County to the east, Muhlenberg County to the south, and Stewart County, Tennessee to the west. The county seat is Elkton, and the county was formed in 1819 from Christian and Logan counties. The county is named for Colonel John Todd, a Revolutionary War veteran and early settler of the area.
Geography
Todd County covers an area of 437 square miles, of which 434 square miles is land and 3 square miles is water. The county is located in the Pennyroyal Plateau region of Kentucky, and is characterized by rolling hills and valleys. The highest point in the county is located in the northwest corner, at an elevation of 590 feet. The county is drained by the Little River, which flows through the center of the county.
The county is home to several state parks and recreation areas, including Lake Malone State Park, which is located in the northern part of the county. The park offers camping, fishing, boating, and other outdoor activities. Other parks in the county include the Land Between the Lakes National Recreation Area, which is located in the western part of the county, and the Kentucky Dam Village State Resort Park, which is located in the southern part of the county.
Economy
The economy of Todd County is largely based on agriculture. The county is home to several large farms, and the main crops grown in the county are corn, soybeans, wheat, and hay. Livestock production is also important to the county’s economy, with beef cattle, dairy cattle, and hogs being the main types of livestock raised in the county.
The county is also home to several manufacturing companies, including a furniture factory, a plastics factory, and a paper mill. The county is also home to several small businesses, including restaurants, retail stores, and service providers.
Demographics
As of the 2010 census, the population of Todd County was 12,460, with a population density of 28.6 people per square mile. The racial makeup of the county was 95.2% White, 2.7% African American, 0.3% Native American, 0.2% Asian, 0.1% Pacific Islander, 0.5% from other races, and 1.1% from two or more races. Hispanic or Latino of any race were 1.3% of the population.
The median household income in the county was $37,945, and the median family income was $45,945. The per capita income was $18,945. About 15.2% of the population was below the poverty line.
The largest city in the county is Elkton, which is the county seat. Other cities in the county include Guthrie, Trenton, and Allensville. The county is served by the Todd County School District, which includes seven elementary schools, two middle schools, and one high school.
Common Questions
What is Per Capita Income in Todd County?
Per Capita income in Todd County is $30,252.
What is the Median Family Income in Todd County?
Median Family Income in Todd County is $68,983.
What is the Median Household income in Todd County?
Median Household Income in Todd County is $57,891.
What is Income or Wage Gap in Todd County?
Income or Wage Gap in Todd County is 33.6%.
Women in Todd County earn 66.4 cents for every dollar earned by a man.
What is Inequality or Gini Index in Todd County?
Inequality or Gini Index in Todd County is 0.49.
What is the Total Population of Todd County?
Total Population of Todd County is 12,281.
What is the Total Male Population of Todd County?
Total Male Population of Todd County is 6,269.
What is the Total Female Population of Todd County?
Total Female Population of Todd County is 6,012.
What is the Ratio of Males per 100 Females in Todd County?
There are 104.27 Males per 100 Females in Todd County.
What is the Ratio of Females per 100 Males in Todd County?
There are 95.90 Females per 100 Males in Todd County.
What is the Median Population Age in Todd County?
Median Population Age in Todd County is 36.6 Years.
What is the Average Family Size in Todd County
Average Family Size in Todd County is 3.2 People.
What is the Average Household Size in Todd County
Average Household Size in Todd County is 2.7 People.
How Large is the Labor Force in Todd County?
There are 5,282 People in the Labor Forcein in Todd County.
What is the Percentage of People in the Labor Force in Todd County?
56.0% of People are in the Labor Force in Todd County.
What is the Unemployment Rate in Todd County?
Unemployment Rate in Todd County is 4.3%.