Spencer County, KY Map & Demographics
Spencer County Map
Spencer County Overview
$39,997
PER CAPITA INCOME
$109,672
AVG FAMILY INCOME
$101,118
AVG HOUSEHOLD INCOME
22.5%
WAGE / INCOME GAP [ % ]
77.5¢/ $1
WAGE / INCOME GAP [ $ ]
$10,607
FAMILY INCOME DEFICIT
0.38
INEQUALITY / GINI INDEX
19,549
TOTAL POPULATION
9,878
MALE POPULATION
9,671
FEMALE POPULATION
102.14
MALES / 100 FEMALES
97.90
FEMALES / 100 MALES
42.9
MEDIAN AGE
3.0
AVG FAMILY SIZE
2.8
AVG HOUSEHOLD SIZE
10,588
LABOR FORCE [ PEOPLE ]
67.7%
PERCENT IN LABOR FORCE
6.2%
UNEMPLOYMENT RATE
Spencer County Area Codes
Income in Spencer County
Income Overview in Spencer County
Per Capita Income in Spencer County is $39,997, while median incomes of families and households are $109,672 and $101,118 respectively.
| Characteristic | Number | Measure |
| Per Capita Income | 19,549 | $39,997 |
| Median Family Income | 5,622 | $109,672 |
| Mean Family Income | 5,622 | $119,234 |
| Median Household Income | 6,916 | $101,118 |
| Mean Household Income | 6,916 | $109,491 |
| Income Deficit | 5,622 | $10,607 |
| Wage / Income Gap (%) | 19,549 | 22.49% |
| Wage / Income Gap ($) | 19,549 | 77.51¢ per $1 |
| Gini / Inequality Index | 19,549 | 0.38 |
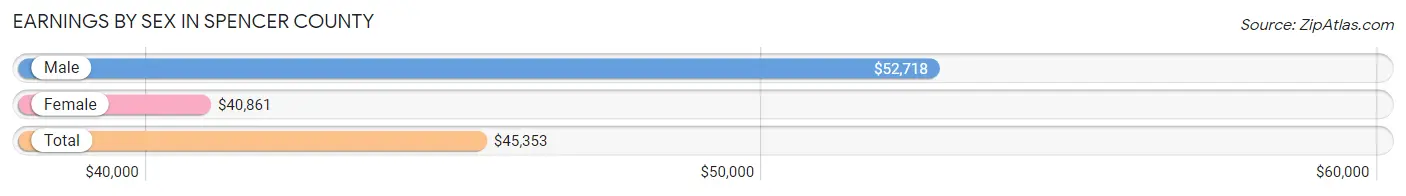
Earnings by Sex in Spencer County
Average Earnings in Spencer County are $45,353, $52,718 for men and $40,861 for women, a difference of 22.5%.
| Sex | Number | Average Earnings |
| Male | 5,942 (53.1%) | $52,718 |
| Female | 5,242 (46.9%) | $40,861 |
| Total | 11,184 (100.0%) | $45,353 |
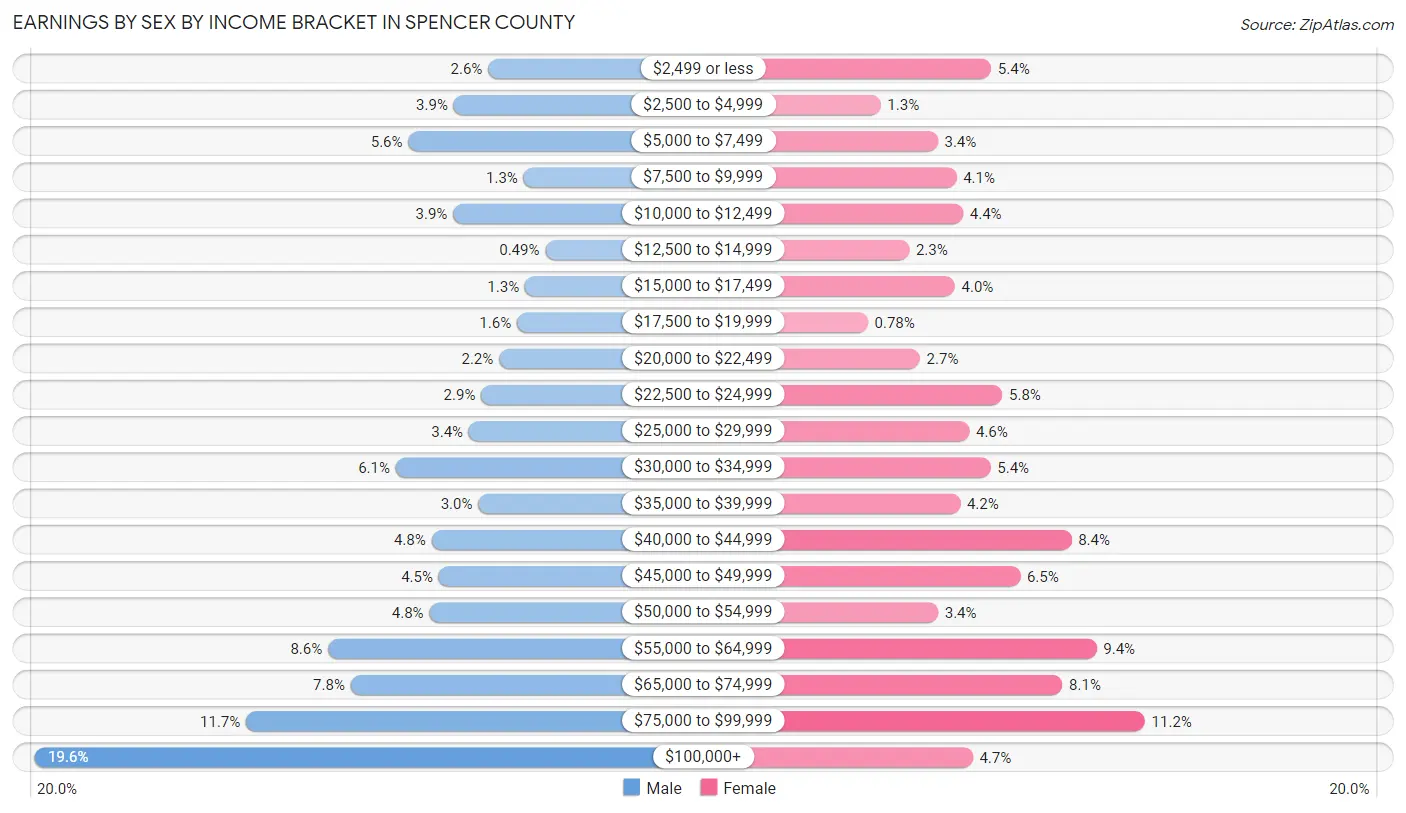
Earnings by Sex by Income Bracket in Spencer County
The most common earnings brackets in Spencer County are $100,000+ for men (1,165 | 19.6%) and $75,000 to $99,999 for women (585 | 11.2%).
| Income | Male | Female |
| $2,499 or less | 156 (2.6%) | 283 (5.4%) |
| $2,500 to $4,999 | 233 (3.9%) | 66 (1.3%) |
| $5,000 to $7,499 | 334 (5.6%) | 178 (3.4%) |
| $7,500 to $9,999 | 77 (1.3%) | 215 (4.1%) |
| $10,000 to $12,499 | 234 (3.9%) | 228 (4.3%) |
| $12,500 to $14,999 | 29 (0.5%) | 122 (2.3%) |
| $15,000 to $17,499 | 74 (1.3%) | 212 (4.0%) |
| $17,500 to $19,999 | 92 (1.5%) | 41 (0.8%) |
| $20,000 to $22,499 | 132 (2.2%) | 143 (2.7%) |
| $22,500 to $24,999 | 172 (2.9%) | 305 (5.8%) |
| $25,000 to $29,999 | 199 (3.4%) | 240 (4.6%) |
| $30,000 to $34,999 | 362 (6.1%) | 282 (5.4%) |
| $35,000 to $39,999 | 178 (3.0%) | 222 (4.2%) |
| $40,000 to $44,999 | 282 (4.8%) | 441 (8.4%) |
| $45,000 to $49,999 | 266 (4.5%) | 340 (6.5%) |
| $50,000 to $54,999 | 287 (4.8%) | 179 (3.4%) |
| $55,000 to $64,999 | 513 (8.6%) | 490 (9.3%) |
| $65,000 to $74,999 | 462 (7.8%) | 423 (8.1%) |
| $75,000 to $99,999 | 695 (11.7%) | 585 (11.2%) |
| $100,000+ | 1,165 (19.6%) | 247 (4.7%) |
| Total | 5,942 (100.0%) | 5,242 (100.0%) |
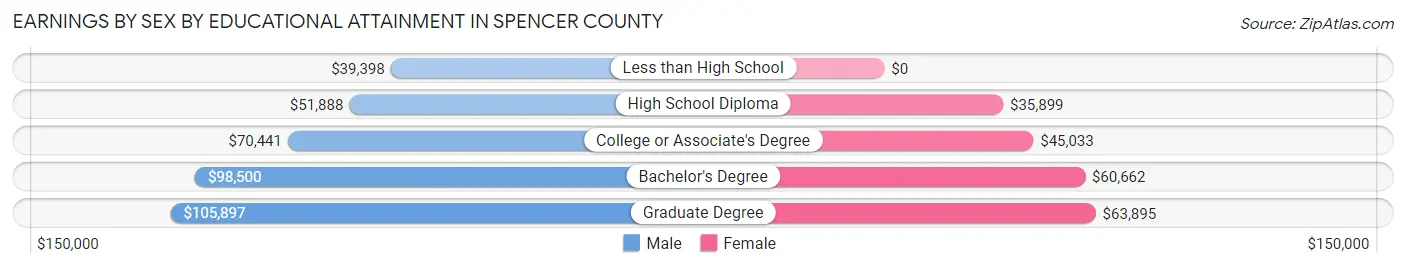
Earnings by Sex by Educational Attainment in Spencer County
Average earnings in Spencer County are $59,002 for men and $45,701 for women, a difference of 22.5%. Men with an educational attainment of graduate degree enjoy the highest average annual earnings of $105,897, while those with less than high school education earn the least with $39,398. Women with an educational attainment of graduate degree earn the most with the average annual earnings of $63,895, while those with high school diploma education have the smallest earnings of $35,899.
| Educational Attainment | Male Income | Female Income |
| Less than High School | $39,398 | $0 |
| High School Diploma | $51,888 | $35,899 |
| College or Associate's Degree | $70,441 | $45,033 |
| Bachelor's Degree | $98,500 | $60,662 |
| Graduate Degree | $105,897 | $63,895 |
| Total | $59,002 | $45,701 |
Family Income in Spencer County
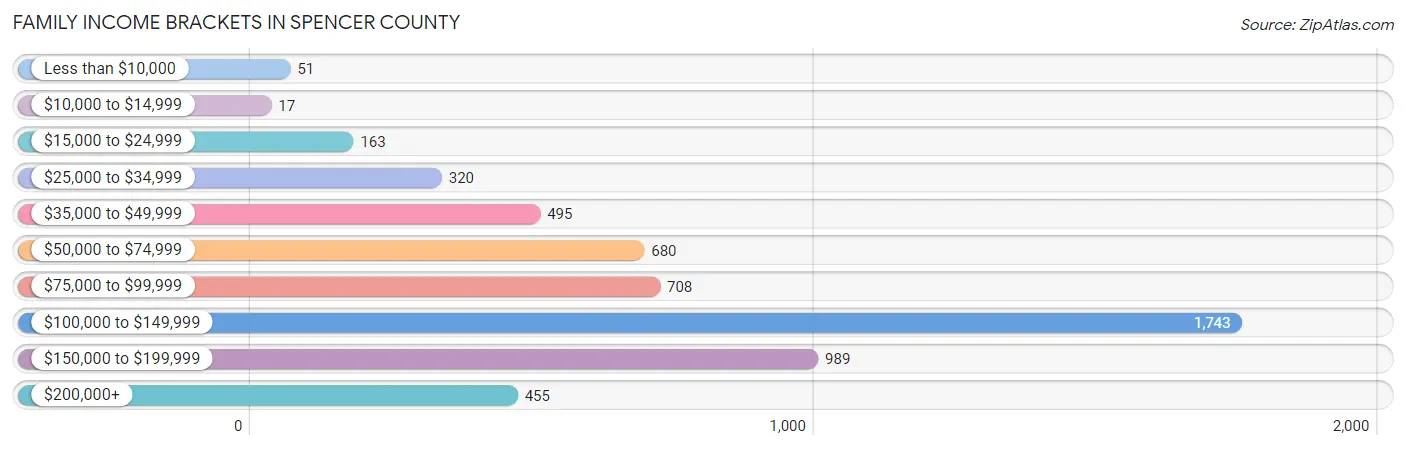
Family Income Brackets in Spencer County
According to the Spencer County family income data, there are 1,743 families falling into the $100,000 to $149,999 income range, which is the most common income bracket and makes up 31.0% of all families. Conversely, the $10,000 to $14,999 income bracket is the least frequent group with only 17 families (0.3%) belonging to this category.
| Income Bracket | # Families | % Families |
| Less than $10,000 | 51 | 0.9% |
| $10,000 to $14,999 | 17 | 0.3% |
| $15,000 to $24,999 | 163 | 2.9% |
| $25,000 to $34,999 | 320 | 5.7% |
| $35,000 to $49,999 | 495 | 8.8% |
| $50,000 to $74,999 | 680 | 12.1% |
| $75,000 to $99,999 | 708 | 12.6% |
| $100,000 to $149,999 | 1,743 | 31.0% |
| $150,000 to $199,999 | 989 | 17.6% |
| $200,000+ | 455 | 8.1% |
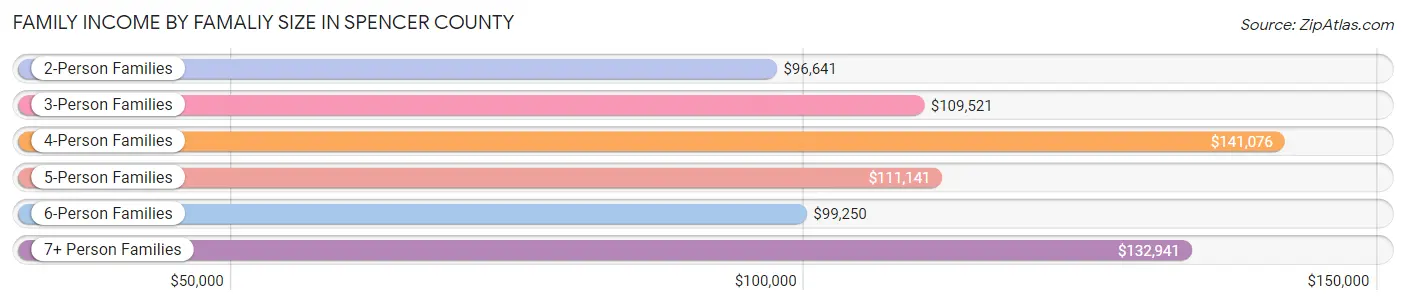
Family Income by Famaliy Size in Spencer County
4-person families (947 | 16.8%) account for the highest median family income in Spencer County with $141,076 per family, while 2-person families (2,877 | 51.2%) have the highest median income of $48,320 per family member.
| Income Bracket | # Families | Median Income |
| 2-Person Families | 2,877 (51.2%) | $96,641 |
| 3-Person Families | 1,122 (20.0%) | $109,521 |
| 4-Person Families | 947 (16.8%) | $141,076 |
| 5-Person Families | 485 (8.6%) | $111,141 |
| 6-Person Families | 153 (2.7%) | $99,250 |
| 7+ Person Families | 38 (0.7%) | $132,941 |
| Total | 5,622 (100.0%) | $109,672 |
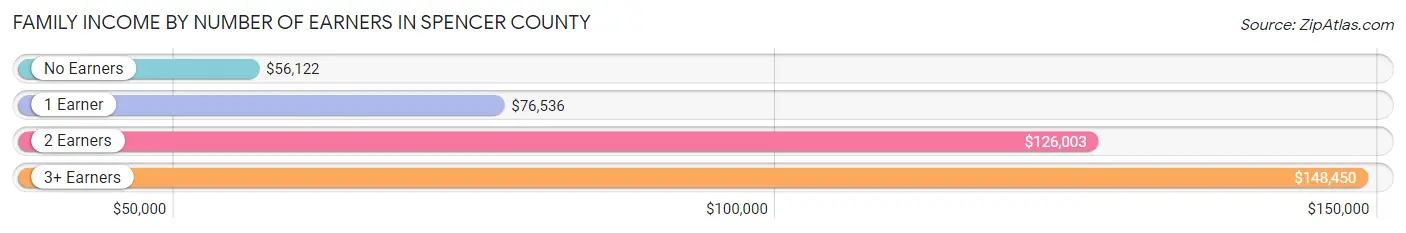
Family Income by Number of Earners in Spencer County
The median family income in Spencer County is $109,672, with families comprising 3+ earners (563) having the highest median family income of $148,450, while families with no earners (673) have the lowest median family income of $56,122, accounting for 10.0% and 12.0% of families, respectively.
| Number of Earners | # Families | Median Income |
| No Earners | 673 (12.0%) | $56,122 |
| 1 Earner | 1,659 (29.5%) | $76,536 |
| 2 Earners | 2,727 (48.5%) | $126,003 |
| 3+ Earners | 563 (10.0%) | $148,450 |
| Total | 5,622 (100.0%) | $109,672 |
Household Income in Spencer County
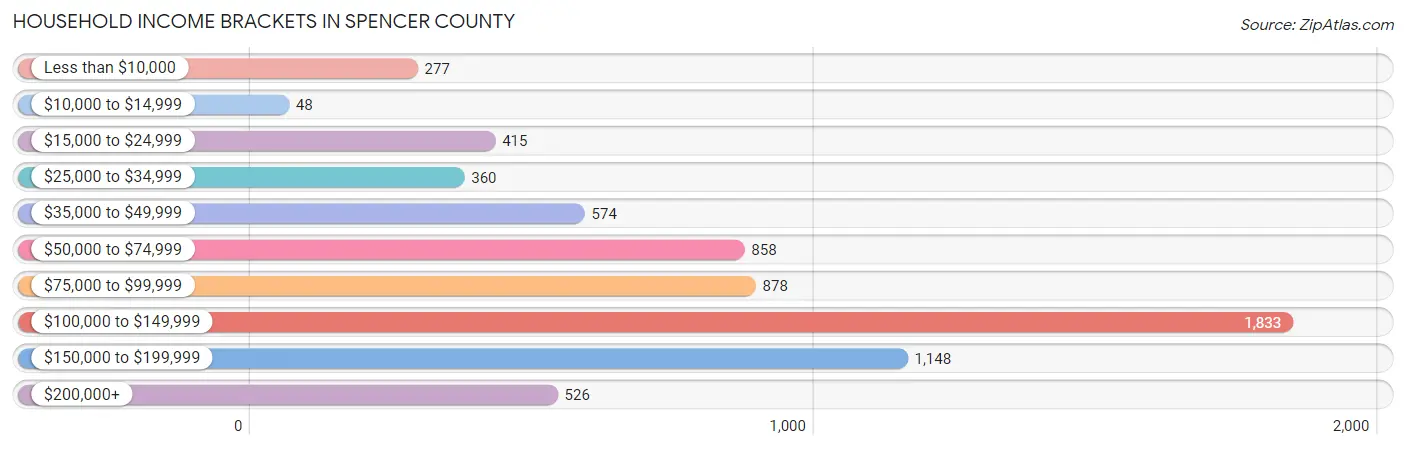
Household Income Brackets in Spencer County
With 1,833 households falling in the category, the $100,000 to $149,999 income range is the most frequent in Spencer County, accounting for 26.5% of all households. In contrast, only 48 households (0.7%) fall into the $10,000 to $14,999 income bracket, making it the least populous group.
| Income Bracket | # Households | % Households |
| Less than $10,000 | 277 | 4.0% |
| $10,000 to $14,999 | 48 | 0.7% |
| $15,000 to $24,999 | 415 | 6.0% |
| $25,000 to $34,999 | 360 | 5.2% |
| $35,000 to $49,999 | 574 | 8.3% |
| $50,000 to $74,999 | 858 | 12.4% |
| $75,000 to $99,999 | 878 | 12.7% |
| $100,000 to $149,999 | 1,833 | 26.5% |
| $150,000 to $199,999 | 1,148 | 16.6% |
| $200,000+ | 526 | 7.6% |
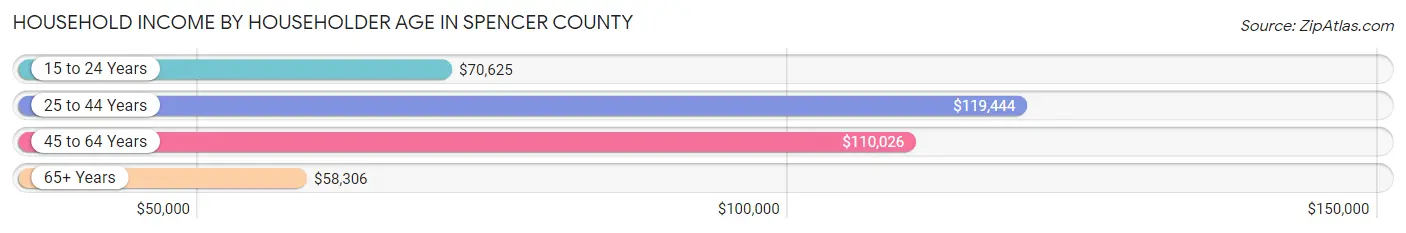
Household Income by Householder Age in Spencer County
The median household income in Spencer County is $101,118, with the highest median household income of $119,444 found in the 25 to 44 years age bracket for the primary householder. A total of 1,890 households (27.3%) fall into this category. Meanwhile, the 65+ years age bracket for the primary householder has the lowest median household income of $58,306, with 1,640 households (23.7%) in this group.
| Income Bracket | # Households | Median Income |
| 15 to 24 Years | 51 (0.7%) | $70,625 |
| 25 to 44 Years | 1,890 (27.3%) | $119,444 |
| 45 to 64 Years | 3,335 (48.2%) | $110,026 |
| 65+ Years | 1,640 (23.7%) | $58,306 |
| Total | 6,916 (100.0%) | $101,118 |
Poverty in Spencer County
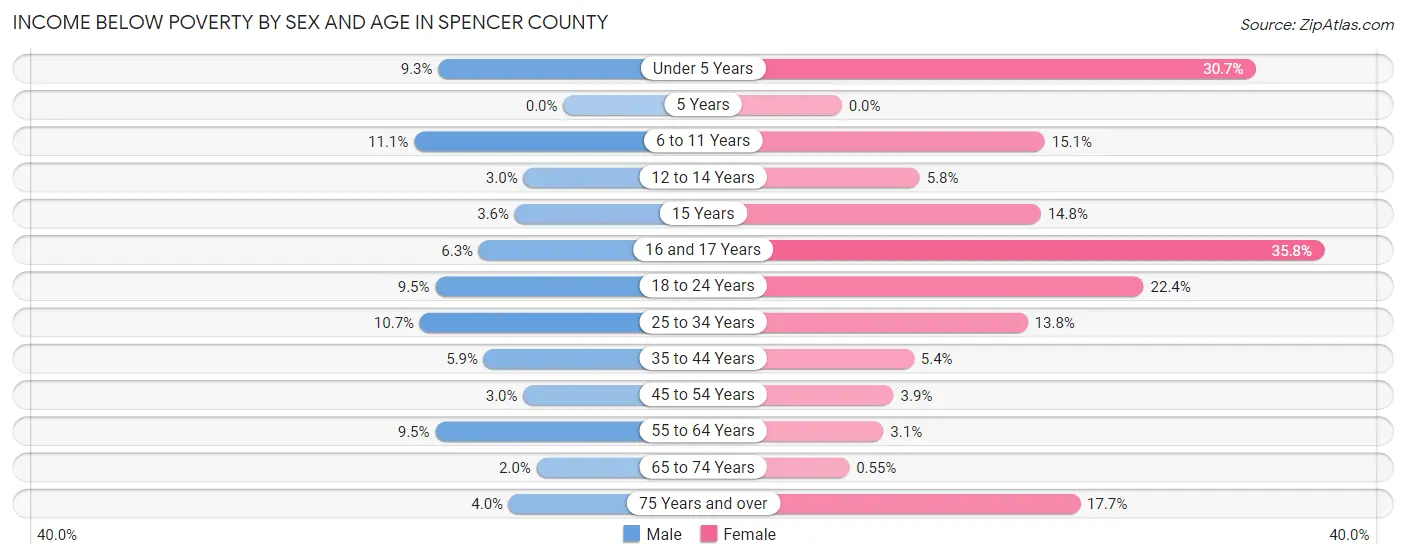
Income Below Poverty by Sex and Age in Spencer County
With 6.6% poverty level for males and 10.1% for females among the residents of Spencer County, 6 to 11 year old males and 16 and 17 year old females are the most vulnerable to poverty, with 76 males (11.1%) and 107 females (35.8%) in their respective age groups living below the poverty level.
| Age Bracket | Male | Female |
| Under 5 Years | 48 (9.3%) | 144 (30.7%) |
| 5 Years | 0 (0.0%) | 0 (0.0%) |
| 6 to 11 Years | 76 (11.1%) | 101 (15.1%) |
| 12 to 14 Years | 12 (3.0%) | 28 (5.8%) |
| 15 Years | 4 (3.6%) | 13 (14.8%) |
| 16 and 17 Years | 20 (6.3%) | 107 (35.8%) |
| 18 to 24 Years | 69 (9.5%) | 171 (22.4%) |
| 25 to 34 Years | 103 (10.6%) | 138 (13.8%) |
| 35 to 44 Years | 77 (5.9%) | 71 (5.3%) |
| 45 to 54 Years | 46 (3.0%) | 55 (3.8%) |
| 55 to 64 Years | 156 (9.5%) | 46 (3.1%) |
| 65 to 74 Years | 18 (2.0%) | 5 (0.5%) |
| 75 Years and over | 18 (4.0%) | 81 (17.7%) |
| Total | 647 (6.6%) | 960 (10.1%) |
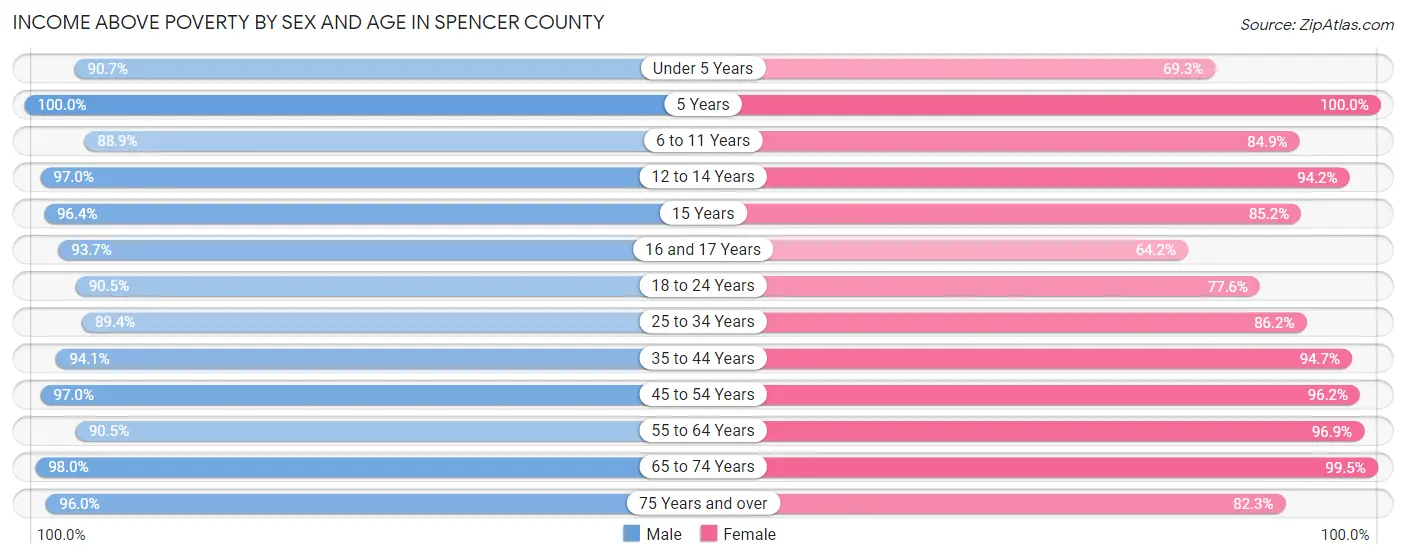
Income Above Poverty by Sex and Age in Spencer County
According to the poverty statistics in Spencer County, males aged 5 years and females aged 5 years are the age groups that are most secure financially, with 100.0% of males and 100.0% of females in these age groups living above the poverty line.
| Age Bracket | Male | Female |
| Under 5 Years | 469 (90.7%) | 325 (69.3%) |
| 5 Years | 200 (100.0%) | 124 (100.0%) |
| 6 to 11 Years | 610 (88.9%) | 569 (84.9%) |
| 12 to 14 Years | 393 (97.0%) | 456 (94.2%) |
| 15 Years | 107 (96.4%) | 75 (85.2%) |
| 16 and 17 Years | 299 (93.7%) | 192 (64.2%) |
| 18 to 24 Years | 657 (90.5%) | 592 (77.6%) |
| 25 to 34 Years | 864 (89.3%) | 862 (86.2%) |
| 35 to 44 Years | 1,227 (94.1%) | 1,255 (94.7%) |
| 45 to 54 Years | 1,501 (97.0%) | 1,373 (96.2%) |
| 55 to 64 Years | 1,486 (90.5%) | 1,445 (96.9%) |
| 65 to 74 Years | 891 (98.0%) | 905 (99.5%) |
| 75 Years and over | 428 (96.0%) | 377 (82.3%) |
| Total | 9,132 (93.4%) | 8,550 (89.9%) |
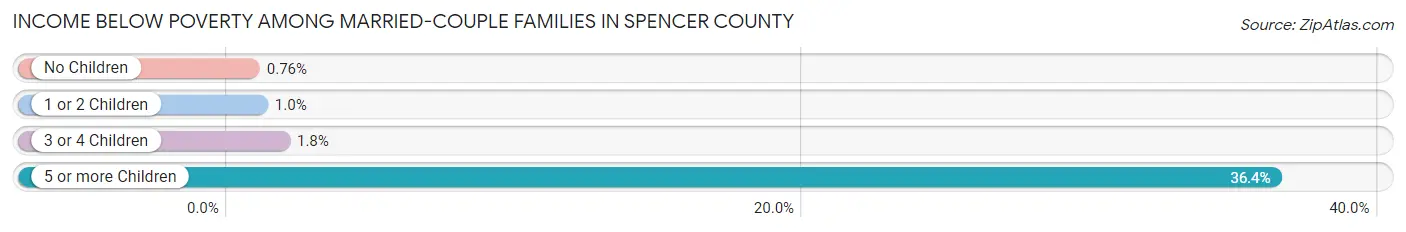
Income Below Poverty Among Married-Couple Families in Spencer County
The poverty statistics for married-couple families in Spencer County show that 1.2% or 54 of the total 4,568 families live below the poverty line. Families with 5 or more children have the highest poverty rate of 36.4%, comprising of 12 families. On the other hand, families with no children have the lowest poverty rate of 0.8%, which includes 21 families.
| Children | Above Poverty | Below Poverty |
| No Children | 2,738 (99.2%) | 21 (0.8%) |
| 1 or 2 Children | 1,430 (99.0%) | 15 (1.0%) |
| 3 or 4 Children | 325 (98.2%) | 6 (1.8%) |
| 5 or more Children | 21 (63.6%) | 12 (36.4%) |
| Total | 4,514 (98.8%) | 54 (1.2%) |
Income Below Poverty Among Single-Parent Households in Spencer County
According to the poverty data in Spencer County, 12.0% or 54 single-father households and 17.6% or 106 single-mother households are living below the poverty line. Among single-father households, those with 3 or 4 children have the highest poverty rate, with 52 households (86.7%) experiencing poverty. Likewise, among single-mother households, those with 1 or 2 children have the highest poverty rate, with 99 households (29.1%) falling below the poverty line.
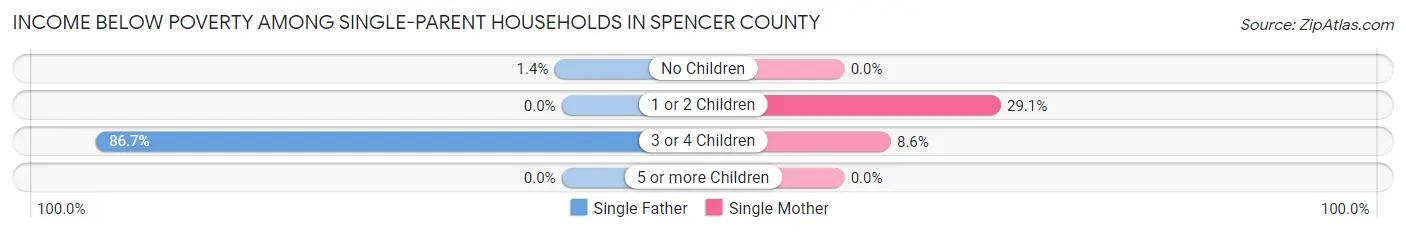
| Children | Single Father | Single Mother |
| No Children | 2 (1.3%) | 0 (0.0%) |
| 1 or 2 Children | 0 (0.0%) | 99 (29.1%) |
| 3 or 4 Children | 52 (86.7%) | 7 (8.6%) |
| 5 or more Children | 0 (0.0%) | 0 (0.0%) |
| Total | 54 (12.0%) | 106 (17.6%) |
Income Below Poverty Among Married-Couple vs Single-Parent Households in Spencer County
The poverty data for Spencer County shows that 54 of the married-couple family households (1.2%) and 160 of the single-parent households (15.2%) are living below the poverty level. Within the married-couple family households, those with 5 or more children have the highest poverty rate, with 12 households (36.4%) falling below the poverty line. Among the single-parent households, those with 3 or 4 children have the highest poverty rate, with 59 household (41.8%) living below poverty.
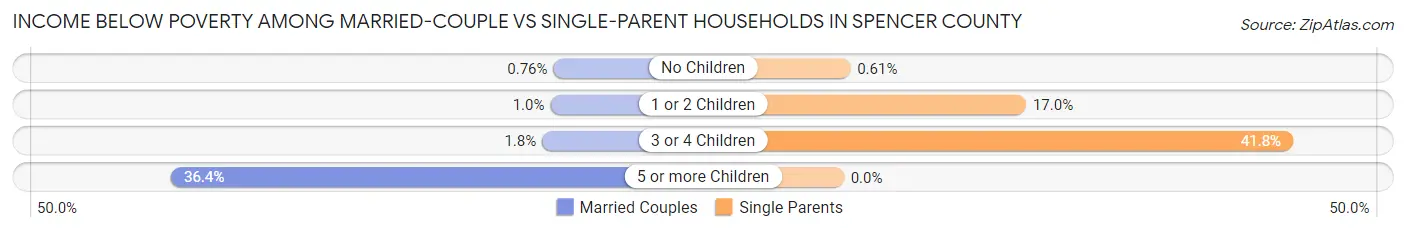
| Children | Married-Couple Families | Single-Parent Households |
| No Children | 21 (0.8%) | 2 (0.6%) |
| 1 or 2 Children | 15 (1.0%) | 99 (17.0%) |
| 3 or 4 Children | 6 (1.8%) | 59 (41.8%) |
| 5 or more Children | 12 (36.4%) | 0 (0.0%) |
| Total | 54 (1.2%) | 160 (15.2%) |
Race in Spencer County
The most populous races in Spencer County are White / Caucasian (18,612 | 95.2%), Hispanic or Latino (514 | 2.6%), and Two or more Races (359 | 1.8%).
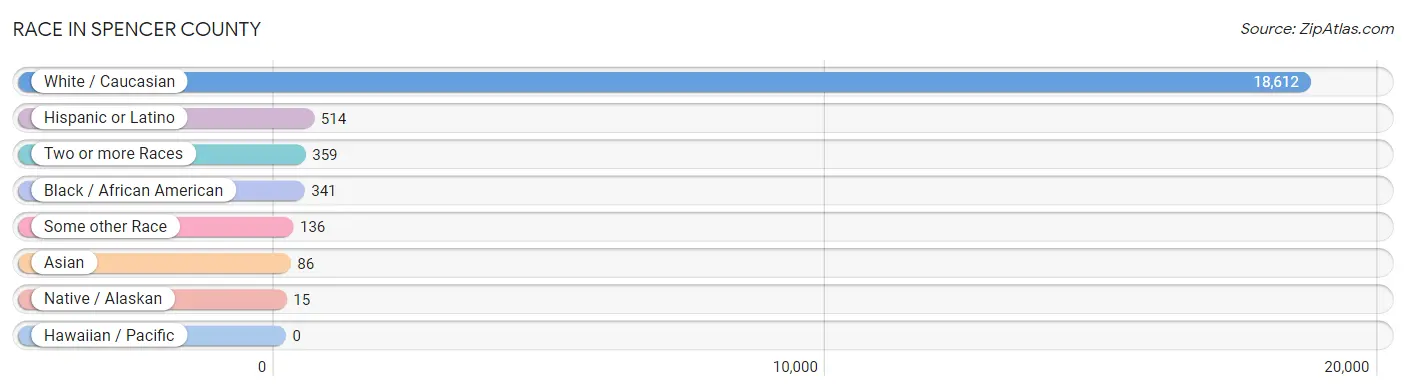
| Race | # Population | % Population |
| Asian | 86 | 0.4% |
| Black / African American | 341 | 1.7% |
| Hawaiian / Pacific | 0 | 0.0% |
| Hispanic or Latino | 514 | 2.6% |
| Native / Alaskan | 15 | 0.1% |
| White / Caucasian | 18,612 | 95.2% |
| Two or more Races | 359 | 1.8% |
| Some other Race | 136 | 0.7% |
| Total | 19,549 | 100.0% |
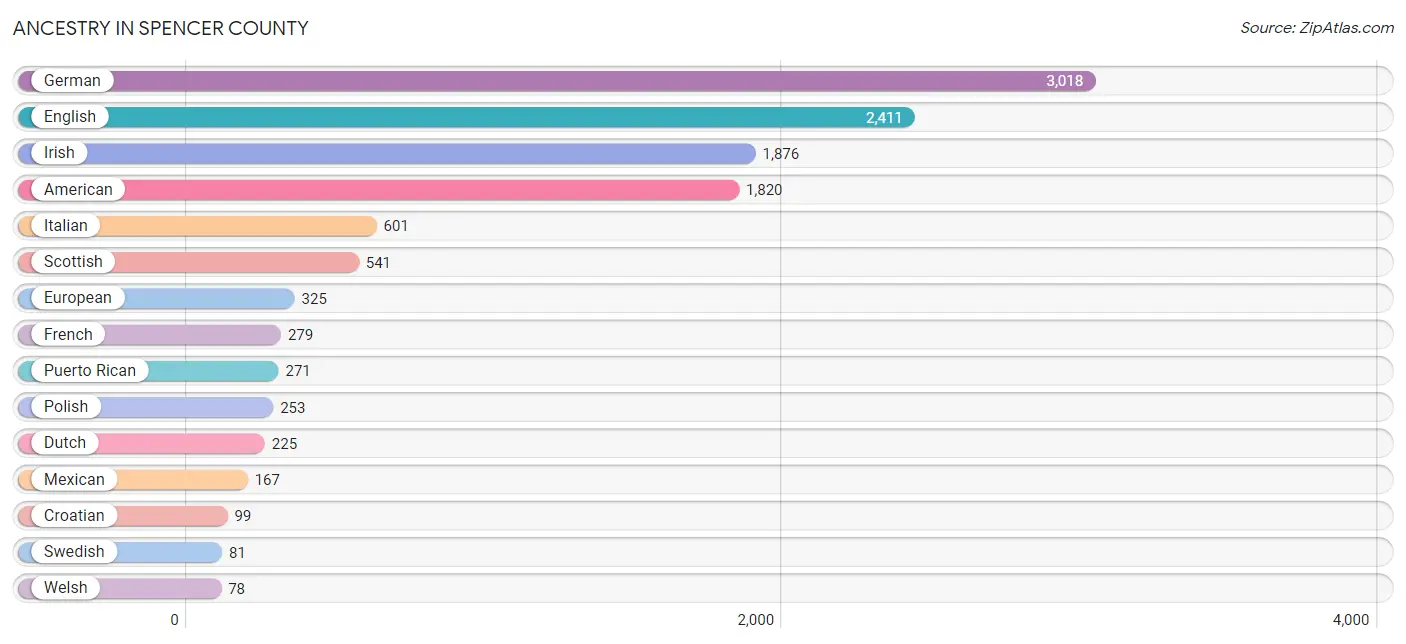
Ancestry in Spencer County
The most populous ancestries reported in Spencer County are German (3,018 | 15.4%), English (2,411 | 12.3%), Irish (1,876 | 9.6%), American (1,820 | 9.3%), and Italian (601 | 3.1%), together accounting for 49.8% of all Spencer County residents.
| Ancestry | # Population | % Population |
| African | 4 | 0.0% |
| American | 1,820 | 9.3% |
| Australian | 5 | 0.0% |
| Austrian | 34 | 0.2% |
| Belgian | 60 | 0.3% |
| Brazilian | 30 | 0.2% |
| British | 26 | 0.1% |
| Central American | 44 | 0.2% |
| Cherokee | 23 | 0.1% |
| Chippewa | 4 | 0.0% |
| Colombian | 26 | 0.1% |
| Croatian | 99 | 0.5% |
| Cuban | 6 | 0.0% |
| Czech | 11 | 0.1% |
| Dutch | 225 | 1.1% |
| Eastern European | 30 | 0.2% |
| English | 2,411 | 12.3% |
| European | 325 | 1.7% |
| Filipino | 5 | 0.0% |
| French | 279 | 1.4% |
| German | 3,018 | 15.4% |
| Greek | 11 | 0.1% |
| Indian (Asian) | 42 | 0.2% |
| Irish | 1,876 | 9.6% |
| Italian | 601 | 3.1% |
| Korean | 46 | 0.2% |
| Lithuanian | 26 | 0.1% |
| Mexican | 167 | 0.9% |
| Mexican American Indian | 5 | 0.0% |
| Norwegian | 30 | 0.2% |
| Polish | 253 | 1.3% |
| Portuguese | 36 | 0.2% |
| Puerto Rican | 271 | 1.4% |
| Russian | 23 | 0.1% |
| Salvadoran | 44 | 0.2% |
| Samoan | 5 | 0.0% |
| Scandinavian | 72 | 0.4% |
| Scotch-Irish | 67 | 0.3% |
| Scottish | 541 | 2.8% |
| Serbian | 8 | 0.0% |
| Slovak | 44 | 0.2% |
| South American | 26 | 0.1% |
| Subsaharan African | 4 | 0.0% |
| Swedish | 81 | 0.4% |
| Swiss | 43 | 0.2% |
| Thai | 10 | 0.1% |
| Tlingit-Haida | 8 | 0.0% |
| Ukrainian | 19 | 0.1% |
| Welsh | 78 | 0.4% | View All 49 Rows |
Immigrants in Spencer County
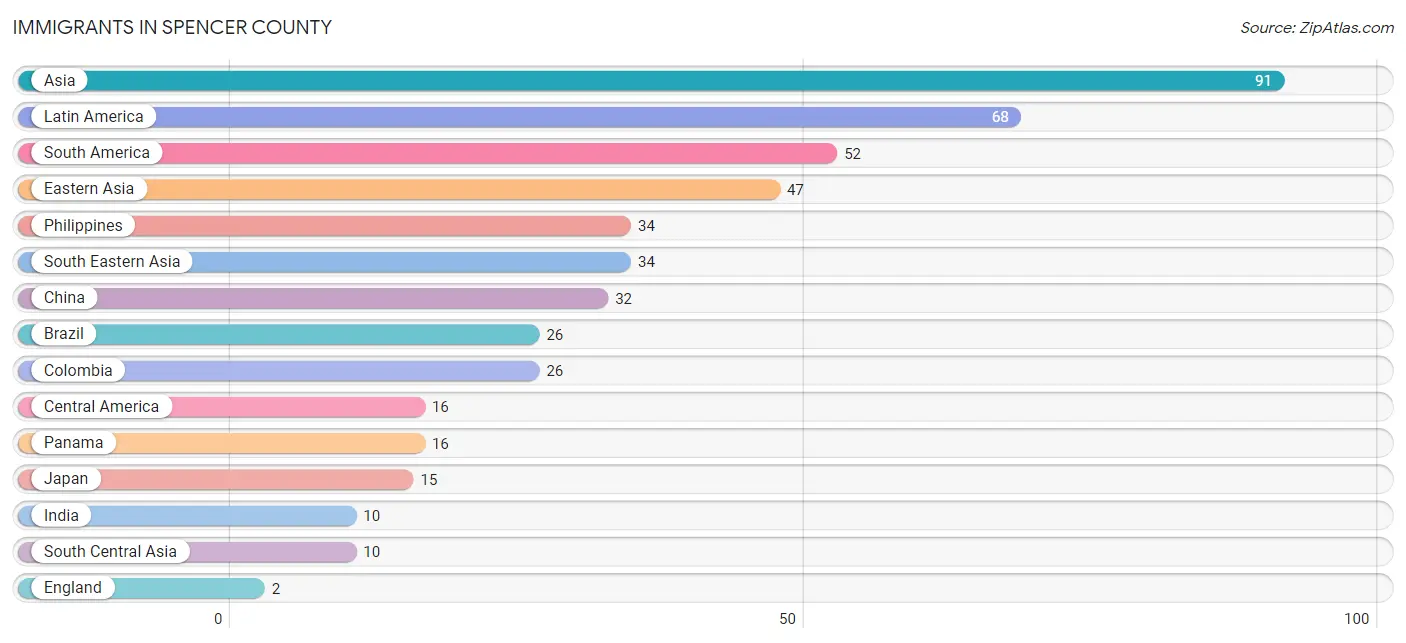
The most numerous immigrant groups reported in Spencer County came from Asia (91 | 0.5%), Latin America (68 | 0.4%), South America (52 | 0.3%), Eastern Asia (47 | 0.2%), and Philippines (34 | 0.2%), together accounting for 1.5% of all Spencer County residents.
| Immigration Origin | # Population | % Population |
| Asia | 91 | 0.5% |
| Brazil | 26 | 0.1% |
| Central America | 16 | 0.1% |
| China | 32 | 0.2% |
| Colombia | 26 | 0.1% |
| Eastern Asia | 47 | 0.2% |
| England | 2 | 0.0% |
| Europe | 2 | 0.0% |
| India | 10 | 0.1% |
| Japan | 15 | 0.1% |
| Latin America | 68 | 0.4% |
| Northern Europe | 2 | 0.0% |
| Panama | 16 | 0.1% |
| Philippines | 34 | 0.2% |
| South America | 52 | 0.3% |
| South Central Asia | 10 | 0.1% |
| South Eastern Asia | 34 | 0.2% | View All 17 Rows |
Sex and Age in Spencer County
Sex and Age in Spencer County
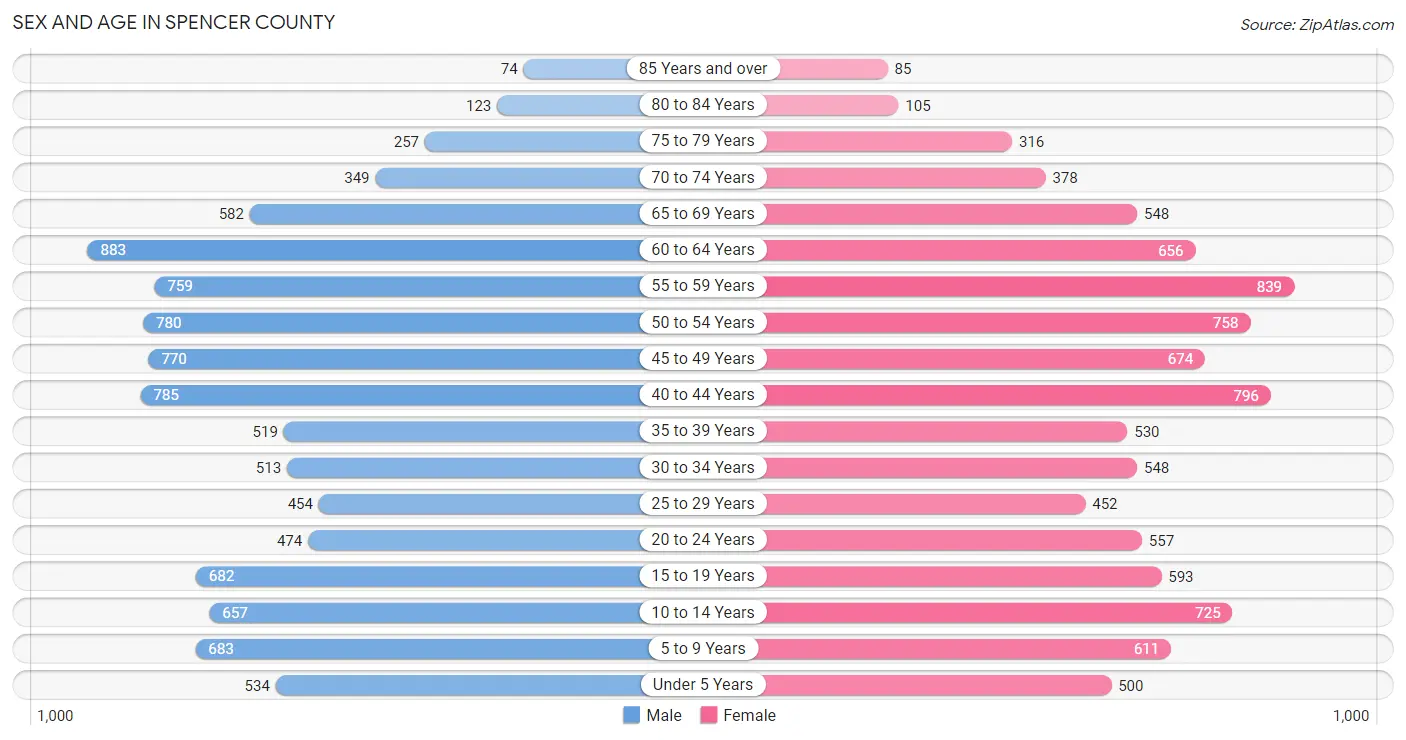
The most populous age groups in Spencer County are 60 to 64 Years (883 | 8.9%) for men and 55 to 59 Years (839 | 8.7%) for women.
| Age Bracket | Male | Female |
| Under 5 Years | 534 (5.4%) | 500 (5.2%) |
| 5 to 9 Years | 683 (6.9%) | 611 (6.3%) |
| 10 to 14 Years | 657 (6.7%) | 725 (7.5%) |
| 15 to 19 Years | 682 (6.9%) | 593 (6.1%) |
| 20 to 24 Years | 474 (4.8%) | 557 (5.8%) |
| 25 to 29 Years | 454 (4.6%) | 452 (4.7%) |
| 30 to 34 Years | 513 (5.2%) | 548 (5.7%) |
| 35 to 39 Years | 519 (5.2%) | 530 (5.5%) |
| 40 to 44 Years | 785 (8.0%) | 796 (8.2%) |
| 45 to 49 Years | 770 (7.8%) | 674 (7.0%) |
| 50 to 54 Years | 780 (7.9%) | 758 (7.8%) |
| 55 to 59 Years | 759 (7.7%) | 839 (8.7%) |
| 60 to 64 Years | 883 (8.9%) | 656 (6.8%) |
| 65 to 69 Years | 582 (5.9%) | 548 (5.7%) |
| 70 to 74 Years | 349 (3.5%) | 378 (3.9%) |
| 75 to 79 Years | 257 (2.6%) | 316 (3.3%) |
| 80 to 84 Years | 123 (1.3%) | 105 (1.1%) |
| 85 Years and over | 74 (0.7%) | 85 (0.9%) |
| Total | 9,878 (100.0%) | 9,671 (100.0%) |
Families and Households in Spencer County
Median Family Size in Spencer County
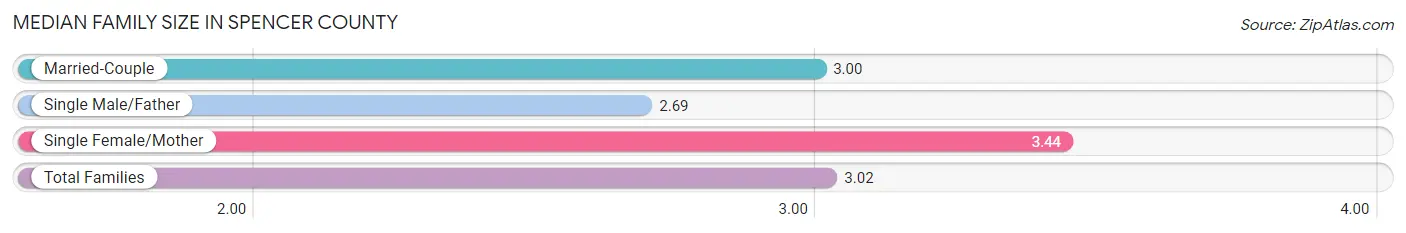
The median family size in Spencer County is 3.02 persons per family, with single female/mother families (603 | 10.7%) accounting for the largest median family size of 3.44 persons per family. On the other hand, single male/father families (451 | 8.0%) represent the smallest median family size with 2.69 persons per family.
| Family Type | # Families | Family Size |
| Married-Couple | 4,568 (81.2%) | 3.00 |
| Single Male/Father | 451 (8.0%) | 2.69 |
| Single Female/Mother | 603 (10.7%) | 3.44 |
| Total Families | 5,622 (100.0%) | 3.02 |
Median Household Size in Spencer County
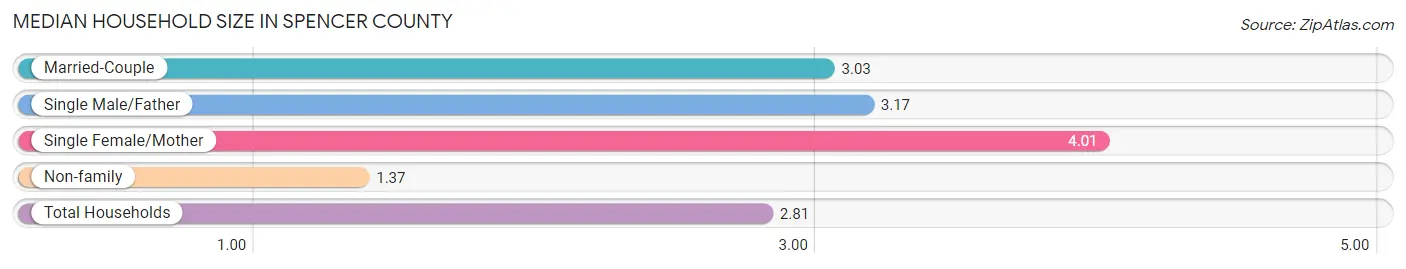
The median household size in Spencer County is 2.81 persons per household, with single female/mother households (603 | 8.7%) accounting for the largest median household size of 4.01 persons per household. non-family households (1,294 | 18.7%) represent the smallest median household size with 1.37 persons per household.
| Household Type | # Households | Household Size |
| Married-Couple | 4,568 (66.0%) | 3.03 |
| Single Male/Father | 451 (6.5%) | 3.17 |
| Single Female/Mother | 603 (8.7%) | 4.01 |
| Non-family | 1,294 (18.7%) | 1.37 |
| Total Households | 6,916 (100.0%) | 2.81 |
Household Size by Marriage Status in Spencer County
Out of a total of 6,916 households in Spencer County, 5,622 (81.3%) are family households, while 1,294 (18.7%) are nonfamily households. The most numerous type of family households are 2-person households, comprising 2,654, and the most common type of nonfamily households are 1-person households, comprising 1,038.
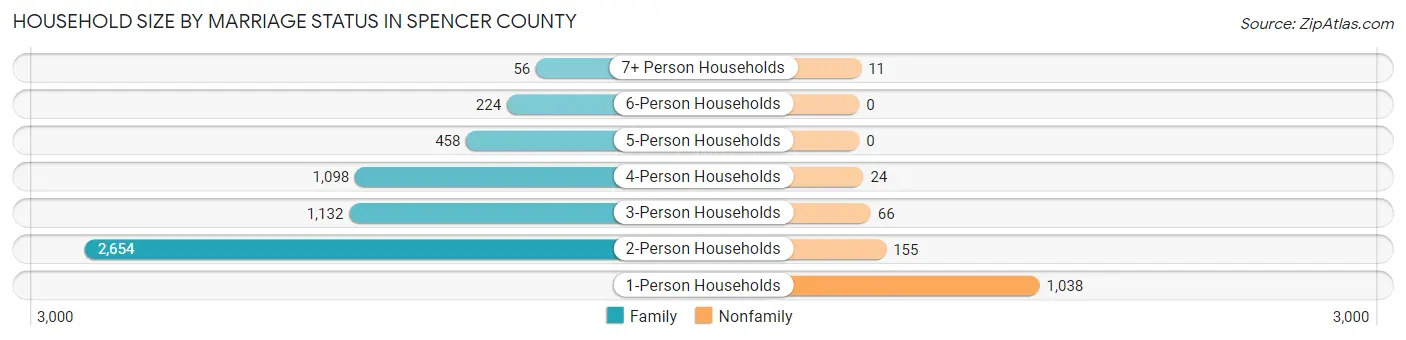
| Household Size | Family Households | Nonfamily Households |
| 1-Person Households | - | 1,038 (15.0%) |
| 2-Person Households | 2,654 (38.4%) | 155 (2.2%) |
| 3-Person Households | 1,132 (16.4%) | 66 (0.9%) |
| 4-Person Households | 1,098 (15.9%) | 24 (0.4%) |
| 5-Person Households | 458 (6.6%) | 0 (0.0%) |
| 6-Person Households | 224 (3.2%) | 0 (0.0%) |
| 7+ Person Households | 56 (0.8%) | 11 (0.2%) |
| Total | 5,622 (81.3%) | 1,294 (18.7%) |
Female Fertility in Spencer County
Fertility by Age in Spencer County
Average fertility rate in Spencer County is 77.0 births per 1,000 women. Women in the age bracket of 20 to 34 years have the highest fertility rate with 126.0 births per 1,000 women. Women in the age bracket of 20 to 34 years acount for 58.2% of all women with births.
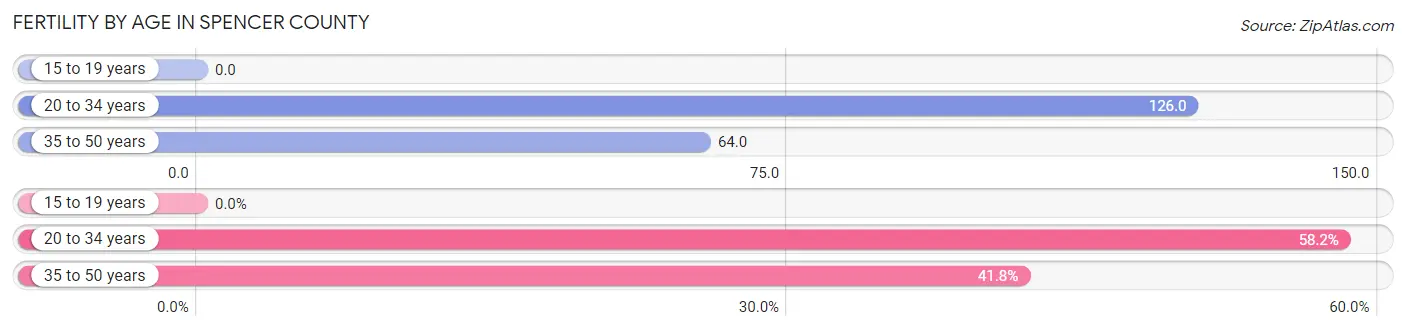
| Age Bracket | Women with Births | Births / 1,000 Women |
| 15 to 19 years | 0 (0.0%) | 0.0 |
| 20 to 34 years | 196 (58.2%) | 126.0 |
| 35 to 50 years | 141 (41.8%) | 64.0 |
| Total | 337 (100.0%) | 77.0 |
Fertility by Age by Marriage Status in Spencer County
57.9% of women with births (337) in Spencer County are married. The highest percentage of unmarried women with births falls into 20 to 34 years age bracket with 72.5% of them unmarried at the time of birth, while the lowest percentage of unmarried women with births belong to 35 to 50 years age bracket with 0.0% of them unmarried.
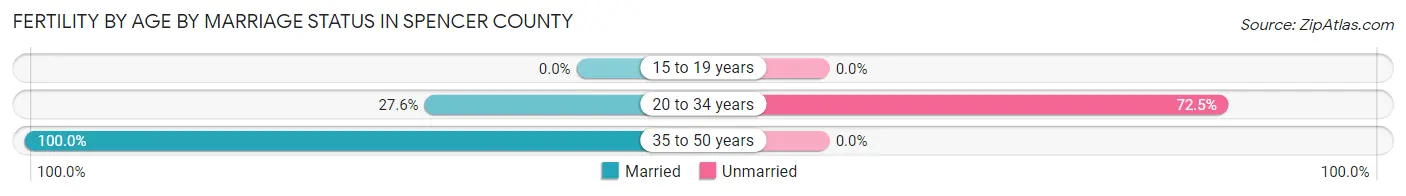
| Age Bracket | Married | Unmarried |
| 15 to 19 years | 0 (0.0%) | 0 (0.0%) |
| 20 to 34 years | 54 (27.6%) | 142 (72.5%) |
| 35 to 50 years | 141 (100.0%) | 0 (0.0%) |
| Total | 195 (57.9%) | 142 (42.1%) |
Fertility by Education in Spencer County
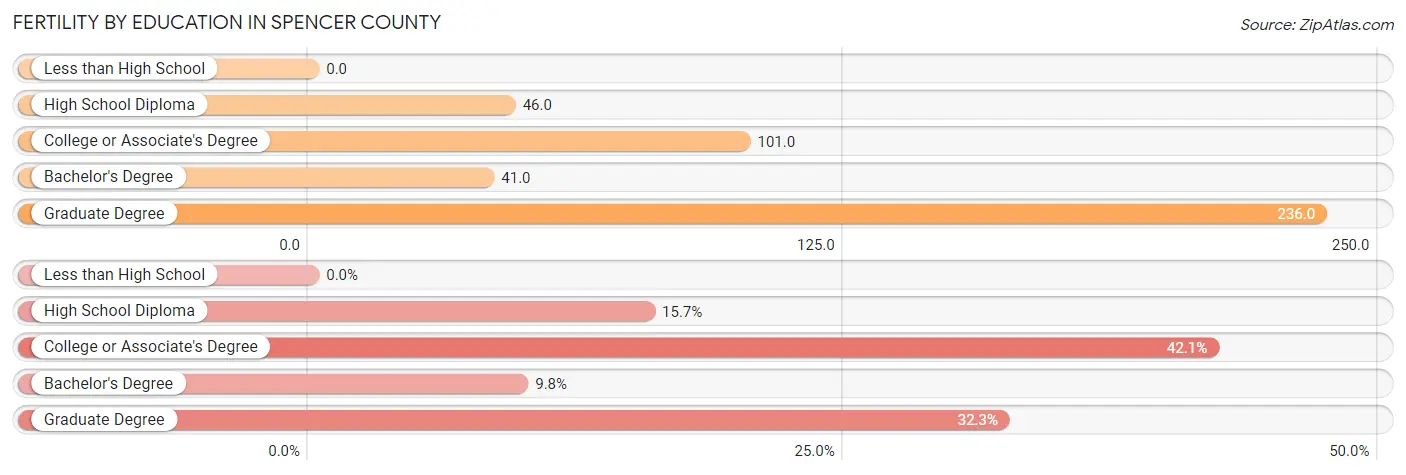
| Educational Attainment | Women with Births | Births / 1,000 Women |
| Less than High School | 0 (0.0%) | 0.0 |
| High School Diploma | 53 (15.7%) | 46.0 |
| College or Associate's Degree | 142 (42.1%) | 101.0 |
| Bachelor's Degree | 33 (9.8%) | 41.0 |
| Graduate Degree | 109 (32.3%) | 236.0 |
| Total | 337 (100.0%) | 77.0 |
Fertility by Education by Marriage Status in Spencer County
42.1% of women with births in Spencer County are unmarried. Women with the educational attainment of graduate degree are most likely to be married with 100.0% of them married at childbirth, while women with the educational attainment of high school diploma are least likely to be married with 100.0% of them unmarried at childbirth.
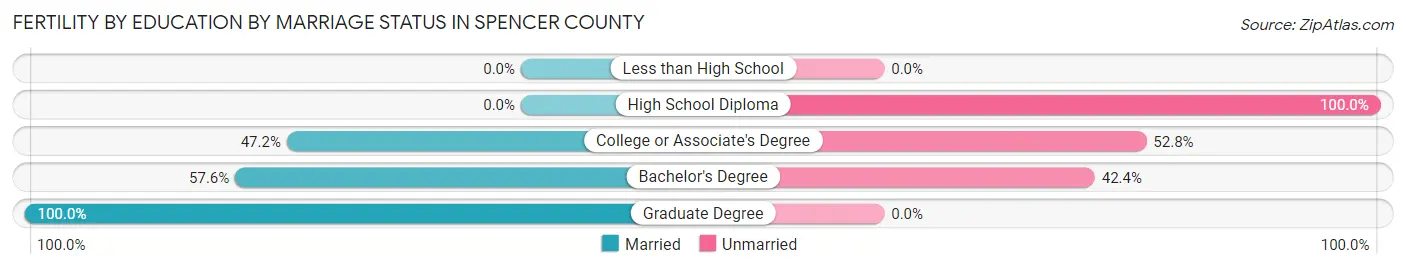
| Educational Attainment | Married | Unmarried |
| Less than High School | 0 (0.0%) | 0 (0.0%) |
| High School Diploma | 0 (0.0%) | 53 (100.0%) |
| College or Associate's Degree | 67 (47.2%) | 75 (52.8%) |
| Bachelor's Degree | 19 (57.6%) | 14 (42.4%) |
| Graduate Degree | 109 (100.0%) | 0 (0.0%) |
| Total | 195 (57.9%) | 142 (42.1%) |
Employment Characteristics in Spencer County
Employment by Class of Employer in Spencer County
Among the 9,528 employed individuals in Spencer County, private company employees (7,005 | 73.5%), not-for-profit organizations (858 | 9.0%), and local government employees (675 | 7.1%) make up the most common classes of employment.
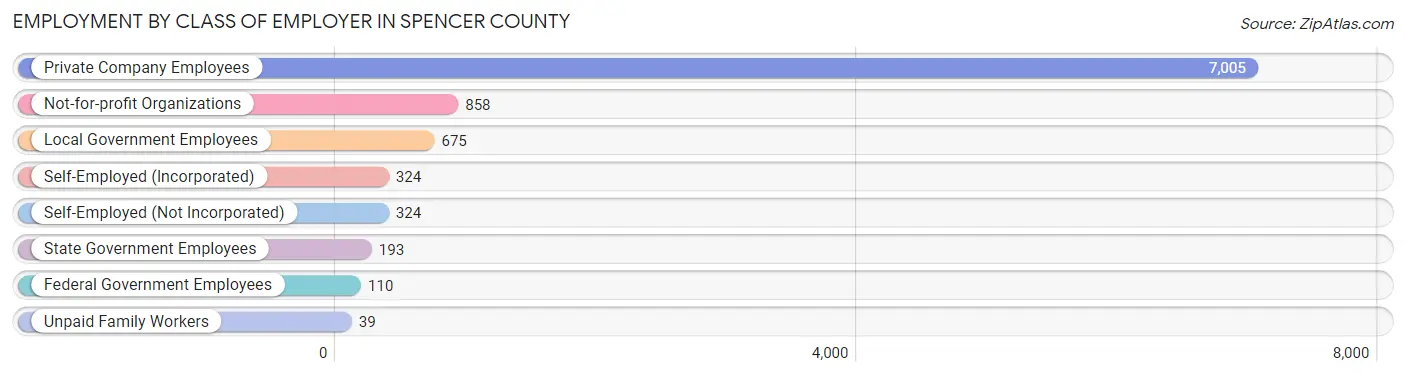
| Employer Class | # Employees | % Employees |
| Private Company Employees | 7,005 | 73.5% |
| Self-Employed (Incorporated) | 324 | 3.4% |
| Self-Employed (Not Incorporated) | 324 | 3.4% |
| Not-for-profit Organizations | 858 | 9.0% |
| Local Government Employees | 675 | 7.1% |
| State Government Employees | 193 | 2.0% |
| Federal Government Employees | 110 | 1.1% |
| Unpaid Family Workers | 39 | 0.4% |
| Total | 9,528 | 100.0% |
Employment Status by Age in Spencer County
According to the labor force statistics for Spencer County, out of the total population over 16 years of age (15,640), 67.7% or 10,588 individuals are in the labor force, with 6.2% or 656 of them unemployed. The age group with the highest labor force participation rate is 30 to 34 years, with 91.2% or 968 individuals in the labor force. Within the labor force, the 20 to 24 years age range has the highest percentage of unemployed individuals, with 16.9% or 137 of them being unemployed.
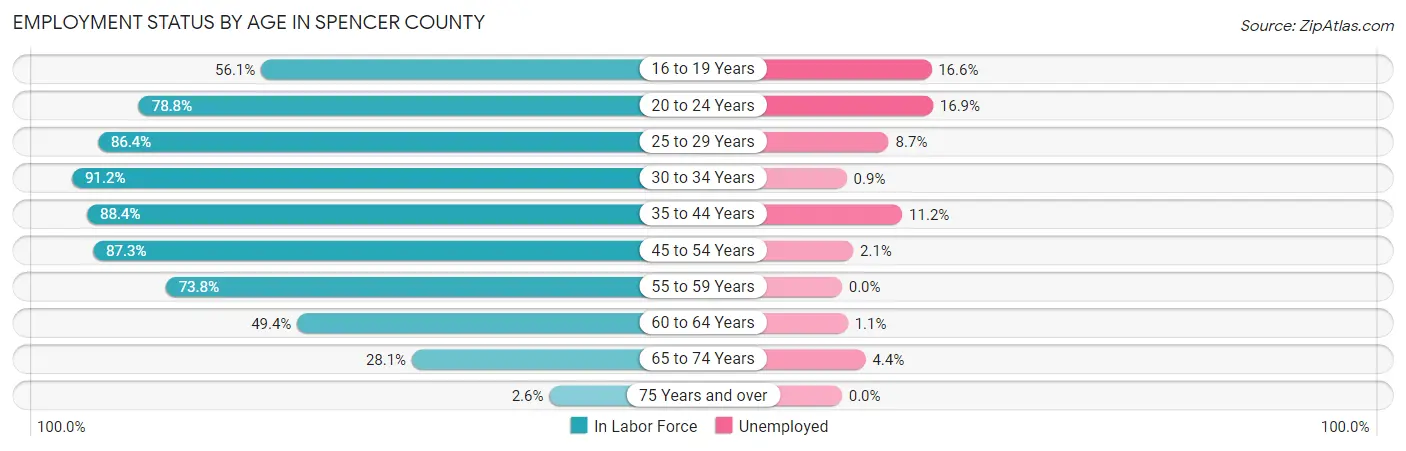
| Age Bracket | In Labor Force | Unemployed |
| 16 to 19 Years | 604 (56.1%) | 100 (16.6%) |
| 20 to 24 Years | 812 (78.8%) | 137 (16.9%) |
| 25 to 29 Years | 783 (86.4%) | 68 (8.7%) |
| 30 to 34 Years | 968 (91.2%) | 9 (0.9%) |
| 35 to 44 Years | 2,325 (88.4%) | 260 (11.2%) |
| 45 to 54 Years | 2,603 (87.3%) | 55 (2.1%) |
| 55 to 59 Years | 1,179 (73.8%) | 0 (0.0%) |
| 60 to 64 Years | 760 (49.4%) | 8 (1.1%) |
| 65 to 74 Years | 522 (28.1%) | 23 (4.4%) |
| 75 Years and over | 25 (2.6%) | 0 (0.0%) |
| Total | 10,588 (67.7%) | 656 (6.2%) |
Employment Status by Educational Attainment in Spencer County
According to labor force statistics for Spencer County, 80.4% of individuals (8,616) out of the total population between 25 and 64 years of age (10,716) are in the labor force, with 4.6% or 396 of them being unemployed. The group with the highest labor force participation rate are those with the educational attainment of bachelor's degree or higher, with 87.4% or 2,265 individuals in the labor force. Within the labor force, individuals with high school diploma education have the highest percentage of unemployment, with 10.0% or 297 of them being unemployed.
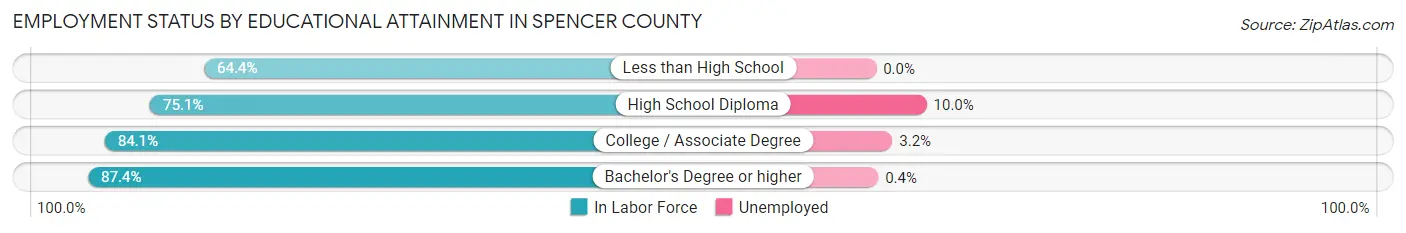
| Educational Attainment | In Labor Force | Unemployed |
| Less than High School | 406 (64.4%) | 0 (0.0%) |
| High School Diploma | 2,974 (75.1%) | 396 (10.0%) |
| College / Associate Degree | 2,972 (84.1%) | 113 (3.2%) |
| Bachelor's Degree or higher | 2,265 (87.4%) | 10 (0.4%) |
| Total | 8,616 (80.4%) | 493 (4.6%) |
Employment Occupations by Sex in Spencer County
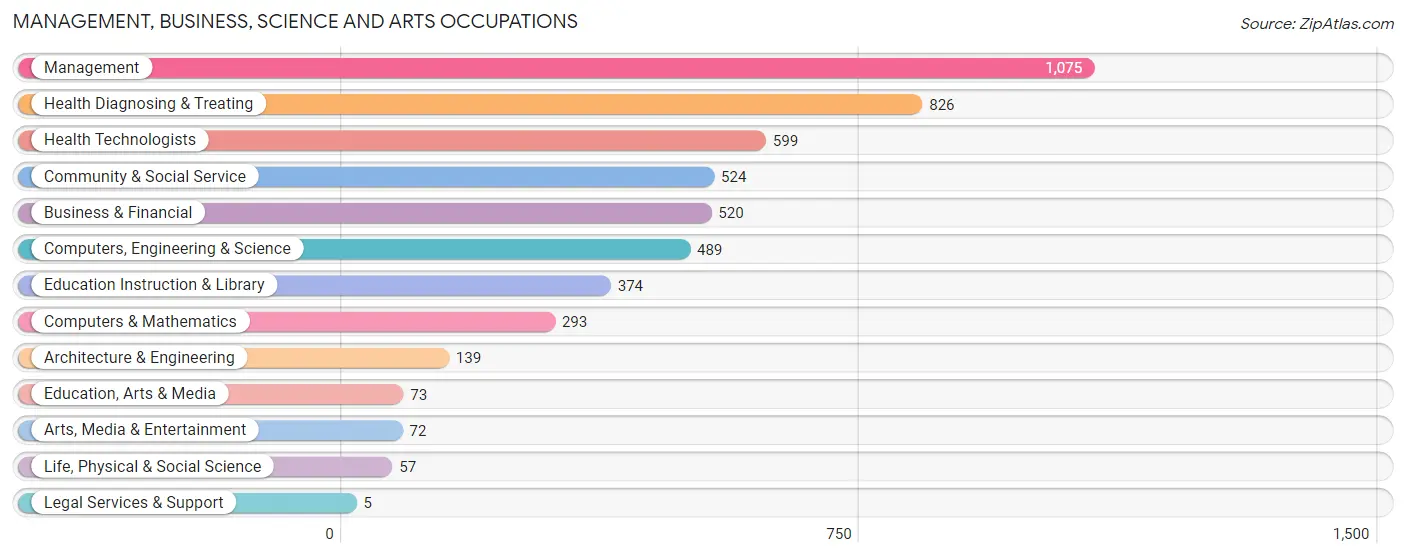
Management, Business, Science and Arts Occupations
The most common Management, Business, Science and Arts occupations in Spencer County are Management (1,075 | 10.8%), Health Diagnosing & Treating (826 | 8.3%), Health Technologists (599 | 6.0%), Community & Social Service (524 | 5.3%), and Business & Financial (520 | 5.2%).
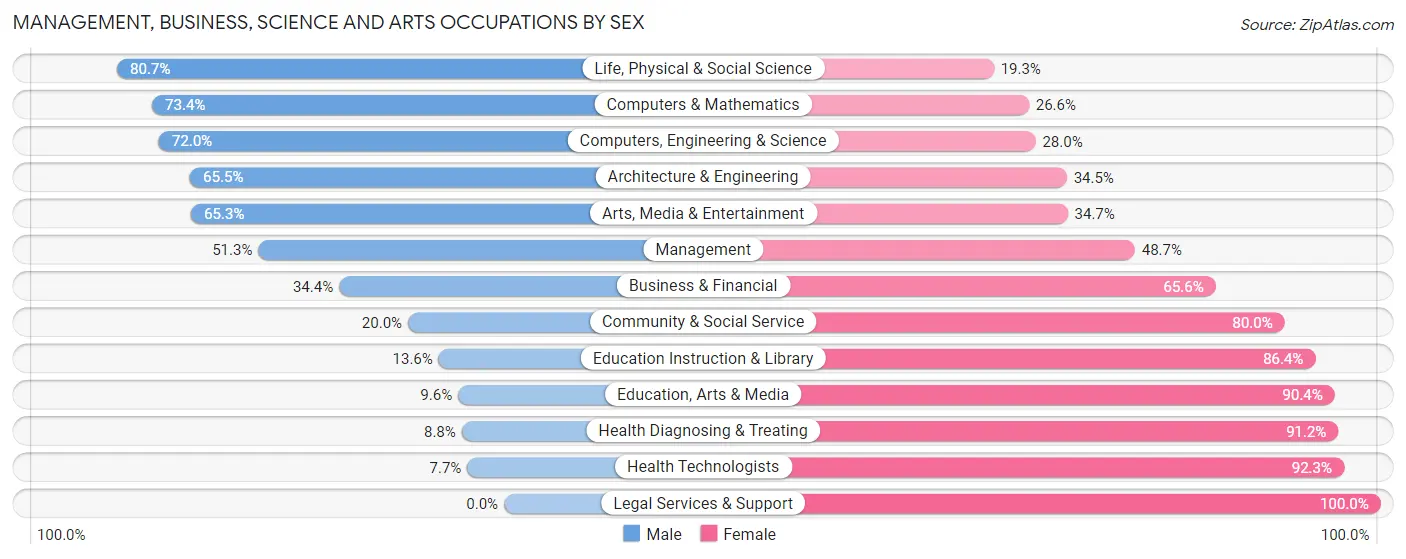
Management, Business, Science and Arts Occupations by Sex
Within the Management, Business, Science and Arts occupations in Spencer County, the most male-oriented occupations are Life, Physical & Social Science (80.7%), Computers & Mathematics (73.4%), and Computers, Engineering & Science (72.0%), while the most female-oriented occupations are Legal Services & Support (100.0%), Health Technologists (92.3%), and Health Diagnosing & Treating (91.2%).
| Occupation | Male | Female |
| Management | 551 (51.3%) | 524 (48.7%) |
| Business & Financial | 179 (34.4%) | 341 (65.6%) |
| Computers, Engineering & Science | 352 (72.0%) | 137 (28.0%) |
| Computers & Mathematics | 215 (73.4%) | 78 (26.6%) |
| Architecture & Engineering | 91 (65.5%) | 48 (34.5%) |
| Life, Physical & Social Science | 46 (80.7%) | 11 (19.3%) |
| Community & Social Service | 105 (20.0%) | 419 (80.0%) |
| Education, Arts & Media | 7 (9.6%) | 66 (90.4%) |
| Legal Services & Support | 0 (0.0%) | 5 (100.0%) |
| Education Instruction & Library | 51 (13.6%) | 323 (86.4%) |
| Arts, Media & Entertainment | 47 (65.3%) | 25 (34.7%) |
| Health Diagnosing & Treating | 73 (8.8%) | 753 (91.2%) |
| Health Technologists | 46 (7.7%) | 553 (92.3%) |
| Total (Category) | 1,260 (36.7%) | 2,174 (63.3%) |
| Total (Overall) | 5,280 (53.2%) | 4,637 (46.8%) |
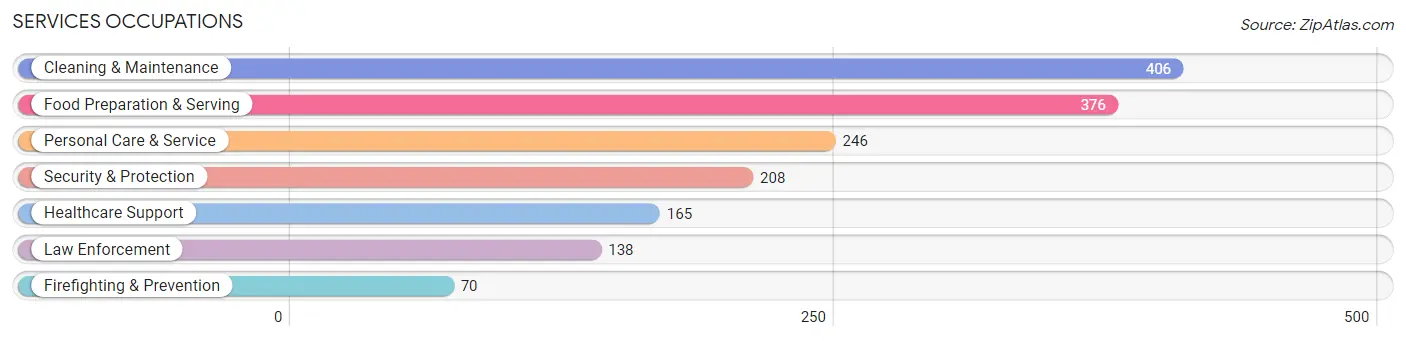
Services Occupations
The most common Services occupations in Spencer County are Cleaning & Maintenance (406 | 4.1%), Food Preparation & Serving (376 | 3.8%), Personal Care & Service (246 | 2.5%), Security & Protection (208 | 2.1%), and Healthcare Support (165 | 1.7%).
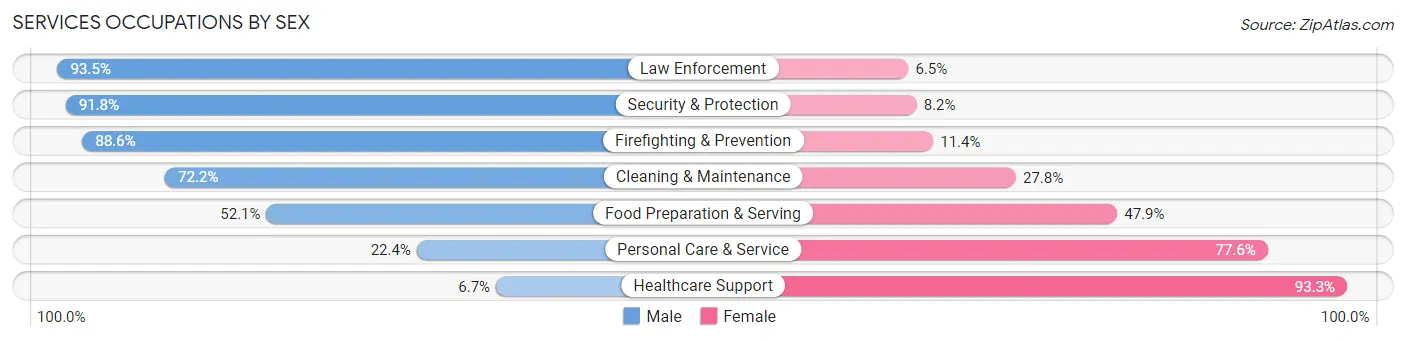
Services Occupations by Sex
Within the Services occupations in Spencer County, the most male-oriented occupations are Law Enforcement (93.5%), Security & Protection (91.8%), and Firefighting & Prevention (88.6%), while the most female-oriented occupations are Healthcare Support (93.3%), Personal Care & Service (77.6%), and Food Preparation & Serving (47.9%).
| Occupation | Male | Female |
| Healthcare Support | 11 (6.7%) | 154 (93.3%) |
| Security & Protection | 191 (91.8%) | 17 (8.2%) |
| Firefighting & Prevention | 62 (88.6%) | 8 (11.4%) |
| Law Enforcement | 129 (93.5%) | 9 (6.5%) |
| Food Preparation & Serving | 196 (52.1%) | 180 (47.9%) |
| Cleaning & Maintenance | 293 (72.2%) | 113 (27.8%) |
| Personal Care & Service | 55 (22.4%) | 191 (77.6%) |
| Total (Category) | 746 (53.2%) | 655 (46.8%) |
| Total (Overall) | 5,280 (53.2%) | 4,637 (46.8%) |
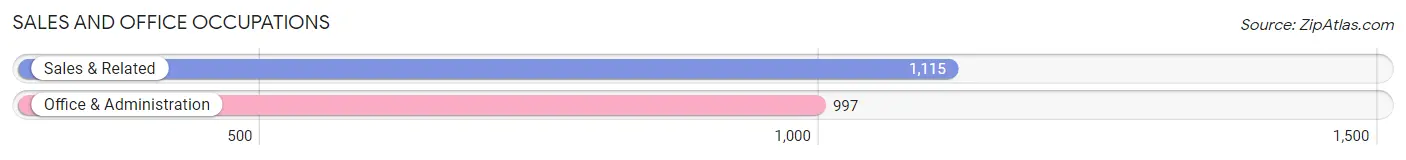
Sales and Office Occupations
The most common Sales and Office occupations in Spencer County are Sales & Related (1,115 | 11.2%), and Office & Administration (997 | 10.1%).
Sales and Office Occupations by Sex

| Occupation | Male | Female |
| Sales & Related | 598 (53.6%) | 517 (46.4%) |
| Office & Administration | 128 (12.8%) | 869 (87.2%) |
| Total (Category) | 726 (34.4%) | 1,386 (65.6%) |
| Total (Overall) | 5,280 (53.2%) | 4,637 (46.8%) |
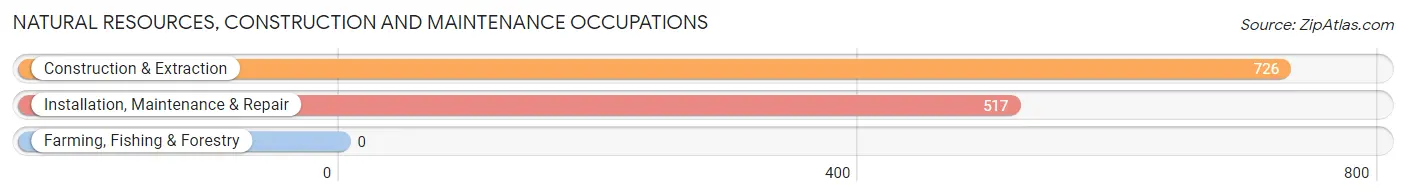
Natural Resources, Construction and Maintenance Occupations
The most common Natural Resources, Construction and Maintenance occupations in Spencer County are Construction & Extraction (726 | 7.3%), and Installation, Maintenance & Repair (517 | 5.2%).
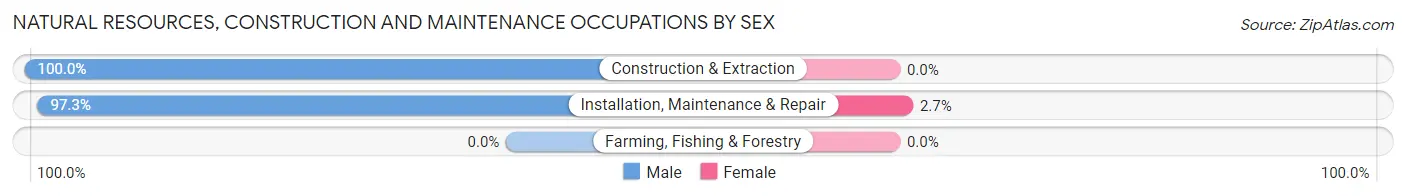
Natural Resources, Construction and Maintenance Occupations by Sex
| Occupation | Male | Female |
| Farming, Fishing & Forestry | 0 (0.0%) | 0 (0.0%) |
| Construction & Extraction | 726 (100.0%) | 0 (0.0%) |
| Installation, Maintenance & Repair | 503 (97.3%) | 14 (2.7%) |
| Total (Category) | 1,229 (98.9%) | 14 (1.1%) |
| Total (Overall) | 5,280 (53.2%) | 4,637 (46.8%) |
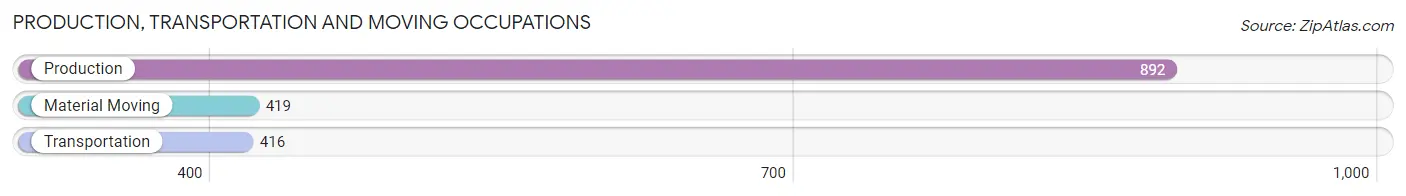
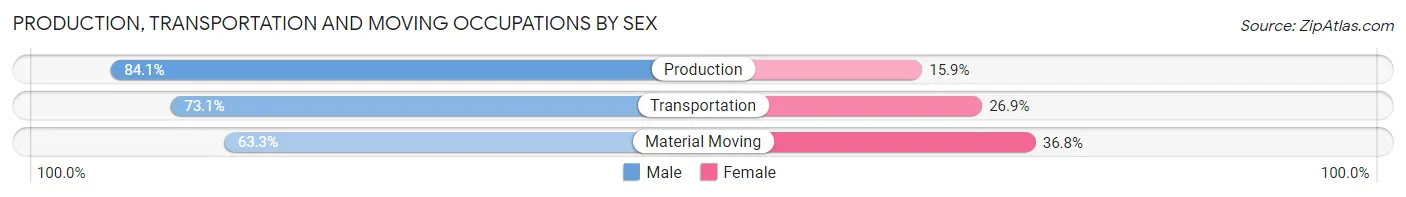
Production, Transportation and Moving Occupations
The most common Production, Transportation and Moving occupations in Spencer County are Production (892 | 9.0%), Material Moving (419 | 4.2%), and Transportation (416 | 4.2%).
Production, Transportation and Moving Occupations by Sex
| Occupation | Male | Female |
| Production | 750 (84.1%) | 142 (15.9%) |
| Transportation | 304 (73.1%) | 112 (26.9%) |
| Material Moving | 265 (63.2%) | 154 (36.7%) |
| Total (Category) | 1,319 (76.4%) | 408 (23.6%) |
| Total (Overall) | 5,280 (53.2%) | 4,637 (46.8%) |
Employment Industries by Sex in Spencer County
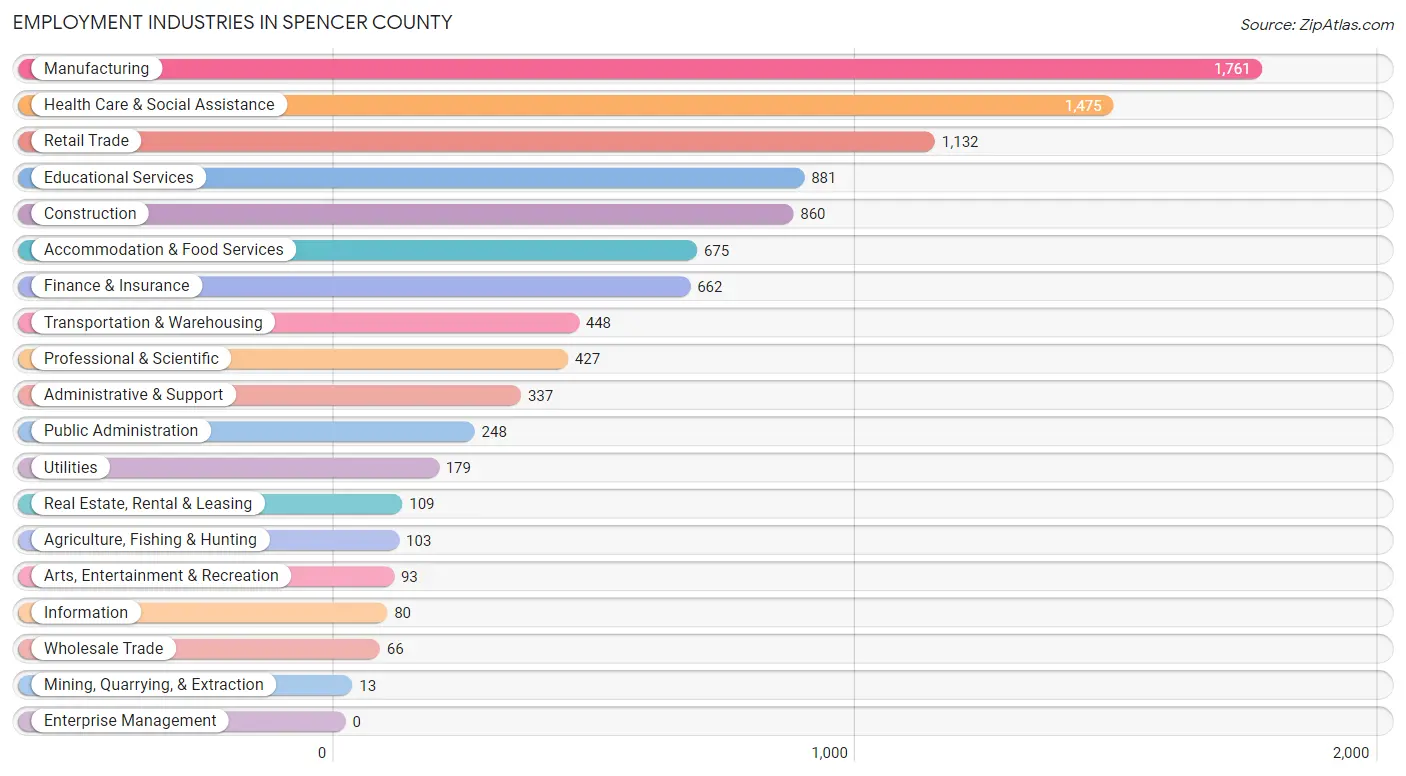
Employment Industries in Spencer County
The major employment industries in Spencer County include Manufacturing (1,761 | 17.8%), Health Care & Social Assistance (1,475 | 14.9%), Retail Trade (1,132 | 11.4%), Educational Services (881 | 8.9%), and Construction (860 | 8.7%).
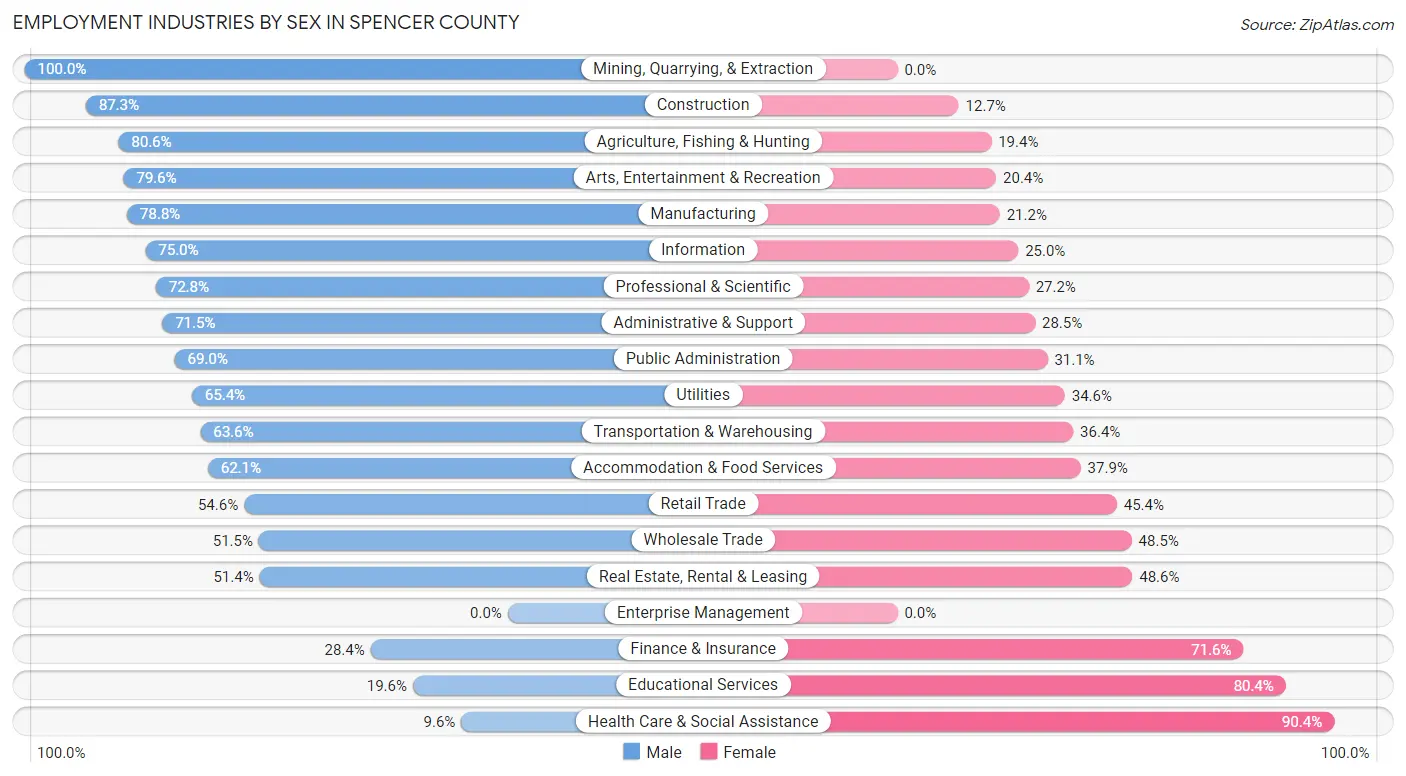
Employment Industries by Sex in Spencer County
The Spencer County industries that see more men than women are Mining, Quarrying, & Extraction (100.0%), Construction (87.3%), and Agriculture, Fishing & Hunting (80.6%), whereas the industries that tend to have a higher number of women are Health Care & Social Assistance (90.4%), Educational Services (80.4%), and Finance & Insurance (71.6%).
| Industry | Male | Female |
| Agriculture, Fishing & Hunting | 83 (80.6%) | 20 (19.4%) |
| Mining, Quarrying, & Extraction | 13 (100.0%) | 0 (0.0%) |
| Construction | 751 (87.3%) | 109 (12.7%) |
| Manufacturing | 1,388 (78.8%) | 373 (21.2%) |
| Wholesale Trade | 34 (51.5%) | 32 (48.5%) |
| Retail Trade | 618 (54.6%) | 514 (45.4%) |
| Transportation & Warehousing | 285 (63.6%) | 163 (36.4%) |
| Utilities | 117 (65.4%) | 62 (34.6%) |
| Information | 60 (75.0%) | 20 (25.0%) |
| Finance & Insurance | 188 (28.4%) | 474 (71.6%) |
| Real Estate, Rental & Leasing | 56 (51.4%) | 53 (48.6%) |
| Professional & Scientific | 311 (72.8%) | 116 (27.2%) |
| Enterprise Management | 0 (0.0%) | 0 (0.0%) |
| Administrative & Support | 241 (71.5%) | 96 (28.5%) |
| Educational Services | 173 (19.6%) | 708 (80.4%) |
| Health Care & Social Assistance | 142 (9.6%) | 1,333 (90.4%) |
| Arts, Entertainment & Recreation | 74 (79.6%) | 19 (20.4%) |
| Accommodation & Food Services | 419 (62.1%) | 256 (37.9%) |
| Public Administration | 171 (69.0%) | 77 (31.0%) |
| Total | 5,280 (53.2%) | 4,637 (46.8%) |
Education in Spencer County
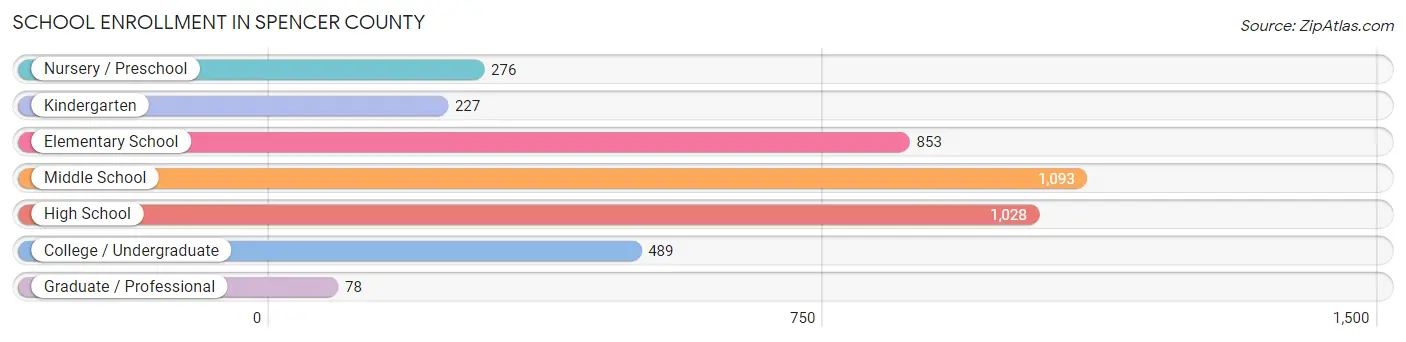
School Enrollment in Spencer County
The most common levels of schooling among the 4,044 students in Spencer County are middle school (1,093 | 27.0%), high school (1,028 | 25.4%), and elementary school (853 | 21.1%).
| School Level | # Students | % Students |
| Nursery / Preschool | 276 | 6.8% |
| Kindergarten | 227 | 5.6% |
| Elementary School | 853 | 21.1% |
| Middle School | 1,093 | 27.0% |
| High School | 1,028 | 25.4% |
| College / Undergraduate | 489 | 12.1% |
| Graduate / Professional | 78 | 1.9% |
| Total | 4,044 | 100.0% |
School Enrollment by Age by Funding Source in Spencer County
Out of a total of 4,044 students who are enrolled in schools in Spencer County, 712 (17.6%) attend a private institution, while the remaining 3,332 (82.4%) are enrolled in public schools. The age group of 25 to 34 year olds has the highest likelihood of being enrolled in private schools, with 147 (72.8% in the age bracket) enrolled. Conversely, the age group of 15 to 17 year olds has the lowest likelihood of being enrolled in a private school, with 715 (94.7% in the age bracket) attending a public institution.
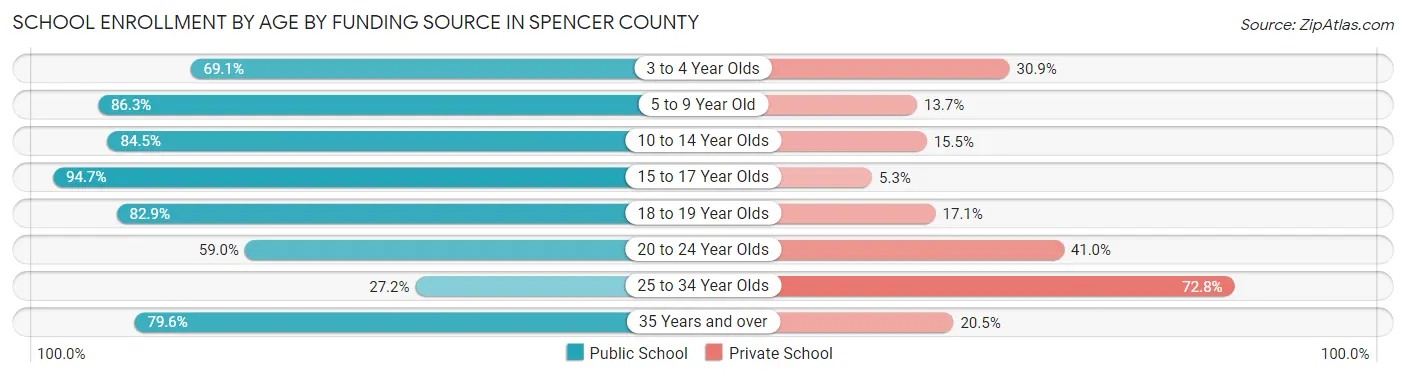
| Age Bracket | Public School | Private School |
| 3 to 4 Year Olds | 76 (69.1%) | 34 (30.9%) |
| 5 to 9 Year Old | 979 (86.3%) | 155 (13.7%) |
| 10 to 14 Year Olds | 1,158 (84.5%) | 212 (15.5%) |
| 15 to 17 Year Olds | 715 (94.7%) | 40 (5.3%) |
| 18 to 19 Year Olds | 208 (82.9%) | 43 (17.1%) |
| 20 to 24 Year Olds | 105 (59.0%) | 73 (41.0%) |
| 25 to 34 Year Olds | 55 (27.2%) | 147 (72.8%) |
| 35 Years and over | 35 (79.5%) | 9 (20.4%) |
| Total | 3,332 (82.4%) | 712 (17.6%) |
Educational Attainment by Field of Study in Spencer County
Business (791 | 25.3%), science & technology (407 | 13.0%), education (351 | 11.2%), arts & humanities (305 | 9.8%), and bio, nature & agricultural (261 | 8.4%) are the most common fields of study among 3,125 individuals in Spencer County who have obtained a bachelor's degree or higher.
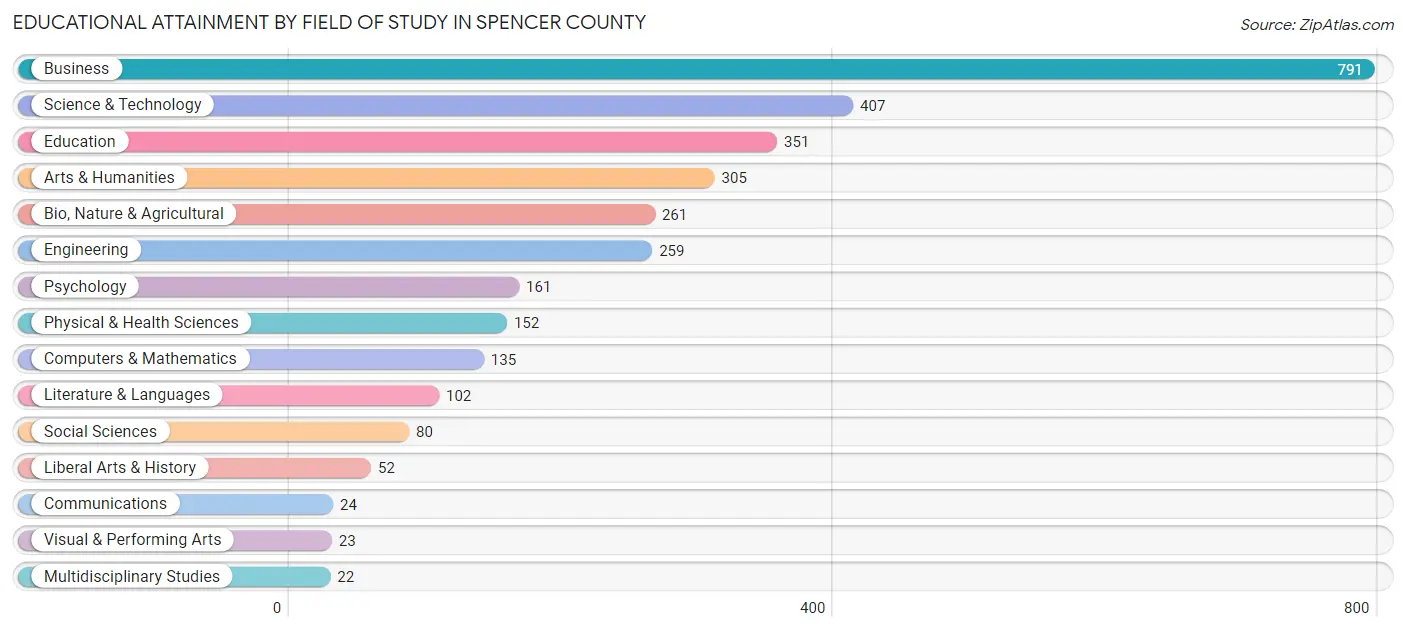
| Field of Study | # Graduates | % Graduates |
| Computers & Mathematics | 135 | 4.3% |
| Bio, Nature & Agricultural | 261 | 8.4% |
| Physical & Health Sciences | 152 | 4.9% |
| Psychology | 161 | 5.1% |
| Social Sciences | 80 | 2.6% |
| Engineering | 259 | 8.3% |
| Multidisciplinary Studies | 22 | 0.7% |
| Science & Technology | 407 | 13.0% |
| Business | 791 | 25.3% |
| Education | 351 | 11.2% |
| Literature & Languages | 102 | 3.3% |
| Liberal Arts & History | 52 | 1.7% |
| Visual & Performing Arts | 23 | 0.7% |
| Communications | 24 | 0.8% |
| Arts & Humanities | 305 | 9.8% |
| Total | 3,125 | 100.0% |
Transportation & Commute in Spencer County
Vehicle Availability by Sex in Spencer County
The most prevalent vehicle ownership categories in Spencer County are males with 2 vehicles (2,105, accounting for 41.8%) and females with 2 vehicles (1,716, making up 46.8%).
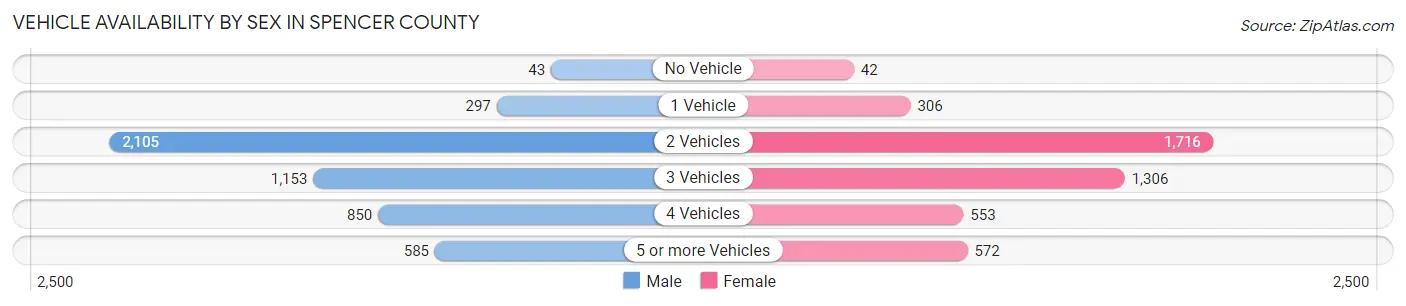
| Vehicles Available | Male | Female |
| No Vehicle | 43 (0.9%) | 42 (0.9%) |
| 1 Vehicle | 297 (5.9%) | 306 (6.8%) |
| 2 Vehicles | 2,105 (41.8%) | 1,716 (38.2%) |
| 3 Vehicles | 1,153 (22.9%) | 1,306 (29.0%) |
| 4 Vehicles | 850 (16.9%) | 553 (12.3%) |
| 5 or more Vehicles | 585 (11.6%) | 572 (12.7%) |
| Total | 5,033 (100.0%) | 4,495 (100.0%) |
Commute Time in Spencer County
The most frequently occuring commute durations in Spencer County are 45 to 59 minutes (1,694 commuters, 19.5%), 30 to 34 minutes (1,577 commuters, 18.2%), and 40 to 44 minutes (1,139 commuters, 13.1%).
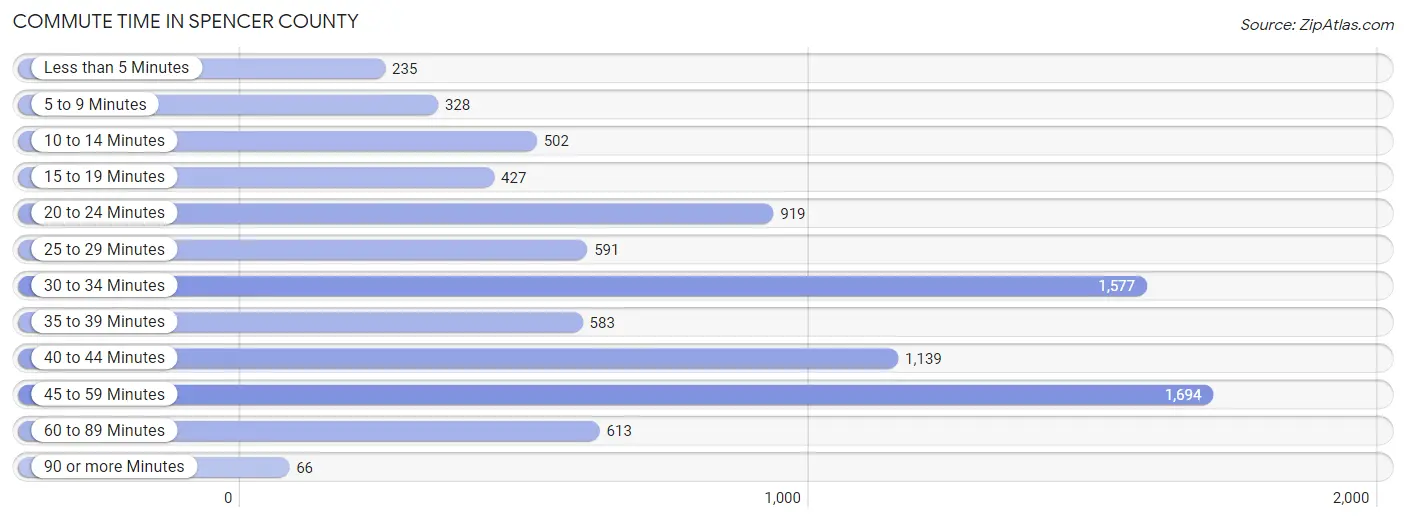
| Commute Time | # Commuters | % Commuters |
| Less than 5 Minutes | 235 | 2.7% |
| 5 to 9 Minutes | 328 | 3.8% |
| 10 to 14 Minutes | 502 | 5.8% |
| 15 to 19 Minutes | 427 | 4.9% |
| 20 to 24 Minutes | 919 | 10.6% |
| 25 to 29 Minutes | 591 | 6.8% |
| 30 to 34 Minutes | 1,577 | 18.2% |
| 35 to 39 Minutes | 583 | 6.7% |
| 40 to 44 Minutes | 1,139 | 13.1% |
| 45 to 59 Minutes | 1,694 | 19.5% |
| 60 to 89 Minutes | 613 | 7.1% |
| 90 or more Minutes | 66 | 0.8% |
Commute Time by Sex in Spencer County
The most common commute times in Spencer County are 30 to 34 minutes (862 commuters, 18.4%) for males and 45 to 59 minutes (898 commuters, 22.5%) for females.
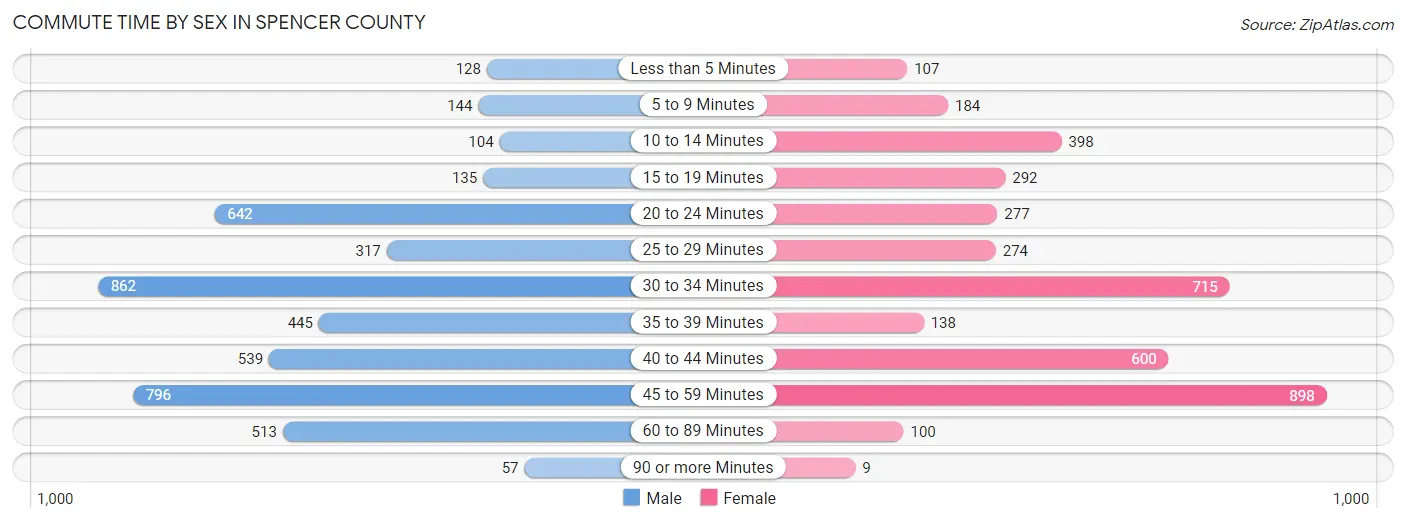
| Commute Time | Male | Female |
| Less than 5 Minutes | 128 (2.7%) | 107 (2.7%) |
| 5 to 9 Minutes | 144 (3.1%) | 184 (4.6%) |
| 10 to 14 Minutes | 104 (2.2%) | 398 (10.0%) |
| 15 to 19 Minutes | 135 (2.9%) | 292 (7.3%) |
| 20 to 24 Minutes | 642 (13.7%) | 277 (6.9%) |
| 25 to 29 Minutes | 317 (6.8%) | 274 (6.9%) |
| 30 to 34 Minutes | 862 (18.4%) | 715 (17.9%) |
| 35 to 39 Minutes | 445 (9.5%) | 138 (3.5%) |
| 40 to 44 Minutes | 539 (11.5%) | 600 (15.0%) |
| 45 to 59 Minutes | 796 (17.0%) | 898 (22.5%) |
| 60 to 89 Minutes | 513 (11.0%) | 100 (2.5%) |
| 90 or more Minutes | 57 (1.2%) | 9 (0.2%) |
Time of Departure to Work by Sex in Spencer County
The most frequent times of departure to work in Spencer County are 6:00 AM to 6:29 AM (693, 14.8%) for males and 7:00 AM to 7:29 AM (616, 15.4%) for females.
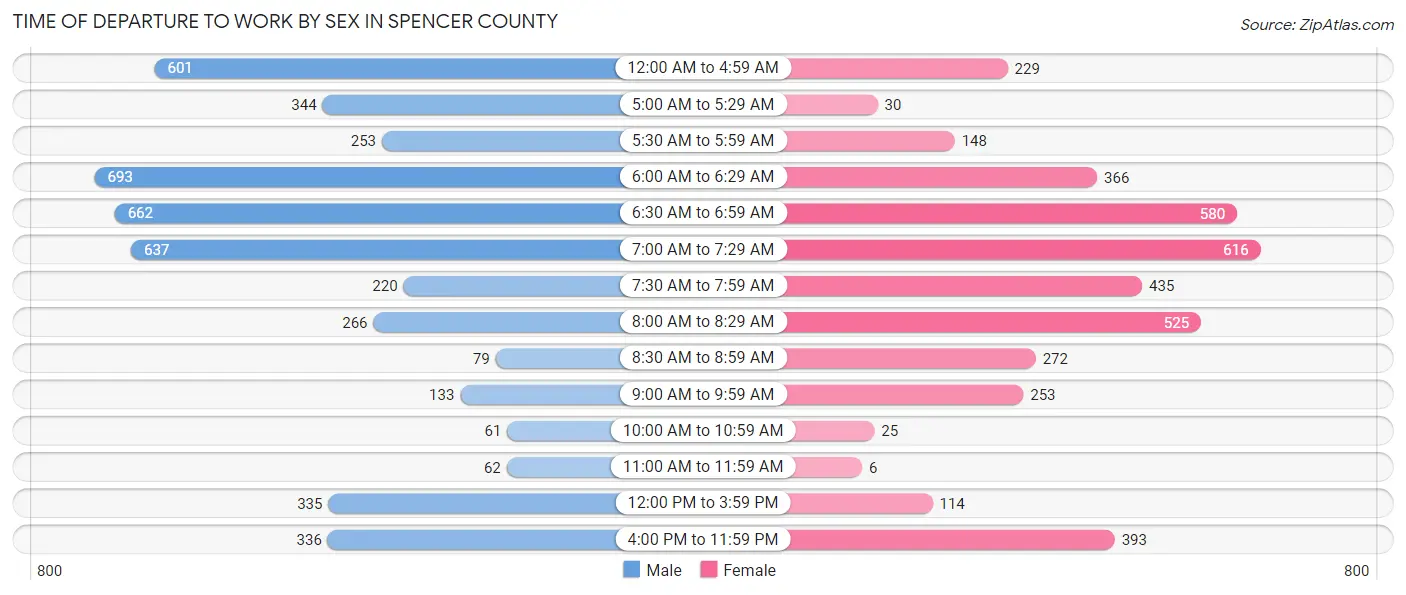
| Time of Departure | Male | Female |
| 12:00 AM to 4:59 AM | 601 (12.8%) | 229 (5.7%) |
| 5:00 AM to 5:29 AM | 344 (7.3%) | 30 (0.7%) |
| 5:30 AM to 5:59 AM | 253 (5.4%) | 148 (3.7%) |
| 6:00 AM to 6:29 AM | 693 (14.8%) | 366 (9.2%) |
| 6:30 AM to 6:59 AM | 662 (14.1%) | 580 (14.5%) |
| 7:00 AM to 7:29 AM | 637 (13.6%) | 616 (15.4%) |
| 7:30 AM to 7:59 AM | 220 (4.7%) | 435 (10.9%) |
| 8:00 AM to 8:29 AM | 266 (5.7%) | 525 (13.2%) |
| 8:30 AM to 8:59 AM | 79 (1.7%) | 272 (6.8%) |
| 9:00 AM to 9:59 AM | 133 (2.8%) | 253 (6.3%) |
| 10:00 AM to 10:59 AM | 61 (1.3%) | 25 (0.6%) |
| 11:00 AM to 11:59 AM | 62 (1.3%) | 6 (0.2%) |
| 12:00 PM to 3:59 PM | 335 (7.2%) | 114 (2.9%) |
| 4:00 PM to 11:59 PM | 336 (7.2%) | 393 (9.8%) |
| Total | 4,682 (100.0%) | 3,992 (100.0%) |
Housing Occupancy in Spencer County
Occupancy by Ownership in Spencer County
Of the total 6,916 dwellings in Spencer County, owner-occupied units account for 5,961 (86.2%), while renter-occupied units make up 955 (13.8%).
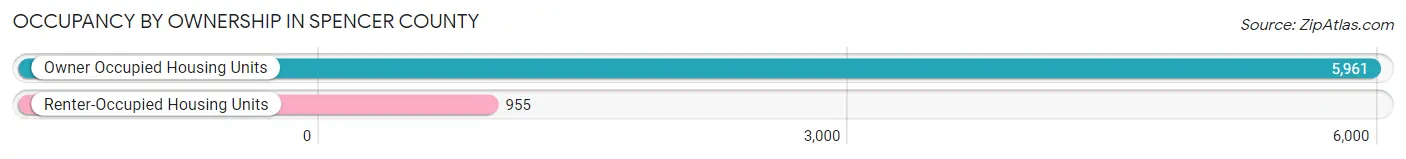
| Occupancy | # Housing Units | % Housing Units |
| Owner Occupied Housing Units | 5,961 | 86.2% |
| Renter-Occupied Housing Units | 955 | 13.8% |
| Total Occupied Housing Units | 6,916 | 100.0% |
Occupancy by Household Size in Spencer County
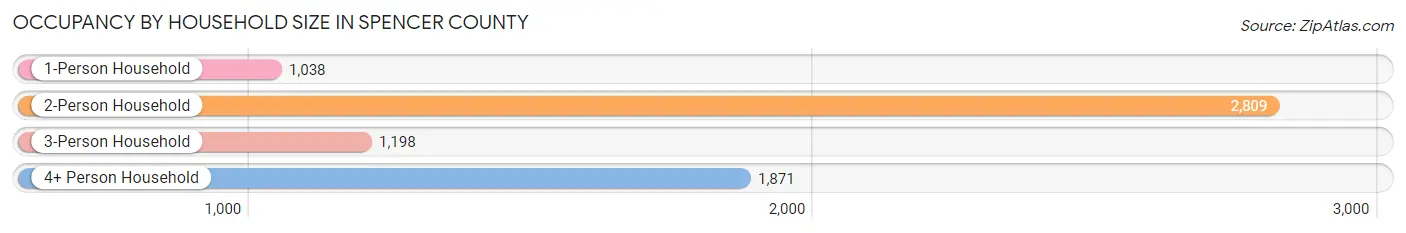
| Household Size | # Housing Units | % Housing Units |
| 1-Person Household | 1,038 | 15.0% |
| 2-Person Household | 2,809 | 40.6% |
| 3-Person Household | 1,198 | 17.3% |
| 4+ Person Household | 1,871 | 27.1% |
| Total Housing Units | 6,916 | 100.0% |
Occupancy by Ownership by Household Size in Spencer County
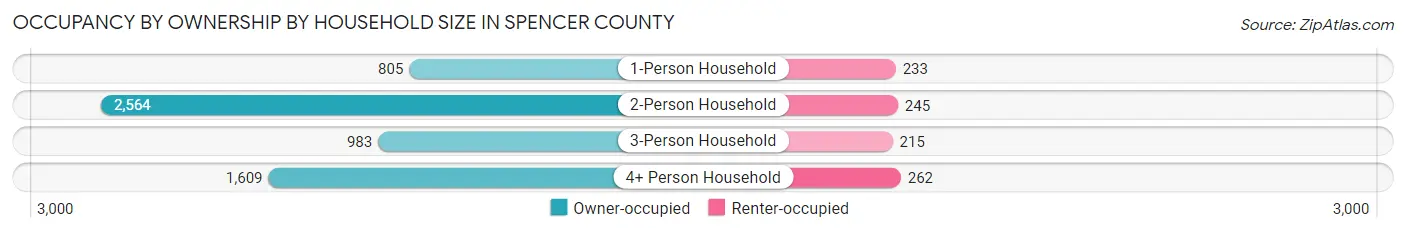
| Household Size | Owner-occupied | Renter-occupied |
| 1-Person Household | 805 (77.5%) | 233 (22.5%) |
| 2-Person Household | 2,564 (91.3%) | 245 (8.7%) |
| 3-Person Household | 983 (82.1%) | 215 (17.9%) |
| 4+ Person Household | 1,609 (86.0%) | 262 (14.0%) |
| Total Housing Units | 5,961 (86.2%) | 955 (13.8%) |
Occupancy by Educational Attainment in Spencer County
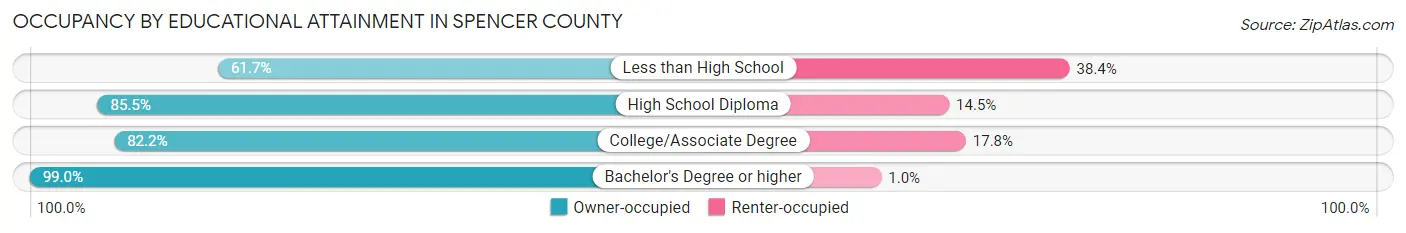
| Household Size | Owner-occupied | Renter-occupied |
| Less than High School | 217 (61.7%) | 135 (38.4%) |
| High School Diploma | 2,216 (85.5%) | 375 (14.5%) |
| College/Associate Degree | 1,984 (82.2%) | 429 (17.8%) |
| Bachelor's Degree or higher | 1,544 (99.0%) | 16 (1.0%) |
Occupancy by Age of Householder in Spencer County
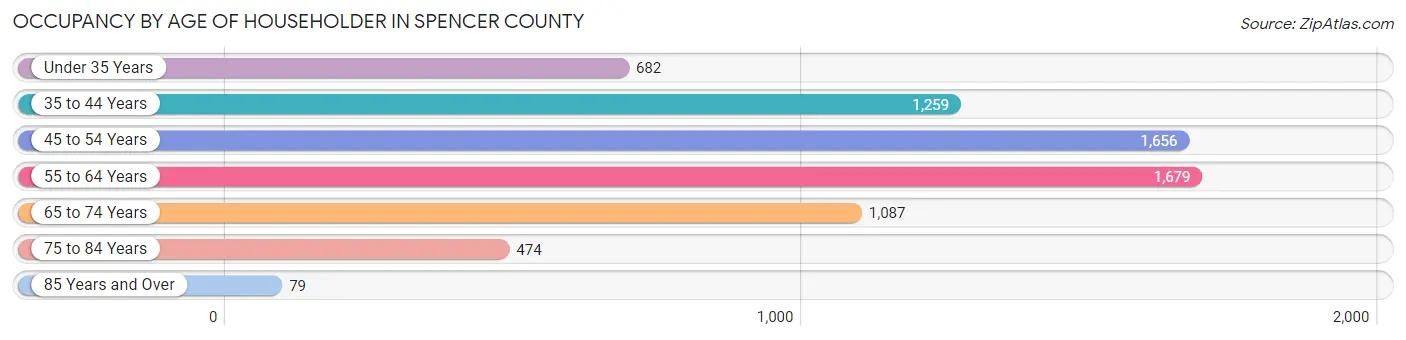
| Age Bracket | # Households | % Households |
| Under 35 Years | 682 | 9.9% |
| 35 to 44 Years | 1,259 | 18.2% |
| 45 to 54 Years | 1,656 | 23.9% |
| 55 to 64 Years | 1,679 | 24.3% |
| 65 to 74 Years | 1,087 | 15.7% |
| 75 to 84 Years | 474 | 6.9% |
| 85 Years and Over | 79 | 1.1% |
| Total | 6,916 | 100.0% |
Housing Finances in Spencer County
Median Income by Occupancy in Spencer County
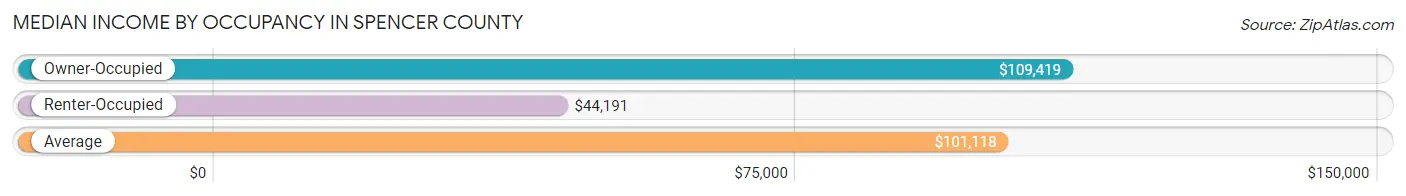
| Occupancy Type | # Households | Median Income |
| Owner-Occupied | 5,961 (86.2%) | $109,419 |
| Renter-Occupied | 955 (13.8%) | $44,191 |
| Average | 6,916 (100.0%) | $101,118 |
Occupancy by Householder Income Bracket in Spencer County
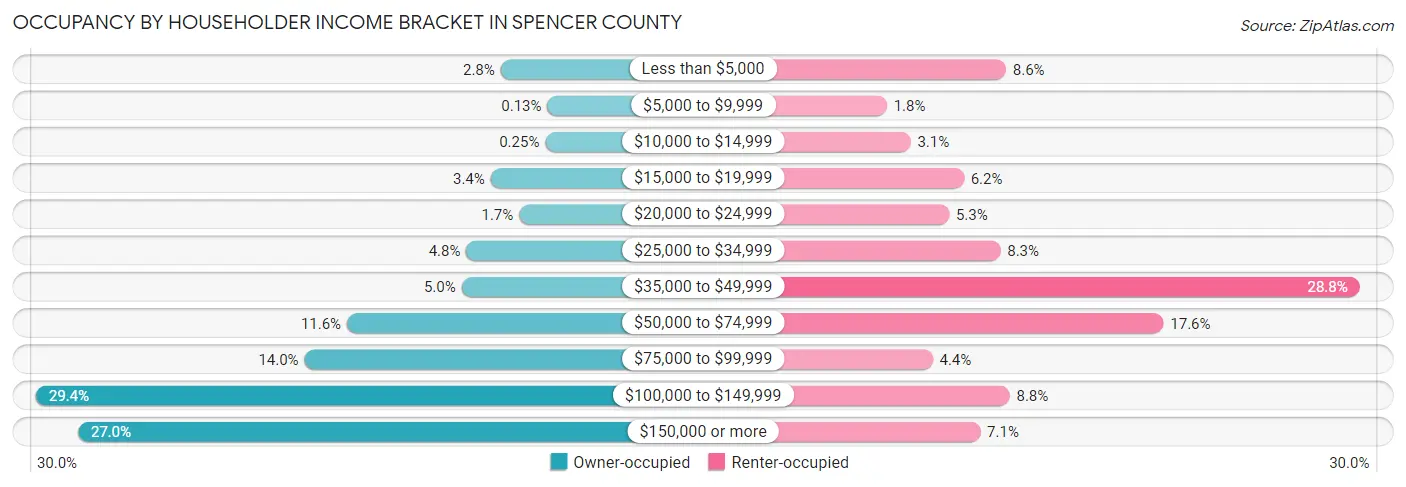
| Income Bracket | Owner-occupied | Renter-occupied |
| Less than $5,000 | 167 (2.8%) | 82 (8.6%) |
| $5,000 to $9,999 | 8 (0.1%) | 17 (1.8%) |
| $10,000 to $14,999 | 15 (0.3%) | 30 (3.1%) |
| $15,000 to $19,999 | 201 (3.4%) | 59 (6.2%) |
| $20,000 to $24,999 | 104 (1.7%) | 51 (5.3%) |
| $25,000 to $34,999 | 284 (4.8%) | 79 (8.3%) |
| $35,000 to $49,999 | 300 (5.0%) | 275 (28.8%) |
| $50,000 to $74,999 | 690 (11.6%) | 168 (17.6%) |
| $75,000 to $99,999 | 835 (14.0%) | 42 (4.4%) |
| $100,000 to $149,999 | 1,750 (29.4%) | 84 (8.8%) |
| $150,000 or more | 1,607 (27.0%) | 68 (7.1%) |
| Total | 5,961 (100.0%) | 955 (100.0%) |
Monthly Housing Cost Tiers in Spencer County
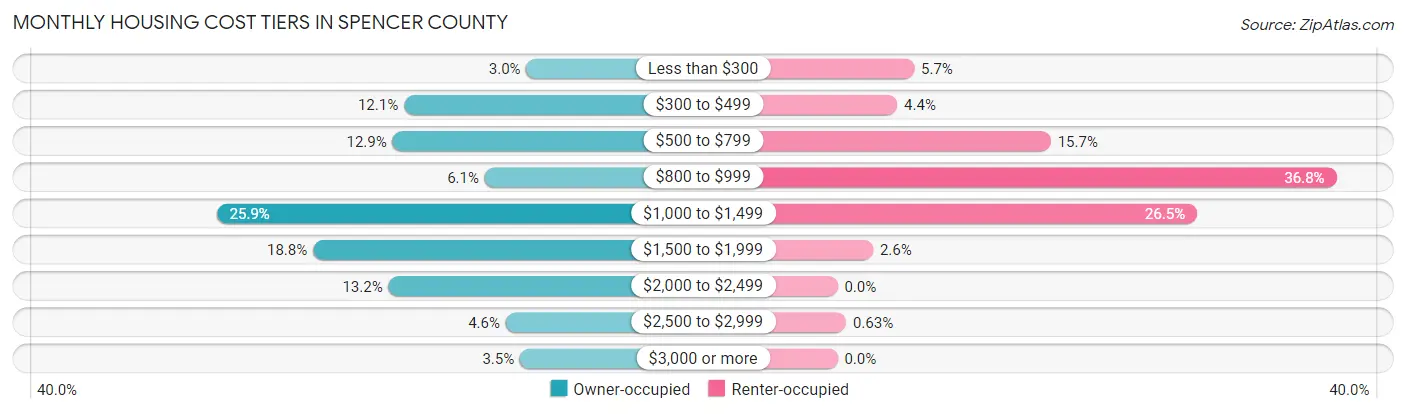
| Monthly Cost | Owner-occupied | Renter-occupied |
| Less than $300 | 181 (3.0%) | 54 (5.7%) |
| $300 to $499 | 719 (12.1%) | 42 (4.4%) |
| $500 to $799 | 769 (12.9%) | 150 (15.7%) |
| $800 to $999 | 364 (6.1%) | 351 (36.7%) |
| $1,000 to $1,499 | 1,542 (25.9%) | 253 (26.5%) |
| $1,500 to $1,999 | 1,118 (18.8%) | 25 (2.6%) |
| $2,000 to $2,499 | 787 (13.2%) | 0 (0.0%) |
| $2,500 to $2,999 | 272 (4.6%) | 6 (0.6%) |
| $3,000 or more | 209 (3.5%) | 0 (0.0%) |
| Total | 5,961 (100.0%) | 955 (100.0%) |
Physical Housing Characteristics in Spencer County
Housing Structures in Spencer County
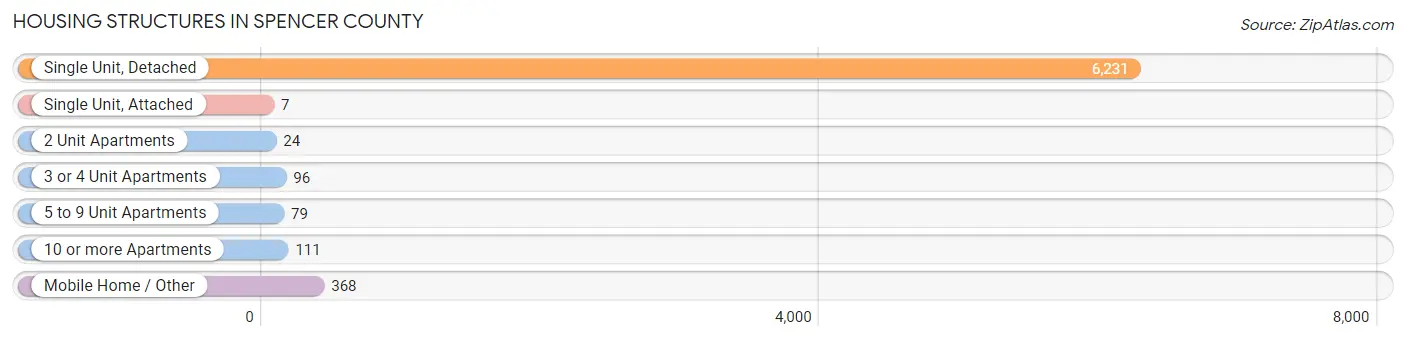
| Structure Type | # Housing Units | % Housing Units |
| Single Unit, Detached | 6,231 | 90.1% |
| Single Unit, Attached | 7 | 0.1% |
| 2 Unit Apartments | 24 | 0.4% |
| 3 or 4 Unit Apartments | 96 | 1.4% |
| 5 to 9 Unit Apartments | 79 | 1.1% |
| 10 or more Apartments | 111 | 1.6% |
| Mobile Home / Other | 368 | 5.3% |
| Total | 6,916 | 100.0% |
Housing Structures by Occupancy in Spencer County
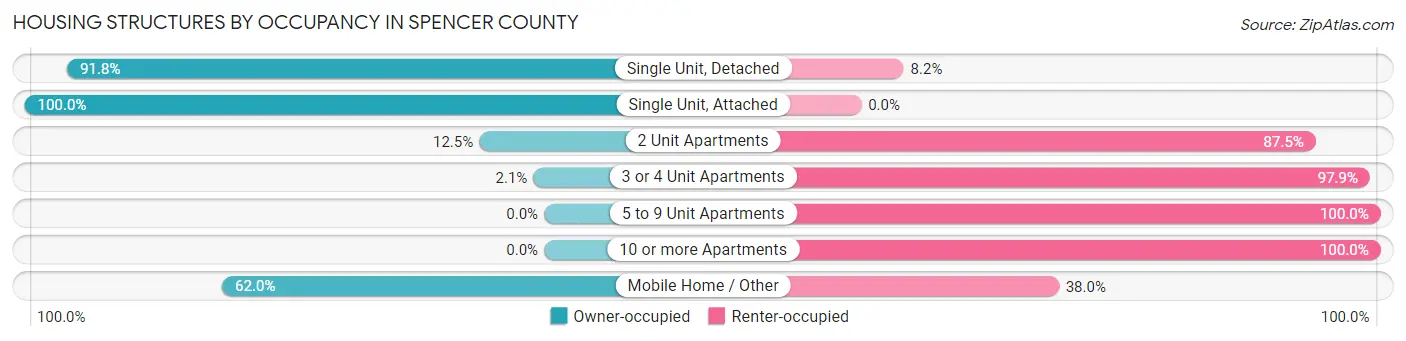
| Structure Type | Owner-occupied | Renter-occupied |
| Single Unit, Detached | 5,721 (91.8%) | 510 (8.2%) |
| Single Unit, Attached | 7 (100.0%) | 0 (0.0%) |
| 2 Unit Apartments | 3 (12.5%) | 21 (87.5%) |
| 3 or 4 Unit Apartments | 2 (2.1%) | 94 (97.9%) |
| 5 to 9 Unit Apartments | 0 (0.0%) | 79 (100.0%) |
| 10 or more Apartments | 0 (0.0%) | 111 (100.0%) |
| Mobile Home / Other | 228 (62.0%) | 140 (38.0%) |
| Total | 5,961 (86.2%) | 955 (13.8%) |
Housing Structures by Number of Rooms in Spencer County
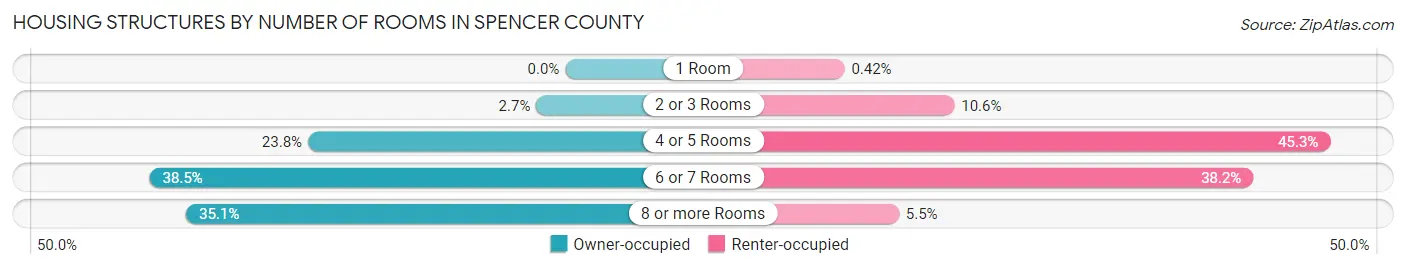
| Number of Rooms | Owner-occupied | Renter-occupied |
| 1 Room | 0 (0.0%) | 4 (0.4%) |
| 2 or 3 Rooms | 160 (2.7%) | 101 (10.6%) |
| 4 or 5 Rooms | 1,419 (23.8%) | 433 (45.3%) |
| 6 or 7 Rooms | 2,292 (38.5%) | 365 (38.2%) |
| 8 or more Rooms | 2,090 (35.1%) | 52 (5.4%) |
| Total | 5,961 (100.0%) | 955 (100.0%) |
Housing Structure by Heating Type in Spencer County
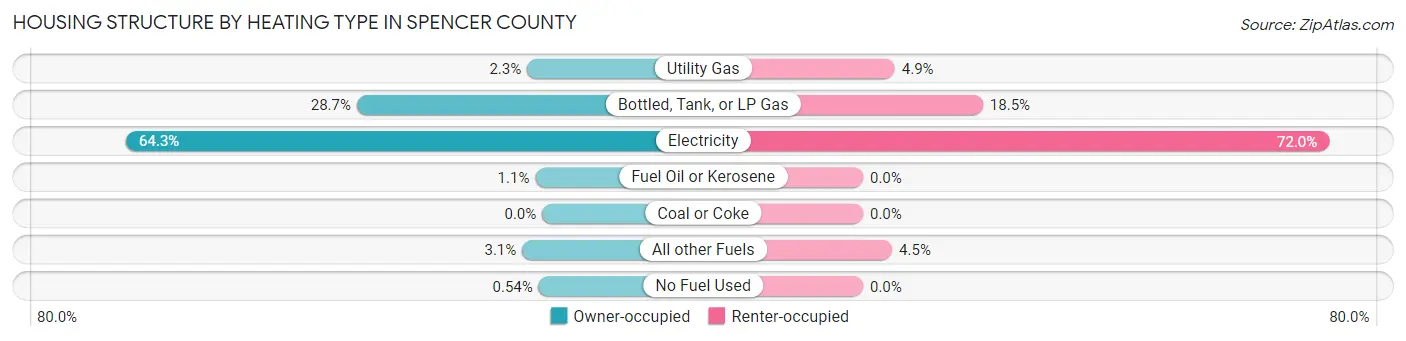
| Heating Type | Owner-occupied | Renter-occupied |
| Utility Gas | 139 (2.3%) | 47 (4.9%) |
| Bottled, Tank, or LP Gas | 1,708 (28.6%) | 177 (18.5%) |
| Electricity | 3,835 (64.3%) | 688 (72.0%) |
| Fuel Oil or Kerosene | 63 (1.1%) | 0 (0.0%) |
| Coal or Coke | 0 (0.0%) | 0 (0.0%) |
| All other Fuels | 184 (3.1%) | 43 (4.5%) |
| No Fuel Used | 32 (0.5%) | 0 (0.0%) |
| Total | 5,961 (100.0%) | 955 (100.0%) |
Household Vehicle Usage in Spencer County
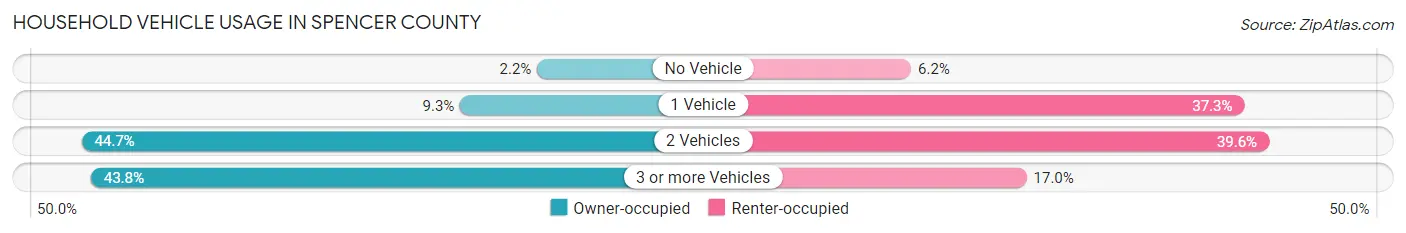
| Vehicles per Household | Owner-occupied | Renter-occupied |
| No Vehicle | 128 (2.1%) | 59 (6.2%) |
| 1 Vehicle | 557 (9.3%) | 356 (37.3%) |
| 2 Vehicles | 2,664 (44.7%) | 378 (39.6%) |
| 3 or more Vehicles | 2,612 (43.8%) | 162 (17.0%) |
| Total | 5,961 (100.0%) | 955 (100.0%) |
Real Estate & Mortgages in Spencer County
Real Estate and Mortgage Overview in Spencer County
| Characteristic | Without Mortgage | With Mortgage |
| Housing Units | 1,633 | 4,328 |
| Median Property Value | $259,100 | $297,800 |
| Median Household Income | $76,076 | $1,295 |
| Monthly Housing Costs | $479 | $209 |
| Real Estate Taxes | $1,856 | $59 |
Property Value by Mortgage Status in Spencer County
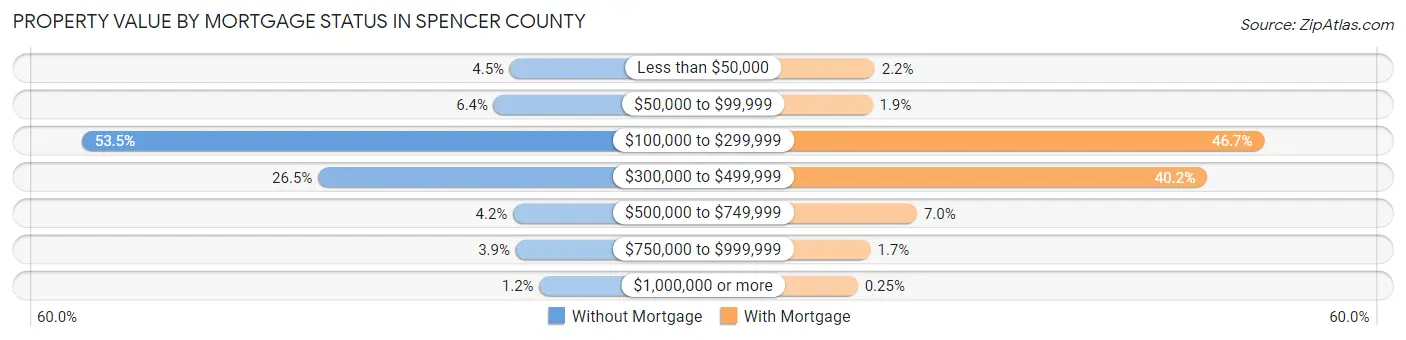
| Property Value | Without Mortgage | With Mortgage |
| Less than $50,000 | 74 (4.5%) | 95 (2.2%) |
| $50,000 to $99,999 | 104 (6.4%) | 84 (1.9%) |
| $100,000 to $299,999 | 873 (53.5%) | 2,022 (46.7%) |
| $300,000 to $499,999 | 432 (26.5%) | 1,738 (40.2%) |
| $500,000 to $749,999 | 68 (4.2%) | 304 (7.0%) |
| $750,000 to $999,999 | 63 (3.9%) | 74 (1.7%) |
| $1,000,000 or more | 19 (1.2%) | 11 (0.3%) |
| Total | 1,633 (100.0%) | 4,328 (100.0%) |
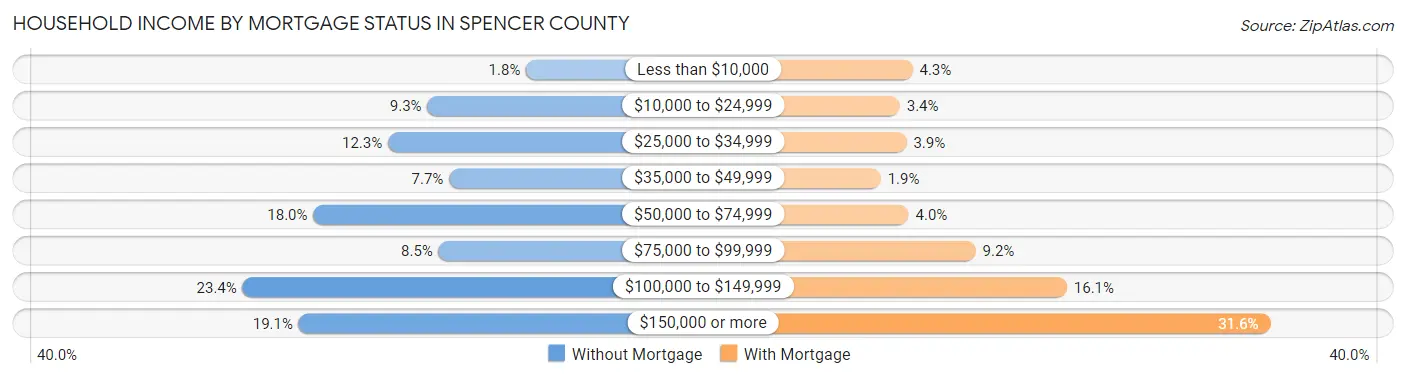
Household Income by Mortgage Status in Spencer County
| Household Income | Without Mortgage | With Mortgage |
| Less than $10,000 | 29 (1.8%) | 188 (4.3%) |
| $10,000 to $24,999 | 152 (9.3%) | 146 (3.4%) |
| $25,000 to $34,999 | 201 (12.3%) | 168 (3.9%) |
| $35,000 to $49,999 | 125 (7.6%) | 83 (1.9%) |
| $50,000 to $74,999 | 294 (18.0%) | 175 (4.0%) |
| $75,000 to $99,999 | 138 (8.5%) | 396 (9.1%) |
| $100,000 to $149,999 | 382 (23.4%) | 697 (16.1%) |
| $150,000 or more | 312 (19.1%) | 1,368 (31.6%) |
| Total | 1,633 (100.0%) | 4,328 (100.0%) |
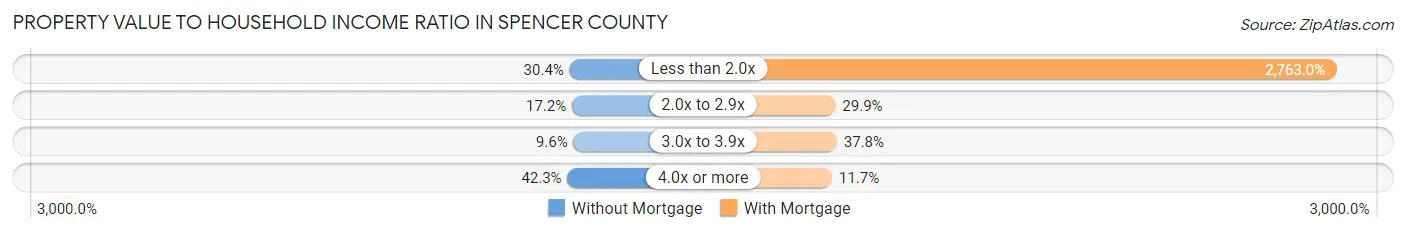
Property Value to Household Income Ratio in Spencer County
| Value-to-Income Ratio | Without Mortgage | With Mortgage |
| Less than 2.0x | 497 (30.4%) | 119,583 (2,763.0%) |
| 2.0x to 2.9x | 280 (17.2%) | 1,292 (29.8%) |
| 3.0x to 3.9x | 156 (9.6%) | 1,636 (37.8%) |
| 4.0x or more | 690 (42.2%) | 504 (11.7%) |
| Total | 1,633 (100.0%) | 4,328 (100.0%) |
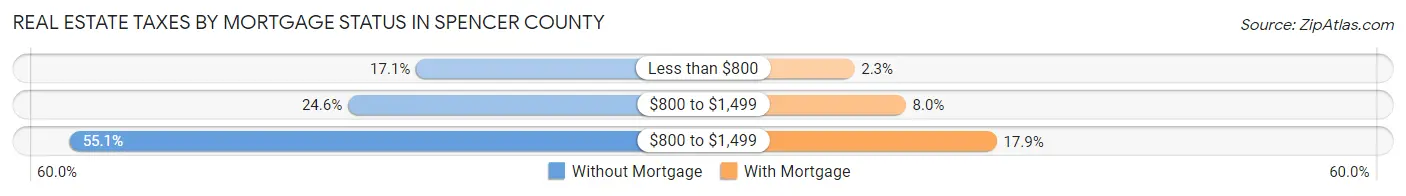
Real Estate Taxes by Mortgage Status in Spencer County
| Property Taxes | Without Mortgage | With Mortgage |
| Less than $800 | 279 (17.1%) | 101 (2.3%) |
| $800 to $1,499 | 401 (24.6%) | 344 (8.0%) |
| $800 to $1,499 | 899 (55.0%) | 775 (17.9%) |
| Total | 1,633 (100.0%) | 4,328 (100.0%) |
Health & Disability in Spencer County
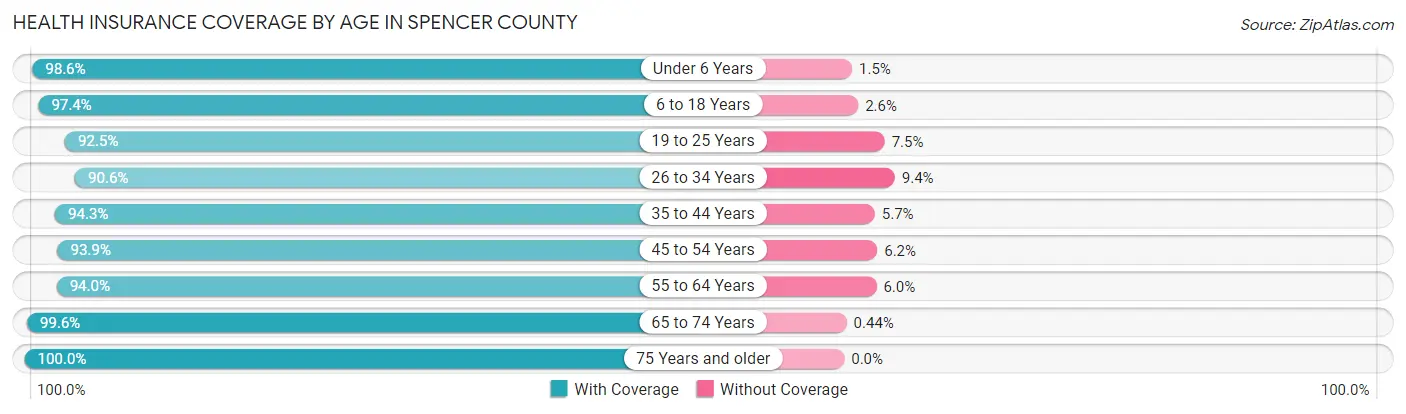
Health Insurance Coverage by Age in Spencer County
| Age Bracket | With Coverage | Without Coverage |
| Under 6 Years | 1,361 (98.6%) | 20 (1.5%) |
| 6 to 18 Years | 3,384 (97.4%) | 90 (2.6%) |
| 19 to 25 Years | 1,202 (92.5%) | 98 (7.5%) |
| 26 to 34 Years | 1,651 (90.6%) | 172 (9.4%) |
| 35 to 44 Years | 2,480 (94.3%) | 150 (5.7%) |
| 45 to 54 Years | 2,792 (93.9%) | 183 (6.1%) |
| 55 to 64 Years | 2,945 (94.0%) | 188 (6.0%) |
| 65 to 74 Years | 1,811 (99.6%) | 8 (0.4%) |
| 75 Years and older | 904 (100.0%) | 0 (0.0%) |
| Total | 18,530 (95.3%) | 909 (4.7%) |
Health Insurance Coverage by Citizenship Status in Spencer County
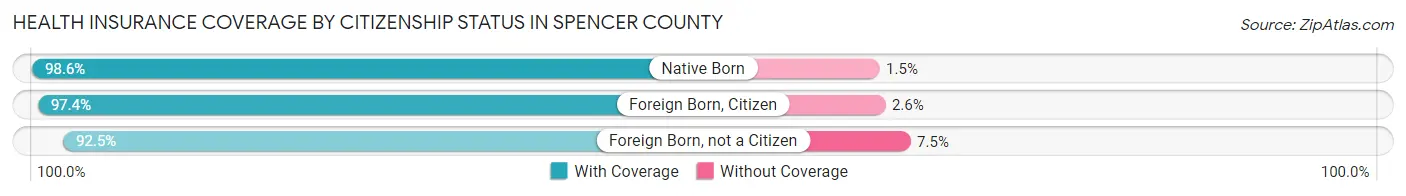
| Citizenship Status | With Coverage | Without Coverage |
| Native Born | 1,361 (98.6%) | 20 (1.5%) |
| Foreign Born, Citizen | 3,384 (97.4%) | 90 (2.6%) |
| Foreign Born, not a Citizen | 1,202 (92.5%) | 98 (7.5%) |
Health Insurance Coverage by Household Income in Spencer County
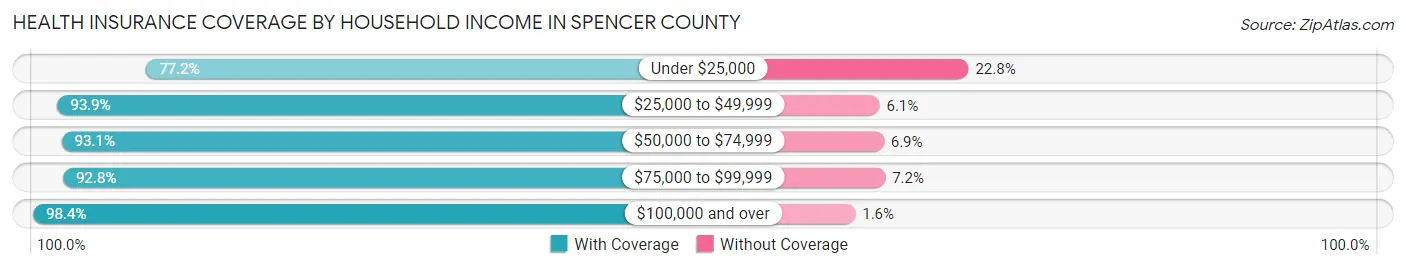
| Household Income | With Coverage | Without Coverage |
| Under $25,000 | 755 (77.2%) | 223 (22.8%) |
| $25,000 to $49,999 | 2,309 (93.9%) | 151 (6.1%) |
| $50,000 to $74,999 | 2,499 (93.1%) | 186 (6.9%) |
| $75,000 to $99,999 | 2,269 (92.8%) | 176 (7.2%) |
| $100,000 and over | 10,698 (98.4%) | 173 (1.6%) |
Public vs Private Health Insurance Coverage by Age in Spencer County
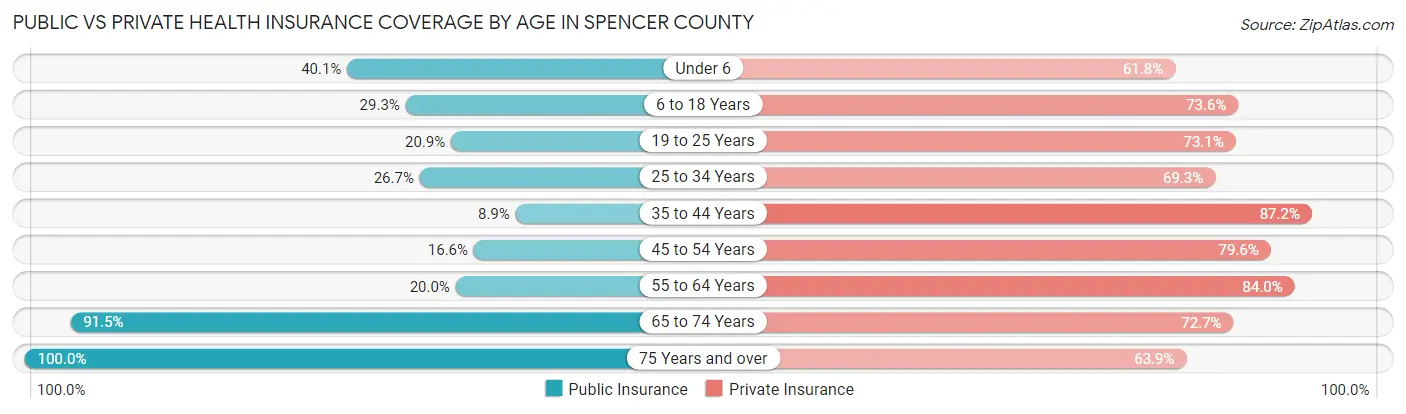
| Age Bracket | Public Insurance | Private Insurance |
| Under 6 | 554 (40.1%) | 854 (61.8%) |
| 6 to 18 Years | 1,017 (29.3%) | 2,556 (73.6%) |
| 19 to 25 Years | 271 (20.8%) | 950 (73.1%) |
| 25 to 34 Years | 486 (26.7%) | 1,263 (69.3%) |
| 35 to 44 Years | 233 (8.9%) | 2,294 (87.2%) |
| 45 to 54 Years | 494 (16.6%) | 2,368 (79.6%) |
| 55 to 64 Years | 626 (20.0%) | 2,633 (84.0%) |
| 65 to 74 Years | 1,665 (91.5%) | 1,322 (72.7%) |
| 75 Years and over | 904 (100.0%) | 578 (63.9%) |
| Total | 6,250 (32.2%) | 14,818 (76.2%) |
Disability Status by Sex by Age in Spencer County
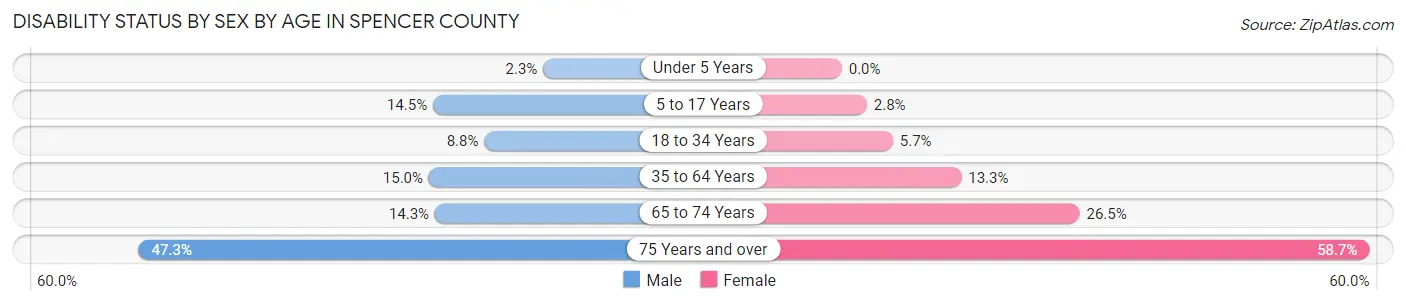
| Age Bracket | Male | Female |
| Under 5 Years | 12 (2.2%) | 0 (0.0%) |
| 5 to 17 Years | 257 (14.5%) | 48 (2.8%) |
| 18 to 34 Years | 149 (8.8%) | 100 (5.7%) |
| 35 to 64 Years | 673 (15.0%) | 565 (13.3%) |
| 65 to 74 Years | 130 (14.3%) | 241 (26.5%) |
| 75 Years and over | 211 (47.3%) | 269 (58.7%) |
Disability Class by Sex by Age in Spencer County
Disability Class: Hearing Difficulty
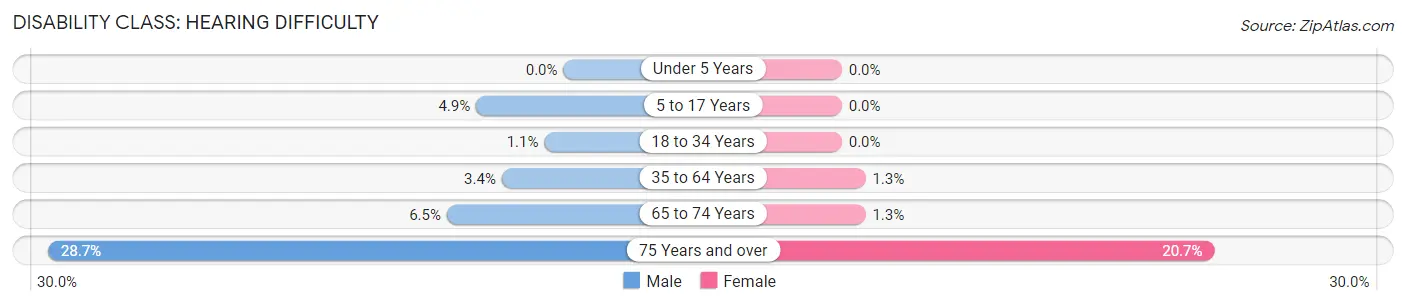
| Age Bracket | Male | Female |
| Under 5 Years | 0 (0.0%) | 0 (0.0%) |
| 5 to 17 Years | 86 (4.9%) | 0 (0.0%) |
| 18 to 34 Years | 18 (1.1%) | 0 (0.0%) |
| 35 to 64 Years | 154 (3.4%) | 56 (1.3%) |
| 65 to 74 Years | 59 (6.5%) | 12 (1.3%) |
| 75 Years and over | 128 (28.7%) | 95 (20.7%) |
Disability Class: Vision Difficulty
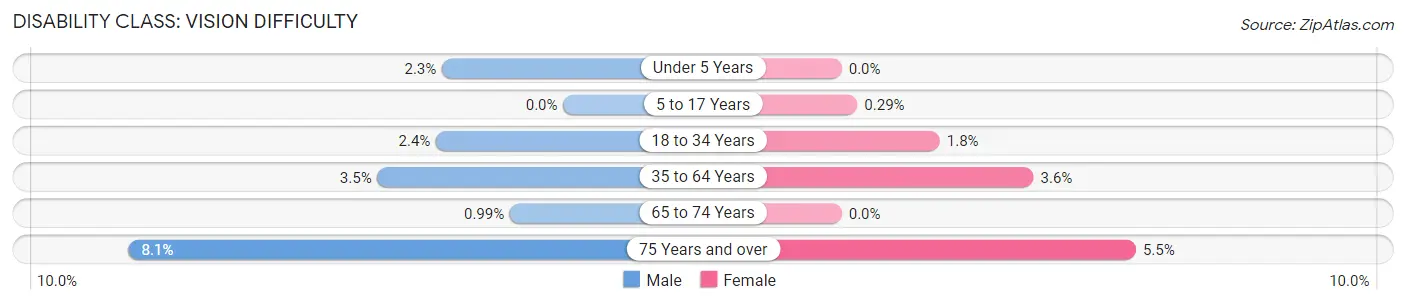
| Age Bracket | Male | Female |
| Under 5 Years | 12 (2.2%) | 0 (0.0%) |
| 5 to 17 Years | 0 (0.0%) | 5 (0.3%) |
| 18 to 34 Years | 40 (2.4%) | 32 (1.8%) |
| 35 to 64 Years | 155 (3.5%) | 151 (3.6%) |
| 65 to 74 Years | 9 (1.0%) | 0 (0.0%) |
| 75 Years and over | 36 (8.1%) | 25 (5.5%) |
Disability Class: Cognitive Difficulty
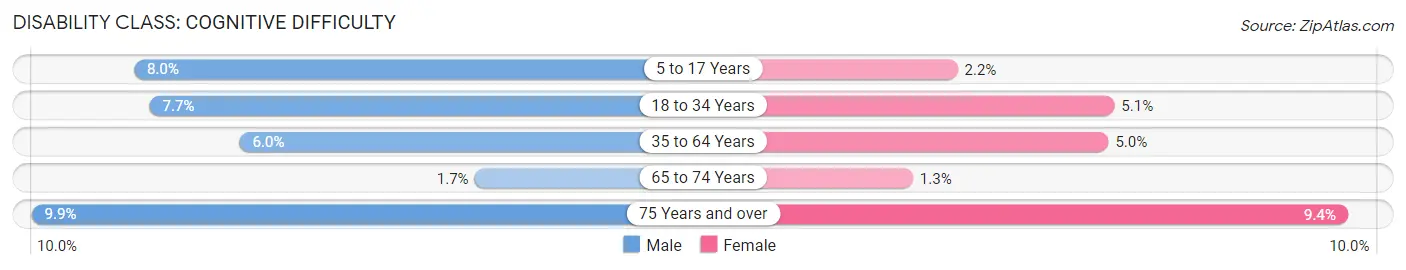
| Age Bracket | Male | Female |
| 5 to 17 Years | 141 (8.0%) | 37 (2.1%) |
| 18 to 34 Years | 130 (7.7%) | 89 (5.1%) |
| 35 to 64 Years | 270 (6.0%) | 210 (5.0%) |
| 65 to 74 Years | 15 (1.7%) | 12 (1.3%) |
| 75 Years and over | 44 (9.9%) | 43 (9.4%) |
Disability Class: Ambulatory Difficulty
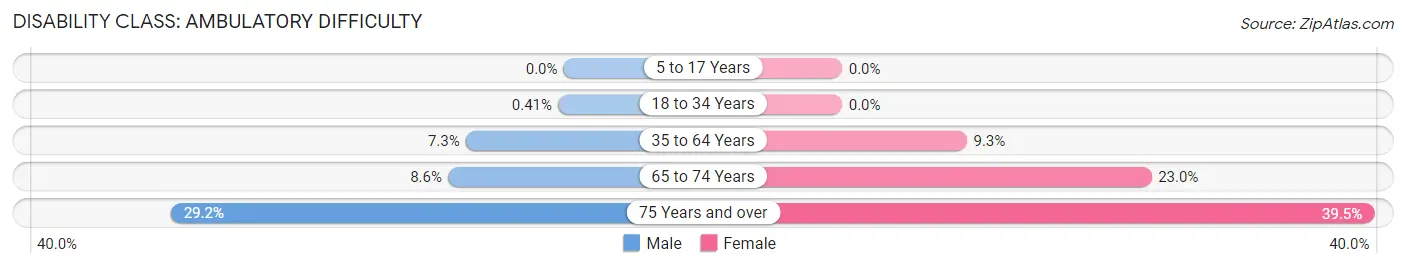
| Age Bracket | Male | Female |
| 5 to 17 Years | 0 (0.0%) | 0 (0.0%) |
| 18 to 34 Years | 7 (0.4%) | 0 (0.0%) |
| 35 to 64 Years | 326 (7.3%) | 393 (9.3%) |
| 65 to 74 Years | 78 (8.6%) | 209 (23.0%) |
| 75 Years and over | 130 (29.1%) | 181 (39.5%) |
Disability Class: Self-Care Difficulty
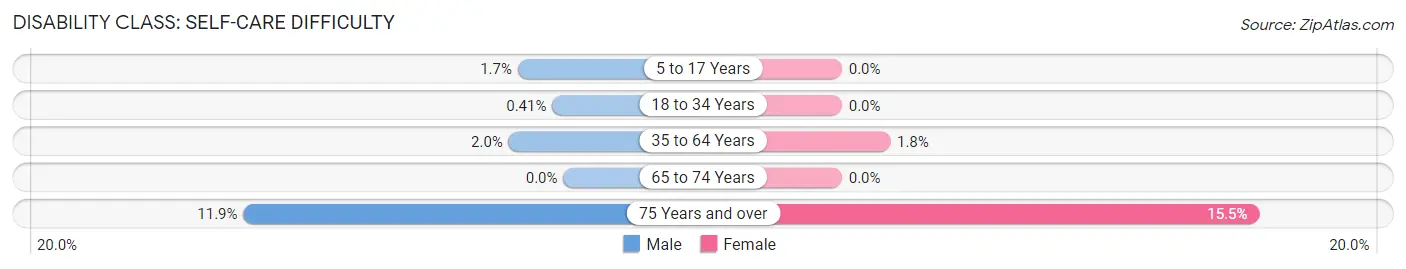
| Age Bracket | Male | Female |
| 5 to 17 Years | 30 (1.7%) | 0 (0.0%) |
| 18 to 34 Years | 7 (0.4%) | 0 (0.0%) |
| 35 to 64 Years | 91 (2.0%) | 76 (1.8%) |
| 65 to 74 Years | 0 (0.0%) | 0 (0.0%) |
| 75 Years and over | 53 (11.9%) | 71 (15.5%) |
Technology Access in Spencer County
Computing Device Access in Spencer County
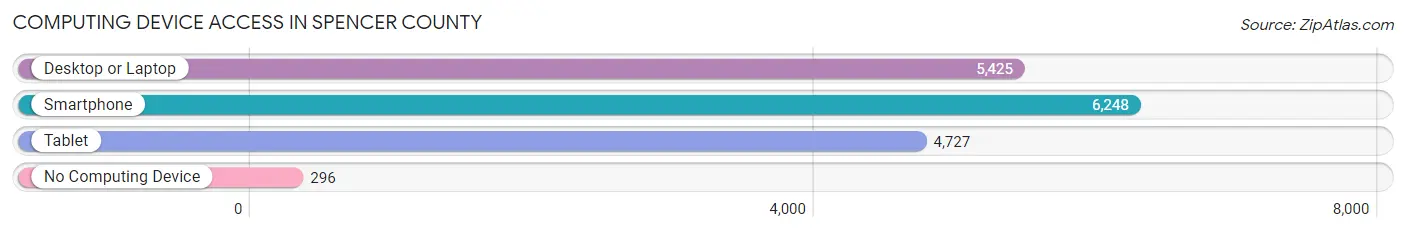
| Device Type | # Households | % Households |
| Desktop or Laptop | 5,425 | 78.4% |
| Smartphone | 6,248 | 90.3% |
| Tablet | 4,727 | 68.3% |
| No Computing Device | 296 | 4.3% |
| Total | 6,916 | 100.0% |
Internet Access in Spencer County
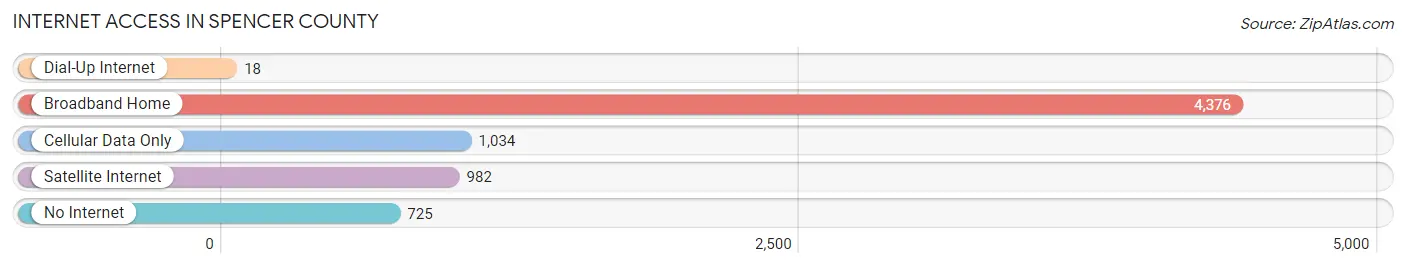
| Internet Type | # Households | % Households |
| Dial-Up Internet | 18 | 0.3% |
| Broadband Home | 4,376 | 63.3% |
| Cellular Data Only | 1,034 | 14.9% |
| Satellite Internet | 982 | 14.2% |
| No Internet | 725 | 10.5% |
| Total | 6,916 | 100.0% |
Spencer County Summary
Spencer County, Kentucky is located in the central part of the state, just south of Louisville. It is bordered by Bullitt County to the north, Nelson County to the east, Anderson County to the south, and Shelby County to the west. The county seat is Taylorsville, and the county was formed in 1824 from parts of Bullitt and Nelson counties.
Geography
Spencer County is located in the Inner Bluegrass region of Kentucky, and is characterized by rolling hills and fertile soil. The county is drained by the Salt River, which flows through the county from north to south. The county is also home to several small lakes, including Taylorsville Lake, which is the largest. The county has a total area of 246 square miles, of which 241 square miles is land and 5 square miles is water.
Demographics
As of the 2010 census, Spencer County had a population of 17,061. The racial makeup of the county was 95.3% White, 2.2% Black or African American, 0.3% Native American, 0.4% Asian, 0.1% Pacific Islander, 0.7% from other races, and 0.9% from two or more races. Hispanic or Latino of any race were 1.7% of the population.
The median income for a household in the county was $45,945, and the median income for a family was $54,845. The per capita income for the county was $22,845. About 8.2% of families and 10.3% of the population were below the poverty line, including 13.2% of those under age 18 and 10.2% of those age 65 or over.
Economy
Spencer County is largely rural, and the economy is based on agriculture and manufacturing. The county is home to several large farms, and the main crops grown are corn, soybeans, and wheat. The county is also home to several manufacturing companies, including a large automotive parts plant and a furniture factory.
The county is also home to several tourist attractions, including Taylorsville Lake State Park, which offers camping, fishing, and boating. The county is also home to several wineries, and the county is part of the Kentucky Bourbon Trail.
Conclusion
Spencer County, Kentucky is a rural county located in the central part of the state. It is bordered by Bullitt, Nelson, Anderson, and Shelby counties, and the county seat is Taylorsville. The county has a population of 17,061, and the economy is based on agriculture and manufacturing. The county is home to several tourist attractions, including Taylorsville Lake State Park, and is part of the Kentucky Bourbon Trail.
Common Questions
What is Per Capita Income in Spencer County?
Per Capita income in Spencer County is $39,997.
What is the Median Family Income in Spencer County?
Median Family Income in Spencer County is $109,672.
What is the Median Household income in Spencer County?
Median Household Income in Spencer County is $101,118.
What is Income or Wage Gap in Spencer County?
Income or Wage Gap in Spencer County is 22.5%.
Women in Spencer County earn 77.5 cents for every dollar earned by a man.
What is Family Income Deficit in Spencer County?
Family Income Deficit in Spencer County is $10,607.
Families that are below poverty line in Spencer County earn $10,607 less on average than the poverty threshold level.
What is Inequality or Gini Index in Spencer County?
Inequality or Gini Index in Spencer County is 0.38.
What is the Total Population of Spencer County?
Total Population of Spencer County is 19,549.
What is the Total Male Population of Spencer County?
Total Male Population of Spencer County is 9,878.
What is the Total Female Population of Spencer County?
Total Female Population of Spencer County is 9,671.
What is the Ratio of Males per 100 Females in Spencer County?
There are 102.14 Males per 100 Females in Spencer County.
What is the Ratio of Females per 100 Males in Spencer County?
There are 97.90 Females per 100 Males in Spencer County.
What is the Median Population Age in Spencer County?
Median Population Age in Spencer County is 42.9 Years.
What is the Average Family Size in Spencer County
Average Family Size in Spencer County is 3.0 People.
What is the Average Household Size in Spencer County
Average Household Size in Spencer County is 2.8 People.
How Large is the Labor Force in Spencer County?
There are 10,588 People in the Labor Forcein in Spencer County.
What is the Percentage of People in the Labor Force in Spencer County?
67.7% of People are in the Labor Force in Spencer County.
What is the Unemployment Rate in Spencer County?
Unemployment Rate in Spencer County is 6.2%.