Simpson County, KY Map & Demographics
Simpson County Map
Simpson County Overview
$27,951
PER CAPITA INCOME
$68,252
AVG FAMILY INCOME
$55,907
AVG HOUSEHOLD INCOME
34.6%
WAGE / INCOME GAP [ % ]
65.4¢/ $1
WAGE / INCOME GAP [ $ ]
$11,268
FAMILY INCOME DEFICIT
0.42
INEQUALITY / GINI INDEX
19,574
TOTAL POPULATION
9,912
MALE POPULATION
9,662
FEMALE POPULATION
102.59
MALES / 100 FEMALES
97.48
FEMALES / 100 MALES
39.2
MEDIAN AGE
3.0
AVG FAMILY SIZE
2.5
AVG HOUSEHOLD SIZE
9,249
LABOR FORCE [ PEOPLE ]
59.6%
PERCENT IN LABOR FORCE
3.5%
UNEMPLOYMENT RATE
Simpson County Area Codes
Income in Simpson County
Income Overview in Simpson County
Per Capita Income in Simpson County is $27,951, while median incomes of families and households are $68,252 and $55,907 respectively.
| Characteristic | Number | Measure |
| Per Capita Income | 19,574 | $27,951 |
| Median Family Income | 5,061 | $68,252 |
| Mean Family Income | 5,061 | $82,042 |
| Median Household Income | 7,530 | $55,907 |
| Mean Household Income | 7,530 | $69,020 |
| Income Deficit | 5,061 | $11,268 |
| Wage / Income Gap (%) | 19,574 | 34.62% |
| Wage / Income Gap ($) | 19,574 | 65.38¢ per $1 |
| Gini / Inequality Index | 19,574 | 0.42 |
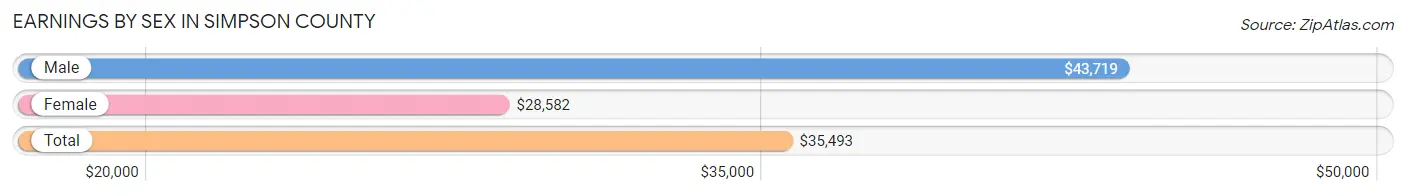
Earnings by Sex in Simpson County
Average Earnings in Simpson County are $35,493, $43,719 for men and $28,582 for women, a difference of 34.6%.
| Sex | Number | Average Earnings |
| Male | 5,145 (52.1%) | $43,719 |
| Female | 4,726 (47.9%) | $28,582 |
| Total | 9,871 (100.0%) | $35,493 |
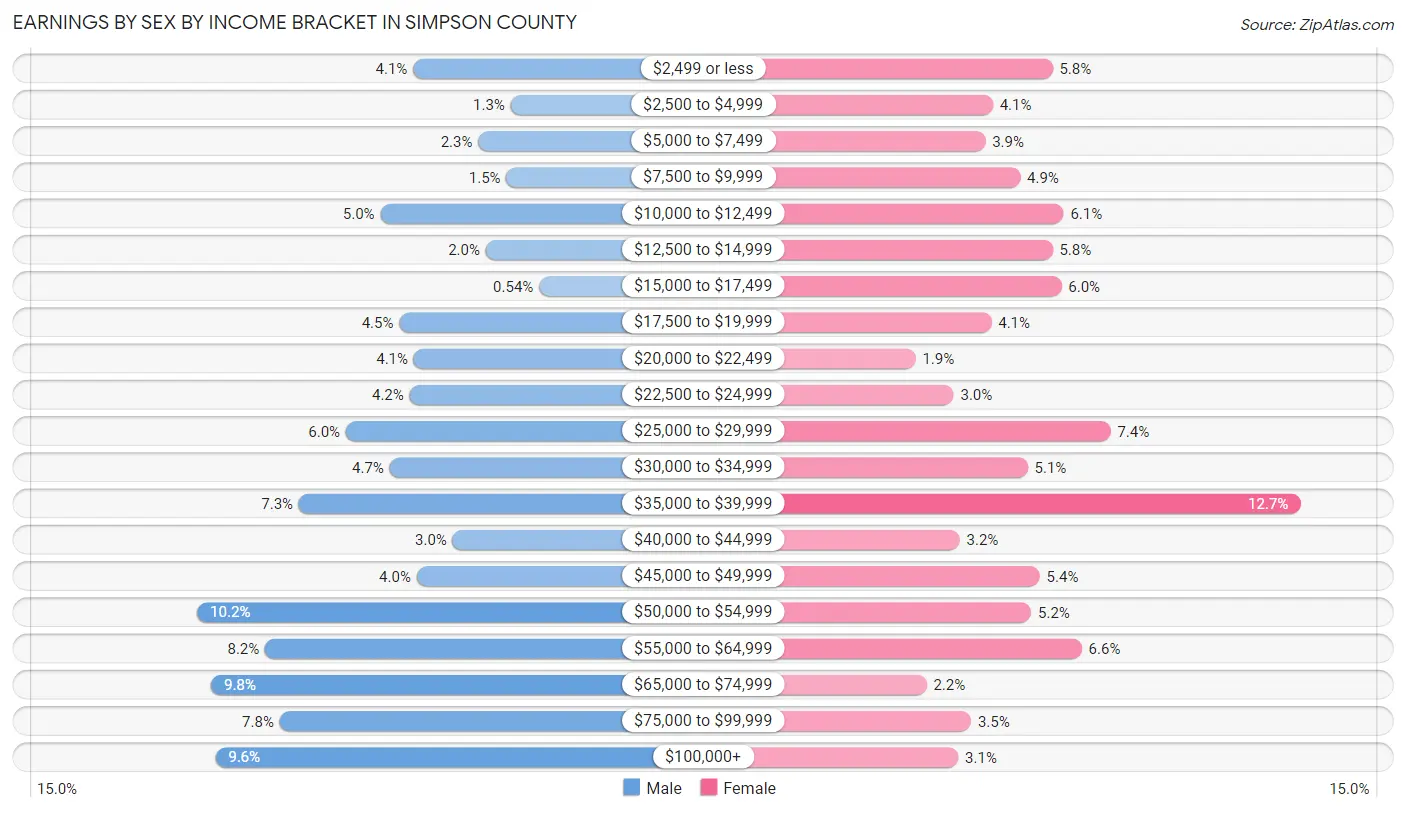
Earnings by Sex by Income Bracket in Simpson County
The most common earnings brackets in Simpson County are $50,000 to $54,999 for men (522 | 10.2%) and $35,000 to $39,999 for women (602 | 12.7%).
| Income | Male | Female |
| $2,499 or less | 210 (4.1%) | 273 (5.8%) |
| $2,500 to $4,999 | 69 (1.3%) | 194 (4.1%) |
| $5,000 to $7,499 | 116 (2.2%) | 184 (3.9%) |
| $7,500 to $9,999 | 75 (1.5%) | 230 (4.9%) |
| $10,000 to $12,499 | 257 (5.0%) | 288 (6.1%) |
| $12,500 to $14,999 | 105 (2.0%) | 273 (5.8%) |
| $15,000 to $17,499 | 28 (0.5%) | 285 (6.0%) |
| $17,500 to $19,999 | 230 (4.5%) | 192 (4.1%) |
| $20,000 to $22,499 | 209 (4.1%) | 91 (1.9%) |
| $22,500 to $24,999 | 215 (4.2%) | 142 (3.0%) |
| $25,000 to $29,999 | 307 (6.0%) | 350 (7.4%) |
| $30,000 to $34,999 | 244 (4.7%) | 240 (5.1%) |
| $35,000 to $39,999 | 375 (7.3%) | 602 (12.7%) |
| $40,000 to $44,999 | 153 (3.0%) | 150 (3.2%) |
| $45,000 to $49,999 | 205 (4.0%) | 256 (5.4%) |
| $50,000 to $54,999 | 522 (10.2%) | 245 (5.2%) |
| $55,000 to $64,999 | 424 (8.2%) | 312 (6.6%) |
| $65,000 to $74,999 | 502 (9.8%) | 106 (2.2%) |
| $75,000 to $99,999 | 403 (7.8%) | 165 (3.5%) |
| $100,000+ | 496 (9.6%) | 148 (3.1%) |
| Total | 5,145 (100.0%) | 4,726 (100.0%) |
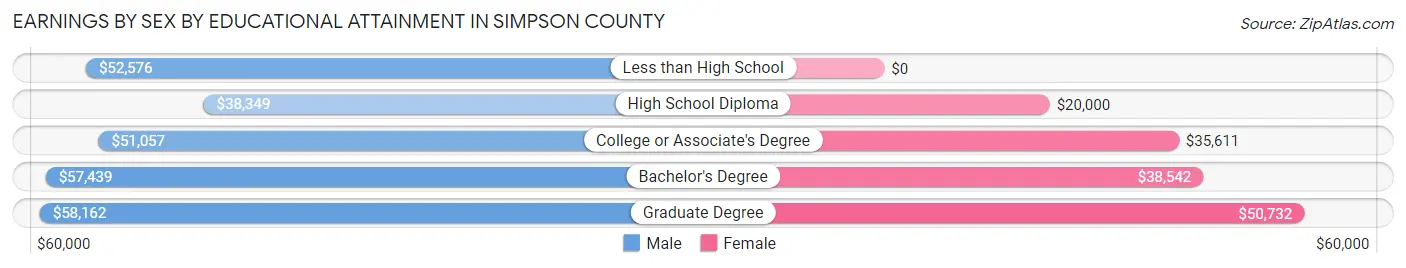
Earnings by Sex by Educational Attainment in Simpson County
Average earnings in Simpson County are $49,669 for men and $31,637 for women, a difference of 36.3%. Men with an educational attainment of graduate degree enjoy the highest average annual earnings of $58,162, while those with high school diploma education earn the least with $38,349. Women with an educational attainment of graduate degree earn the most with the average annual earnings of $50,732, while those with high school diploma education have the smallest earnings of $20,000.
| Educational Attainment | Male Income | Female Income |
| Less than High School | $52,576 | $0 |
| High School Diploma | $38,349 | $20,000 |
| College or Associate's Degree | $51,057 | $35,611 |
| Bachelor's Degree | $57,439 | $38,542 |
| Graduate Degree | $58,162 | $50,732 |
| Total | $49,669 | $31,637 |
Family Income in Simpson County
Family Income Brackets in Simpson County
According to the Simpson County family income data, there are 1,306 families falling into the $50,000 to $74,999 income range, which is the most common income bracket and makes up 25.8% of all families. Conversely, the $10,000 to $14,999 income bracket is the least frequent group with only 167 families (3.3%) belonging to this category.
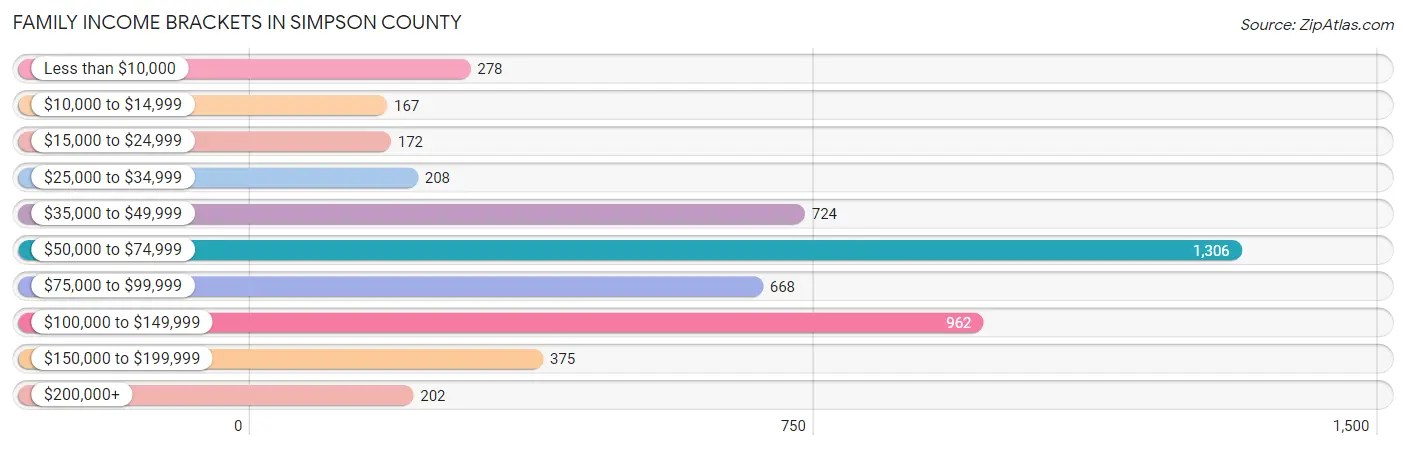
| Income Bracket | # Families | % Families |
| Less than $10,000 | 278 | 5.5% |
| $10,000 to $14,999 | 167 | 3.3% |
| $15,000 to $24,999 | 172 | 3.4% |
| $25,000 to $34,999 | 208 | 4.1% |
| $35,000 to $49,999 | 724 | 14.3% |
| $50,000 to $74,999 | 1,306 | 25.8% |
| $75,000 to $99,999 | 668 | 13.2% |
| $100,000 to $149,999 | 962 | 19.0% |
| $150,000 to $199,999 | 375 | 7.4% |
| $200,000+ | 202 | 4.0% |
Family Income by Famaliy Size in Simpson County
4-person families (706 | 14.0%) account for the highest median family income in Simpson County with $86,296 per family, while 2-person families (2,578 | 50.9%) have the highest median income of $31,797 per family member.
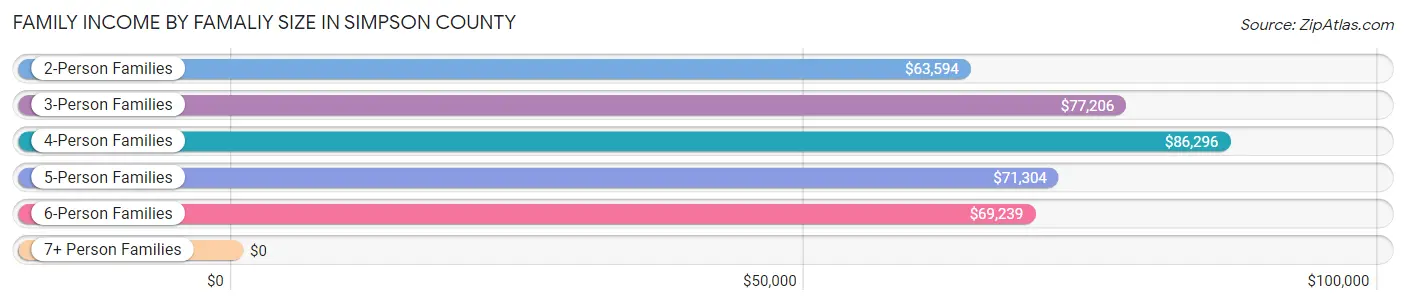
| Income Bracket | # Families | Median Income |
| 2-Person Families | 2,578 (50.9%) | $63,594 |
| 3-Person Families | 1,148 (22.7%) | $77,206 |
| 4-Person Families | 706 (14.0%) | $86,296 |
| 5-Person Families | 510 (10.1%) | $71,304 |
| 6-Person Families | 104 (2.1%) | $69,239 |
| 7+ Person Families | 15 (0.3%) | $0 |
| Total | 5,061 (100.0%) | $68,252 |
Family Income by Number of Earners in Simpson County
The median family income in Simpson County is $68,252, with families comprising 2 earners (2,117) having the highest median family income of $102,344, while families with no earners (746) have the lowest median family income of $36,389, accounting for 41.8% and 14.7% of families, respectively.
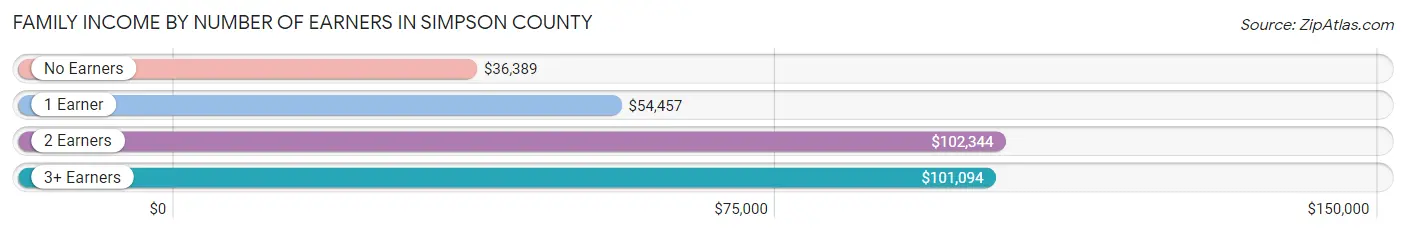
| Number of Earners | # Families | Median Income |
| No Earners | 746 (14.7%) | $36,389 |
| 1 Earner | 1,809 (35.7%) | $54,457 |
| 2 Earners | 2,117 (41.8%) | $102,344 |
| 3+ Earners | 389 (7.7%) | $101,094 |
| Total | 5,061 (100.0%) | $68,252 |
Household Income in Simpson County
Household Income Brackets in Simpson County
With 1,724 households falling in the category, the $50,000 to $74,999 income range is the most frequent in Simpson County, accounting for 22.9% of all households. In contrast, only 203 households (2.7%) fall into the $200,000+ income bracket, making it the least populous group.
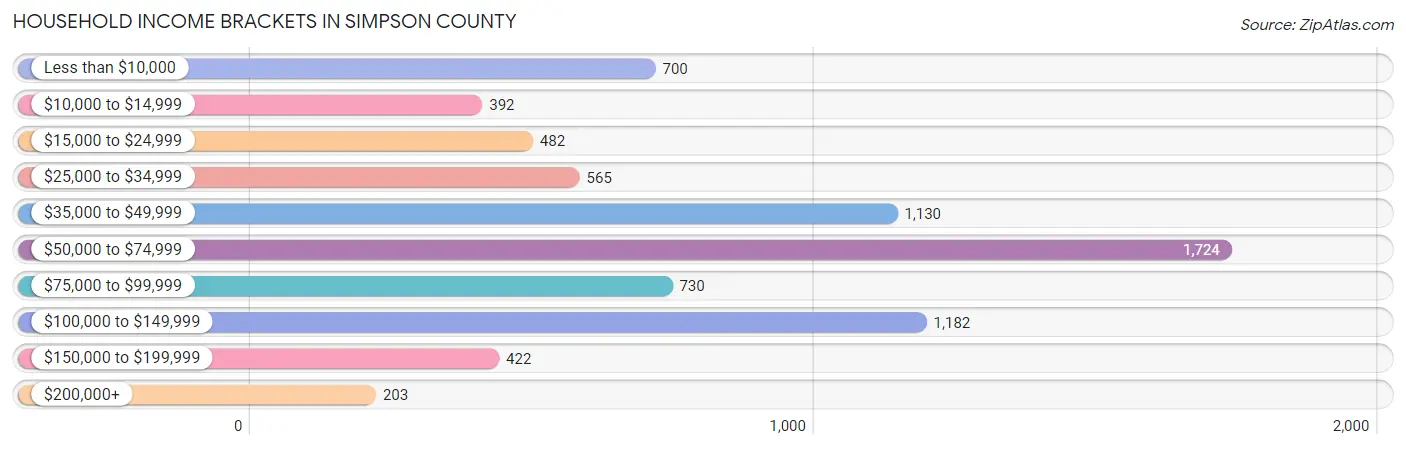
| Income Bracket | # Households | % Households |
| Less than $10,000 | 700 | 9.3% |
| $10,000 to $14,999 | 392 | 5.2% |
| $15,000 to $24,999 | 482 | 6.4% |
| $25,000 to $34,999 | 565 | 7.5% |
| $35,000 to $49,999 | 1,130 | 15.0% |
| $50,000 to $74,999 | 1,724 | 22.9% |
| $75,000 to $99,999 | 730 | 9.7% |
| $100,000 to $149,999 | 1,182 | 15.7% |
| $150,000 to $199,999 | 422 | 5.6% |
| $200,000+ | 203 | 2.7% |
Household Income by Householder Age in Simpson County
The median household income in Simpson County is $55,907, with the highest median household income of $67,954 found in the 25 to 44 years age bracket for the primary householder. A total of 2,345 households (31.1%) fall into this category. Meanwhile, the 15 to 24 years age bracket for the primary householder has the lowest median household income of $0, with 394 households (5.2%) in this group.
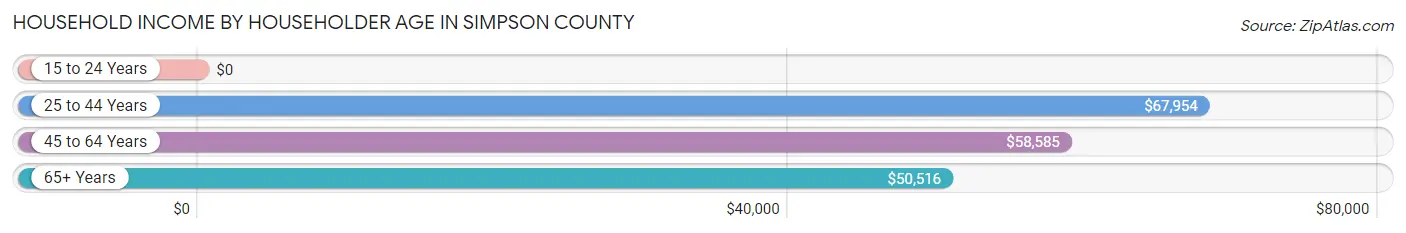
| Income Bracket | # Households | Median Income |
| 15 to 24 Years | 394 (5.2%) | $0 |
| 25 to 44 Years | 2,345 (31.1%) | $67,954 |
| 45 to 64 Years | 2,948 (39.2%) | $58,585 |
| 65+ Years | 1,843 (24.5%) | $50,516 |
| Total | 7,530 (100.0%) | $55,907 |
Poverty in Simpson County
Income Below Poverty by Sex and Age in Simpson County
With 10.5% poverty level for males and 17.9% for females among the residents of Simpson County, 15 year old males and 5 year old females are the most vulnerable to poverty, with 47 males (36.1%) and 42 females (62.7%) in their respective age groups living below the poverty level.
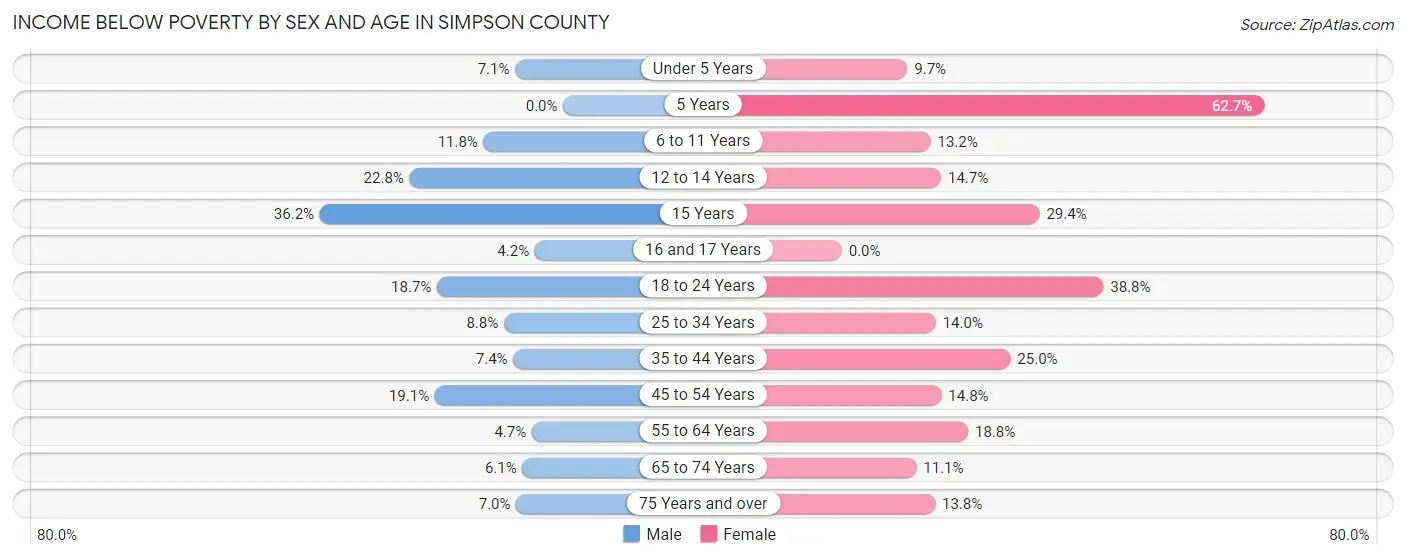
| Age Bracket | Male | Female |
| Under 5 Years | 34 (7.1%) | 51 (9.7%) |
| 5 Years | 0 (0.0%) | 42 (62.7%) |
| 6 to 11 Years | 86 (11.8%) | 112 (13.2%) |
| 12 to 14 Years | 89 (22.8%) | 46 (14.7%) |
| 15 Years | 47 (36.1%) | 27 (29.3%) |
| 16 and 17 Years | 11 (4.2%) | 0 (0.0%) |
| 18 to 24 Years | 163 (18.7%) | 336 (38.8%) |
| 25 to 34 Years | 122 (8.8%) | 159 (14.0%) |
| 35 to 44 Years | 84 (7.4%) | 284 (25.0%) |
| 45 to 54 Years | 210 (19.1%) | 168 (14.8%) |
| 55 to 64 Years | 66 (4.6%) | 267 (18.8%) |
| 65 to 74 Years | 53 (6.1%) | 110 (11.1%) |
| 75 Years and over | 33 (7.0%) | 94 (13.8%) |
| Total | 998 (10.5%) | 1,696 (17.9%) |
Income Above Poverty by Sex and Age in Simpson County
According to the poverty statistics in Simpson County, males aged 5 years and females aged 16 and 17 years are the age groups that are most secure financially, with 100.0% of males and 100.0% of females in these age groups living above the poverty line.
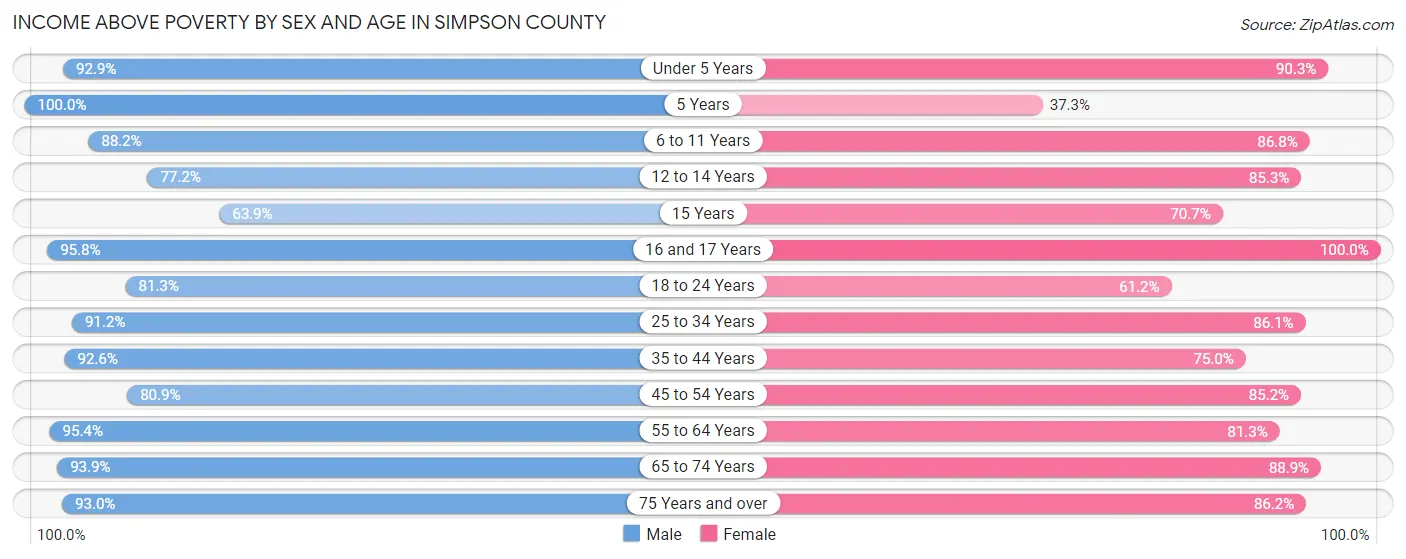
| Age Bracket | Male | Female |
| Under 5 Years | 442 (92.9%) | 473 (90.3%) |
| 5 Years | 272 (100.0%) | 25 (37.3%) |
| 6 to 11 Years | 641 (88.2%) | 737 (86.8%) |
| 12 to 14 Years | 301 (77.2%) | 266 (85.3%) |
| 15 Years | 83 (63.8%) | 65 (70.7%) |
| 16 and 17 Years | 250 (95.8%) | 253 (100.0%) |
| 18 to 24 Years | 707 (81.3%) | 529 (61.2%) |
| 25 to 34 Years | 1,265 (91.2%) | 981 (86.1%) |
| 35 to 44 Years | 1,050 (92.6%) | 850 (75.0%) |
| 45 to 54 Years | 892 (80.9%) | 968 (85.2%) |
| 55 to 64 Years | 1,352 (95.4%) | 1,157 (81.2%) |
| 65 to 74 Years | 822 (93.9%) | 884 (88.9%) |
| 75 Years and over | 440 (93.0%) | 585 (86.2%) |
| Total | 8,517 (89.5%) | 7,773 (82.1%) |
Income Below Poverty Among Married-Couple Families in Simpson County
The poverty statistics for married-couple families in Simpson County show that 5.8% or 227 of the total 3,884 families live below the poverty line. Families with 1 or 2 children have the highest poverty rate of 7.9%, comprising of 80 families. On the other hand, families with 3 or 4 children have the lowest poverty rate of 0.0%, which includes 0 families.
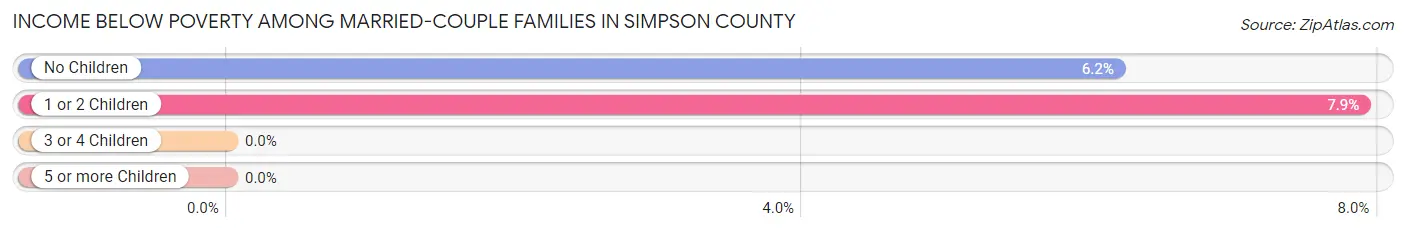
| Children | Above Poverty | Below Poverty |
| No Children | 2,230 (93.8%) | 147 (6.2%) |
| 1 or 2 Children | 934 (92.1%) | 80 (7.9%) |
| 3 or 4 Children | 493 (100.0%) | 0 (0.0%) |
| 5 or more Children | 0 (0.0%) | 0 (0.0%) |
| Total | 3,657 (94.2%) | 227 (5.8%) |
Income Below Poverty Among Single-Parent Households in Simpson County
According to the poverty data in Simpson County, 5.9% or 25 single-father households and 43.0% or 325 single-mother households are living below the poverty line. Among single-father households, those with no children have the highest poverty rate, with 18 households (6.9%) experiencing poverty. Likewise, among single-mother households, those with 1 or 2 children have the highest poverty rate, with 253 households (65.9%) falling below the poverty line.
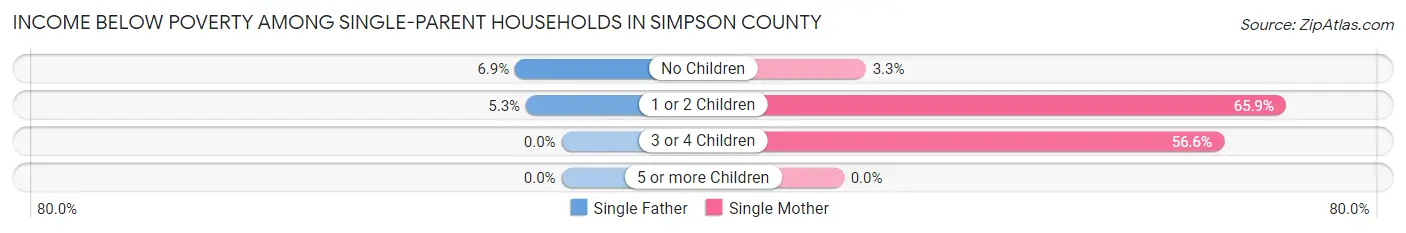
| Children | Single Father | Single Mother |
| No Children | 18 (6.9%) | 8 (3.3%) |
| 1 or 2 Children | 7 (5.3%) | 253 (65.9%) |
| 3 or 4 Children | 0 (0.0%) | 64 (56.6%) |
| 5 or more Children | 0 (0.0%) | 0 (0.0%) |
| Total | 25 (5.9%) | 325 (43.0%) |
Income Below Poverty Among Married-Couple vs Single-Parent Households in Simpson County
The poverty data for Simpson County shows that 227 of the married-couple family households (5.8%) and 350 of the single-parent households (29.7%) are living below the poverty level. Within the married-couple family households, those with 1 or 2 children have the highest poverty rate, with 80 households (7.9%) falling below the poverty line. Among the single-parent households, those with 1 or 2 children have the highest poverty rate, with 260 household (50.4%) living below poverty.
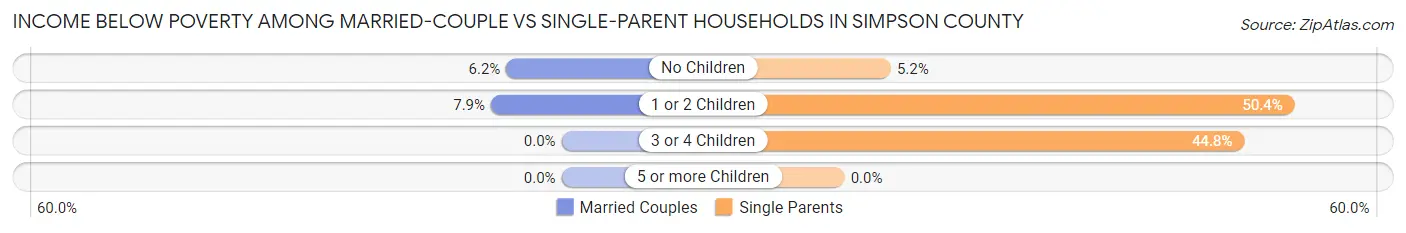
| Children | Married-Couple Families | Single-Parent Households |
| No Children | 147 (6.2%) | 26 (5.2%) |
| 1 or 2 Children | 80 (7.9%) | 260 (50.4%) |
| 3 or 4 Children | 0 (0.0%) | 64 (44.8%) |
| 5 or more Children | 0 (0.0%) | 0 (0.0%) |
| Total | 227 (5.8%) | 350 (29.7%) |
Race in Simpson County
The most populous races in Simpson County are White / Caucasian (16,639 | 85.0%), Black / African American (1,839 | 9.4%), and Two or more Races (856 | 4.4%).
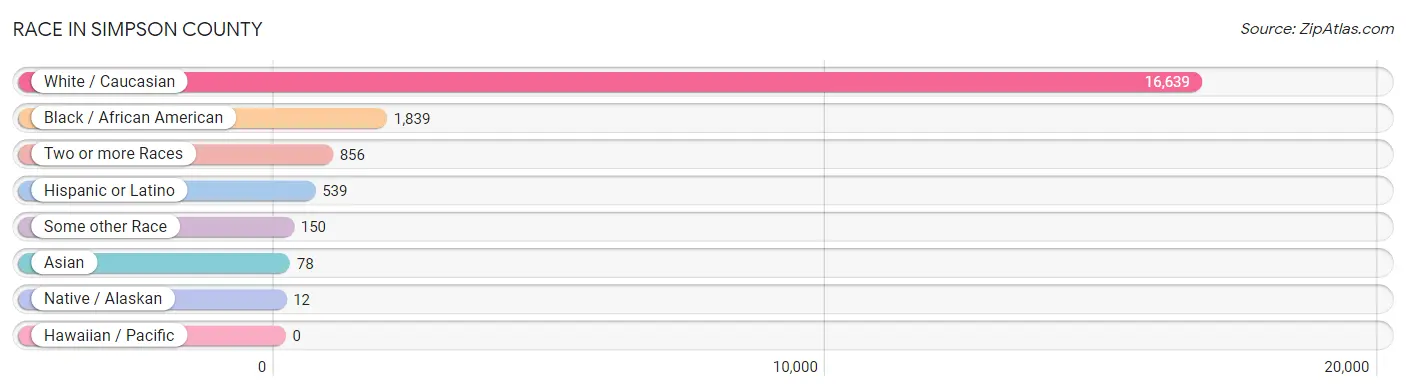
| Race | # Population | % Population |
| Asian | 78 | 0.4% |
| Black / African American | 1,839 | 9.4% |
| Hawaiian / Pacific | 0 | 0.0% |
| Hispanic or Latino | 539 | 2.8% |
| Native / Alaskan | 12 | 0.1% |
| White / Caucasian | 16,639 | 85.0% |
| Two or more Races | 856 | 4.4% |
| Some other Race | 150 | 0.8% |
| Total | 19,574 | 100.0% |
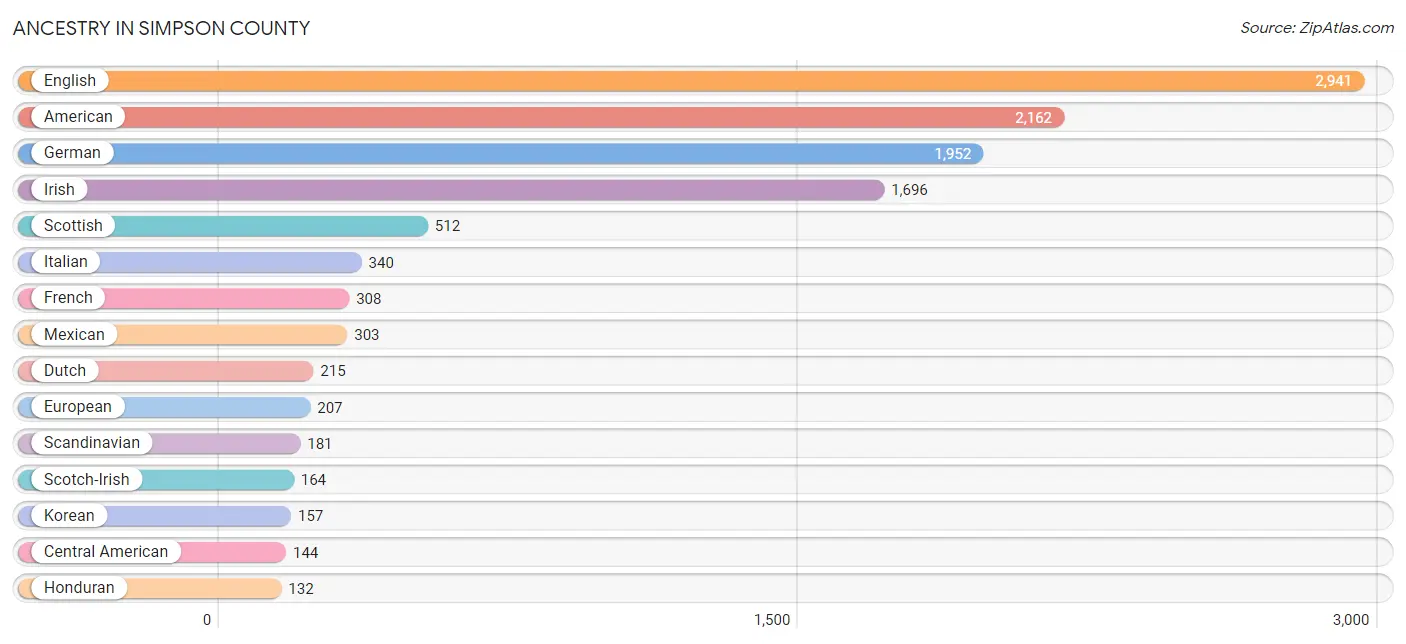
Ancestry in Simpson County
The most populous ancestries reported in Simpson County are English (2,941 | 15.0%), American (2,162 | 11.1%), German (1,952 | 10.0%), Irish (1,696 | 8.7%), and Scottish (512 | 2.6%), together accounting for 47.3% of all Simpson County residents.
| Ancestry | # Population | % Population |
| African | 86 | 0.4% |
| American | 2,162 | 11.1% |
| Arab | 1 | 0.0% |
| Bhutanese | 37 | 0.2% |
| British | 29 | 0.2% |
| Canadian | 11 | 0.1% |
| Central American | 144 | 0.7% |
| Central American Indian | 53 | 0.3% |
| Cherokee | 46 | 0.2% |
| Creek | 4 | 0.0% |
| Czech | 19 | 0.1% |
| Danish | 20 | 0.1% |
| Dutch | 215 | 1.1% |
| Eastern European | 32 | 0.2% |
| Egyptian | 1 | 0.0% |
| English | 2,941 | 15.0% |
| European | 207 | 1.1% |
| Filipino | 5 | 0.0% |
| Finnish | 20 | 0.1% |
| French | 308 | 1.6% |
| French Canadian | 88 | 0.4% |
| German | 1,952 | 10.0% |
| Guatemalan | 6 | 0.0% |
| Honduran | 132 | 0.7% |
| Hungarian | 30 | 0.2% |
| Irish | 1,696 | 8.7% |
| Italian | 340 | 1.7% |
| Jamaican | 49 | 0.3% |
| Korean | 157 | 0.8% |
| Mexican | 303 | 1.5% |
| Navajo | 1 | 0.0% |
| Nicaraguan | 6 | 0.0% |
| Norwegian | 91 | 0.5% |
| Polish | 125 | 0.6% |
| Portuguese | 90 | 0.5% |
| Puerto Rican | 48 | 0.3% |
| Romanian | 17 | 0.1% |
| Russian | 44 | 0.2% |
| Scandinavian | 181 | 0.9% |
| Scotch-Irish | 164 | 0.8% |
| Scottish | 512 | 2.6% |
| Serbian | 17 | 0.1% |
| Slovak | 7 | 0.0% |
| Spanish | 16 | 0.1% |
| Subsaharan African | 86 | 0.4% |
| Swedish | 34 | 0.2% |
| Swiss | 18 | 0.1% |
| Ukrainian | 11 | 0.1% |
| Welsh | 48 | 0.3% | View All 49 Rows |
Immigrants in Simpson County
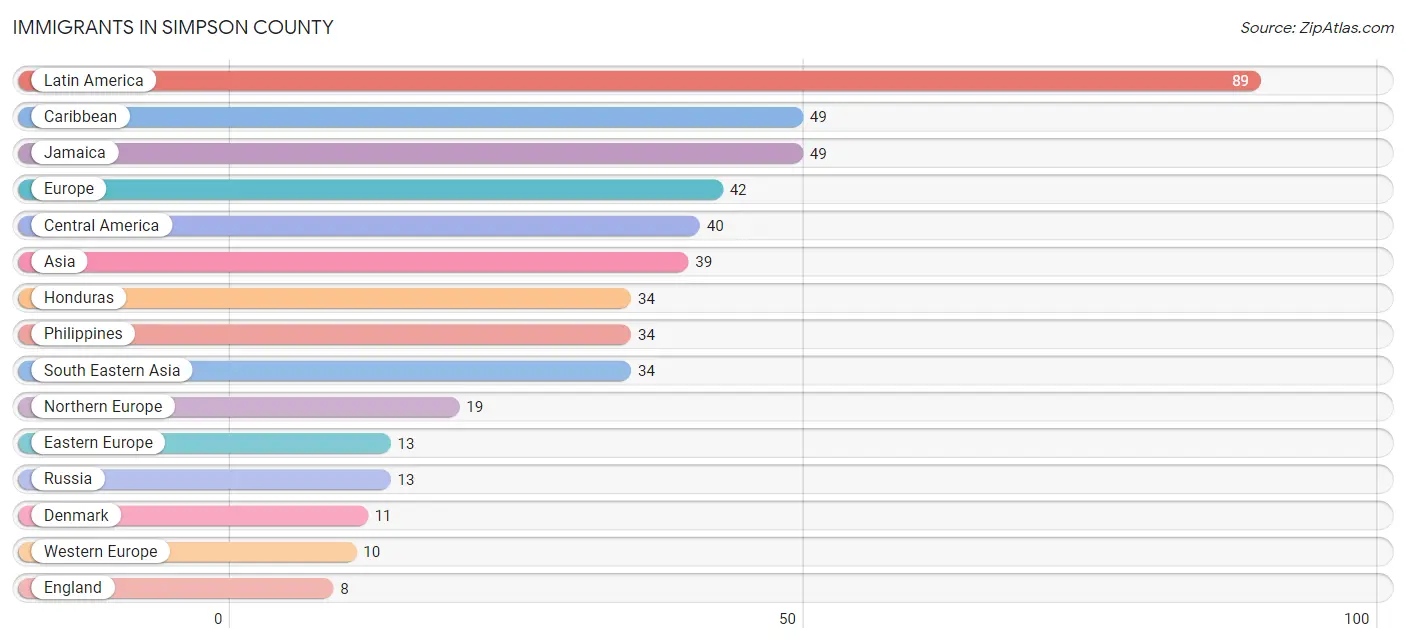
The most numerous immigrant groups reported in Simpson County came from Latin America (89 | 0.4%), Caribbean (49 | 0.3%), Jamaica (49 | 0.3%), Europe (42 | 0.2%), and Central America (40 | 0.2%), together accounting for 1.4% of all Simpson County residents.
| Immigration Origin | # Population | % Population |
| Africa | 1 | 0.0% |
| Asia | 39 | 0.2% |
| Caribbean | 49 | 0.3% |
| Central America | 40 | 0.2% |
| China | 5 | 0.0% |
| Denmark | 11 | 0.1% |
| Eastern Asia | 5 | 0.0% |
| Eastern Europe | 13 | 0.1% |
| Egypt | 1 | 0.0% |
| England | 8 | 0.0% |
| Europe | 42 | 0.2% |
| France | 5 | 0.0% |
| Guatemala | 6 | 0.0% |
| Honduras | 34 | 0.2% |
| Jamaica | 49 | 0.3% |
| Latin America | 89 | 0.4% |
| Netherlands | 5 | 0.0% |
| Northern Africa | 1 | 0.0% |
| Northern Europe | 19 | 0.1% |
| Philippines | 34 | 0.2% |
| Russia | 13 | 0.1% |
| South Eastern Asia | 34 | 0.2% |
| Taiwan | 5 | 0.0% |
| Western Europe | 10 | 0.1% | View All 24 Rows |
Sex and Age in Simpson County
Sex and Age in Simpson County
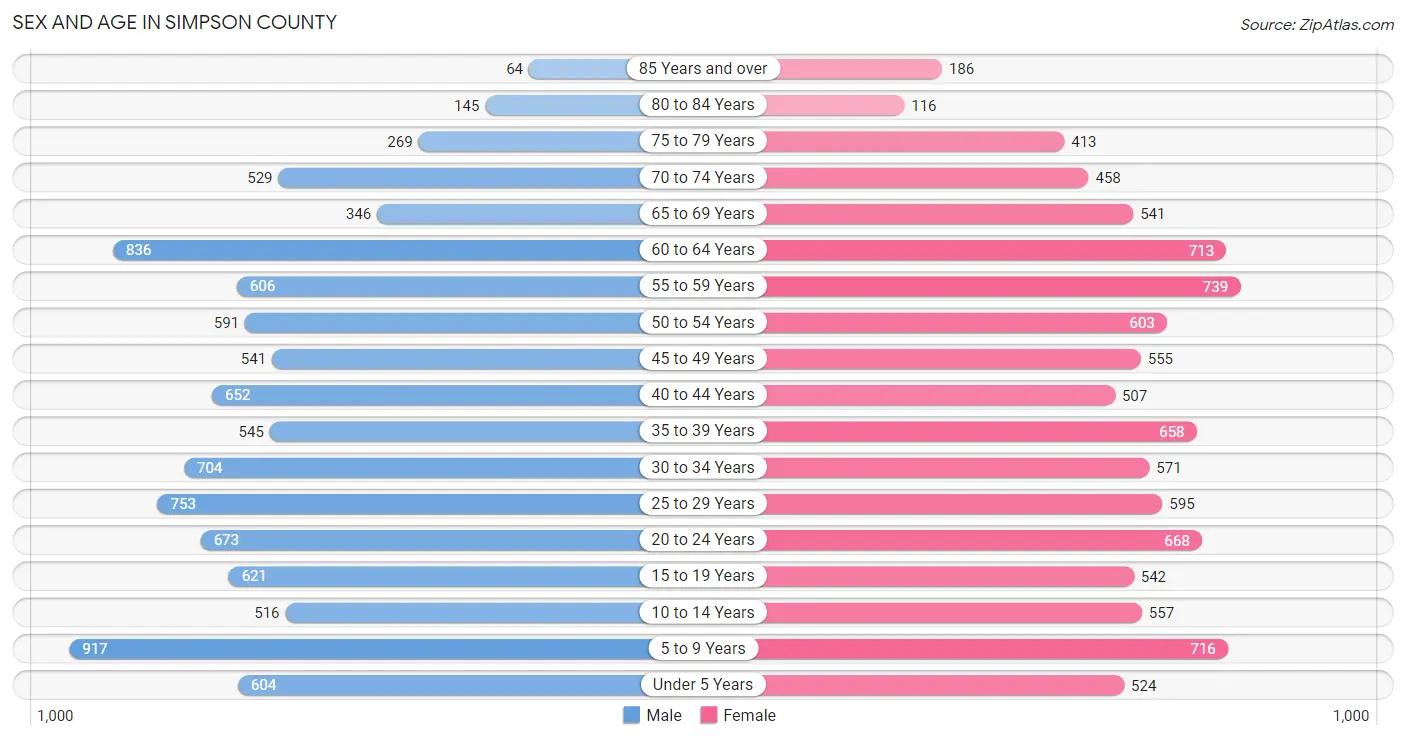
The most populous age groups in Simpson County are 5 to 9 Years (917 | 9.2%) for men and 55 to 59 Years (739 | 7.6%) for women.
| Age Bracket | Male | Female |
| Under 5 Years | 604 (6.1%) | 524 (5.4%) |
| 5 to 9 Years | 917 (9.2%) | 716 (7.4%) |
| 10 to 14 Years | 516 (5.2%) | 557 (5.8%) |
| 15 to 19 Years | 621 (6.3%) | 542 (5.6%) |
| 20 to 24 Years | 673 (6.8%) | 668 (6.9%) |
| 25 to 29 Years | 753 (7.6%) | 595 (6.2%) |
| 30 to 34 Years | 704 (7.1%) | 571 (5.9%) |
| 35 to 39 Years | 545 (5.5%) | 658 (6.8%) |
| 40 to 44 Years | 652 (6.6%) | 507 (5.2%) |
| 45 to 49 Years | 541 (5.5%) | 555 (5.7%) |
| 50 to 54 Years | 591 (6.0%) | 603 (6.2%) |
| 55 to 59 Years | 606 (6.1%) | 739 (7.6%) |
| 60 to 64 Years | 836 (8.4%) | 713 (7.4%) |
| 65 to 69 Years | 346 (3.5%) | 541 (5.6%) |
| 70 to 74 Years | 529 (5.3%) | 458 (4.7%) |
| 75 to 79 Years | 269 (2.7%) | 413 (4.3%) |
| 80 to 84 Years | 145 (1.5%) | 116 (1.2%) |
| 85 Years and over | 64 (0.6%) | 186 (1.9%) |
| Total | 9,912 (100.0%) | 9,662 (100.0%) |
Families and Households in Simpson County
Median Family Size in Simpson County
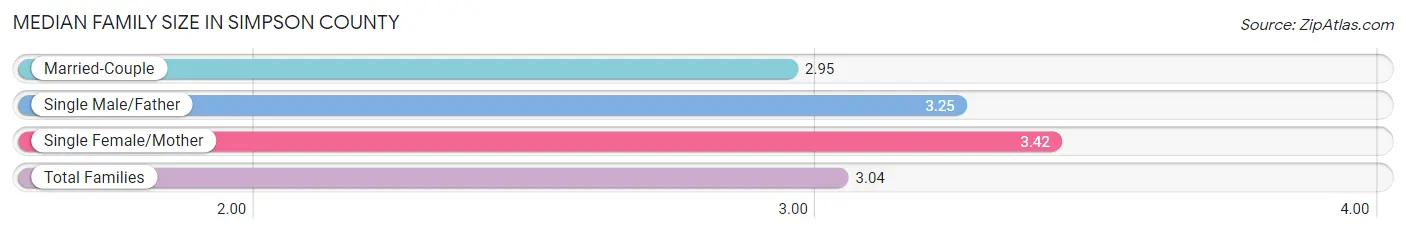
The median family size in Simpson County is 3.04 persons per family, with single female/mother families (755 | 14.9%) accounting for the largest median family size of 3.42 persons per family. On the other hand, married-couple families (3,884 | 76.7%) represent the smallest median family size with 2.95 persons per family.
| Family Type | # Families | Family Size |
| Married-Couple | 3,884 (76.7%) | 2.95 |
| Single Male/Father | 422 (8.3%) | 3.25 |
| Single Female/Mother | 755 (14.9%) | 3.42 |
| Total Families | 5,061 (100.0%) | 3.04 |
Median Household Size in Simpson County
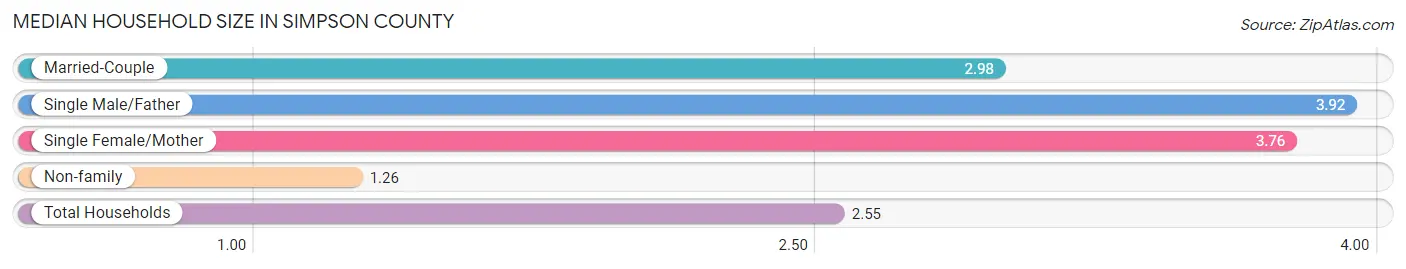
The median household size in Simpson County is 2.55 persons per household, with single male/father households (422 | 5.6%) accounting for the largest median household size of 3.92 persons per household. non-family households (2,469 | 32.8%) represent the smallest median household size with 1.26 persons per household.
| Household Type | # Households | Household Size |
| Married-Couple | 3,884 (51.6%) | 2.98 |
| Single Male/Father | 422 (5.6%) | 3.92 |
| Single Female/Mother | 755 (10.0%) | 3.76 |
| Non-family | 2,469 (32.8%) | 1.26 |
| Total Households | 7,530 (100.0%) | 2.55 |
Household Size by Marriage Status in Simpson County
Out of a total of 7,530 households in Simpson County, 5,061 (67.2%) are family households, while 2,469 (32.8%) are nonfamily households. The most numerous type of family households are 2-person households, comprising 2,380, and the most common type of nonfamily households are 1-person households, comprising 2,139.
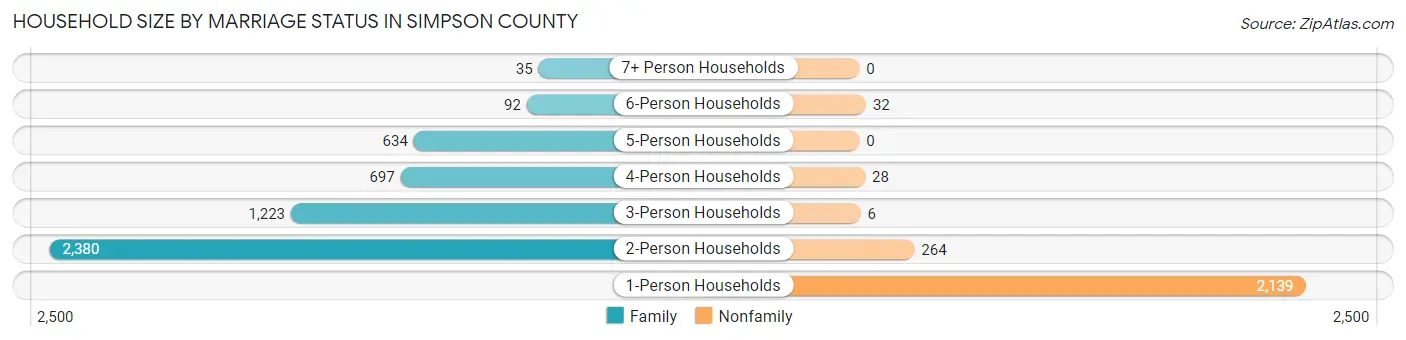
| Household Size | Family Households | Nonfamily Households |
| 1-Person Households | - | 2,139 (28.4%) |
| 2-Person Households | 2,380 (31.6%) | 264 (3.5%) |
| 3-Person Households | 1,223 (16.2%) | 6 (0.1%) |
| 4-Person Households | 697 (9.3%) | 28 (0.4%) |
| 5-Person Households | 634 (8.4%) | 0 (0.0%) |
| 6-Person Households | 92 (1.2%) | 32 (0.4%) |
| 7+ Person Households | 35 (0.5%) | 0 (0.0%) |
| Total | 5,061 (67.2%) | 2,469 (32.8%) |
Female Fertility in Simpson County
Fertility by Age in Simpson County
Average fertility rate in Simpson County is 44.0 births per 1,000 women. Women in the age bracket of 20 to 34 years have the highest fertility rate with 79.0 births per 1,000 women. Women in the age bracket of 20 to 34 years acount for 76.6% of all women with births.
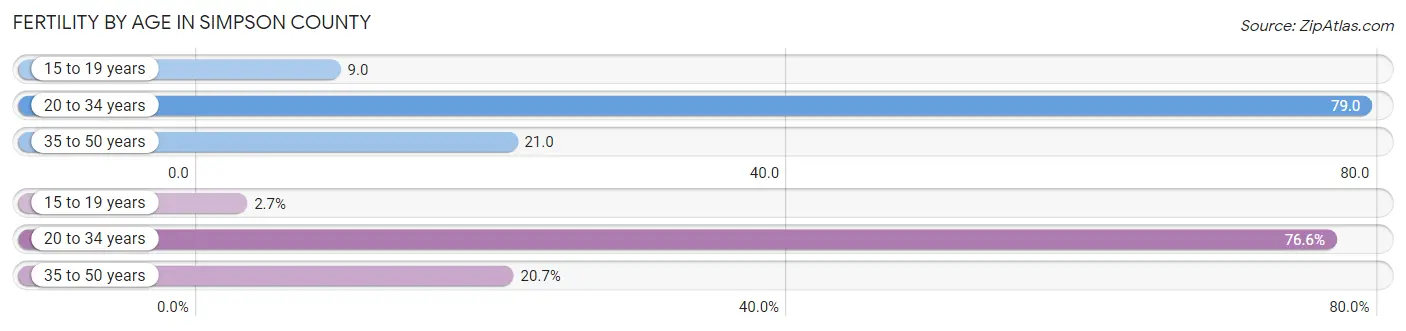
| Age Bracket | Women with Births | Births / 1,000 Women |
| 15 to 19 years | 5 (2.7%) | 9.0 |
| 20 to 34 years | 144 (76.6%) | 79.0 |
| 35 to 50 years | 39 (20.7%) | 21.0 |
| Total | 188 (100.0%) | 44.0 |
Fertility by Age by Marriage Status in Simpson County
97.3% of women with births (188) in Simpson County are married. The highest percentage of unmarried women with births falls into 15 to 19 years age bracket with 100.0% of them unmarried at the time of birth, while the lowest percentage of unmarried women with births belong to 20 to 34 years age bracket with 0.0% of them unmarried.
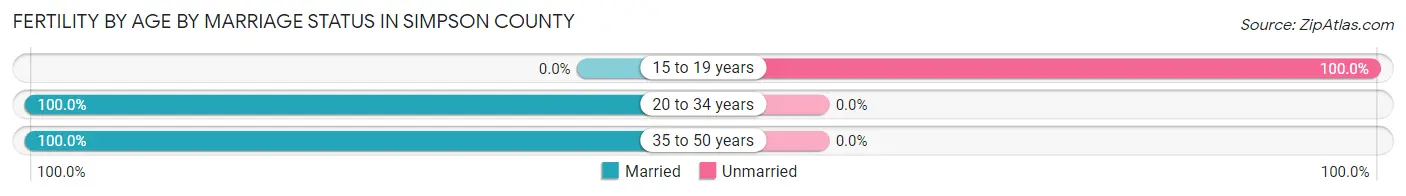
| Age Bracket | Married | Unmarried |
| 15 to 19 years | 0 (0.0%) | 5 (100.0%) |
| 20 to 34 years | 144 (100.0%) | 0 (0.0%) |
| 35 to 50 years | 39 (100.0%) | 0 (0.0%) |
| Total | 183 (97.3%) | 5 (2.7%) |
Fertility by Education in Simpson County
Average fertility rate in Simpson County is 44.0 births per 1,000 women. Women with the education attainment of college or associate's degree have the highest fertility rate of 90.0 births per 1,000 women, while women with the education attainment of high school diploma have the lowest fertility at 15.0 births per 1,000 women. Women with the education attainment of college or associate's degree represent 73.9% of all women with births.
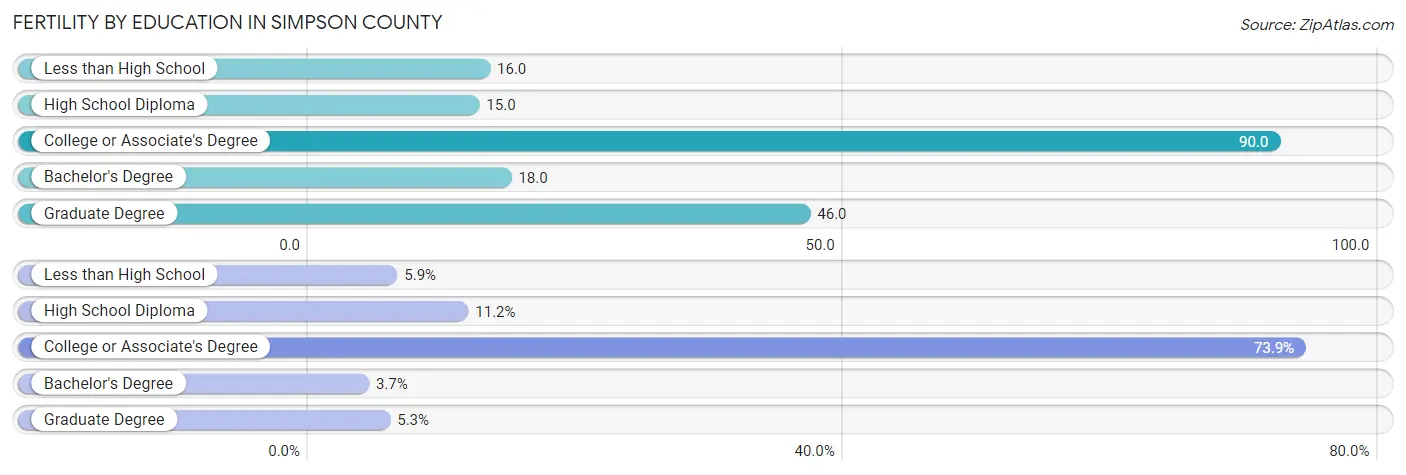
| Educational Attainment | Women with Births | Births / 1,000 Women |
| Less than High School | 11 (5.9%) | 16.0 |
| High School Diploma | 21 (11.2%) | 15.0 |
| College or Associate's Degree | 139 (73.9%) | 90.0 |
| Bachelor's Degree | 7 (3.7%) | 18.0 |
| Graduate Degree | 10 (5.3%) | 46.0 |
| Total | 188 (100.0%) | 44.0 |
Fertility by Education by Marriage Status in Simpson County
2.7% of women with births in Simpson County are unmarried. Women with the educational attainment of high school diploma are most likely to be married with 100.0% of them married at childbirth, while women with the educational attainment of less than high school are least likely to be married with 45.5% of them unmarried at childbirth.
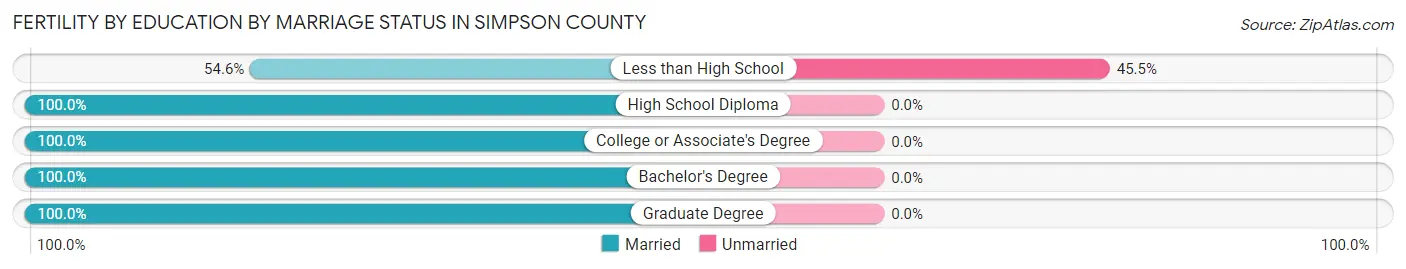
| Educational Attainment | Married | Unmarried |
| Less than High School | 6 (54.5%) | 5 (45.5%) |
| High School Diploma | 21 (100.0%) | 0 (0.0%) |
| College or Associate's Degree | 139 (100.0%) | 0 (0.0%) |
| Bachelor's Degree | 7 (100.0%) | 0 (0.0%) |
| Graduate Degree | 10 (100.0%) | 0 (0.0%) |
| Total | 183 (97.3%) | 5 (2.7%) |
Employment Characteristics in Simpson County
Employment by Class of Employer in Simpson County
Among the 8,711 employed individuals in Simpson County, private company employees (6,519 | 74.8%), self-employed (not incorporated) (806 | 9.2%), and local government employees (527 | 6.0%) make up the most common classes of employment.
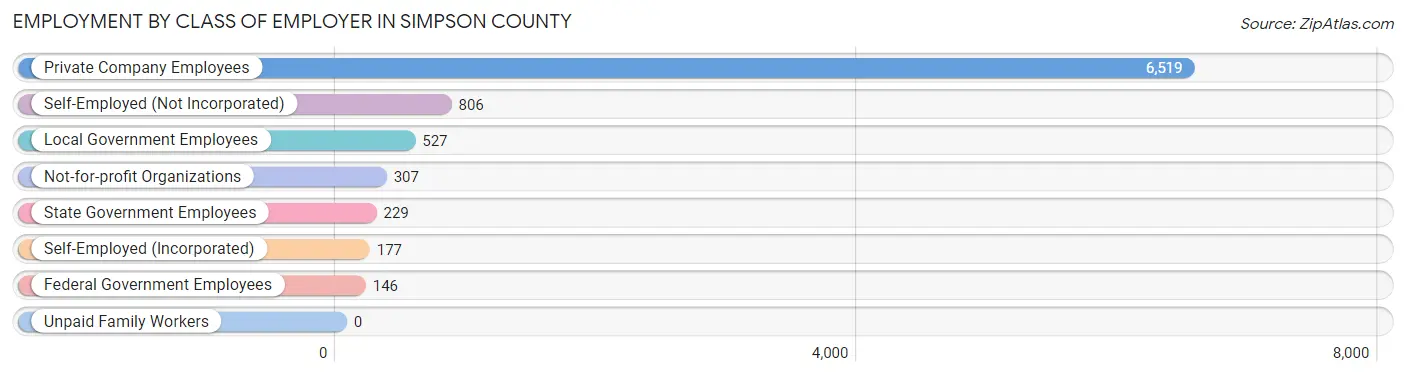
| Employer Class | # Employees | % Employees |
| Private Company Employees | 6,519 | 74.8% |
| Self-Employed (Incorporated) | 177 | 2.0% |
| Self-Employed (Not Incorporated) | 806 | 9.2% |
| Not-for-profit Organizations | 307 | 3.5% |
| Local Government Employees | 527 | 6.0% |
| State Government Employees | 229 | 2.6% |
| Federal Government Employees | 146 | 1.7% |
| Unpaid Family Workers | 0 | 0.0% |
| Total | 8,711 | 100.0% |
Employment Status by Age in Simpson County
According to the labor force statistics for Simpson County, out of the total population over 16 years of age (15,518), 59.6% or 9,249 individuals are in the labor force, with 3.5% or 324 of them unemployed. The age group with the highest labor force participation rate is 25 to 29 years, with 86.6% or 1,167 individuals in the labor force. Within the labor force, the 16 to 19 years age range has the highest percentage of unemployed individuals, with 25.6% or 61 of them being unemployed.
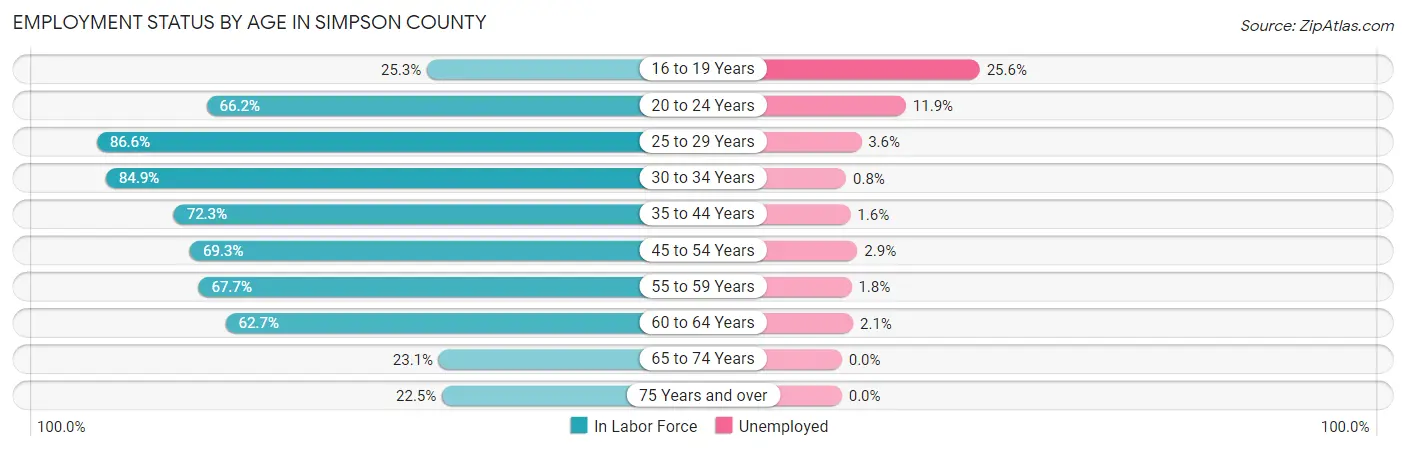
| Age Bracket | In Labor Force | Unemployed |
| 16 to 19 Years | 238 (25.3%) | 61 (25.6%) |
| 20 to 24 Years | 888 (66.2%) | 106 (11.9%) |
| 25 to 29 Years | 1,167 (86.6%) | 42 (3.6%) |
| 30 to 34 Years | 1,082 (84.9%) | 9 (0.8%) |
| 35 to 44 Years | 1,708 (72.3%) | 27 (1.6%) |
| 45 to 54 Years | 1,587 (69.3%) | 46 (2.9%) |
| 55 to 59 Years | 911 (67.7%) | 16 (1.8%) |
| 60 to 64 Years | 971 (62.7%) | 20 (2.1%) |
| 65 to 74 Years | 433 (23.1%) | 0 (0.0%) |
| 75 Years and over | 268 (22.5%) | 0 (0.0%) |
| Total | 9,249 (59.6%) | 324 (3.5%) |
Employment Status by Educational Attainment in Simpson County
According to labor force statistics for Simpson County, 73.0% of individuals (7,423) out of the total population between 25 and 64 years of age (10,169) are in the labor force, with 2.2% or 163 of them being unemployed. The group with the highest labor force participation rate are those with the educational attainment of bachelor's degree or higher, with 88.4% or 1,294 individuals in the labor force. Within the labor force, individuals with less than high school education have the highest percentage of unemployment, with 3.0% or 13 of them being unemployed.
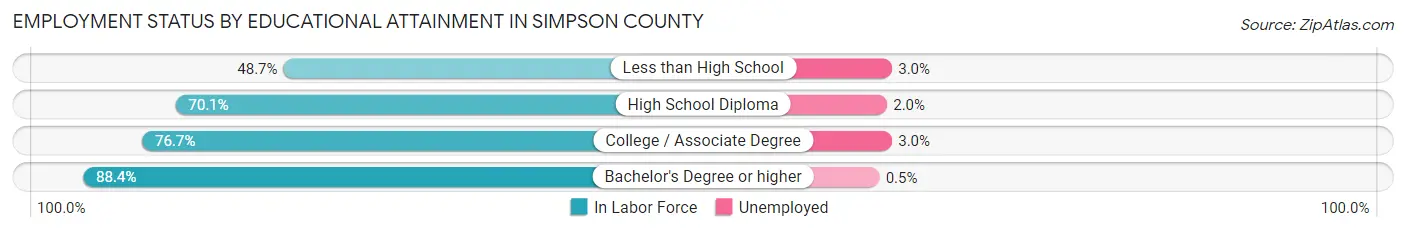
| Educational Attainment | In Labor Force | Unemployed |
| Less than High School | 439 (48.7%) | 27 (3.0%) |
| High School Diploma | 3,097 (70.1%) | 88 (2.0%) |
| College / Associate Degree | 2,597 (76.7%) | 102 (3.0%) |
| Bachelor's Degree or higher | 1,294 (88.4%) | 7 (0.5%) |
| Total | 7,423 (73.0%) | 224 (2.2%) |
Employment Occupations by Sex in Simpson County
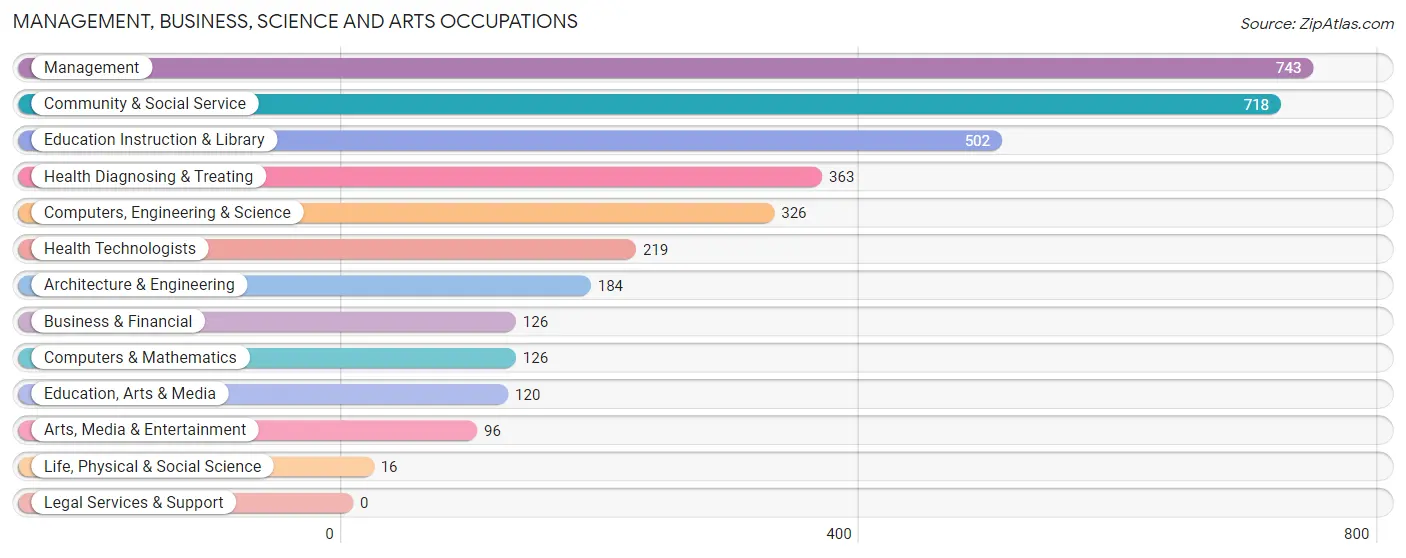
Management, Business, Science and Arts Occupations
The most common Management, Business, Science and Arts occupations in Simpson County are Management (743 | 8.3%), Community & Social Service (718 | 8.0%), Education Instruction & Library (502 | 5.6%), Health Diagnosing & Treating (363 | 4.1%), and Computers, Engineering & Science (326 | 3.6%).
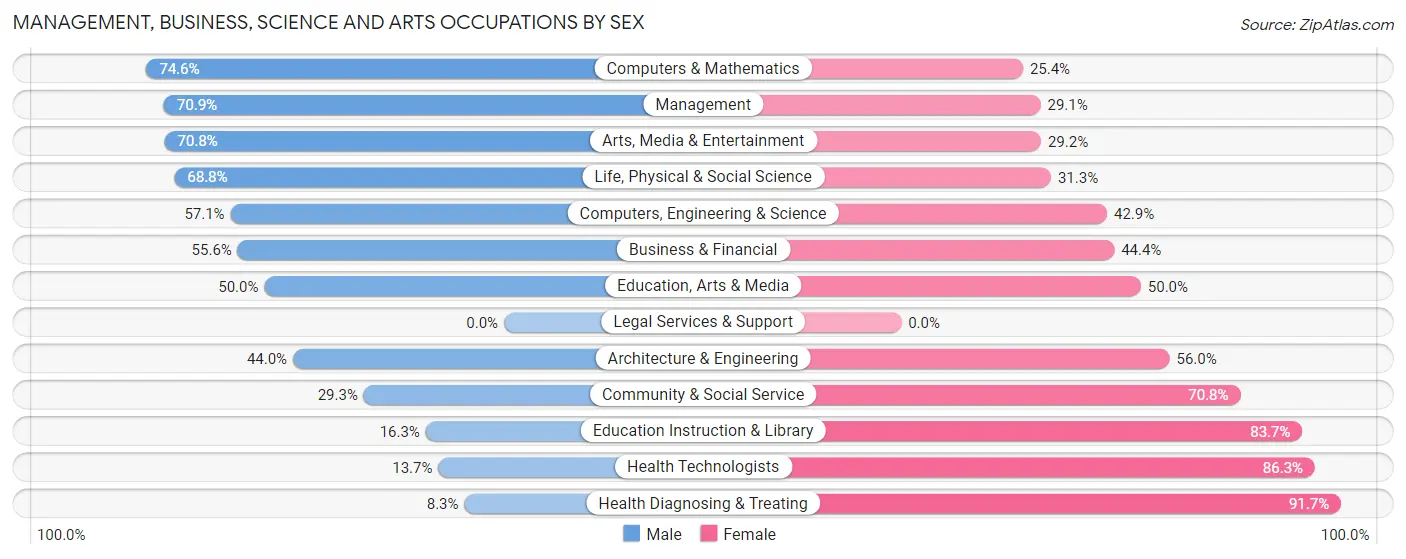
Management, Business, Science and Arts Occupations by Sex
Within the Management, Business, Science and Arts occupations in Simpson County, the most male-oriented occupations are Computers & Mathematics (74.6%), Management (70.9%), and Arts, Media & Entertainment (70.8%), while the most female-oriented occupations are Health Diagnosing & Treating (91.7%), Health Technologists (86.3%), and Education Instruction & Library (83.7%).
| Occupation | Male | Female |
| Management | 527 (70.9%) | 216 (29.1%) |
| Business & Financial | 70 (55.6%) | 56 (44.4%) |
| Computers, Engineering & Science | 186 (57.1%) | 140 (42.9%) |
| Computers & Mathematics | 94 (74.6%) | 32 (25.4%) |
| Architecture & Engineering | 81 (44.0%) | 103 (56.0%) |
| Life, Physical & Social Science | 11 (68.8%) | 5 (31.2%) |
| Community & Social Service | 210 (29.2%) | 508 (70.8%) |
| Education, Arts & Media | 60 (50.0%) | 60 (50.0%) |
| Legal Services & Support | 0 (0.0%) | 0 (0.0%) |
| Education Instruction & Library | 82 (16.3%) | 420 (83.7%) |
| Arts, Media & Entertainment | 68 (70.8%) | 28 (29.2%) |
| Health Diagnosing & Treating | 30 (8.3%) | 333 (91.7%) |
| Health Technologists | 30 (13.7%) | 189 (86.3%) |
| Total (Category) | 1,023 (45.0%) | 1,253 (55.0%) |
| Total (Overall) | 4,793 (53.7%) | 4,133 (46.3%) |
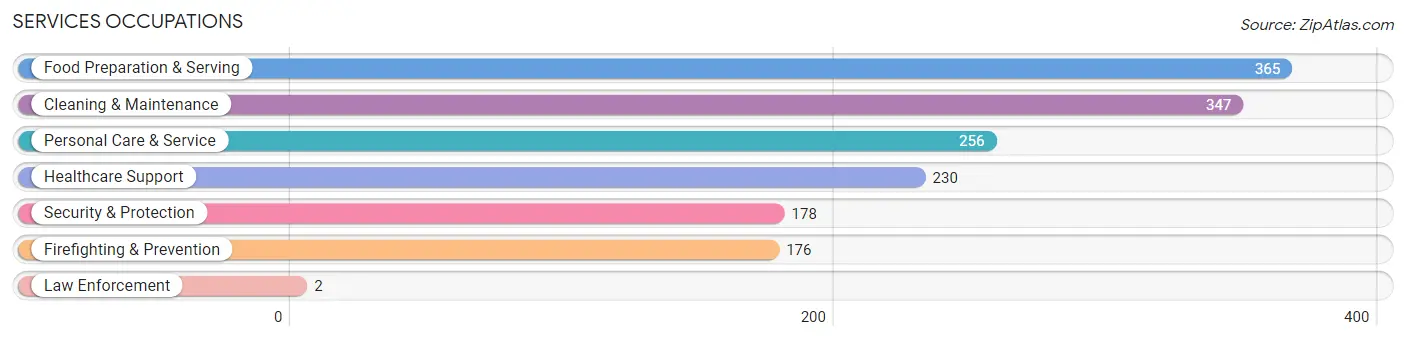
Services Occupations
The most common Services occupations in Simpson County are Food Preparation & Serving (365 | 4.1%), Cleaning & Maintenance (347 | 3.9%), Personal Care & Service (256 | 2.9%), Healthcare Support (230 | 2.6%), and Security & Protection (178 | 2.0%).
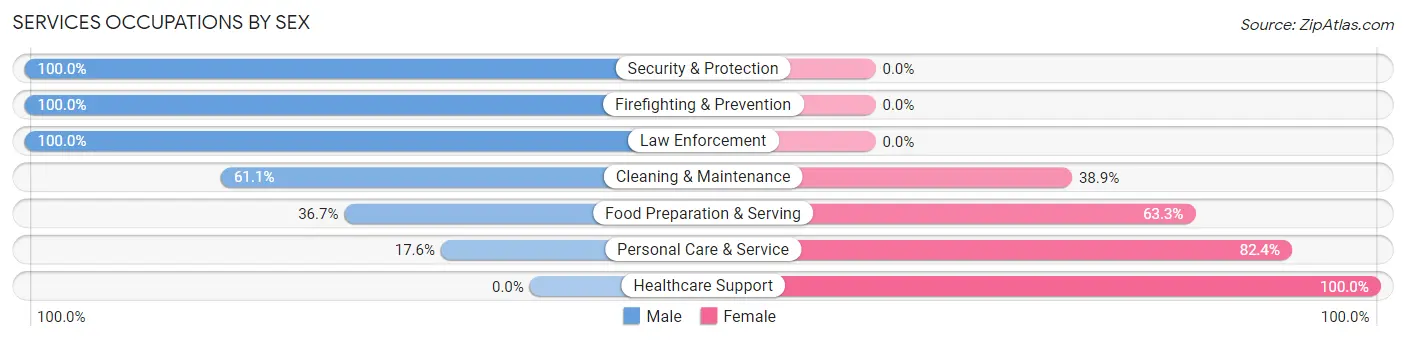
Services Occupations by Sex
Within the Services occupations in Simpson County, the most male-oriented occupations are Security & Protection (100.0%), Firefighting & Prevention (100.0%), and Law Enforcement (100.0%), while the most female-oriented occupations are Healthcare Support (100.0%), Personal Care & Service (82.4%), and Food Preparation & Serving (63.3%).
| Occupation | Male | Female |
| Healthcare Support | 0 (0.0%) | 230 (100.0%) |
| Security & Protection | 178 (100.0%) | 0 (0.0%) |
| Firefighting & Prevention | 176 (100.0%) | 0 (0.0%) |
| Law Enforcement | 2 (100.0%) | 0 (0.0%) |
| Food Preparation & Serving | 134 (36.7%) | 231 (63.3%) |
| Cleaning & Maintenance | 212 (61.1%) | 135 (38.9%) |
| Personal Care & Service | 45 (17.6%) | 211 (82.4%) |
| Total (Category) | 569 (41.3%) | 807 (58.7%) |
| Total (Overall) | 4,793 (53.7%) | 4,133 (46.3%) |
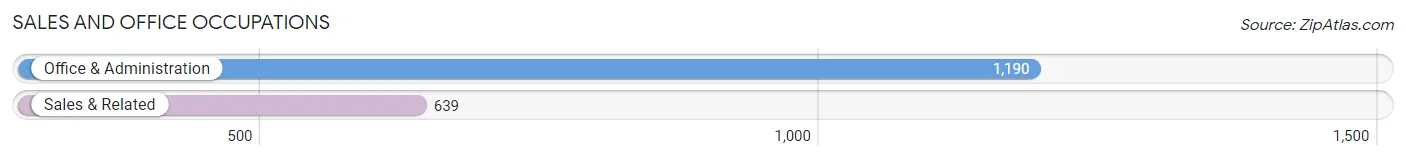
Sales and Office Occupations
The most common Sales and Office occupations in Simpson County are Office & Administration (1,190 | 13.3%), and Sales & Related (639 | 7.2%).
Sales and Office Occupations by Sex
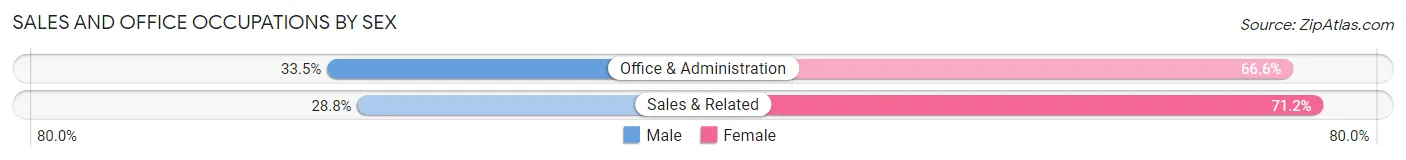
| Occupation | Male | Female |
| Sales & Related | 184 (28.8%) | 455 (71.2%) |
| Office & Administration | 398 (33.5%) | 792 (66.5%) |
| Total (Category) | 582 (31.8%) | 1,247 (68.2%) |
| Total (Overall) | 4,793 (53.7%) | 4,133 (46.3%) |
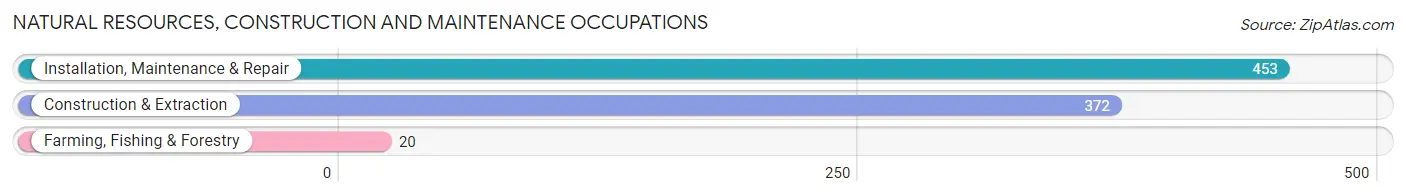
Natural Resources, Construction and Maintenance Occupations
The most common Natural Resources, Construction and Maintenance occupations in Simpson County are Installation, Maintenance & Repair (453 | 5.1%), Construction & Extraction (372 | 4.2%), and Farming, Fishing & Forestry (20 | 0.2%).
Natural Resources, Construction and Maintenance Occupations by Sex
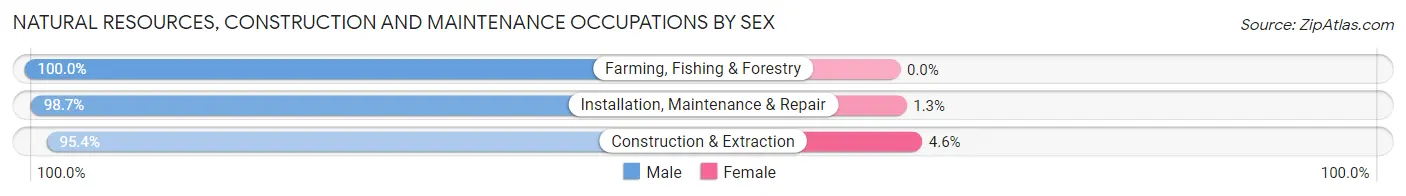
| Occupation | Male | Female |
| Farming, Fishing & Forestry | 20 (100.0%) | 0 (0.0%) |
| Construction & Extraction | 355 (95.4%) | 17 (4.6%) |
| Installation, Maintenance & Repair | 447 (98.7%) | 6 (1.3%) |
| Total (Category) | 822 (97.3%) | 23 (2.7%) |
| Total (Overall) | 4,793 (53.7%) | 4,133 (46.3%) |
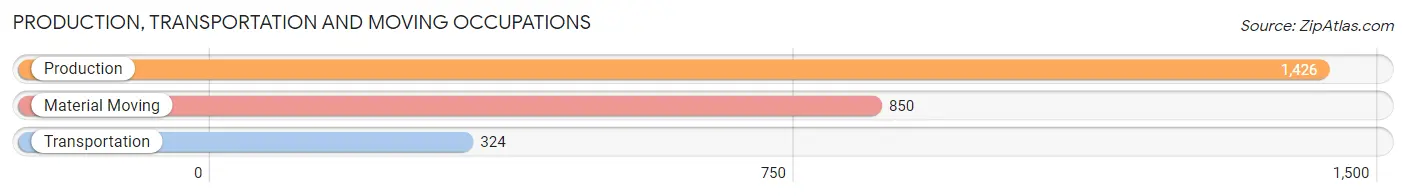
Production, Transportation and Moving Occupations
The most common Production, Transportation and Moving occupations in Simpson County are Production (1,426 | 16.0%), Material Moving (850 | 9.5%), and Transportation (324 | 3.6%).
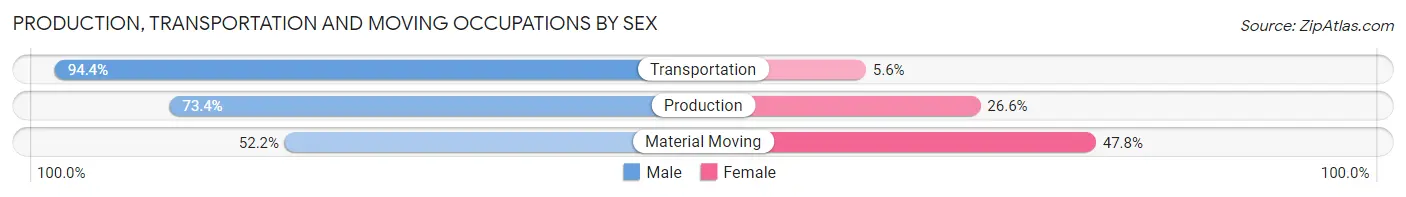
Production, Transportation and Moving Occupations by Sex
| Occupation | Male | Female |
| Production | 1,047 (73.4%) | 379 (26.6%) |
| Transportation | 306 (94.4%) | 18 (5.6%) |
| Material Moving | 444 (52.2%) | 406 (47.8%) |
| Total (Category) | 1,797 (69.1%) | 803 (30.9%) |
| Total (Overall) | 4,793 (53.7%) | 4,133 (46.3%) |
Employment Industries by Sex in Simpson County
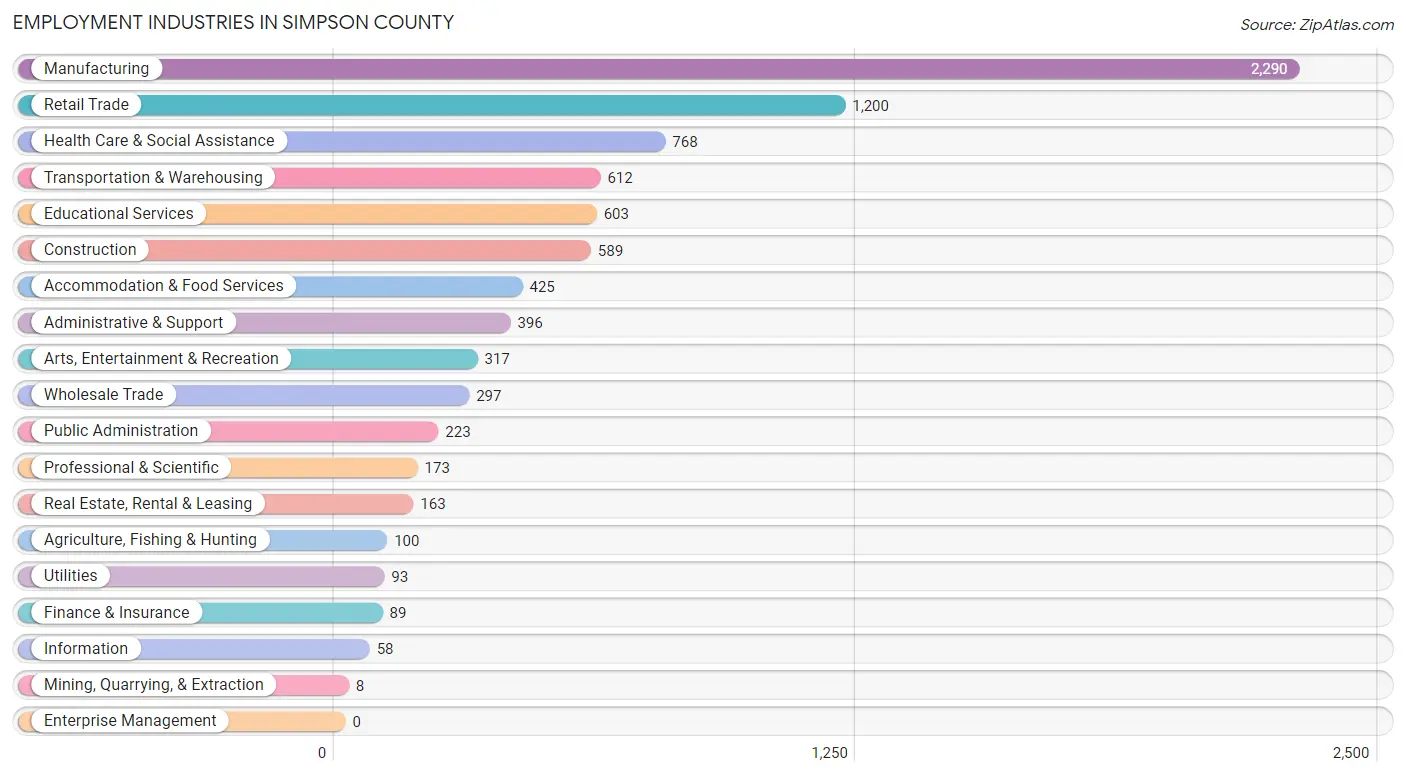
Employment Industries in Simpson County
The major employment industries in Simpson County include Manufacturing (2,290 | 25.7%), Retail Trade (1,200 | 13.4%), Health Care & Social Assistance (768 | 8.6%), Transportation & Warehousing (612 | 6.9%), and Educational Services (603 | 6.8%).
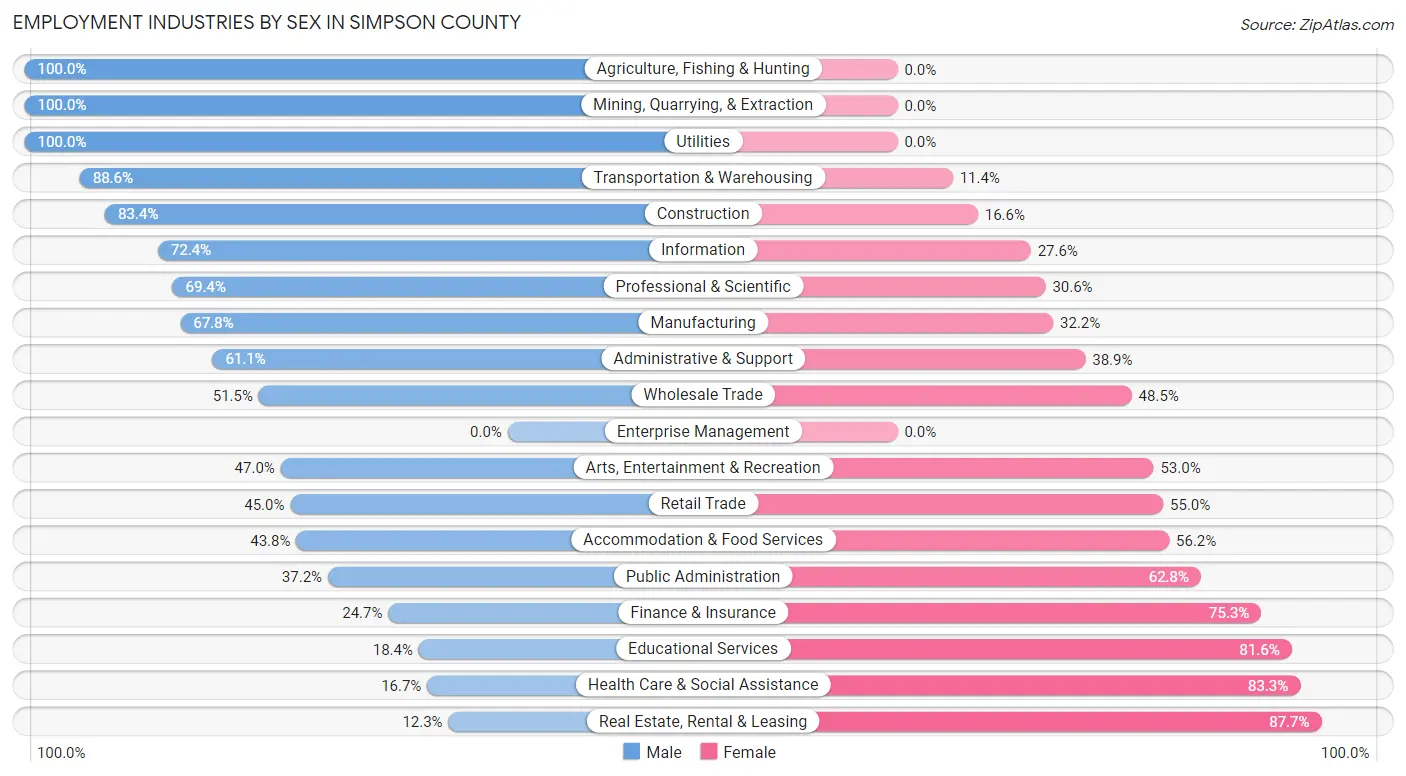
Employment Industries by Sex in Simpson County
The Simpson County industries that see more men than women are Agriculture, Fishing & Hunting (100.0%), Mining, Quarrying, & Extraction (100.0%), and Utilities (100.0%), whereas the industries that tend to have a higher number of women are Real Estate, Rental & Leasing (87.7%), Health Care & Social Assistance (83.3%), and Educational Services (81.6%).
| Industry | Male | Female |
| Agriculture, Fishing & Hunting | 100 (100.0%) | 0 (0.0%) |
| Mining, Quarrying, & Extraction | 8 (100.0%) | 0 (0.0%) |
| Construction | 491 (83.4%) | 98 (16.6%) |
| Manufacturing | 1,552 (67.8%) | 738 (32.2%) |
| Wholesale Trade | 153 (51.5%) | 144 (48.5%) |
| Retail Trade | 540 (45.0%) | 660 (55.0%) |
| Transportation & Warehousing | 542 (88.6%) | 70 (11.4%) |
| Utilities | 93 (100.0%) | 0 (0.0%) |
| Information | 42 (72.4%) | 16 (27.6%) |
| Finance & Insurance | 22 (24.7%) | 67 (75.3%) |
| Real Estate, Rental & Leasing | 20 (12.3%) | 143 (87.7%) |
| Professional & Scientific | 120 (69.4%) | 53 (30.6%) |
| Enterprise Management | 0 (0.0%) | 0 (0.0%) |
| Administrative & Support | 242 (61.1%) | 154 (38.9%) |
| Educational Services | 111 (18.4%) | 492 (81.6%) |
| Health Care & Social Assistance | 128 (16.7%) | 640 (83.3%) |
| Arts, Entertainment & Recreation | 149 (47.0%) | 168 (53.0%) |
| Accommodation & Food Services | 186 (43.8%) | 239 (56.2%) |
| Public Administration | 83 (37.2%) | 140 (62.8%) |
| Total | 4,793 (53.7%) | 4,133 (46.3%) |
Education in Simpson County
School Enrollment in Simpson County
The most common levels of schooling among the 4,015 students in Simpson County are elementary school (1,102 | 27.5%), high school (937 | 23.3%), and middle school (858 | 21.4%).
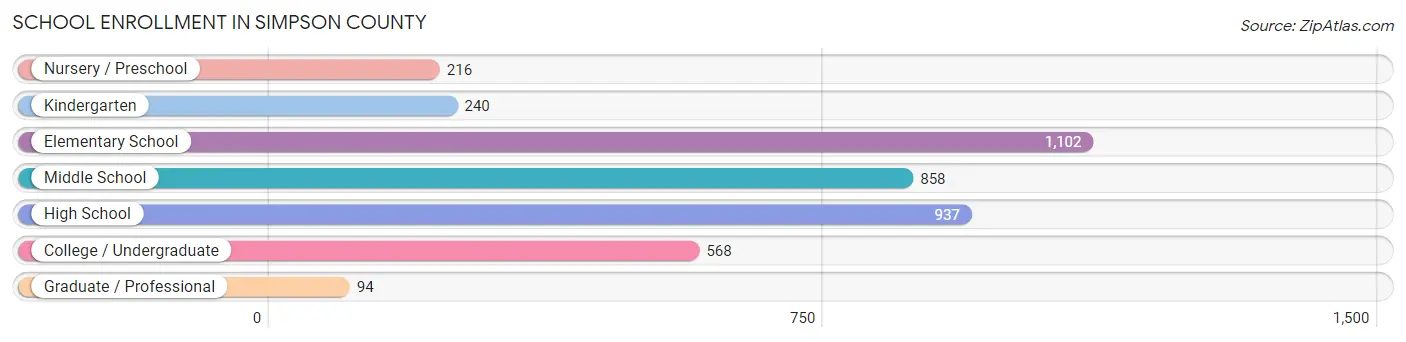
| School Level | # Students | % Students |
| Nursery / Preschool | 216 | 5.4% |
| Kindergarten | 240 | 6.0% |
| Elementary School | 1,102 | 27.5% |
| Middle School | 858 | 21.4% |
| High School | 937 | 23.3% |
| College / Undergraduate | 568 | 14.1% |
| Graduate / Professional | 94 | 2.3% |
| Total | 4,015 | 100.0% |
School Enrollment by Age by Funding Source in Simpson County
Out of a total of 4,015 students who are enrolled in schools in Simpson County, 538 (13.4%) attend a private institution, while the remaining 3,477 (86.6%) are enrolled in public schools. The age group of 35 years and over has the highest likelihood of being enrolled in private schools, with 63 (56.2% in the age bracket) enrolled. Conversely, the age group of 3 to 4 year olds has the lowest likelihood of being enrolled in a private school, with 133 (100.0% in the age bracket) attending a public institution.
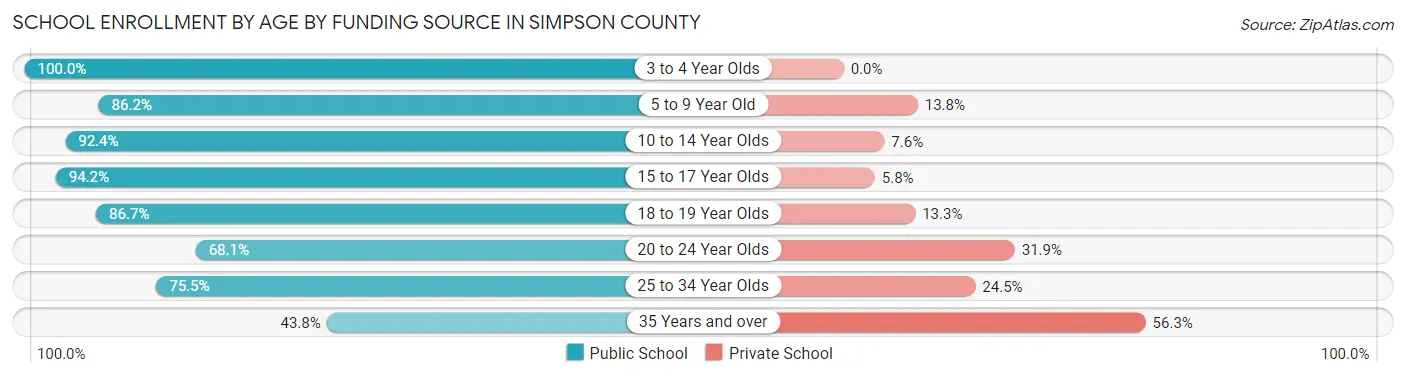
| Age Bracket | Public School | Private School |
| 3 to 4 Year Olds | 133 (100.0%) | 0 (0.0%) |
| 5 to 9 Year Old | 1,218 (86.2%) | 195 (13.8%) |
| 10 to 14 Year Olds | 986 (92.4%) | 81 (7.6%) |
| 15 to 17 Year Olds | 503 (94.2%) | 31 (5.8%) |
| 18 to 19 Year Olds | 234 (86.7%) | 36 (13.3%) |
| 20 to 24 Year Olds | 109 (68.1%) | 51 (31.9%) |
| 25 to 34 Year Olds | 246 (75.5%) | 80 (24.5%) |
| 35 Years and over | 49 (43.8%) | 63 (56.2%) |
| Total | 3,477 (86.6%) | 538 (13.4%) |
Educational Attainment by Field of Study in Simpson County
Education (386 | 17.8%), business (346 | 16.0%), bio, nature & agricultural (234 | 10.8%), science & technology (216 | 10.0%), and liberal arts & history (207 | 9.6%) are the most common fields of study among 2,165 individuals in Simpson County who have obtained a bachelor's degree or higher.
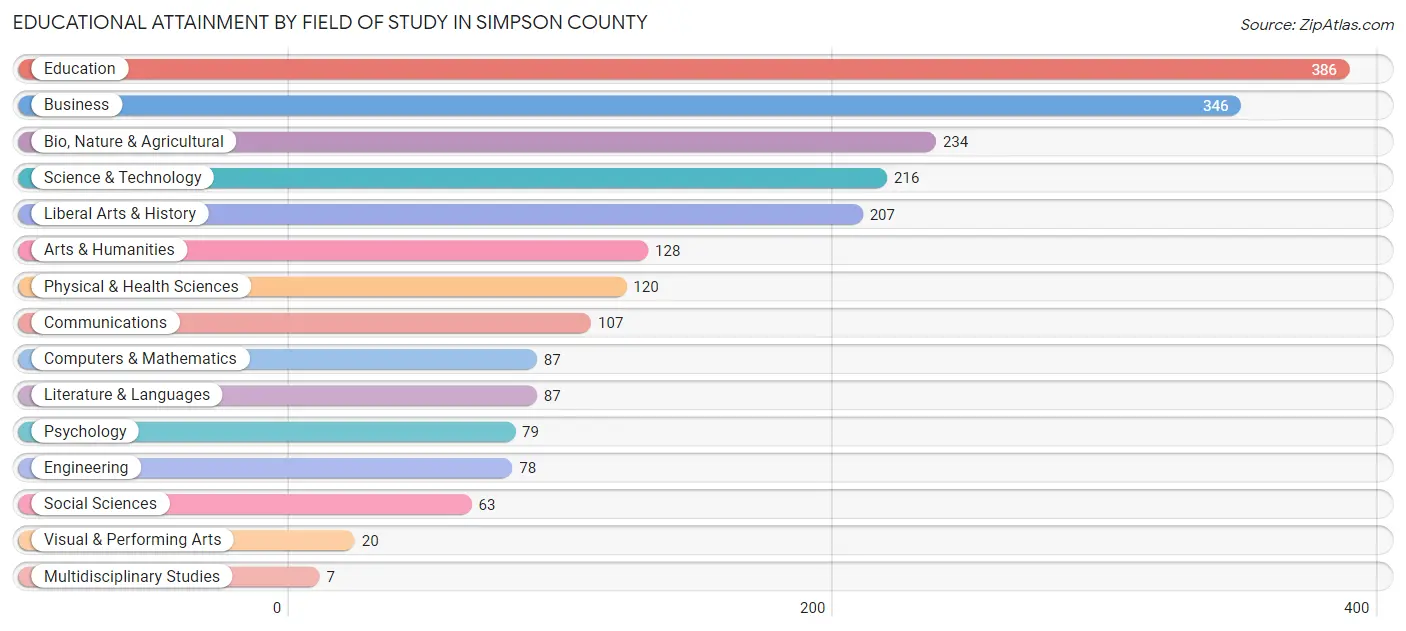
| Field of Study | # Graduates | % Graduates |
| Computers & Mathematics | 87 | 4.0% |
| Bio, Nature & Agricultural | 234 | 10.8% |
| Physical & Health Sciences | 120 | 5.5% |
| Psychology | 79 | 3.6% |
| Social Sciences | 63 | 2.9% |
| Engineering | 78 | 3.6% |
| Multidisciplinary Studies | 7 | 0.3% |
| Science & Technology | 216 | 10.0% |
| Business | 346 | 16.0% |
| Education | 386 | 17.8% |
| Literature & Languages | 87 | 4.0% |
| Liberal Arts & History | 207 | 9.6% |
| Visual & Performing Arts | 20 | 0.9% |
| Communications | 107 | 4.9% |
| Arts & Humanities | 128 | 5.9% |
| Total | 2,165 | 100.0% |
Transportation & Commute in Simpson County
Vehicle Availability by Sex in Simpson County
The most prevalent vehicle ownership categories in Simpson County are males with 2 vehicles (2,163, accounting for 45.7%) and females with 2 vehicles (1,513, making up 54.4%).
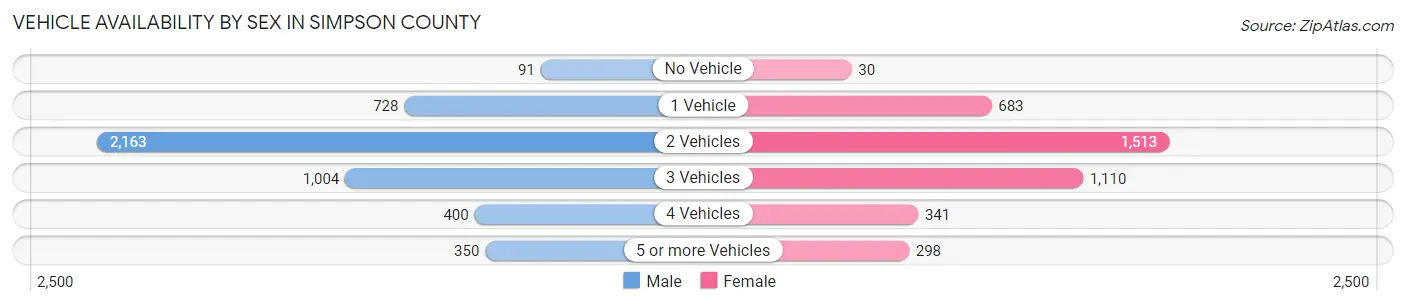
| Vehicles Available | Male | Female |
| No Vehicle | 91 (1.9%) | 30 (0.7%) |
| 1 Vehicle | 728 (15.4%) | 683 (17.2%) |
| 2 Vehicles | 2,163 (45.7%) | 1,513 (38.1%) |
| 3 Vehicles | 1,004 (21.2%) | 1,110 (27.9%) |
| 4 Vehicles | 400 (8.5%) | 341 (8.6%) |
| 5 or more Vehicles | 350 (7.4%) | 298 (7.5%) |
| Total | 4,736 (100.0%) | 3,975 (100.0%) |
Commute Time in Simpson County
The most frequently occuring commute durations in Simpson County are 10 to 14 minutes (1,731 commuters, 20.7%), 15 to 19 minutes (1,274 commuters, 15.2%), and 20 to 24 minutes (1,172 commuters, 14.0%).
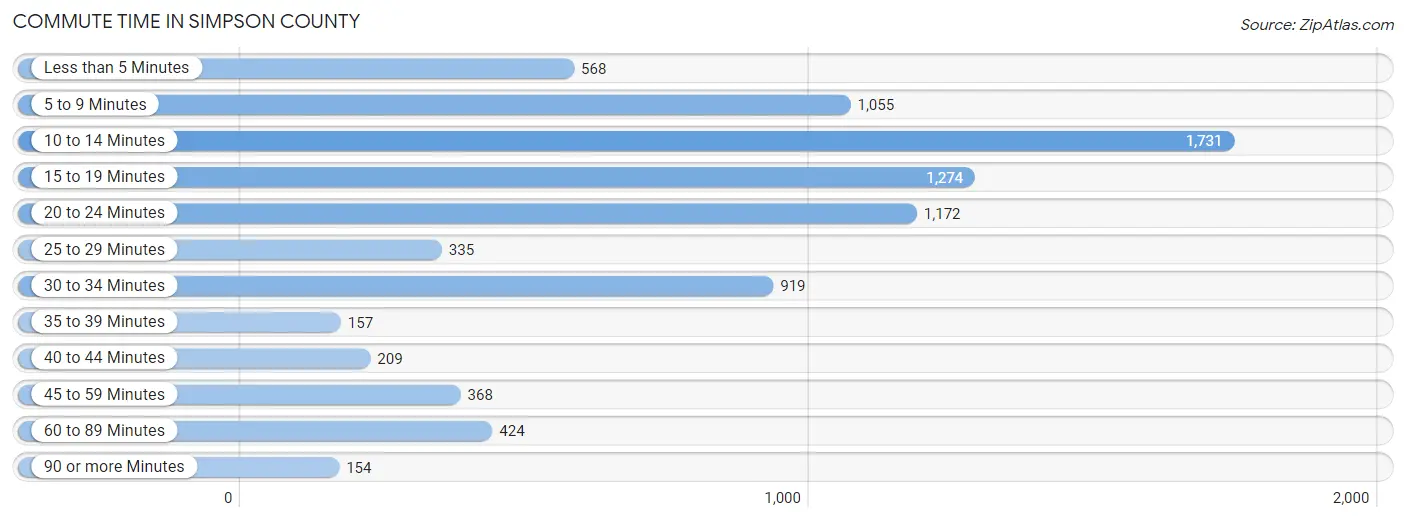
| Commute Time | # Commuters | % Commuters |
| Less than 5 Minutes | 568 | 6.8% |
| 5 to 9 Minutes | 1,055 | 12.6% |
| 10 to 14 Minutes | 1,731 | 20.7% |
| 15 to 19 Minutes | 1,274 | 15.2% |
| 20 to 24 Minutes | 1,172 | 14.0% |
| 25 to 29 Minutes | 335 | 4.0% |
| 30 to 34 Minutes | 919 | 11.0% |
| 35 to 39 Minutes | 157 | 1.9% |
| 40 to 44 Minutes | 209 | 2.5% |
| 45 to 59 Minutes | 368 | 4.4% |
| 60 to 89 Minutes | 424 | 5.1% |
| 90 or more Minutes | 154 | 1.8% |
Commute Time by Sex in Simpson County
The most common commute times in Simpson County are 15 to 19 minutes (901 commuters, 19.6%) for males and 10 to 14 minutes (878 commuters, 23.3%) for females.
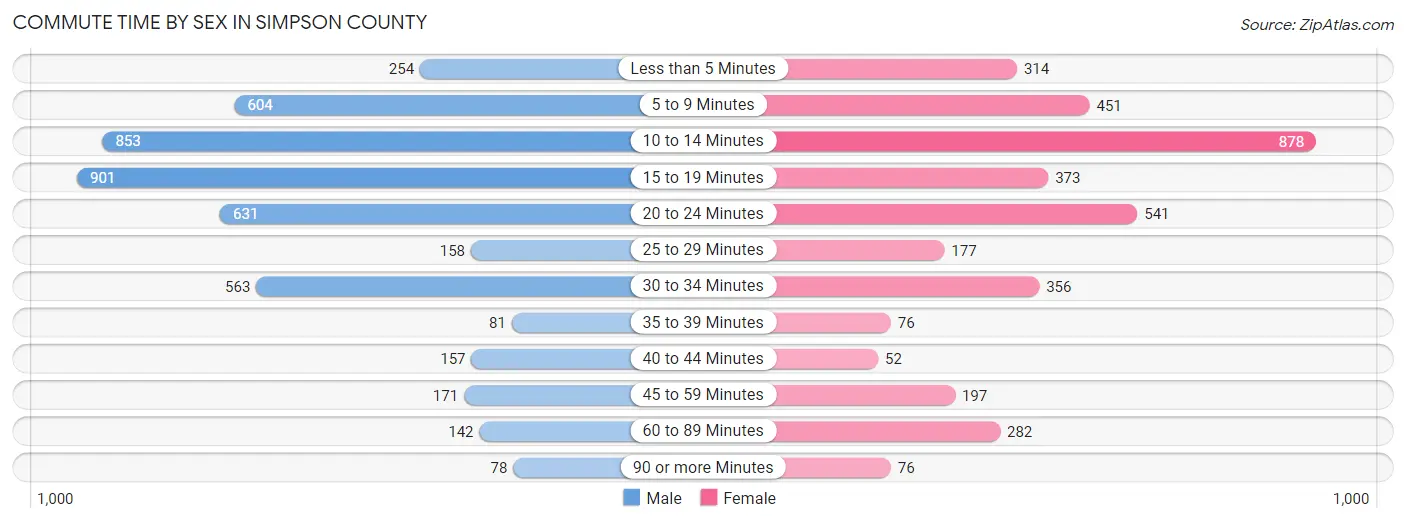
| Commute Time | Male | Female |
| Less than 5 Minutes | 254 (5.5%) | 314 (8.3%) |
| 5 to 9 Minutes | 604 (13.2%) | 451 (11.9%) |
| 10 to 14 Minutes | 853 (18.6%) | 878 (23.3%) |
| 15 to 19 Minutes | 901 (19.6%) | 373 (9.9%) |
| 20 to 24 Minutes | 631 (13.7%) | 541 (14.3%) |
| 25 to 29 Minutes | 158 (3.4%) | 177 (4.7%) |
| 30 to 34 Minutes | 563 (12.3%) | 356 (9.4%) |
| 35 to 39 Minutes | 81 (1.8%) | 76 (2.0%) |
| 40 to 44 Minutes | 157 (3.4%) | 52 (1.4%) |
| 45 to 59 Minutes | 171 (3.7%) | 197 (5.2%) |
| 60 to 89 Minutes | 142 (3.1%) | 282 (7.5%) |
| 90 or more Minutes | 78 (1.7%) | 76 (2.0%) |
Time of Departure to Work by Sex in Simpson County
The most frequent times of departure to work in Simpson County are 6:30 AM to 6:59 AM (624, 13.6%) for males and 6:30 AM to 6:59 AM (645, 17.1%) for females.
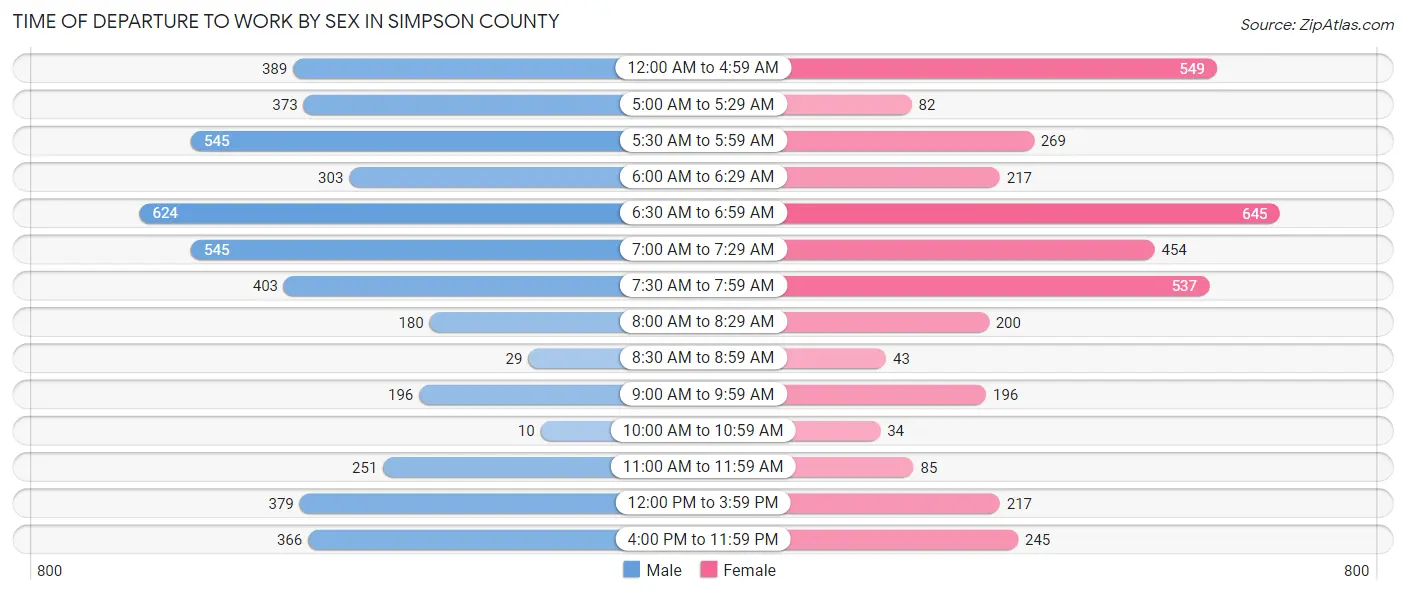
| Time of Departure | Male | Female |
| 12:00 AM to 4:59 AM | 389 (8.5%) | 549 (14.5%) |
| 5:00 AM to 5:29 AM | 373 (8.1%) | 82 (2.2%) |
| 5:30 AM to 5:59 AM | 545 (11.9%) | 269 (7.1%) |
| 6:00 AM to 6:29 AM | 303 (6.6%) | 217 (5.8%) |
| 6:30 AM to 6:59 AM | 624 (13.6%) | 645 (17.1%) |
| 7:00 AM to 7:29 AM | 545 (11.9%) | 454 (12.0%) |
| 7:30 AM to 7:59 AM | 403 (8.8%) | 537 (14.2%) |
| 8:00 AM to 8:29 AM | 180 (3.9%) | 200 (5.3%) |
| 8:30 AM to 8:59 AM | 29 (0.6%) | 43 (1.1%) |
| 9:00 AM to 9:59 AM | 196 (4.3%) | 196 (5.2%) |
| 10:00 AM to 10:59 AM | 10 (0.2%) | 34 (0.9%) |
| 11:00 AM to 11:59 AM | 251 (5.5%) | 85 (2.2%) |
| 12:00 PM to 3:59 PM | 379 (8.3%) | 217 (5.8%) |
| 4:00 PM to 11:59 PM | 366 (8.0%) | 245 (6.5%) |
| Total | 4,593 (100.0%) | 3,773 (100.0%) |
Housing Occupancy in Simpson County
Occupancy by Ownership in Simpson County
Of the total 7,530 dwellings in Simpson County, owner-occupied units account for 4,946 (65.7%), while renter-occupied units make up 2,584 (34.3%).
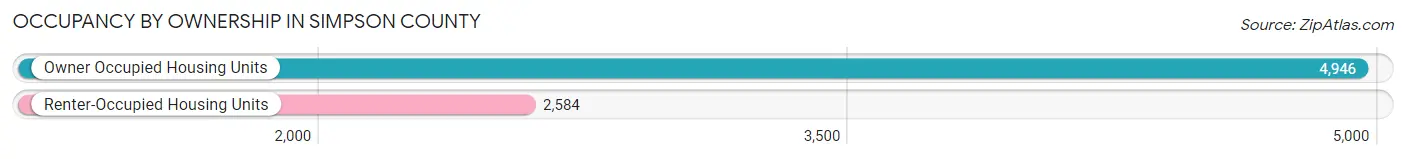
| Occupancy | # Housing Units | % Housing Units |
| Owner Occupied Housing Units | 4,946 | 65.7% |
| Renter-Occupied Housing Units | 2,584 | 34.3% |
| Total Occupied Housing Units | 7,530 | 100.0% |
Occupancy by Household Size in Simpson County
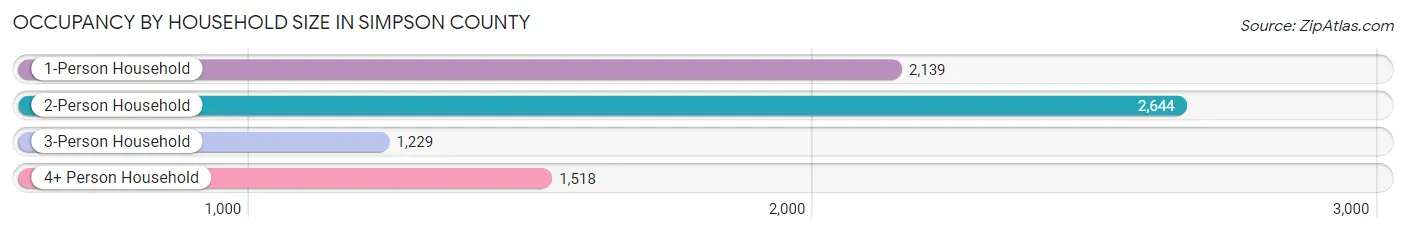
| Household Size | # Housing Units | % Housing Units |
| 1-Person Household | 2,139 | 28.4% |
| 2-Person Household | 2,644 | 35.1% |
| 3-Person Household | 1,229 | 16.3% |
| 4+ Person Household | 1,518 | 20.2% |
| Total Housing Units | 7,530 | 100.0% |
Occupancy by Ownership by Household Size in Simpson County
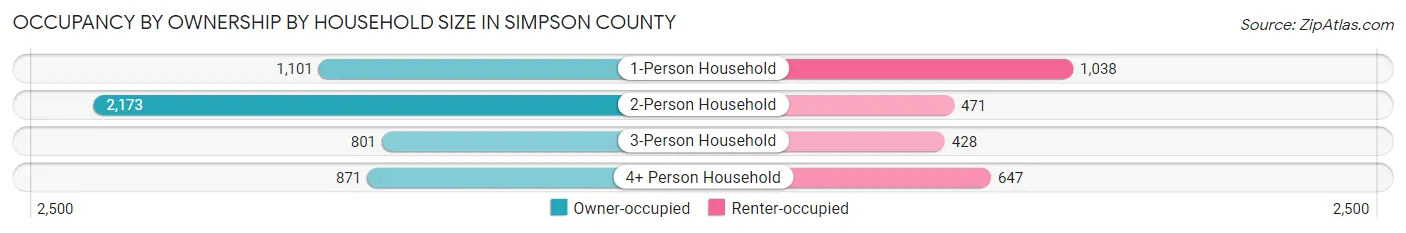
| Household Size | Owner-occupied | Renter-occupied |
| 1-Person Household | 1,101 (51.5%) | 1,038 (48.5%) |
| 2-Person Household | 2,173 (82.2%) | 471 (17.8%) |
| 3-Person Household | 801 (65.2%) | 428 (34.8%) |
| 4+ Person Household | 871 (57.4%) | 647 (42.6%) |
| Total Housing Units | 4,946 (65.7%) | 2,584 (34.3%) |
Occupancy by Educational Attainment in Simpson County
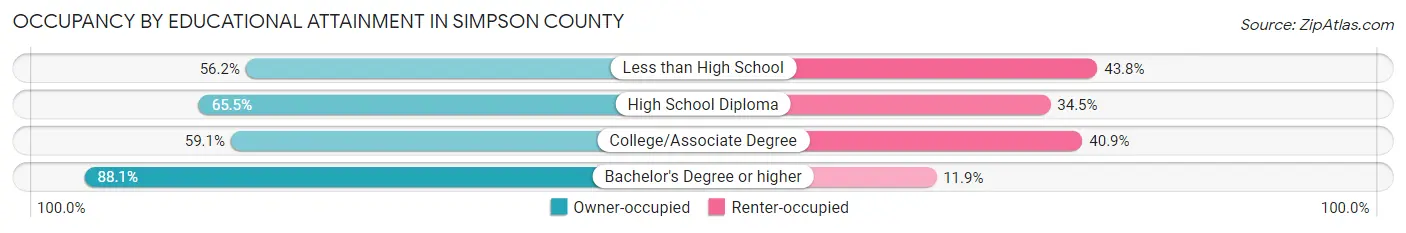
| Household Size | Owner-occupied | Renter-occupied |
| Less than High School | 383 (56.2%) | 299 (43.8%) |
| High School Diploma | 2,070 (65.5%) | 1,092 (34.5%) |
| College/Associate Degree | 1,539 (59.1%) | 1,064 (40.9%) |
| Bachelor's Degree or higher | 954 (88.1%) | 129 (11.9%) |
Occupancy by Age of Householder in Simpson County
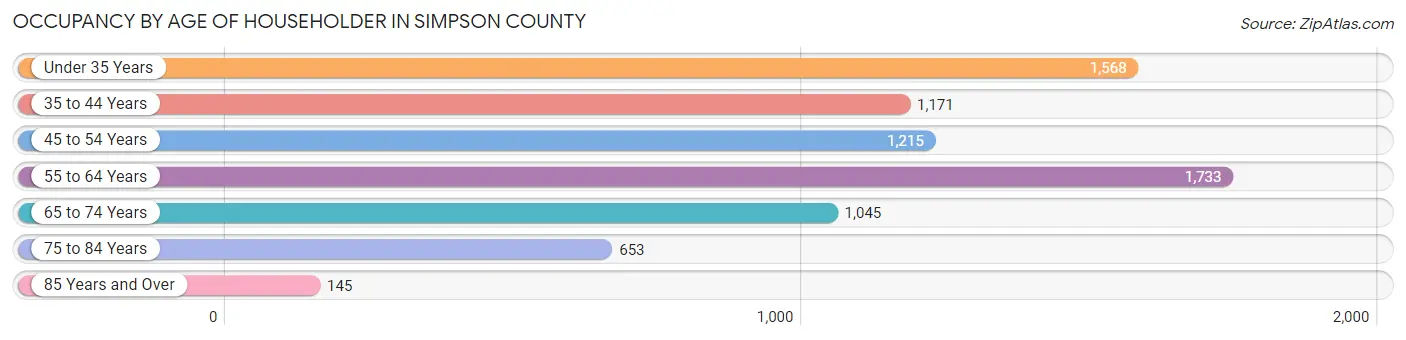
| Age Bracket | # Households | % Households |
| Under 35 Years | 1,568 | 20.8% |
| 35 to 44 Years | 1,171 | 15.5% |
| 45 to 54 Years | 1,215 | 16.1% |
| 55 to 64 Years | 1,733 | 23.0% |
| 65 to 74 Years | 1,045 | 13.9% |
| 75 to 84 Years | 653 | 8.7% |
| 85 Years and Over | 145 | 1.9% |
| Total | 7,530 | 100.0% |
Housing Finances in Simpson County
Median Income by Occupancy in Simpson County
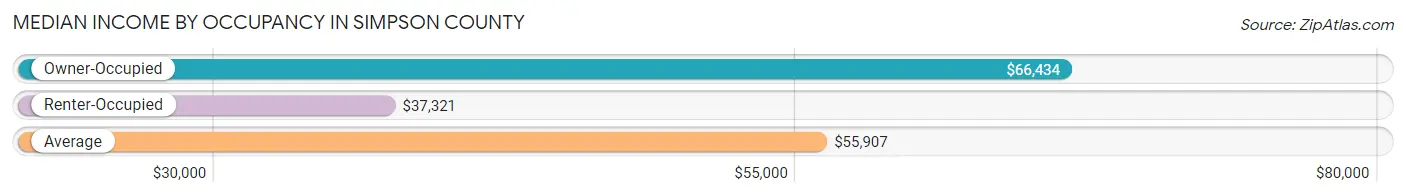
| Occupancy Type | # Households | Median Income |
| Owner-Occupied | 4,946 (65.7%) | $66,434 |
| Renter-Occupied | 2,584 (34.3%) | $37,321 |
| Average | 7,530 (100.0%) | $55,907 |
Occupancy by Householder Income Bracket in Simpson County
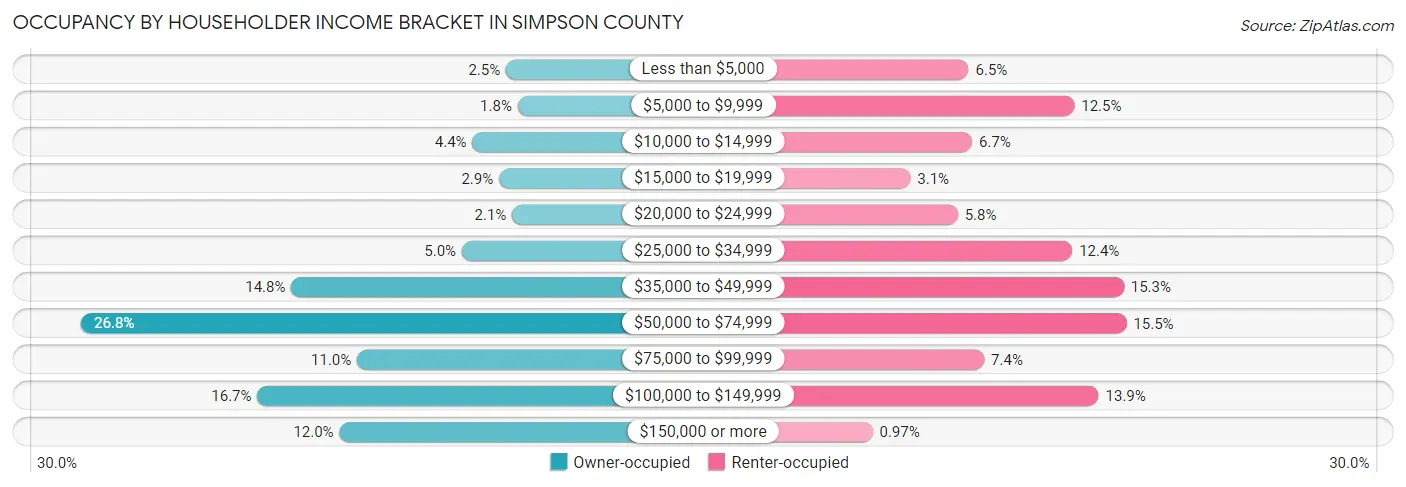
| Income Bracket | Owner-occupied | Renter-occupied |
| Less than $5,000 | 123 (2.5%) | 167 (6.5%) |
| $5,000 to $9,999 | 90 (1.8%) | 323 (12.5%) |
| $10,000 to $14,999 | 218 (4.4%) | 172 (6.7%) |
| $15,000 to $19,999 | 143 (2.9%) | 81 (3.1%) |
| $20,000 to $24,999 | 106 (2.1%) | 151 (5.8%) |
| $25,000 to $34,999 | 248 (5.0%) | 320 (12.4%) |
| $35,000 to $49,999 | 730 (14.8%) | 396 (15.3%) |
| $50,000 to $74,999 | 1,324 (26.8%) | 400 (15.5%) |
| $75,000 to $99,999 | 544 (11.0%) | 190 (7.3%) |
| $100,000 to $149,999 | 826 (16.7%) | 359 (13.9%) |
| $150,000 or more | 594 (12.0%) | 25 (1.0%) |
| Total | 4,946 (100.0%) | 2,584 (100.0%) |
Monthly Housing Cost Tiers in Simpson County
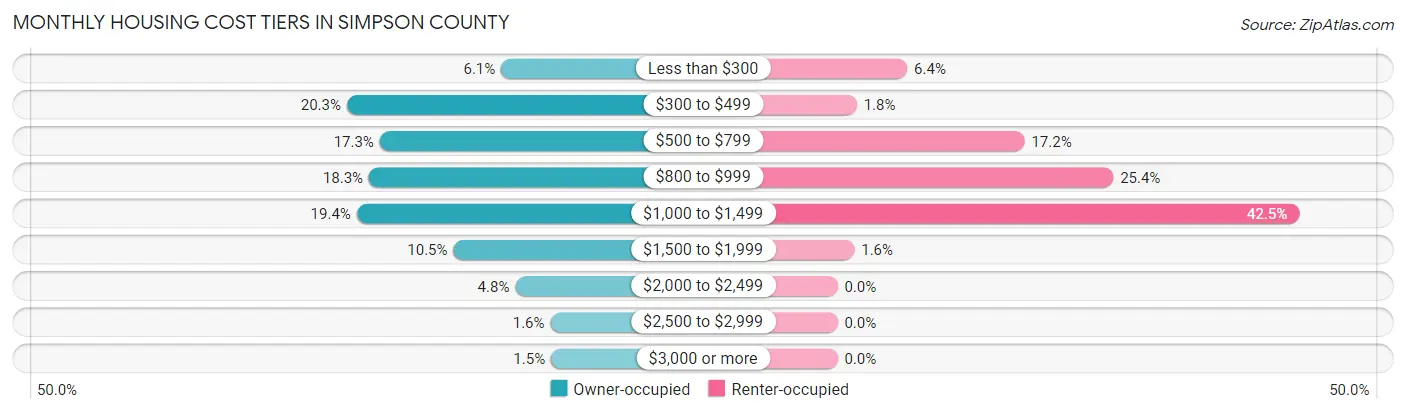
| Monthly Cost | Owner-occupied | Renter-occupied |
| Less than $300 | 303 (6.1%) | 166 (6.4%) |
| $300 to $499 | 1,006 (20.3%) | 46 (1.8%) |
| $500 to $799 | 856 (17.3%) | 445 (17.2%) |
| $800 to $999 | 905 (18.3%) | 656 (25.4%) |
| $1,000 to $1,499 | 961 (19.4%) | 1,098 (42.5%) |
| $1,500 to $1,999 | 521 (10.5%) | 40 (1.5%) |
| $2,000 to $2,499 | 239 (4.8%) | 0 (0.0%) |
| $2,500 to $2,999 | 79 (1.6%) | 0 (0.0%) |
| $3,000 or more | 76 (1.5%) | 0 (0.0%) |
| Total | 4,946 (100.0%) | 2,584 (100.0%) |
Physical Housing Characteristics in Simpson County
Housing Structures in Simpson County
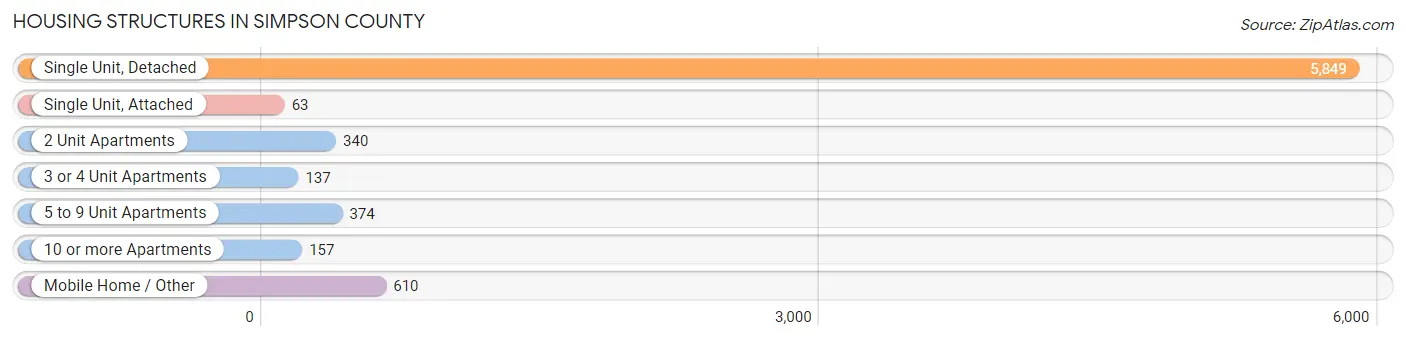
| Structure Type | # Housing Units | % Housing Units |
| Single Unit, Detached | 5,849 | 77.7% |
| Single Unit, Attached | 63 | 0.8% |
| 2 Unit Apartments | 340 | 4.5% |
| 3 or 4 Unit Apartments | 137 | 1.8% |
| 5 to 9 Unit Apartments | 374 | 5.0% |
| 10 or more Apartments | 157 | 2.1% |
| Mobile Home / Other | 610 | 8.1% |
| Total | 7,530 | 100.0% |
Housing Structures by Occupancy in Simpson County
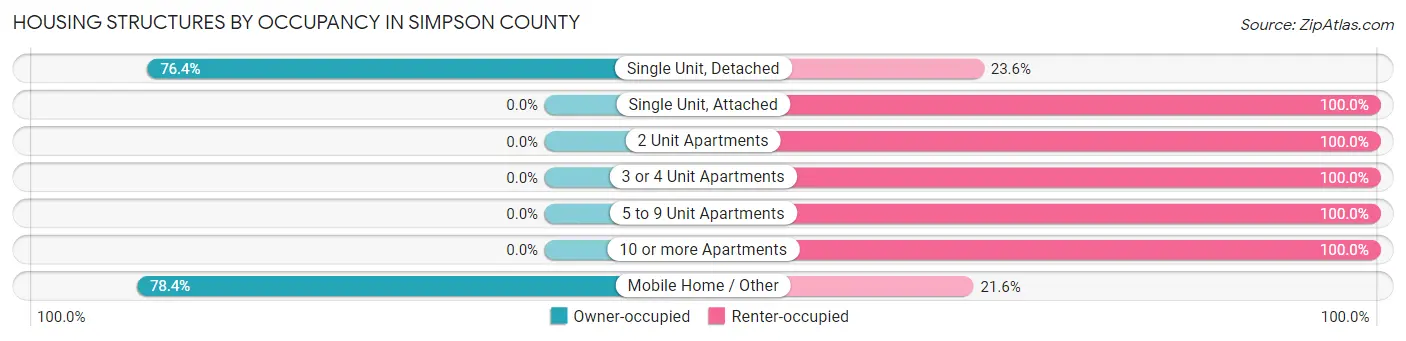
| Structure Type | Owner-occupied | Renter-occupied |
| Single Unit, Detached | 4,468 (76.4%) | 1,381 (23.6%) |
| Single Unit, Attached | 0 (0.0%) | 63 (100.0%) |
| 2 Unit Apartments | 0 (0.0%) | 340 (100.0%) |
| 3 or 4 Unit Apartments | 0 (0.0%) | 137 (100.0%) |
| 5 to 9 Unit Apartments | 0 (0.0%) | 374 (100.0%) |
| 10 or more Apartments | 0 (0.0%) | 157 (100.0%) |
| Mobile Home / Other | 478 (78.4%) | 132 (21.6%) |
| Total | 4,946 (65.7%) | 2,584 (34.3%) |
Housing Structures by Number of Rooms in Simpson County
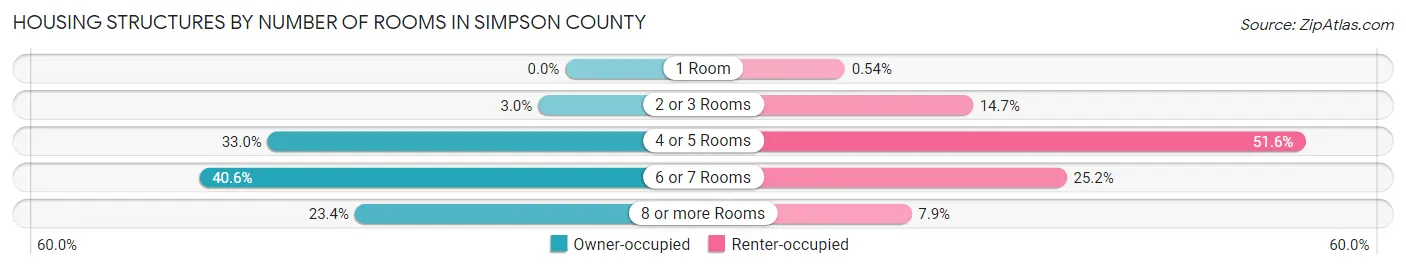
| Number of Rooms | Owner-occupied | Renter-occupied |
| 1 Room | 0 (0.0%) | 14 (0.5%) |
| 2 or 3 Rooms | 149 (3.0%) | 381 (14.7%) |
| 4 or 5 Rooms | 1,633 (33.0%) | 1,334 (51.6%) |
| 6 or 7 Rooms | 2,009 (40.6%) | 650 (25.2%) |
| 8 or more Rooms | 1,155 (23.4%) | 205 (7.9%) |
| Total | 4,946 (100.0%) | 2,584 (100.0%) |
Housing Structure by Heating Type in Simpson County
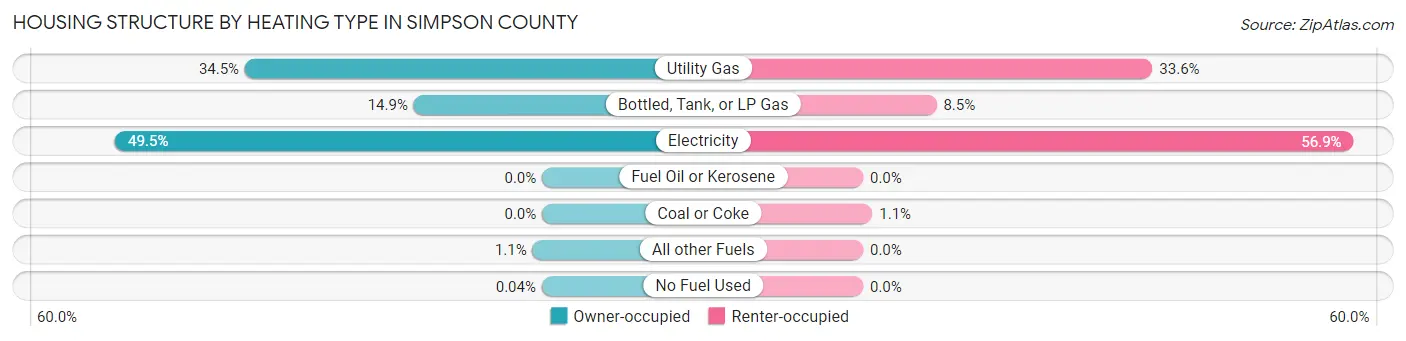
| Heating Type | Owner-occupied | Renter-occupied |
| Utility Gas | 1,704 (34.4%) | 867 (33.6%) |
| Bottled, Tank, or LP Gas | 736 (14.9%) | 220 (8.5%) |
| Electricity | 2,449 (49.5%) | 1,469 (56.9%) |
| Fuel Oil or Kerosene | 0 (0.0%) | 0 (0.0%) |
| Coal or Coke | 0 (0.0%) | 28 (1.1%) |
| All other Fuels | 55 (1.1%) | 0 (0.0%) |
| No Fuel Used | 2 (0.0%) | 0 (0.0%) |
| Total | 4,946 (100.0%) | 2,584 (100.0%) |
Household Vehicle Usage in Simpson County
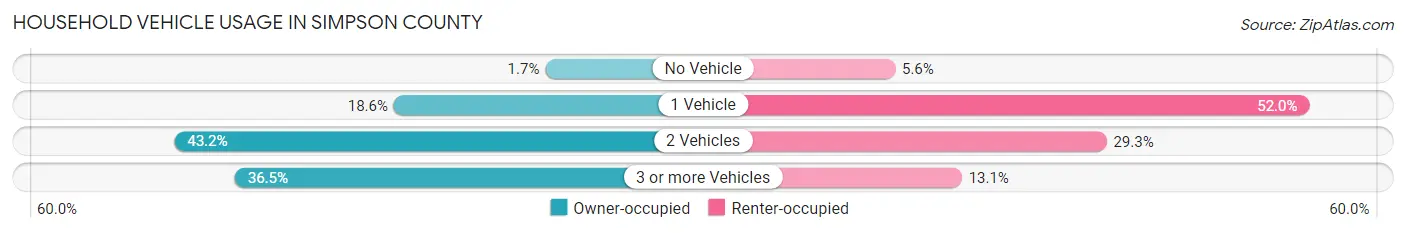
| Vehicles per Household | Owner-occupied | Renter-occupied |
| No Vehicle | 83 (1.7%) | 145 (5.6%) |
| 1 Vehicle | 922 (18.6%) | 1,344 (52.0%) |
| 2 Vehicles | 2,138 (43.2%) | 757 (29.3%) |
| 3 or more Vehicles | 1,803 (36.4%) | 338 (13.1%) |
| Total | 4,946 (100.0%) | 2,584 (100.0%) |
Real Estate & Mortgages in Simpson County
Real Estate and Mortgage Overview in Simpson County
| Characteristic | Without Mortgage | With Mortgage |
| Housing Units | 2,147 | 2,799 |
| Median Property Value | $160,900 | $201,300 |
| Median Household Income | $48,607 | $493 |
| Monthly Housing Costs | $459 | $76 |
| Real Estate Taxes | $1,053 | $81 |
Property Value by Mortgage Status in Simpson County
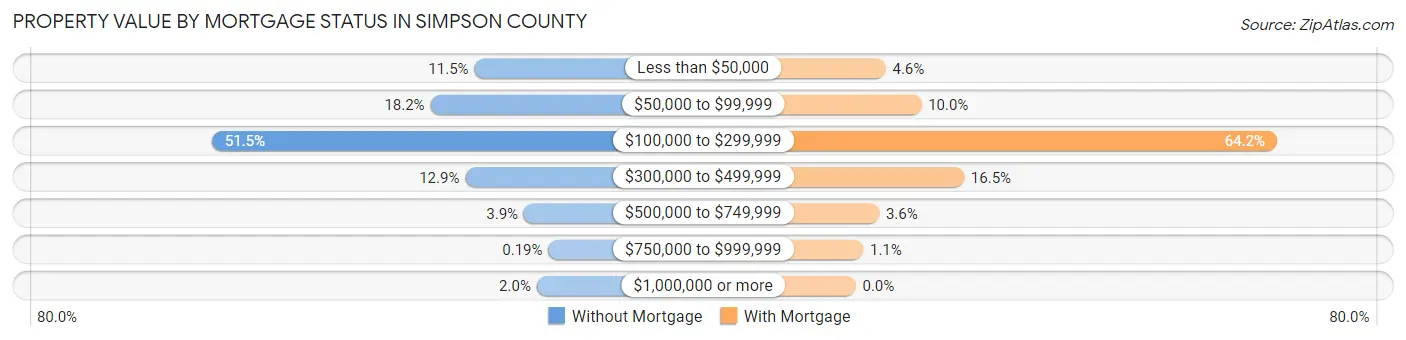
| Property Value | Without Mortgage | With Mortgage |
| Less than $50,000 | 246 (11.5%) | 128 (4.6%) |
| $50,000 to $99,999 | 390 (18.2%) | 280 (10.0%) |
| $100,000 to $299,999 | 1,105 (51.5%) | 1,797 (64.2%) |
| $300,000 to $499,999 | 276 (12.9%) | 462 (16.5%) |
| $500,000 to $749,999 | 84 (3.9%) | 100 (3.6%) |
| $750,000 to $999,999 | 4 (0.2%) | 32 (1.1%) |
| $1,000,000 or more | 42 (2.0%) | 0 (0.0%) |
| Total | 2,147 (100.0%) | 2,799 (100.0%) |
Household Income by Mortgage Status in Simpson County
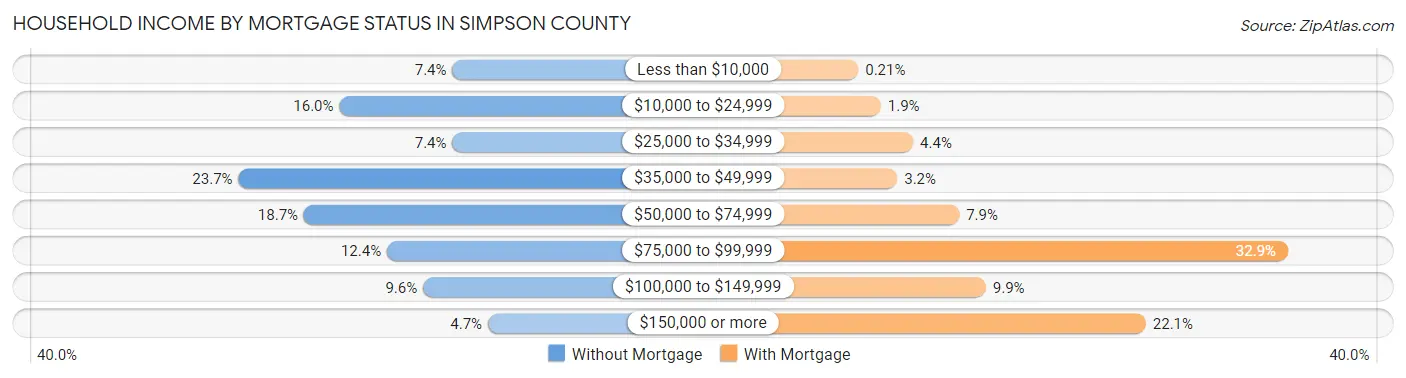
| Household Income | Without Mortgage | With Mortgage |
| Less than $10,000 | 159 (7.4%) | 6 (0.2%) |
| $10,000 to $24,999 | 344 (16.0%) | 54 (1.9%) |
| $25,000 to $34,999 | 159 (7.4%) | 123 (4.4%) |
| $35,000 to $49,999 | 509 (23.7%) | 89 (3.2%) |
| $50,000 to $74,999 | 402 (18.7%) | 221 (7.9%) |
| $75,000 to $99,999 | 266 (12.4%) | 922 (32.9%) |
| $100,000 to $149,999 | 207 (9.6%) | 278 (9.9%) |
| $150,000 or more | 101 (4.7%) | 619 (22.1%) |
| Total | 2,147 (100.0%) | 2,799 (100.0%) |
Property Value to Household Income Ratio in Simpson County
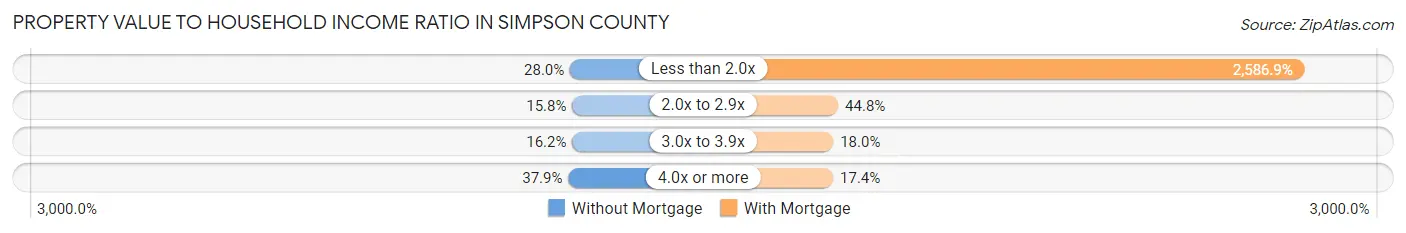
| Value-to-Income Ratio | Without Mortgage | With Mortgage |
| Less than 2.0x | 600 (28.0%) | 72,406 (2,586.9%) |
| 2.0x to 2.9x | 339 (15.8%) | 1,255 (44.8%) |
| 3.0x to 3.9x | 347 (16.2%) | 505 (18.0%) |
| 4.0x or more | 813 (37.9%) | 486 (17.4%) |
| Total | 2,147 (100.0%) | 2,799 (100.0%) |
Real Estate Taxes by Mortgage Status in Simpson County
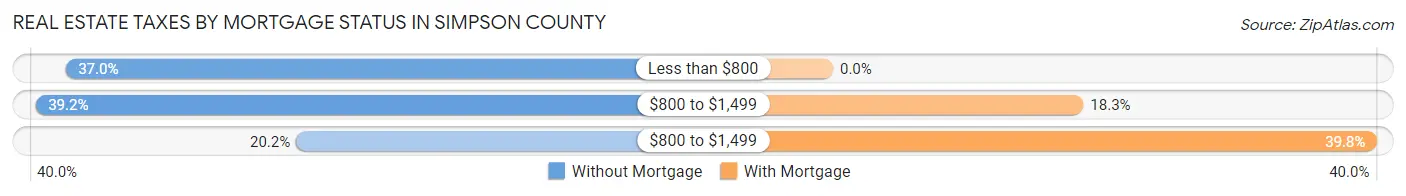
| Property Taxes | Without Mortgage | With Mortgage |
| Less than $800 | 795 (37.0%) | 0 (0.0%) |
| $800 to $1,499 | 842 (39.2%) | 512 (18.3%) |
| $800 to $1,499 | 433 (20.2%) | 1,113 (39.8%) |
| Total | 2,147 (100.0%) | 2,799 (100.0%) |
Health & Disability in Simpson County
Health Insurance Coverage by Age in Simpson County
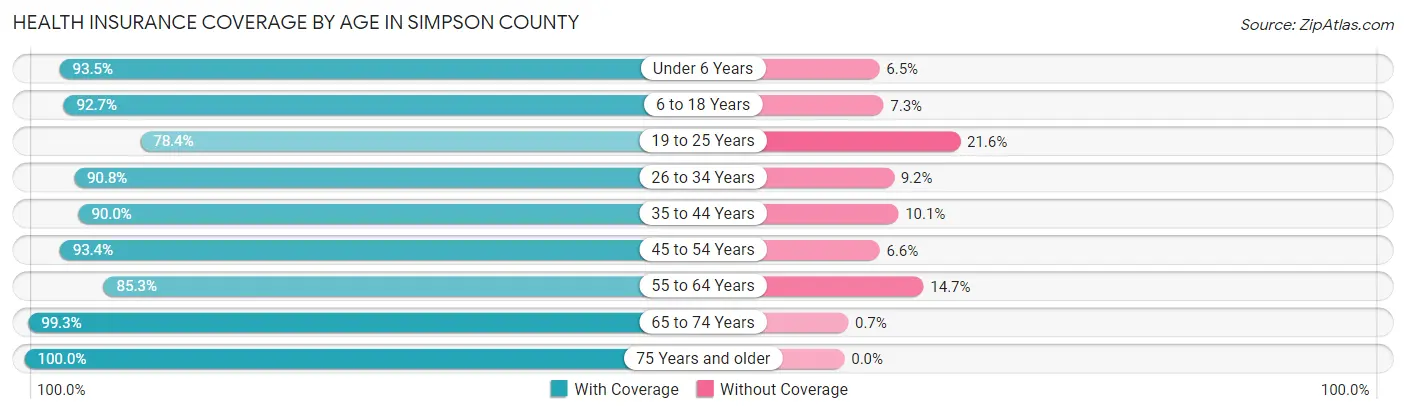
| Age Bracket | With Coverage | Without Coverage |
| Under 6 Years | 1,372 (93.5%) | 96 (6.5%) |
| 6 to 18 Years | 3,005 (92.7%) | 236 (7.3%) |
| 19 to 25 Years | 1,530 (78.4%) | 421 (21.6%) |
| 26 to 34 Years | 1,972 (90.8%) | 200 (9.2%) |
| 35 to 44 Years | 2,040 (89.9%) | 228 (10.1%) |
| 45 to 54 Years | 2,091 (93.4%) | 147 (6.6%) |
| 55 to 64 Years | 2,423 (85.3%) | 419 (14.7%) |
| 65 to 74 Years | 1,856 (99.3%) | 13 (0.7%) |
| 75 Years and older | 1,152 (100.0%) | 0 (0.0%) |
| Total | 17,441 (90.8%) | 1,760 (9.2%) |
Health Insurance Coverage by Citizenship Status in Simpson County
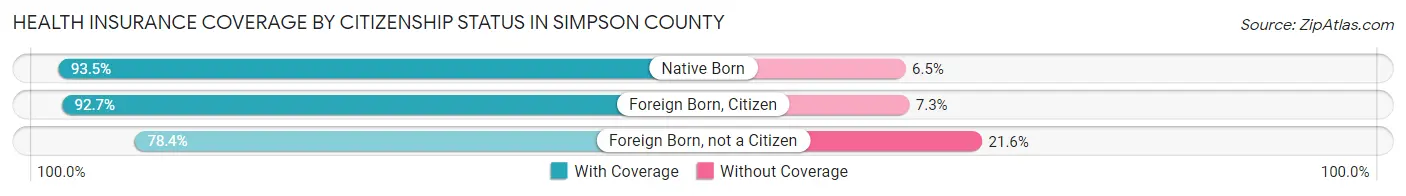
| Citizenship Status | With Coverage | Without Coverage |
| Native Born | 1,372 (93.5%) | 96 (6.5%) |
| Foreign Born, Citizen | 3,005 (92.7%) | 236 (7.3%) |
| Foreign Born, not a Citizen | 1,530 (78.4%) | 421 (21.6%) |
Health Insurance Coverage by Household Income in Simpson County
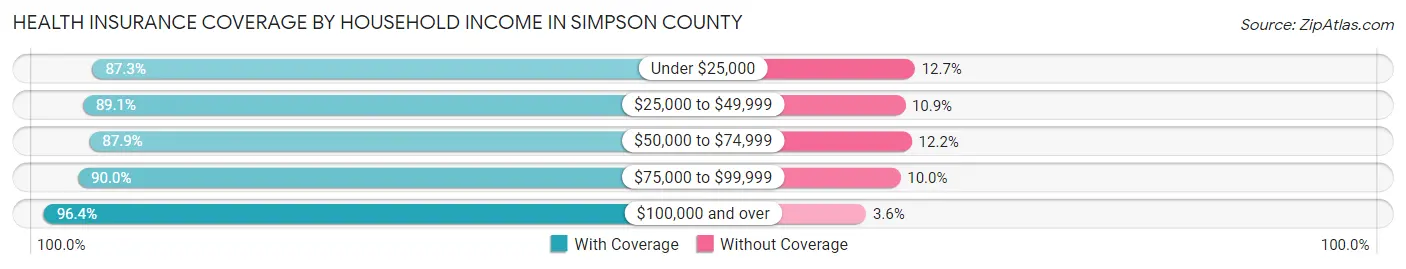
| Household Income | With Coverage | Without Coverage |
| Under $25,000 | 2,052 (87.3%) | 299 (12.7%) |
| $25,000 to $49,999 | 3,059 (89.1%) | 374 (10.9%) |
| $50,000 to $74,999 | 4,570 (87.8%) | 632 (12.1%) |
| $75,000 to $99,999 | 2,242 (90.0%) | 250 (10.0%) |
| $100,000 and over | 5,498 (96.4%) | 205 (3.6%) |
Public vs Private Health Insurance Coverage by Age in Simpson County
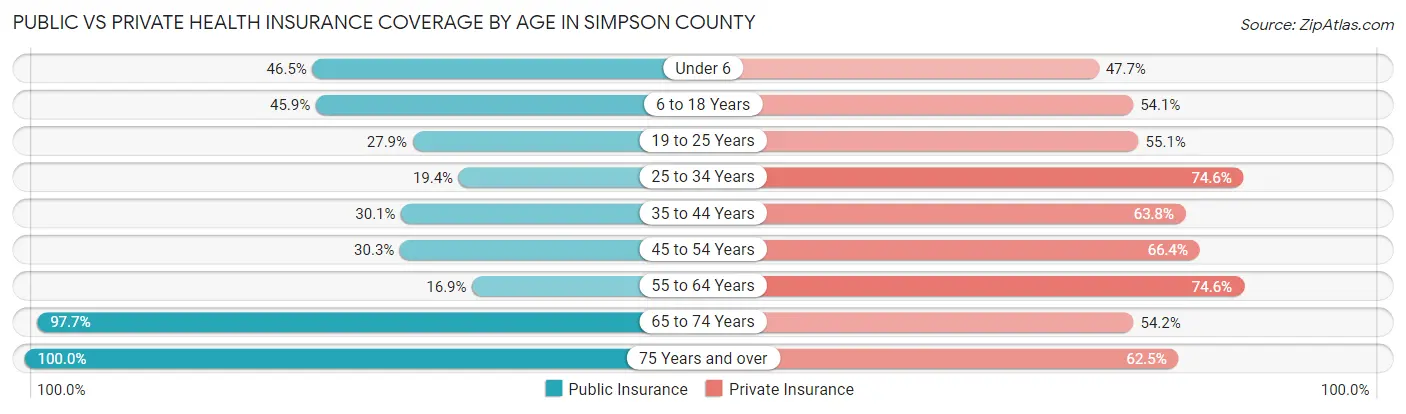
| Age Bracket | Public Insurance | Private Insurance |
| Under 6 | 683 (46.5%) | 700 (47.7%) |
| 6 to 18 Years | 1,488 (45.9%) | 1,753 (54.1%) |
| 19 to 25 Years | 545 (27.9%) | 1,075 (55.1%) |
| 25 to 34 Years | 421 (19.4%) | 1,620 (74.6%) |
| 35 to 44 Years | 682 (30.1%) | 1,448 (63.8%) |
| 45 to 54 Years | 678 (30.3%) | 1,487 (66.4%) |
| 55 to 64 Years | 480 (16.9%) | 2,121 (74.6%) |
| 65 to 74 Years | 1,825 (97.7%) | 1,012 (54.1%) |
| 75 Years and over | 1,152 (100.0%) | 720 (62.5%) |
| Total | 7,954 (41.4%) | 11,936 (62.2%) |
Disability Status by Sex by Age in Simpson County
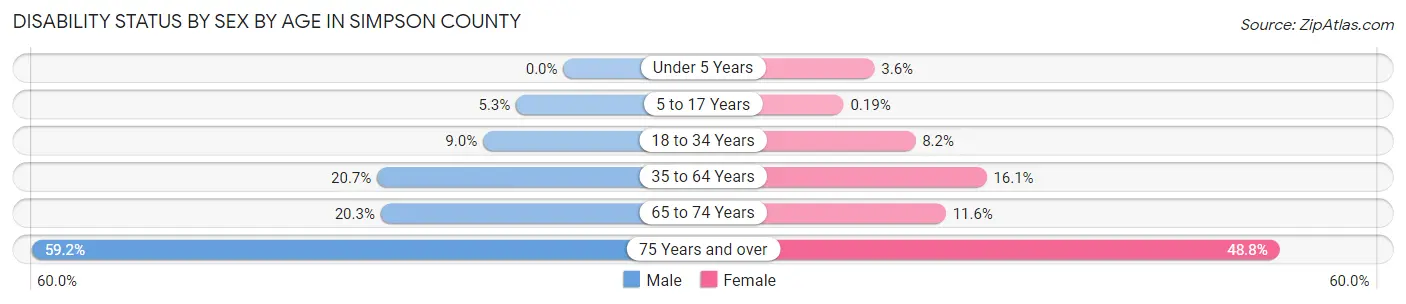
| Age Bracket | Male | Female |
| Under 5 Years | 0 (0.0%) | 19 (3.6%) |
| 5 to 17 Years | 96 (5.3%) | 3 (0.2%) |
| 18 to 34 Years | 202 (8.9%) | 164 (8.2%) |
| 35 to 64 Years | 758 (20.7%) | 595 (16.1%) |
| 65 to 74 Years | 178 (20.3%) | 115 (11.6%) |
| 75 Years and over | 280 (59.2%) | 331 (48.7%) |
Disability Class by Sex by Age in Simpson County
Disability Class: Hearing Difficulty
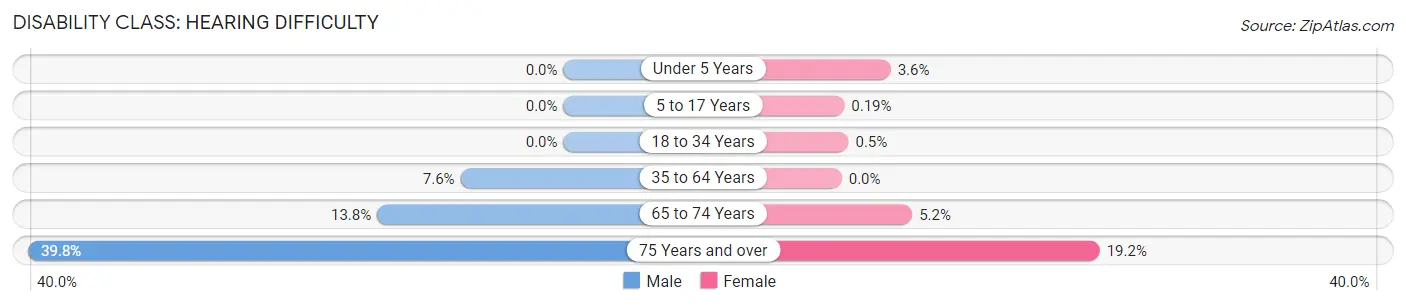
| Age Bracket | Male | Female |
| Under 5 Years | 0 (0.0%) | 19 (3.6%) |
| 5 to 17 Years | 0 (0.0%) | 3 (0.2%) |
| 18 to 34 Years | 0 (0.0%) | 10 (0.5%) |
| 35 to 64 Years | 279 (7.6%) | 0 (0.0%) |
| 65 to 74 Years | 121 (13.8%) | 52 (5.2%) |
| 75 Years and over | 188 (39.8%) | 130 (19.2%) |
Disability Class: Vision Difficulty
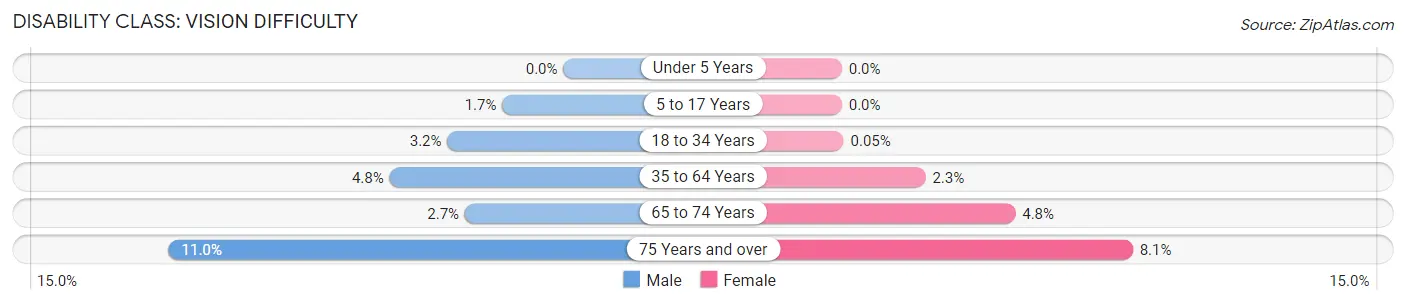
| Age Bracket | Male | Female |
| Under 5 Years | 0 (0.0%) | 0 (0.0%) |
| 5 to 17 Years | 31 (1.7%) | 0 (0.0%) |
| 18 to 34 Years | 73 (3.2%) | 1 (0.1%) |
| 35 to 64 Years | 177 (4.8%) | 86 (2.3%) |
| 65 to 74 Years | 24 (2.7%) | 48 (4.8%) |
| 75 Years and over | 52 (11.0%) | 55 (8.1%) |
Disability Class: Cognitive Difficulty
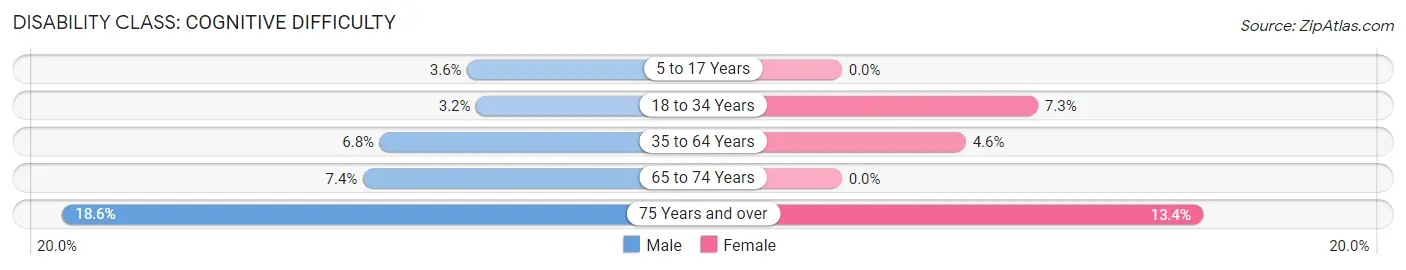
| Age Bracket | Male | Female |
| 5 to 17 Years | 65 (3.6%) | 0 (0.0%) |
| 18 to 34 Years | 73 (3.2%) | 146 (7.3%) |
| 35 to 64 Years | 249 (6.8%) | 170 (4.6%) |
| 65 to 74 Years | 65 (7.4%) | 0 (0.0%) |
| 75 Years and over | 88 (18.6%) | 91 (13.4%) |
Disability Class: Ambulatory Difficulty
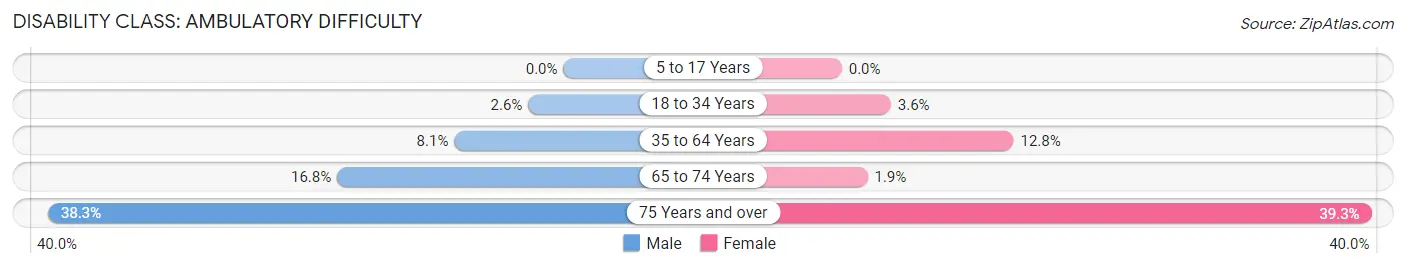
| Age Bracket | Male | Female |
| 5 to 17 Years | 0 (0.0%) | 0 (0.0%) |
| 18 to 34 Years | 59 (2.6%) | 73 (3.6%) |
| 35 to 64 Years | 296 (8.1%) | 471 (12.8%) |
| 65 to 74 Years | 147 (16.8%) | 19 (1.9%) |
| 75 Years and over | 181 (38.3%) | 267 (39.3%) |
Disability Class: Self-Care Difficulty
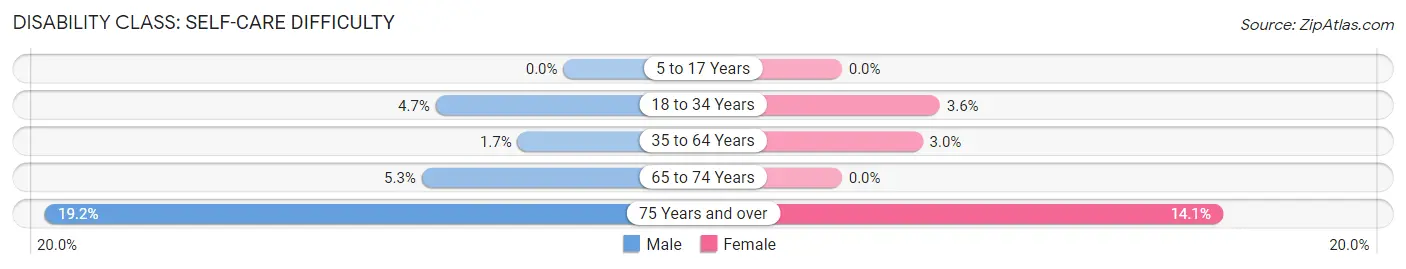
| Age Bracket | Male | Female |
| 5 to 17 Years | 0 (0.0%) | 0 (0.0%) |
| 18 to 34 Years | 107 (4.7%) | 73 (3.6%) |
| 35 to 64 Years | 62 (1.7%) | 111 (3.0%) |
| 65 to 74 Years | 46 (5.3%) | 0 (0.0%) |
| 75 Years and over | 91 (19.2%) | 96 (14.1%) |
Technology Access in Simpson County
Computing Device Access in Simpson County
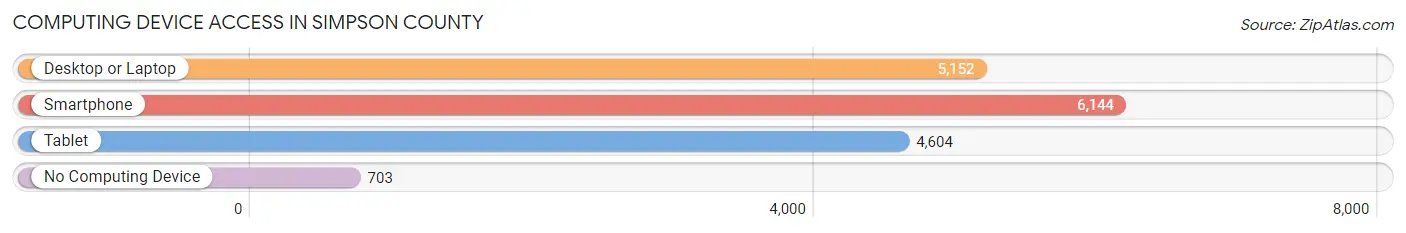
| Device Type | # Households | % Households |
| Desktop or Laptop | 5,152 | 68.4% |
| Smartphone | 6,144 | 81.6% |
| Tablet | 4,604 | 61.1% |
| No Computing Device | 703 | 9.3% |
| Total | 7,530 | 100.0% |
Internet Access in Simpson County
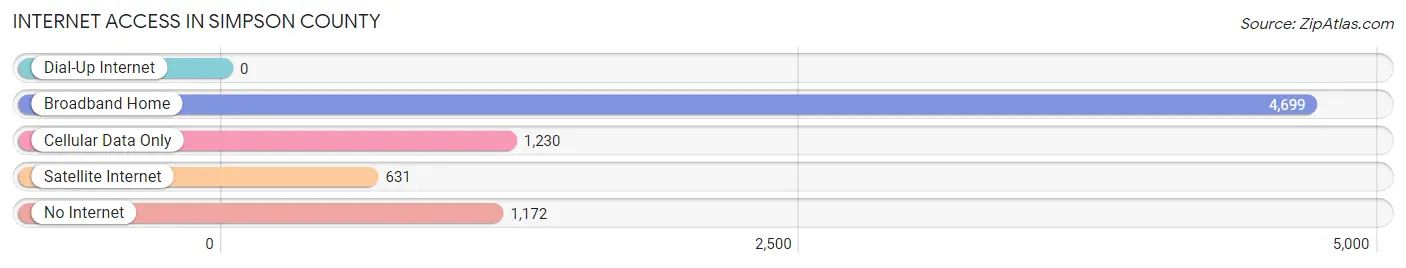
| Internet Type | # Households | % Households |
| Dial-Up Internet | 0 | 0.0% |
| Broadband Home | 4,699 | 62.4% |
| Cellular Data Only | 1,230 | 16.3% |
| Satellite Internet | 631 | 8.4% |
| No Internet | 1,172 | 15.6% |
| Total | 7,530 | 100.0% |
Simpson County Summary
Simpson County is located in the south-central region of Kentucky, and is part of the Barren River Area Development District. The county was established in 1819 and is named after Captain John Simpson, a Revolutionary War veteran. The county seat is Franklin, and the county has a total area of 441 square miles. As of the 2010 census, the population was 17,327.
Geography
Simpson County is located in the Pennyroyal Plateau region of Kentucky, and is bordered by Allen County to the north, Warren County to the east, Logan County to the south, and Simpson County to the west. The terrain is mostly rolling hills, with some flat areas in the northern part of the county. The Barren River runs through the county, and there are several small creeks and streams. The county is mostly rural, with some small towns and villages scattered throughout.
Climate
Simpson County has a humid subtropical climate, with hot, humid summers and mild winters. The average annual temperature is around 62°F, and the average annual precipitation is around 45 inches.
Demographics
As of the 2010 census, the population of Simpson County was 17,327, with a population density of 39.3 people per square mile. The racial makeup of the county was 94.3% White, 3.7% African American, 0.3% Native American, 0.3% Asian, 0.1% Pacific Islander, 0.5% from other races, and 0.8% from two or more races. Hispanic or Latino of any race were 1.3% of the population.
The median income for a household in the county was $37,945, and the median income for a family was $45,945. The per capita income for the county was $18,945. About 11.3% of the population was below the poverty line.
Economy
Simpson County has a diverse economy, with a mix of agriculture, manufacturing, and services. The county is home to several large employers, including the Simpson County Board of Education, the Franklin-Simpson County Hospital, and the Simpson County Sheriff's Office. Agriculture is a major part of the economy, with corn, soybeans, and hay being the main crops. Manufacturing is also important, with several companies producing furniture, automotive parts, and other products.
The county also has a thriving tourism industry, with several attractions, including the Franklin-Simpson County Museum, the Simpson County Historical Society, and the Franklin-Simpson County Fair. The county is also home to several wineries, and is a popular destination for outdoor activities such as fishing, hunting, and camping.
Conclusion
Simpson County is a rural county located in the south-central region of Kentucky. The county has a diverse economy, with a mix of agriculture, manufacturing, and services. The county is home to several large employers, and has a thriving tourism industry. The population of the county is 17,327, and the median income for a household is $37,945. Simpson County is a great place to live, work, and visit.
Common Questions
What is Per Capita Income in Simpson County?
Per Capita income in Simpson County is $27,951.
What is the Median Family Income in Simpson County?
Median Family Income in Simpson County is $68,252.
What is the Median Household income in Simpson County?
Median Household Income in Simpson County is $55,907.
What is Income or Wage Gap in Simpson County?
Income or Wage Gap in Simpson County is 34.6%.
Women in Simpson County earn 65.4 cents for every dollar earned by a man.
What is Family Income Deficit in Simpson County?
Family Income Deficit in Simpson County is $11,268.
Families that are below poverty line in Simpson County earn $11,268 less on average than the poverty threshold level.
What is Inequality or Gini Index in Simpson County?
Inequality or Gini Index in Simpson County is 0.42.
What is the Total Population of Simpson County?
Total Population of Simpson County is 19,574.
What is the Total Male Population of Simpson County?
Total Male Population of Simpson County is 9,912.
What is the Total Female Population of Simpson County?
Total Female Population of Simpson County is 9,662.
What is the Ratio of Males per 100 Females in Simpson County?
There are 102.59 Males per 100 Females in Simpson County.
What is the Ratio of Females per 100 Males in Simpson County?
There are 97.48 Females per 100 Males in Simpson County.
What is the Median Population Age in Simpson County?
Median Population Age in Simpson County is 39.2 Years.
What is the Average Family Size in Simpson County
Average Family Size in Simpson County is 3.0 People.
What is the Average Household Size in Simpson County
Average Household Size in Simpson County is 2.5 People.
How Large is the Labor Force in Simpson County?
There are 9,249 People in the Labor Forcein in Simpson County.
What is the Percentage of People in the Labor Force in Simpson County?
59.6% of People are in the Labor Force in Simpson County.
What is the Unemployment Rate in Simpson County?
Unemployment Rate in Simpson County is 3.5%.