Robertson County, KY Map & Demographics
Robertson County Map
Robertson County Overview
$24,146
PER CAPITA INCOME
$58,889
AVG FAMILY INCOME
$53,798
AVG HOUSEHOLD INCOME
28.3%
WAGE / INCOME GAP [ % ]
71.7¢/ $1
WAGE / INCOME GAP [ $ ]
0.48
INEQUALITY / GINI INDEX
2,207
TOTAL POPULATION
944
MALE POPULATION
1,263
FEMALE POPULATION
74.74
MALES / 100 FEMALES
133.79
FEMALES / 100 MALES
39.0
MEDIAN AGE
3.0
AVG FAMILY SIZE
2.7
AVG HOUSEHOLD SIZE
895
LABOR FORCE [ PEOPLE ]
52.4%
PERCENT IN LABOR FORCE
7.0%
UNEMPLOYMENT RATE
Robertson County Area Codes
Income in Robertson County
Income Overview in Robertson County
Per Capita Income in Robertson County is $24,146, while median incomes of families and households are $58,889 and $53,798 respectively.
| Characteristic | Number | Measure |
| Per Capita Income | 2,207 | $24,146 |
| Median Family Income | 542 | $58,889 |
| Mean Family Income | 542 | $78,630 |
| Median Household Income | 797 | $53,798 |
| Mean Household Income | 797 | $68,070 |
| Income Deficit | 542 | $0 |
| Wage / Income Gap (%) | 2,207 | 28.34% |
| Wage / Income Gap ($) | 2,207 | 71.66¢ per $1 |
| Gini / Inequality Index | 2,207 | 0.48 |
Earnings by Sex in Robertson County
Average Earnings in Robertson County are $34,583, $46,300 for men and $33,177 for women, a difference of 28.3%.
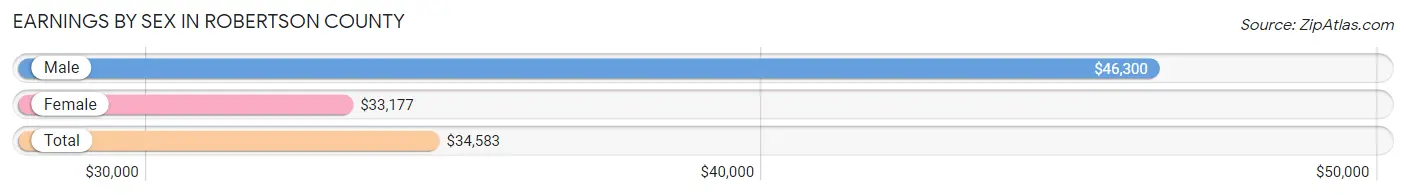
| Sex | Number | Average Earnings |
| Male | 418 (44.5%) | $46,300 |
| Female | 522 (55.5%) | $33,177 |
| Total | 940 (100.0%) | $34,583 |
Earnings by Sex by Income Bracket in Robertson County
The most common earnings brackets in Robertson County are $55,000 to $64,999 for men (80 | 19.1%) and $10,000 to $12,499 for women (73 | 14.0%).
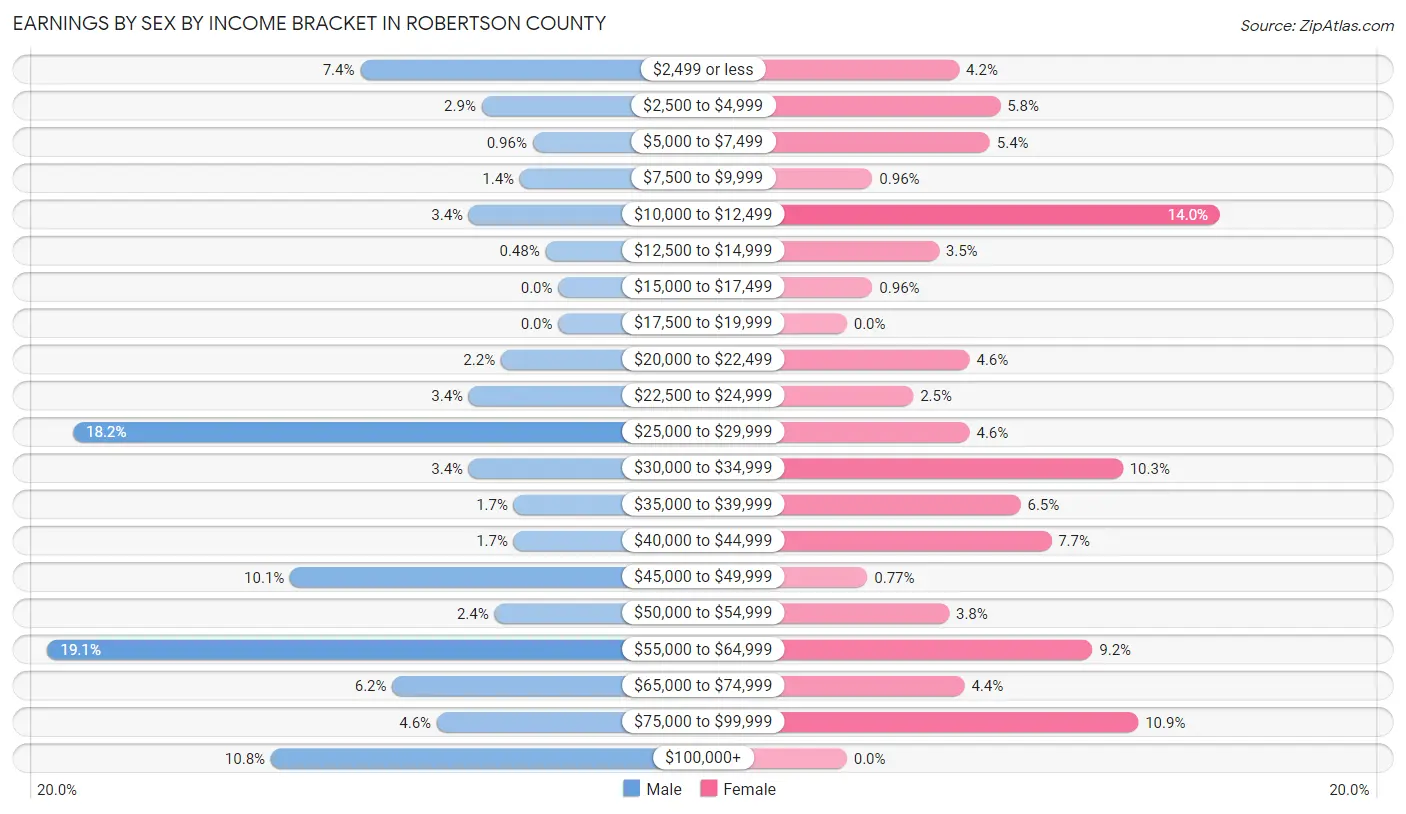
| Income | Male | Female |
| $2,499 or less | 31 (7.4%) | 22 (4.2%) |
| $2,500 to $4,999 | 12 (2.9%) | 30 (5.8%) |
| $5,000 to $7,499 | 4 (1.0%) | 28 (5.4%) |
| $7,500 to $9,999 | 6 (1.4%) | 5 (1.0%) |
| $10,000 to $12,499 | 14 (3.4%) | 73 (14.0%) |
| $12,500 to $14,999 | 2 (0.5%) | 18 (3.5%) |
| $15,000 to $17,499 | 0 (0.0%) | 5 (1.0%) |
| $17,500 to $19,999 | 0 (0.0%) | 0 (0.0%) |
| $20,000 to $22,499 | 9 (2.1%) | 24 (4.6%) |
| $22,500 to $24,999 | 14 (3.4%) | 13 (2.5%) |
| $25,000 to $29,999 | 76 (18.2%) | 24 (4.6%) |
| $30,000 to $34,999 | 14 (3.4%) | 54 (10.3%) |
| $35,000 to $39,999 | 7 (1.7%) | 34 (6.5%) |
| $40,000 to $44,999 | 7 (1.7%) | 40 (7.7%) |
| $45,000 to $49,999 | 42 (10.1%) | 4 (0.8%) |
| $50,000 to $54,999 | 10 (2.4%) | 20 (3.8%) |
| $55,000 to $64,999 | 80 (19.1%) | 48 (9.2%) |
| $65,000 to $74,999 | 26 (6.2%) | 23 (4.4%) |
| $75,000 to $99,999 | 19 (4.5%) | 57 (10.9%) |
| $100,000+ | 45 (10.8%) | 0 (0.0%) |
| Total | 418 (100.0%) | 522 (100.0%) |
Earnings by Sex by Educational Attainment in Robertson County
Average earnings in Robertson County are $48,529 for men and $34,036 for women, a difference of 29.9%. Men with an educational attainment of less than high school enjoy the highest average annual earnings of $100,391, while those with college or associate's degree education earn the least with $45,000. Women with an educational attainment of graduate degree earn the most with the average annual earnings of $75,313, while those with college or associate's degree education have the smallest earnings of $33,598.
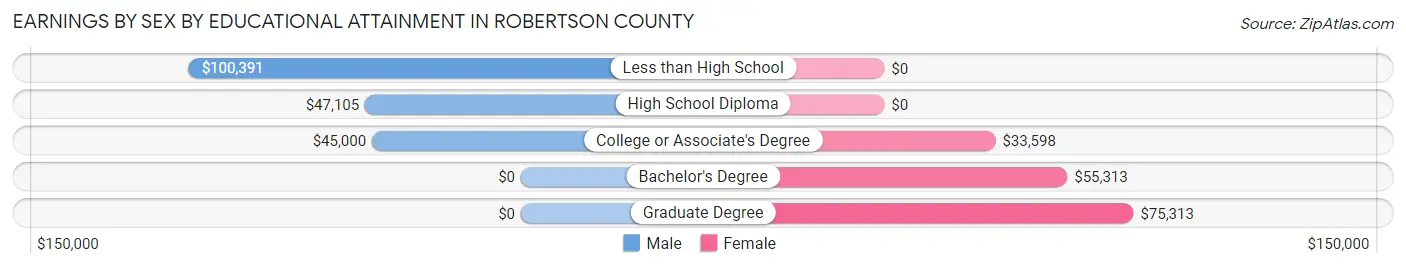
| Educational Attainment | Male Income | Female Income |
| Less than High School | $100,391 | $0 |
| High School Diploma | $47,105 | $0 |
| College or Associate's Degree | $45,000 | $33,598 |
| Bachelor's Degree | - | - |
| Graduate Degree | - | - |
| Total | $48,529 | $34,036 |
Family Income in Robertson County
Family Income Brackets in Robertson County
According to the Robertson County family income data, there are 111 families falling into the $75,000 to $99,999 income range, which is the most common income bracket and makes up 20.5% of all families. Conversely, the $10,000 to $14,999 income bracket is the least frequent group with only 9 families (1.7%) belonging to this category.
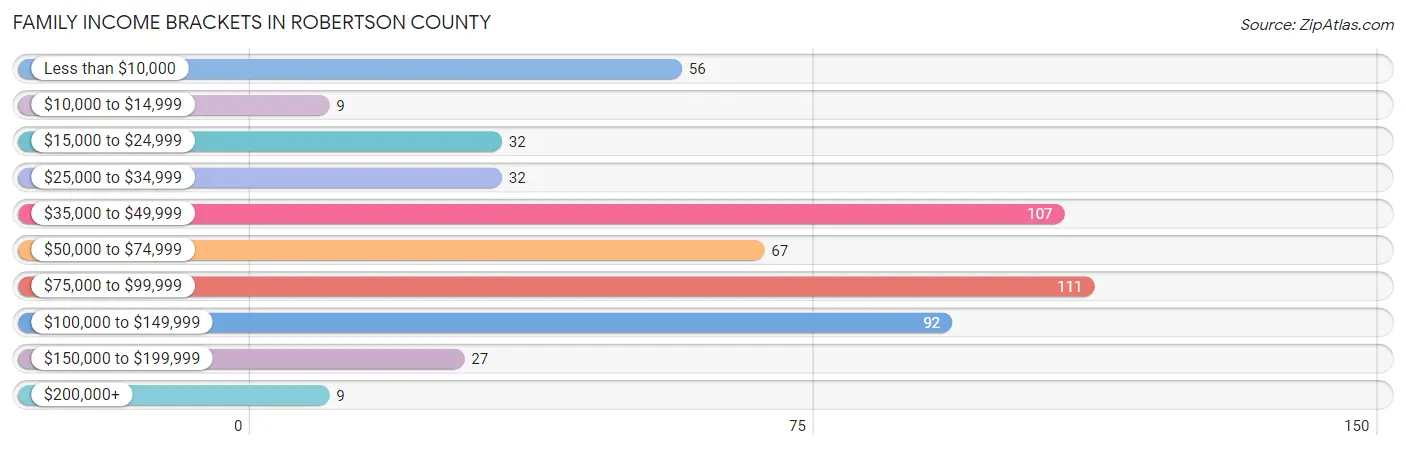
| Income Bracket | # Families | % Families |
| Less than $10,000 | 56 | 10.3% |
| $10,000 to $14,999 | 9 | 1.7% |
| $15,000 to $24,999 | 32 | 5.9% |
| $25,000 to $34,999 | 32 | 5.9% |
| $35,000 to $49,999 | 107 | 19.7% |
| $50,000 to $74,999 | 67 | 12.4% |
| $75,000 to $99,999 | 111 | 20.5% |
| $100,000 to $149,999 | 92 | 17.0% |
| $150,000 to $199,999 | 27 | 5.0% |
| $200,000+ | 9 | 1.7% |
Family Income by Famaliy Size in Robertson County
4-person families (63 | 11.6%) account for the highest median family income in Robertson County with $97,188 per family, while 3-person families (151 | 27.9%) have the highest median income of $30,013 per family member.
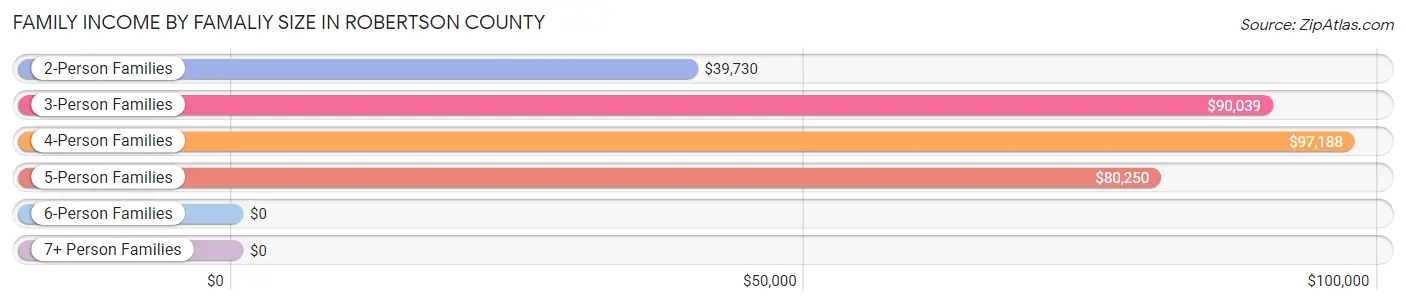
| Income Bracket | # Families | Median Income |
| 2-Person Families | 226 (41.7%) | $39,730 |
| 3-Person Families | 151 (27.9%) | $90,039 |
| 4-Person Families | 63 (11.6%) | $97,188 |
| 5-Person Families | 97 (17.9%) | $80,250 |
| 6-Person Families | 0 (0.0%) | $0 |
| 7+ Person Families | 5 (0.9%) | $0 |
| Total | 542 (100.0%) | $58,889 |
Family Income by Number of Earners in Robertson County
The median family income in Robertson County is $58,889, with families comprising 3+ earners (37) having the highest median family income of $144,583, while families with no earners (118) have the lowest median family income of $24,063, accounting for 6.8% and 21.8% of families, respectively.
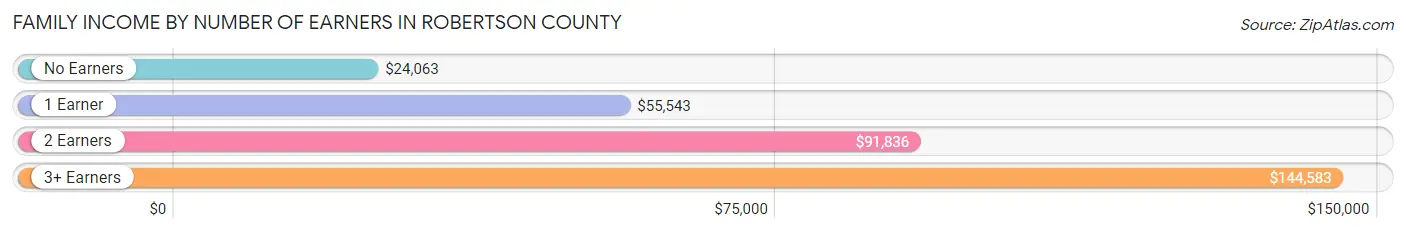
| Number of Earners | # Families | Median Income |
| No Earners | 118 (21.8%) | $24,063 |
| 1 Earner | 232 (42.8%) | $55,543 |
| 2 Earners | 155 (28.6%) | $91,836 |
| 3+ Earners | 37 (6.8%) | $144,583 |
| Total | 542 (100.0%) | $58,889 |
Household Income in Robertson County
Household Income Brackets in Robertson County
With 139 households falling in the category, the $75,000 to $99,999 income range is the most frequent in Robertson County, accounting for 17.4% of all households. In contrast, only 10 households (1.3%) fall into the $200,000+ income bracket, making it the least populous group.
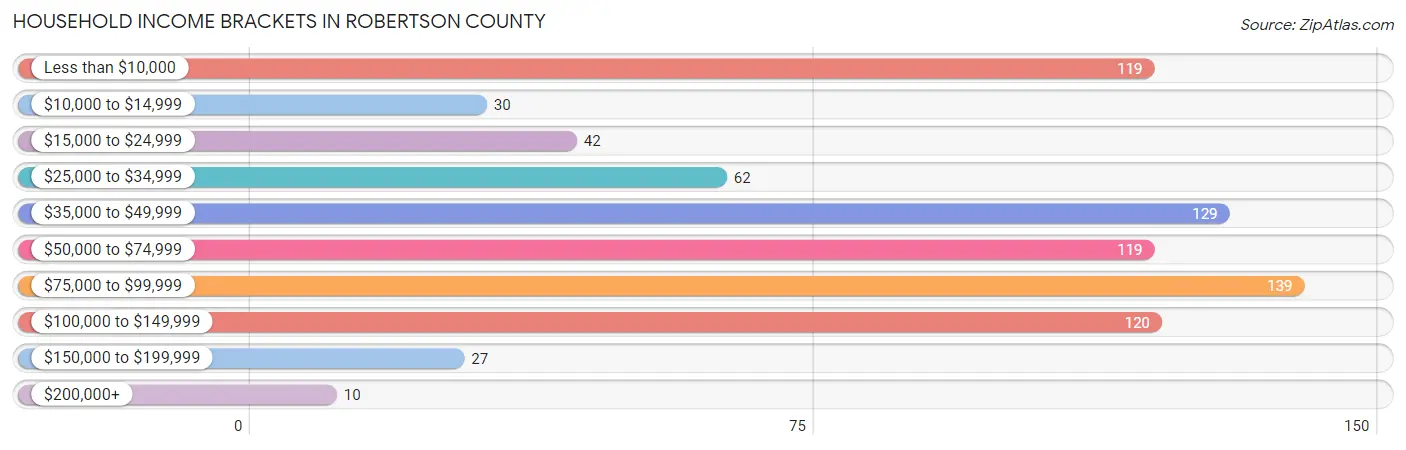
| Income Bracket | # Households | % Households |
| Less than $10,000 | 119 | 14.9% |
| $10,000 to $14,999 | 30 | 3.8% |
| $15,000 to $24,999 | 42 | 5.3% |
| $25,000 to $34,999 | 62 | 7.8% |
| $35,000 to $49,999 | 129 | 16.2% |
| $50,000 to $74,999 | 119 | 14.9% |
| $75,000 to $99,999 | 139 | 17.4% |
| $100,000 to $149,999 | 120 | 15.1% |
| $150,000 to $199,999 | 27 | 3.4% |
| $200,000+ | 10 | 1.3% |
Household Income by Householder Age in Robertson County
The median household income in Robertson County is $53,798, with the highest median household income of $72,019 found in the 25 to 44 years age bracket for the primary householder. A total of 285 households (35.8%) fall into this category. Meanwhile, the 15 to 24 years age bracket for the primary householder has the lowest median household income of $0, with 4 households (0.5%) in this group.
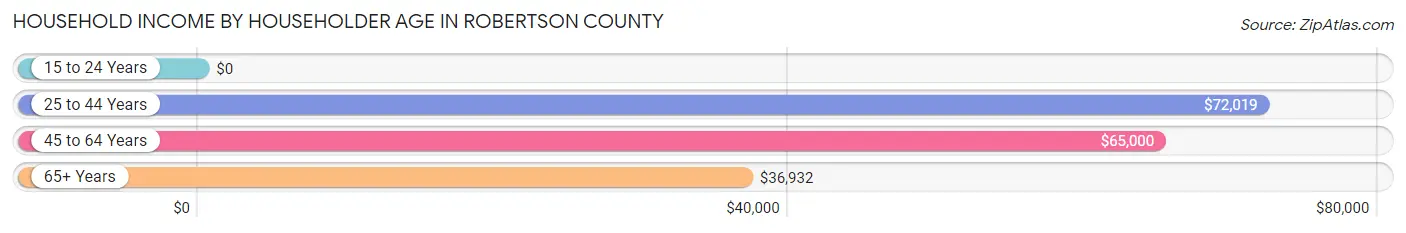
| Income Bracket | # Households | Median Income |
| 15 to 24 Years | 4 (0.5%) | $0 |
| 25 to 44 Years | 285 (35.8%) | $72,019 |
| 45 to 64 Years | 272 (34.1%) | $65,000 |
| 65+ Years | 236 (29.6%) | $36,932 |
| Total | 797 (100.0%) | $53,798 |
Poverty in Robertson County
Income Below Poverty by Sex and Age in Robertson County
With 20.0% poverty level for males and 23.6% for females among the residents of Robertson County, 55 to 64 year old males and 16 and 17 year old females are the most vulnerable to poverty, with 60 males (42.9%) and 25 females (69.4%) in their respective age groups living below the poverty level.
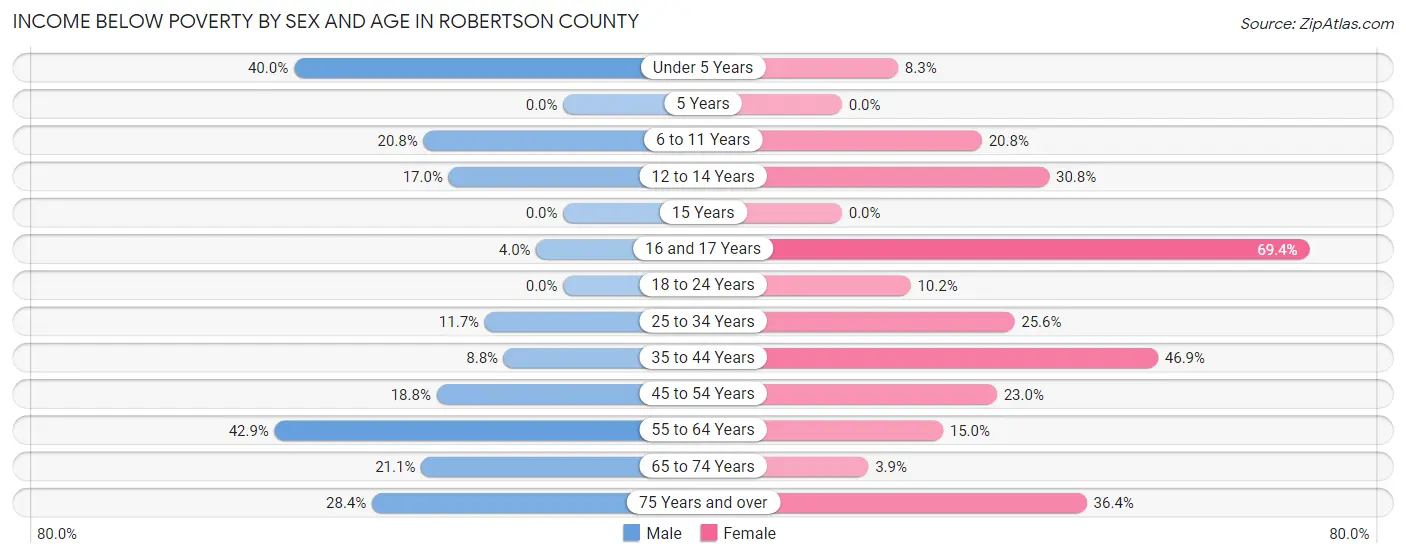
| Age Bracket | Male | Female |
| Under 5 Years | 10 (40.0%) | 3 (8.3%) |
| 5 Years | 0 (0.0%) | 0 (0.0%) |
| 6 to 11 Years | 11 (20.7%) | 16 (20.8%) |
| 12 to 14 Years | 8 (17.0%) | 20 (30.8%) |
| 15 Years | 0 (0.0%) | 0 (0.0%) |
| 16 and 17 Years | 1 (4.0%) | 25 (69.4%) |
| 18 to 24 Years | 0 (0.0%) | 5 (10.2%) |
| 25 to 34 Years | 12 (11.7%) | 42 (25.6%) |
| 35 to 44 Years | 12 (8.8%) | 84 (46.9%) |
| 45 to 54 Years | 25 (18.8%) | 26 (23.0%) |
| 55 to 64 Years | 60 (42.9%) | 24 (15.0%) |
| 65 to 74 Years | 23 (21.1%) | 4 (3.9%) |
| 75 Years and over | 23 (28.4%) | 16 (36.4%) |
| Total | 185 (20.0%) | 265 (23.6%) |
Income Above Poverty by Sex and Age in Robertson County
According to the poverty statistics in Robertson County, males aged 18 to 24 years and females aged 5 years are the age groups that are most secure financially, with 100.0% of males and 100.0% of females in these age groups living above the poverty line.
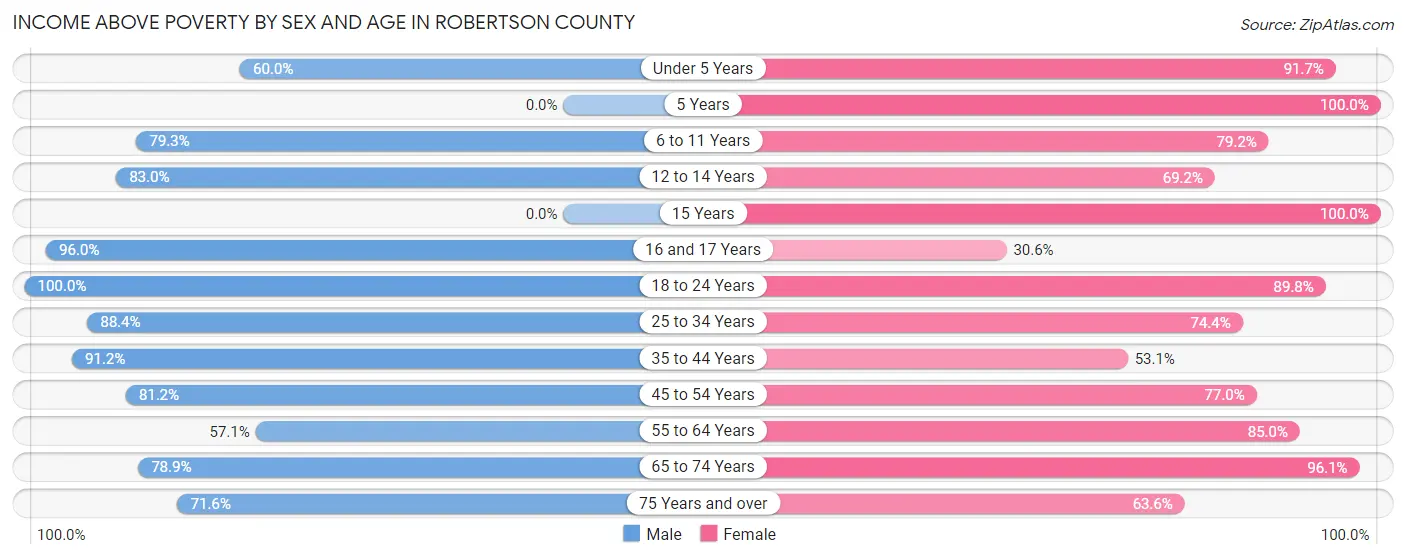
| Age Bracket | Male | Female |
| Under 5 Years | 15 (60.0%) | 33 (91.7%) |
| 5 Years | 0 (0.0%) | 53 (100.0%) |
| 6 to 11 Years | 42 (79.2%) | 61 (79.2%) |
| 12 to 14 Years | 39 (83.0%) | 45 (69.2%) |
| 15 Years | 0 (0.0%) | 44 (100.0%) |
| 16 and 17 Years | 24 (96.0%) | 11 (30.6%) |
| 18 to 24 Years | 73 (100.0%) | 44 (89.8%) |
| 25 to 34 Years | 91 (88.3%) | 122 (74.4%) |
| 35 to 44 Years | 124 (91.2%) | 95 (53.1%) |
| 45 to 54 Years | 108 (81.2%) | 87 (77.0%) |
| 55 to 64 Years | 80 (57.1%) | 136 (85.0%) |
| 65 to 74 Years | 86 (78.9%) | 98 (96.1%) |
| 75 Years and over | 58 (71.6%) | 28 (63.6%) |
| Total | 740 (80.0%) | 857 (76.4%) |
Income Below Poverty Among Married-Couple Families in Robertson County
The poverty statistics for married-couple families in Robertson County show that 11.2% or 43 of the total 383 families live below the poverty line. Families with no children have the highest poverty rate of 17.5%, comprising of 36 families. On the other hand, families with 1 or 2 children have the lowest poverty rate of 2.4%, which includes 3 families.
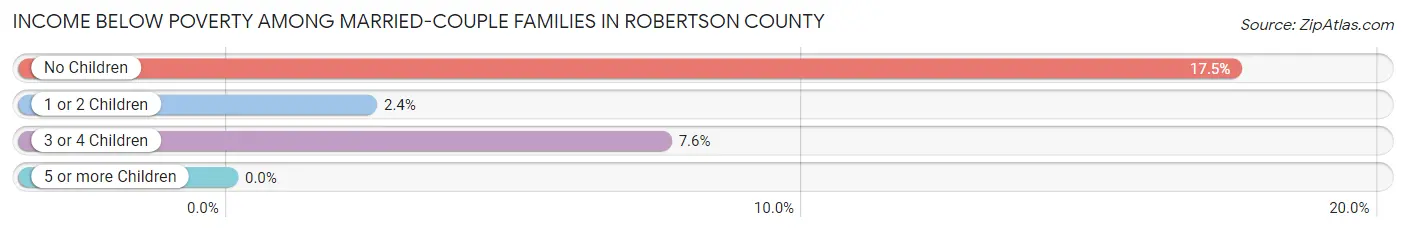
| Children | Above Poverty | Below Poverty |
| No Children | 170 (82.5%) | 36 (17.5%) |
| 1 or 2 Children | 121 (97.6%) | 3 (2.4%) |
| 3 or 4 Children | 49 (92.4%) | 4 (7.5%) |
| 5 or more Children | 0 (0.0%) | 0 (0.0%) |
| Total | 340 (88.8%) | 43 (11.2%) |
Income Below Poverty Among Single-Parent Households in Robertson County
According to the poverty data in Robertson County, 7.3% or 4 single-father households and 42.3% or 44 single-mother households are living below the poverty line. Among single-father households, those with 1 or 2 children have the highest poverty rate, with 4 households (22.2%) experiencing poverty. Likewise, among single-mother households, those with 3 or 4 children have the highest poverty rate, with 7 households (100.0%) falling below the poverty line.
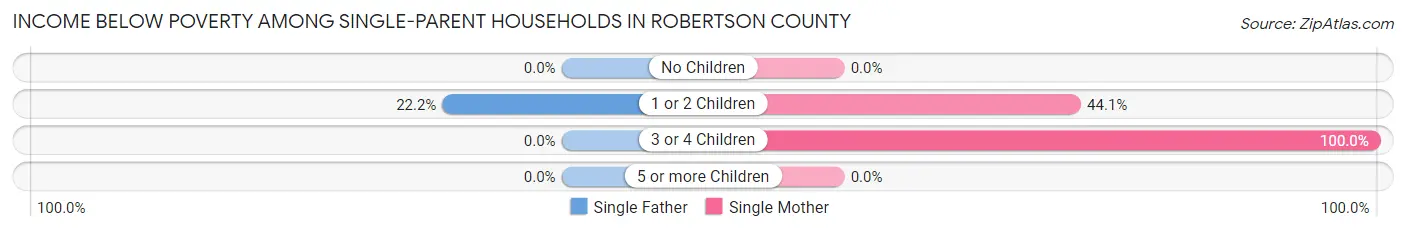
| Children | Single Father | Single Mother |
| No Children | 0 (0.0%) | 0 (0.0%) |
| 1 or 2 Children | 4 (22.2%) | 37 (44.1%) |
| 3 or 4 Children | 0 (0.0%) | 7 (100.0%) |
| 5 or more Children | 0 (0.0%) | 0 (0.0%) |
| Total | 4 (7.3%) | 44 (42.3%) |
Income Below Poverty Among Married-Couple vs Single-Parent Households in Robertson County
The poverty data for Robertson County shows that 43 of the married-couple family households (11.2%) and 48 of the single-parent households (30.2%) are living below the poverty level. Within the married-couple family households, those with no children have the highest poverty rate, with 36 households (17.5%) falling below the poverty line. Among the single-parent households, those with 1 or 2 children have the highest poverty rate, with 41 household (40.2%) living below poverty.
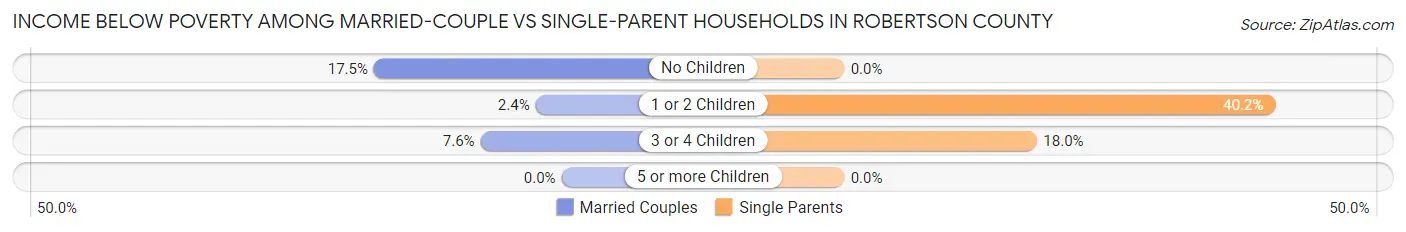
| Children | Married-Couple Families | Single-Parent Households |
| No Children | 36 (17.5%) | 0 (0.0%) |
| 1 or 2 Children | 3 (2.4%) | 41 (40.2%) |
| 3 or 4 Children | 4 (7.5%) | 7 (17.9%) |
| 5 or more Children | 0 (0.0%) | 0 (0.0%) |
| Total | 43 (11.2%) | 48 (30.2%) |
Race in Robertson County
The most populous races in Robertson County are White / Caucasian (2,163 | 98.0%), Hispanic or Latino (39 | 1.8%), and Two or more Races (33 | 1.5%).
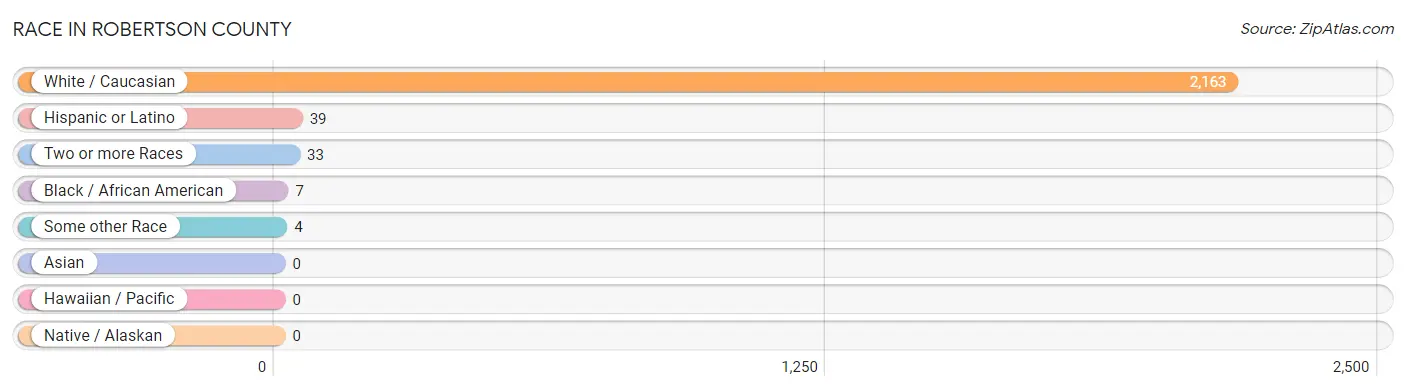
| Race | # Population | % Population |
| Asian | 0 | 0.0% |
| Black / African American | 7 | 0.3% |
| Hawaiian / Pacific | 0 | 0.0% |
| Hispanic or Latino | 39 | 1.8% |
| Native / Alaskan | 0 | 0.0% |
| White / Caucasian | 2,163 | 98.0% |
| Two or more Races | 33 | 1.5% |
| Some other Race | 4 | 0.2% |
| Total | 2,207 | 100.0% |
Ancestry in Robertson County
The most populous ancestries reported in Robertson County are American (417 | 18.9%), German (360 | 16.3%), English (221 | 10.0%), Irish (173 | 7.8%), and Scottish (43 | 1.9%), together accounting for 55.0% of all Robertson County residents.
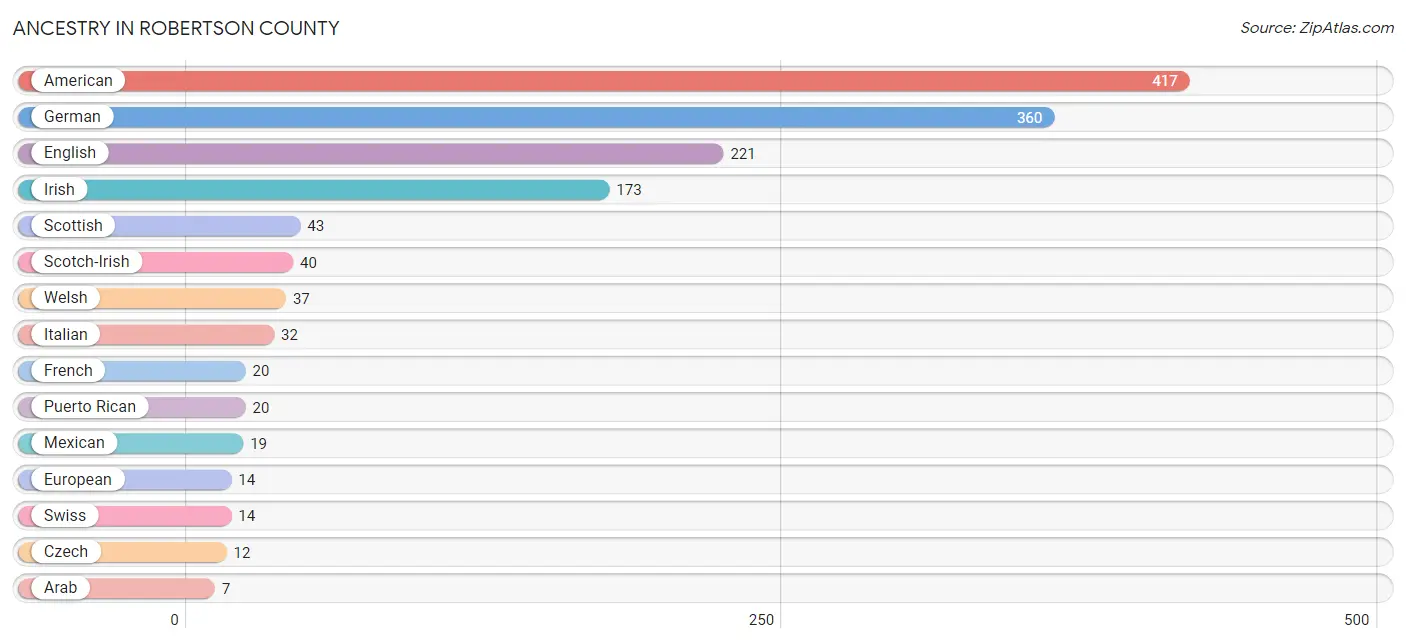
| Ancestry | # Population | % Population |
| American | 417 | 18.9% |
| Arab | 7 | 0.3% |
| Cherokee | 3 | 0.1% |
| Czech | 12 | 0.5% |
| Dutch | 4 | 0.2% |
| English | 221 | 10.0% |
| European | 14 | 0.6% |
| French | 20 | 0.9% |
| German | 360 | 16.3% |
| Irish | 173 | 7.8% |
| Italian | 32 | 1.5% |
| Lebanese | 7 | 0.3% |
| Mexican | 19 | 0.9% |
| Polish | 6 | 0.3% |
| Puerto Rican | 20 | 0.9% |
| Scotch-Irish | 40 | 1.8% |
| Scottish | 43 | 1.9% |
| Swiss | 14 | 0.6% |
| Welsh | 37 | 1.7% | View All 19 Rows |
Immigrants in Robertson County
The most numerous immigrant groups reported in Robertson County came from Central America (4 | 0.2%), Latin America (4 | 0.2%), and Mexico (4 | 0.2%), together accounting for 0.5% of all Robertson County residents.
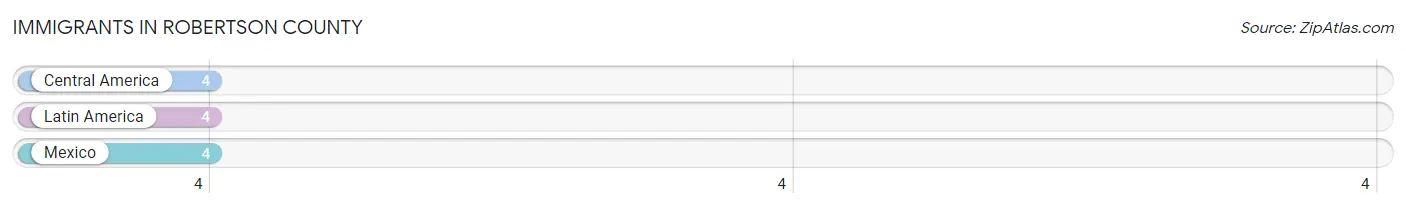
| Immigration Origin | # Population | % Population |
| Central America | 4 | 0.2% |
| Latin America | 4 | 0.2% |
| Mexico | 4 | 0.2% | View All 3 Rows |
Sex and Age in Robertson County
Sex and Age in Robertson County
The most populous age groups in Robertson County are 55 to 59 Years (90 | 9.5%) for men and 5 to 9 Years (171 | 13.5%) for women.
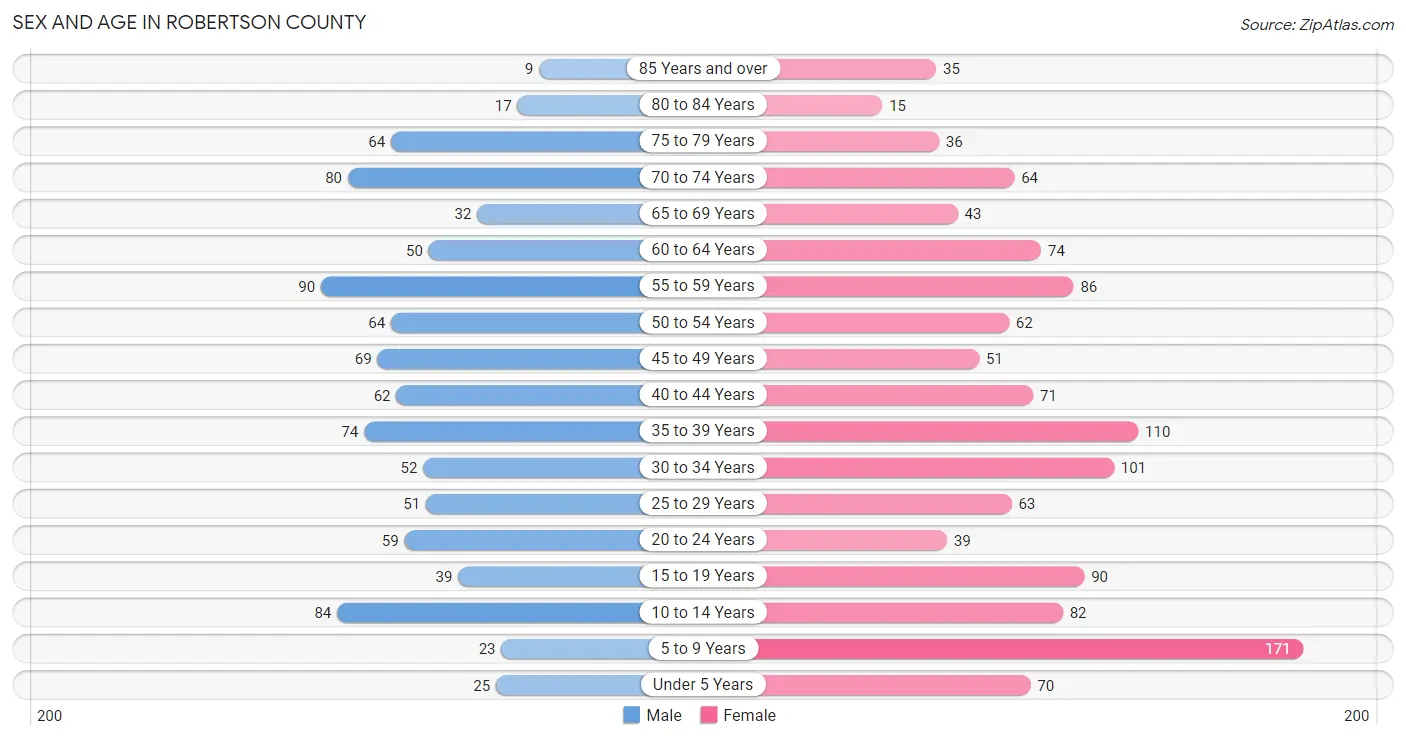
| Age Bracket | Male | Female |
| Under 5 Years | 25 (2.6%) | 70 (5.5%) |
| 5 to 9 Years | 23 (2.4%) | 171 (13.5%) |
| 10 to 14 Years | 84 (8.9%) | 82 (6.5%) |
| 15 to 19 Years | 39 (4.1%) | 90 (7.1%) |
| 20 to 24 Years | 59 (6.2%) | 39 (3.1%) |
| 25 to 29 Years | 51 (5.4%) | 63 (5.0%) |
| 30 to 34 Years | 52 (5.5%) | 101 (8.0%) |
| 35 to 39 Years | 74 (7.8%) | 110 (8.7%) |
| 40 to 44 Years | 62 (6.6%) | 71 (5.6%) |
| 45 to 49 Years | 69 (7.3%) | 51 (4.0%) |
| 50 to 54 Years | 64 (6.8%) | 62 (4.9%) |
| 55 to 59 Years | 90 (9.5%) | 86 (6.8%) |
| 60 to 64 Years | 50 (5.3%) | 74 (5.9%) |
| 65 to 69 Years | 32 (3.4%) | 43 (3.4%) |
| 70 to 74 Years | 80 (8.5%) | 64 (5.1%) |
| 75 to 79 Years | 64 (6.8%) | 36 (2.9%) |
| 80 to 84 Years | 17 (1.8%) | 15 (1.2%) |
| 85 Years and over | 9 (0.9%) | 35 (2.8%) |
| Total | 944 (100.0%) | 1,263 (100.0%) |
Families and Households in Robertson County
Median Family Size in Robertson County
The median family size in Robertson County is 2.95 persons per family, with single male/father families (55 | 10.2%) accounting for the largest median family size of 3.96 persons per family. On the other hand, married-couple families (383 | 70.7%) represent the smallest median family size with 2.81 persons per family.
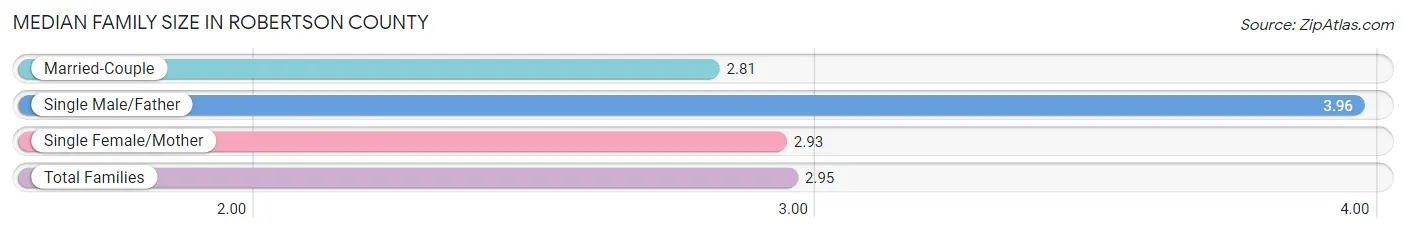
| Family Type | # Families | Family Size |
| Married-Couple | 383 (70.7%) | 2.81 |
| Single Male/Father | 55 (10.2%) | 3.96 |
| Single Female/Mother | 104 (19.2%) | 2.93 |
| Total Families | 542 (100.0%) | 2.95 |
Median Household Size in Robertson County
The median household size in Robertson County is 2.69 persons per household, with single male/father households (55 | 6.9%) accounting for the largest median household size of 4.95 persons per household. non-family households (255 | 32.0%) represent the smallest median household size with 1.75 persons per household.
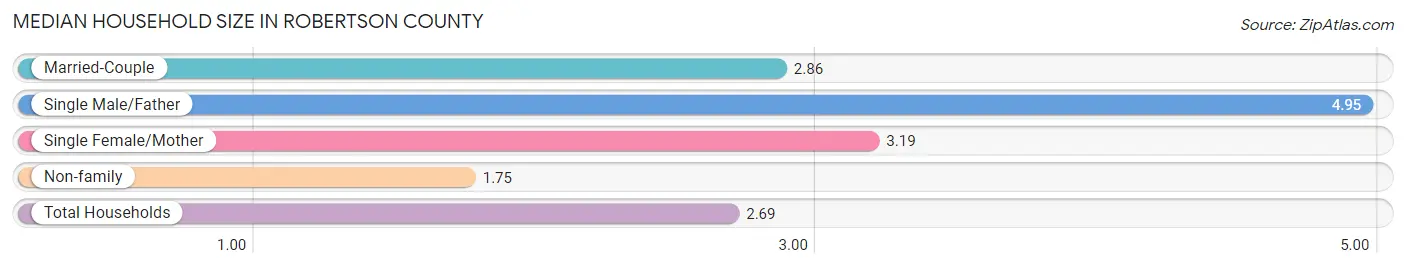
| Household Type | # Households | Household Size |
| Married-Couple | 383 (48.1%) | 2.86 |
| Single Male/Father | 55 (6.9%) | 4.95 |
| Single Female/Mother | 104 (13.1%) | 3.19 |
| Non-family | 255 (32.0%) | 1.75 |
| Total Households | 797 (100.0%) | 2.69 |
Household Size by Marriage Status in Robertson County
Out of a total of 797 households in Robertson County, 542 (68.0%) are family households, while 255 (32.0%) are nonfamily households. The most numerous type of family households are 2-person households, comprising 193, and the most common type of nonfamily households are 1-person households, comprising 176.
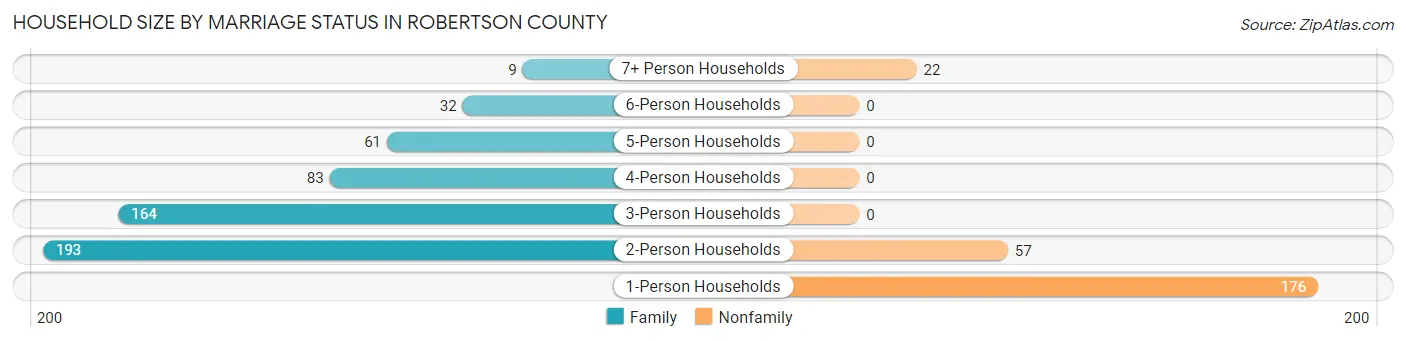
| Household Size | Family Households | Nonfamily Households |
| 1-Person Households | - | 176 (22.1%) |
| 2-Person Households | 193 (24.2%) | 57 (7.1%) |
| 3-Person Households | 164 (20.6%) | 0 (0.0%) |
| 4-Person Households | 83 (10.4%) | 0 (0.0%) |
| 5-Person Households | 61 (7.6%) | 0 (0.0%) |
| 6-Person Households | 32 (4.0%) | 0 (0.0%) |
| 7+ Person Households | 9 (1.1%) | 22 (2.8%) |
| Total | 542 (68.0%) | 255 (32.0%) |
Female Fertility in Robertson County
Fertility by Age in Robertson County
Average fertility rate in Robertson County is 13.0 births per 1,000 women. Women in the age bracket of 15 to 19 years have the highest fertility rate with 44.0 births per 1,000 women. Women in the age bracket of 15 to 19 years acount for 57.1% of all women with births.
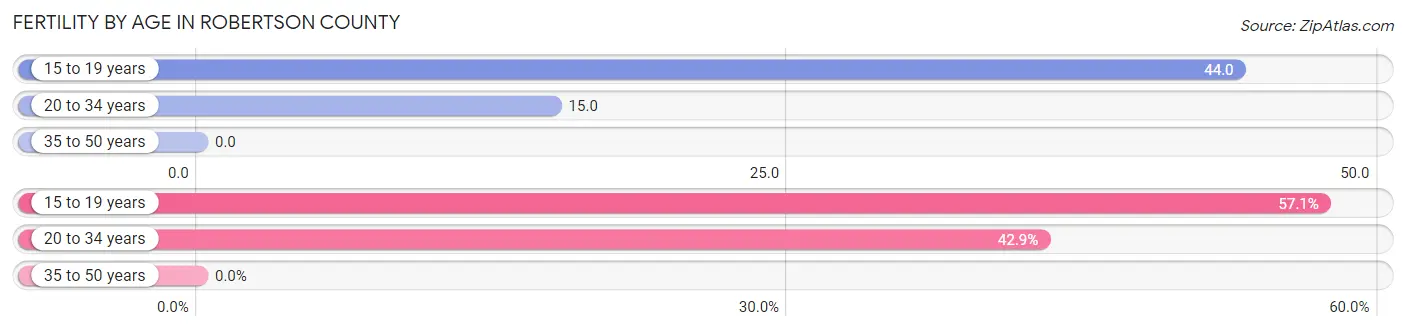
| Age Bracket | Women with Births | Births / 1,000 Women |
| 15 to 19 years | 4 (57.1%) | 44.0 |
| 20 to 34 years | 3 (42.9%) | 15.0 |
| 35 to 50 years | 0 (0.0%) | 0.0 |
| Total | 7 (100.0%) | 13.0 |
Fertility by Age by Marriage Status in Robertson County
42.9% of women with births (7) in Robertson County are married. The highest percentage of unmarried women with births falls into 15 to 19 years age bracket with 100.0% of them unmarried at the time of birth, while the lowest percentage of unmarried women with births belong to 20 to 34 years age bracket with 0.0% of them unmarried.
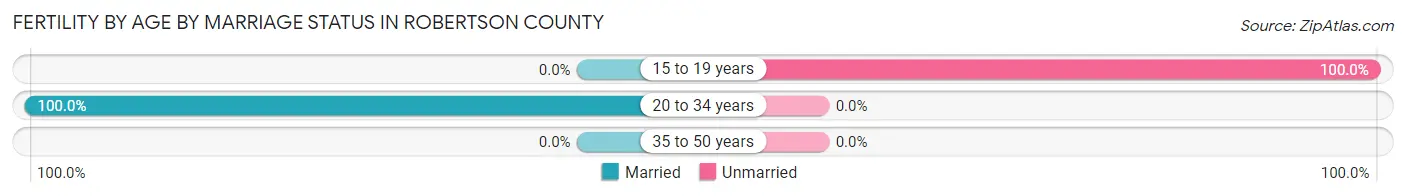
| Age Bracket | Married | Unmarried |
| 15 to 19 years | 0 (0.0%) | 4 (100.0%) |
| 20 to 34 years | 3 (100.0%) | 0 (0.0%) |
| 35 to 50 years | 0 (0.0%) | 0 (0.0%) |
| Total | 3 (42.9%) | 4 (57.1%) |
Fertility by Education in Robertson County
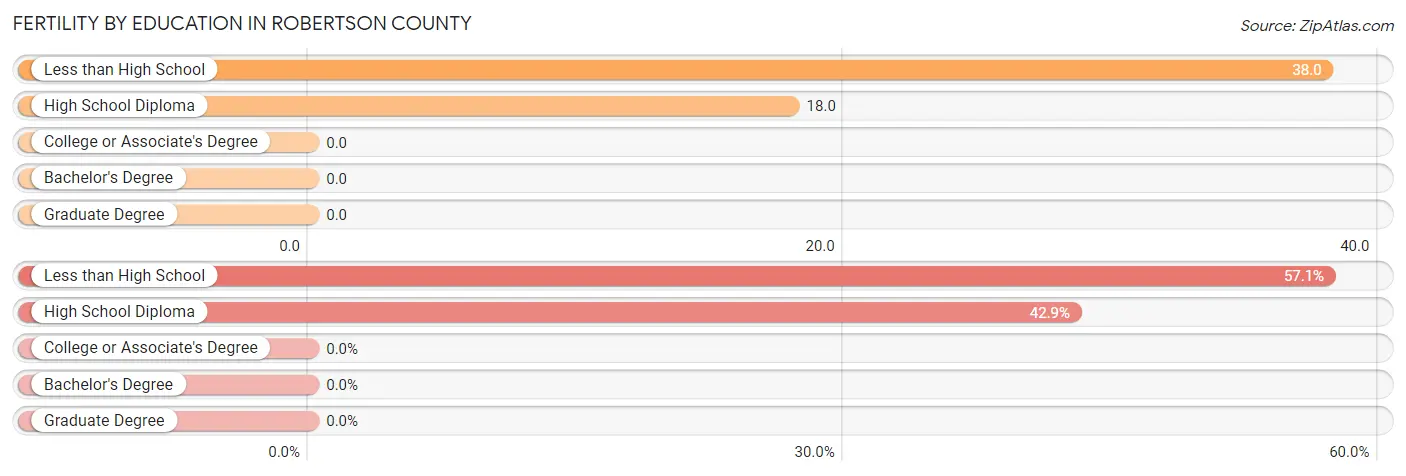
| Educational Attainment | Women with Births | Births / 1,000 Women |
| Less than High School | 4 (57.1%) | 38.0 |
| High School Diploma | 3 (42.9%) | 18.0 |
| College or Associate's Degree | 0 (0.0%) | 0.0 |
| Bachelor's Degree | 0 (0.0%) | 0.0 |
| Graduate Degree | 0 (0.0%) | 0.0 |
| Total | 7 (100.0%) | 13.0 |
Fertility by Education by Marriage Status in Robertson County
57.1% of women with births in Robertson County are unmarried. Women with the educational attainment of high school diploma are most likely to be married with 100.0% of them married at childbirth, while women with the educational attainment of less than high school are least likely to be married with 100.0% of them unmarried at childbirth.
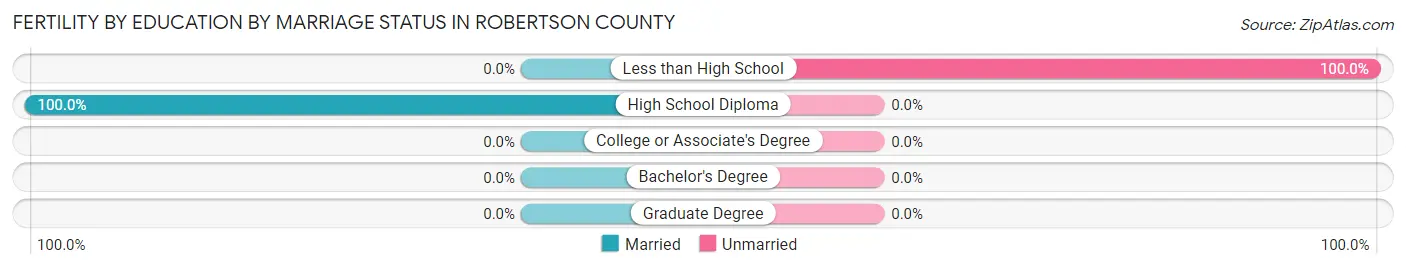
| Educational Attainment | Married | Unmarried |
| Less than High School | 0 (0.0%) | 4 (100.0%) |
| High School Diploma | 3 (100.0%) | 0 (0.0%) |
| College or Associate's Degree | 0 (0.0%) | 0 (0.0%) |
| Bachelor's Degree | 0 (0.0%) | 0 (0.0%) |
| Graduate Degree | 0 (0.0%) | 0 (0.0%) |
| Total | 3 (42.9%) | 4 (57.1%) |
Employment Characteristics in Robertson County
Employment by Class of Employer in Robertson County
Among the 816 employed individuals in Robertson County, private company employees (484 | 59.3%), state government employees (135 | 16.5%), and self-employed (not incorporated) (94 | 11.5%) make up the most common classes of employment.
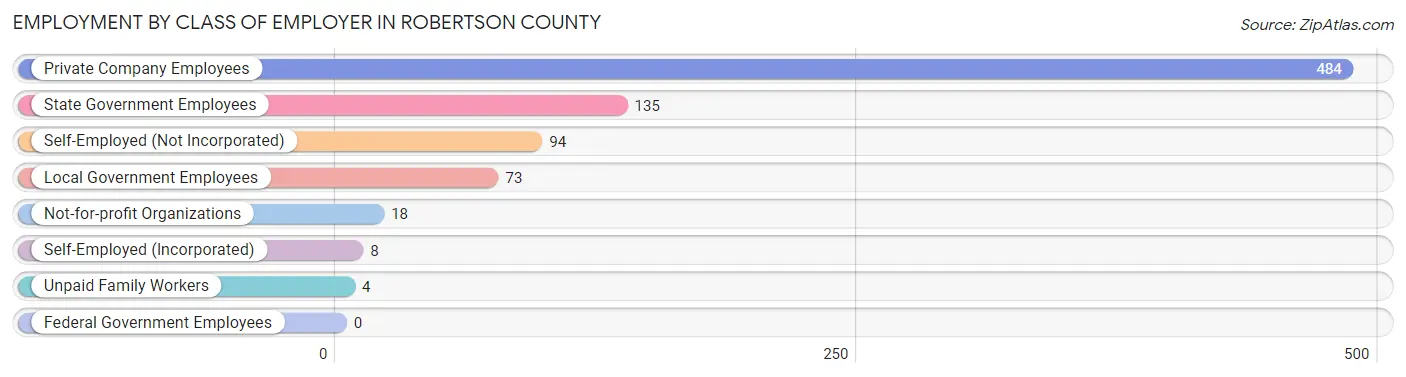
| Employer Class | # Employees | % Employees |
| Private Company Employees | 484 | 59.3% |
| Self-Employed (Incorporated) | 8 | 1.0% |
| Self-Employed (Not Incorporated) | 94 | 11.5% |
| Not-for-profit Organizations | 18 | 2.2% |
| Local Government Employees | 73 | 8.9% |
| State Government Employees | 135 | 16.5% |
| Federal Government Employees | 0 | 0.0% |
| Unpaid Family Workers | 4 | 0.5% |
| Total | 816 | 100.0% |
Employment Status by Age in Robertson County
According to the labor force statistics for Robertson County, out of the total population over 16 years of age (1,708), 52.4% or 895 individuals are in the labor force, with 7.0% or 63 of them unemployed. The age group with the highest labor force participation rate is 45 to 54 years, with 84.1% or 207 individuals in the labor force. Within the labor force, the 25 to 29 years age range has the highest percentage of unemployed individuals, with 28.4% or 19 of them being unemployed.
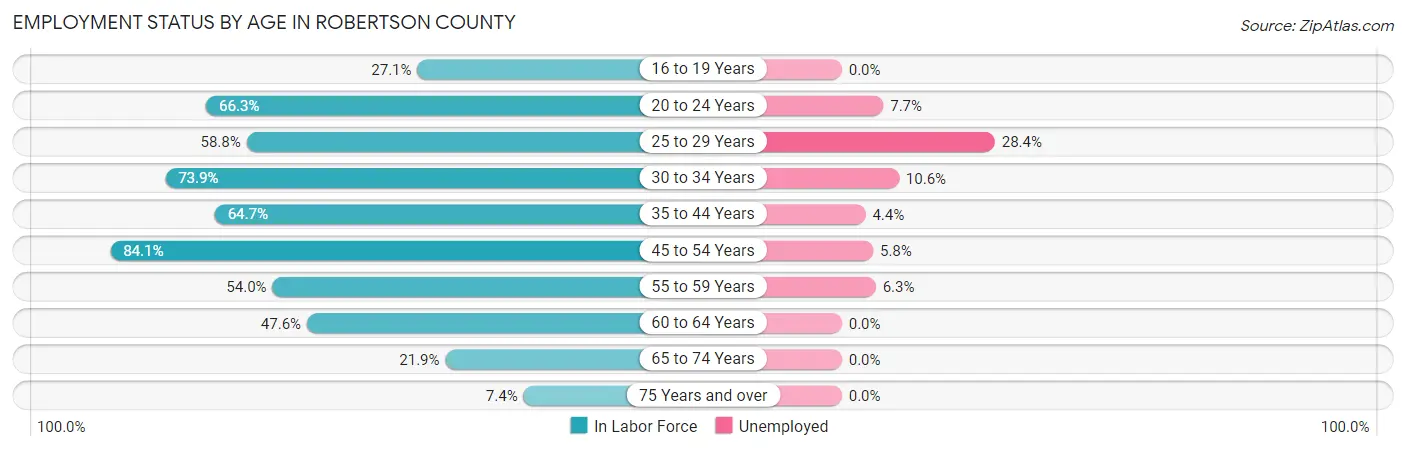
| Age Bracket | In Labor Force | Unemployed |
| 16 to 19 Years | 23 (27.1%) | 0 (0.0%) |
| 20 to 24 Years | 65 (66.3%) | 5 (7.7%) |
| 25 to 29 Years | 67 (58.8%) | 19 (28.4%) |
| 30 to 34 Years | 113 (73.9%) | 12 (10.6%) |
| 35 to 44 Years | 205 (64.7%) | 9 (4.4%) |
| 45 to 54 Years | 207 (84.1%) | 12 (5.8%) |
| 55 to 59 Years | 95 (54.0%) | 6 (6.3%) |
| 60 to 64 Years | 59 (47.6%) | 0 (0.0%) |
| 65 to 74 Years | 48 (21.9%) | 0 (0.0%) |
| 75 Years and over | 13 (7.4%) | 0 (0.0%) |
| Total | 895 (52.4%) | 63 (7.0%) |
Employment Status by Educational Attainment in Robertson County
According to labor force statistics for Robertson County, 66.0% of individuals (746) out of the total population between 25 and 64 years of age (1,130) are in the labor force, with 7.8% or 58 of them being unemployed. The group with the highest labor force participation rate are those with the educational attainment of college / associate degree, with 89.0% or 365 individuals in the labor force. Within the labor force, individuals with high school diploma education have the highest percentage of unemployment, with 10.0% or 25 of them being unemployed.
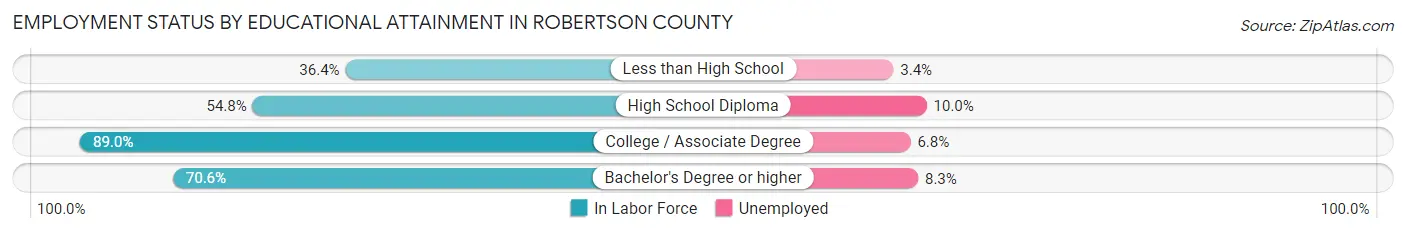
| Educational Attainment | In Labor Force | Unemployed |
| Less than High School | 59 (36.4%) | 6 (3.4%) |
| High School Diploma | 250 (54.8%) | 46 (10.0%) |
| College / Associate Degree | 365 (89.0%) | 28 (6.8%) |
| Bachelor's Degree or higher | 72 (70.6%) | 8 (8.3%) |
| Total | 746 (66.0%) | 88 (7.8%) |
Employment Occupations by Sex in Robertson County
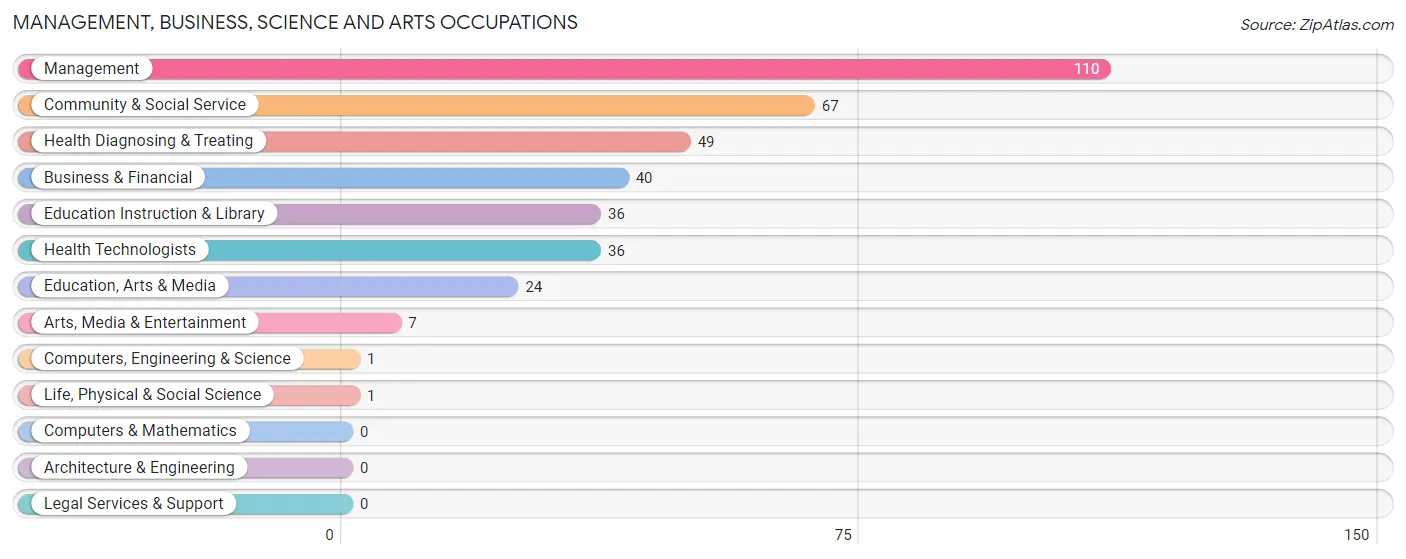
Management, Business, Science and Arts Occupations
The most common Management, Business, Science and Arts occupations in Robertson County are Management (110 | 13.2%), Community & Social Service (67 | 8.1%), Health Diagnosing & Treating (49 | 5.9%), Business & Financial (40 | 4.8%), and Education Instruction & Library (36 | 4.3%).
Management, Business, Science and Arts Occupations by Sex
Within the Management, Business, Science and Arts occupations in Robertson County, the most male-oriented occupations are Computers, Engineering & Science (100.0%), Life, Physical & Social Science (100.0%), and Management (79.1%), while the most female-oriented occupations are Community & Social Service (100.0%), Education, Arts & Media (100.0%), and Education Instruction & Library (100.0%).
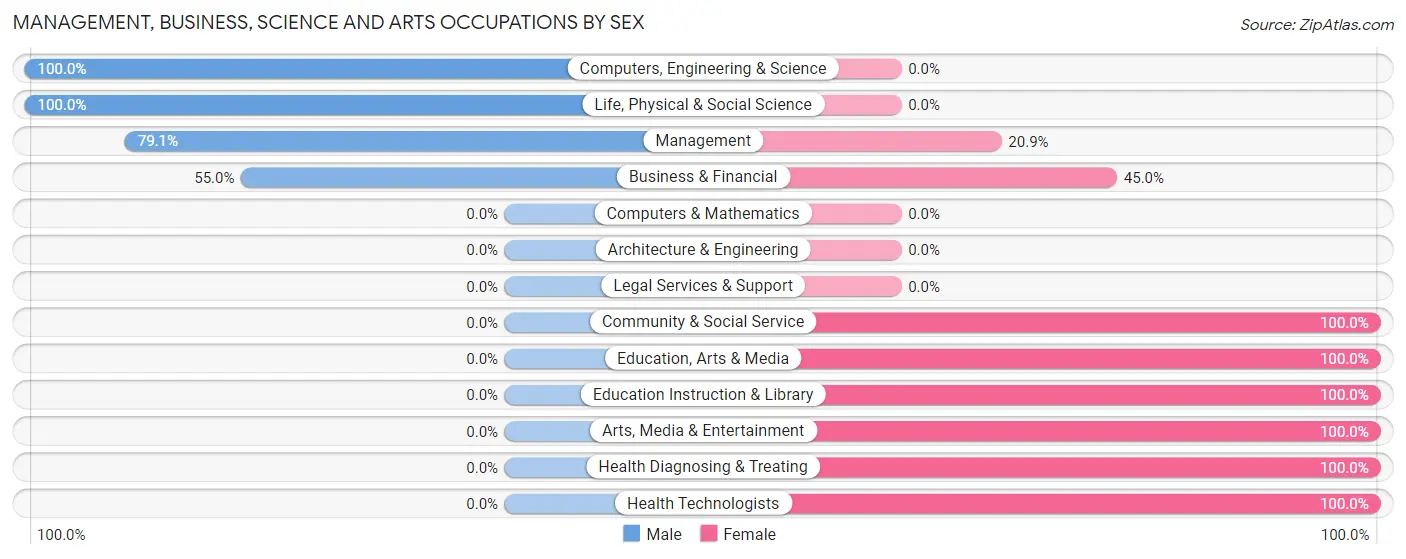
| Occupation | Male | Female |
| Management | 87 (79.1%) | 23 (20.9%) |
| Business & Financial | 22 (55.0%) | 18 (45.0%) |
| Computers, Engineering & Science | 1 (100.0%) | 0 (0.0%) |
| Computers & Mathematics | 0 (0.0%) | 0 (0.0%) |
| Architecture & Engineering | 0 (0.0%) | 0 (0.0%) |
| Life, Physical & Social Science | 1 (100.0%) | 0 (0.0%) |
| Community & Social Service | 0 (0.0%) | 67 (100.0%) |
| Education, Arts & Media | 0 (0.0%) | 24 (100.0%) |
| Legal Services & Support | 0 (0.0%) | 0 (0.0%) |
| Education Instruction & Library | 0 (0.0%) | 36 (100.0%) |
| Arts, Media & Entertainment | 0 (0.0%) | 7 (100.0%) |
| Health Diagnosing & Treating | 0 (0.0%) | 49 (100.0%) |
| Health Technologists | 0 (0.0%) | 36 (100.0%) |
| Total (Category) | 110 (41.2%) | 157 (58.8%) |
| Total (Overall) | 384 (46.2%) | 448 (53.8%) |
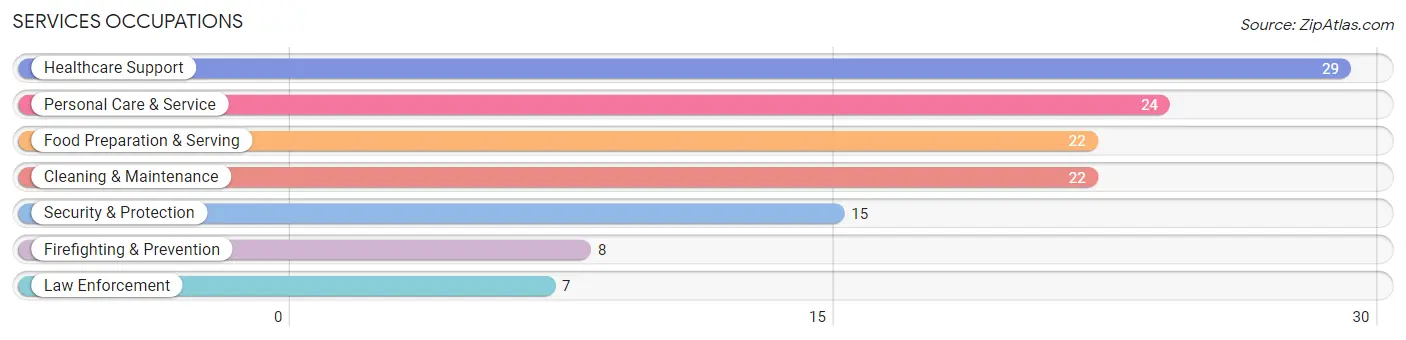
Services Occupations
The most common Services occupations in Robertson County are Healthcare Support (29 | 3.5%), Personal Care & Service (24 | 2.9%), Food Preparation & Serving (22 | 2.6%), Cleaning & Maintenance (22 | 2.6%), and Security & Protection (15 | 1.8%).
Services Occupations by Sex
Within the Services occupations in Robertson County, the most male-oriented occupations are Firefighting & Prevention (100.0%), Security & Protection (73.3%), and Cleaning & Maintenance (54.5%), while the most female-oriented occupations are Healthcare Support (100.0%), Food Preparation & Serving (100.0%), and Personal Care & Service (100.0%).
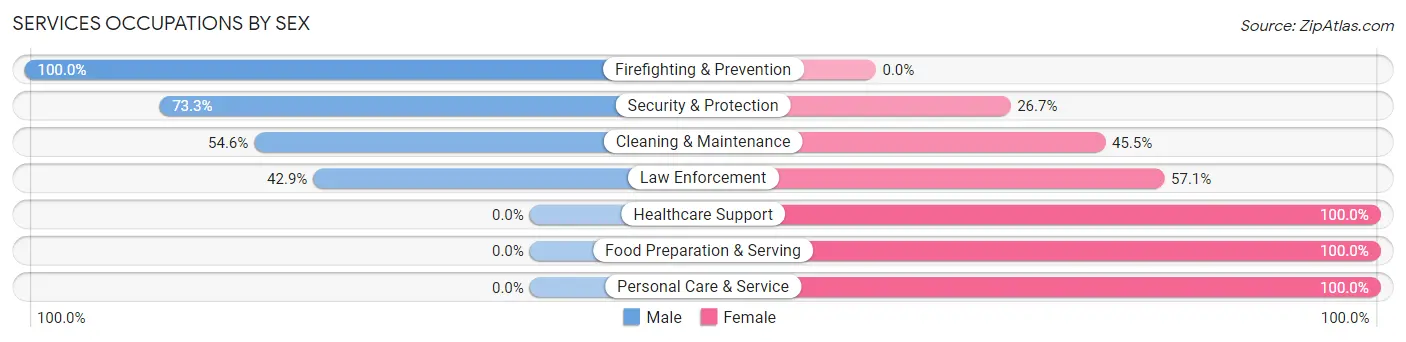
| Occupation | Male | Female |
| Healthcare Support | 0 (0.0%) | 29 (100.0%) |
| Security & Protection | 11 (73.3%) | 4 (26.7%) |
| Firefighting & Prevention | 8 (100.0%) | 0 (0.0%) |
| Law Enforcement | 3 (42.9%) | 4 (57.1%) |
| Food Preparation & Serving | 0 (0.0%) | 22 (100.0%) |
| Cleaning & Maintenance | 12 (54.5%) | 10 (45.5%) |
| Personal Care & Service | 0 (0.0%) | 24 (100.0%) |
| Total (Category) | 23 (20.5%) | 89 (79.5%) |
| Total (Overall) | 384 (46.2%) | 448 (53.8%) |
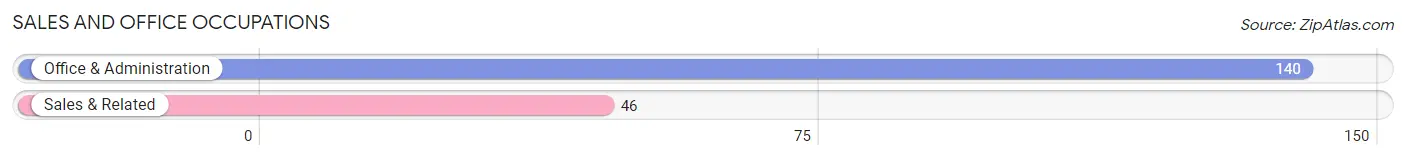
Sales and Office Occupations
The most common Sales and Office occupations in Robertson County are Office & Administration (140 | 16.8%), and Sales & Related (46 | 5.5%).
Sales and Office Occupations by Sex
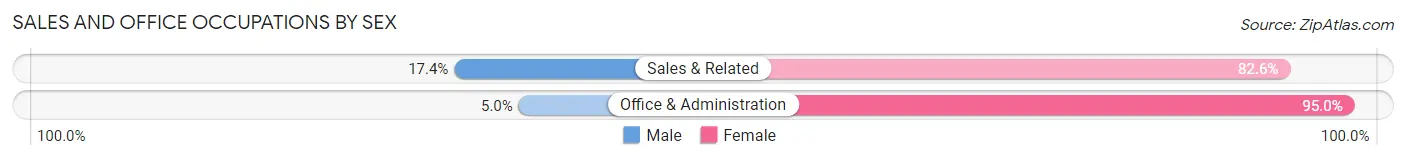
| Occupation | Male | Female |
| Sales & Related | 8 (17.4%) | 38 (82.6%) |
| Office & Administration | 7 (5.0%) | 133 (95.0%) |
| Total (Category) | 15 (8.1%) | 171 (91.9%) |
| Total (Overall) | 384 (46.2%) | 448 (53.8%) |
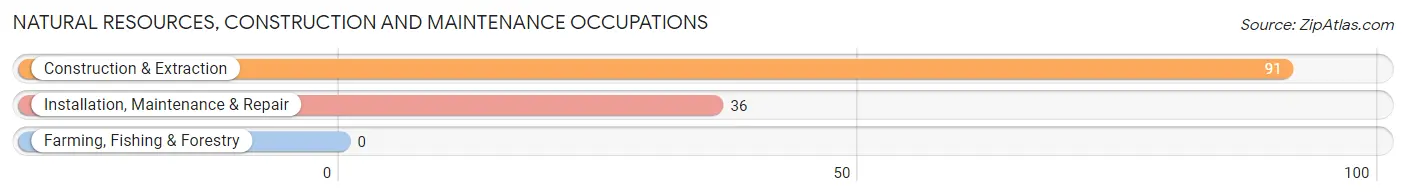
Natural Resources, Construction and Maintenance Occupations
The most common Natural Resources, Construction and Maintenance occupations in Robertson County are Construction & Extraction (91 | 10.9%), and Installation, Maintenance & Repair (36 | 4.3%).
Natural Resources, Construction and Maintenance Occupations by Sex
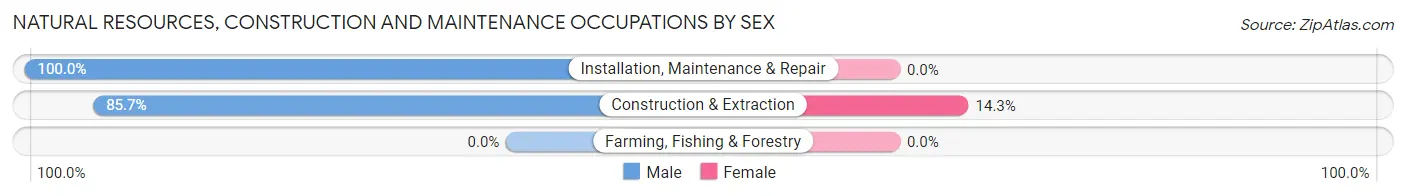
| Occupation | Male | Female |
| Farming, Fishing & Forestry | 0 (0.0%) | 0 (0.0%) |
| Construction & Extraction | 78 (85.7%) | 13 (14.3%) |
| Installation, Maintenance & Repair | 36 (100.0%) | 0 (0.0%) |
| Total (Category) | 114 (89.8%) | 13 (10.2%) |
| Total (Overall) | 384 (46.2%) | 448 (53.8%) |
Production, Transportation and Moving Occupations
The most common Production, Transportation and Moving occupations in Robertson County are Production (62 | 7.4%), Material Moving (45 | 5.4%), and Transportation (33 | 4.0%).
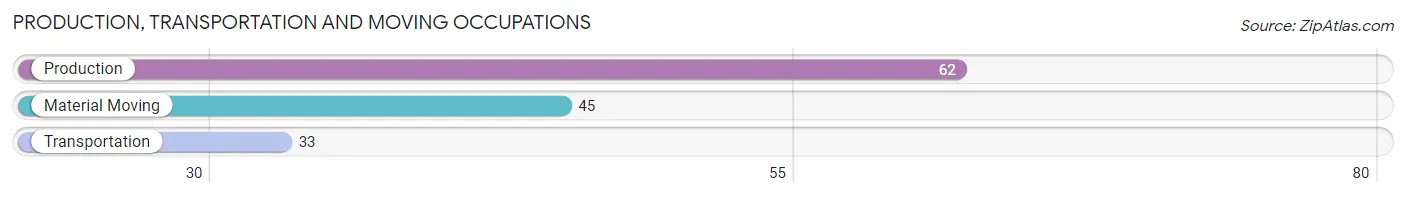
Production, Transportation and Moving Occupations by Sex
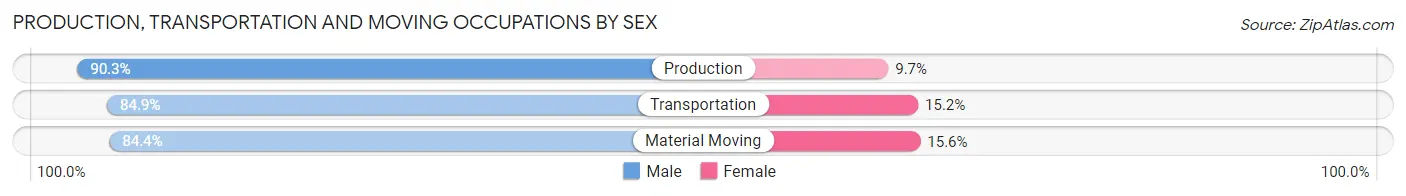
| Occupation | Male | Female |
| Production | 56 (90.3%) | 6 (9.7%) |
| Transportation | 28 (84.9%) | 5 (15.1%) |
| Material Moving | 38 (84.4%) | 7 (15.6%) |
| Total (Category) | 122 (87.1%) | 18 (12.9%) |
| Total (Overall) | 384 (46.2%) | 448 (53.8%) |
Employment Industries by Sex in Robertson County
Employment Industries in Robertson County
The major employment industries in Robertson County include Manufacturing (141 | 17.0%), Construction (121 | 14.5%), Health Care & Social Assistance (105 | 12.6%), Educational Services (102 | 12.3%), and Public Administration (93 | 11.2%).
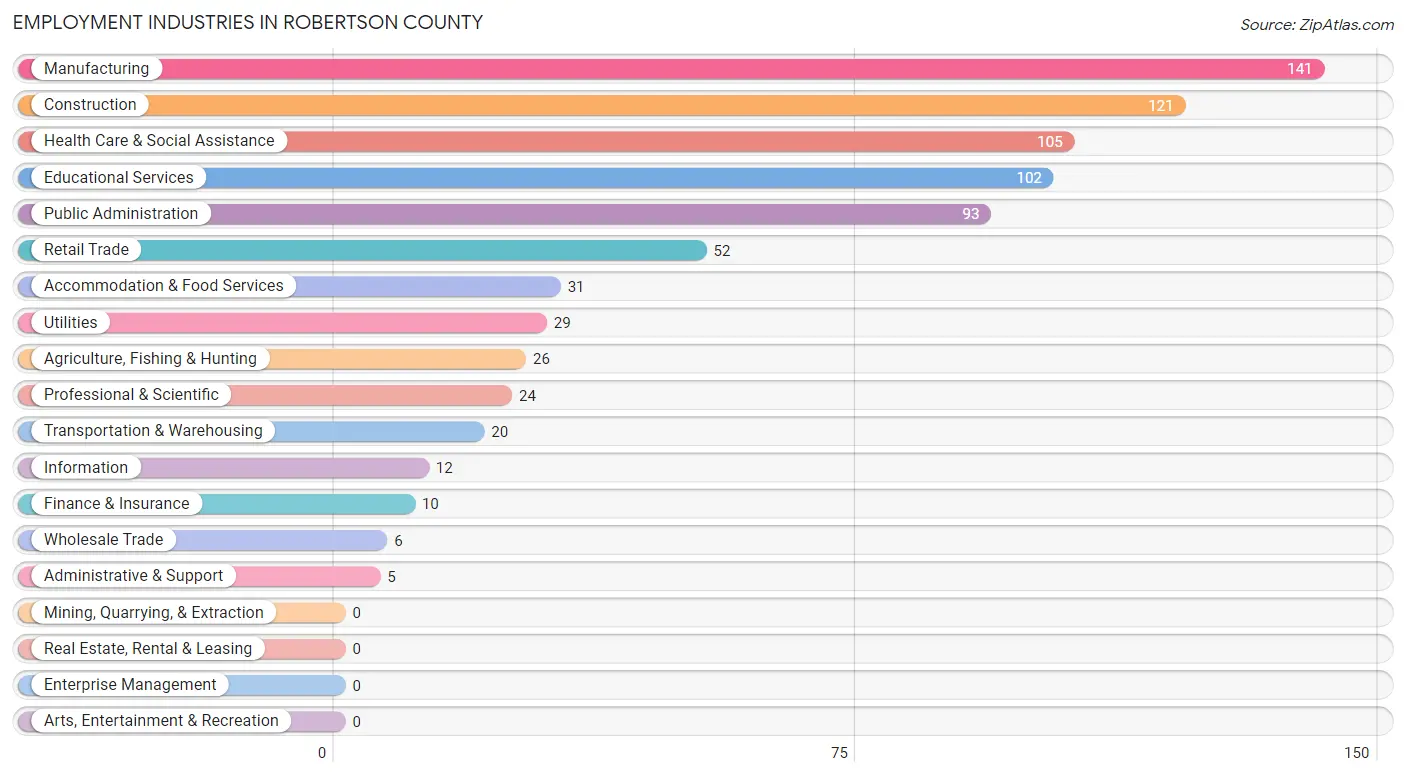
Employment Industries by Sex in Robertson County
The Robertson County industries that see more men than women are Utilities (100.0%), Agriculture, Fishing & Hunting (84.6%), and Manufacturing (75.9%), whereas the industries that tend to have a higher number of women are Wholesale Trade (100.0%), Information (100.0%), and Administrative & Support (100.0%).
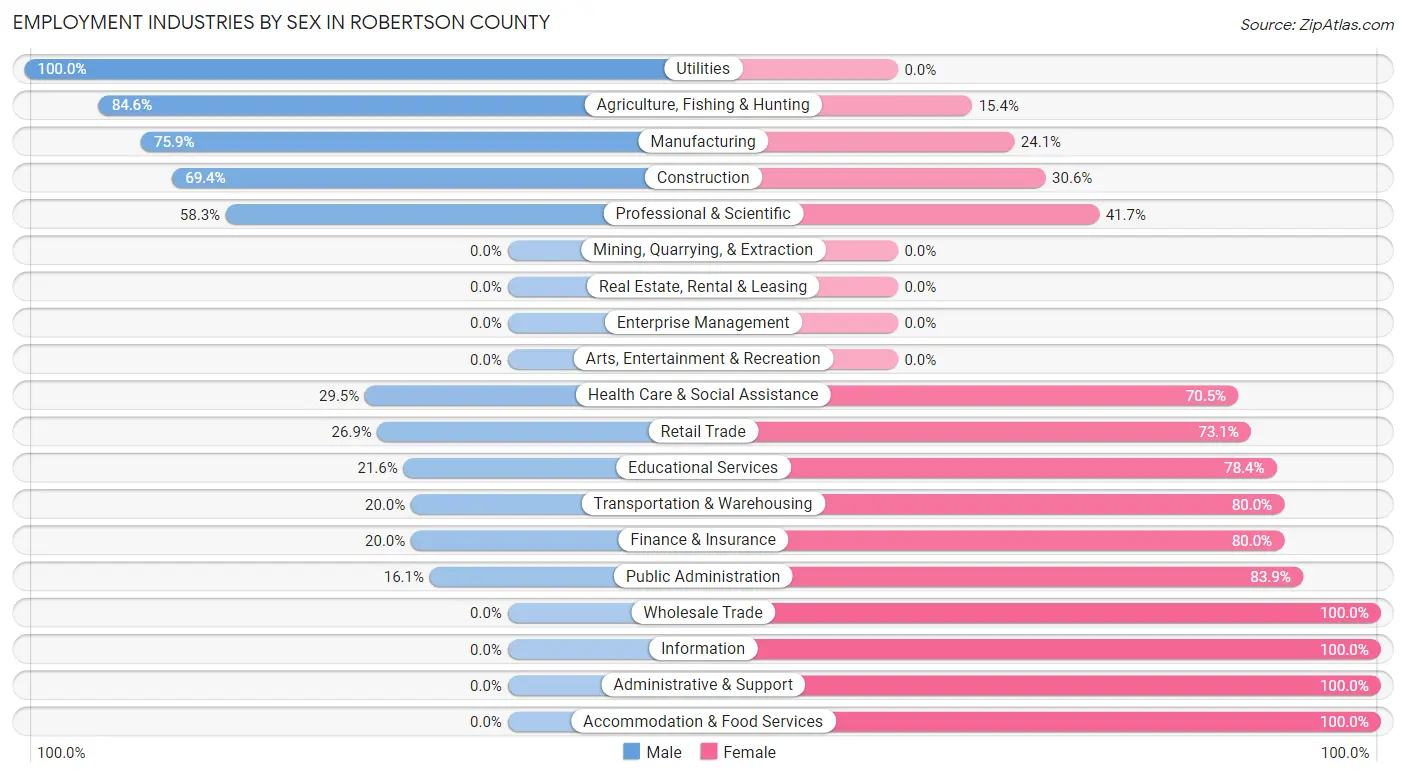
| Industry | Male | Female |
| Agriculture, Fishing & Hunting | 22 (84.6%) | 4 (15.4%) |
| Mining, Quarrying, & Extraction | 0 (0.0%) | 0 (0.0%) |
| Construction | 84 (69.4%) | 37 (30.6%) |
| Manufacturing | 107 (75.9%) | 34 (24.1%) |
| Wholesale Trade | 0 (0.0%) | 6 (100.0%) |
| Retail Trade | 14 (26.9%) | 38 (73.1%) |
| Transportation & Warehousing | 4 (20.0%) | 16 (80.0%) |
| Utilities | 29 (100.0%) | 0 (0.0%) |
| Information | 0 (0.0%) | 12 (100.0%) |
| Finance & Insurance | 2 (20.0%) | 8 (80.0%) |
| Real Estate, Rental & Leasing | 0 (0.0%) | 0 (0.0%) |
| Professional & Scientific | 14 (58.3%) | 10 (41.7%) |
| Enterprise Management | 0 (0.0%) | 0 (0.0%) |
| Administrative & Support | 0 (0.0%) | 5 (100.0%) |
| Educational Services | 22 (21.6%) | 80 (78.4%) |
| Health Care & Social Assistance | 31 (29.5%) | 74 (70.5%) |
| Arts, Entertainment & Recreation | 0 (0.0%) | 0 (0.0%) |
| Accommodation & Food Services | 0 (0.0%) | 31 (100.0%) |
| Public Administration | 15 (16.1%) | 78 (83.9%) |
| Total | 384 (46.2%) | 448 (53.8%) |
Education in Robertson County
School Enrollment in Robertson County
The most common levels of schooling among the 546 students in Robertson County are middle school (155 | 28.4%), elementary school (125 | 22.9%), and high school (125 | 22.9%).
| School Level | # Students | % Students |
| Nursery / Preschool | 93 | 17.0% |
| Kindergarten | 10 | 1.8% |
| Elementary School | 125 | 22.9% |
| Middle School | 155 | 28.4% |
| High School | 125 | 22.9% |
| College / Undergraduate | 38 | 7.0% |
| Graduate / Professional | 0 | 0.0% |
| Total | 546 | 100.0% |
School Enrollment by Age by Funding Source in Robertson County
Out of a total of 546 students who are enrolled in schools in Robertson County, 14 (2.6%) attend a private institution, while the remaining 532 (97.4%) are enrolled in public schools. The age group of 18 to 19 year olds has the highest likelihood of being enrolled in private schools, with 4 (25.0% in the age bracket) enrolled. Conversely, the age group of 3 to 4 year olds has the lowest likelihood of being enrolled in a private school, with 34 (100.0% in the age bracket) attending a public institution.
| Age Bracket | Public School | Private School |
| 3 to 4 Year Olds | 34 (100.0%) | 0 (0.0%) |
| 5 to 9 Year Old | 190 (97.9%) | 4 (2.1%) |
| 10 to 14 Year Olds | 160 (96.4%) | 6 (3.6%) |
| 15 to 17 Year Olds | 105 (100.0%) | 0 (0.0%) |
| 18 to 19 Year Olds | 12 (75.0%) | 4 (25.0%) |
| 20 to 24 Year Olds | 21 (100.0%) | 0 (0.0%) |
| 25 to 34 Year Olds | 10 (100.0%) | 0 (0.0%) |
| 35 Years and over | 0 (0.0%) | 0 (0.0%) |
| Total | 532 (97.4%) | 14 (2.6%) |
Educational Attainment by Field of Study in Robertson County
Science & technology (39 | 21.0%), bio, nature & agricultural (30 | 16.1%), visual & performing arts (27 | 14.5%), arts & humanities (22 | 11.8%), and psychology (21 | 11.3%) are the most common fields of study among 186 individuals in Robertson County who have obtained a bachelor's degree or higher.
| Field of Study | # Graduates | % Graduates |
| Computers & Mathematics | 0 | 0.0% |
| Bio, Nature & Agricultural | 30 | 16.1% |
| Physical & Health Sciences | 0 | 0.0% |
| Psychology | 21 | 11.3% |
| Social Sciences | 0 | 0.0% |
| Engineering | 3 | 1.6% |
| Multidisciplinary Studies | 1 | 0.5% |
| Science & Technology | 39 | 21.0% |
| Business | 21 | 11.3% |
| Education | 14 | 7.5% |
| Literature & Languages | 2 | 1.1% |
| Liberal Arts & History | 0 | 0.0% |
| Visual & Performing Arts | 27 | 14.5% |
| Communications | 6 | 3.2% |
| Arts & Humanities | 22 | 11.8% |
| Total | 186 | 100.0% |
Transportation & Commute in Robertson County
Vehicle Availability by Sex in Robertson County
The most prevalent vehicle ownership categories in Robertson County are males with 2 vehicles (158, accounting for 41.9%) and females with 2 vehicles (128, making up 36.0%).
| Vehicles Available | Male | Female |
| No Vehicle | 0 (0.0%) | 0 (0.0%) |
| 1 Vehicle | 29 (7.7%) | 112 (25.5%) |
| 2 Vehicles | 158 (41.9%) | 128 (29.2%) |
| 3 Vehicles | 105 (27.9%) | 79 (18.0%) |
| 4 Vehicles | 35 (9.3%) | 84 (19.1%) |
| 5 or more Vehicles | 50 (13.3%) | 36 (8.2%) |
| Total | 377 (100.0%) | 439 (100.0%) |
Commute Time in Robertson County
The most frequently occuring commute durations in Robertson County are 30 to 34 minutes (174 commuters, 22.5%), 5 to 9 minutes (110 commuters, 14.2%), and 90 or more minutes (74 commuters, 9.6%).
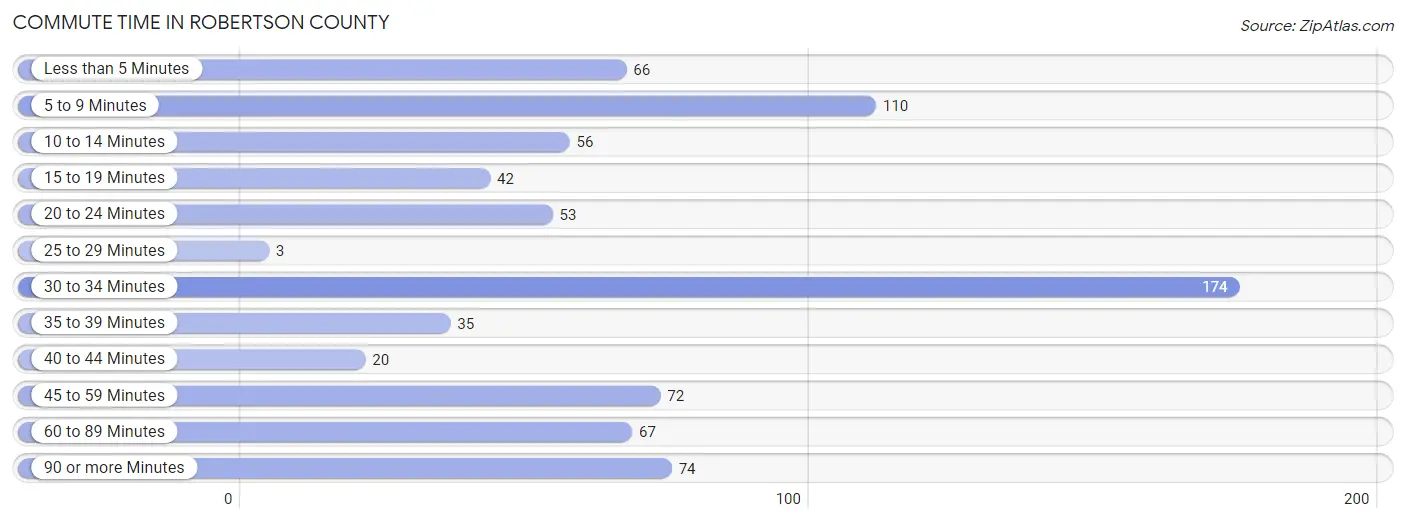
| Commute Time | # Commuters | % Commuters |
| Less than 5 Minutes | 66 | 8.6% |
| 5 to 9 Minutes | 110 | 14.2% |
| 10 to 14 Minutes | 56 | 7.2% |
| 15 to 19 Minutes | 42 | 5.4% |
| 20 to 24 Minutes | 53 | 6.9% |
| 25 to 29 Minutes | 3 | 0.4% |
| 30 to 34 Minutes | 174 | 22.5% |
| 35 to 39 Minutes | 35 | 4.5% |
| 40 to 44 Minutes | 20 | 2.6% |
| 45 to 59 Minutes | 72 | 9.3% |
| 60 to 89 Minutes | 67 | 8.7% |
| 90 or more Minutes | 74 | 9.6% |
Commute Time by Sex in Robertson County
The most common commute times in Robertson County are 30 to 34 minutes (110 commuters, 30.5%) for males and less than 5 minutes (66 commuters, 16.1%) for females.
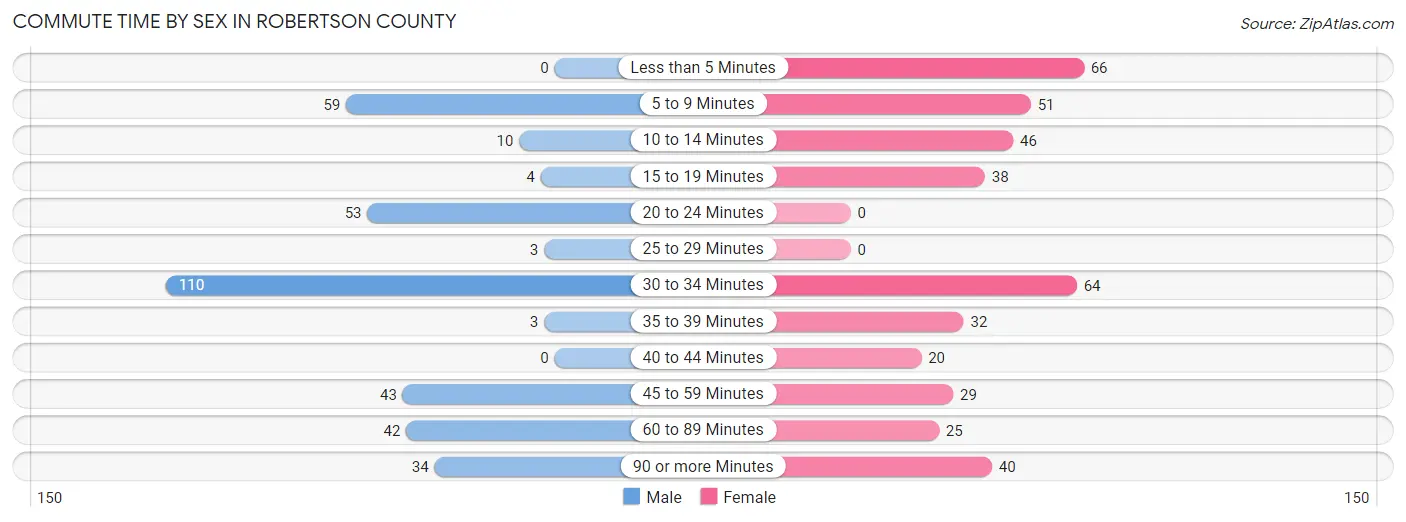
| Commute Time | Male | Female |
| Less than 5 Minutes | 0 (0.0%) | 66 (16.1%) |
| 5 to 9 Minutes | 59 (16.3%) | 51 (12.4%) |
| 10 to 14 Minutes | 10 (2.8%) | 46 (11.2%) |
| 15 to 19 Minutes | 4 (1.1%) | 38 (9.2%) |
| 20 to 24 Minutes | 53 (14.7%) | 0 (0.0%) |
| 25 to 29 Minutes | 3 (0.8%) | 0 (0.0%) |
| 30 to 34 Minutes | 110 (30.5%) | 64 (15.6%) |
| 35 to 39 Minutes | 3 (0.8%) | 32 (7.8%) |
| 40 to 44 Minutes | 0 (0.0%) | 20 (4.9%) |
| 45 to 59 Minutes | 43 (11.9%) | 29 (7.1%) |
| 60 to 89 Minutes | 42 (11.6%) | 25 (6.1%) |
| 90 or more Minutes | 34 (9.4%) | 40 (9.7%) |
Time of Departure to Work by Sex in Robertson County
The most frequent times of departure to work in Robertson County are 7:30 AM to 7:59 AM (76, 21.0%) for males and 7:30 AM to 7:59 AM (77, 18.7%) for females.
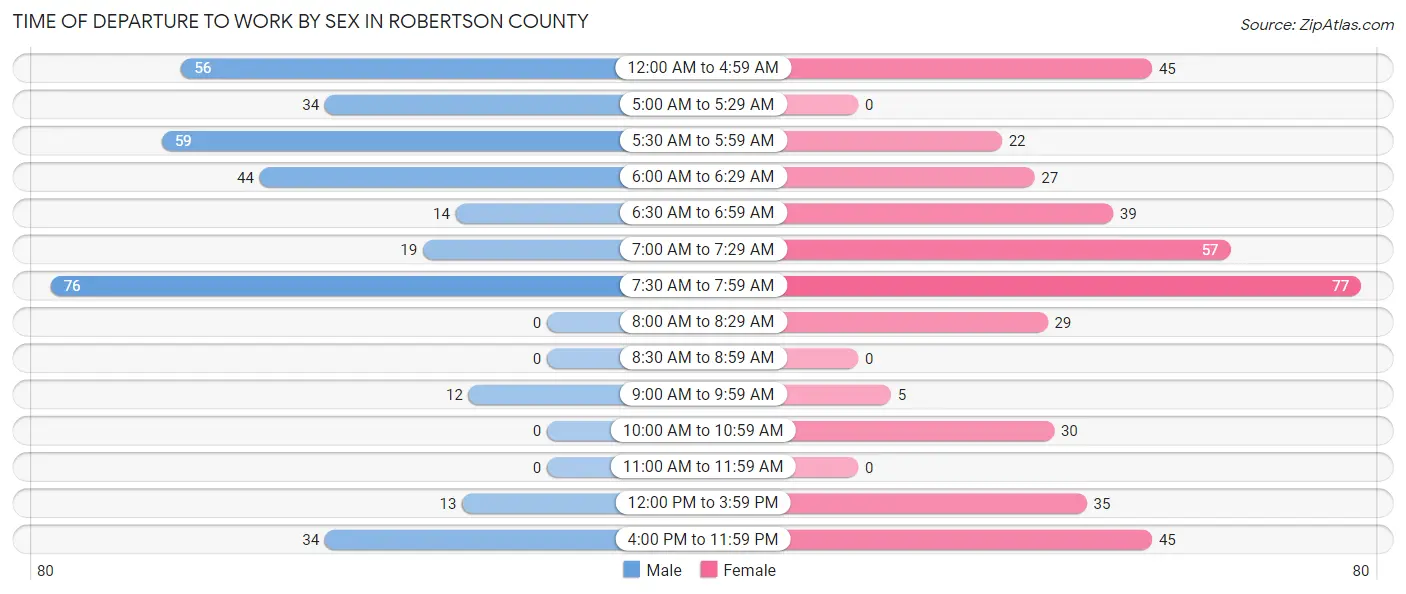
| Time of Departure | Male | Female |
| 12:00 AM to 4:59 AM | 56 (15.5%) | 45 (11.0%) |
| 5:00 AM to 5:29 AM | 34 (9.4%) | 0 (0.0%) |
| 5:30 AM to 5:59 AM | 59 (16.3%) | 22 (5.3%) |
| 6:00 AM to 6:29 AM | 44 (12.2%) | 27 (6.6%) |
| 6:30 AM to 6:59 AM | 14 (3.9%) | 39 (9.5%) |
| 7:00 AM to 7:29 AM | 19 (5.3%) | 57 (13.9%) |
| 7:30 AM to 7:59 AM | 76 (21.0%) | 77 (18.7%) |
| 8:00 AM to 8:29 AM | 0 (0.0%) | 29 (7.1%) |
| 8:30 AM to 8:59 AM | 0 (0.0%) | 0 (0.0%) |
| 9:00 AM to 9:59 AM | 12 (3.3%) | 5 (1.2%) |
| 10:00 AM to 10:59 AM | 0 (0.0%) | 30 (7.3%) |
| 11:00 AM to 11:59 AM | 0 (0.0%) | 0 (0.0%) |
| 12:00 PM to 3:59 PM | 13 (3.6%) | 35 (8.5%) |
| 4:00 PM to 11:59 PM | 34 (9.4%) | 45 (11.0%) |
| Total | 361 (100.0%) | 411 (100.0%) |
Housing Occupancy in Robertson County
Occupancy by Ownership in Robertson County
Of the total 797 dwellings in Robertson County, owner-occupied units account for 591 (74.2%), while renter-occupied units make up 206 (25.9%).
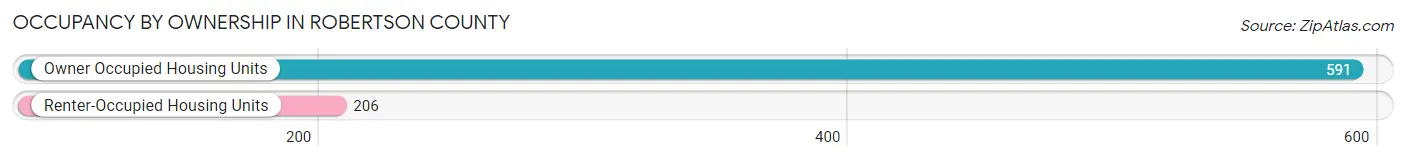
| Occupancy | # Housing Units | % Housing Units |
| Owner Occupied Housing Units | 591 | 74.2% |
| Renter-Occupied Housing Units | 206 | 25.9% |
| Total Occupied Housing Units | 797 | 100.0% |
Occupancy by Household Size in Robertson County
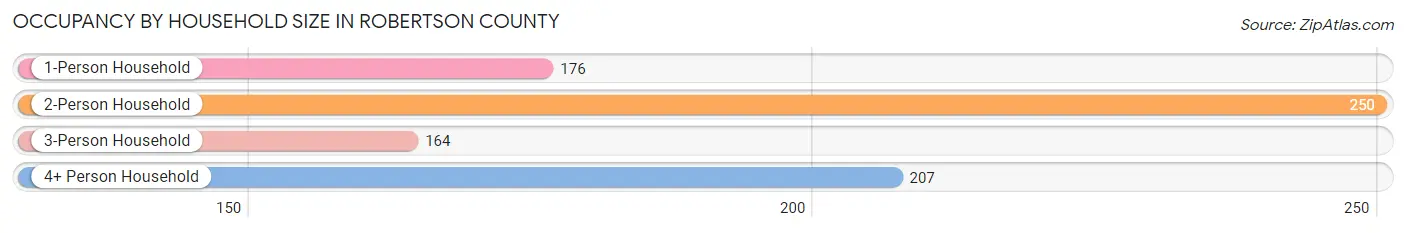
| Household Size | # Housing Units | % Housing Units |
| 1-Person Household | 176 | 22.1% |
| 2-Person Household | 250 | 31.4% |
| 3-Person Household | 164 | 20.6% |
| 4+ Person Household | 207 | 26.0% |
| Total Housing Units | 797 | 100.0% |
Occupancy by Ownership by Household Size in Robertson County
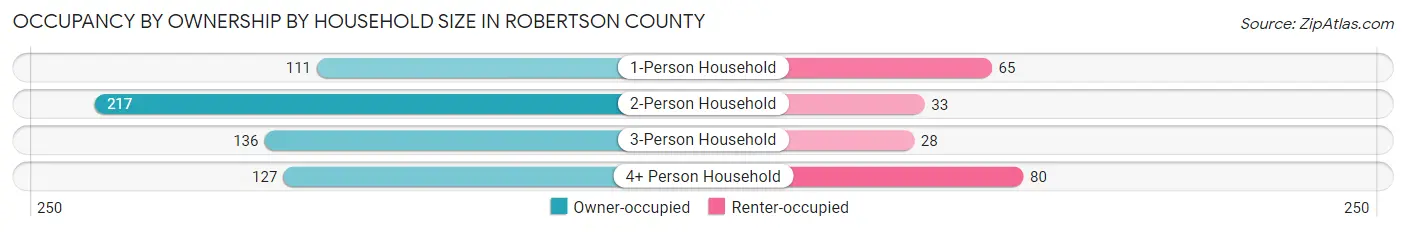
| Household Size | Owner-occupied | Renter-occupied |
| 1-Person Household | 111 (63.1%) | 65 (36.9%) |
| 2-Person Household | 217 (86.8%) | 33 (13.2%) |
| 3-Person Household | 136 (82.9%) | 28 (17.1%) |
| 4+ Person Household | 127 (61.4%) | 80 (38.7%) |
| Total Housing Units | 591 (74.2%) | 206 (25.9%) |
Occupancy by Educational Attainment in Robertson County
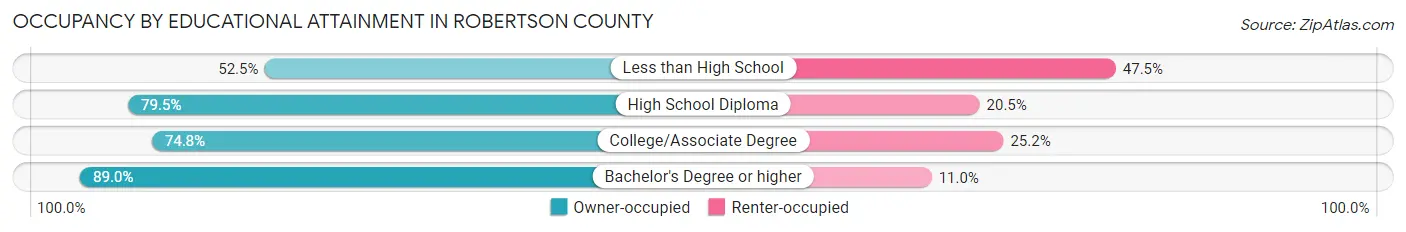
| Household Size | Owner-occupied | Renter-occupied |
| Less than High School | 74 (52.5%) | 67 (47.5%) |
| High School Diploma | 186 (79.5%) | 48 (20.5%) |
| College/Associate Degree | 234 (74.8%) | 79 (25.2%) |
| Bachelor's Degree or higher | 97 (89.0%) | 12 (11.0%) |
Occupancy by Age of Householder in Robertson County
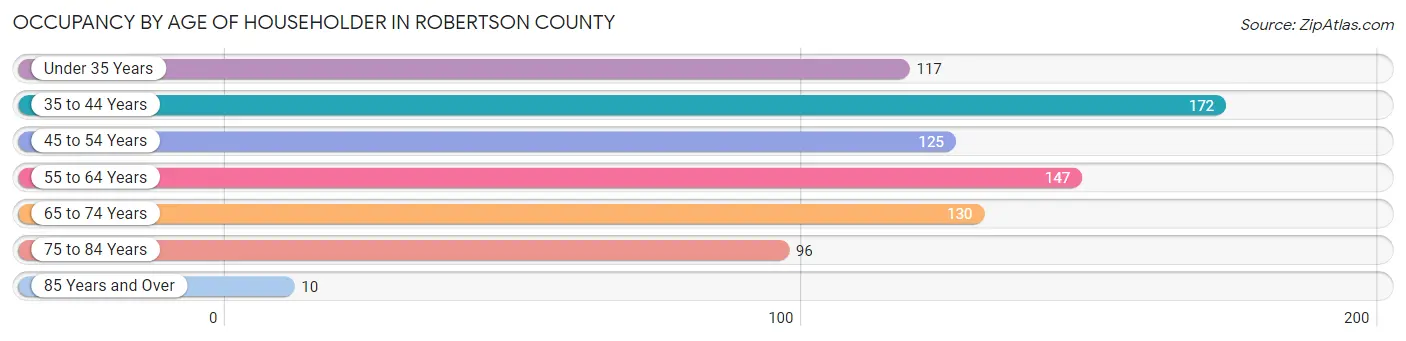
| Age Bracket | # Households | % Households |
| Under 35 Years | 117 | 14.7% |
| 35 to 44 Years | 172 | 21.6% |
| 45 to 54 Years | 125 | 15.7% |
| 55 to 64 Years | 147 | 18.4% |
| 65 to 74 Years | 130 | 16.3% |
| 75 to 84 Years | 96 | 12.0% |
| 85 Years and Over | 10 | 1.3% |
| Total | 797 | 100.0% |
Housing Finances in Robertson County
Median Income by Occupancy in Robertson County
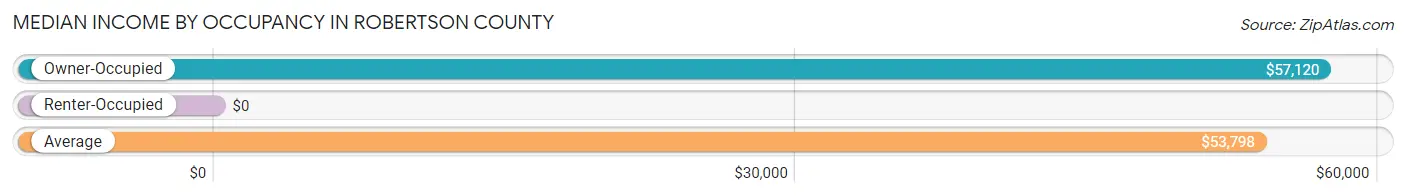
| Occupancy Type | # Households | Median Income |
| Owner-Occupied | 591 (74.2%) | $57,120 |
| Renter-Occupied | 206 (25.9%) | $0 |
| Average | 797 (100.0%) | $53,798 |
Occupancy by Householder Income Bracket in Robertson County
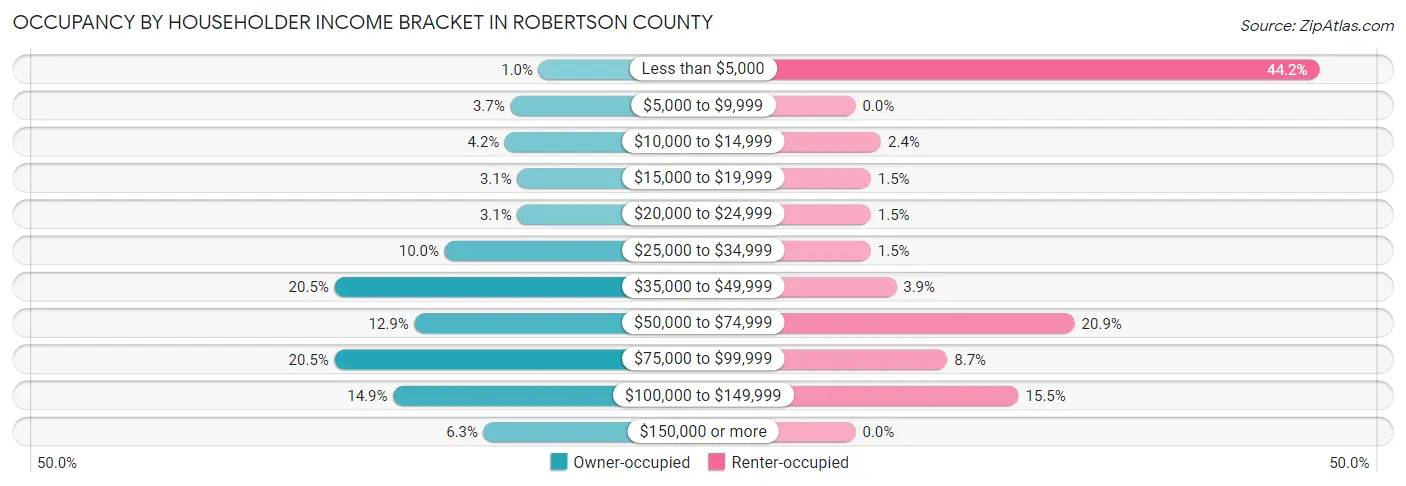
| Income Bracket | Owner-occupied | Renter-occupied |
| Less than $5,000 | 6 (1.0%) | 91 (44.2%) |
| $5,000 to $9,999 | 22 (3.7%) | 0 (0.0%) |
| $10,000 to $14,999 | 25 (4.2%) | 5 (2.4%) |
| $15,000 to $19,999 | 18 (3.0%) | 3 (1.5%) |
| $20,000 to $24,999 | 18 (3.0%) | 3 (1.5%) |
| $25,000 to $34,999 | 59 (10.0%) | 3 (1.5%) |
| $35,000 to $49,999 | 121 (20.5%) | 8 (3.9%) |
| $50,000 to $74,999 | 76 (12.9%) | 43 (20.9%) |
| $75,000 to $99,999 | 121 (20.5%) | 18 (8.7%) |
| $100,000 to $149,999 | 88 (14.9%) | 32 (15.5%) |
| $150,000 or more | 37 (6.3%) | 0 (0.0%) |
| Total | 591 (100.0%) | 206 (100.0%) |
Monthly Housing Cost Tiers in Robertson County
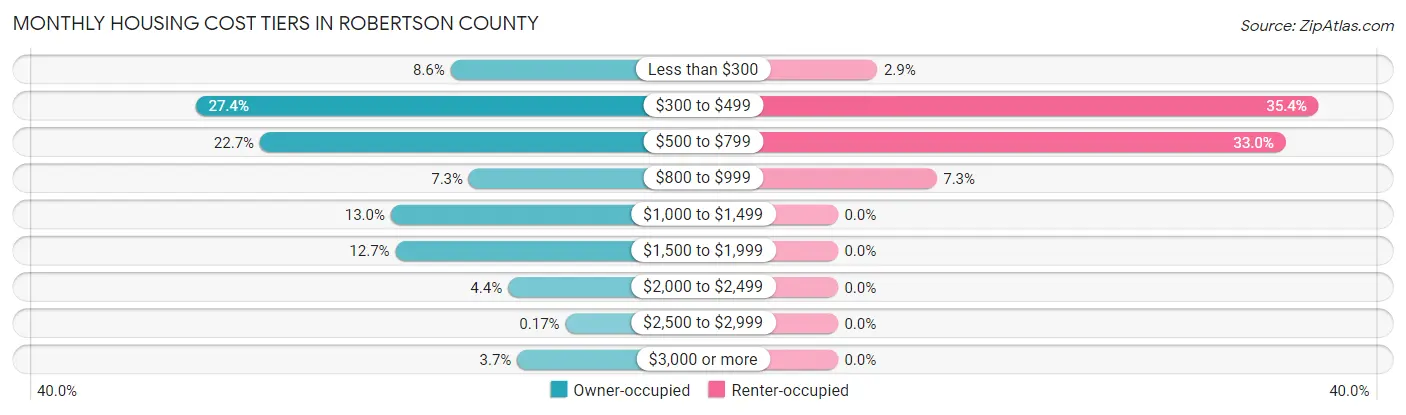
| Monthly Cost | Owner-occupied | Renter-occupied |
| Less than $300 | 51 (8.6%) | 6 (2.9%) |
| $300 to $499 | 162 (27.4%) | 73 (35.4%) |
| $500 to $799 | 134 (22.7%) | 68 (33.0%) |
| $800 to $999 | 43 (7.3%) | 15 (7.3%) |
| $1,000 to $1,499 | 77 (13.0%) | 0 (0.0%) |
| $1,500 to $1,999 | 75 (12.7%) | 0 (0.0%) |
| $2,000 to $2,499 | 26 (4.4%) | 0 (0.0%) |
| $2,500 to $2,999 | 1 (0.2%) | 0 (0.0%) |
| $3,000 or more | 22 (3.7%) | 0 (0.0%) |
| Total | 591 (100.0%) | 206 (100.0%) |
Physical Housing Characteristics in Robertson County
Housing Structures in Robertson County
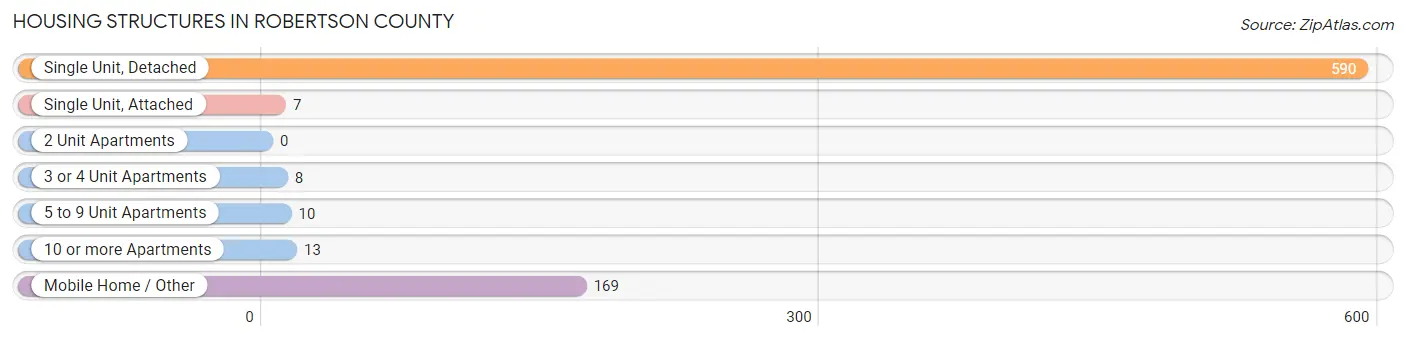
| Structure Type | # Housing Units | % Housing Units |
| Single Unit, Detached | 590 | 74.0% |
| Single Unit, Attached | 7 | 0.9% |
| 2 Unit Apartments | 0 | 0.0% |
| 3 or 4 Unit Apartments | 8 | 1.0% |
| 5 to 9 Unit Apartments | 10 | 1.3% |
| 10 or more Apartments | 13 | 1.6% |
| Mobile Home / Other | 169 | 21.2% |
| Total | 797 | 100.0% |
Housing Structures by Occupancy in Robertson County
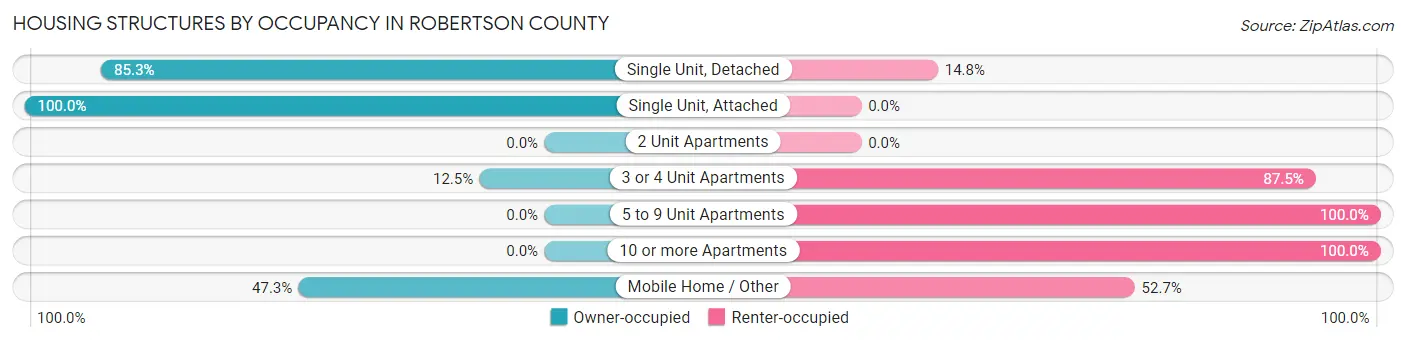
| Structure Type | Owner-occupied | Renter-occupied |
| Single Unit, Detached | 503 (85.3%) | 87 (14.7%) |
| Single Unit, Attached | 7 (100.0%) | 0 (0.0%) |
| 2 Unit Apartments | 0 (0.0%) | 0 (0.0%) |
| 3 or 4 Unit Apartments | 1 (12.5%) | 7 (87.5%) |
| 5 to 9 Unit Apartments | 0 (0.0%) | 10 (100.0%) |
| 10 or more Apartments | 0 (0.0%) | 13 (100.0%) |
| Mobile Home / Other | 80 (47.3%) | 89 (52.7%) |
| Total | 591 (74.2%) | 206 (25.9%) |
Housing Structures by Number of Rooms in Robertson County
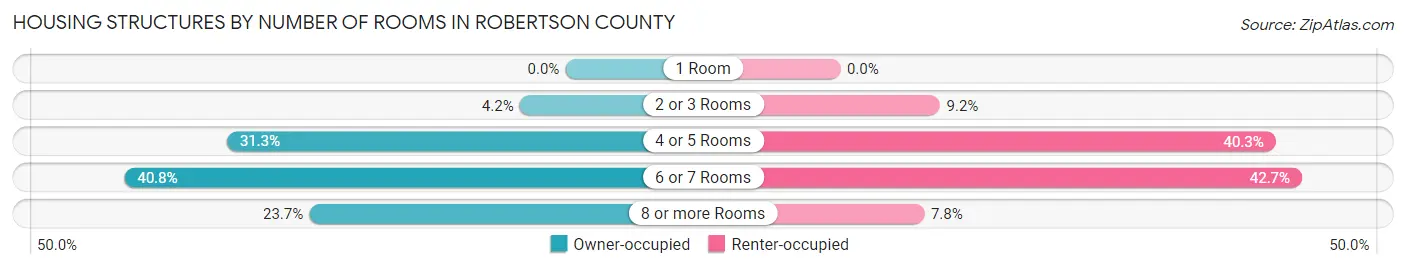
| Number of Rooms | Owner-occupied | Renter-occupied |
| 1 Room | 0 (0.0%) | 0 (0.0%) |
| 2 or 3 Rooms | 25 (4.2%) | 19 (9.2%) |
| 4 or 5 Rooms | 185 (31.3%) | 83 (40.3%) |
| 6 or 7 Rooms | 241 (40.8%) | 88 (42.7%) |
| 8 or more Rooms | 140 (23.7%) | 16 (7.8%) |
| Total | 591 (100.0%) | 206 (100.0%) |
Housing Structure by Heating Type in Robertson County
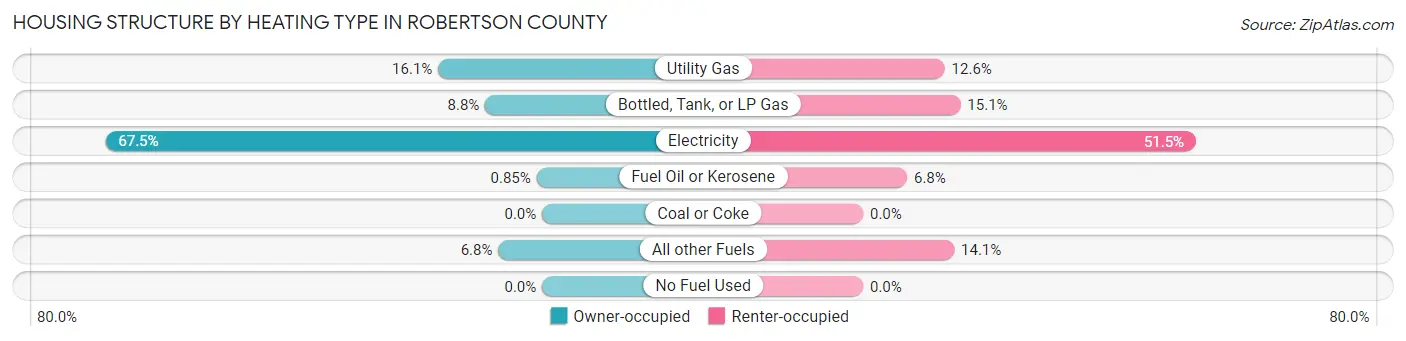
| Heating Type | Owner-occupied | Renter-occupied |
| Utility Gas | 95 (16.1%) | 26 (12.6%) |
| Bottled, Tank, or LP Gas | 52 (8.8%) | 31 (15.0%) |
| Electricity | 399 (67.5%) | 106 (51.5%) |
| Fuel Oil or Kerosene | 5 (0.9%) | 14 (6.8%) |
| Coal or Coke | 0 (0.0%) | 0 (0.0%) |
| All other Fuels | 40 (6.8%) | 29 (14.1%) |
| No Fuel Used | 0 (0.0%) | 0 (0.0%) |
| Total | 591 (100.0%) | 206 (100.0%) |
Household Vehicle Usage in Robertson County
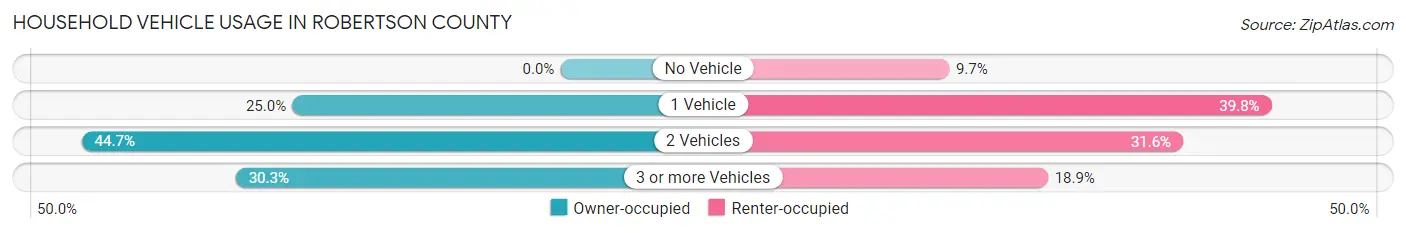
| Vehicles per Household | Owner-occupied | Renter-occupied |
| No Vehicle | 0 (0.0%) | 20 (9.7%) |
| 1 Vehicle | 148 (25.0%) | 82 (39.8%) |
| 2 Vehicles | 264 (44.7%) | 65 (31.6%) |
| 3 or more Vehicles | 179 (30.3%) | 39 (18.9%) |
| Total | 591 (100.0%) | 206 (100.0%) |
Real Estate & Mortgages in Robertson County
Real Estate and Mortgage Overview in Robertson County
| Characteristic | Without Mortgage | With Mortgage |
| Housing Units | 257 | 334 |
| Median Property Value | $106,300 | $200,000 |
| Median Household Income | $38,750 | $23 |
| Monthly Housing Costs | $365 | $22 |
| Real Estate Taxes | $650 | $8 |
Property Value by Mortgage Status in Robertson County
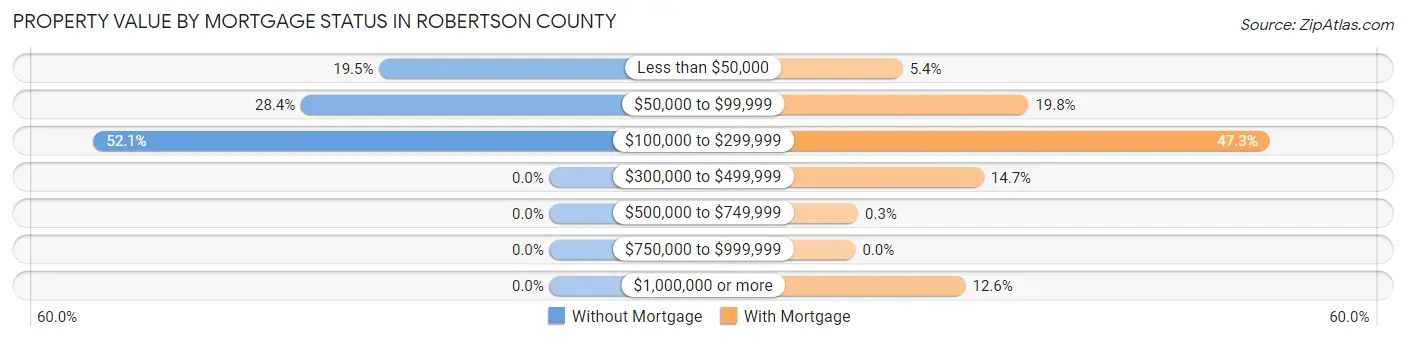
| Property Value | Without Mortgage | With Mortgage |
| Less than $50,000 | 50 (19.5%) | 18 (5.4%) |
| $50,000 to $99,999 | 73 (28.4%) | 66 (19.8%) |
| $100,000 to $299,999 | 134 (52.1%) | 158 (47.3%) |
| $300,000 to $499,999 | 0 (0.0%) | 49 (14.7%) |
| $500,000 to $749,999 | 0 (0.0%) | 1 (0.3%) |
| $750,000 to $999,999 | 0 (0.0%) | 0 (0.0%) |
| $1,000,000 or more | 0 (0.0%) | 42 (12.6%) |
| Total | 257 (100.0%) | 334 (100.0%) |
Household Income by Mortgage Status in Robertson County
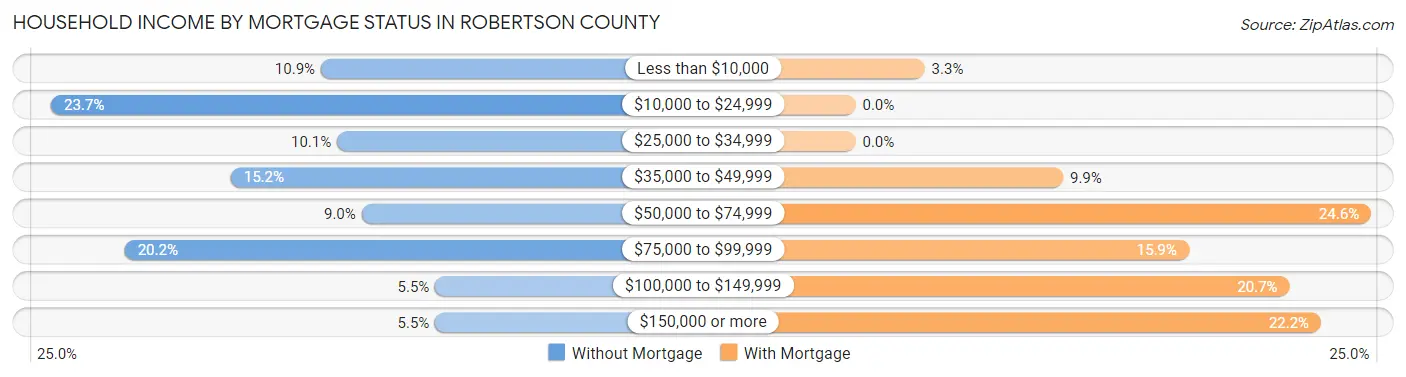
| Household Income | Without Mortgage | With Mortgage |
| Less than $10,000 | 28 (10.9%) | 11 (3.3%) |
| $10,000 to $24,999 | 61 (23.7%) | 0 (0.0%) |
| $25,000 to $34,999 | 26 (10.1%) | 0 (0.0%) |
| $35,000 to $49,999 | 39 (15.2%) | 33 (9.9%) |
| $50,000 to $74,999 | 23 (8.9%) | 82 (24.5%) |
| $75,000 to $99,999 | 52 (20.2%) | 53 (15.9%) |
| $100,000 to $149,999 | 14 (5.4%) | 69 (20.7%) |
| $150,000 or more | 14 (5.4%) | 74 (22.2%) |
| Total | 257 (100.0%) | 334 (100.0%) |
Property Value to Household Income Ratio in Robertson County
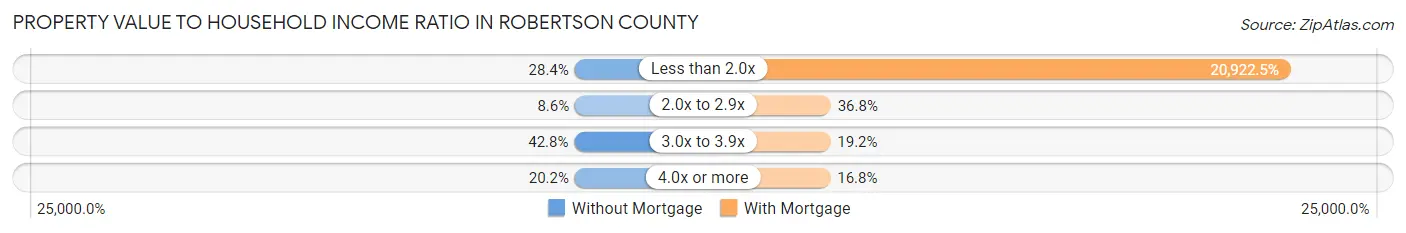
| Value-to-Income Ratio | Without Mortgage | With Mortgage |
| Less than 2.0x | 73 (28.4%) | 69,881 (20,922.5%) |
| 2.0x to 2.9x | 22 (8.6%) | 123 (36.8%) |
| 3.0x to 3.9x | 110 (42.8%) | 64 (19.2%) |
| 4.0x or more | 52 (20.2%) | 56 (16.8%) |
| Total | 257 (100.0%) | 334 (100.0%) |
Real Estate Taxes by Mortgage Status in Robertson County
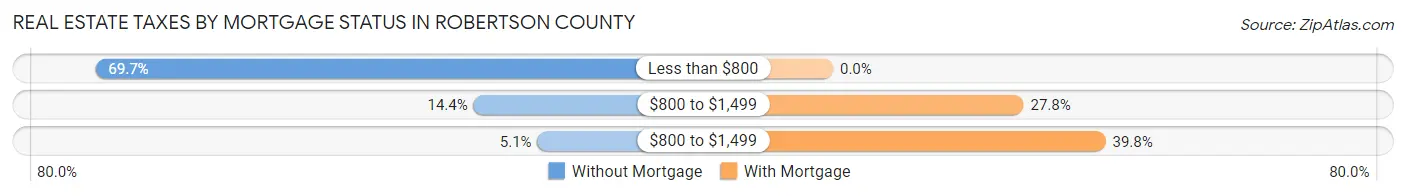
| Property Taxes | Without Mortgage | With Mortgage |
| Less than $800 | 179 (69.7%) | 0 (0.0%) |
| $800 to $1,499 | 37 (14.4%) | 93 (27.8%) |
| $800 to $1,499 | 13 (5.1%) | 133 (39.8%) |
| Total | 257 (100.0%) | 334 (100.0%) |
Health & Disability in Robertson County
Health Insurance Coverage by Age in Robertson County
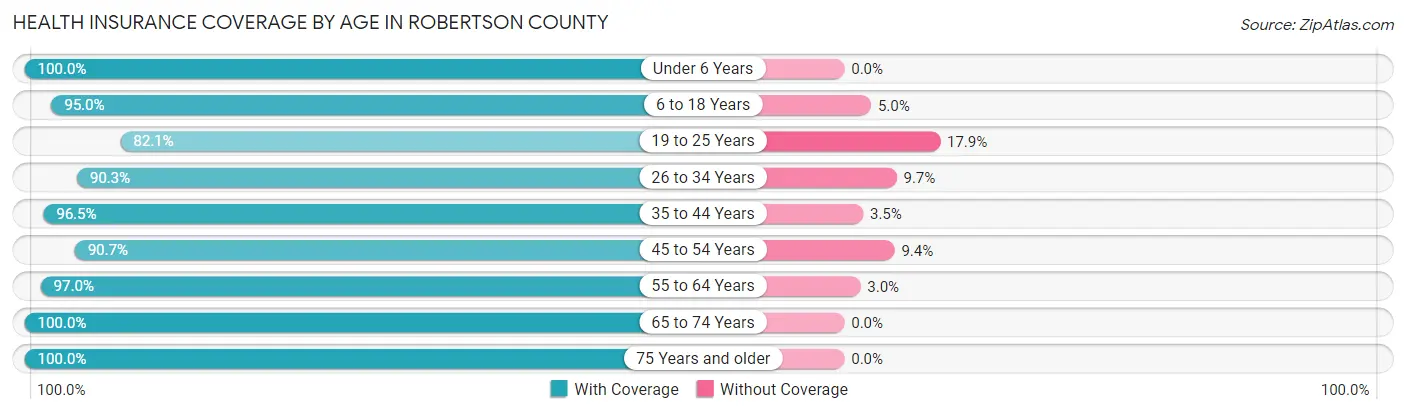
| Age Bracket | With Coverage | Without Coverage |
| Under 6 Years | 168 (100.0%) | 0 (0.0%) |
| 6 to 18 Years | 382 (95.0%) | 20 (5.0%) |
| 19 to 25 Years | 92 (82.1%) | 20 (17.9%) |
| 26 to 34 Years | 241 (90.3%) | 26 (9.7%) |
| 35 to 44 Years | 304 (96.5%) | 11 (3.5%) |
| 45 to 54 Years | 223 (90.6%) | 23 (9.3%) |
| 55 to 64 Years | 291 (97.0%) | 9 (3.0%) |
| 65 to 74 Years | 211 (100.0%) | 0 (0.0%) |
| 75 Years and older | 125 (100.0%) | 0 (0.0%) |
| Total | 2,037 (94.9%) | 109 (5.1%) |
Health Insurance Coverage by Citizenship Status in Robertson County
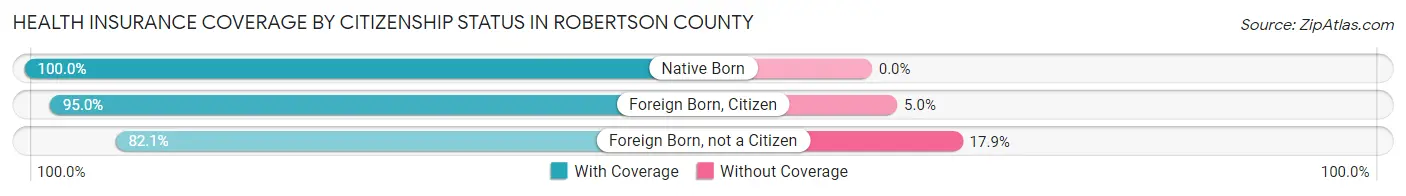
| Citizenship Status | With Coverage | Without Coverage |
| Native Born | 168 (100.0%) | 0 (0.0%) |
| Foreign Born, Citizen | 382 (95.0%) | 20 (5.0%) |
| Foreign Born, not a Citizen | 92 (82.1%) | 20 (17.9%) |
Health Insurance Coverage by Household Income in Robertson County
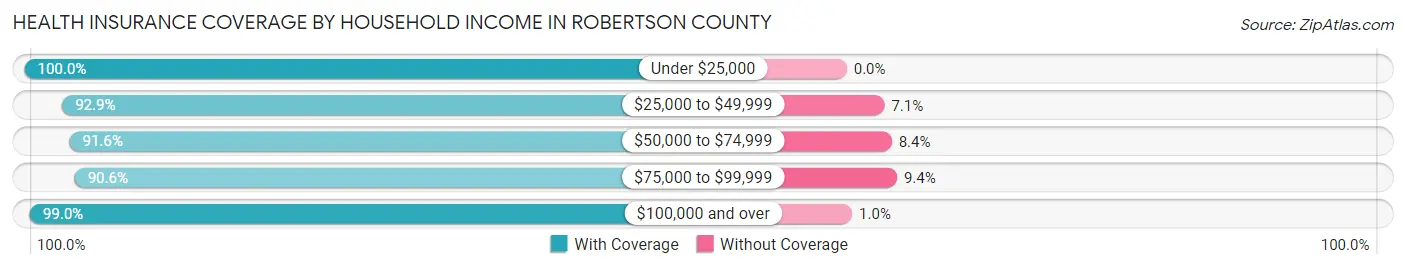
| Household Income | With Coverage | Without Coverage |
| Under $25,000 | 299 (100.0%) | 0 (0.0%) |
| $25,000 to $49,999 | 408 (92.9%) | 31 (7.1%) |
| $50,000 to $74,999 | 359 (91.6%) | 33 (8.4%) |
| $75,000 to $99,999 | 376 (90.6%) | 39 (9.4%) |
| $100,000 and over | 595 (99.0%) | 6 (1.0%) |
Public vs Private Health Insurance Coverage by Age in Robertson County
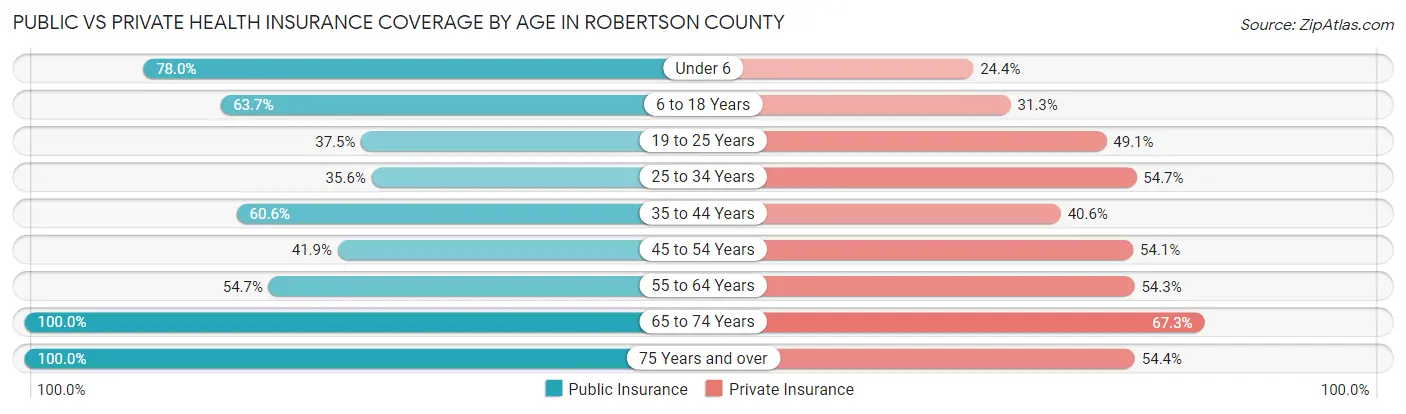
| Age Bracket | Public Insurance | Private Insurance |
| Under 6 | 131 (78.0%) | 41 (24.4%) |
| 6 to 18 Years | 256 (63.7%) | 126 (31.3%) |
| 19 to 25 Years | 42 (37.5%) | 55 (49.1%) |
| 25 to 34 Years | 95 (35.6%) | 146 (54.7%) |
| 35 to 44 Years | 191 (60.6%) | 128 (40.6%) |
| 45 to 54 Years | 103 (41.9%) | 133 (54.1%) |
| 55 to 64 Years | 164 (54.7%) | 163 (54.3%) |
| 65 to 74 Years | 211 (100.0%) | 142 (67.3%) |
| 75 Years and over | 125 (100.0%) | 68 (54.4%) |
| Total | 1,318 (61.4%) | 1,002 (46.7%) |
Disability Status by Sex by Age in Robertson County
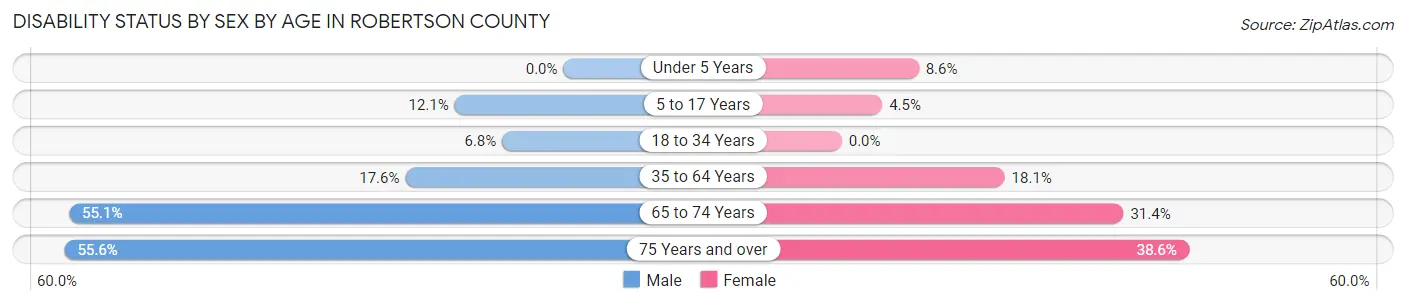
| Age Bracket | Male | Female |
| Under 5 Years | 0 (0.0%) | 6 (8.6%) |
| 5 to 17 Years | 16 (12.1%) | 15 (4.5%) |
| 18 to 34 Years | 12 (6.8%) | 0 (0.0%) |
| 35 to 64 Years | 72 (17.6%) | 82 (18.1%) |
| 65 to 74 Years | 60 (55.0%) | 32 (31.4%) |
| 75 Years and over | 45 (55.6%) | 17 (38.6%) |
Disability Class by Sex by Age in Robertson County
Disability Class: Hearing Difficulty
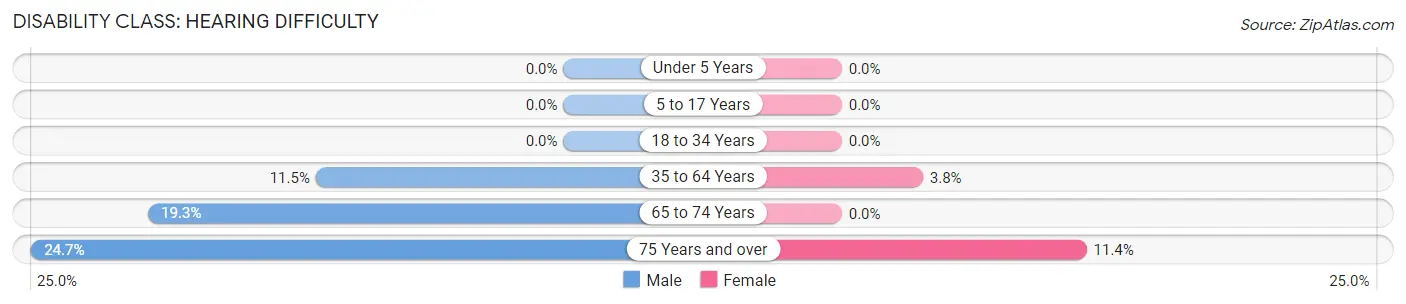
| Age Bracket | Male | Female |
| Under 5 Years | 0 (0.0%) | 0 (0.0%) |
| 5 to 17 Years | 0 (0.0%) | 0 (0.0%) |
| 18 to 34 Years | 0 (0.0%) | 0 (0.0%) |
| 35 to 64 Years | 47 (11.5%) | 17 (3.8%) |
| 65 to 74 Years | 21 (19.3%) | 0 (0.0%) |
| 75 Years and over | 20 (24.7%) | 5 (11.4%) |
Disability Class: Vision Difficulty
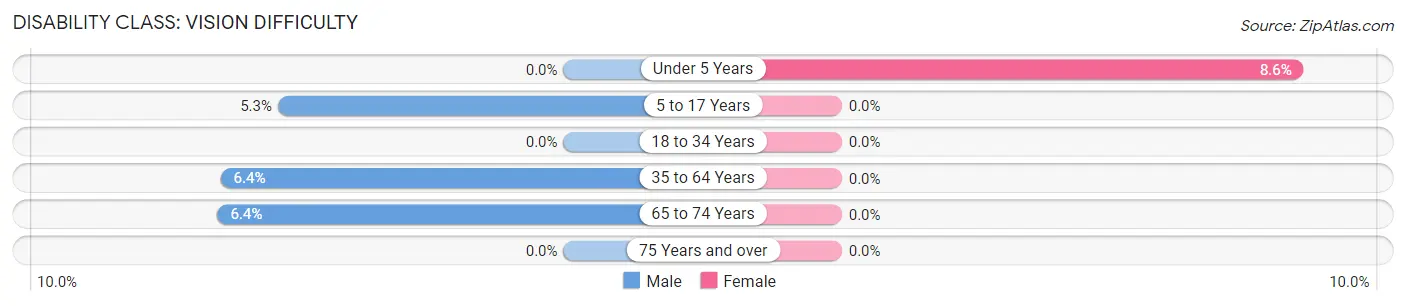
| Age Bracket | Male | Female |
| Under 5 Years | 0 (0.0%) | 6 (8.6%) |
| 5 to 17 Years | 7 (5.3%) | 0 (0.0%) |
| 18 to 34 Years | 0 (0.0%) | 0 (0.0%) |
| 35 to 64 Years | 26 (6.4%) | 0 (0.0%) |
| 65 to 74 Years | 7 (6.4%) | 0 (0.0%) |
| 75 Years and over | 0 (0.0%) | 0 (0.0%) |
Disability Class: Cognitive Difficulty
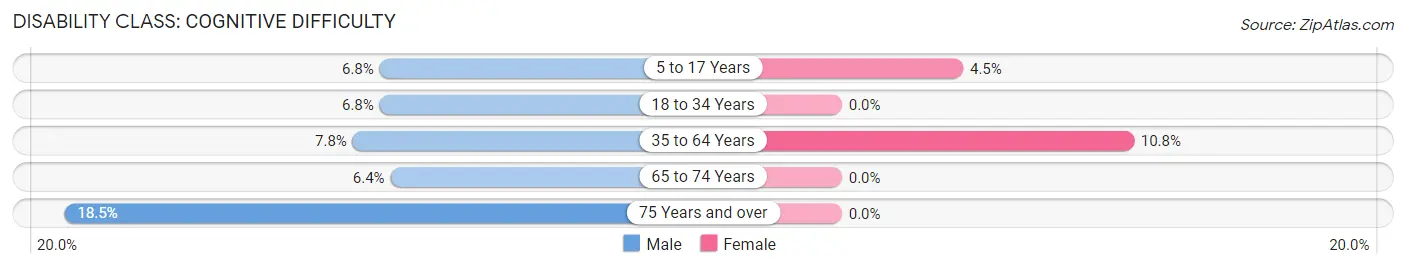
| Age Bracket | Male | Female |
| 5 to 17 Years | 9 (6.8%) | 15 (4.5%) |
| 18 to 34 Years | 12 (6.8%) | 0 (0.0%) |
| 35 to 64 Years | 32 (7.8%) | 49 (10.8%) |
| 65 to 74 Years | 7 (6.4%) | 0 (0.0%) |
| 75 Years and over | 15 (18.5%) | 0 (0.0%) |
Disability Class: Ambulatory Difficulty
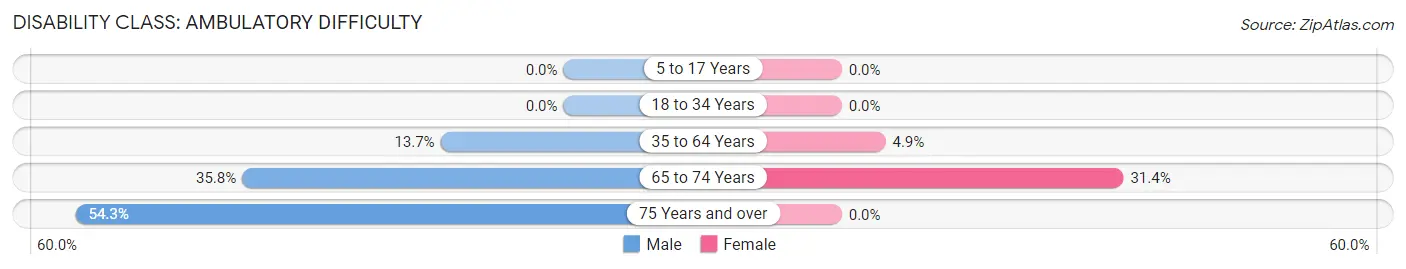
| Age Bracket | Male | Female |
| 5 to 17 Years | 0 (0.0%) | 0 (0.0%) |
| 18 to 34 Years | 0 (0.0%) | 0 (0.0%) |
| 35 to 64 Years | 56 (13.7%) | 22 (4.9%) |
| 65 to 74 Years | 39 (35.8%) | 32 (31.4%) |
| 75 Years and over | 44 (54.3%) | 0 (0.0%) |
Disability Class: Self-Care Difficulty
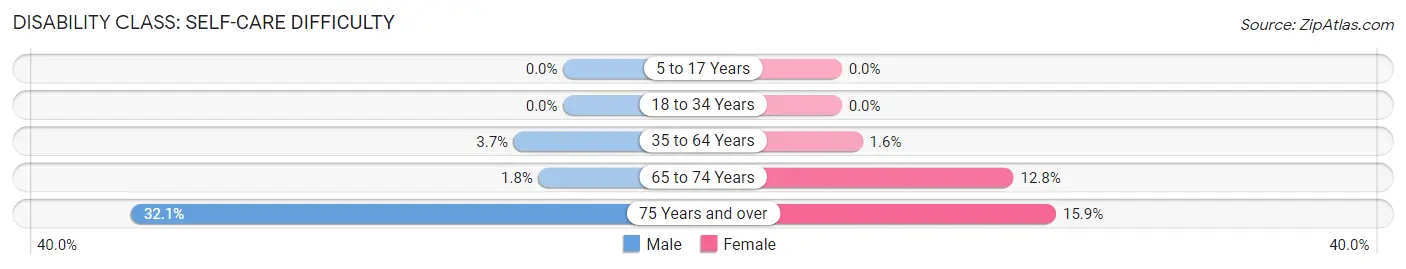
| Age Bracket | Male | Female |
| 5 to 17 Years | 0 (0.0%) | 0 (0.0%) |
| 18 to 34 Years | 0 (0.0%) | 0 (0.0%) |
| 35 to 64 Years | 15 (3.7%) | 7 (1.5%) |
| 65 to 74 Years | 2 (1.8%) | 13 (12.8%) |
| 75 Years and over | 26 (32.1%) | 7 (15.9%) |
Technology Access in Robertson County
Computing Device Access in Robertson County
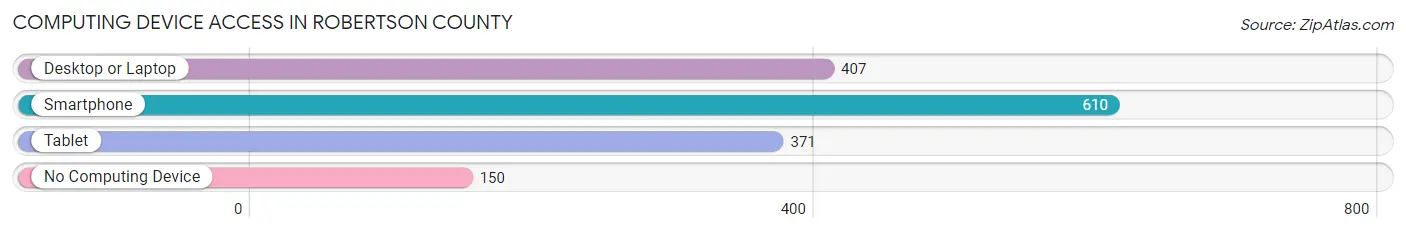
| Device Type | # Households | % Households |
| Desktop or Laptop | 407 | 51.1% |
| Smartphone | 610 | 76.5% |
| Tablet | 371 | 46.6% |
| No Computing Device | 150 | 18.8% |
| Total | 797 | 100.0% |
Internet Access in Robertson County
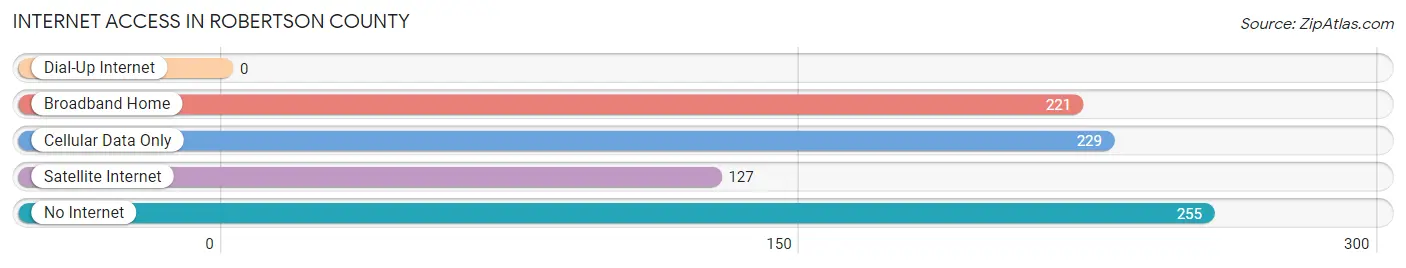
| Internet Type | # Households | % Households |
| Dial-Up Internet | 0 | 0.0% |
| Broadband Home | 221 | 27.7% |
| Cellular Data Only | 229 | 28.7% |
| Satellite Internet | 127 | 15.9% |
| No Internet | 255 | 32.0% |
| Total | 797 | 100.0% |
Robertson County Summary
Robertson County is located in the Bluegrass region of Kentucky, and is part of the Central Kentucky area. It is bordered by the counties of Bracken, Mason, Lewis, Nicholas, and Fleming. The county seat is Mount Olivet, and the county was formed in 1867 from parts of Mason and Nicholas counties. The county has a total area of 246 square miles, and a population of 20,845 as of the 2010 census.
History
The area that is now Robertson County was originally inhabited by Native American tribes, including the Shawnee, Cherokee, and Chickasaw. The first European settlers arrived in the area in the late 1700s, and the county was officially established in 1867. The county was named for Major General James Robertson, a Revolutionary War veteran and one of the founders of the state of Tennessee.
The county was largely agricultural in the 19th century, with tobacco, corn, and wheat being the main crops. The county also had a thriving timber industry, and several sawmills were built in the area. The county was also home to several distilleries, which produced whiskey and other spirits.
Geography
Robertson County is located in the Bluegrass region of Kentucky, and is part of the Central Kentucky area. It is bordered by the counties of Bracken, Mason, Lewis, Nicholas, and Fleming. The county has a total area of 246 square miles, and is mostly flat, with some rolling hills in the northern part of the county. The county is drained by the Licking River, which flows through the county from north to south.
The county is home to several state parks, including the Natural Bridge State Park, which features a natural sandstone arch, and the Carter Caves State Resort Park, which features several caves and underground streams.
Economy
The economy of Robertson County is largely based on agriculture, with tobacco, corn, and wheat being the main crops. The county also has a thriving timber industry, and several sawmills are located in the area. The county is also home to several manufacturing companies, including a furniture factory and a plastics factory.
The county is also home to several tourist attractions, including the Natural Bridge State Park, the Carter Caves State Resort Park, and the Kentucky Speedway. These attractions bring in tourists from all over the state and the region, and help to boost the local economy.
Demographics
As of the 2010 census, the population of Robertson County was 20,845. The population is mostly white (94.3%), with small percentages of African American (3.2%), Hispanic (1.2%), and Asian (0.5%) residents. The median household income is $41,945, and the median home value is $117,400. The unemployment rate is 6.2%.
Conclusion
Robertson County is a rural county located in the Bluegrass region of Kentucky. It is bordered by the counties of Bracken, Mason, Lewis, Nicholas, and Fleming. The county has a total area of 246 square miles, and a population of 20,845 as of the 2010 census. The economy of the county is largely based on agriculture, with tobacco, corn, and wheat being the main crops. The county is also home to several tourist attractions, which help to boost the local economy.
Common Questions
What is Per Capita Income in Robertson County?
Per Capita income in Robertson County is $24,146.
What is the Median Family Income in Robertson County?
Median Family Income in Robertson County is $58,889.
What is the Median Household income in Robertson County?
Median Household Income in Robertson County is $53,798.
What is Income or Wage Gap in Robertson County?
Income or Wage Gap in Robertson County is 28.3%.
Women in Robertson County earn 71.7 cents for every dollar earned by a man.
What is Inequality or Gini Index in Robertson County?
Inequality or Gini Index in Robertson County is 0.48.
What is the Total Population of Robertson County?
Total Population of Robertson County is 2,207.
What is the Total Male Population of Robertson County?
Total Male Population of Robertson County is 944.
What is the Total Female Population of Robertson County?
Total Female Population of Robertson County is 1,263.
What is the Ratio of Males per 100 Females in Robertson County?
There are 74.74 Males per 100 Females in Robertson County.
What is the Ratio of Females per 100 Males in Robertson County?
There are 133.79 Females per 100 Males in Robertson County.
What is the Median Population Age in Robertson County?
Median Population Age in Robertson County is 39.0 Years.
What is the Average Family Size in Robertson County
Average Family Size in Robertson County is 3.0 People.
What is the Average Household Size in Robertson County
Average Household Size in Robertson County is 2.7 People.
How Large is the Labor Force in Robertson County?
There are 895 People in the Labor Forcein in Robertson County.
What is the Percentage of People in the Labor Force in Robertson County?
52.4% of People are in the Labor Force in Robertson County.
What is the Unemployment Rate in Robertson County?
Unemployment Rate in Robertson County is 7.0%.