Powell County, KY Map & Demographics
Powell County Map
Powell County Overview
$23,336
PER CAPITA INCOME
$67,610
AVG FAMILY INCOME
$38,415
AVG HOUSEHOLD INCOME
36.1%
WAGE / INCOME GAP [ % ]
63.9¢/ $1
WAGE / INCOME GAP [ $ ]
$12,620
FAMILY INCOME DEFICIT
0.48
INEQUALITY / GINI INDEX
13,089
TOTAL POPULATION
6,658
MALE POPULATION
6,431
FEMALE POPULATION
103.53
MALES / 100 FEMALES
96.59
FEMALES / 100 MALES
39.5
MEDIAN AGE
3.4
AVG FAMILY SIZE
2.7
AVG HOUSEHOLD SIZE
5,196
LABOR FORCE [ PEOPLE ]
51.1%
PERCENT IN LABOR FORCE
7.1%
UNEMPLOYMENT RATE
Powell County Area Codes
Income in Powell County
Income Overview in Powell County
Per Capita Income in Powell County is $23,336, while median incomes of families and households are $67,610 and $38,415 respectively.
| Characteristic | Number | Measure |
| Per Capita Income | 13,089 | $23,336 |
| Median Family Income | 3,283 | $67,610 |
| Mean Family Income | 3,283 | $73,724 |
| Median Household Income | 4,658 | $38,415 |
| Mean Household Income | 4,658 | $59,213 |
| Income Deficit | 3,283 | $12,620 |
| Wage / Income Gap (%) | 13,089 | 36.12% |
| Wage / Income Gap ($) | 13,089 | 63.88¢ per $1 |
| Gini / Inequality Index | 13,089 | 0.48 |
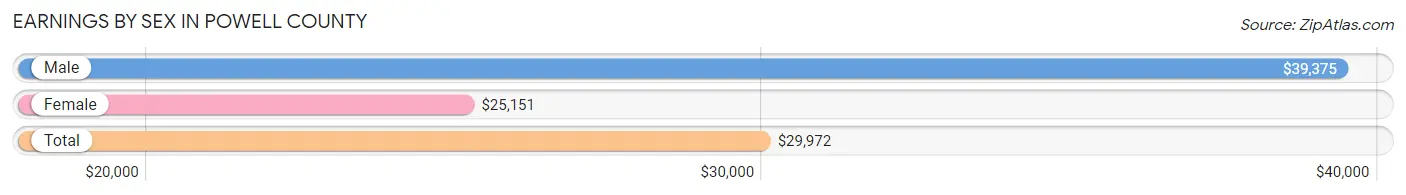
Earnings by Sex in Powell County
Average Earnings in Powell County are $29,972, $39,375 for men and $25,151 for women, a difference of 36.1%.
| Sex | Number | Average Earnings |
| Male | 2,852 (52.0%) | $39,375 |
| Female | 2,631 (48.0%) | $25,151 |
| Total | 5,483 (100.0%) | $29,972 |
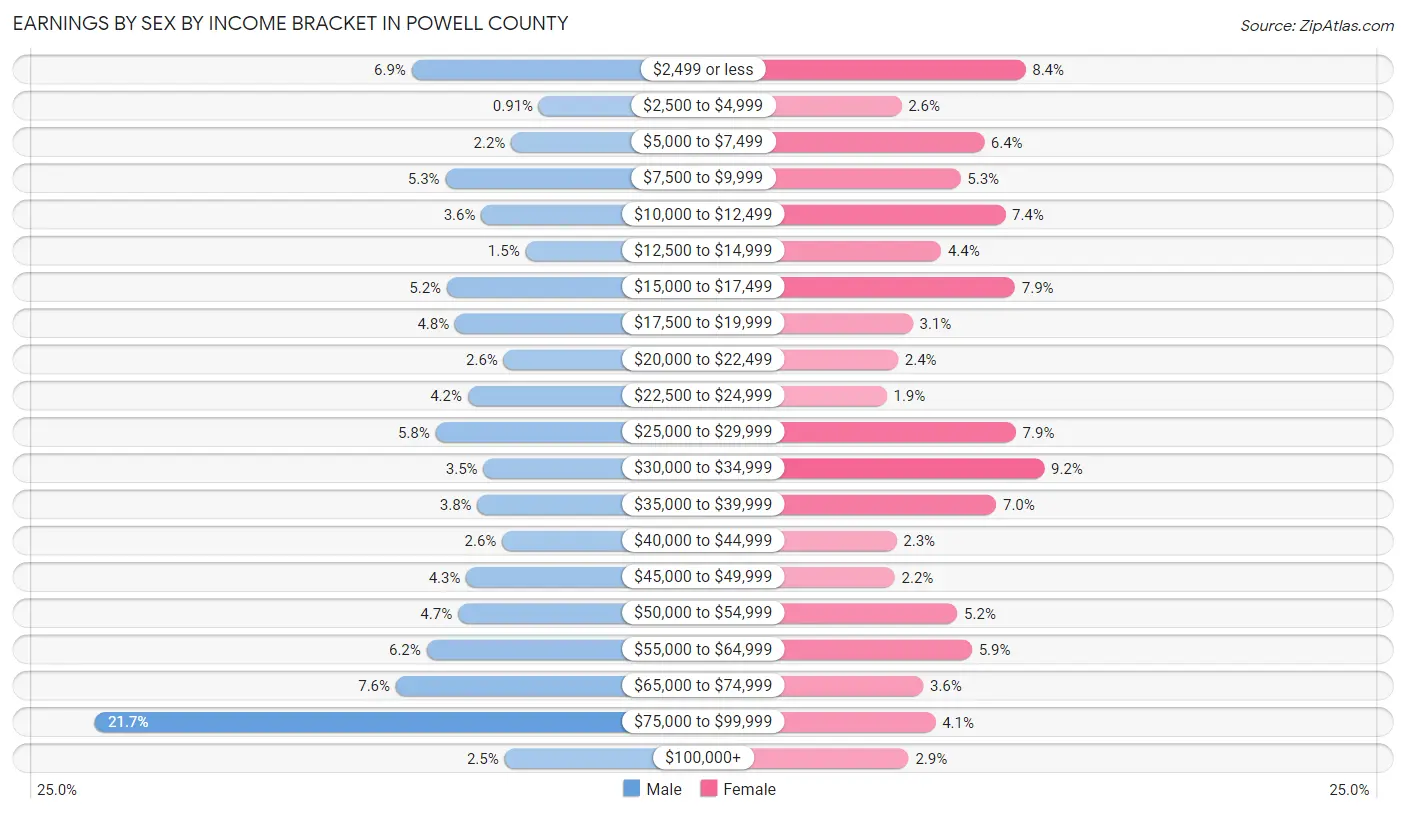
Earnings by Sex by Income Bracket in Powell County
The most common earnings brackets in Powell County are $75,000 to $99,999 for men (619 | 21.7%) and $30,000 to $34,999 for women (243 | 9.2%).
| Income | Male | Female |
| $2,499 or less | 196 (6.9%) | 220 (8.4%) |
| $2,500 to $4,999 | 26 (0.9%) | 67 (2.5%) |
| $5,000 to $7,499 | 63 (2.2%) | 169 (6.4%) |
| $7,500 to $9,999 | 151 (5.3%) | 140 (5.3%) |
| $10,000 to $12,499 | 103 (3.6%) | 195 (7.4%) |
| $12,500 to $14,999 | 44 (1.5%) | 116 (4.4%) |
| $15,000 to $17,499 | 149 (5.2%) | 207 (7.9%) |
| $17,500 to $19,999 | 138 (4.8%) | 81 (3.1%) |
| $20,000 to $22,499 | 73 (2.6%) | 63 (2.4%) |
| $22,500 to $24,999 | 121 (4.2%) | 49 (1.9%) |
| $25,000 to $29,999 | 164 (5.8%) | 208 (7.9%) |
| $30,000 to $34,999 | 100 (3.5%) | 243 (9.2%) |
| $35,000 to $39,999 | 108 (3.8%) | 184 (7.0%) |
| $40,000 to $44,999 | 75 (2.6%) | 61 (2.3%) |
| $45,000 to $49,999 | 123 (4.3%) | 59 (2.2%) |
| $50,000 to $54,999 | 134 (4.7%) | 136 (5.2%) |
| $55,000 to $64,999 | 176 (6.2%) | 154 (5.9%) |
| $65,000 to $74,999 | 217 (7.6%) | 94 (3.6%) |
| $75,000 to $99,999 | 619 (21.7%) | 109 (4.1%) |
| $100,000+ | 72 (2.5%) | 76 (2.9%) |
| Total | 2,852 (100.0%) | 2,631 (100.0%) |
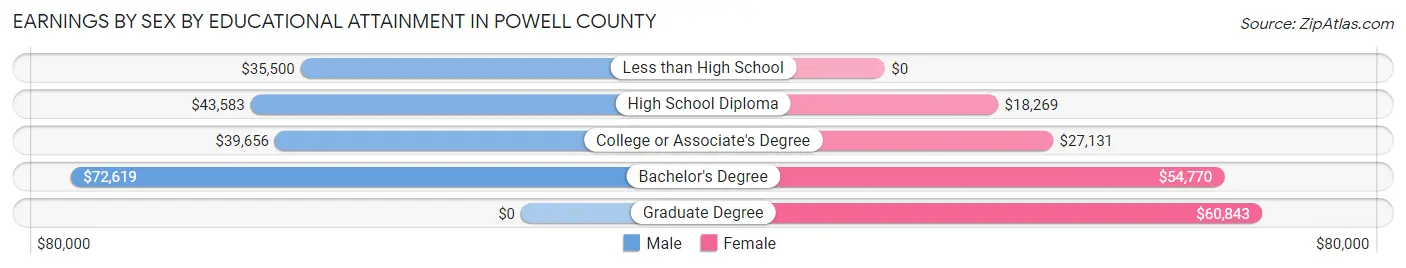
Earnings by Sex by Educational Attainment in Powell County
Average earnings in Powell County are $49,415 for men and $30,236 for women, a difference of 38.8%. Men with an educational attainment of bachelor's degree enjoy the highest average annual earnings of $72,619, while those with less than high school education earn the least with $35,500. Women with an educational attainment of graduate degree earn the most with the average annual earnings of $60,843, while those with high school diploma education have the smallest earnings of $18,269.
| Educational Attainment | Male Income | Female Income |
| Less than High School | $35,500 | $0 |
| High School Diploma | $43,583 | $18,269 |
| College or Associate's Degree | $39,656 | $27,131 |
| Bachelor's Degree | $72,619 | $54,770 |
| Graduate Degree | - | - |
| Total | $49,415 | $30,236 |
Family Income in Powell County
Family Income Brackets in Powell County
According to the Powell County family income data, there are 689 families falling into the $100,000 to $149,999 income range, which is the most common income bracket and makes up 21.0% of all families. Conversely, the $200,000+ income bracket is the least frequent group with only 69 families (2.1%) belonging to this category.
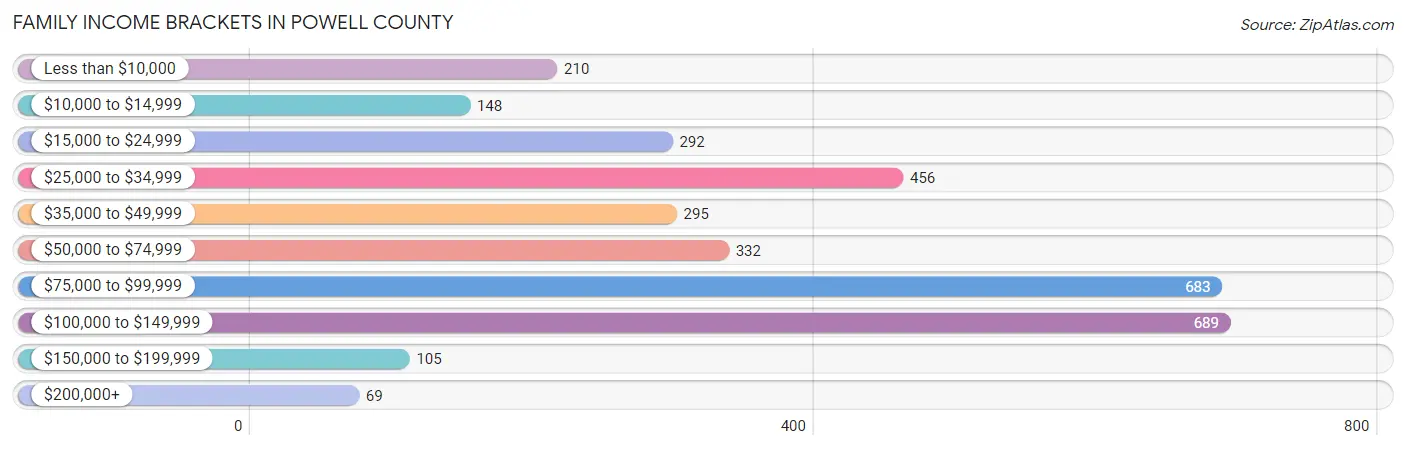
| Income Bracket | # Families | % Families |
| Less than $10,000 | 210 | 6.4% |
| $10,000 to $14,999 | 148 | 4.5% |
| $15,000 to $24,999 | 292 | 8.9% |
| $25,000 to $34,999 | 456 | 13.9% |
| $35,000 to $49,999 | 295 | 9.0% |
| $50,000 to $74,999 | 332 | 10.1% |
| $75,000 to $99,999 | 683 | 20.8% |
| $100,000 to $149,999 | 689 | 21.0% |
| $150,000 to $199,999 | 105 | 3.2% |
| $200,000+ | 69 | 2.1% |
Family Income by Famaliy Size in Powell County
4-person families (675 | 20.6%) account for the highest median family income in Powell County with $104,805 per family, while 2-person families (1,577 | 48.0%) have the highest median income of $27,057 per family member.
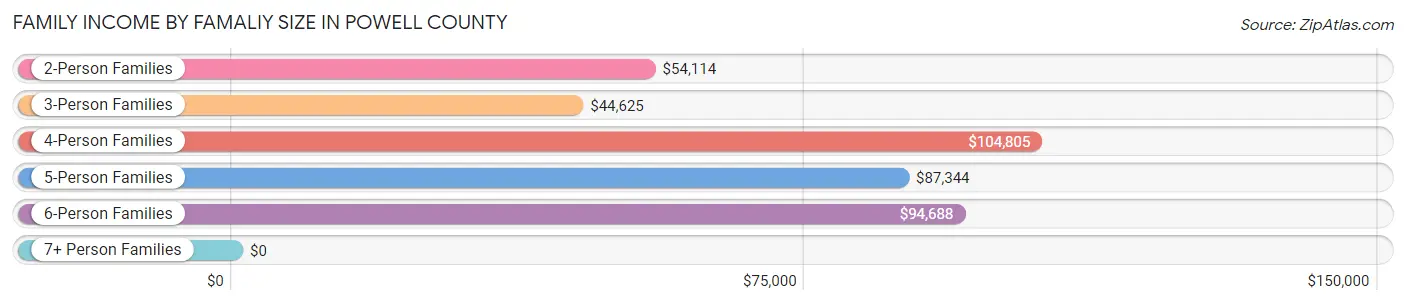
| Income Bracket | # Families | Median Income |
| 2-Person Families | 1,577 (48.0%) | $54,114 |
| 3-Person Families | 781 (23.8%) | $44,625 |
| 4-Person Families | 675 (20.6%) | $104,805 |
| 5-Person Families | 209 (6.4%) | $87,344 |
| 6-Person Families | 28 (0.9%) | $94,688 |
| 7+ Person Families | 13 (0.4%) | $0 |
| Total | 3,283 (100.0%) | $67,610 |
Family Income by Number of Earners in Powell County
The median family income in Powell County is $67,610, with families comprising 3+ earners (232) having the highest median family income of $127,500, while families with no earners (712) have the lowest median family income of $34,300, accounting for 7.1% and 21.7% of families, respectively.
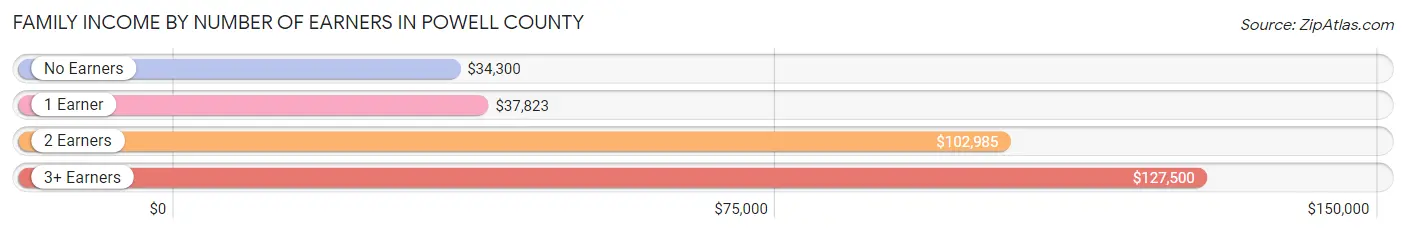
| Number of Earners | # Families | Median Income |
| No Earners | 712 (21.7%) | $34,300 |
| 1 Earner | 1,354 (41.2%) | $37,823 |
| 2 Earners | 985 (30.0%) | $102,985 |
| 3+ Earners | 232 (7.1%) | $127,500 |
| Total | 3,283 (100.0%) | $67,610 |
Household Income in Powell County
Household Income Brackets in Powell County
With 797 households falling in the category, the $75,000 to $99,999 income range is the most frequent in Powell County, accounting for 17.1% of all households. In contrast, only 70 households (1.5%) fall into the $200,000+ income bracket, making it the least populous group.
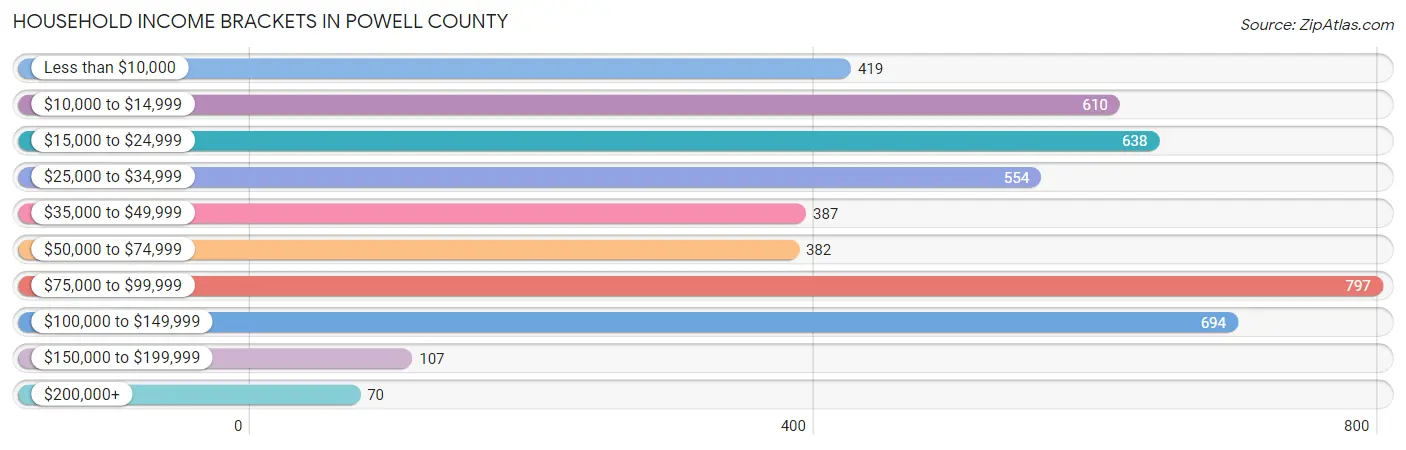
| Income Bracket | # Households | % Households |
| Less than $10,000 | 419 | 9.0% |
| $10,000 to $14,999 | 610 | 13.1% |
| $15,000 to $24,999 | 638 | 13.7% |
| $25,000 to $34,999 | 554 | 11.9% |
| $35,000 to $49,999 | 387 | 8.3% |
| $50,000 to $74,999 | 382 | 8.2% |
| $75,000 to $99,999 | 797 | 17.1% |
| $100,000 to $149,999 | 694 | 14.9% |
| $150,000 to $199,999 | 107 | 2.3% |
| $200,000+ | 70 | 1.5% |
Household Income by Householder Age in Powell County
The median household income in Powell County is $38,415, with the highest median household income of $74,291 found in the 45 to 64 years age bracket for the primary householder. A total of 1,899 households (40.8%) fall into this category. Meanwhile, the 15 to 24 years age bracket for the primary householder has the lowest median household income of $0, with 317 households (6.8%) in this group.
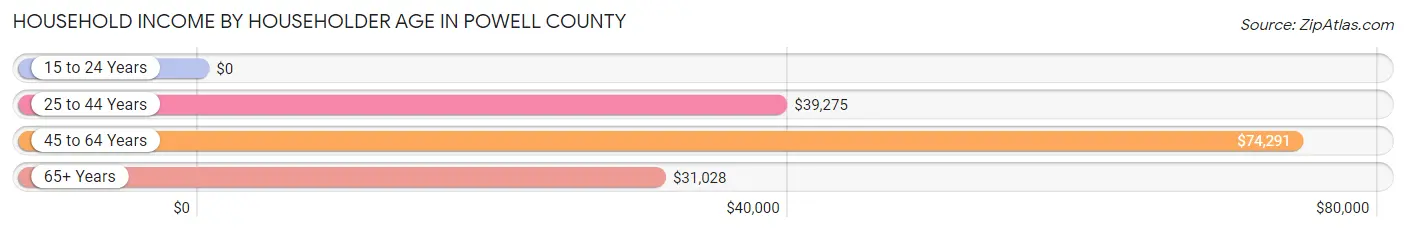
| Income Bracket | # Households | Median Income |
| 15 to 24 Years | 317 (6.8%) | $0 |
| 25 to 44 Years | 1,184 (25.4%) | $39,275 |
| 45 to 64 Years | 1,899 (40.8%) | $74,291 |
| 65+ Years | 1,258 (27.0%) | $31,028 |
| Total | 4,658 (100.0%) | $38,415 |
Poverty in Powell County
Income Below Poverty by Sex and Age in Powell County
With 20.3% poverty level for males and 22.0% for females among the residents of Powell County, 5 year old males and 18 to 24 year old females are the most vulnerable to poverty, with 34 males (75.6%) and 252 females (52.2%) in their respective age groups living below the poverty level.
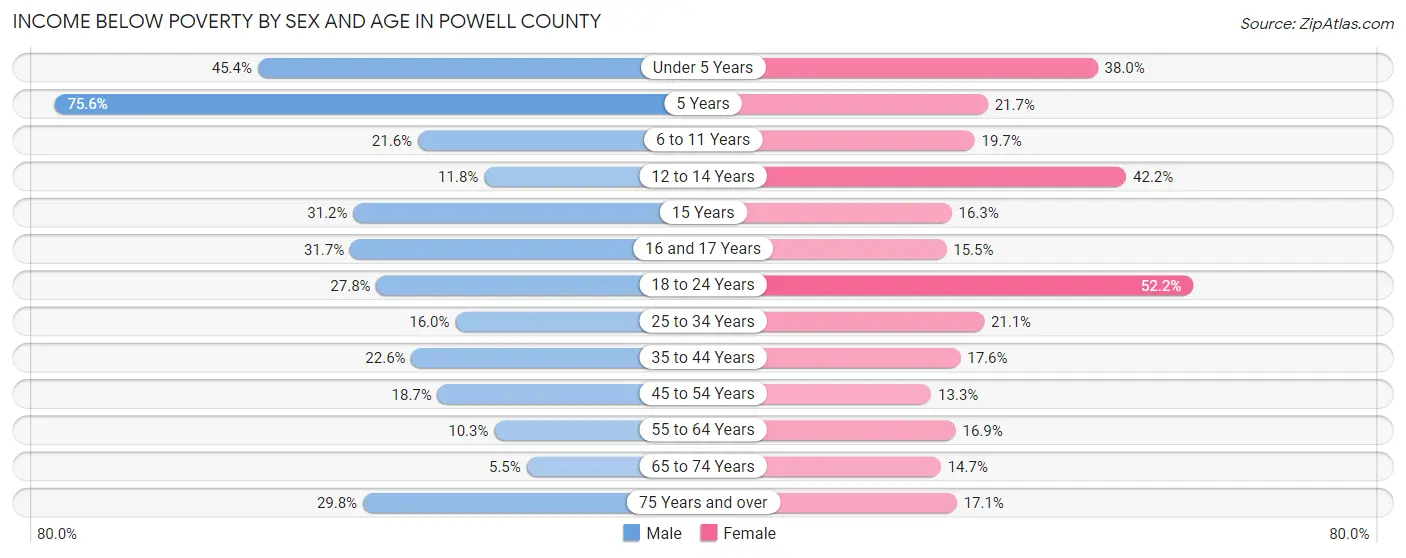
| Age Bracket | Male | Female |
| Under 5 Years | 201 (45.4%) | 144 (38.0%) |
| 5 Years | 34 (75.6%) | 13 (21.7%) |
| 6 to 11 Years | 100 (21.6%) | 111 (19.7%) |
| 12 to 14 Years | 40 (11.8%) | 95 (42.2%) |
| 15 Years | 58 (31.2%) | 23 (16.3%) |
| 16 and 17 Years | 38 (31.7%) | 18 (15.5%) |
| 18 to 24 Years | 141 (27.8%) | 252 (52.2%) |
| 25 to 34 Years | 119 (16.0%) | 163 (21.1%) |
| 35 to 44 Years | 187 (22.6%) | 141 (17.6%) |
| 45 to 54 Years | 166 (18.7%) | 104 (13.3%) |
| 55 to 64 Years | 96 (10.2%) | 147 (16.9%) |
| 65 to 74 Years | 34 (5.4%) | 104 (14.7%) |
| 75 Years and over | 86 (29.8%) | 65 (17.1%) |
| Total | 1,300 (20.3%) | 1,380 (22.0%) |
Income Above Poverty by Sex and Age in Powell County
According to the poverty statistics in Powell County, males aged 65 to 74 years and females aged 45 to 54 years are the age groups that are most secure financially, with 94.6% of males and 86.7% of females in these age groups living above the poverty line.
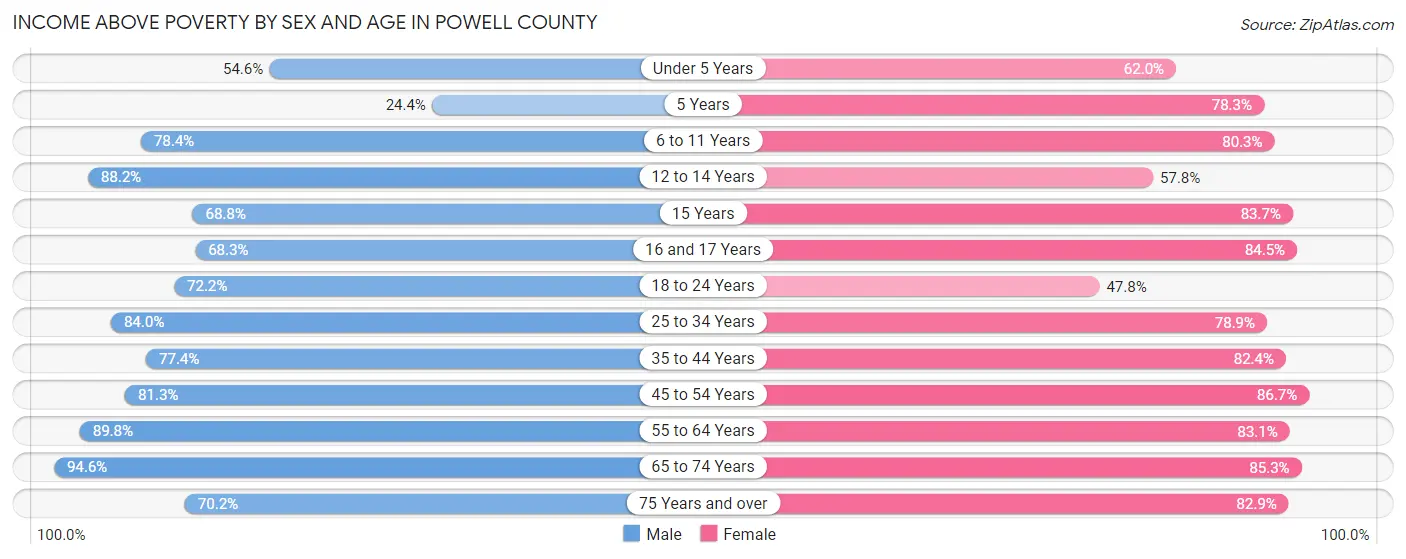
| Age Bracket | Male | Female |
| Under 5 Years | 242 (54.6%) | 235 (62.0%) |
| 5 Years | 11 (24.4%) | 47 (78.3%) |
| 6 to 11 Years | 363 (78.4%) | 452 (80.3%) |
| 12 to 14 Years | 300 (88.2%) | 130 (57.8%) |
| 15 Years | 128 (68.8%) | 118 (83.7%) |
| 16 and 17 Years | 82 (68.3%) | 98 (84.5%) |
| 18 to 24 Years | 367 (72.2%) | 231 (47.8%) |
| 25 to 34 Years | 623 (84.0%) | 609 (78.9%) |
| 35 to 44 Years | 642 (77.4%) | 660 (82.4%) |
| 45 to 54 Years | 723 (81.3%) | 680 (86.7%) |
| 55 to 64 Years | 841 (89.7%) | 723 (83.1%) |
| 65 to 74 Years | 590 (94.6%) | 604 (85.3%) |
| 75 Years and over | 203 (70.2%) | 316 (82.9%) |
| Total | 5,115 (79.7%) | 4,903 (78.0%) |
Income Below Poverty Among Married-Couple Families in Powell County
The poverty statistics for married-couple families in Powell County show that 9.1% or 215 of the total 2,371 families live below the poverty line. Families with 3 or 4 children have the highest poverty rate of 41.2%, comprising of 49 families. On the other hand, families with no children have the lowest poverty rate of 4.4%, which includes 58 families.
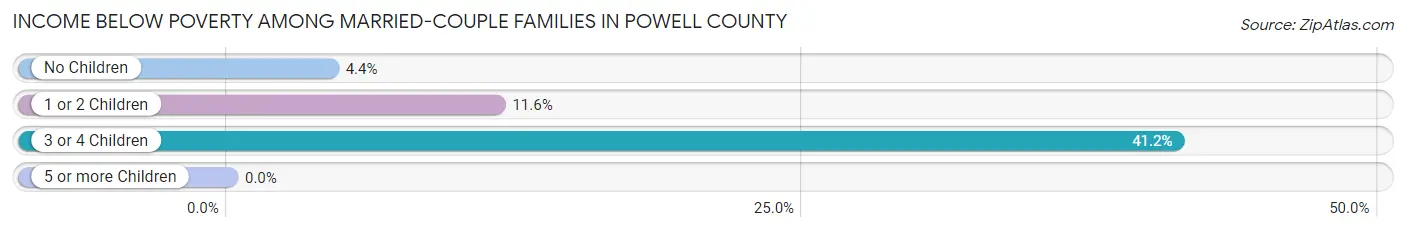
| Children | Above Poverty | Below Poverty |
| No Children | 1,266 (95.6%) | 58 (4.4%) |
| 1 or 2 Children | 820 (88.4%) | 108 (11.6%) |
| 3 or 4 Children | 70 (58.8%) | 49 (41.2%) |
| 5 or more Children | 0 (0.0%) | 0 (0.0%) |
| Total | 2,156 (90.9%) | 215 (9.1%) |
Income Below Poverty Among Single-Parent Households in Powell County
According to the poverty data in Powell County, 41.0% or 125 single-father households and 35.1% or 213 single-mother households are living below the poverty line. Among single-father households, those with 1 or 2 children have the highest poverty rate, with 125 households (70.2%) experiencing poverty. Likewise, among single-mother households, those with 3 or 4 children have the highest poverty rate, with 59 households (100.0%) falling below the poverty line.
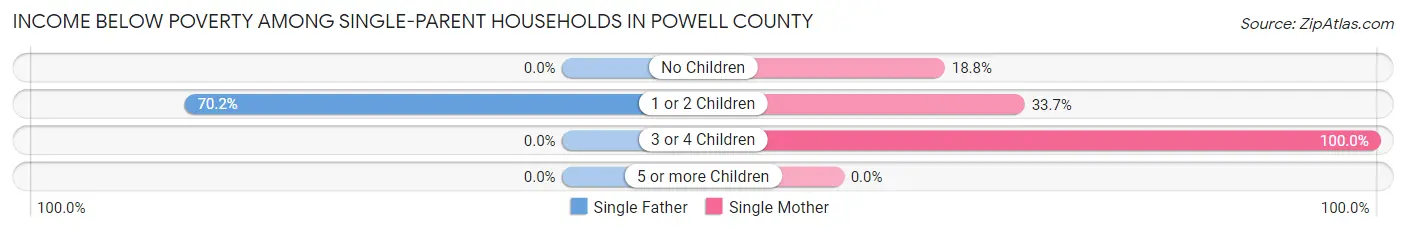
| Children | Single Father | Single Mother |
| No Children | 0 (0.0%) | 39 (18.8%) |
| 1 or 2 Children | 125 (70.2%) | 115 (33.7%) |
| 3 or 4 Children | 0 (0.0%) | 59 (100.0%) |
| 5 or more Children | 0 (0.0%) | 0 (0.0%) |
| Total | 125 (41.0%) | 213 (35.1%) |
Income Below Poverty Among Married-Couple vs Single-Parent Households in Powell County
The poverty data for Powell County shows that 215 of the married-couple family households (9.1%) and 338 of the single-parent households (37.1%) are living below the poverty level. Within the married-couple family households, those with 3 or 4 children have the highest poverty rate, with 49 households (41.2%) falling below the poverty line. Among the single-parent households, those with 3 or 4 children have the highest poverty rate, with 59 household (100.0%) living below poverty.
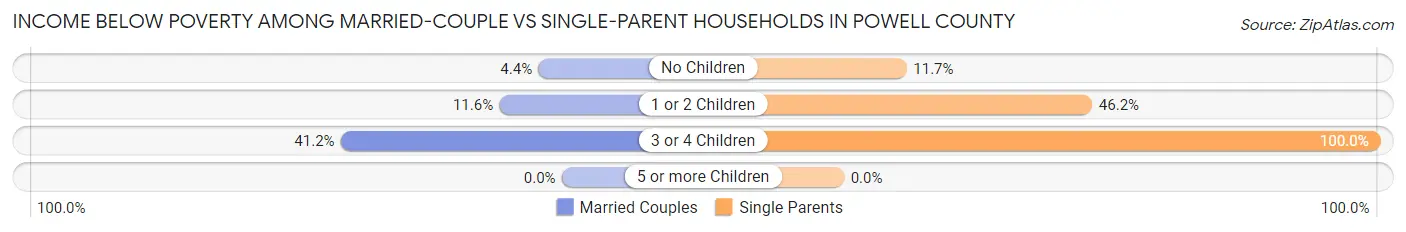
| Children | Married-Couple Families | Single-Parent Households |
| No Children | 58 (4.4%) | 39 (11.7%) |
| 1 or 2 Children | 108 (11.6%) | 240 (46.2%) |
| 3 or 4 Children | 49 (41.2%) | 59 (100.0%) |
| 5 or more Children | 0 (0.0%) | 0 (0.0%) |
| Total | 215 (9.1%) | 338 (37.1%) |
Race in Powell County
The most populous races in Powell County are White / Caucasian (12,389 | 94.7%), Two or more Races (583 | 4.4%), and Hispanic or Latino (259 | 2.0%).
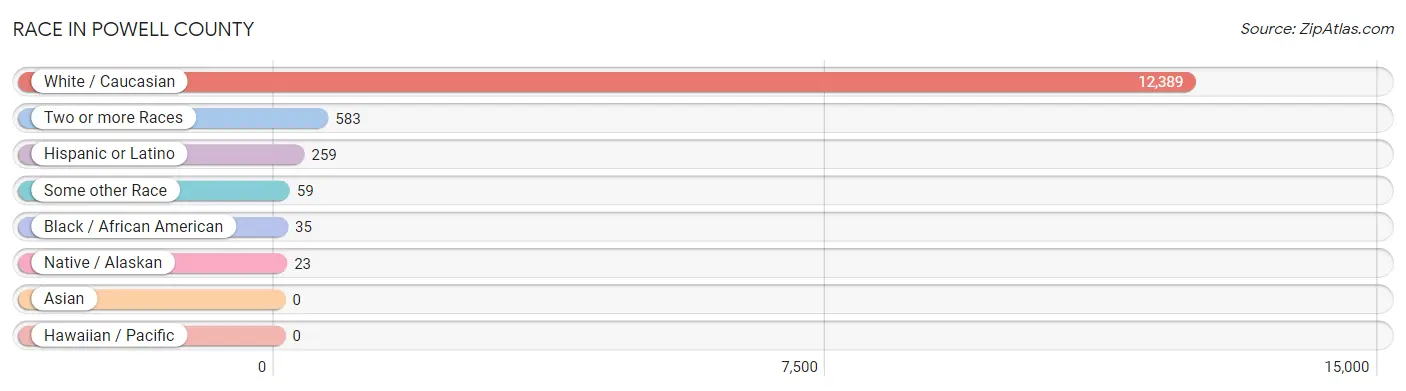
| Race | # Population | % Population |
| Asian | 0 | 0.0% |
| Black / African American | 35 | 0.3% |
| Hawaiian / Pacific | 0 | 0.0% |
| Hispanic or Latino | 259 | 2.0% |
| Native / Alaskan | 23 | 0.2% |
| White / Caucasian | 12,389 | 94.7% |
| Two or more Races | 583 | 4.4% |
| Some other Race | 59 | 0.4% |
| Total | 13,089 | 100.0% |
Ancestry in Powell County
The most populous ancestries reported in Powell County are English (1,984 | 15.2%), American (1,726 | 13.2%), Irish (1,065 | 8.1%), German (638 | 4.9%), and French (273 | 2.1%), together accounting for 43.4% of all Powell County residents.
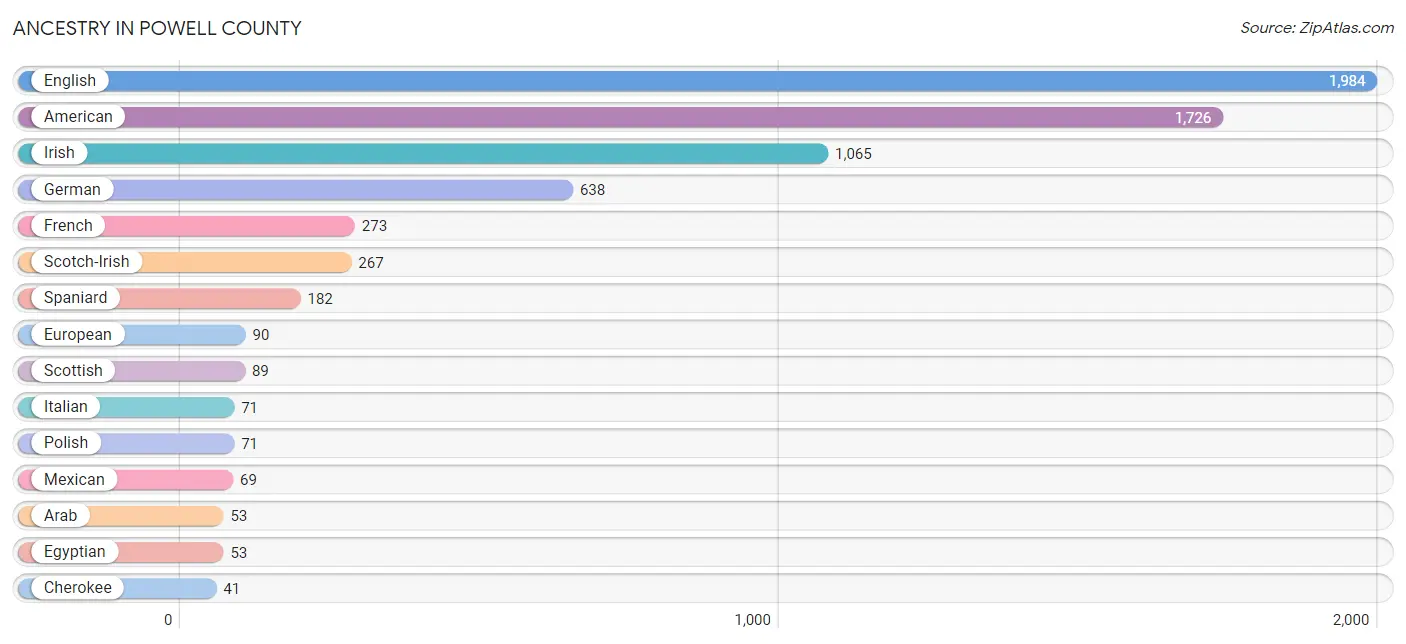
| Ancestry | # Population | % Population |
| American | 1,726 | 13.2% |
| Arab | 53 | 0.4% |
| Austrian | 3 | 0.0% |
| Celtic | 16 | 0.1% |
| Cherokee | 41 | 0.3% |
| Crow | 20 | 0.2% |
| Dutch | 4 | 0.0% |
| Egyptian | 53 | 0.4% |
| English | 1,984 | 15.2% |
| European | 90 | 0.7% |
| French | 273 | 2.1% |
| German | 638 | 4.9% |
| Greek | 16 | 0.1% |
| Irish | 1,065 | 8.1% |
| Italian | 71 | 0.5% |
| Mexican | 69 | 0.5% |
| Peruvian | 8 | 0.1% |
| Polish | 71 | 0.5% |
| Scandinavian | 10 | 0.1% |
| Scotch-Irish | 267 | 2.0% |
| Scottish | 89 | 0.7% |
| Slovak | 2 | 0.0% |
| South American | 8 | 0.1% |
| Spaniard | 182 | 1.4% |
| Swedish | 5 | 0.0% |
| Welsh | 14 | 0.1% | View All 26 Rows |
Immigrants in Powell County
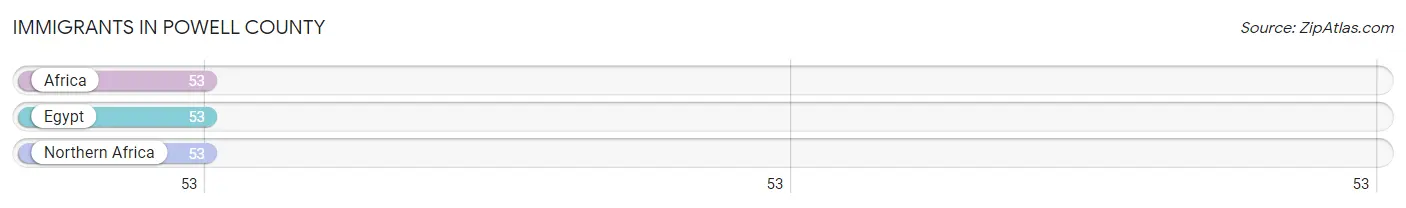
The most numerous immigrant groups reported in Powell County came from Africa (53 | 0.4%), Egypt (53 | 0.4%), and Northern Africa (53 | 0.4%), together accounting for 1.2% of all Powell County residents.
| Immigration Origin | # Population | % Population |
| Africa | 53 | 0.4% |
| Egypt | 53 | 0.4% |
| Northern Africa | 53 | 0.4% | View All 3 Rows |
Sex and Age in Powell County
Sex and Age in Powell County
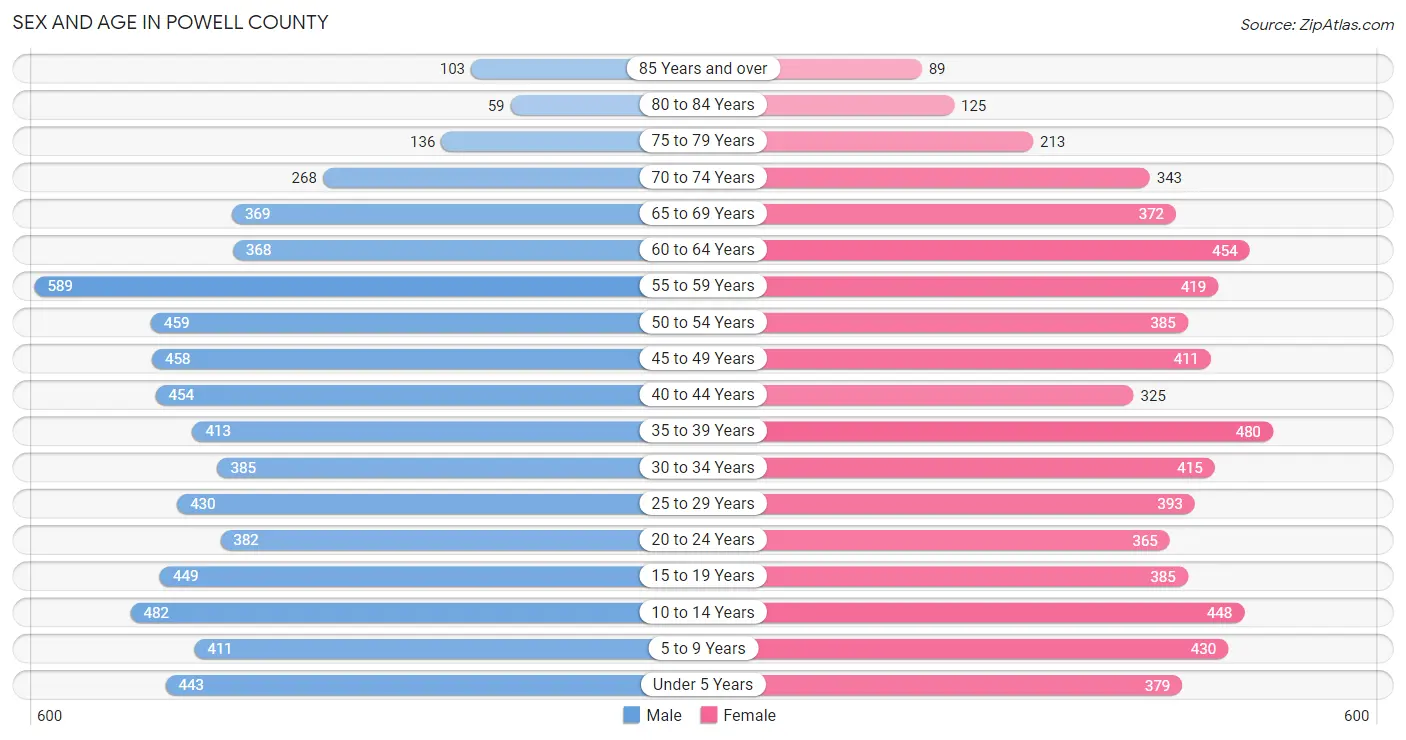
The most populous age groups in Powell County are 55 to 59 Years (589 | 8.8%) for men and 35 to 39 Years (480 | 7.5%) for women.
| Age Bracket | Male | Female |
| Under 5 Years | 443 (6.7%) | 379 (5.9%) |
| 5 to 9 Years | 411 (6.2%) | 430 (6.7%) |
| 10 to 14 Years | 482 (7.2%) | 448 (7.0%) |
| 15 to 19 Years | 449 (6.7%) | 385 (6.0%) |
| 20 to 24 Years | 382 (5.7%) | 365 (5.7%) |
| 25 to 29 Years | 430 (6.5%) | 393 (6.1%) |
| 30 to 34 Years | 385 (5.8%) | 415 (6.5%) |
| 35 to 39 Years | 413 (6.2%) | 480 (7.5%) |
| 40 to 44 Years | 454 (6.8%) | 325 (5.1%) |
| 45 to 49 Years | 458 (6.9%) | 411 (6.4%) |
| 50 to 54 Years | 459 (6.9%) | 385 (6.0%) |
| 55 to 59 Years | 589 (8.8%) | 419 (6.5%) |
| 60 to 64 Years | 368 (5.5%) | 454 (7.1%) |
| 65 to 69 Years | 369 (5.5%) | 372 (5.8%) |
| 70 to 74 Years | 268 (4.0%) | 343 (5.3%) |
| 75 to 79 Years | 136 (2.0%) | 213 (3.3%) |
| 80 to 84 Years | 59 (0.9%) | 125 (1.9%) |
| 85 Years and over | 103 (1.5%) | 89 (1.4%) |
| Total | 6,658 (100.0%) | 6,431 (100.0%) |
Families and Households in Powell County
Median Family Size in Powell County
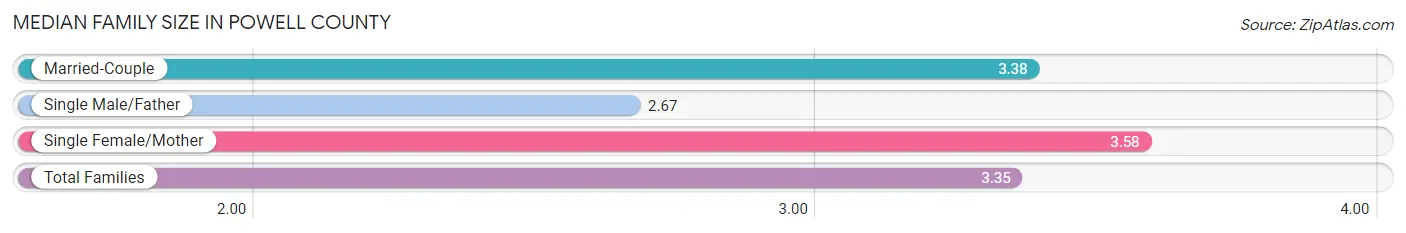
The median family size in Powell County is 3.35 persons per family, with single female/mother families (607 | 18.5%) accounting for the largest median family size of 3.58 persons per family. On the other hand, single male/father families (305 | 9.3%) represent the smallest median family size with 2.67 persons per family.
| Family Type | # Families | Family Size |
| Married-Couple | 2,371 (72.2%) | 3.38 |
| Single Male/Father | 305 (9.3%) | 2.67 |
| Single Female/Mother | 607 (18.5%) | 3.58 |
| Total Families | 3,283 (100.0%) | 3.35 |
Median Household Size in Powell County
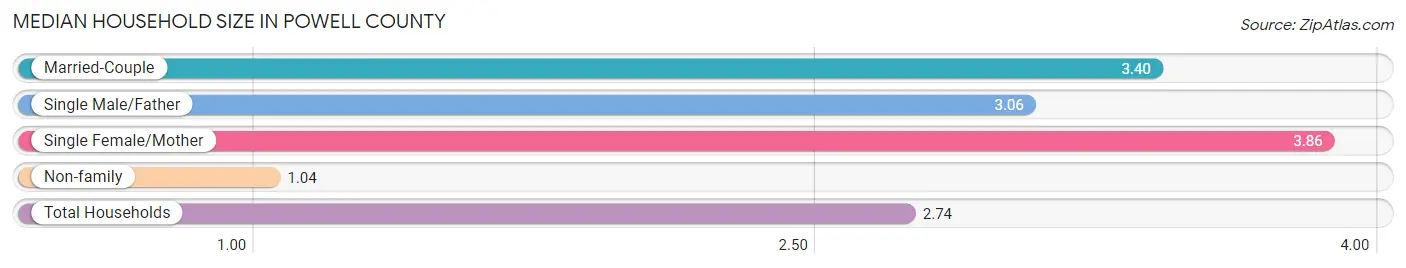
The median household size in Powell County is 2.74 persons per household, with single female/mother households (607 | 13.0%) accounting for the largest median household size of 3.86 persons per household. non-family households (1,375 | 29.5%) represent the smallest median household size with 1.04 persons per household.
| Household Type | # Households | Household Size |
| Married-Couple | 2,371 (50.9%) | 3.40 |
| Single Male/Father | 305 (6.6%) | 3.06 |
| Single Female/Mother | 607 (13.0%) | 3.86 |
| Non-family | 1,375 (29.5%) | 1.04 |
| Total Households | 4,658 (100.0%) | 2.74 |
Household Size by Marriage Status in Powell County
Out of a total of 4,658 households in Powell County, 3,283 (70.5%) are family households, while 1,375 (29.5%) are nonfamily households. The most numerous type of family households are 2-person households, comprising 1,461, and the most common type of nonfamily households are 1-person households, comprising 1,344.
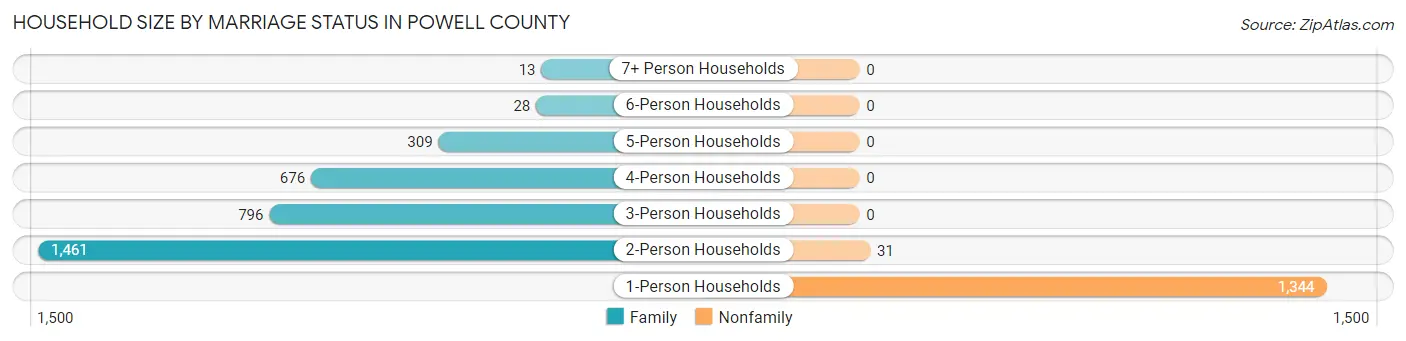
| Household Size | Family Households | Nonfamily Households |
| 1-Person Households | - | 1,344 (28.8%) |
| 2-Person Households | 1,461 (31.4%) | 31 (0.7%) |
| 3-Person Households | 796 (17.1%) | 0 (0.0%) |
| 4-Person Households | 676 (14.5%) | 0 (0.0%) |
| 5-Person Households | 309 (6.6%) | 0 (0.0%) |
| 6-Person Households | 28 (0.6%) | 0 (0.0%) |
| 7+ Person Households | 13 (0.3%) | 0 (0.0%) |
| Total | 3,283 (70.5%) | 1,375 (29.5%) |
Female Fertility in Powell County
Fertility by Age in Powell County
Average fertility rate in Powell County is 116.0 births per 1,000 women. Women in the age bracket of 20 to 34 years have the highest fertility rate with 275.0 births per 1,000 women. Women in the age bracket of 20 to 34 years acount for 93.6% of all women with births.
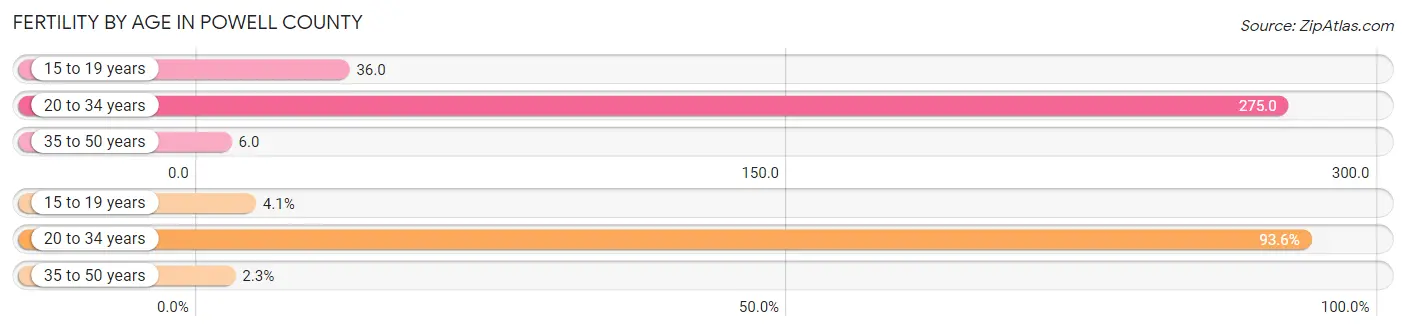
| Age Bracket | Women with Births | Births / 1,000 Women |
| 15 to 19 years | 14 (4.1%) | 36.0 |
| 20 to 34 years | 323 (93.6%) | 275.0 |
| 35 to 50 years | 8 (2.3%) | 6.0 |
| Total | 345 (100.0%) | 116.0 |
Fertility by Age by Marriage Status in Powell County
77.4% of women with births (345) in Powell County are married. The highest percentage of unmarried women with births falls into 15 to 19 years age bracket with 100.0% of them unmarried at the time of birth, while the lowest percentage of unmarried women with births belong to 20 to 34 years age bracket with 17.3% of them unmarried.

| Age Bracket | Married | Unmarried |
| 15 to 19 years | 0 (0.0%) | 14 (100.0%) |
| 20 to 34 years | 267 (82.7%) | 56 (17.3%) |
| 35 to 50 years | 0 (0.0%) | 8 (100.0%) |
| Total | 267 (77.4%) | 78 (22.6%) |
Fertility by Education in Powell County
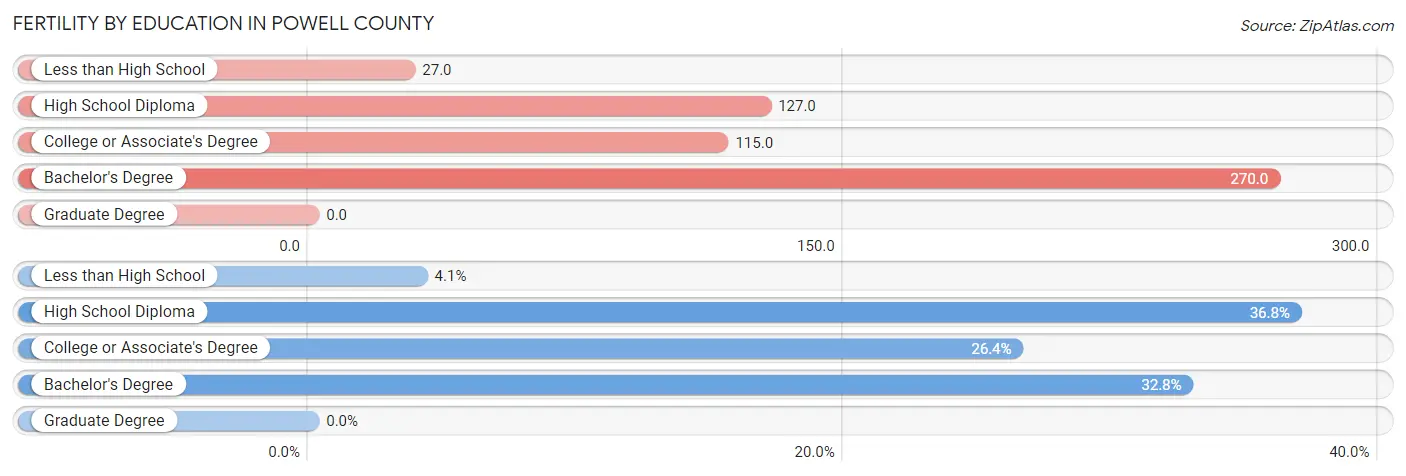
| Educational Attainment | Women with Births | Births / 1,000 Women |
| Less than High School | 14 (4.1%) | 27.0 |
| High School Diploma | 127 (36.8%) | 127.0 |
| College or Associate's Degree | 91 (26.4%) | 115.0 |
| Bachelor's Degree | 113 (32.8%) | 270.0 |
| Graduate Degree | 0 (0.0%) | 0.0 |
| Total | 345 (100.0%) | 116.0 |
Fertility by Education by Marriage Status in Powell County
22.6% of women with births in Powell County are unmarried. Women with the educational attainment of bachelor's degree are most likely to be married with 100.0% of them married at childbirth, while women with the educational attainment of less than high school are least likely to be married with 100.0% of them unmarried at childbirth.
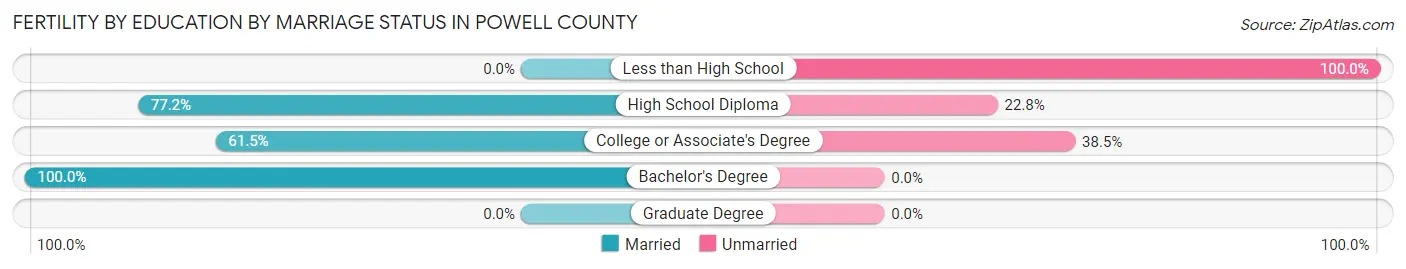
| Educational Attainment | Married | Unmarried |
| Less than High School | 0 (0.0%) | 14 (100.0%) |
| High School Diploma | 98 (77.2%) | 29 (22.8%) |
| College or Associate's Degree | 56 (61.5%) | 35 (38.5%) |
| Bachelor's Degree | 113 (100.0%) | 0 (0.0%) |
| Graduate Degree | 0 (0.0%) | 0 (0.0%) |
| Total | 267 (77.4%) | 78 (22.6%) |
Employment Characteristics in Powell County
Employment by Class of Employer in Powell County
Among the 4,637 employed individuals in Powell County, private company employees (3,117 | 67.2%), local government employees (456 | 9.8%), and state government employees (258 | 5.6%) make up the most common classes of employment.
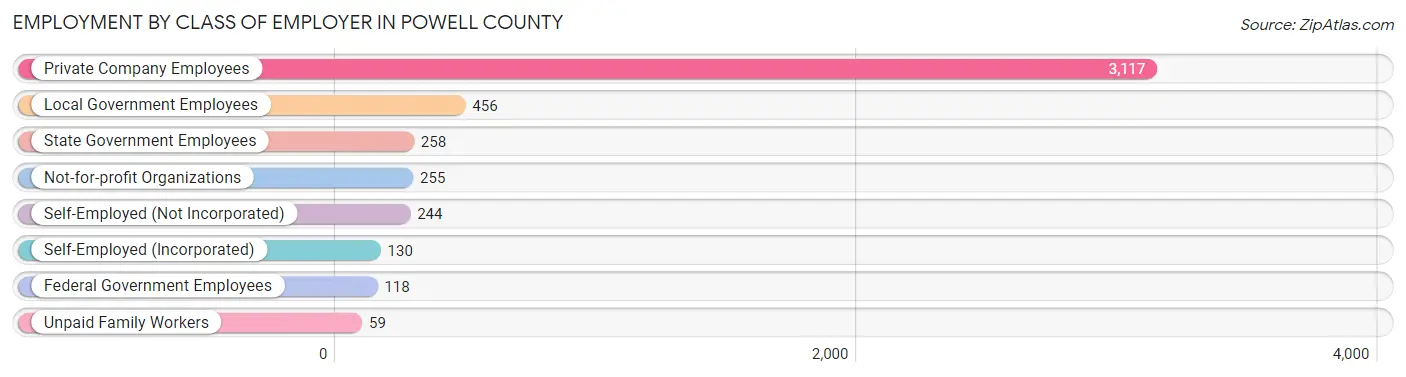
| Employer Class | # Employees | % Employees |
| Private Company Employees | 3,117 | 67.2% |
| Self-Employed (Incorporated) | 130 | 2.8% |
| Self-Employed (Not Incorporated) | 244 | 5.3% |
| Not-for-profit Organizations | 255 | 5.5% |
| Local Government Employees | 456 | 9.8% |
| State Government Employees | 258 | 5.6% |
| Federal Government Employees | 118 | 2.5% |
| Unpaid Family Workers | 59 | 1.3% |
| Total | 4,637 | 100.0% |
Employment Status by Age in Powell County
According to the labor force statistics for Powell County, out of the total population over 16 years of age (10,169), 51.1% or 5,196 individuals are in the labor force, with 7.1% or 369 of them unemployed. The age group with the highest labor force participation rate is 25 to 29 years, with 73.9% or 608 individuals in the labor force. Within the labor force, the 16 to 19 years age range has the highest percentage of unemployed individuals, with 27.0% or 71 of them being unemployed.
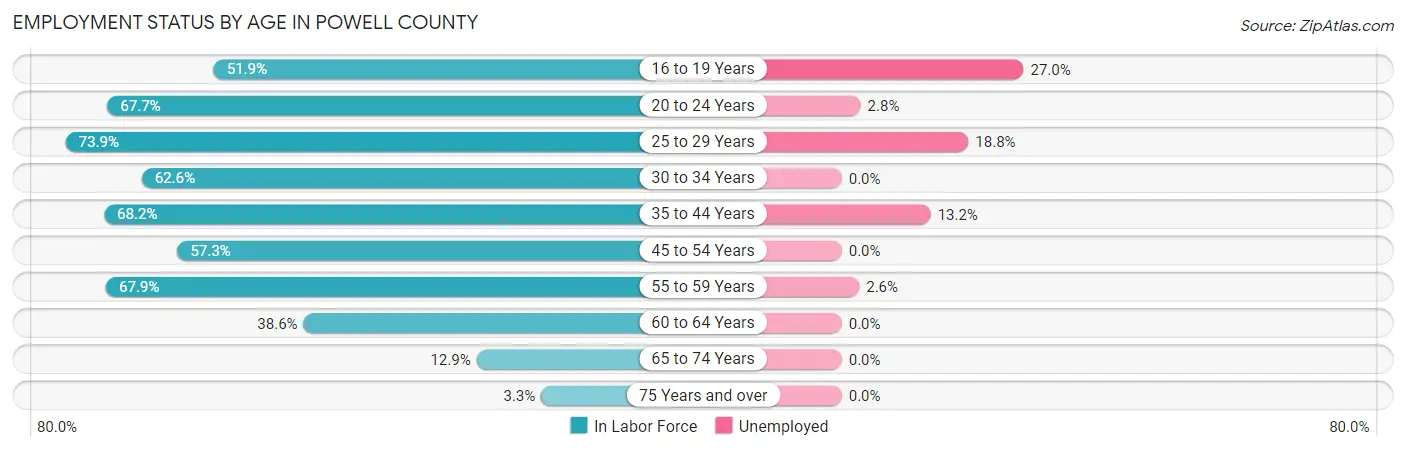
| Age Bracket | In Labor Force | Unemployed |
| 16 to 19 Years | 263 (51.9%) | 71 (27.0%) |
| 20 to 24 Years | 506 (67.7%) | 14 (2.8%) |
| 25 to 29 Years | 608 (73.9%) | 114 (18.8%) |
| 30 to 34 Years | 501 (62.6%) | 0 (0.0%) |
| 35 to 44 Years | 1,140 (68.2%) | 150 (13.2%) |
| 45 to 54 Years | 982 (57.3%) | 0 (0.0%) |
| 55 to 59 Years | 684 (67.9%) | 18 (2.6%) |
| 60 to 64 Years | 317 (38.6%) | 0 (0.0%) |
| 65 to 74 Years | 174 (12.9%) | 0 (0.0%) |
| 75 Years and over | 24 (3.3%) | 0 (0.0%) |
| Total | 5,196 (51.1%) | 369 (7.1%) |
Employment Status by Educational Attainment in Powell County
According to labor force statistics for Powell County, 61.9% of individuals (4,233) out of the total population between 25 and 64 years of age (6,838) are in the labor force, with 6.7% or 284 of them being unemployed. The group with the highest labor force participation rate are those with the educational attainment of bachelor's degree or higher, with 88.5% or 994 individuals in the labor force. Within the labor force, individuals with bachelor's degree or higher education have the highest percentage of unemployment, with 10.2% or 101 of them being unemployed.
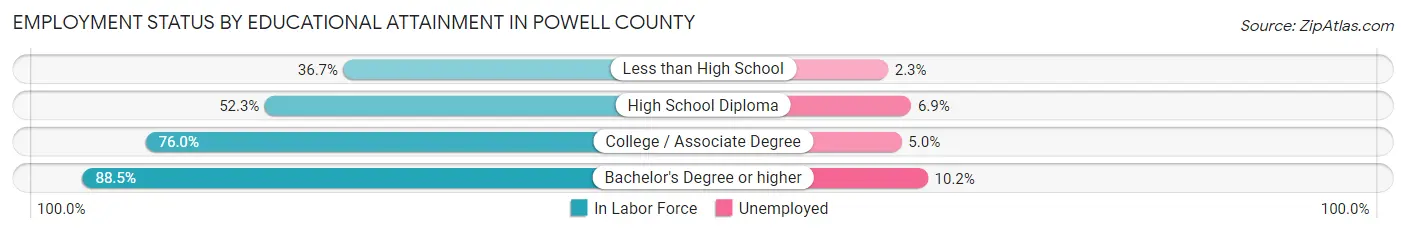
| Educational Attainment | In Labor Force | Unemployed |
| Less than High School | 354 (36.7%) | 22 (2.3%) |
| High School Diploma | 1,604 (52.3%) | 212 (6.9%) |
| College / Associate Degree | 1,281 (76.0%) | 84 (5.0%) |
| Bachelor's Degree or higher | 994 (88.5%) | 115 (10.2%) |
| Total | 4,233 (61.9%) | 458 (6.7%) |
Employment Occupations by Sex in Powell County
Management, Business, Science and Arts Occupations
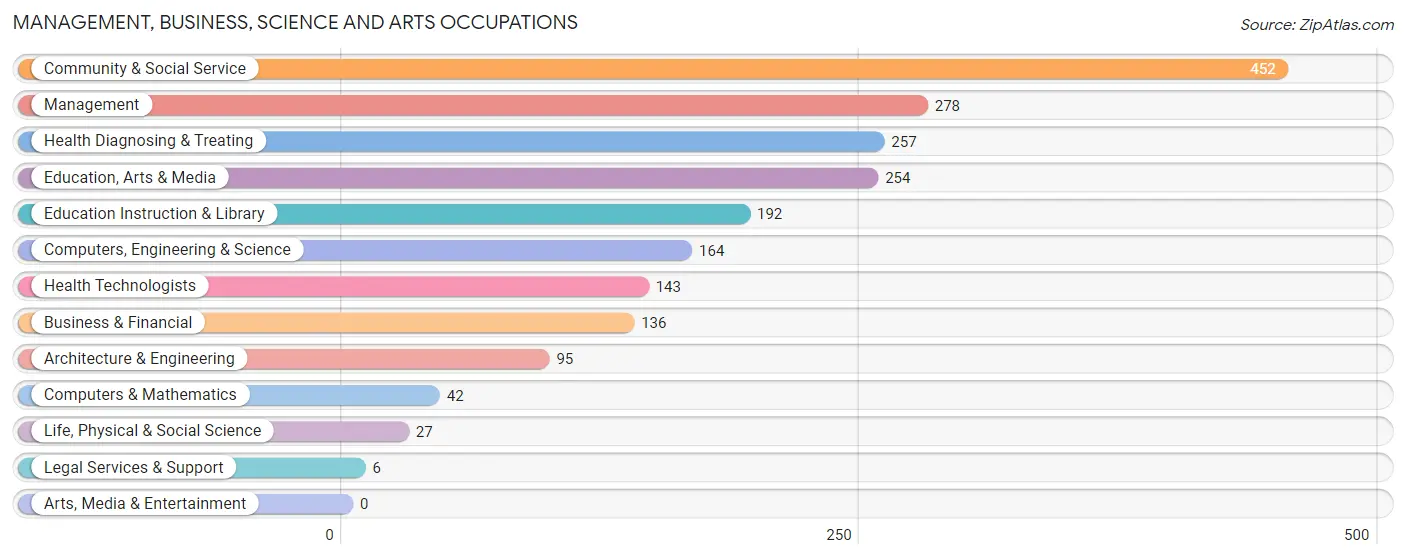
The most common Management, Business, Science and Arts occupations in Powell County are Community & Social Service (452 | 9.3%), Management (278 | 5.8%), Health Diagnosing & Treating (257 | 5.3%), Education, Arts & Media (254 | 5.3%), and Education Instruction & Library (192 | 4.0%).
Management, Business, Science and Arts Occupations by Sex
Within the Management, Business, Science and Arts occupations in Powell County, the most male-oriented occupations are Architecture & Engineering (100.0%), Computers, Engineering & Science (60.4%), and Management (56.1%), while the most female-oriented occupations are Computers & Mathematics (100.0%), Legal Services & Support (100.0%), and Education Instruction & Library (94.8%).
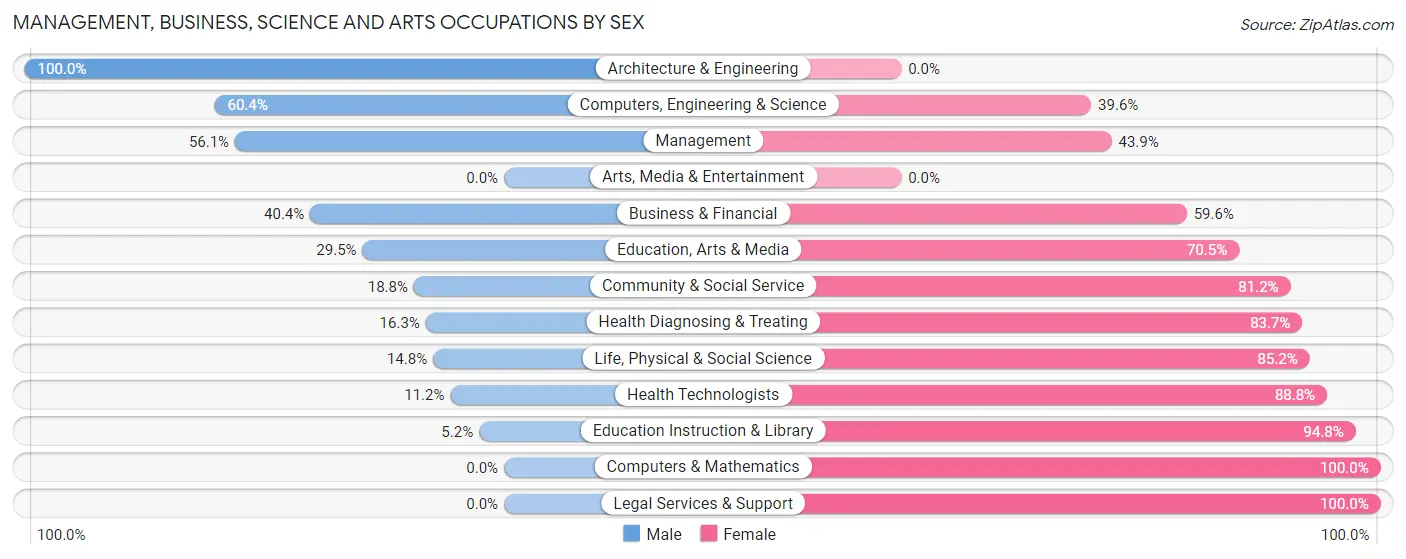
| Occupation | Male | Female |
| Management | 156 (56.1%) | 122 (43.9%) |
| Business & Financial | 55 (40.4%) | 81 (59.6%) |
| Computers, Engineering & Science | 99 (60.4%) | 65 (39.6%) |
| Computers & Mathematics | 0 (0.0%) | 42 (100.0%) |
| Architecture & Engineering | 95 (100.0%) | 0 (0.0%) |
| Life, Physical & Social Science | 4 (14.8%) | 23 (85.2%) |
| Community & Social Service | 85 (18.8%) | 367 (81.2%) |
| Education, Arts & Media | 75 (29.5%) | 179 (70.5%) |
| Legal Services & Support | 0 (0.0%) | 6 (100.0%) |
| Education Instruction & Library | 10 (5.2%) | 182 (94.8%) |
| Arts, Media & Entertainment | 0 (0.0%) | 0 (0.0%) |
| Health Diagnosing & Treating | 42 (16.3%) | 215 (83.7%) |
| Health Technologists | 16 (11.2%) | 127 (88.8%) |
| Total (Category) | 437 (34.0%) | 850 (66.0%) |
| Total (Overall) | 2,557 (52.9%) | 2,275 (47.1%) |
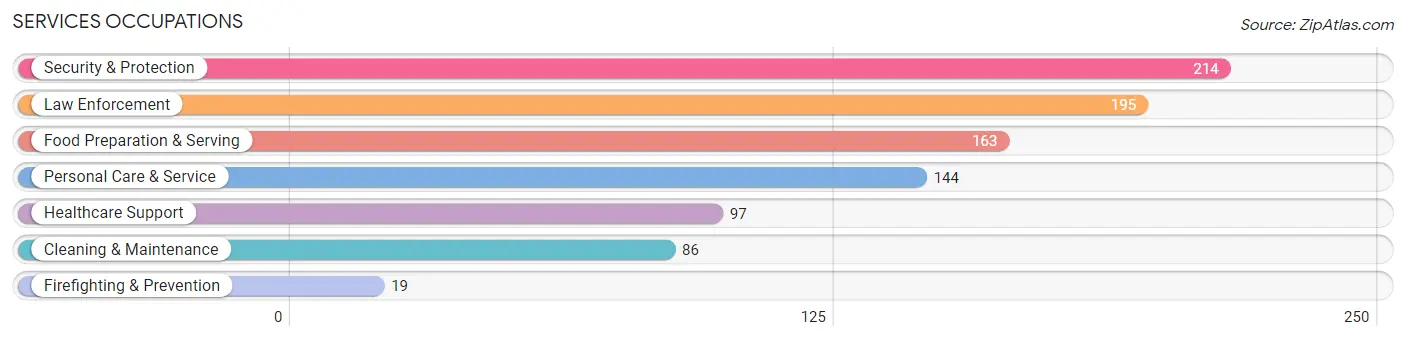
Services Occupations
The most common Services occupations in Powell County are Security & Protection (214 | 4.4%), Law Enforcement (195 | 4.0%), Food Preparation & Serving (163 | 3.4%), Personal Care & Service (144 | 3.0%), and Healthcare Support (97 | 2.0%).
Services Occupations by Sex
Within the Services occupations in Powell County, the most male-oriented occupations are Law Enforcement (90.8%), Security & Protection (82.7%), and Cleaning & Maintenance (77.9%), while the most female-oriented occupations are Healthcare Support (100.0%), Firefighting & Prevention (100.0%), and Personal Care & Service (74.3%).
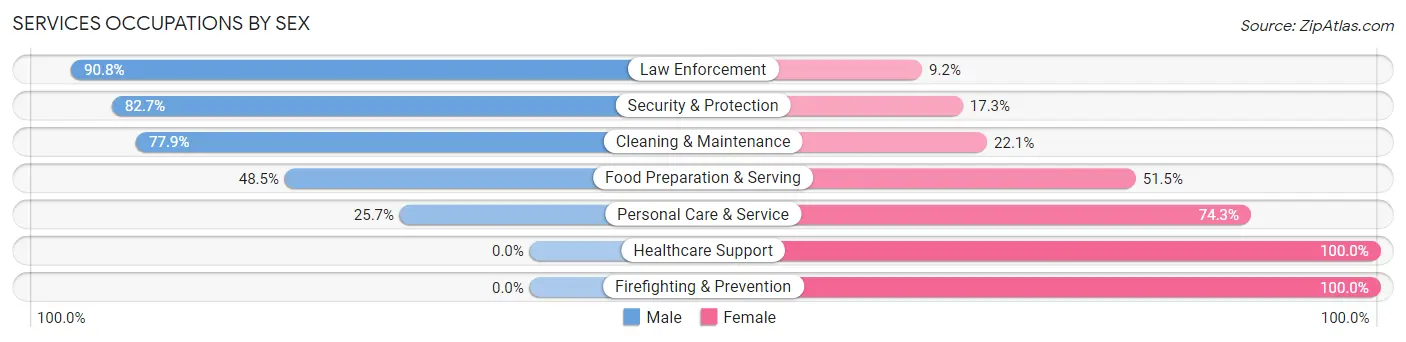
| Occupation | Male | Female |
| Healthcare Support | 0 (0.0%) | 97 (100.0%) |
| Security & Protection | 177 (82.7%) | 37 (17.3%) |
| Firefighting & Prevention | 0 (0.0%) | 19 (100.0%) |
| Law Enforcement | 177 (90.8%) | 18 (9.2%) |
| Food Preparation & Serving | 79 (48.5%) | 84 (51.5%) |
| Cleaning & Maintenance | 67 (77.9%) | 19 (22.1%) |
| Personal Care & Service | 37 (25.7%) | 107 (74.3%) |
| Total (Category) | 360 (51.1%) | 344 (48.9%) |
| Total (Overall) | 2,557 (52.9%) | 2,275 (47.1%) |
Sales and Office Occupations
The most common Sales and Office occupations in Powell County are Office & Administration (627 | 13.0%), and Sales & Related (490 | 10.1%).

Sales and Office Occupations by Sex

| Occupation | Male | Female |
| Sales & Related | 229 (46.7%) | 261 (53.3%) |
| Office & Administration | 92 (14.7%) | 535 (85.3%) |
| Total (Category) | 321 (28.7%) | 796 (71.3%) |
| Total (Overall) | 2,557 (52.9%) | 2,275 (47.1%) |
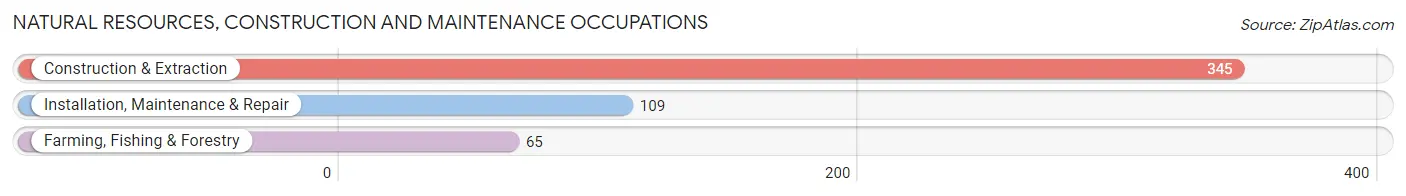
Natural Resources, Construction and Maintenance Occupations
The most common Natural Resources, Construction and Maintenance occupations in Powell County are Construction & Extraction (345 | 7.1%), Installation, Maintenance & Repair (109 | 2.3%), and Farming, Fishing & Forestry (65 | 1.3%).
Natural Resources, Construction and Maintenance Occupations by Sex
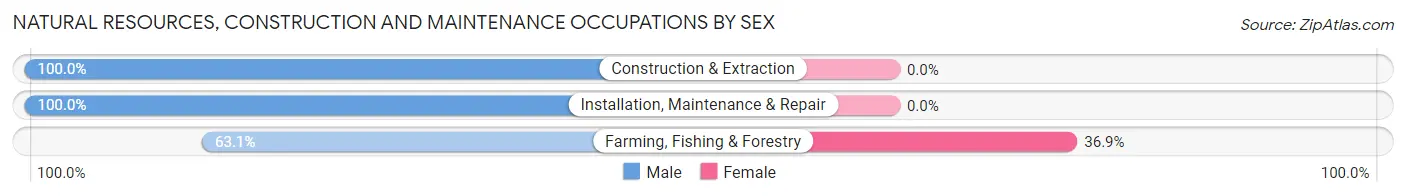
| Occupation | Male | Female |
| Farming, Fishing & Forestry | 41 (63.1%) | 24 (36.9%) |
| Construction & Extraction | 345 (100.0%) | 0 (0.0%) |
| Installation, Maintenance & Repair | 109 (100.0%) | 0 (0.0%) |
| Total (Category) | 495 (95.4%) | 24 (4.6%) |
| Total (Overall) | 2,557 (52.9%) | 2,275 (47.1%) |
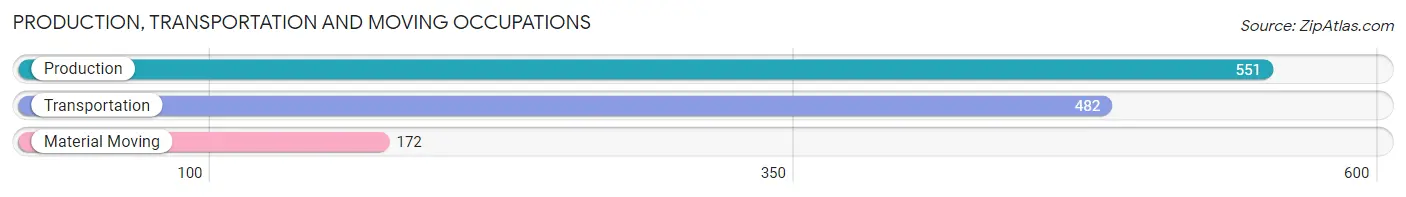
Production, Transportation and Moving Occupations
The most common Production, Transportation and Moving occupations in Powell County are Production (551 | 11.4%), Transportation (482 | 10.0%), and Material Moving (172 | 3.6%).
Production, Transportation and Moving Occupations by Sex
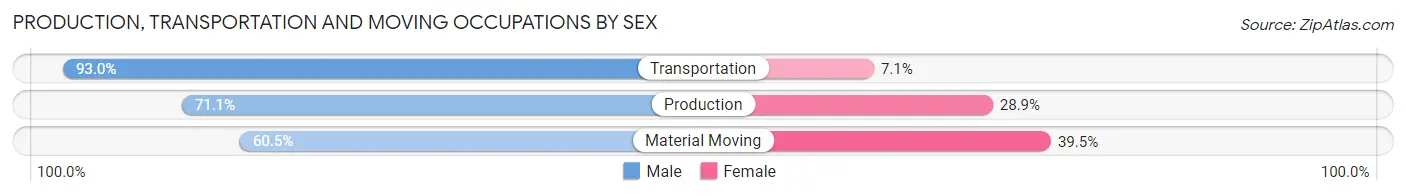
| Occupation | Male | Female |
| Production | 392 (71.1%) | 159 (28.9%) |
| Transportation | 448 (92.9%) | 34 (7.0%) |
| Material Moving | 104 (60.5%) | 68 (39.5%) |
| Total (Category) | 944 (78.3%) | 261 (21.7%) |
| Total (Overall) | 2,557 (52.9%) | 2,275 (47.1%) |
Employment Industries by Sex in Powell County
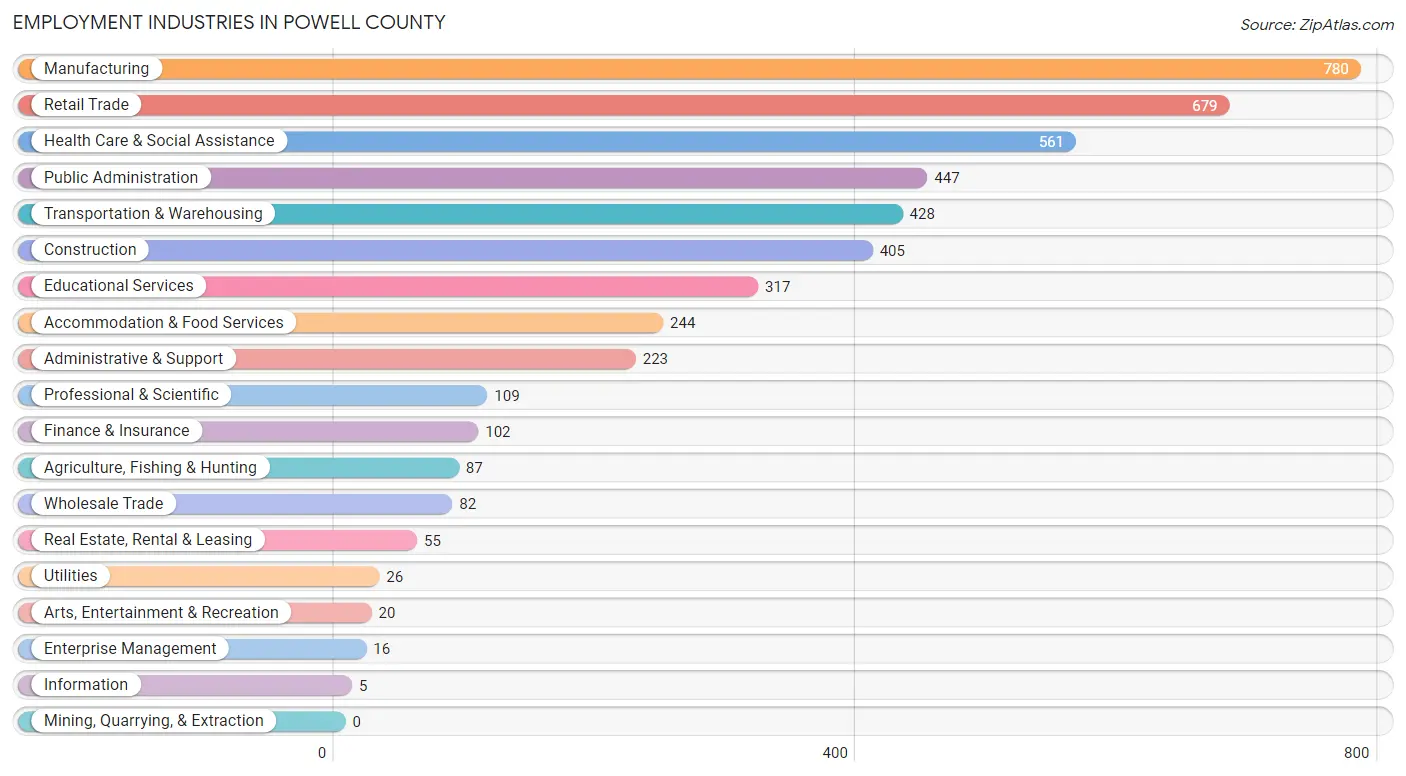
Employment Industries in Powell County
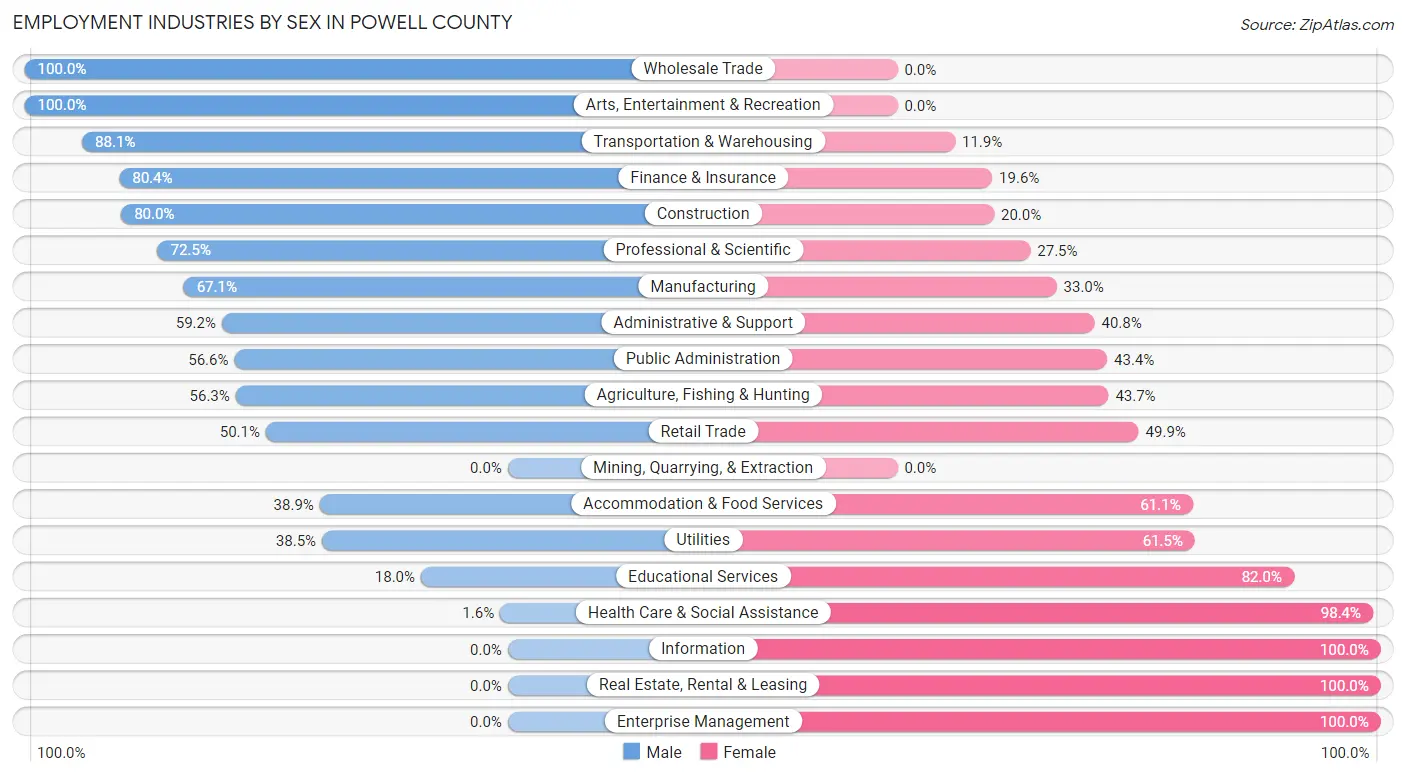
The major employment industries in Powell County include Manufacturing (780 | 16.1%), Retail Trade (679 | 14.1%), Health Care & Social Assistance (561 | 11.6%), Public Administration (447 | 9.2%), and Transportation & Warehousing (428 | 8.9%).
Employment Industries by Sex in Powell County
The Powell County industries that see more men than women are Wholesale Trade (100.0%), Arts, Entertainment & Recreation (100.0%), and Transportation & Warehousing (88.1%), whereas the industries that tend to have a higher number of women are Information (100.0%), Real Estate, Rental & Leasing (100.0%), and Enterprise Management (100.0%).
| Industry | Male | Female |
| Agriculture, Fishing & Hunting | 49 (56.3%) | 38 (43.7%) |
| Mining, Quarrying, & Extraction | 0 (0.0%) | 0 (0.0%) |
| Construction | 324 (80.0%) | 81 (20.0%) |
| Manufacturing | 523 (67.0%) | 257 (33.0%) |
| Wholesale Trade | 82 (100.0%) | 0 (0.0%) |
| Retail Trade | 340 (50.1%) | 339 (49.9%) |
| Transportation & Warehousing | 377 (88.1%) | 51 (11.9%) |
| Utilities | 10 (38.5%) | 16 (61.5%) |
| Information | 0 (0.0%) | 5 (100.0%) |
| Finance & Insurance | 82 (80.4%) | 20 (19.6%) |
| Real Estate, Rental & Leasing | 0 (0.0%) | 55 (100.0%) |
| Professional & Scientific | 79 (72.5%) | 30 (27.5%) |
| Enterprise Management | 0 (0.0%) | 16 (100.0%) |
| Administrative & Support | 132 (59.2%) | 91 (40.8%) |
| Educational Services | 57 (18.0%) | 260 (82.0%) |
| Health Care & Social Assistance | 9 (1.6%) | 552 (98.4%) |
| Arts, Entertainment & Recreation | 20 (100.0%) | 0 (0.0%) |
| Accommodation & Food Services | 95 (38.9%) | 149 (61.1%) |
| Public Administration | 253 (56.6%) | 194 (43.4%) |
| Total | 2,557 (52.9%) | 2,275 (47.1%) |
Education in Powell County
School Enrollment in Powell County
The most common levels of schooling among the 2,919 students in Powell County are high school (794 | 27.2%), middle school (722 | 24.7%), and elementary school (510 | 17.5%).
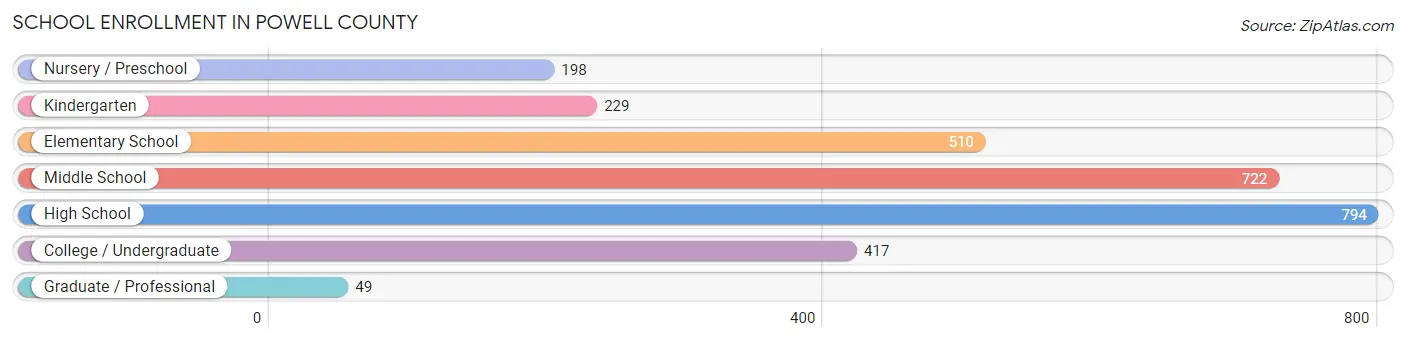
| School Level | # Students | % Students |
| Nursery / Preschool | 198 | 6.8% |
| Kindergarten | 229 | 7.9% |
| Elementary School | 510 | 17.5% |
| Middle School | 722 | 24.7% |
| High School | 794 | 27.2% |
| College / Undergraduate | 417 | 14.3% |
| Graduate / Professional | 49 | 1.7% |
| Total | 2,919 | 100.0% |
School Enrollment by Age by Funding Source in Powell County
Out of a total of 2,919 students who are enrolled in schools in Powell County, 184 (6.3%) attend a private institution, while the remaining 2,735 (93.7%) are enrolled in public schools. The age group of 3 to 4 year olds has the highest likelihood of being enrolled in private schools, with 42 (29.4% in the age bracket) enrolled. Conversely, the age group of 10 to 14 year olds has the lowest likelihood of being enrolled in a private school, with 930 (100.0% in the age bracket) attending a public institution.
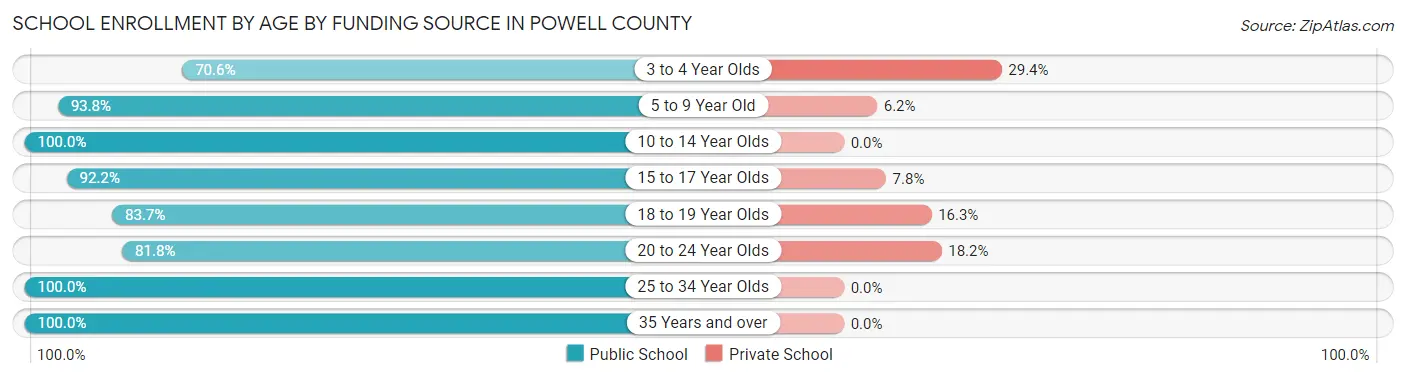
| Age Bracket | Public School | Private School |
| 3 to 4 Year Olds | 101 (70.6%) | 42 (29.4%) |
| 5 to 9 Year Old | 700 (93.8%) | 46 (6.2%) |
| 10 to 14 Year Olds | 930 (100.0%) | 0 (0.0%) |
| 15 to 17 Year Olds | 519 (92.2%) | 44 (7.8%) |
| 18 to 19 Year Olds | 113 (83.7%) | 22 (16.3%) |
| 20 to 24 Year Olds | 135 (81.8%) | 30 (18.2%) |
| 25 to 34 Year Olds | 191 (100.0%) | 0 (0.0%) |
| 35 Years and over | 46 (100.0%) | 0 (0.0%) |
| Total | 2,735 (93.7%) | 184 (6.3%) |
Educational Attainment by Field of Study in Powell County
Business (305 | 20.8%), education (303 | 20.7%), science & technology (251 | 17.2%), arts & humanities (205 | 14.0%), and engineering (105 | 7.2%) are the most common fields of study among 1,463 individuals in Powell County who have obtained a bachelor's degree or higher.
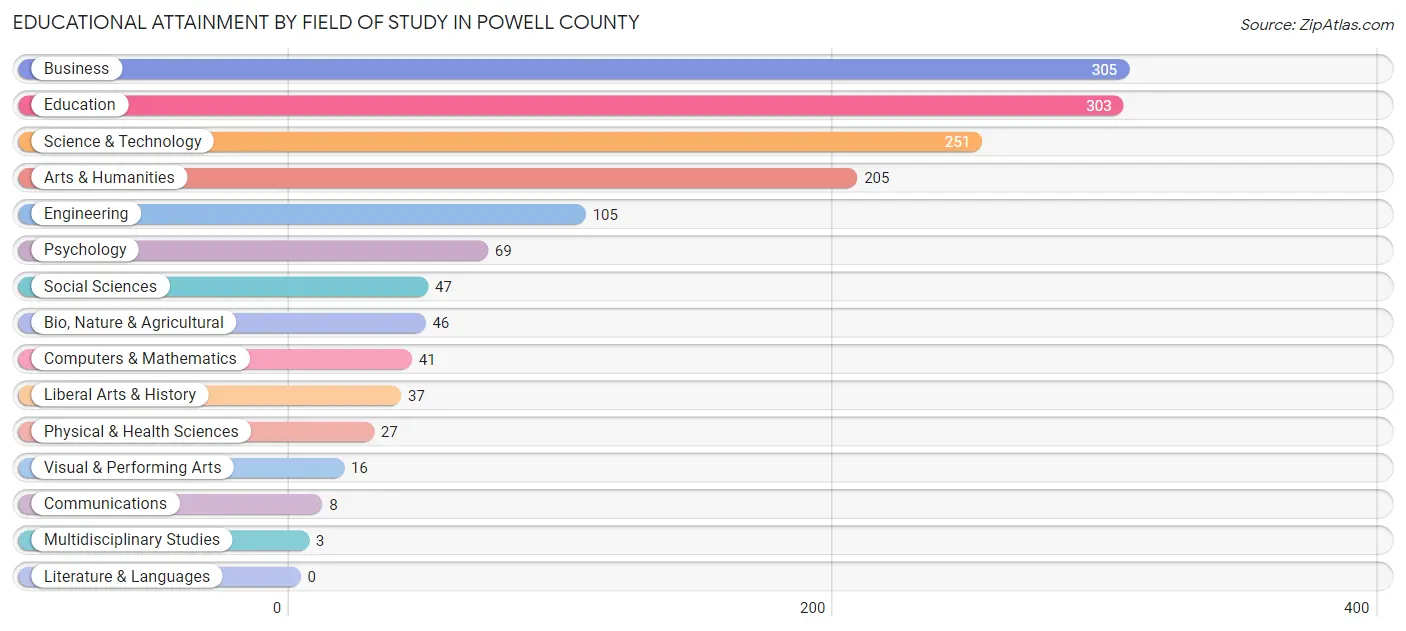
| Field of Study | # Graduates | % Graduates |
| Computers & Mathematics | 41 | 2.8% |
| Bio, Nature & Agricultural | 46 | 3.1% |
| Physical & Health Sciences | 27 | 1.8% |
| Psychology | 69 | 4.7% |
| Social Sciences | 47 | 3.2% |
| Engineering | 105 | 7.2% |
| Multidisciplinary Studies | 3 | 0.2% |
| Science & Technology | 251 | 17.2% |
| Business | 305 | 20.8% |
| Education | 303 | 20.7% |
| Literature & Languages | 0 | 0.0% |
| Liberal Arts & History | 37 | 2.5% |
| Visual & Performing Arts | 16 | 1.1% |
| Communications | 8 | 0.5% |
| Arts & Humanities | 205 | 14.0% |
| Total | 1,463 | 100.0% |
Transportation & Commute in Powell County
Vehicle Availability by Sex in Powell County
The most prevalent vehicle ownership categories in Powell County are males with 2 vehicles (735, accounting for 29.0%) and females with 2 vehicles (749, making up 35.0%).
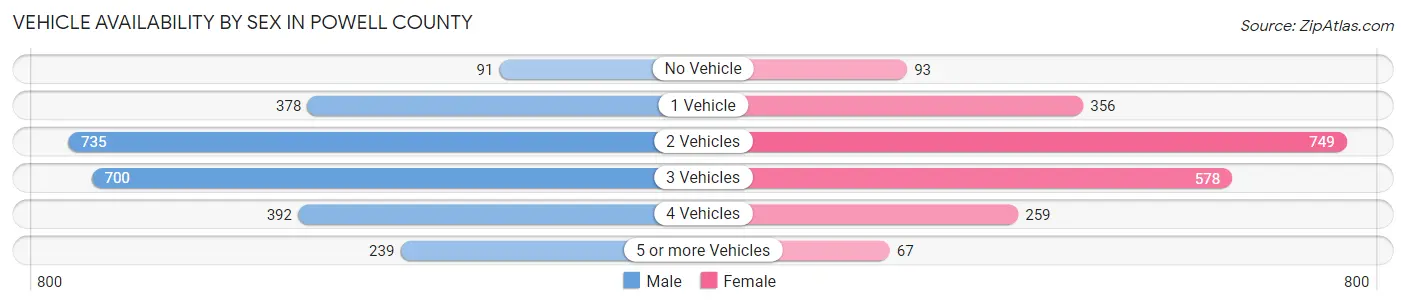
| Vehicles Available | Male | Female |
| No Vehicle | 91 (3.6%) | 93 (4.4%) |
| 1 Vehicle | 378 (14.9%) | 356 (16.9%) |
| 2 Vehicles | 735 (29.0%) | 749 (35.6%) |
| 3 Vehicles | 700 (27.6%) | 578 (27.5%) |
| 4 Vehicles | 392 (15.5%) | 259 (12.3%) |
| 5 or more Vehicles | 239 (9.4%) | 67 (3.2%) |
| Total | 2,535 (100.0%) | 2,102 (100.0%) |
Commute Time in Powell County
The most frequently occuring commute durations in Powell County are 10 to 14 minutes (851 commuters, 19.1%), 45 to 59 minutes (681 commuters, 15.3%), and 60 to 89 minutes (558 commuters, 12.5%).
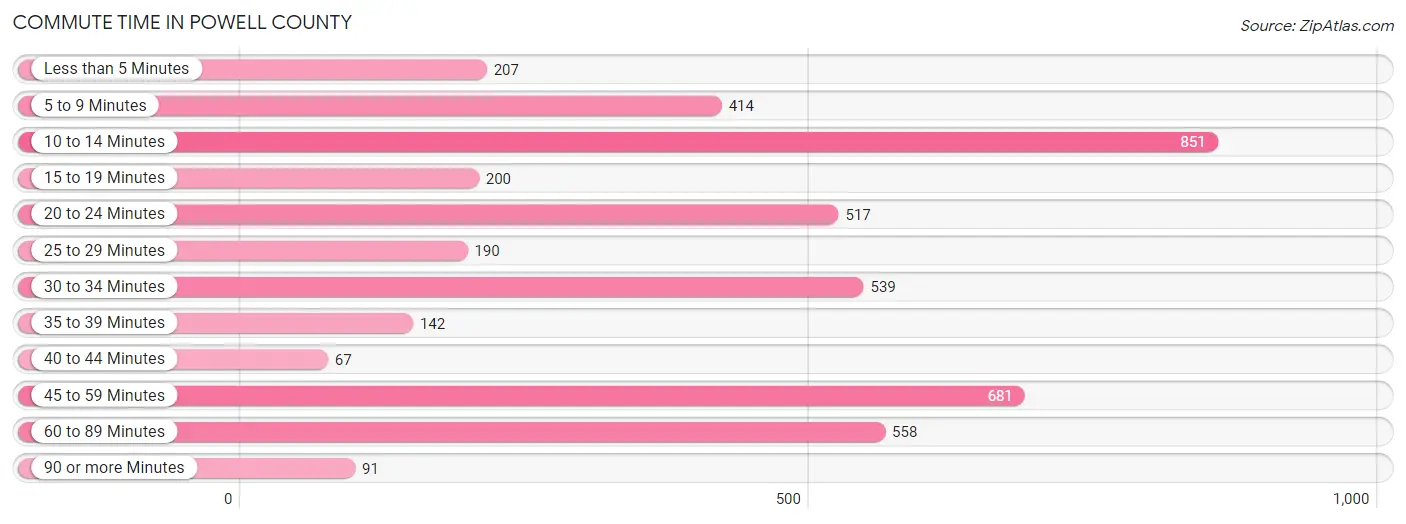
| Commute Time | # Commuters | % Commuters |
| Less than 5 Minutes | 207 | 4.6% |
| 5 to 9 Minutes | 414 | 9.3% |
| 10 to 14 Minutes | 851 | 19.1% |
| 15 to 19 Minutes | 200 | 4.5% |
| 20 to 24 Minutes | 517 | 11.6% |
| 25 to 29 Minutes | 190 | 4.3% |
| 30 to 34 Minutes | 539 | 12.1% |
| 35 to 39 Minutes | 142 | 3.2% |
| 40 to 44 Minutes | 67 | 1.5% |
| 45 to 59 Minutes | 681 | 15.3% |
| 60 to 89 Minutes | 558 | 12.5% |
| 90 or more Minutes | 91 | 2.0% |
Commute Time by Sex in Powell County
The most common commute times in Powell County are 10 to 14 minutes (467 commuters, 19.3%) for males and 10 to 14 minutes (384 commuters, 18.8%) for females.
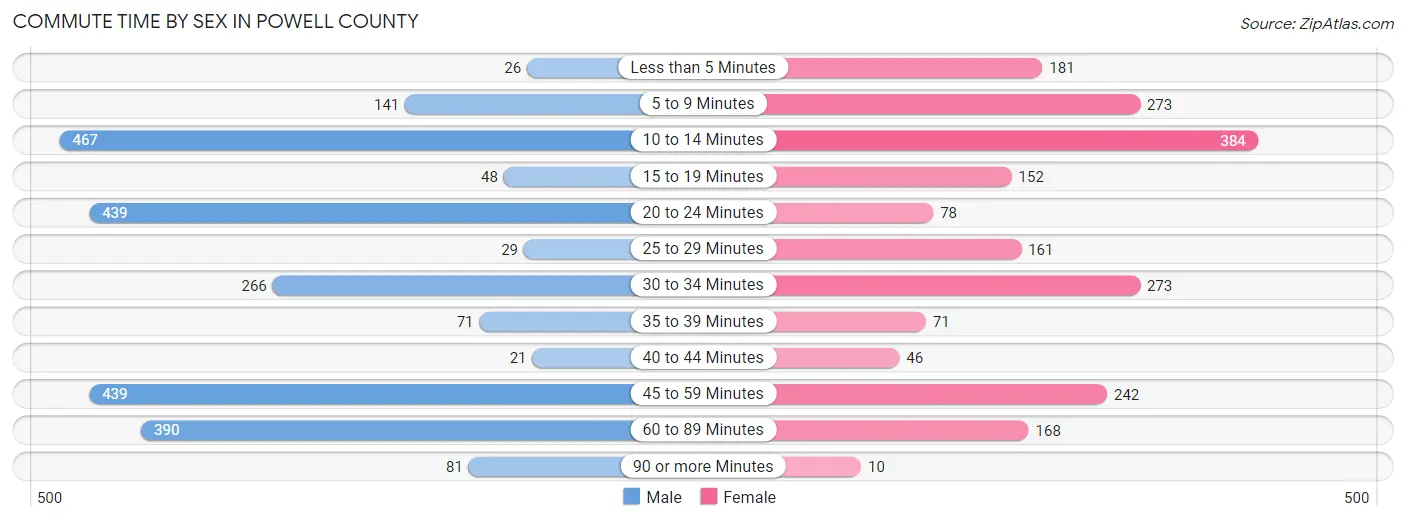
| Commute Time | Male | Female |
| Less than 5 Minutes | 26 (1.1%) | 181 (8.9%) |
| 5 to 9 Minutes | 141 (5.8%) | 273 (13.4%) |
| 10 to 14 Minutes | 467 (19.3%) | 384 (18.8%) |
| 15 to 19 Minutes | 48 (2.0%) | 152 (7.4%) |
| 20 to 24 Minutes | 439 (18.2%) | 78 (3.8%) |
| 25 to 29 Minutes | 29 (1.2%) | 161 (7.9%) |
| 30 to 34 Minutes | 266 (11.0%) | 273 (13.4%) |
| 35 to 39 Minutes | 71 (2.9%) | 71 (3.5%) |
| 40 to 44 Minutes | 21 (0.9%) | 46 (2.3%) |
| 45 to 59 Minutes | 439 (18.2%) | 242 (11.9%) |
| 60 to 89 Minutes | 390 (16.1%) | 168 (8.2%) |
| 90 or more Minutes | 81 (3.4%) | 10 (0.5%) |
Time of Departure to Work by Sex in Powell County
The most frequent times of departure to work in Powell County are 12:00 AM to 4:59 AM (411, 17.0%) for males and 7:30 AM to 7:59 AM (331, 16.2%) for females.
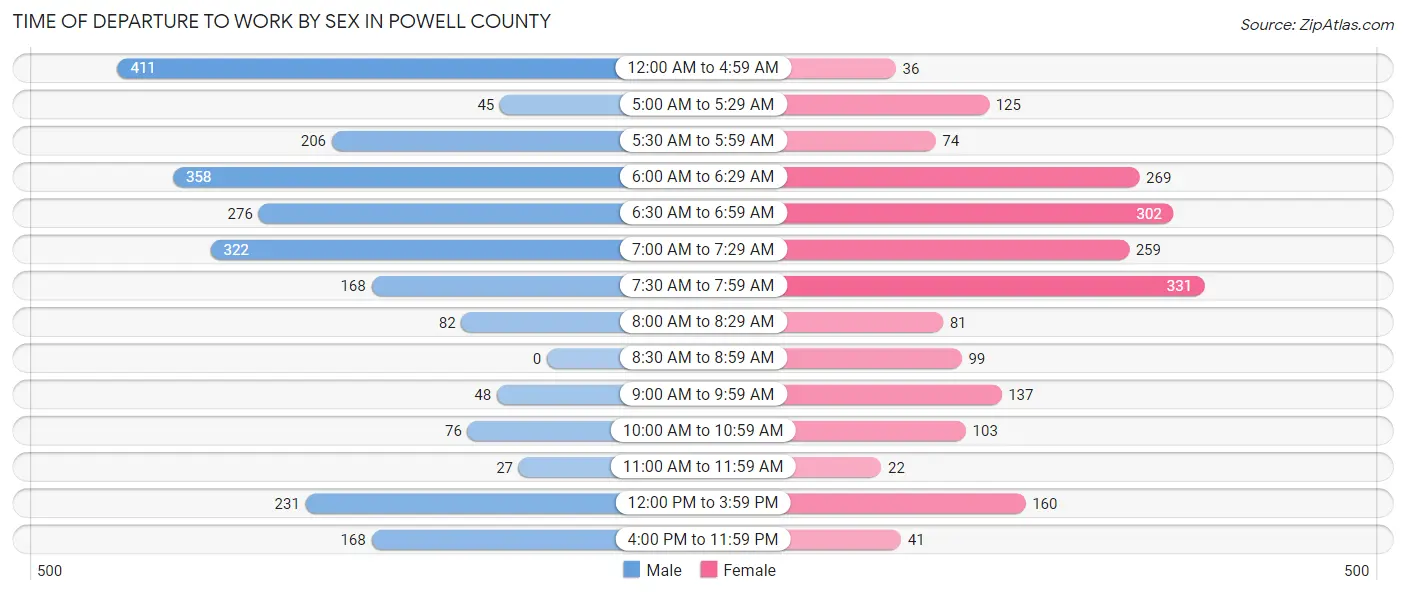
| Time of Departure | Male | Female |
| 12:00 AM to 4:59 AM | 411 (17.0%) | 36 (1.8%) |
| 5:00 AM to 5:29 AM | 45 (1.9%) | 125 (6.1%) |
| 5:30 AM to 5:59 AM | 206 (8.5%) | 74 (3.6%) |
| 6:00 AM to 6:29 AM | 358 (14.8%) | 269 (13.2%) |
| 6:30 AM to 6:59 AM | 276 (11.4%) | 302 (14.8%) |
| 7:00 AM to 7:29 AM | 322 (13.3%) | 259 (12.7%) |
| 7:30 AM to 7:59 AM | 168 (7.0%) | 331 (16.2%) |
| 8:00 AM to 8:29 AM | 82 (3.4%) | 81 (4.0%) |
| 8:30 AM to 8:59 AM | 0 (0.0%) | 99 (4.9%) |
| 9:00 AM to 9:59 AM | 48 (2.0%) | 137 (6.7%) |
| 10:00 AM to 10:59 AM | 76 (3.1%) | 103 (5.1%) |
| 11:00 AM to 11:59 AM | 27 (1.1%) | 22 (1.1%) |
| 12:00 PM to 3:59 PM | 231 (9.6%) | 160 (7.9%) |
| 4:00 PM to 11:59 PM | 168 (7.0%) | 41 (2.0%) |
| Total | 2,418 (100.0%) | 2,039 (100.0%) |
Housing Occupancy in Powell County
Occupancy by Ownership in Powell County
Of the total 4,658 dwellings in Powell County, owner-occupied units account for 3,172 (68.1%), while renter-occupied units make up 1,486 (31.9%).
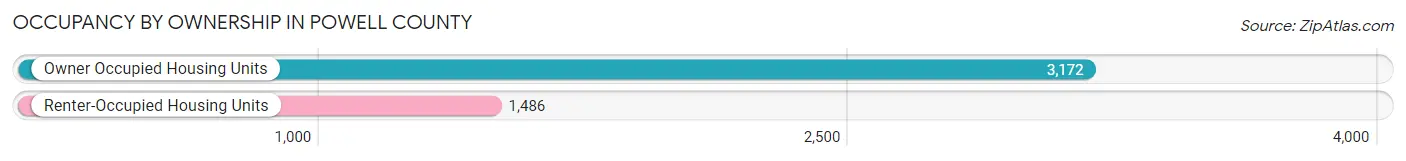
| Occupancy | # Housing Units | % Housing Units |
| Owner Occupied Housing Units | 3,172 | 68.1% |
| Renter-Occupied Housing Units | 1,486 | 31.9% |
| Total Occupied Housing Units | 4,658 | 100.0% |
Occupancy by Household Size in Powell County
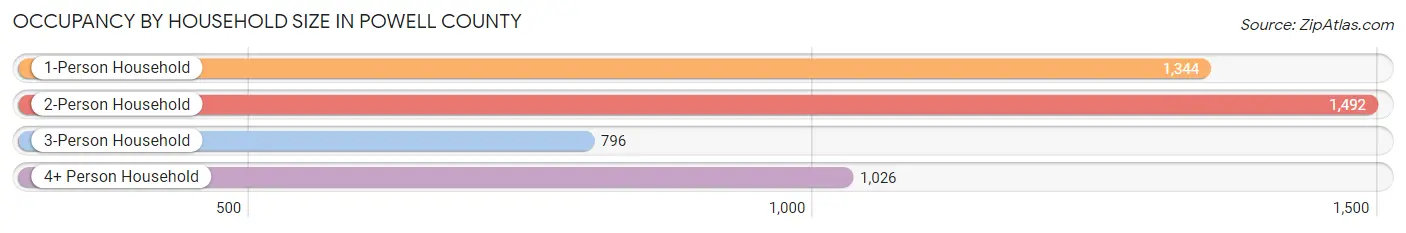
| Household Size | # Housing Units | % Housing Units |
| 1-Person Household | 1,344 | 28.8% |
| 2-Person Household | 1,492 | 32.0% |
| 3-Person Household | 796 | 17.1% |
| 4+ Person Household | 1,026 | 22.0% |
| Total Housing Units | 4,658 | 100.0% |
Occupancy by Ownership by Household Size in Powell County
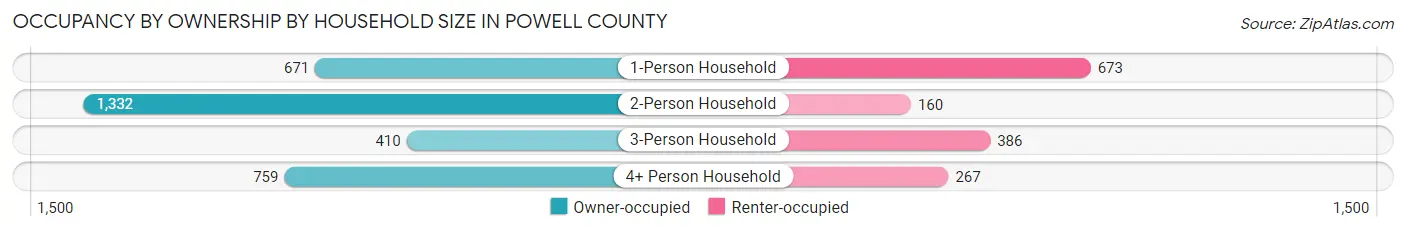
| Household Size | Owner-occupied | Renter-occupied |
| 1-Person Household | 671 (49.9%) | 673 (50.1%) |
| 2-Person Household | 1,332 (89.3%) | 160 (10.7%) |
| 3-Person Household | 410 (51.5%) | 386 (48.5%) |
| 4+ Person Household | 759 (74.0%) | 267 (26.0%) |
| Total Housing Units | 3,172 (68.1%) | 1,486 (31.9%) |
Occupancy by Educational Attainment in Powell County
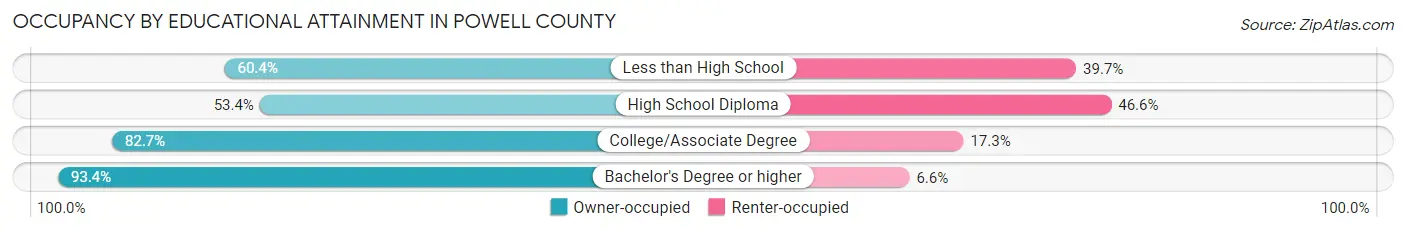
| Household Size | Owner-occupied | Renter-occupied |
| Less than High School | 618 (60.4%) | 406 (39.7%) |
| High School Diploma | 937 (53.4%) | 818 (46.6%) |
| College/Associate Degree | 1,065 (82.7%) | 223 (17.3%) |
| Bachelor's Degree or higher | 552 (93.4%) | 39 (6.6%) |
Occupancy by Age of Householder in Powell County
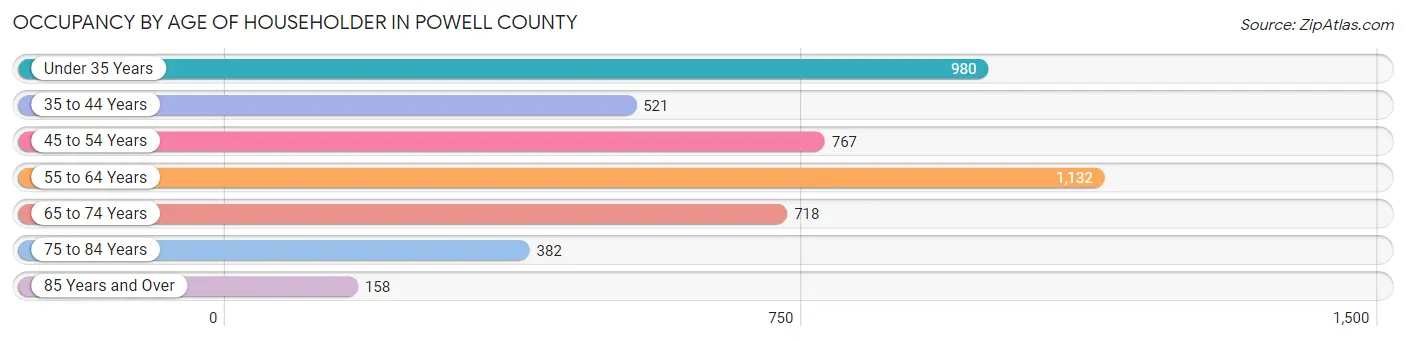
| Age Bracket | # Households | % Households |
| Under 35 Years | 980 | 21.0% |
| 35 to 44 Years | 521 | 11.2% |
| 45 to 54 Years | 767 | 16.5% |
| 55 to 64 Years | 1,132 | 24.3% |
| 65 to 74 Years | 718 | 15.4% |
| 75 to 84 Years | 382 | 8.2% |
| 85 Years and Over | 158 | 3.4% |
| Total | 4,658 | 100.0% |
Housing Finances in Powell County
Median Income by Occupancy in Powell County
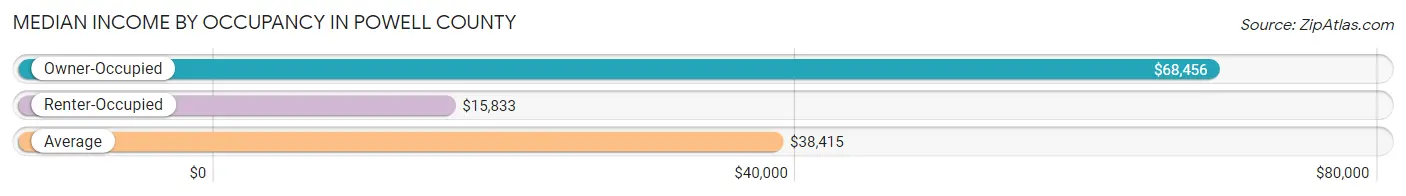
| Occupancy Type | # Households | Median Income |
| Owner-Occupied | 3,172 (68.1%) | $68,456 |
| Renter-Occupied | 1,486 (31.9%) | $15,833 |
| Average | 4,658 (100.0%) | $38,415 |
Occupancy by Householder Income Bracket in Powell County
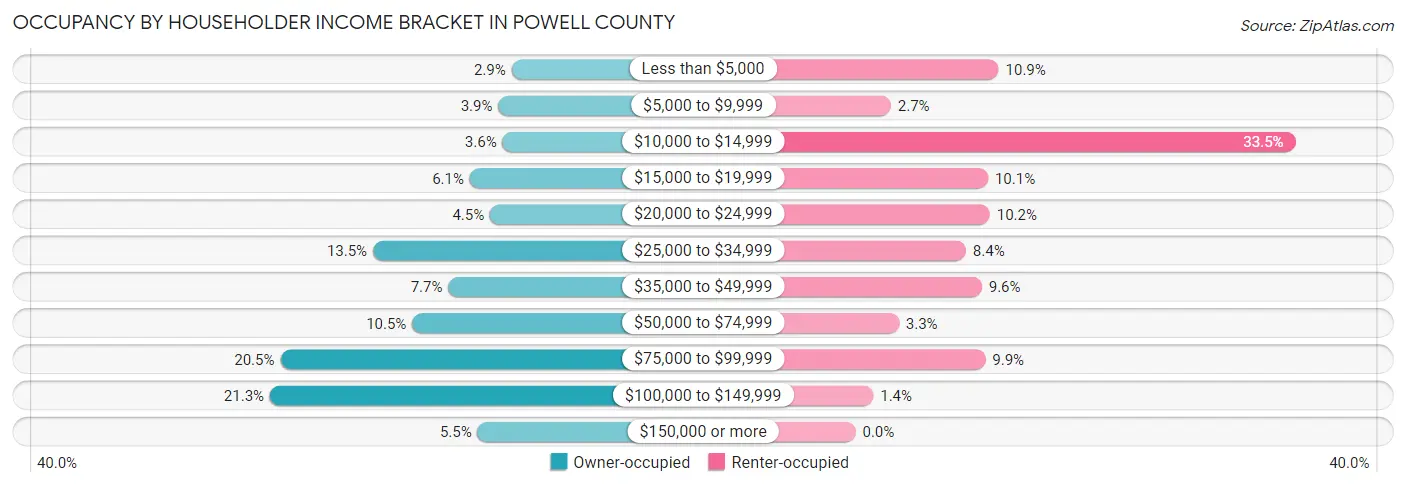
| Income Bracket | Owner-occupied | Renter-occupied |
| Less than $5,000 | 92 (2.9%) | 162 (10.9%) |
| $5,000 to $9,999 | 124 (3.9%) | 40 (2.7%) |
| $10,000 to $14,999 | 114 (3.6%) | 498 (33.5%) |
| $15,000 to $19,999 | 193 (6.1%) | 150 (10.1%) |
| $20,000 to $24,999 | 144 (4.5%) | 152 (10.2%) |
| $25,000 to $34,999 | 427 (13.5%) | 125 (8.4%) |
| $35,000 to $49,999 | 245 (7.7%) | 143 (9.6%) |
| $50,000 to $74,999 | 332 (10.5%) | 49 (3.3%) |
| $75,000 to $99,999 | 651 (20.5%) | 147 (9.9%) |
| $100,000 to $149,999 | 676 (21.3%) | 20 (1.3%) |
| $150,000 or more | 174 (5.5%) | 0 (0.0%) |
| Total | 3,172 (100.0%) | 1,486 (100.0%) |
Monthly Housing Cost Tiers in Powell County
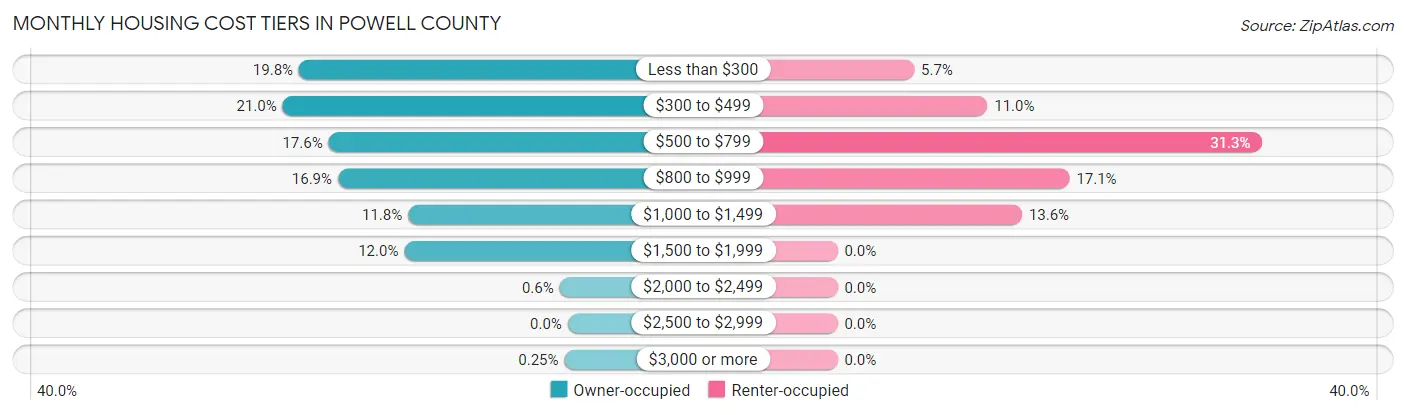
| Monthly Cost | Owner-occupied | Renter-occupied |
| Less than $300 | 628 (19.8%) | 84 (5.7%) |
| $300 to $499 | 666 (21.0%) | 164 (11.0%) |
| $500 to $799 | 559 (17.6%) | 465 (31.3%) |
| $800 to $999 | 537 (16.9%) | 254 (17.1%) |
| $1,000 to $1,499 | 373 (11.8%) | 202 (13.6%) |
| $1,500 to $1,999 | 382 (12.0%) | 0 (0.0%) |
| $2,000 to $2,499 | 19 (0.6%) | 0 (0.0%) |
| $2,500 to $2,999 | 0 (0.0%) | 0 (0.0%) |
| $3,000 or more | 8 (0.3%) | 0 (0.0%) |
| Total | 3,172 (100.0%) | 1,486 (100.0%) |
Physical Housing Characteristics in Powell County
Housing Structures in Powell County
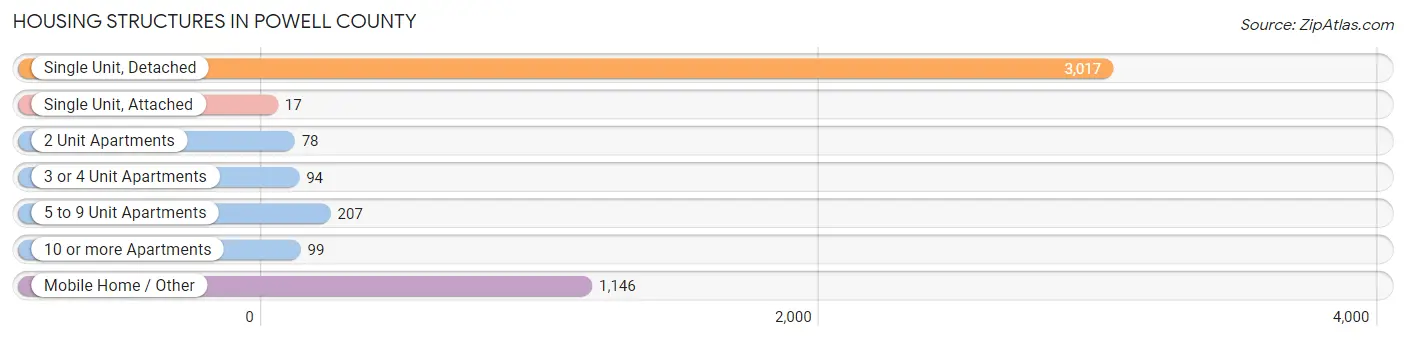
| Structure Type | # Housing Units | % Housing Units |
| Single Unit, Detached | 3,017 | 64.8% |
| Single Unit, Attached | 17 | 0.4% |
| 2 Unit Apartments | 78 | 1.7% |
| 3 or 4 Unit Apartments | 94 | 2.0% |
| 5 to 9 Unit Apartments | 207 | 4.4% |
| 10 or more Apartments | 99 | 2.1% |
| Mobile Home / Other | 1,146 | 24.6% |
| Total | 4,658 | 100.0% |
Housing Structures by Occupancy in Powell County
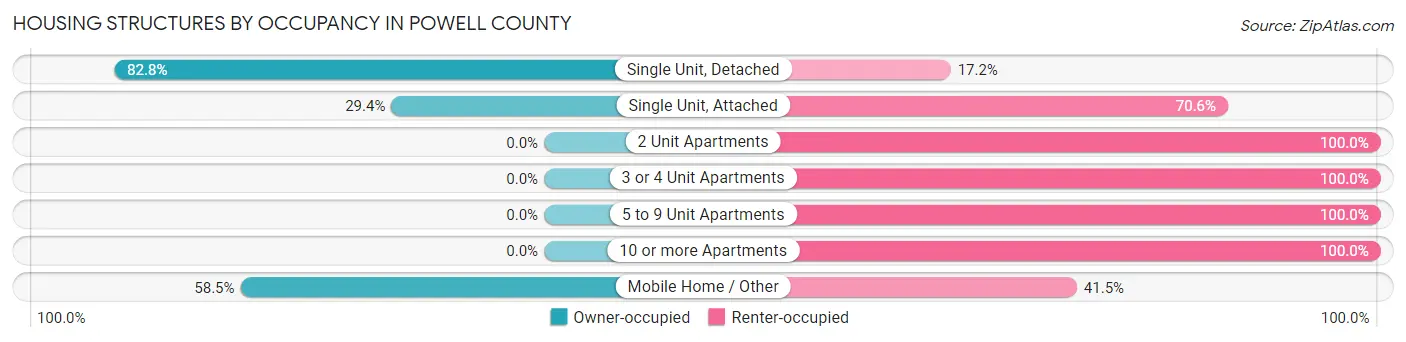
| Structure Type | Owner-occupied | Renter-occupied |
| Single Unit, Detached | 2,497 (82.8%) | 520 (17.2%) |
| Single Unit, Attached | 5 (29.4%) | 12 (70.6%) |
| 2 Unit Apartments | 0 (0.0%) | 78 (100.0%) |
| 3 or 4 Unit Apartments | 0 (0.0%) | 94 (100.0%) |
| 5 to 9 Unit Apartments | 0 (0.0%) | 207 (100.0%) |
| 10 or more Apartments | 0 (0.0%) | 99 (100.0%) |
| Mobile Home / Other | 670 (58.5%) | 476 (41.5%) |
| Total | 3,172 (68.1%) | 1,486 (31.9%) |
Housing Structures by Number of Rooms in Powell County
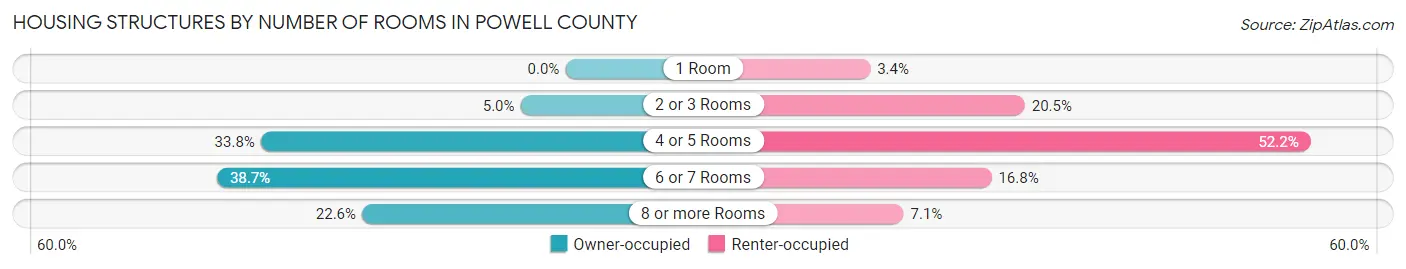
| Number of Rooms | Owner-occupied | Renter-occupied |
| 1 Room | 0 (0.0%) | 50 (3.4%) |
| 2 or 3 Rooms | 158 (5.0%) | 305 (20.5%) |
| 4 or 5 Rooms | 1,072 (33.8%) | 776 (52.2%) |
| 6 or 7 Rooms | 1,226 (38.7%) | 250 (16.8%) |
| 8 or more Rooms | 716 (22.6%) | 105 (7.1%) |
| Total | 3,172 (100.0%) | 1,486 (100.0%) |
Housing Structure by Heating Type in Powell County
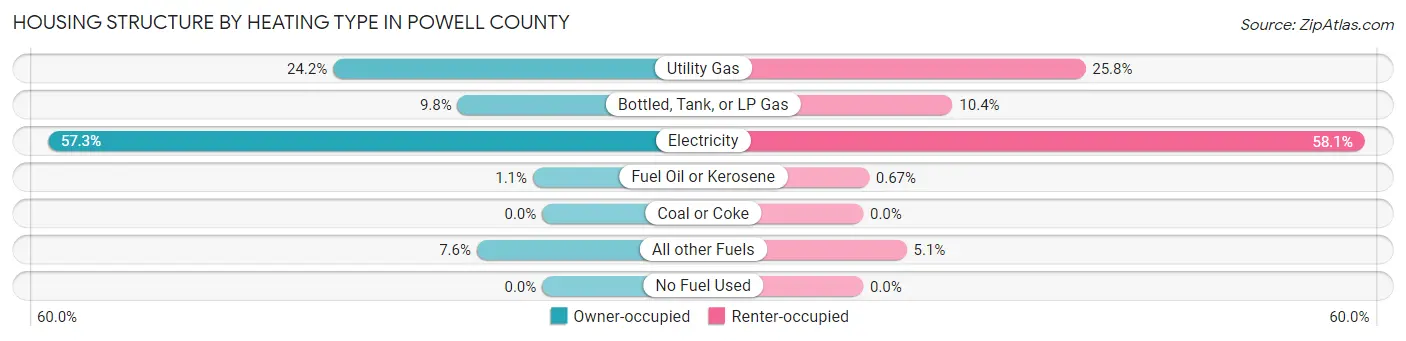
| Heating Type | Owner-occupied | Renter-occupied |
| Utility Gas | 769 (24.2%) | 383 (25.8%) |
| Bottled, Tank, or LP Gas | 311 (9.8%) | 154 (10.4%) |
| Electricity | 1,818 (57.3%) | 864 (58.1%) |
| Fuel Oil or Kerosene | 34 (1.1%) | 10 (0.7%) |
| Coal or Coke | 0 (0.0%) | 0 (0.0%) |
| All other Fuels | 240 (7.6%) | 75 (5.1%) |
| No Fuel Used | 0 (0.0%) | 0 (0.0%) |
| Total | 3,172 (100.0%) | 1,486 (100.0%) |
Household Vehicle Usage in Powell County
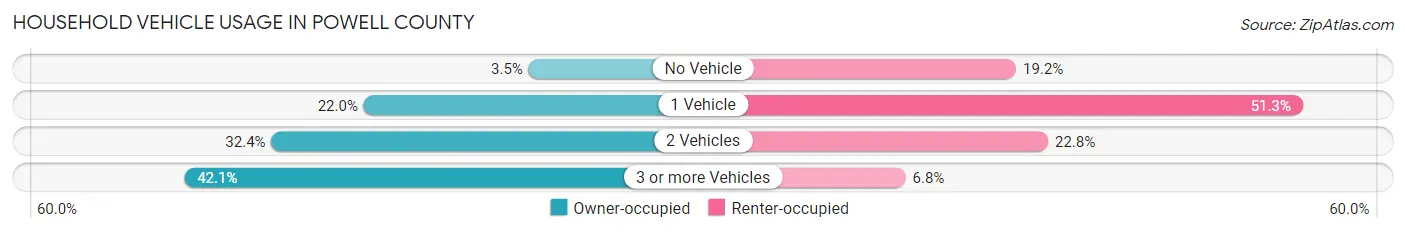
| Vehicles per Household | Owner-occupied | Renter-occupied |
| No Vehicle | 112 (3.5%) | 285 (19.2%) |
| 1 Vehicle | 698 (22.0%) | 762 (51.3%) |
| 2 Vehicles | 1,026 (32.4%) | 338 (22.8%) |
| 3 or more Vehicles | 1,336 (42.1%) | 101 (6.8%) |
| Total | 3,172 (100.0%) | 1,486 (100.0%) |
Real Estate & Mortgages in Powell County
Real Estate and Mortgage Overview in Powell County
| Characteristic | Without Mortgage | With Mortgage |
| Housing Units | 1,597 | 1,575 |
| Median Property Value | $110,800 | $133,400 |
| Median Household Income | $44,940 | $129 |
| Monthly Housing Costs | $333 | $8 |
| Real Estate Taxes | $622 | $34 |
Property Value by Mortgage Status in Powell County
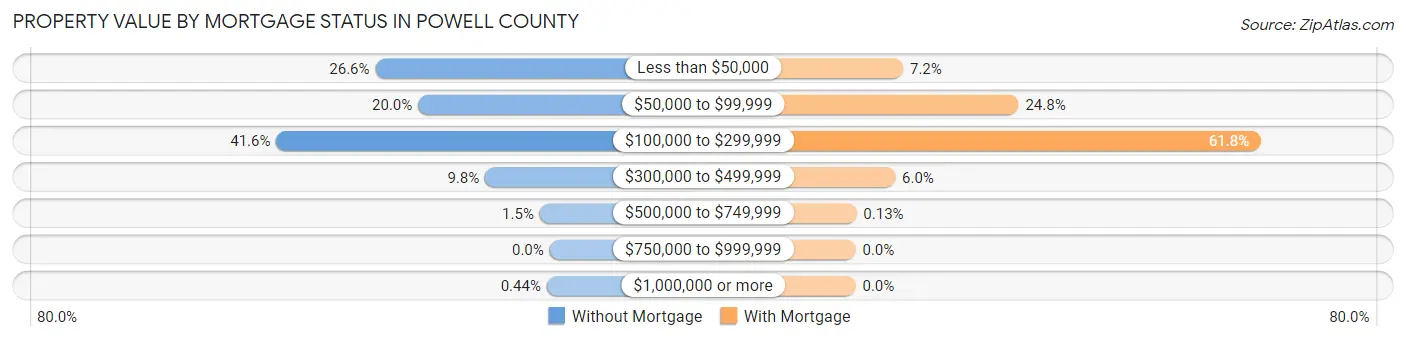
| Property Value | Without Mortgage | With Mortgage |
| Less than $50,000 | 424 (26.6%) | 114 (7.2%) |
| $50,000 to $99,999 | 320 (20.0%) | 391 (24.8%) |
| $100,000 to $299,999 | 665 (41.6%) | 973 (61.8%) |
| $300,000 to $499,999 | 157 (9.8%) | 95 (6.0%) |
| $500,000 to $749,999 | 24 (1.5%) | 2 (0.1%) |
| $750,000 to $999,999 | 0 (0.0%) | 0 (0.0%) |
| $1,000,000 or more | 7 (0.4%) | 0 (0.0%) |
| Total | 1,597 (100.0%) | 1,575 (100.0%) |
Household Income by Mortgage Status in Powell County
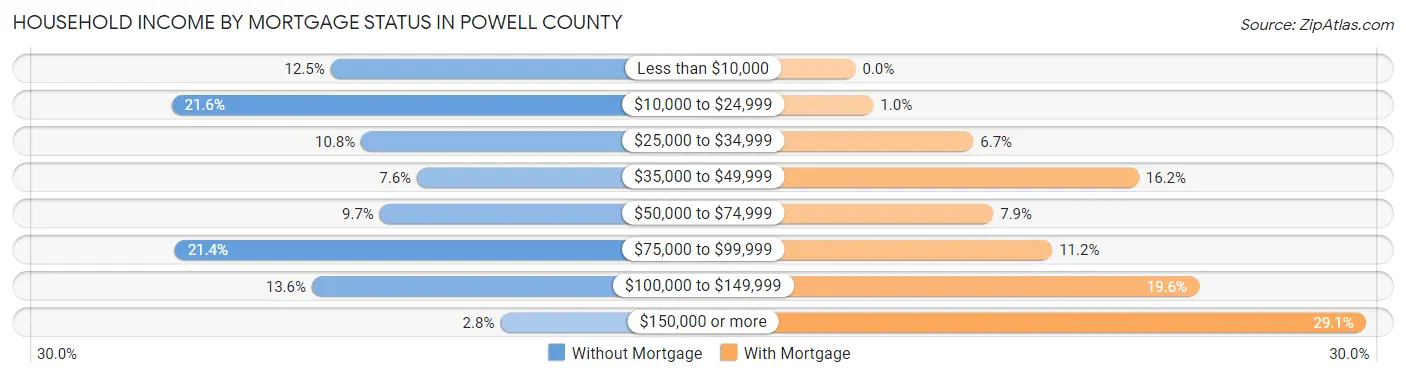
| Household Income | Without Mortgage | With Mortgage |
| Less than $10,000 | 200 (12.5%) | 0 (0.0%) |
| $10,000 to $24,999 | 345 (21.6%) | 16 (1.0%) |
| $25,000 to $34,999 | 172 (10.8%) | 106 (6.7%) |
| $35,000 to $49,999 | 121 (7.6%) | 255 (16.2%) |
| $50,000 to $74,999 | 155 (9.7%) | 124 (7.9%) |
| $75,000 to $99,999 | 342 (21.4%) | 177 (11.2%) |
| $100,000 to $149,999 | 217 (13.6%) | 309 (19.6%) |
| $150,000 or more | 45 (2.8%) | 459 (29.1%) |
| Total | 1,597 (100.0%) | 1,575 (100.0%) |
Property Value to Household Income Ratio in Powell County
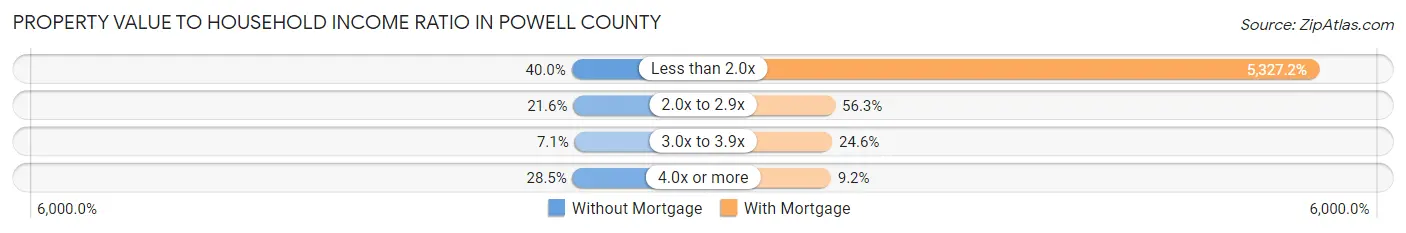
| Value-to-Income Ratio | Without Mortgage | With Mortgage |
| Less than 2.0x | 639 (40.0%) | 83,903 (5,327.2%) |
| 2.0x to 2.9x | 345 (21.6%) | 887 (56.3%) |
| 3.0x to 3.9x | 113 (7.1%) | 388 (24.6%) |
| 4.0x or more | 455 (28.5%) | 145 (9.2%) |
| Total | 1,597 (100.0%) | 1,575 (100.0%) |
Real Estate Taxes by Mortgage Status in Powell County
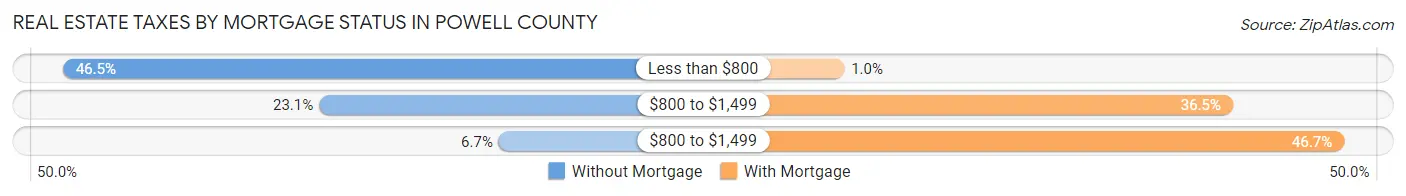
| Property Taxes | Without Mortgage | With Mortgage |
| Less than $800 | 743 (46.5%) | 16 (1.0%) |
| $800 to $1,499 | 369 (23.1%) | 575 (36.5%) |
| $800 to $1,499 | 107 (6.7%) | 735 (46.7%) |
| Total | 1,597 (100.0%) | 1,575 (100.0%) |
Health & Disability in Powell County
Health Insurance Coverage by Age in Powell County
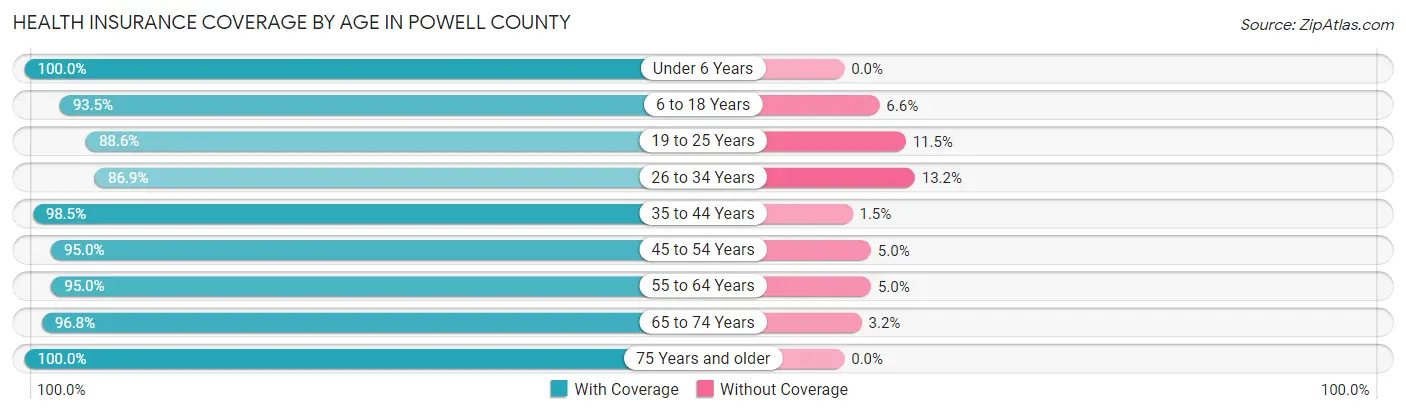
| Age Bracket | With Coverage | Without Coverage |
| Under 6 Years | 972 (100.0%) | 0 (0.0%) |
| 6 to 18 Years | 2,125 (93.4%) | 149 (6.6%) |
| 19 to 25 Years | 1,021 (88.5%) | 132 (11.5%) |
| 26 to 34 Years | 1,096 (86.9%) | 166 (13.2%) |
| 35 to 44 Years | 1,605 (98.5%) | 25 (1.5%) |
| 45 to 54 Years | 1,590 (95.0%) | 83 (5.0%) |
| 55 to 64 Years | 1,717 (95.0%) | 90 (5.0%) |
| 65 to 74 Years | 1,289 (96.8%) | 43 (3.2%) |
| 75 Years and older | 670 (100.0%) | 0 (0.0%) |
| Total | 12,085 (94.6%) | 688 (5.4%) |
Health Insurance Coverage by Citizenship Status in Powell County

| Citizenship Status | With Coverage | Without Coverage |
| Native Born | 972 (100.0%) | 0 (0.0%) |
| Foreign Born, Citizen | 2,125 (93.4%) | 149 (6.6%) |
| Foreign Born, not a Citizen | 1,021 (88.5%) | 132 (11.5%) |
Health Insurance Coverage by Household Income in Powell County
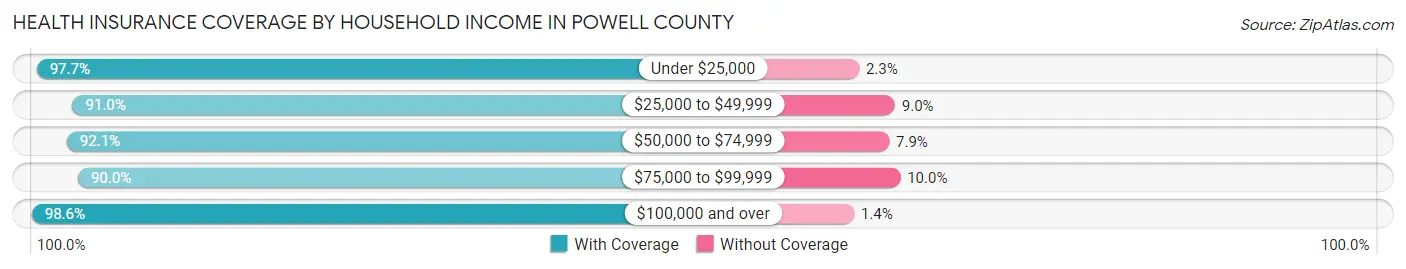
| Household Income | With Coverage | Without Coverage |
| Under $25,000 | 2,833 (97.7%) | 66 (2.3%) |
| $25,000 to $49,999 | 2,478 (91.0%) | 245 (9.0%) |
| $50,000 to $74,999 | 847 (92.1%) | 73 (7.9%) |
| $75,000 to $99,999 | 2,283 (90.0%) | 254 (10.0%) |
| $100,000 and over | 3,639 (98.6%) | 50 (1.4%) |
Public vs Private Health Insurance Coverage by Age in Powell County
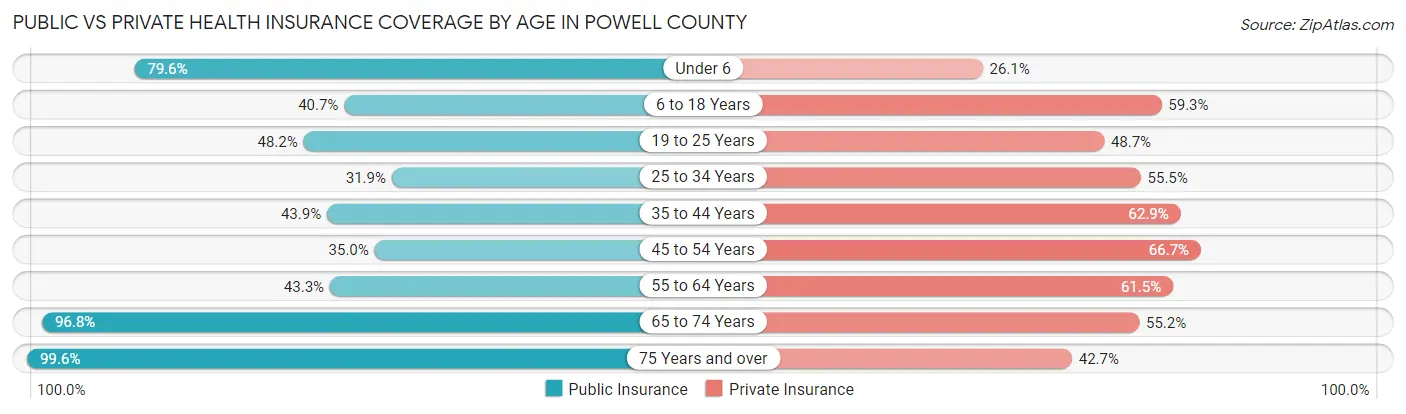
| Age Bracket | Public Insurance | Private Insurance |
| Under 6 | 774 (79.6%) | 254 (26.1%) |
| 6 to 18 Years | 925 (40.7%) | 1,349 (59.3%) |
| 19 to 25 Years | 556 (48.2%) | 561 (48.7%) |
| 25 to 34 Years | 402 (31.9%) | 700 (55.5%) |
| 35 to 44 Years | 715 (43.9%) | 1,025 (62.9%) |
| 45 to 54 Years | 586 (35.0%) | 1,115 (66.6%) |
| 55 to 64 Years | 783 (43.3%) | 1,111 (61.5%) |
| 65 to 74 Years | 1,289 (96.8%) | 735 (55.2%) |
| 75 Years and over | 667 (99.6%) | 286 (42.7%) |
| Total | 6,697 (52.4%) | 7,136 (55.9%) |
Disability Status by Sex by Age in Powell County
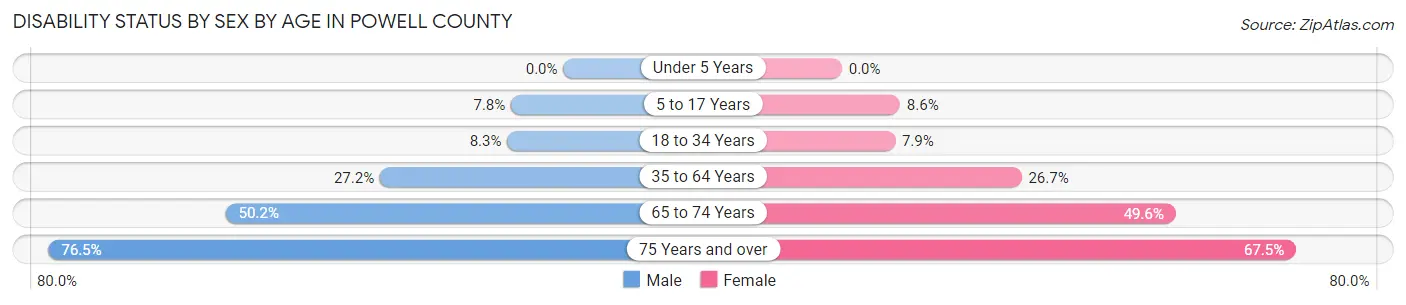
| Age Bracket | Male | Female |
| Under 5 Years | 0 (0.0%) | 0 (0.0%) |
| 5 to 17 Years | 93 (7.8%) | 98 (8.6%) |
| 18 to 34 Years | 104 (8.3%) | 99 (7.9%) |
| 35 to 64 Years | 723 (27.2%) | 655 (26.7%) |
| 65 to 74 Years | 313 (50.2%) | 351 (49.6%) |
| 75 Years and over | 221 (76.5%) | 257 (67.4%) |
Disability Class by Sex by Age in Powell County
Disability Class: Hearing Difficulty
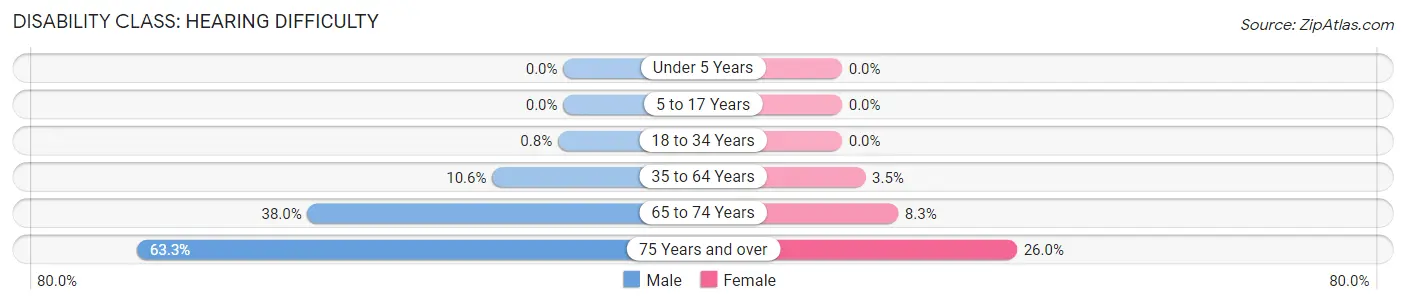
| Age Bracket | Male | Female |
| Under 5 Years | 0 (0.0%) | 0 (0.0%) |
| 5 to 17 Years | 0 (0.0%) | 0 (0.0%) |
| 18 to 34 Years | 10 (0.8%) | 0 (0.0%) |
| 35 to 64 Years | 280 (10.5%) | 85 (3.5%) |
| 65 to 74 Years | 237 (38.0%) | 59 (8.3%) |
| 75 Years and over | 183 (63.3%) | 99 (26.0%) |
Disability Class: Vision Difficulty
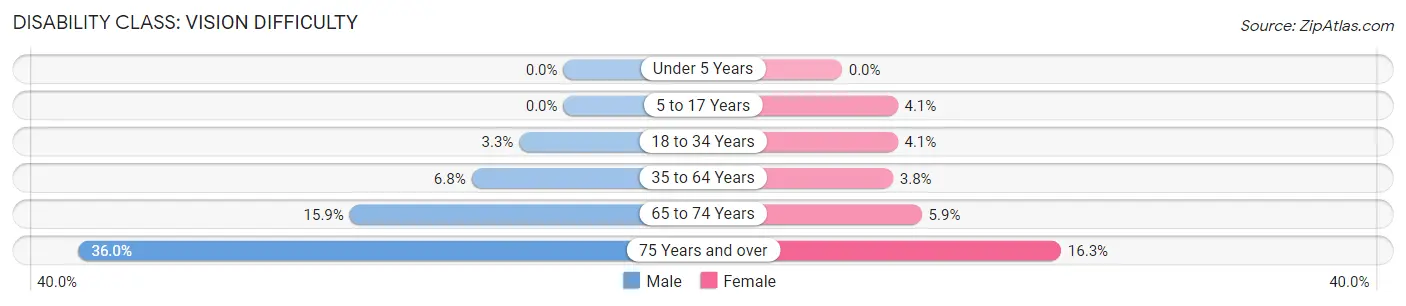
| Age Bracket | Male | Female |
| Under 5 Years | 0 (0.0%) | 0 (0.0%) |
| 5 to 17 Years | 0 (0.0%) | 47 (4.1%) |
| 18 to 34 Years | 41 (3.3%) | 52 (4.1%) |
| 35 to 64 Years | 181 (6.8%) | 93 (3.8%) |
| 65 to 74 Years | 99 (15.9%) | 42 (5.9%) |
| 75 Years and over | 104 (36.0%) | 62 (16.3%) |
Disability Class: Cognitive Difficulty
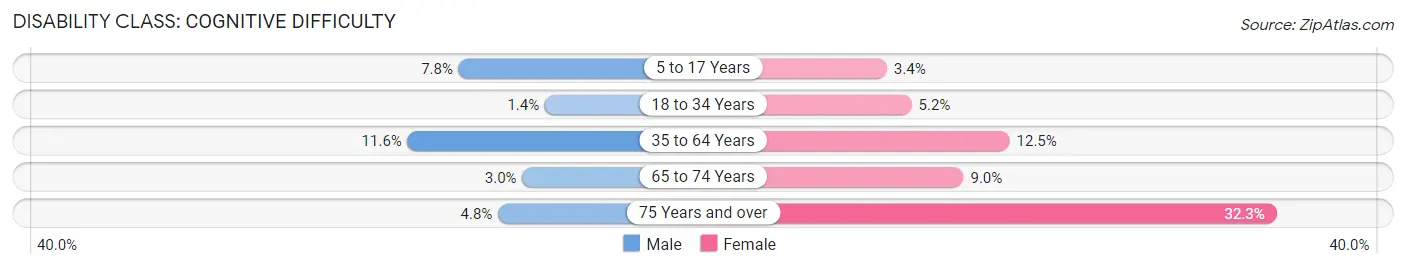
| Age Bracket | Male | Female |
| 5 to 17 Years | 93 (7.8%) | 38 (3.4%) |
| 18 to 34 Years | 17 (1.4%) | 65 (5.2%) |
| 35 to 64 Years | 307 (11.6%) | 306 (12.5%) |
| 65 to 74 Years | 19 (3.0%) | 64 (9.0%) |
| 75 Years and over | 14 (4.8%) | 123 (32.3%) |
Disability Class: Ambulatory Difficulty
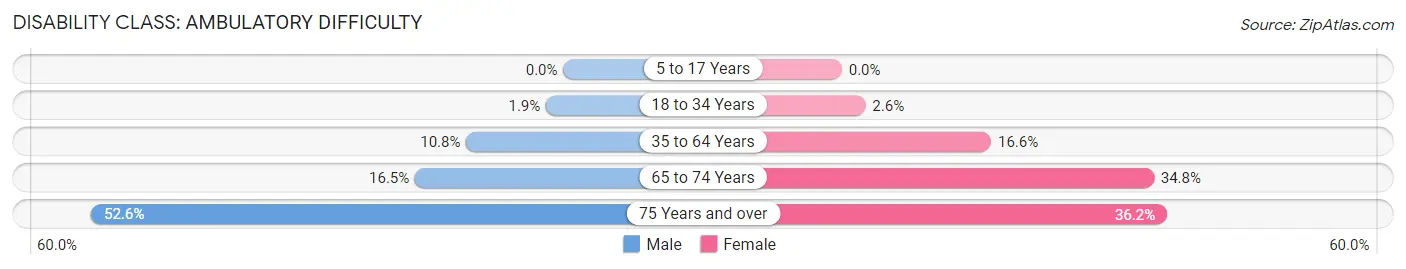
| Age Bracket | Male | Female |
| 5 to 17 Years | 0 (0.0%) | 0 (0.0%) |
| 18 to 34 Years | 24 (1.9%) | 33 (2.6%) |
| 35 to 64 Years | 287 (10.8%) | 408 (16.6%) |
| 65 to 74 Years | 103 (16.5%) | 246 (34.7%) |
| 75 Years and over | 152 (52.6%) | 138 (36.2%) |
Disability Class: Self-Care Difficulty
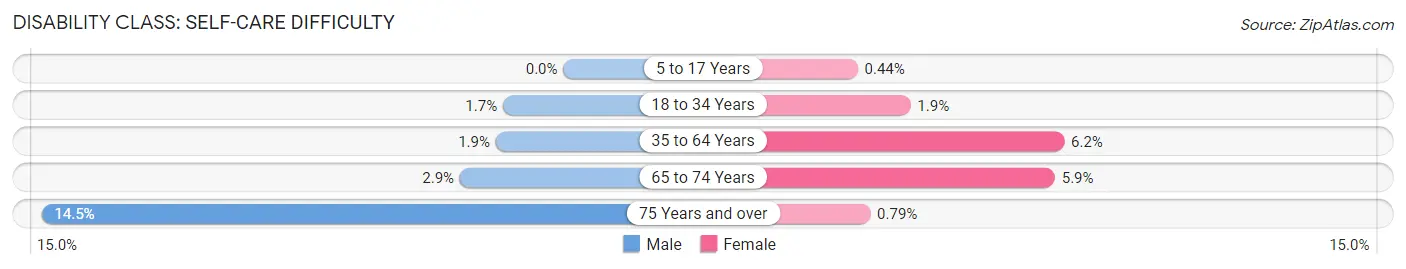
| Age Bracket | Male | Female |
| 5 to 17 Years | 0 (0.0%) | 5 (0.4%) |
| 18 to 34 Years | 21 (1.7%) | 24 (1.9%) |
| 35 to 64 Years | 50 (1.9%) | 152 (6.2%) |
| 65 to 74 Years | 18 (2.9%) | 42 (5.9%) |
| 75 Years and over | 42 (14.5%) | 3 (0.8%) |
Technology Access in Powell County
Computing Device Access in Powell County
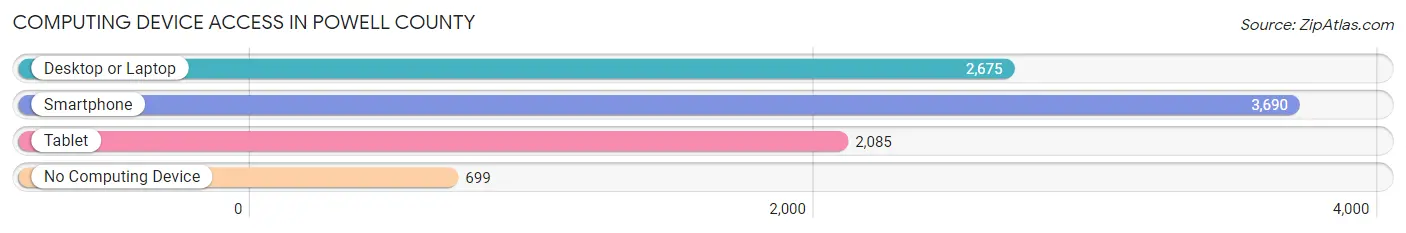
| Device Type | # Households | % Households |
| Desktop or Laptop | 2,675 | 57.4% |
| Smartphone | 3,690 | 79.2% |
| Tablet | 2,085 | 44.8% |
| No Computing Device | 699 | 15.0% |
| Total | 4,658 | 100.0% |
Internet Access in Powell County
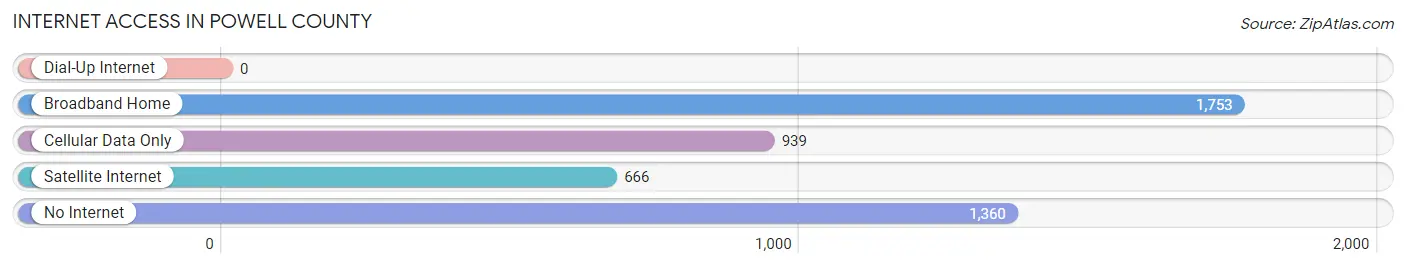
| Internet Type | # Households | % Households |
| Dial-Up Internet | 0 | 0.0% |
| Broadband Home | 1,753 | 37.6% |
| Cellular Data Only | 939 | 20.2% |
| Satellite Internet | 666 | 14.3% |
| No Internet | 1,360 | 29.2% |
| Total | 4,658 | 100.0% |
Powell County Summary
Powell County is a county located in the eastern part of the U.S. state of Kentucky. As of the 2010 census, the population was 12,613. Its county seat is Stanton. The county was formed in 1852 from parts of Clark, Estill, and Montgomery counties and named for Kentucky politician and soldier, Lazarus W. Powell.
Geography
Powell County is located in the Eastern Coal Field region of Kentucky. The county is located in the foothills of the Appalachian Mountains and is bordered by Clark, Estill, Montgomery, Menifee, Wolfe, and Lee counties. The county has a total area of 437 square miles, of which 435 square miles is land and 2.2 square miles (0.5%) is water.
The county is drained by the North Fork of the Kentucky River and its tributaries. The highest point in the county is located on the northern border with Clark County, where the elevation reaches 1,890 feet above sea level.
Demographics
As of the 2010 census, there were 12,613 people, 5,072 households, and 3,541 families residing in the county. The population density was 29 people per square mile. There were 5,845 housing units at an average density of 13 per square mile. The racial makeup of the county was 97.7% White, 0.7% Black or African American, 0.2% Native American, 0.2% Asian, 0.2% from other races, and 0.9% from two or more races. 1.2% of the population were Hispanic or Latino of any race.
There were 5,072 households, out of which 28.7% had children under the age of 18 living with them, 54.2% were married couples living together, 11.2% had a female householder with no husband present, and 30.2% were non-families. 26.7% of all households were made up of individuals, and 11.7% had someone living alone who was 65 years of age or older. The average household size was 2.44 and the average family size was 2.94.
In the county, the population was spread out, with 23.2% under the age of 18, 8.2% from 18 to 24, 28.2% from 25 to 44, 25.2% from 45 to 64, and 15.2% who were 65 years of age or older. The median age was 38 years. For every 100 females there were 95.2 males. For every 100 females age 18 and over, there were 92.2 males.
The median income for a household in the county was $25,945, and the median income for a family was $31,945. Males had a median income of $30,945 versus $20,945 for females. The per capita income for the county was $14,945. About 17.2% of families and 20.2% of the population were below the poverty line, including 28.2% of those under age 18 and 17.2% of those age 65 or over.
Economy
The economy of Powell County is largely based on agriculture and forestry. The county is home to several large farms, as well as a number of smaller family farms. The county is also home to several timber companies, which harvest and process timber for use in construction and other industries.
The county is also home to several small businesses, including restaurants, retail stores, and service providers. The county is also home to a number of manufacturing companies, including a furniture manufacturer, a plastics manufacturer, and a metal fabrication company.
The county is also home to a number of tourist attractions, including the Red River Gorge Geological Area, Natural Bridge State Park, and the Kentucky Horse Park. These attractions bring in a significant amount of tourism revenue to the county.
Conclusion
Powell County is a rural county located in the eastern part of Kentucky. The county is home to a number of farms, timber companies, and small businesses. The county is also home to several tourist attractions, which bring in a significant amount of tourism revenue. The county has a population of 12,613, with a median household income of $25,945. The county is largely agricultural and forestry based, but also has a number of manufacturing companies.
Common Questions
What is Per Capita Income in Powell County?
Per Capita income in Powell County is $23,336.
What is the Median Family Income in Powell County?
Median Family Income in Powell County is $67,610.
What is the Median Household income in Powell County?
Median Household Income in Powell County is $38,415.
What is Income or Wage Gap in Powell County?
Income or Wage Gap in Powell County is 36.1%.
Women in Powell County earn 63.9 cents for every dollar earned by a man.
What is Family Income Deficit in Powell County?
Family Income Deficit in Powell County is $12,620.
Families that are below poverty line in Powell County earn $12,620 less on average than the poverty threshold level.
What is Inequality or Gini Index in Powell County?
Inequality or Gini Index in Powell County is 0.48.
What is the Total Population of Powell County?
Total Population of Powell County is 13,089.
What is the Total Male Population of Powell County?
Total Male Population of Powell County is 6,658.
What is the Total Female Population of Powell County?
Total Female Population of Powell County is 6,431.
What is the Ratio of Males per 100 Females in Powell County?
There are 103.53 Males per 100 Females in Powell County.
What is the Ratio of Females per 100 Males in Powell County?
There are 96.59 Females per 100 Males in Powell County.
What is the Median Population Age in Powell County?
Median Population Age in Powell County is 39.5 Years.
What is the Average Family Size in Powell County
Average Family Size in Powell County is 3.4 People.
What is the Average Household Size in Powell County
Average Household Size in Powell County is 2.7 People.
How Large is the Labor Force in Powell County?
There are 5,196 People in the Labor Forcein in Powell County.
What is the Percentage of People in the Labor Force in Powell County?
51.1% of People are in the Labor Force in Powell County.
What is the Unemployment Rate in Powell County?
Unemployment Rate in Powell County is 7.1%.