Pendleton County, KY Map & Demographics
Pendleton County Map
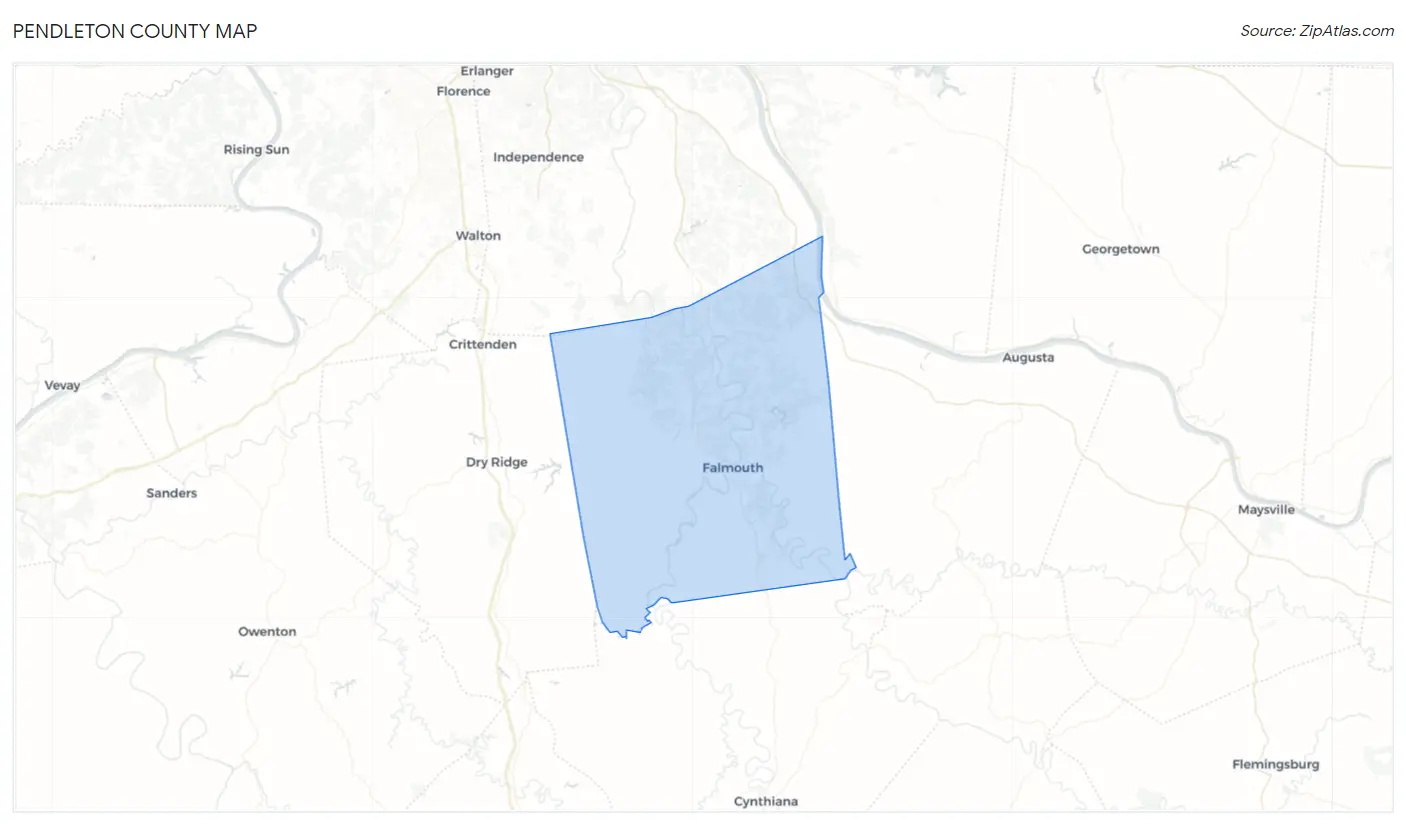
Pendleton County Overview
$28,919
PER CAPITA INCOME
$75,687
AVG FAMILY INCOME
$58,723
AVG HOUSEHOLD INCOME
29.2%
WAGE / INCOME GAP [ % ]
70.8¢/ $1
WAGE / INCOME GAP [ $ ]
0.46
INEQUALITY / GINI INDEX
14,638
TOTAL POPULATION
7,588
MALE POPULATION
7,050
FEMALE POPULATION
107.63
MALES / 100 FEMALES
92.91
FEMALES / 100 MALES
41.7
MEDIAN AGE
3.2
AVG FAMILY SIZE
2.7
AVG HOUSEHOLD SIZE
7,036
LABOR FORCE [ PEOPLE ]
60.4%
PERCENT IN LABOR FORCE
5.0%
UNEMPLOYMENT RATE
Pendleton County Area Codes
Income in Pendleton County
Income Overview in Pendleton County
Per Capita Income in Pendleton County is $28,919, while median incomes of families and households are $75,687 and $58,723 respectively.
| Characteristic | Number | Measure |
| Per Capita Income | 14,638 | $28,919 |
| Median Family Income | 3,653 | $75,687 |
| Mean Family Income | 3,653 | $87,585 |
| Median Household Income | 5,270 | $58,723 |
| Mean Household Income | 5,270 | $74,375 |
| Income Deficit | 3,653 | $0 |
| Wage / Income Gap (%) | 14,638 | 29.25% |
| Wage / Income Gap ($) | 14,638 | 70.75¢ per $1 |
| Gini / Inequality Index | 14,638 | 0.46 |
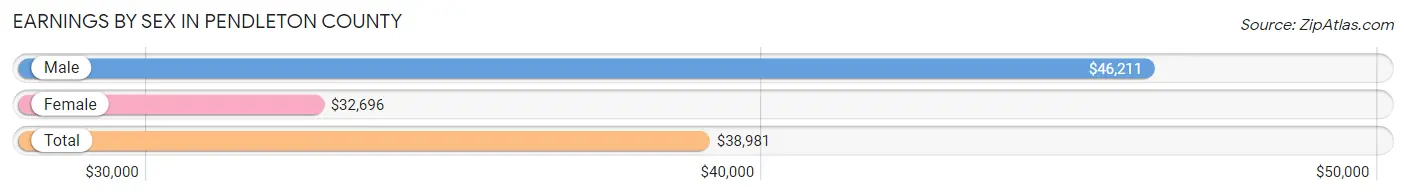
Earnings by Sex in Pendleton County
Average Earnings in Pendleton County are $38,981, $46,211 for men and $32,696 for women, a difference of 29.2%.
| Sex | Number | Average Earnings |
| Male | 3,879 (53.7%) | $46,211 |
| Female | 3,338 (46.3%) | $32,696 |
| Total | 7,217 (100.0%) | $38,981 |
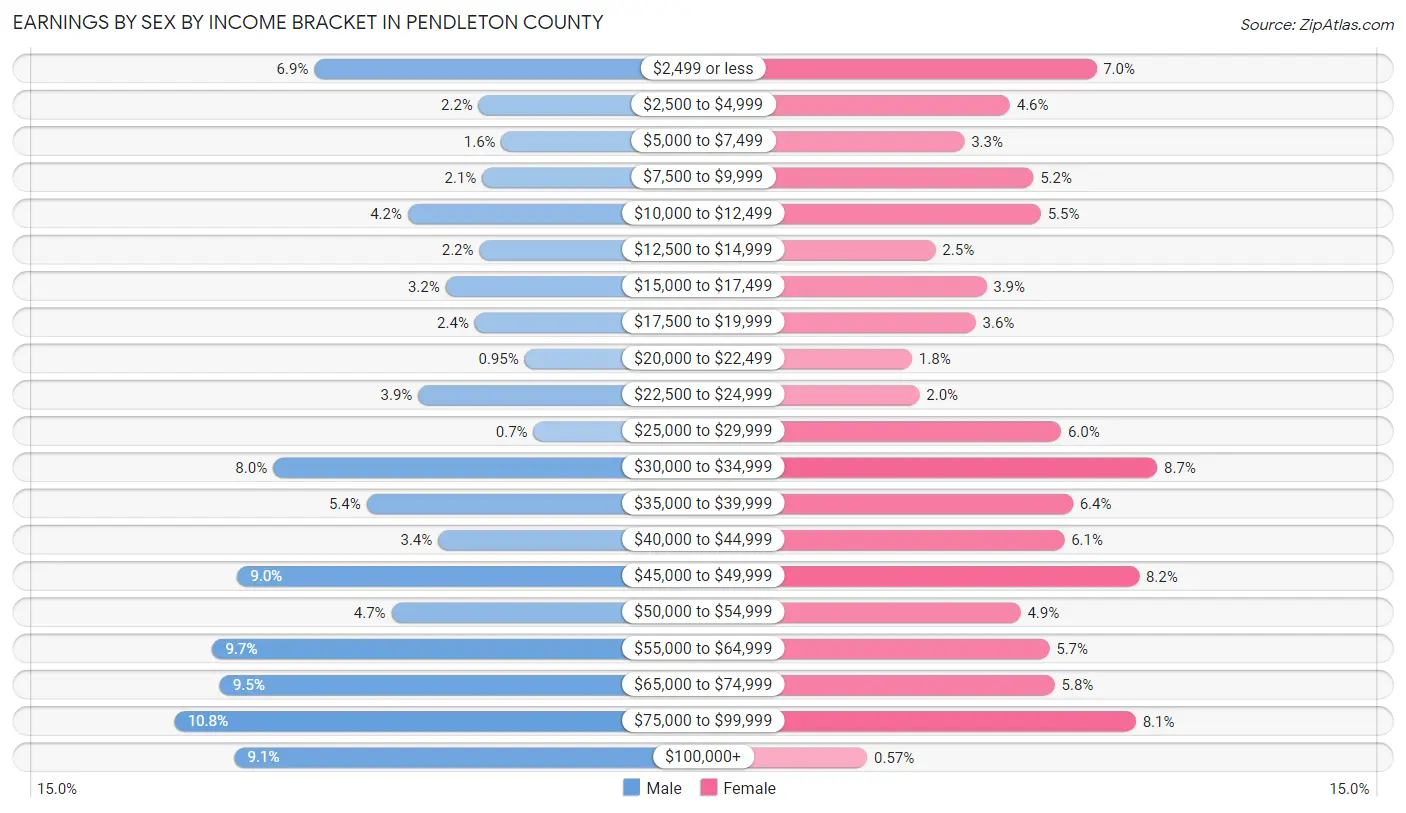
Earnings by Sex by Income Bracket in Pendleton County
The most common earnings brackets in Pendleton County are $75,000 to $99,999 for men (418 | 10.8%) and $30,000 to $34,999 for women (291 | 8.7%).
| Income | Male | Female |
| $2,499 or less | 266 (6.9%) | 234 (7.0%) |
| $2,500 to $4,999 | 87 (2.2%) | 153 (4.6%) |
| $5,000 to $7,499 | 62 (1.6%) | 110 (3.3%) |
| $7,500 to $9,999 | 83 (2.1%) | 175 (5.2%) |
| $10,000 to $12,499 | 164 (4.2%) | 182 (5.4%) |
| $12,500 to $14,999 | 86 (2.2%) | 83 (2.5%) |
| $15,000 to $17,499 | 123 (3.2%) | 131 (3.9%) |
| $17,500 to $19,999 | 91 (2.4%) | 121 (3.6%) |
| $20,000 to $22,499 | 37 (0.9%) | 61 (1.8%) |
| $22,500 to $24,999 | 153 (3.9%) | 68 (2.0%) |
| $25,000 to $29,999 | 27 (0.7%) | 201 (6.0%) |
| $30,000 to $34,999 | 311 (8.0%) | 291 (8.7%) |
| $35,000 to $39,999 | 209 (5.4%) | 212 (6.4%) |
| $40,000 to $44,999 | 131 (3.4%) | 204 (6.1%) |
| $45,000 to $49,999 | 350 (9.0%) | 274 (8.2%) |
| $50,000 to $54,999 | 182 (4.7%) | 163 (4.9%) |
| $55,000 to $64,999 | 377 (9.7%) | 190 (5.7%) |
| $65,000 to $74,999 | 369 (9.5%) | 195 (5.8%) |
| $75,000 to $99,999 | 418 (10.8%) | 271 (8.1%) |
| $100,000+ | 353 (9.1%) | 19 (0.6%) |
| Total | 3,879 (100.0%) | 3,338 (100.0%) |
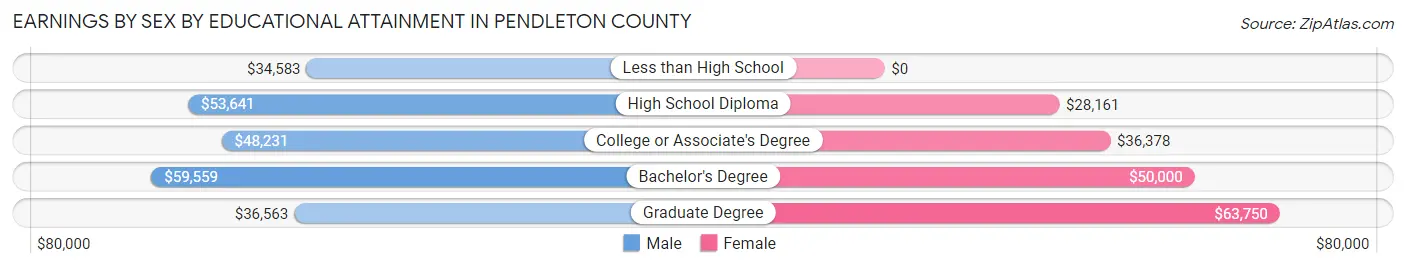
Earnings by Sex by Educational Attainment in Pendleton County
Average earnings in Pendleton County are $49,940 for men and $38,019 for women, a difference of 23.9%. Men with an educational attainment of bachelor's degree enjoy the highest average annual earnings of $59,559, while those with less than high school education earn the least with $34,583. Women with an educational attainment of graduate degree earn the most with the average annual earnings of $63,750, while those with high school diploma education have the smallest earnings of $28,161.
| Educational Attainment | Male Income | Female Income |
| Less than High School | $34,583 | $0 |
| High School Diploma | $53,641 | $28,161 |
| College or Associate's Degree | $48,231 | $36,378 |
| Bachelor's Degree | $59,559 | $50,000 |
| Graduate Degree | $36,563 | $63,750 |
| Total | $49,940 | $38,019 |
Family Income in Pendleton County
Family Income Brackets in Pendleton County
According to the Pendleton County family income data, there are 935 families falling into the $100,000 to $149,999 income range, which is the most common income bracket and makes up 25.6% of all families. Conversely, the $200,000+ income bracket is the least frequent group with only 106 families (2.9%) belonging to this category.
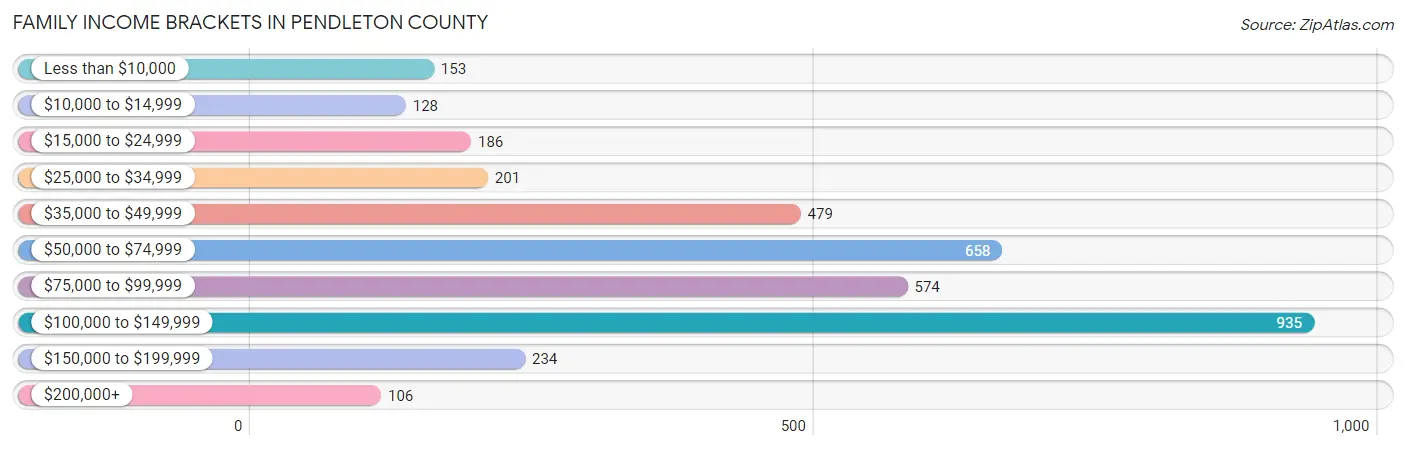
| Income Bracket | # Families | % Families |
| Less than $10,000 | 153 | 4.2% |
| $10,000 to $14,999 | 128 | 3.5% |
| $15,000 to $24,999 | 186 | 5.1% |
| $25,000 to $34,999 | 201 | 5.5% |
| $35,000 to $49,999 | 479 | 13.1% |
| $50,000 to $74,999 | 658 | 18.0% |
| $75,000 to $99,999 | 574 | 15.7% |
| $100,000 to $149,999 | 935 | 25.6% |
| $150,000 to $199,999 | 234 | 6.4% |
| $200,000+ | 106 | 2.9% |
Family Income by Famaliy Size in Pendleton County
7+ person families (156 | 4.3%) account for the highest median family income in Pendleton County with $129,481 per family, while 2-person families (1,778 | 48.7%) have the highest median income of $33,402 per family member.
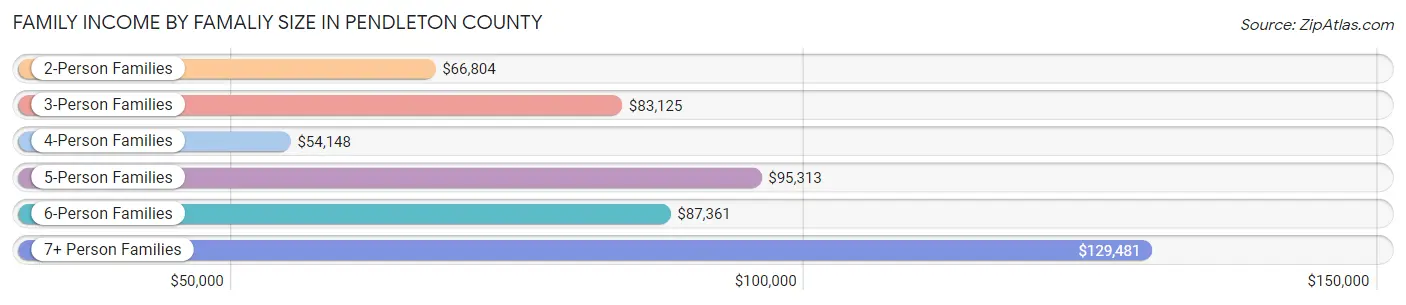
| Income Bracket | # Families | Median Income |
| 2-Person Families | 1,778 (48.7%) | $66,804 |
| 3-Person Families | 810 (22.2%) | $83,125 |
| 4-Person Families | 635 (17.4%) | $54,148 |
| 5-Person Families | 194 (5.3%) | $95,313 |
| 6-Person Families | 80 (2.2%) | $87,361 |
| 7+ Person Families | 156 (4.3%) | $129,481 |
| Total | 3,653 (100.0%) | $75,687 |
Family Income by Number of Earners in Pendleton County
The median family income in Pendleton County is $75,687, with families comprising 3+ earners (424) having the highest median family income of $116,964, while families with no earners (709) have the lowest median family income of $36,179, accounting for 11.6% and 19.4% of families, respectively.
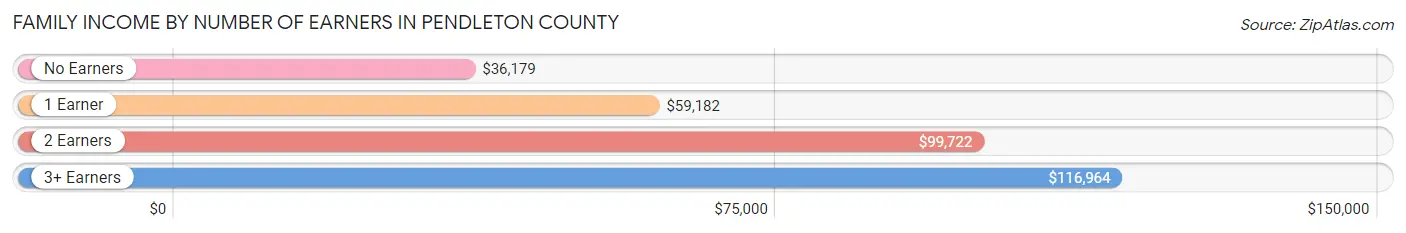
| Number of Earners | # Families | Median Income |
| No Earners | 709 (19.4%) | $36,179 |
| 1 Earner | 1,132 (31.0%) | $59,182 |
| 2 Earners | 1,388 (38.0%) | $99,722 |
| 3+ Earners | 424 (11.6%) | $116,964 |
| Total | 3,653 (100.0%) | $75,687 |
Household Income in Pendleton County
Household Income Brackets in Pendleton County
With 991 households falling in the category, the $100,000 to $149,999 income range is the most frequent in Pendleton County, accounting for 18.8% of all households. In contrast, only 148 households (2.8%) fall into the $200,000+ income bracket, making it the least populous group.
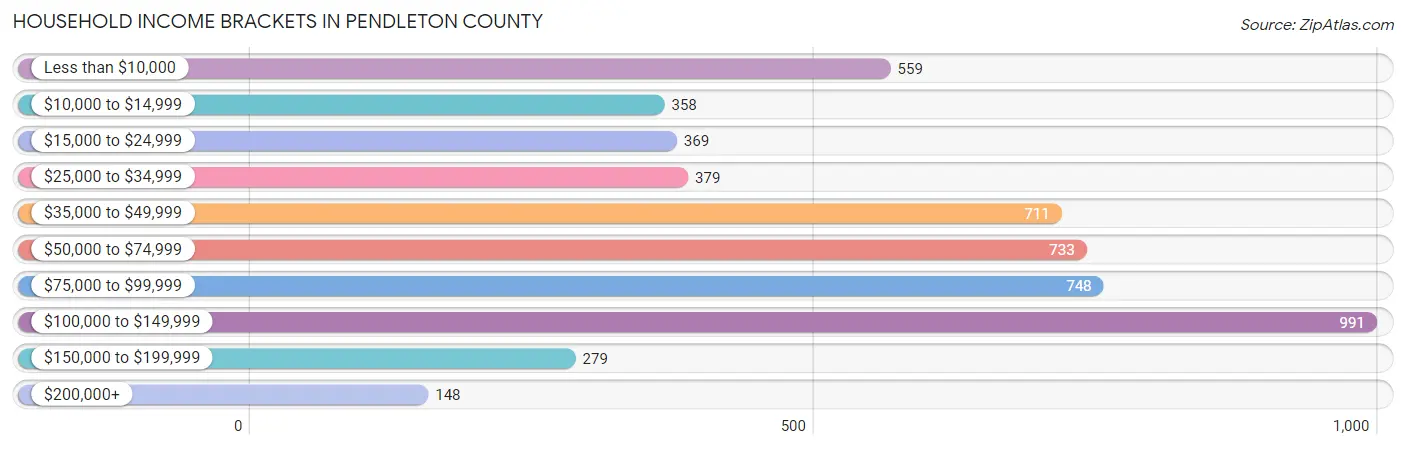
| Income Bracket | # Households | % Households |
| Less than $10,000 | 559 | 10.6% |
| $10,000 to $14,999 | 358 | 6.8% |
| $15,000 to $24,999 | 369 | 7.0% |
| $25,000 to $34,999 | 379 | 7.2% |
| $35,000 to $49,999 | 711 | 13.5% |
| $50,000 to $74,999 | 733 | 13.9% |
| $75,000 to $99,999 | 748 | 14.2% |
| $100,000 to $149,999 | 991 | 18.8% |
| $150,000 to $199,999 | 279 | 5.3% |
| $200,000+ | 148 | 2.8% |
Household Income by Householder Age in Pendleton County
The median household income in Pendleton County is $58,723, with the highest median household income of $71,919 found in the 25 to 44 years age bracket for the primary householder. A total of 1,468 households (27.9%) fall into this category. Meanwhile, the 65+ years age bracket for the primary householder has the lowest median household income of $36,467, with 1,561 households (29.6%) in this group.
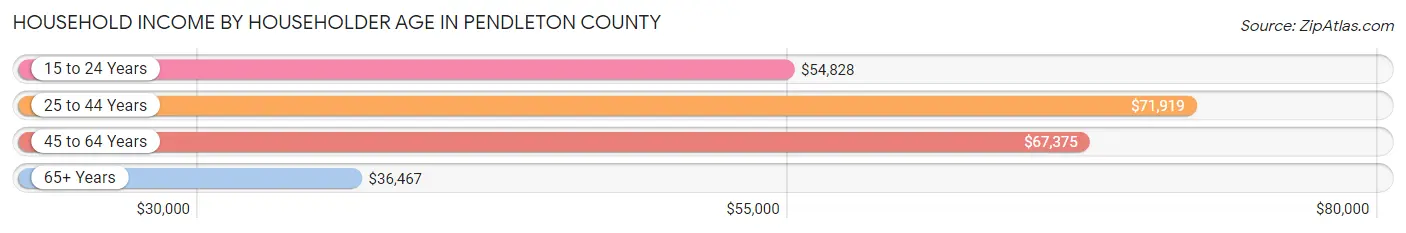
| Income Bracket | # Households | Median Income |
| 15 to 24 Years | 86 (1.6%) | $54,828 |
| 25 to 44 Years | 1,468 (27.9%) | $71,919 |
| 45 to 64 Years | 2,155 (40.9%) | $67,375 |
| 65+ Years | 1,561 (29.6%) | $36,467 |
| Total | 5,270 (100.0%) | $58,723 |
Poverty in Pendleton County
Income Below Poverty by Sex and Age in Pendleton County
With 16.1% poverty level for males and 19.7% for females among the residents of Pendleton County, 5 year old males and 18 to 24 year old females are the most vulnerable to poverty, with 29 males (54.7%) and 178 females (34.7%) in their respective age groups living below the poverty level.
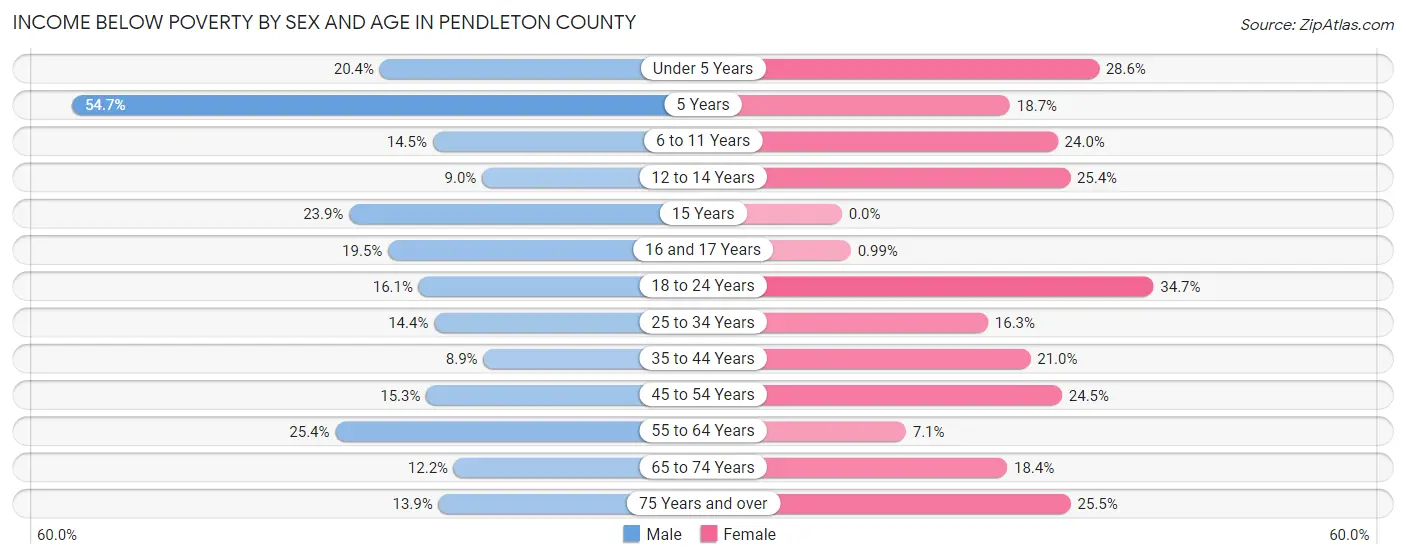
| Age Bracket | Male | Female |
| Under 5 Years | 75 (20.4%) | 101 (28.6%) |
| 5 Years | 29 (54.7%) | 38 (18.7%) |
| 6 to 11 Years | 57 (14.5%) | 69 (24.0%) |
| 12 to 14 Years | 50 (9.0%) | 93 (25.4%) |
| 15 Years | 31 (23.8%) | 0 (0.0%) |
| 16 and 17 Years | 48 (19.5%) | 2 (1.0%) |
| 18 to 24 Years | 104 (16.1%) | 178 (34.7%) |
| 25 to 34 Years | 128 (14.4%) | 135 (16.3%) |
| 35 to 44 Years | 74 (8.9%) | 166 (21.0%) |
| 45 to 54 Years | 159 (15.3%) | 237 (24.5%) |
| 55 to 64 Years | 296 (25.4%) | 76 (7.1%) |
| 65 to 74 Years | 94 (12.2%) | 140 (18.4%) |
| 75 Years and over | 51 (13.9%) | 119 (25.5%) |
| Total | 1,196 (16.1%) | 1,354 (19.7%) |
Income Above Poverty by Sex and Age in Pendleton County
According to the poverty statistics in Pendleton County, males aged 35 to 44 years and females aged 15 years are the age groups that are most secure financially, with 91.1% of males and 100.0% of females in these age groups living above the poverty line.
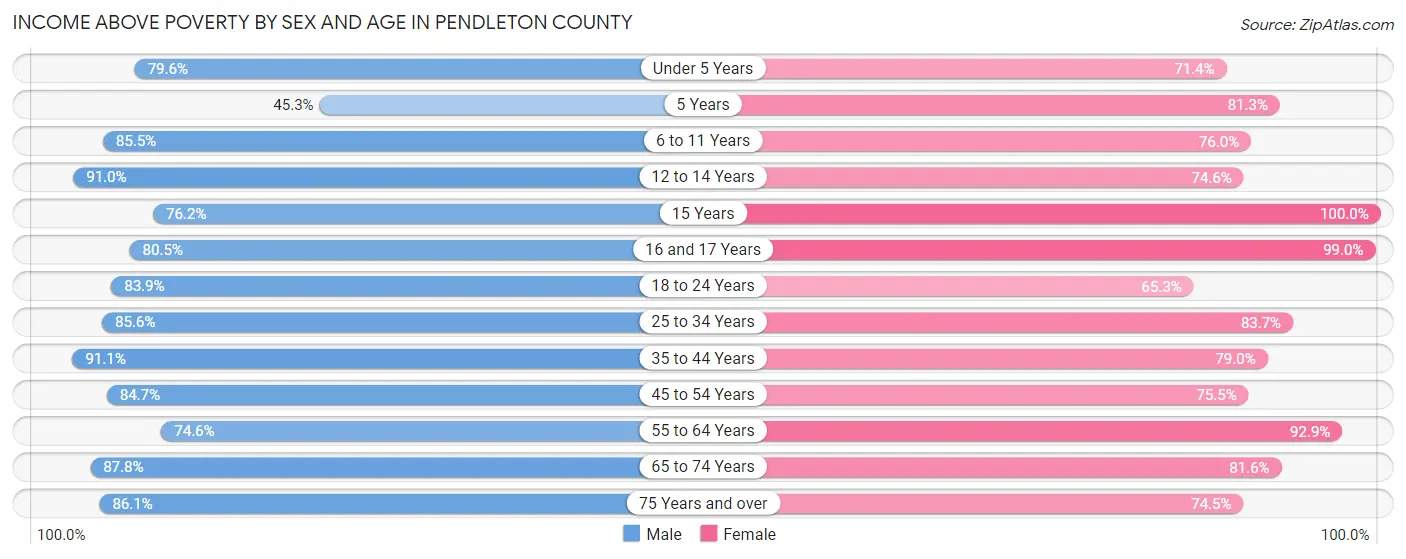
| Age Bracket | Male | Female |
| Under 5 Years | 292 (79.6%) | 252 (71.4%) |
| 5 Years | 24 (45.3%) | 165 (81.3%) |
| 6 to 11 Years | 335 (85.5%) | 218 (76.0%) |
| 12 to 14 Years | 503 (91.0%) | 273 (74.6%) |
| 15 Years | 99 (76.1%) | 75 (100.0%) |
| 16 and 17 Years | 198 (80.5%) | 201 (99.0%) |
| 18 to 24 Years | 542 (83.9%) | 335 (65.3%) |
| 25 to 34 Years | 762 (85.6%) | 695 (83.7%) |
| 35 to 44 Years | 757 (91.1%) | 625 (79.0%) |
| 45 to 54 Years | 883 (84.7%) | 730 (75.5%) |
| 55 to 64 Years | 870 (74.6%) | 990 (92.9%) |
| 65 to 74 Years | 677 (87.8%) | 621 (81.6%) |
| 75 Years and over | 316 (86.1%) | 348 (74.5%) |
| Total | 6,258 (84.0%) | 5,528 (80.3%) |
Income Below Poverty Among Married-Couple Families in Pendleton County
The poverty statistics for married-couple families in Pendleton County show that 6.2% or 163 of the total 2,635 families live below the poverty line. Families with 3 or 4 children have the highest poverty rate of 14.8%, comprising of 30 families. On the other hand, families with 5 or more children have the lowest poverty rate of 0.0%, which includes 0 families.
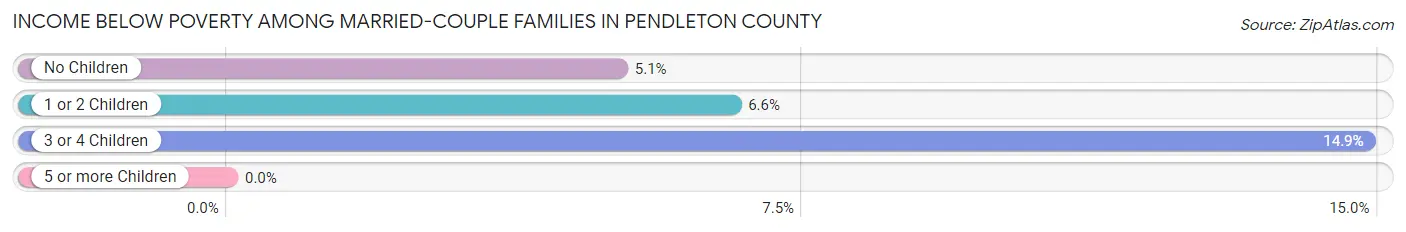
| Children | Above Poverty | Below Poverty |
| No Children | 1,437 (94.9%) | 77 (5.1%) |
| 1 or 2 Children | 796 (93.4%) | 56 (6.6%) |
| 3 or 4 Children | 172 (85.2%) | 30 (14.8%) |
| 5 or more Children | 67 (100.0%) | 0 (0.0%) |
| Total | 2,472 (93.8%) | 163 (6.2%) |
Income Below Poverty Among Single-Parent Households in Pendleton County
According to the poverty data in Pendleton County, 5.3% or 22 single-father households and 39.5% or 239 single-mother households are living below the poverty line. Among single-father households, those with no children have the highest poverty rate, with 11 households (9.0%) experiencing poverty. Likewise, among single-mother households, those with 5 or more children have the highest poverty rate, with 15 households (100.0%) falling below the poverty line.
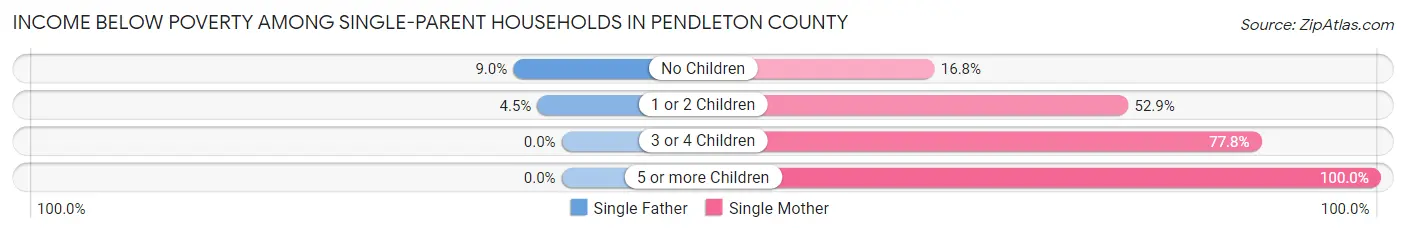
| Children | Single Father | Single Mother |
| No Children | 11 (9.0%) | 42 (16.8%) |
| 1 or 2 Children | 11 (4.5%) | 175 (52.9%) |
| 3 or 4 Children | 0 (0.0%) | 7 (77.8%) |
| 5 or more Children | 0 (0.0%) | 15 (100.0%) |
| Total | 22 (5.3%) | 239 (39.5%) |
Income Below Poverty Among Married-Couple vs Single-Parent Households in Pendleton County
The poverty data for Pendleton County shows that 163 of the married-couple family households (6.2%) and 261 of the single-parent households (25.6%) are living below the poverty level. Within the married-couple family households, those with 3 or 4 children have the highest poverty rate, with 30 households (14.8%) falling below the poverty line. Among the single-parent households, those with 5 or more children have the highest poverty rate, with 15 household (100.0%) living below poverty.
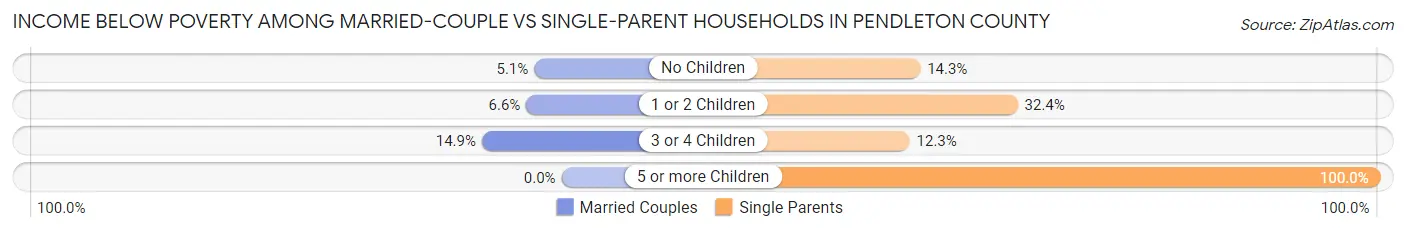
| Children | Married-Couple Families | Single-Parent Households |
| No Children | 77 (5.1%) | 53 (14.2%) |
| 1 or 2 Children | 56 (6.6%) | 186 (32.4%) |
| 3 or 4 Children | 30 (14.8%) | 7 (12.3%) |
| 5 or more Children | 0 (0.0%) | 15 (100.0%) |
| Total | 163 (6.2%) | 261 (25.6%) |
Race in Pendleton County
The most populous races in Pendleton County are White / Caucasian (13,798 | 94.3%), Two or more Races (584 | 4.0%), and Hispanic or Latino (211 | 1.4%).
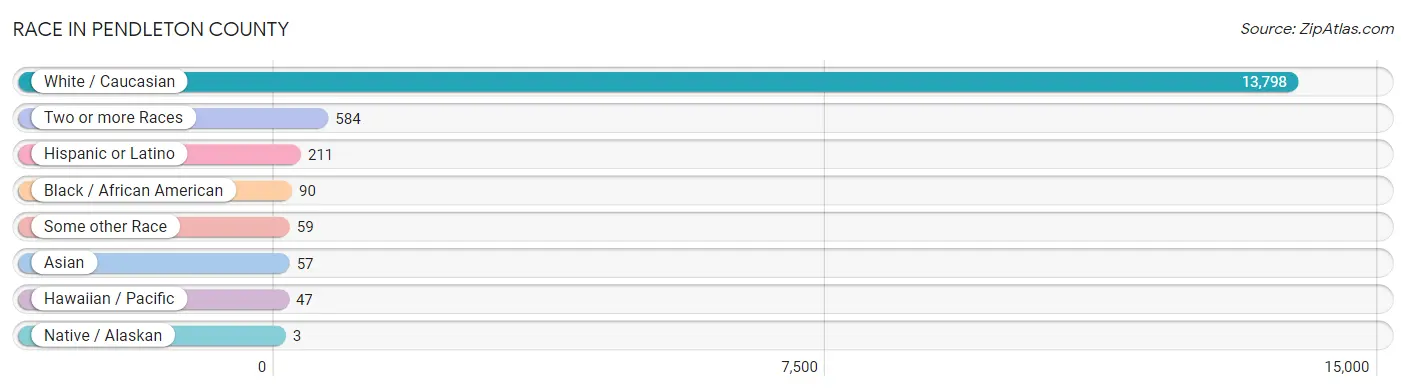
| Race | # Population | % Population |
| Asian | 57 | 0.4% |
| Black / African American | 90 | 0.6% |
| Hawaiian / Pacific | 47 | 0.3% |
| Hispanic or Latino | 211 | 1.4% |
| Native / Alaskan | 3 | 0.0% |
| White / Caucasian | 13,798 | 94.3% |
| Two or more Races | 584 | 4.0% |
| Some other Race | 59 | 0.4% |
| Total | 14,638 | 100.0% |
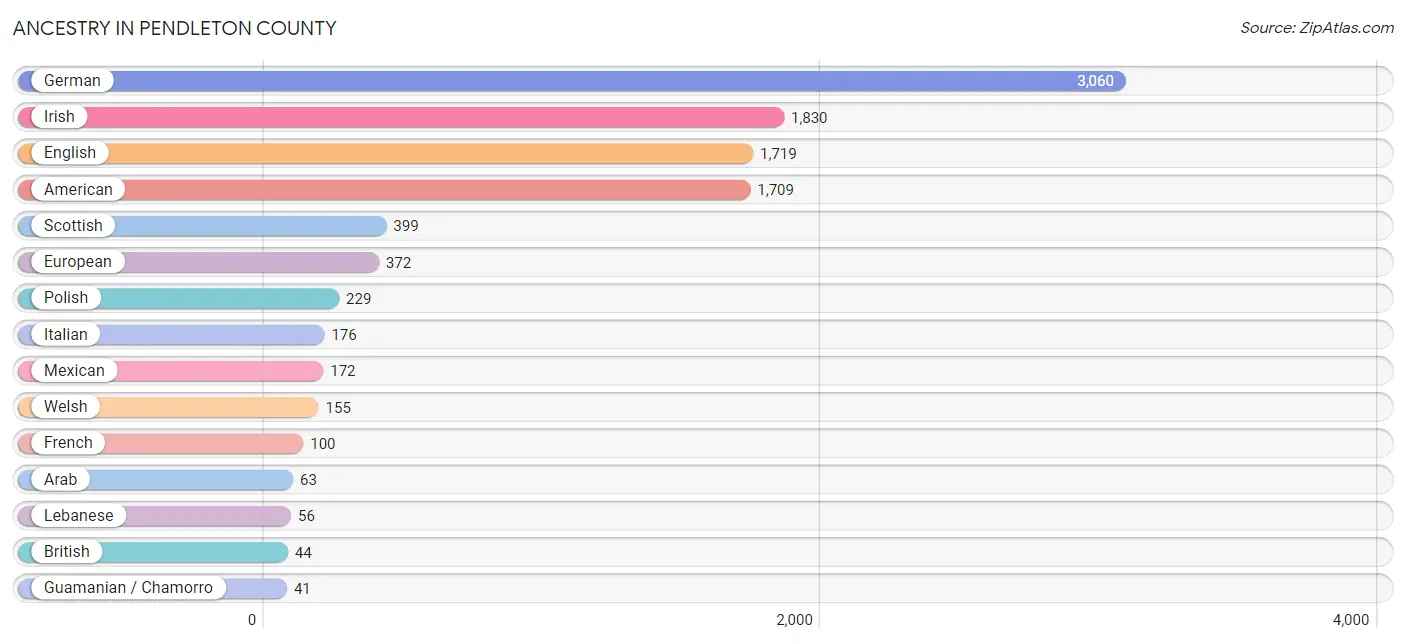
Ancestry in Pendleton County
The most populous ancestries reported in Pendleton County are German (3,060 | 20.9%), Irish (1,830 | 12.5%), English (1,719 | 11.7%), American (1,709 | 11.7%), and Scottish (399 | 2.7%), together accounting for 59.5% of all Pendleton County residents.
| Ancestry | # Population | % Population |
| African | 9 | 0.1% |
| American | 1,709 | 11.7% |
| Arab | 63 | 0.4% |
| British | 44 | 0.3% |
| Burmese | 7 | 0.1% |
| Cherokee | 13 | 0.1% |
| Choctaw | 6 | 0.0% |
| Dutch | 34 | 0.2% |
| English | 1,719 | 11.7% |
| European | 372 | 2.5% |
| French | 100 | 0.7% |
| German | 3,060 | 20.9% |
| Greek | 5 | 0.0% |
| Guamanian / Chamorro | 41 | 0.3% |
| Hungarian | 12 | 0.1% |
| Indian (Asian) | 15 | 0.1% |
| Irish | 1,830 | 12.5% |
| Iroquois | 24 | 0.2% |
| Italian | 176 | 1.2% |
| Korean | 35 | 0.2% |
| Lebanese | 56 | 0.4% |
| Mexican | 172 | 1.2% |
| Native Hawaiian | 6 | 0.0% |
| Nigerian | 12 | 0.1% |
| Norwegian | 38 | 0.3% |
| Polish | 229 | 1.6% |
| Romanian | 3 | 0.0% |
| Russian | 12 | 0.1% |
| Scotch-Irish | 36 | 0.3% |
| Scottish | 399 | 2.7% |
| Spaniard | 9 | 0.1% |
| Spanish | 14 | 0.1% |
| Subsaharan African | 21 | 0.1% |
| Swedish | 22 | 0.2% |
| Swiss | 3 | 0.0% |
| Syrian | 7 | 0.1% |
| Thai | 25 | 0.2% |
| Welsh | 155 | 1.1% | View All 38 Rows |
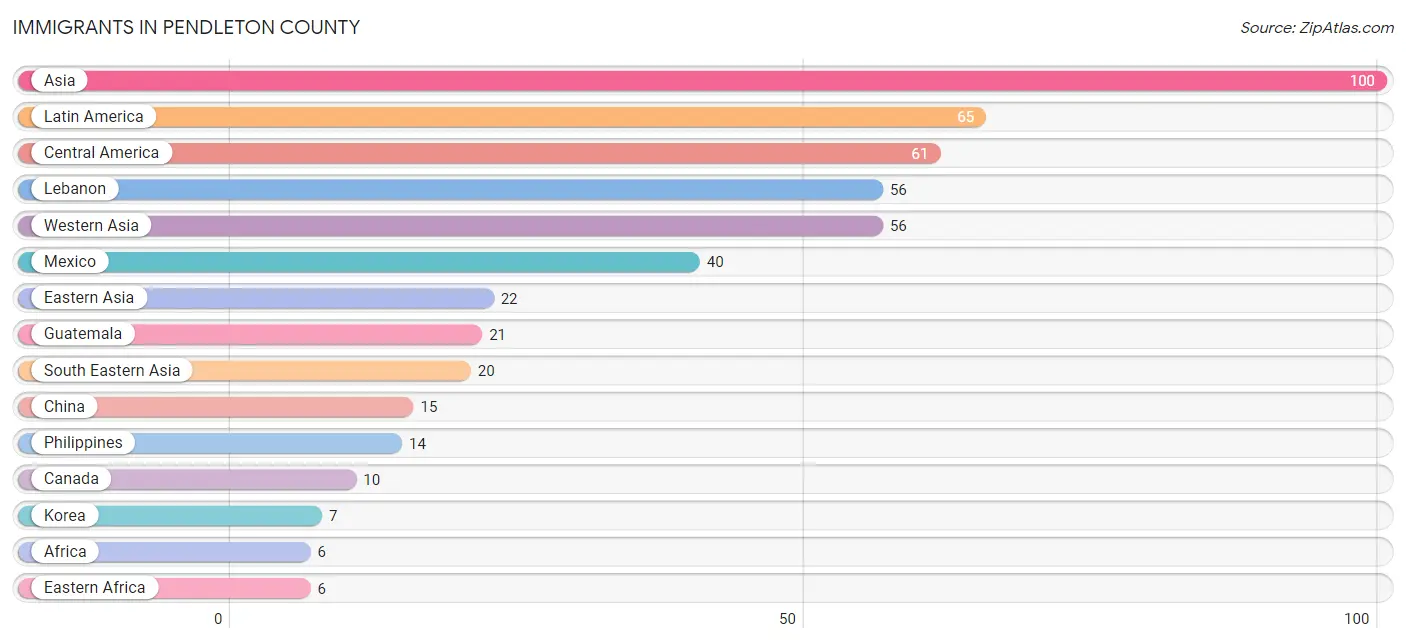
Immigrants in Pendleton County
The most numerous immigrant groups reported in Pendleton County came from Asia (100 | 0.7%), Latin America (65 | 0.4%), Central America (61 | 0.4%), Lebanon (56 | 0.4%), and Western Asia (56 | 0.4%), together accounting for 2.3% of all Pendleton County residents.
| Immigration Origin | # Population | % Population |
| Africa | 6 | 0.0% |
| Asia | 100 | 0.7% |
| Canada | 10 | 0.1% |
| Caribbean | 4 | 0.0% |
| Central America | 61 | 0.4% |
| China | 15 | 0.1% |
| Eastern Africa | 6 | 0.0% |
| Eastern Asia | 22 | 0.2% |
| Guatemala | 21 | 0.1% |
| India | 2 | 0.0% |
| Indonesia | 6 | 0.0% |
| Korea | 7 | 0.1% |
| Latin America | 65 | 0.4% |
| Lebanon | 56 | 0.4% |
| Mexico | 40 | 0.3% |
| Philippines | 14 | 0.1% |
| South Central Asia | 2 | 0.0% |
| South Eastern Asia | 20 | 0.1% |
| Western Asia | 56 | 0.4% | View All 19 Rows |
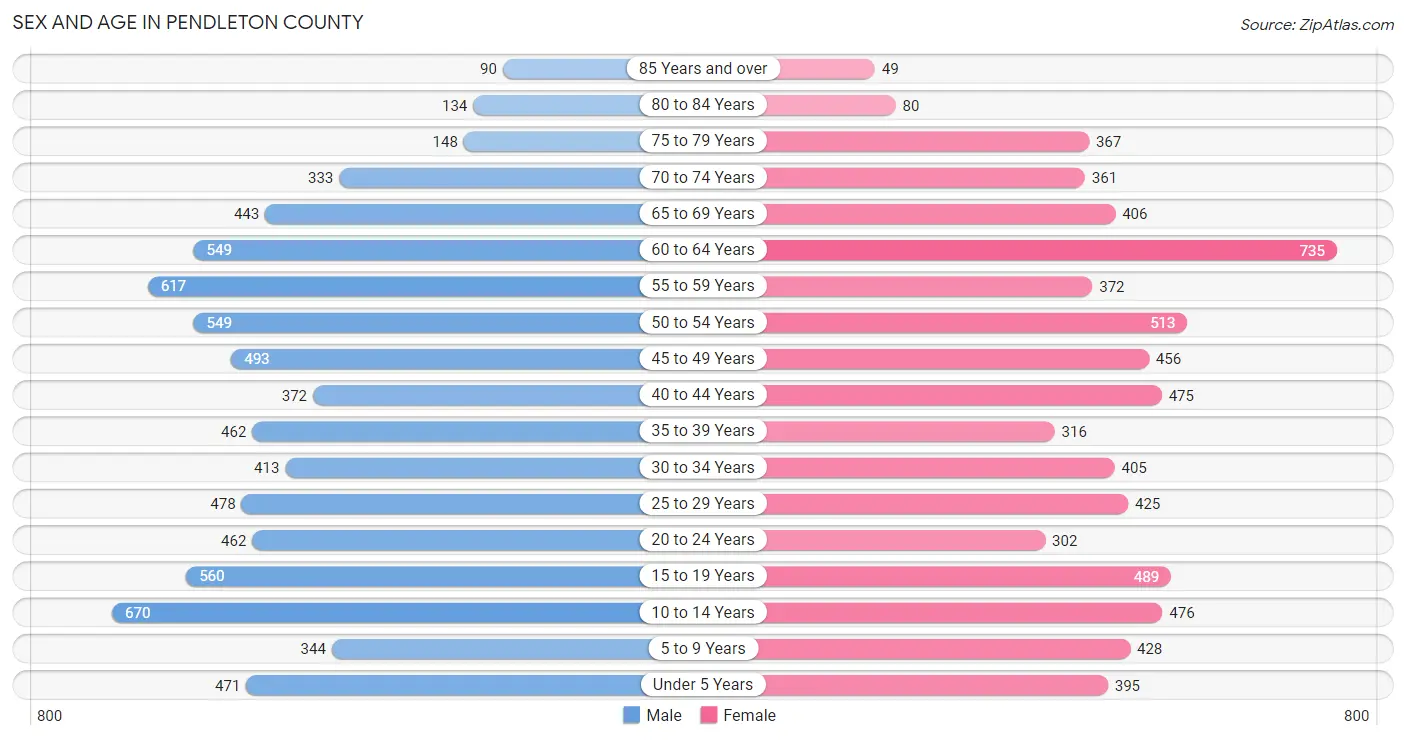
Sex and Age in Pendleton County
Sex and Age in Pendleton County
The most populous age groups in Pendleton County are 10 to 14 Years (670 | 8.8%) for men and 60 to 64 Years (735 | 10.4%) for women.
| Age Bracket | Male | Female |
| Under 5 Years | 471 (6.2%) | 395 (5.6%) |
| 5 to 9 Years | 344 (4.5%) | 428 (6.1%) |
| 10 to 14 Years | 670 (8.8%) | 476 (6.8%) |
| 15 to 19 Years | 560 (7.4%) | 489 (6.9%) |
| 20 to 24 Years | 462 (6.1%) | 302 (4.3%) |
| 25 to 29 Years | 478 (6.3%) | 425 (6.0%) |
| 30 to 34 Years | 413 (5.4%) | 405 (5.7%) |
| 35 to 39 Years | 462 (6.1%) | 316 (4.5%) |
| 40 to 44 Years | 372 (4.9%) | 475 (6.7%) |
| 45 to 49 Years | 493 (6.5%) | 456 (6.5%) |
| 50 to 54 Years | 549 (7.2%) | 513 (7.3%) |
| 55 to 59 Years | 617 (8.1%) | 372 (5.3%) |
| 60 to 64 Years | 549 (7.2%) | 735 (10.4%) |
| 65 to 69 Years | 443 (5.8%) | 406 (5.8%) |
| 70 to 74 Years | 333 (4.4%) | 361 (5.1%) |
| 75 to 79 Years | 148 (1.9%) | 367 (5.2%) |
| 80 to 84 Years | 134 (1.8%) | 80 (1.1%) |
| 85 Years and over | 90 (1.2%) | 49 (0.7%) |
| Total | 7,588 (100.0%) | 7,050 (100.0%) |
Families and Households in Pendleton County
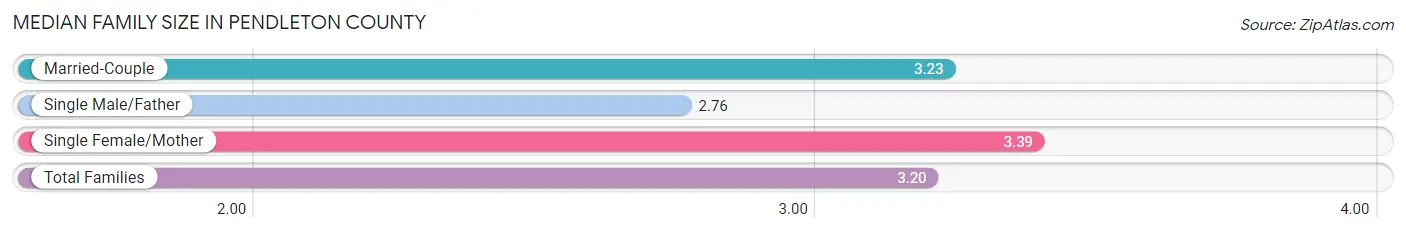
Median Family Size in Pendleton County
The median family size in Pendleton County is 3.20 persons per family, with single female/mother families (605 | 16.6%) accounting for the largest median family size of 3.39 persons per family. On the other hand, single male/father families (413 | 11.3%) represent the smallest median family size with 2.76 persons per family.
| Family Type | # Families | Family Size |
| Married-Couple | 2,635 (72.1%) | 3.23 |
| Single Male/Father | 413 (11.3%) | 2.76 |
| Single Female/Mother | 605 (16.6%) | 3.39 |
| Total Families | 3,653 (100.0%) | 3.20 |
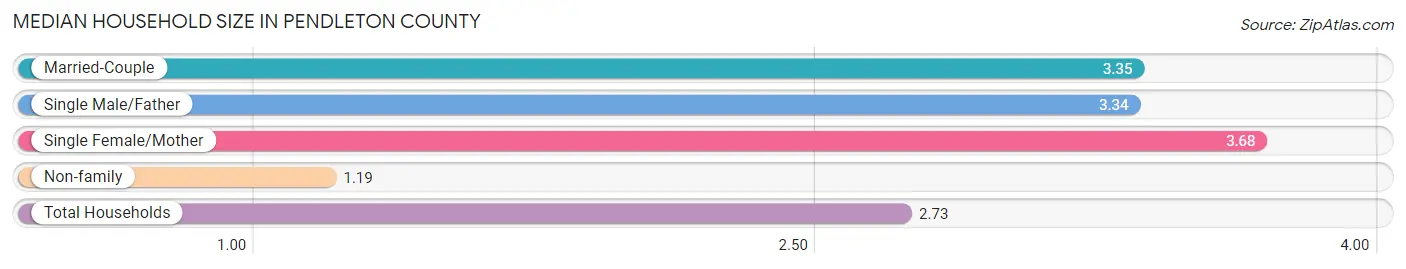
Median Household Size in Pendleton County
The median household size in Pendleton County is 2.73 persons per household, with single female/mother households (605 | 11.5%) accounting for the largest median household size of 3.68 persons per household. non-family households (1,617 | 30.7%) represent the smallest median household size with 1.19 persons per household.
| Household Type | # Households | Household Size |
| Married-Couple | 2,635 (50.0%) | 3.35 |
| Single Male/Father | 413 (7.8%) | 3.34 |
| Single Female/Mother | 605 (11.5%) | 3.68 |
| Non-family | 1,617 (30.7%) | 1.19 |
| Total Households | 5,270 (100.0%) | 2.73 |
Household Size by Marriage Status in Pendleton County
Out of a total of 5,270 households in Pendleton County, 3,653 (69.3%) are family households, while 1,617 (30.7%) are nonfamily households. The most numerous type of family households are 2-person households, comprising 1,560, and the most common type of nonfamily households are 1-person households, comprising 1,421.
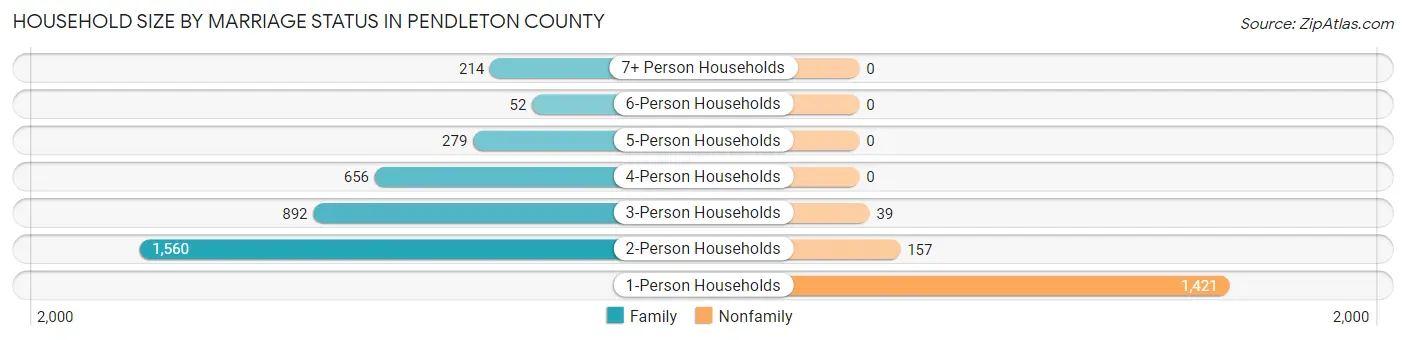
| Household Size | Family Households | Nonfamily Households |
| 1-Person Households | - | 1,421 (27.0%) |
| 2-Person Households | 1,560 (29.6%) | 157 (3.0%) |
| 3-Person Households | 892 (16.9%) | 39 (0.7%) |
| 4-Person Households | 656 (12.4%) | 0 (0.0%) |
| 5-Person Households | 279 (5.3%) | 0 (0.0%) |
| 6-Person Households | 52 (1.0%) | 0 (0.0%) |
| 7+ Person Households | 214 (4.1%) | 0 (0.0%) |
| Total | 3,653 (69.3%) | 1,617 (30.7%) |
Female Fertility in Pendleton County
Fertility by Age in Pendleton County
Average fertility rate in Pendleton County is 76.0 births per 1,000 women. Women in the age bracket of 20 to 34 years have the highest fertility rate with 168.0 births per 1,000 women. Women in the age bracket of 20 to 34 years acount for 84.1% of all women with births.
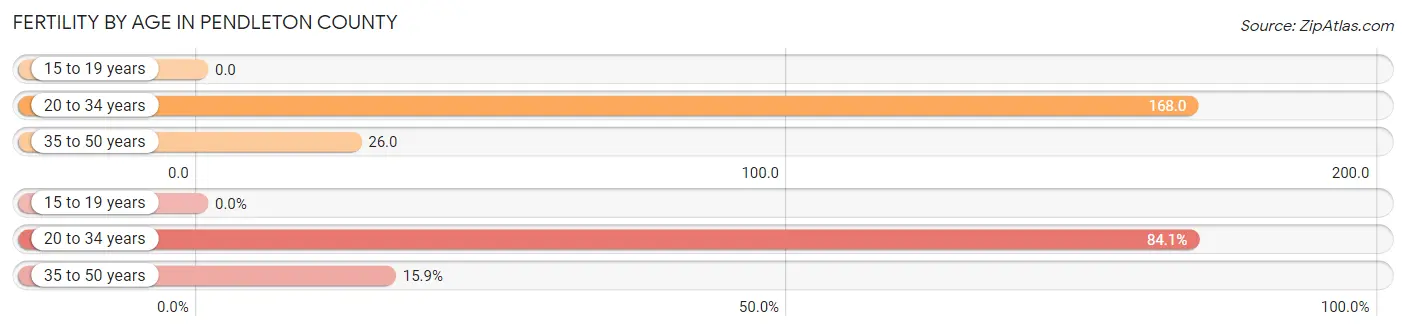
| Age Bracket | Women with Births | Births / 1,000 Women |
| 15 to 19 years | 0 (0.0%) | 0.0 |
| 20 to 34 years | 190 (84.1%) | 168.0 |
| 35 to 50 years | 36 (15.9%) | 26.0 |
| Total | 226 (100.0%) | 76.0 |
Fertility by Age by Marriage Status in Pendleton County
60.6% of women with births (226) in Pendleton County are married. The highest percentage of unmarried women with births falls into 35 to 50 years age bracket with 52.8% of them unmarried at the time of birth, while the lowest percentage of unmarried women with births belong to 20 to 34 years age bracket with 36.8% of them unmarried.
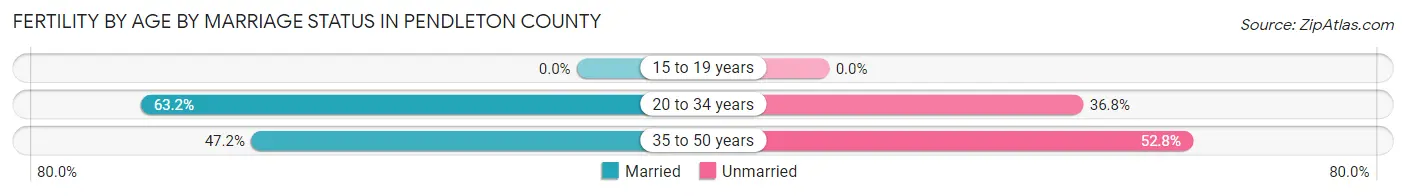
| Age Bracket | Married | Unmarried |
| 15 to 19 years | 0 (0.0%) | 0 (0.0%) |
| 20 to 34 years | 120 (63.2%) | 70 (36.8%) |
| 35 to 50 years | 17 (47.2%) | 19 (52.8%) |
| Total | 137 (60.6%) | 89 (39.4%) |
Fertility by Education in Pendleton County
Average fertility rate in Pendleton County is 76.0 births per 1,000 women. Women with the education attainment of high school diploma have the highest fertility rate of 114.0 births per 1,000 women, while women with the education attainment of less than high school have the lowest fertility at 24.0 births per 1,000 women. Women with the education attainment of high school diploma represent 48.2% of all women with births.
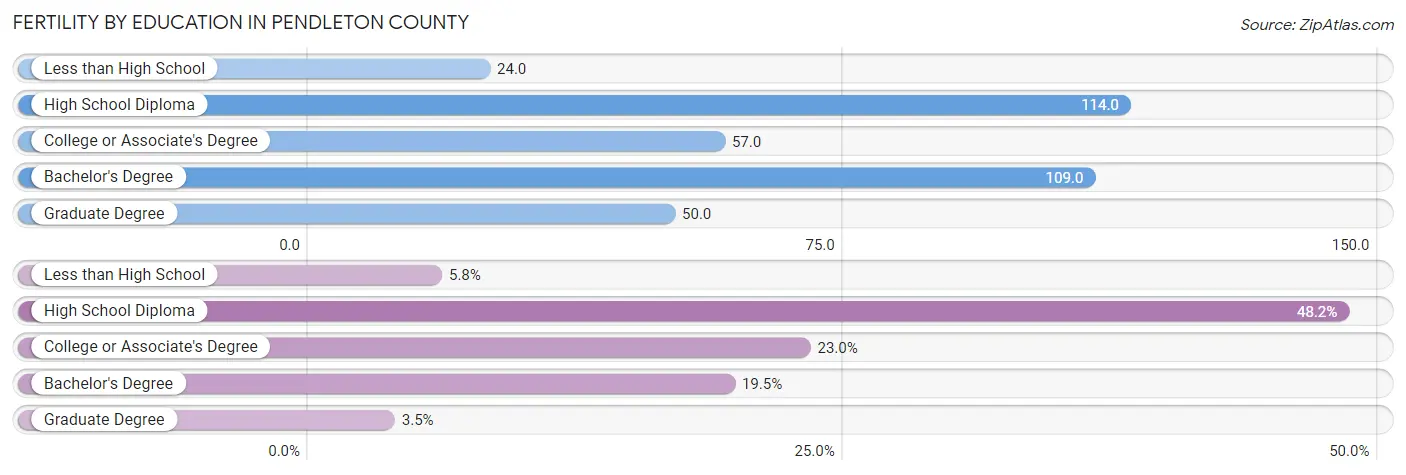
| Educational Attainment | Women with Births | Births / 1,000 Women |
| Less than High School | 13 (5.8%) | 24.0 |
| High School Diploma | 109 (48.2%) | 114.0 |
| College or Associate's Degree | 52 (23.0%) | 57.0 |
| Bachelor's Degree | 44 (19.5%) | 109.0 |
| Graduate Degree | 8 (3.5%) | 50.0 |
| Total | 226 (100.0%) | 76.0 |
Fertility by Education by Marriage Status in Pendleton County
39.4% of women with births in Pendleton County are unmarried. Women with the educational attainment of less than high school are most likely to be married with 100.0% of them married at childbirth, while women with the educational attainment of high school diploma are least likely to be married with 64.2% of them unmarried at childbirth.
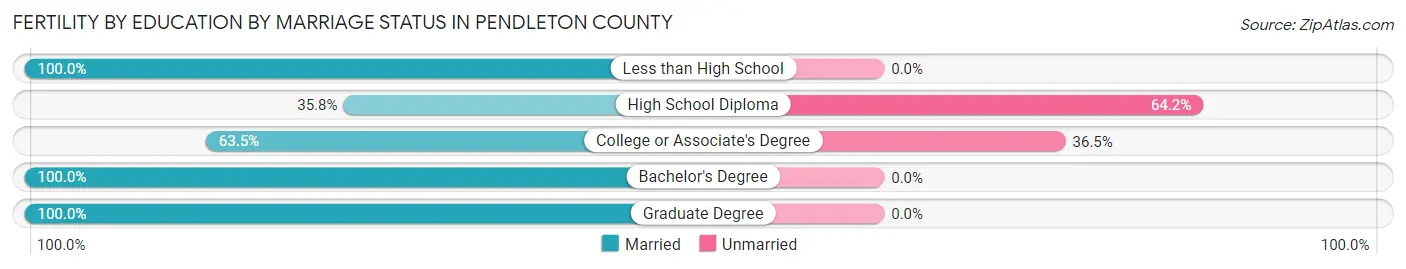
| Educational Attainment | Married | Unmarried |
| Less than High School | 13 (100.0%) | 0 (0.0%) |
| High School Diploma | 39 (35.8%) | 70 (64.2%) |
| College or Associate's Degree | 33 (63.5%) | 19 (36.5%) |
| Bachelor's Degree | 44 (100.0%) | 0 (0.0%) |
| Graduate Degree | 8 (100.0%) | 0 (0.0%) |
| Total | 137 (60.6%) | 89 (39.4%) |
Employment Characteristics in Pendleton County
Employment by Class of Employer in Pendleton County
Among the 6,637 employed individuals in Pendleton County, private company employees (4,748 | 71.5%), local government employees (627 | 9.5%), and not-for-profit organizations (545 | 8.2%) make up the most common classes of employment.
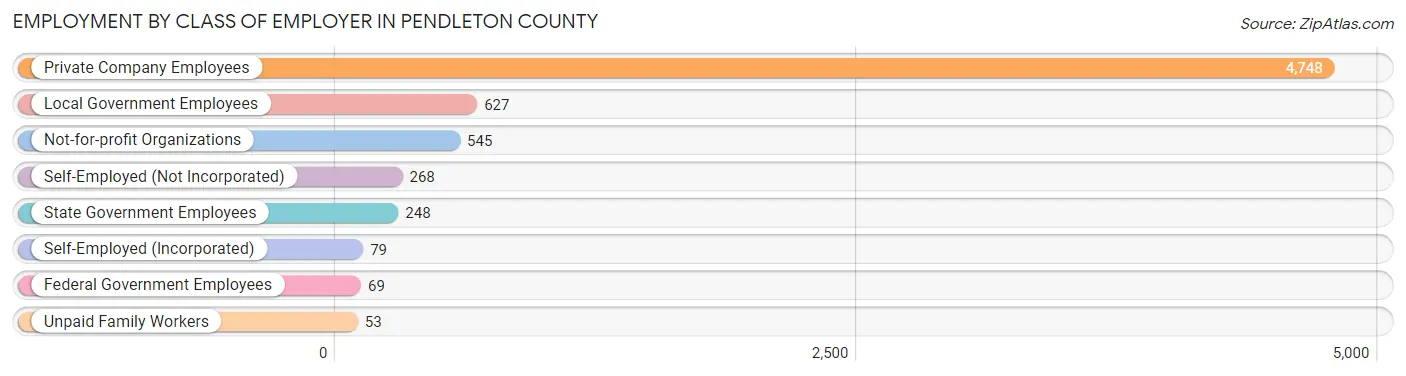
| Employer Class | # Employees | % Employees |
| Private Company Employees | 4,748 | 71.5% |
| Self-Employed (Incorporated) | 79 | 1.2% |
| Self-Employed (Not Incorporated) | 268 | 4.0% |
| Not-for-profit Organizations | 545 | 8.2% |
| Local Government Employees | 627 | 9.5% |
| State Government Employees | 248 | 3.7% |
| Federal Government Employees | 69 | 1.0% |
| Unpaid Family Workers | 53 | 0.8% |
| Total | 6,637 | 100.0% |
Employment Status by Age in Pendleton County
According to the labor force statistics for Pendleton County, out of the total population over 16 years of age (11,649), 60.4% or 7,036 individuals are in the labor force, with 5.0% or 352 of them unemployed. The age group with the highest labor force participation rate is 25 to 29 years, with 89.3% or 806 individuals in the labor force. Within the labor force, the 30 to 34 years age range has the highest percentage of unemployed individuals, with 13.7% or 86 of them being unemployed.
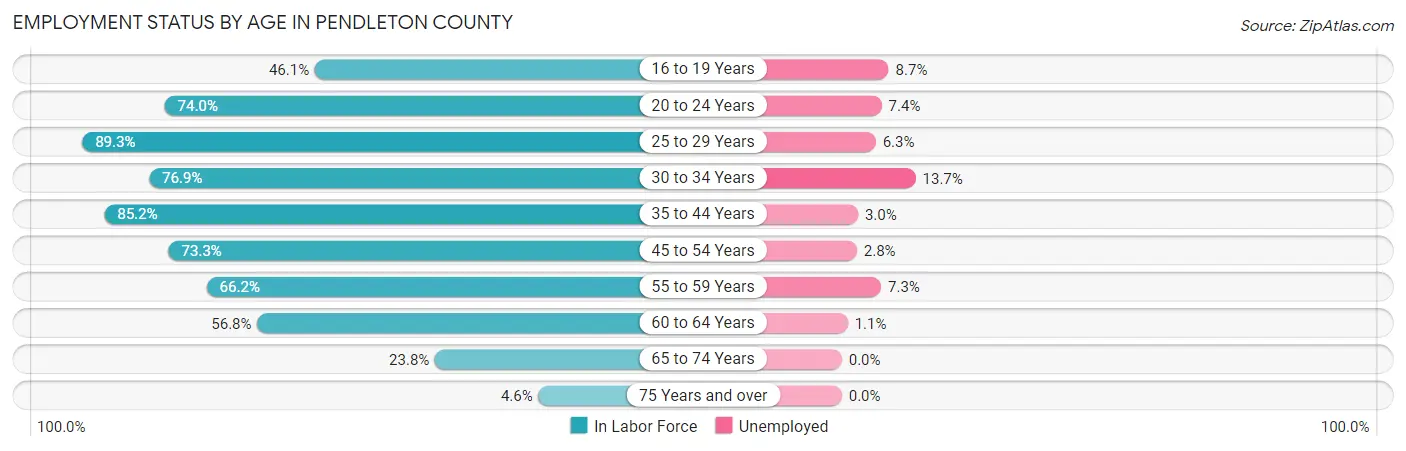
| Age Bracket | In Labor Force | Unemployed |
| 16 to 19 Years | 389 (46.1%) | 34 (8.7%) |
| 20 to 24 Years | 565 (74.0%) | 42 (7.4%) |
| 25 to 29 Years | 806 (89.3%) | 51 (6.3%) |
| 30 to 34 Years | 629 (76.9%) | 86 (13.7%) |
| 35 to 44 Years | 1,384 (85.2%) | 42 (3.0%) |
| 45 to 54 Years | 1,474 (73.3%) | 41 (2.8%) |
| 55 to 59 Years | 655 (66.2%) | 48 (7.3%) |
| 60 to 64 Years | 729 (56.8%) | 8 (1.1%) |
| 65 to 74 Years | 367 (23.8%) | 0 (0.0%) |
| 75 Years and over | 40 (4.6%) | 0 (0.0%) |
| Total | 7,036 (60.4%) | 352 (5.0%) |
Employment Status by Educational Attainment in Pendleton County
According to labor force statistics for Pendleton County, 74.4% of individuals (5,677) out of the total population between 25 and 64 years of age (7,630) are in the labor force, with 4.9% or 278 of them being unemployed. The group with the highest labor force participation rate are those with the educational attainment of bachelor's degree or higher, with 85.2% or 1,154 individuals in the labor force. Within the labor force, individuals with less than high school education have the highest percentage of unemployment, with 10.4% or 40 of them being unemployed.
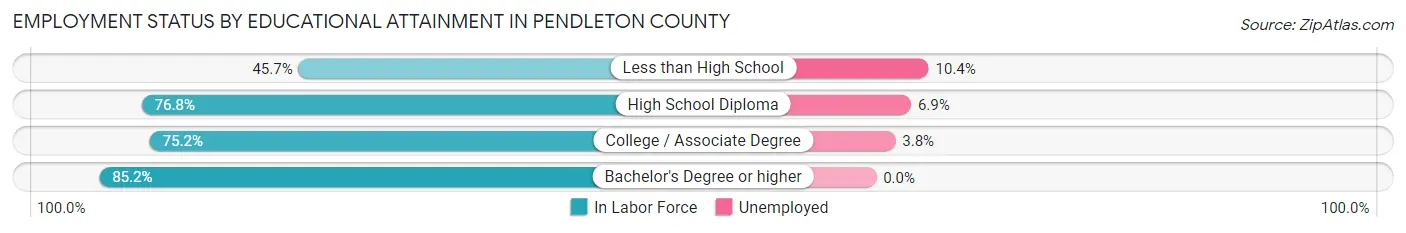
| Educational Attainment | In Labor Force | Unemployed |
| Less than High School | 385 (45.7%) | 88 (10.4%) |
| High School Diploma | 2,498 (76.8%) | 224 (6.9%) |
| College / Associate Degree | 1,639 (75.2%) | 83 (3.8%) |
| Bachelor's Degree or higher | 1,154 (85.2%) | 0 (0.0%) |
| Total | 5,677 (74.4%) | 374 (4.9%) |
Employment Occupations by Sex in Pendleton County
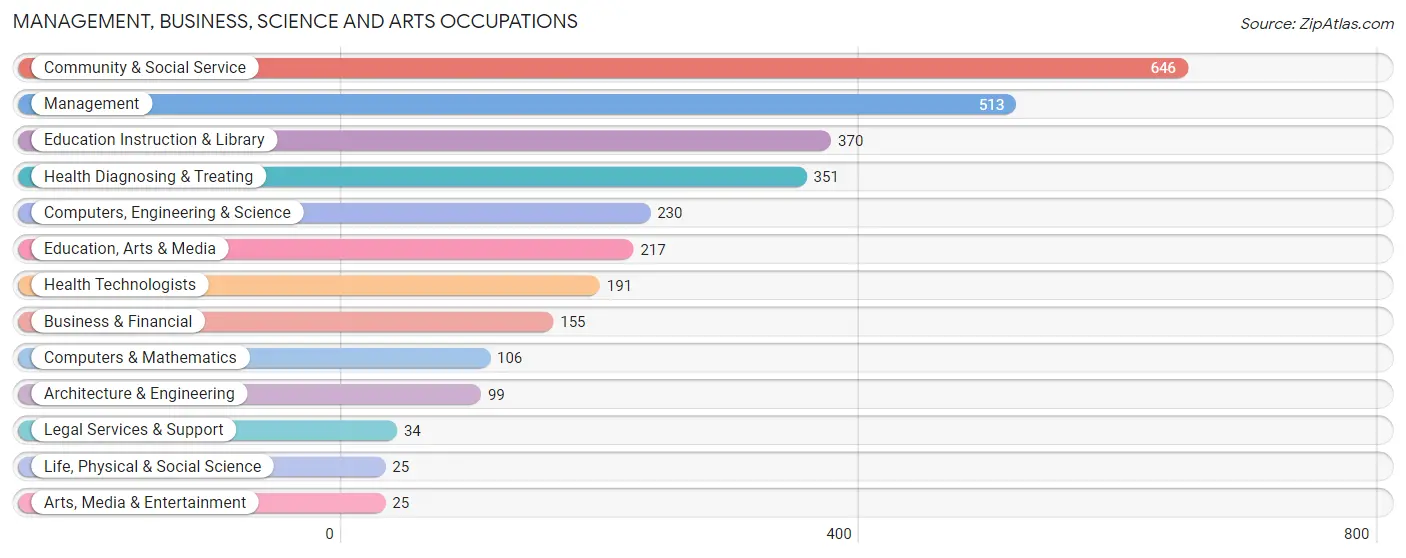
Management, Business, Science and Arts Occupations
The most common Management, Business, Science and Arts occupations in Pendleton County are Community & Social Service (646 | 9.7%), Management (513 | 7.7%), Education Instruction & Library (370 | 5.5%), Health Diagnosing & Treating (351 | 5.2%), and Computers, Engineering & Science (230 | 3.4%).
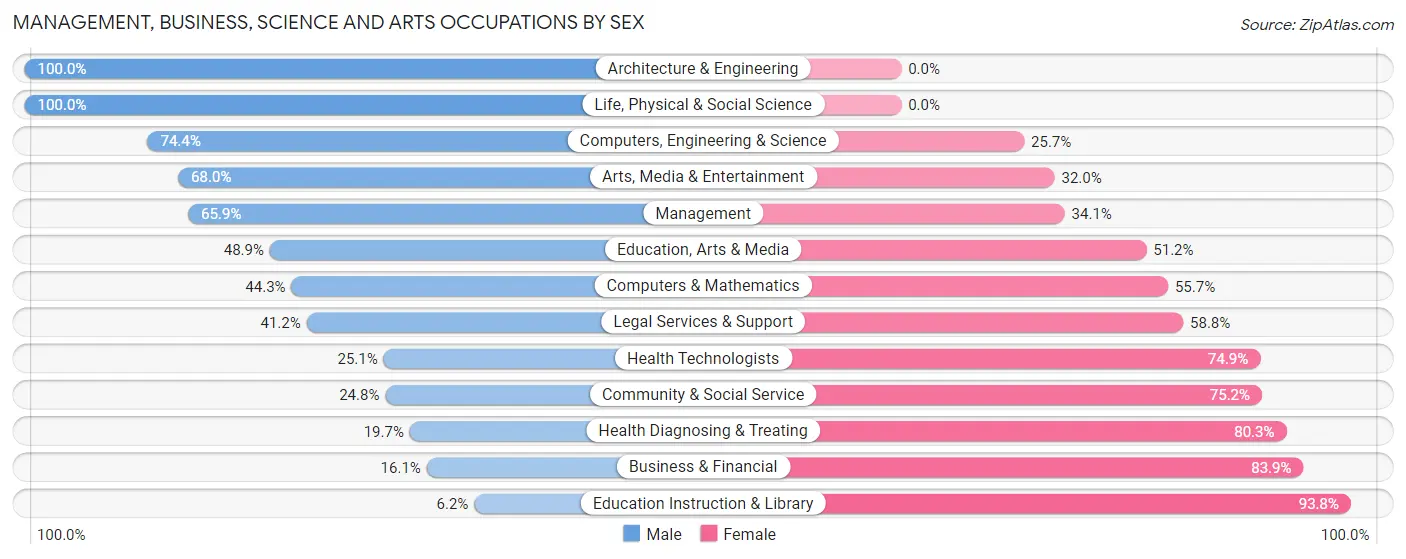
Management, Business, Science and Arts Occupations by Sex
Within the Management, Business, Science and Arts occupations in Pendleton County, the most male-oriented occupations are Architecture & Engineering (100.0%), Life, Physical & Social Science (100.0%), and Computers, Engineering & Science (74.4%), while the most female-oriented occupations are Education Instruction & Library (93.8%), Business & Financial (83.9%), and Health Diagnosing & Treating (80.3%).
| Occupation | Male | Female |
| Management | 338 (65.9%) | 175 (34.1%) |
| Business & Financial | 25 (16.1%) | 130 (83.9%) |
| Computers, Engineering & Science | 171 (74.4%) | 59 (25.7%) |
| Computers & Mathematics | 47 (44.3%) | 59 (55.7%) |
| Architecture & Engineering | 99 (100.0%) | 0 (0.0%) |
| Life, Physical & Social Science | 25 (100.0%) | 0 (0.0%) |
| Community & Social Service | 160 (24.8%) | 486 (75.2%) |
| Education, Arts & Media | 106 (48.8%) | 111 (51.1%) |
| Legal Services & Support | 14 (41.2%) | 20 (58.8%) |
| Education Instruction & Library | 23 (6.2%) | 347 (93.8%) |
| Arts, Media & Entertainment | 17 (68.0%) | 8 (32.0%) |
| Health Diagnosing & Treating | 69 (19.7%) | 282 (80.3%) |
| Health Technologists | 48 (25.1%) | 143 (74.9%) |
| Total (Category) | 763 (40.3%) | 1,132 (59.7%) |
| Total (Overall) | 3,593 (53.7%) | 3,095 (46.3%) |
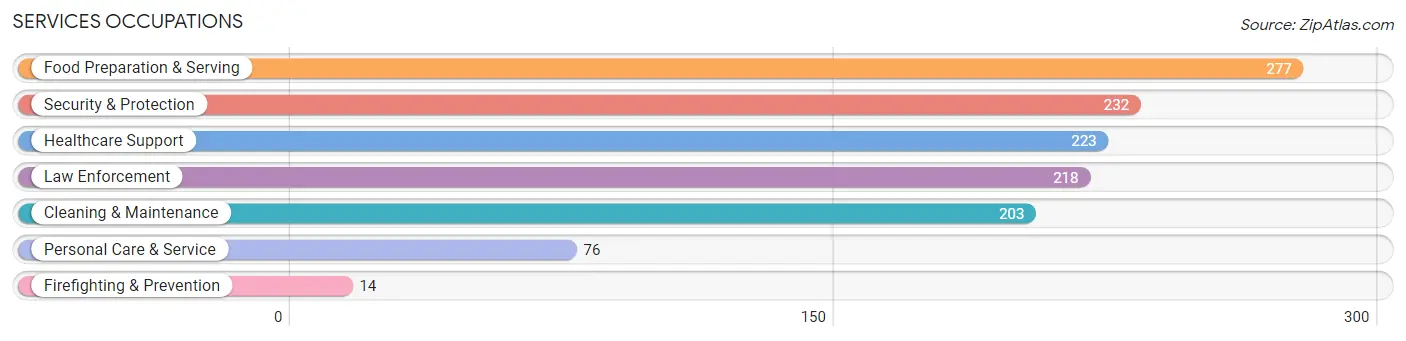
Services Occupations
The most common Services occupations in Pendleton County are Food Preparation & Serving (277 | 4.1%), Security & Protection (232 | 3.5%), Healthcare Support (223 | 3.3%), Law Enforcement (218 | 3.3%), and Cleaning & Maintenance (203 | 3.0%).
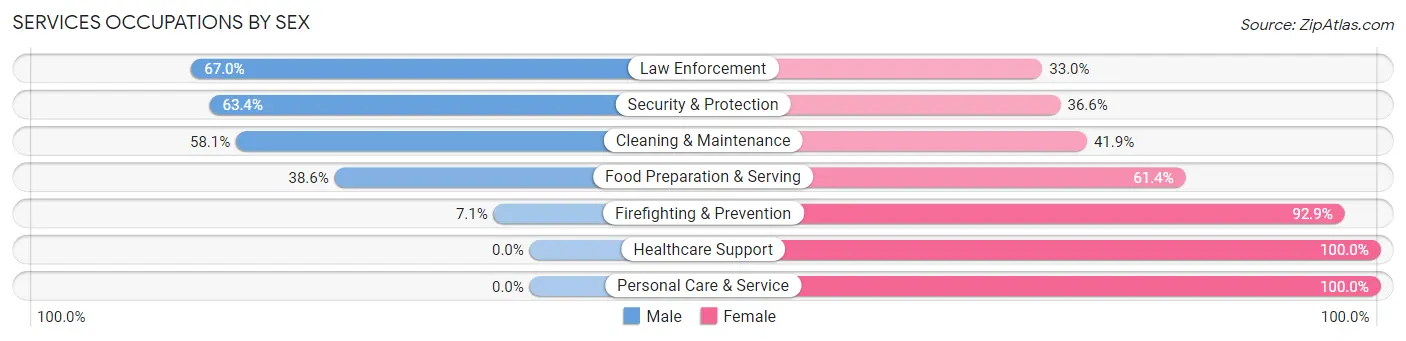
Services Occupations by Sex
Within the Services occupations in Pendleton County, the most male-oriented occupations are Law Enforcement (67.0%), Security & Protection (63.4%), and Cleaning & Maintenance (58.1%), while the most female-oriented occupations are Healthcare Support (100.0%), Personal Care & Service (100.0%), and Firefighting & Prevention (92.9%).
| Occupation | Male | Female |
| Healthcare Support | 0 (0.0%) | 223 (100.0%) |
| Security & Protection | 147 (63.4%) | 85 (36.6%) |
| Firefighting & Prevention | 1 (7.1%) | 13 (92.9%) |
| Law Enforcement | 146 (67.0%) | 72 (33.0%) |
| Food Preparation & Serving | 107 (38.6%) | 170 (61.4%) |
| Cleaning & Maintenance | 118 (58.1%) | 85 (41.9%) |
| Personal Care & Service | 0 (0.0%) | 76 (100.0%) |
| Total (Category) | 372 (36.8%) | 639 (63.2%) |
| Total (Overall) | 3,593 (53.7%) | 3,095 (46.3%) |
Sales and Office Occupations
The most common Sales and Office occupations in Pendleton County are Office & Administration (798 | 11.9%), and Sales & Related (555 | 8.3%).
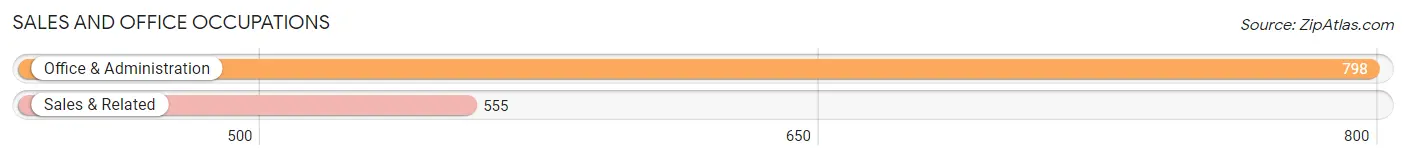
Sales and Office Occupations by Sex
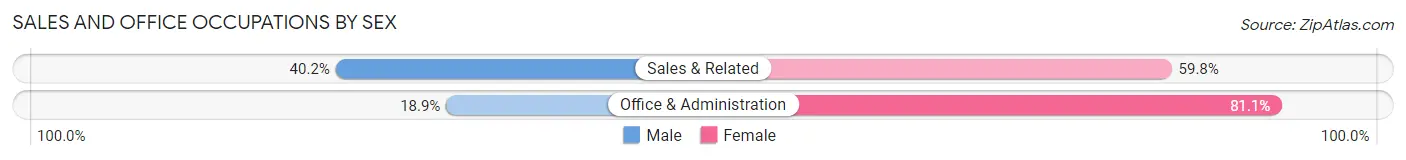
| Occupation | Male | Female |
| Sales & Related | 223 (40.2%) | 332 (59.8%) |
| Office & Administration | 151 (18.9%) | 647 (81.1%) |
| Total (Category) | 374 (27.6%) | 979 (72.4%) |
| Total (Overall) | 3,593 (53.7%) | 3,095 (46.3%) |
Natural Resources, Construction and Maintenance Occupations
The most common Natural Resources, Construction and Maintenance occupations in Pendleton County are Construction & Extraction (621 | 9.3%), Installation, Maintenance & Repair (302 | 4.5%), and Farming, Fishing & Forestry (51 | 0.8%).
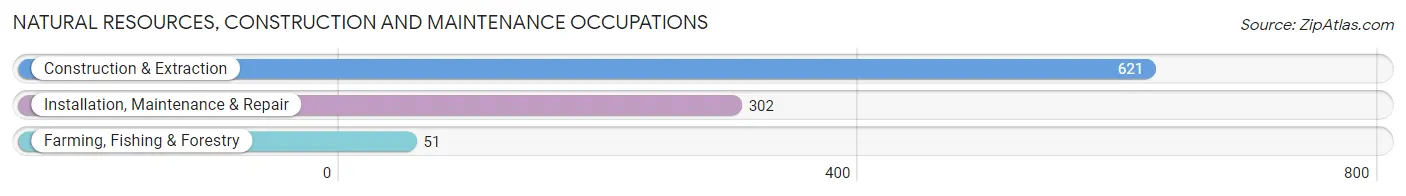
Natural Resources, Construction and Maintenance Occupations by Sex
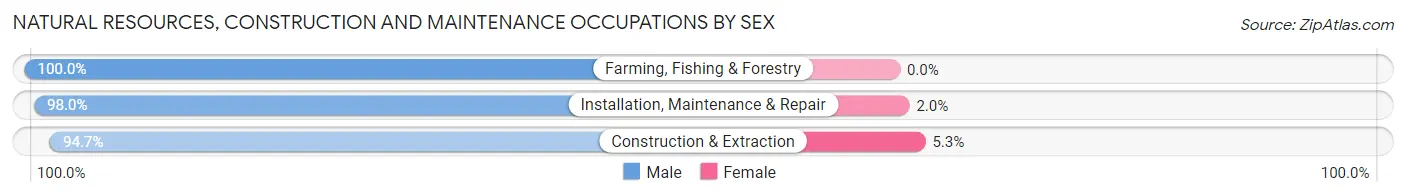
| Occupation | Male | Female |
| Farming, Fishing & Forestry | 51 (100.0%) | 0 (0.0%) |
| Construction & Extraction | 588 (94.7%) | 33 (5.3%) |
| Installation, Maintenance & Repair | 296 (98.0%) | 6 (2.0%) |
| Total (Category) | 935 (96.0%) | 39 (4.0%) |
| Total (Overall) | 3,593 (53.7%) | 3,095 (46.3%) |
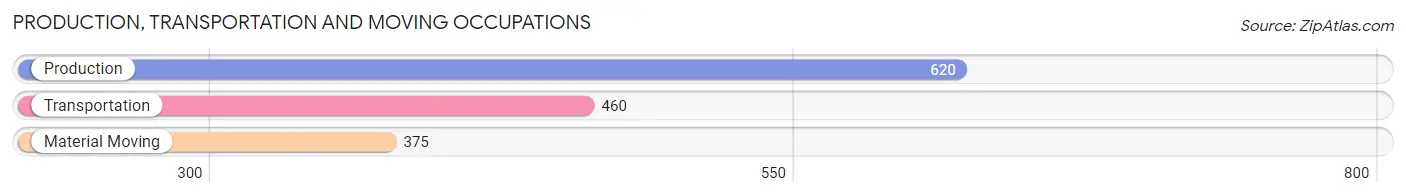
Production, Transportation and Moving Occupations
The most common Production, Transportation and Moving occupations in Pendleton County are Production (620 | 9.3%), Transportation (460 | 6.9%), and Material Moving (375 | 5.6%).
Production, Transportation and Moving Occupations by Sex
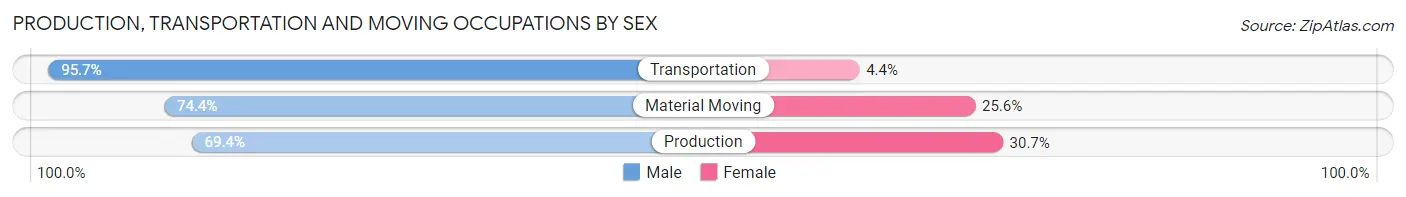
| Occupation | Male | Female |
| Production | 430 (69.4%) | 190 (30.6%) |
| Transportation | 440 (95.7%) | 20 (4.3%) |
| Material Moving | 279 (74.4%) | 96 (25.6%) |
| Total (Category) | 1,149 (79.0%) | 306 (21.0%) |
| Total (Overall) | 3,593 (53.7%) | 3,095 (46.3%) |
Employment Industries by Sex in Pendleton County
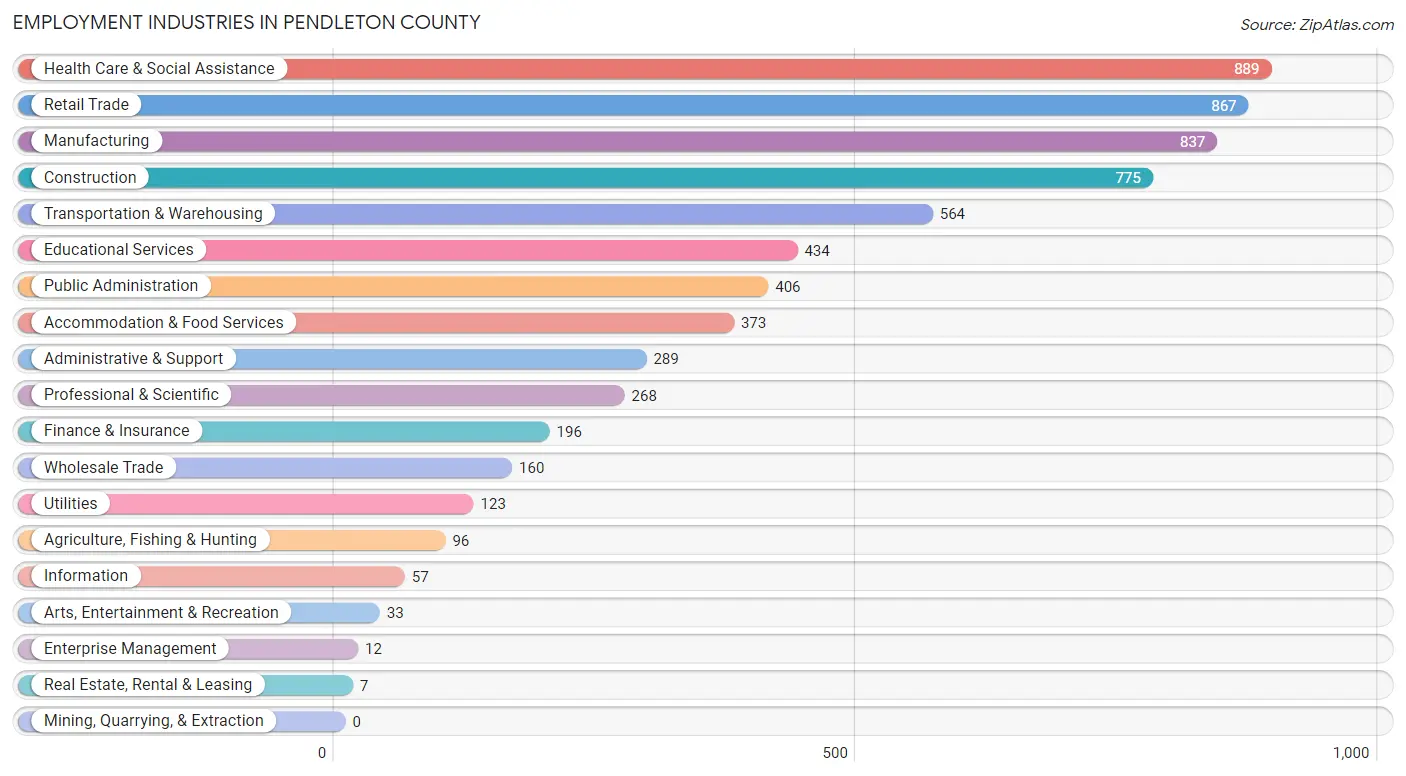
Employment Industries in Pendleton County
The major employment industries in Pendleton County include Health Care & Social Assistance (889 | 13.3%), Retail Trade (867 | 13.0%), Manufacturing (837 | 12.5%), Construction (775 | 11.6%), and Transportation & Warehousing (564 | 8.4%).
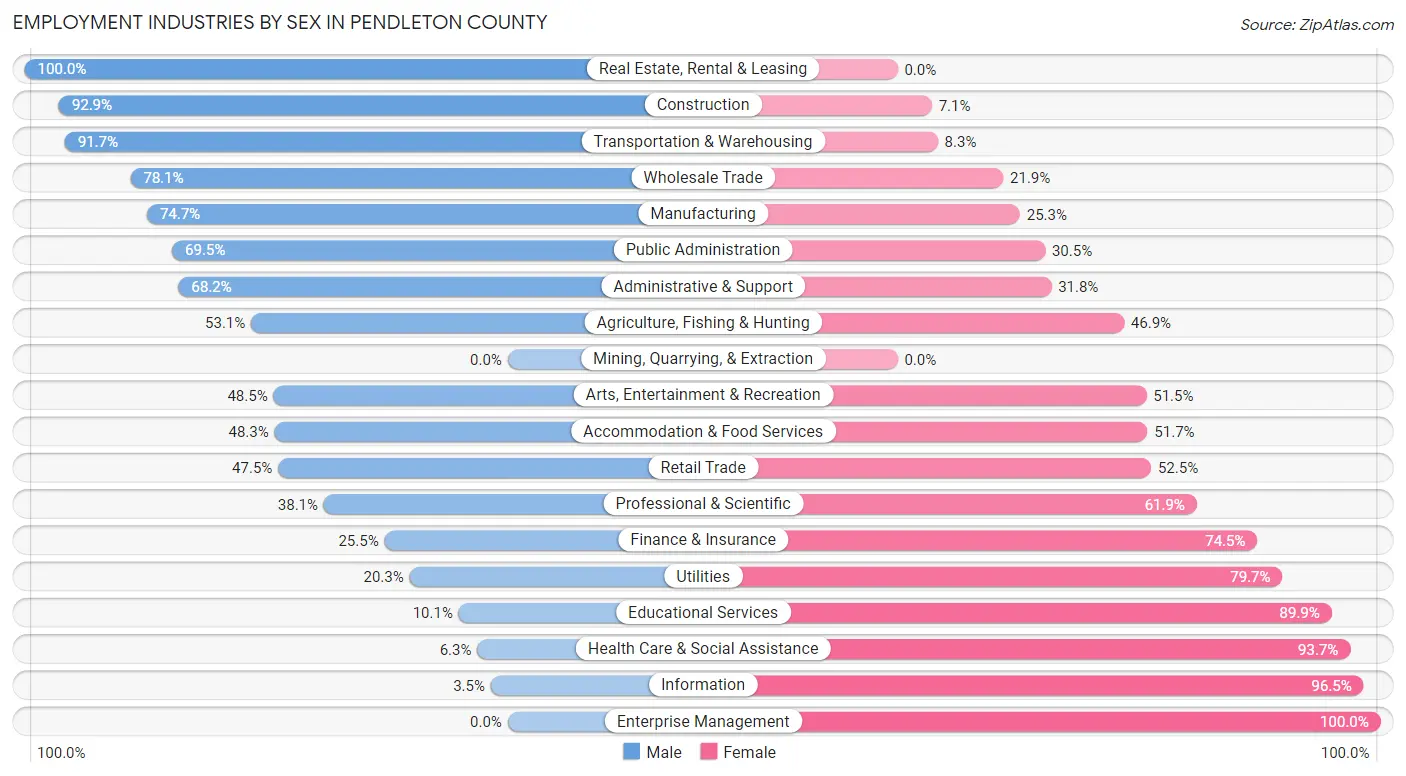
Employment Industries by Sex in Pendleton County
The Pendleton County industries that see more men than women are Real Estate, Rental & Leasing (100.0%), Construction (92.9%), and Transportation & Warehousing (91.7%), whereas the industries that tend to have a higher number of women are Enterprise Management (100.0%), Information (96.5%), and Health Care & Social Assistance (93.7%).
| Industry | Male | Female |
| Agriculture, Fishing & Hunting | 51 (53.1%) | 45 (46.9%) |
| Mining, Quarrying, & Extraction | 0 (0.0%) | 0 (0.0%) |
| Construction | 720 (92.9%) | 55 (7.1%) |
| Manufacturing | 625 (74.7%) | 212 (25.3%) |
| Wholesale Trade | 125 (78.1%) | 35 (21.9%) |
| Retail Trade | 412 (47.5%) | 455 (52.5%) |
| Transportation & Warehousing | 517 (91.7%) | 47 (8.3%) |
| Utilities | 25 (20.3%) | 98 (79.7%) |
| Information | 2 (3.5%) | 55 (96.5%) |
| Finance & Insurance | 50 (25.5%) | 146 (74.5%) |
| Real Estate, Rental & Leasing | 7 (100.0%) | 0 (0.0%) |
| Professional & Scientific | 102 (38.1%) | 166 (61.9%) |
| Enterprise Management | 0 (0.0%) | 12 (100.0%) |
| Administrative & Support | 197 (68.2%) | 92 (31.8%) |
| Educational Services | 44 (10.1%) | 390 (89.9%) |
| Health Care & Social Assistance | 56 (6.3%) | 833 (93.7%) |
| Arts, Entertainment & Recreation | 16 (48.5%) | 17 (51.5%) |
| Accommodation & Food Services | 180 (48.3%) | 193 (51.7%) |
| Public Administration | 282 (69.5%) | 124 (30.5%) |
| Total | 3,593 (53.7%) | 3,095 (46.3%) |
Education in Pendleton County
School Enrollment in Pendleton County
The most common levels of schooling among the 3,269 students in Pendleton County are high school (1,018 | 31.1%), middle school (911 | 27.9%), and elementary school (438 | 13.4%).
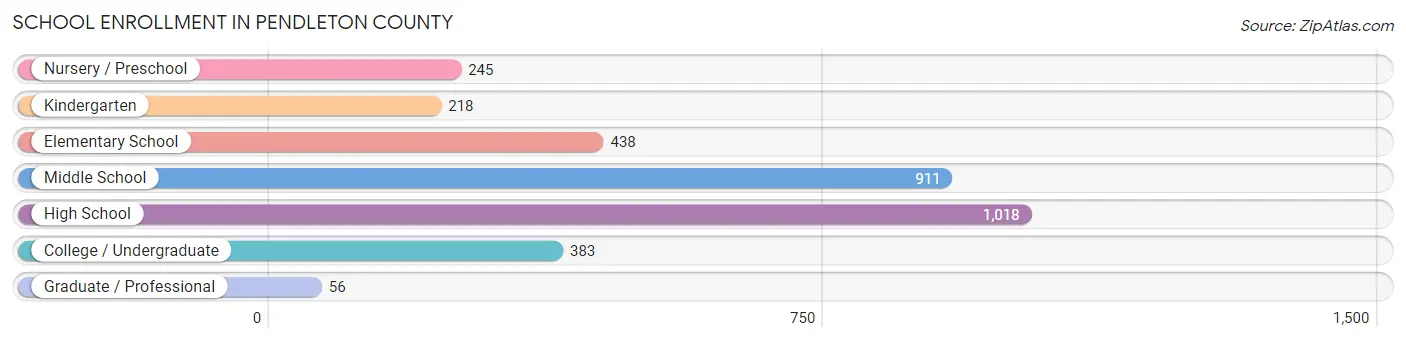
| School Level | # Students | % Students |
| Nursery / Preschool | 245 | 7.5% |
| Kindergarten | 218 | 6.7% |
| Elementary School | 438 | 13.4% |
| Middle School | 911 | 27.9% |
| High School | 1,018 | 31.1% |
| College / Undergraduate | 383 | 11.7% |
| Graduate / Professional | 56 | 1.7% |
| Total | 3,269 | 100.0% |
School Enrollment by Age by Funding Source in Pendleton County
Out of a total of 3,269 students who are enrolled in schools in Pendleton County, 297 (9.1%) attend a private institution, while the remaining 2,972 (90.9%) are enrolled in public schools. The age group of 25 to 34 year olds has the highest likelihood of being enrolled in private schools, with 42 (52.5% in the age bracket) enrolled. Conversely, the age group of 10 to 14 year olds has the lowest likelihood of being enrolled in a private school, with 1,112 (97.2% in the age bracket) attending a public institution.
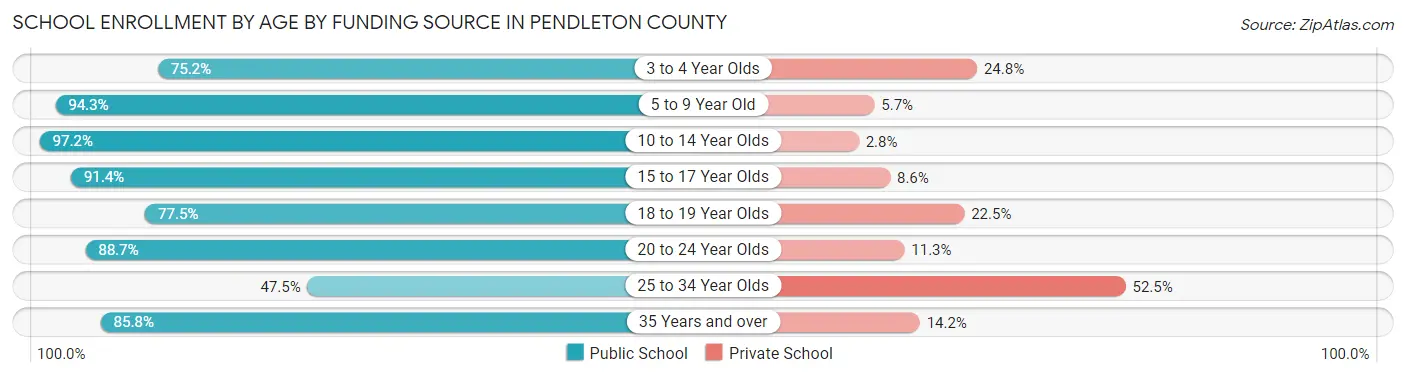
| Age Bracket | Public School | Private School |
| 3 to 4 Year Olds | 109 (75.2%) | 36 (24.8%) |
| 5 to 9 Year Old | 692 (94.3%) | 42 (5.7%) |
| 10 to 14 Year Olds | 1,112 (97.2%) | 32 (2.8%) |
| 15 to 17 Year Olds | 593 (91.4%) | 56 (8.6%) |
| 18 to 19 Year Olds | 183 (77.5%) | 53 (22.5%) |
| 20 to 24 Year Olds | 149 (88.7%) | 19 (11.3%) |
| 25 to 34 Year Olds | 38 (47.5%) | 42 (52.5%) |
| 35 Years and over | 97 (85.8%) | 16 (14.2%) |
| Total | 2,972 (90.9%) | 297 (9.1%) |
Educational Attainment by Field of Study in Pendleton County
Education (526 | 28.8%), business (297 | 16.3%), science & technology (193 | 10.6%), arts & humanities (173 | 9.5%), and bio, nature & agricultural (109 | 6.0%) are the most common fields of study among 1,825 individuals in Pendleton County who have obtained a bachelor's degree or higher.
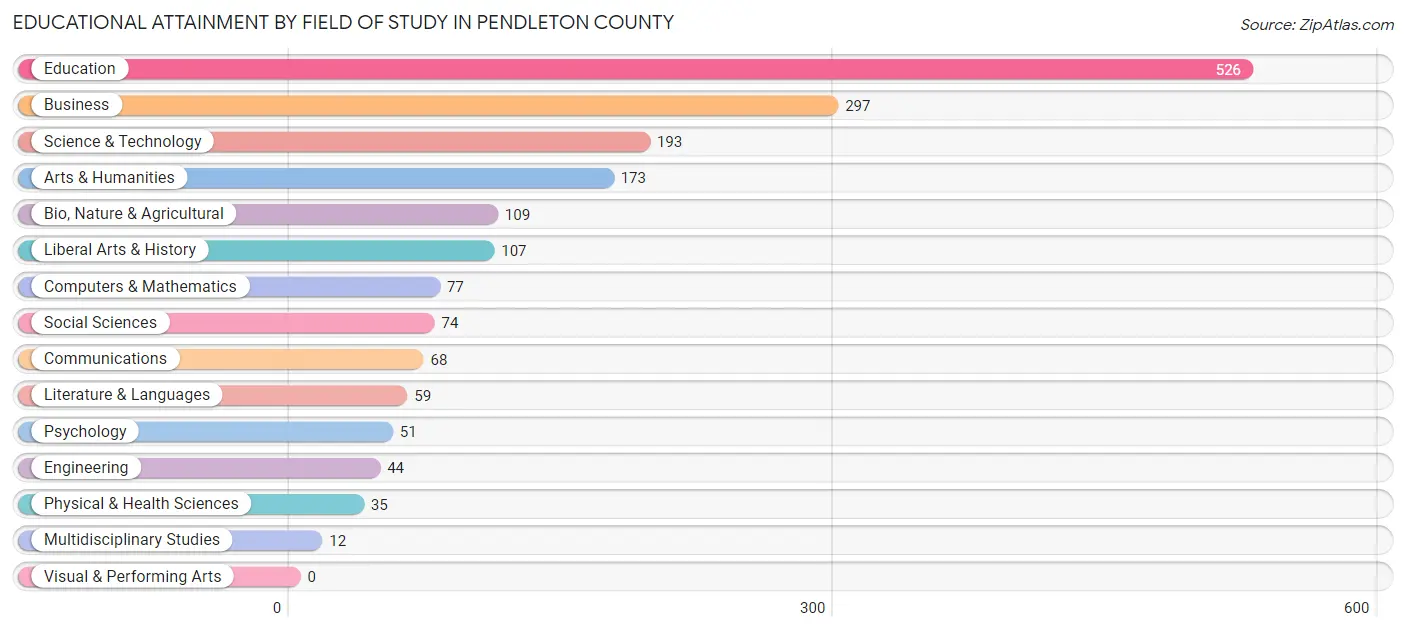
| Field of Study | # Graduates | % Graduates |
| Computers & Mathematics | 77 | 4.2% |
| Bio, Nature & Agricultural | 109 | 6.0% |
| Physical & Health Sciences | 35 | 1.9% |
| Psychology | 51 | 2.8% |
| Social Sciences | 74 | 4.1% |
| Engineering | 44 | 2.4% |
| Multidisciplinary Studies | 12 | 0.7% |
| Science & Technology | 193 | 10.6% |
| Business | 297 | 16.3% |
| Education | 526 | 28.8% |
| Literature & Languages | 59 | 3.2% |
| Liberal Arts & History | 107 | 5.9% |
| Visual & Performing Arts | 0 | 0.0% |
| Communications | 68 | 3.7% |
| Arts & Humanities | 173 | 9.5% |
| Total | 1,825 | 100.0% |
Transportation & Commute in Pendleton County
Vehicle Availability by Sex in Pendleton County
The most prevalent vehicle ownership categories in Pendleton County are males with 2 vehicles (1,103, accounting for 31.8%) and females with 2 vehicles (943, making up 36.1%).
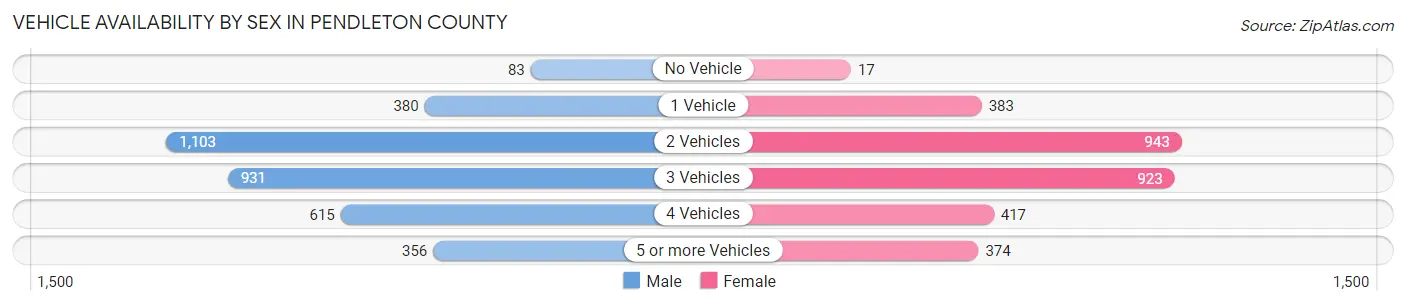
| Vehicles Available | Male | Female |
| No Vehicle | 83 (2.4%) | 17 (0.6%) |
| 1 Vehicle | 380 (11.0%) | 383 (12.5%) |
| 2 Vehicles | 1,103 (31.8%) | 943 (30.8%) |
| 3 Vehicles | 931 (26.9%) | 923 (30.2%) |
| 4 Vehicles | 615 (17.7%) | 417 (13.6%) |
| 5 or more Vehicles | 356 (10.3%) | 374 (12.2%) |
| Total | 3,468 (100.0%) | 3,057 (100.0%) |
Commute Time in Pendleton County
The most frequently occuring commute durations in Pendleton County are 45 to 59 minutes (1,444 commuters, 23.0%), 30 to 34 minutes (857 commuters, 13.7%), and 60 to 89 minutes (756 commuters, 12.0%).
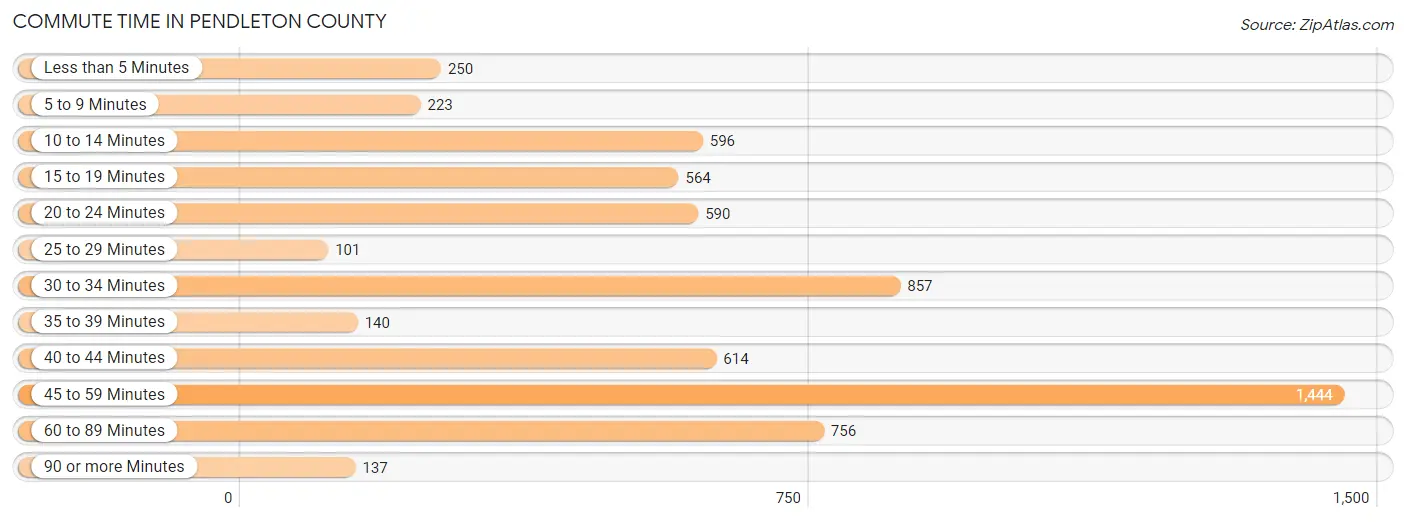
| Commute Time | # Commuters | % Commuters |
| Less than 5 Minutes | 250 | 4.0% |
| 5 to 9 Minutes | 223 | 3.6% |
| 10 to 14 Minutes | 596 | 9.5% |
| 15 to 19 Minutes | 564 | 9.0% |
| 20 to 24 Minutes | 590 | 9.4% |
| 25 to 29 Minutes | 101 | 1.6% |
| 30 to 34 Minutes | 857 | 13.7% |
| 35 to 39 Minutes | 140 | 2.2% |
| 40 to 44 Minutes | 614 | 9.8% |
| 45 to 59 Minutes | 1,444 | 23.0% |
| 60 to 89 Minutes | 756 | 12.0% |
| 90 or more Minutes | 137 | 2.2% |
Commute Time by Sex in Pendleton County
The most common commute times in Pendleton County are 45 to 59 minutes (816 commuters, 23.4%) for males and 45 to 59 minutes (628 commuters, 22.5%) for females.
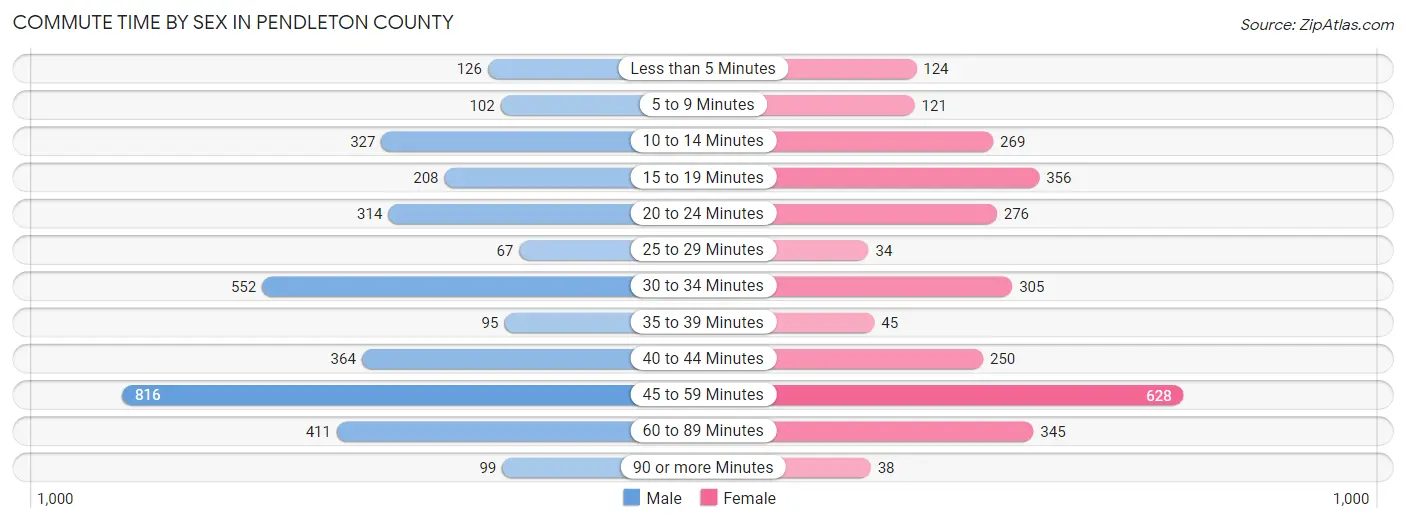
| Commute Time | Male | Female |
| Less than 5 Minutes | 126 (3.6%) | 124 (4.4%) |
| 5 to 9 Minutes | 102 (2.9%) | 121 (4.3%) |
| 10 to 14 Minutes | 327 (9.4%) | 269 (9.6%) |
| 15 to 19 Minutes | 208 (6.0%) | 356 (12.8%) |
| 20 to 24 Minutes | 314 (9.0%) | 276 (9.9%) |
| 25 to 29 Minutes | 67 (1.9%) | 34 (1.2%) |
| 30 to 34 Minutes | 552 (15.9%) | 305 (10.9%) |
| 35 to 39 Minutes | 95 (2.7%) | 45 (1.6%) |
| 40 to 44 Minutes | 364 (10.5%) | 250 (9.0%) |
| 45 to 59 Minutes | 816 (23.4%) | 628 (22.5%) |
| 60 to 89 Minutes | 411 (11.8%) | 345 (12.4%) |
| 90 or more Minutes | 99 (2.8%) | 38 (1.4%) |
Time of Departure to Work by Sex in Pendleton County
The most frequent times of departure to work in Pendleton County are 7:00 AM to 7:29 AM (604, 17.3%) for males and 7:30 AM to 7:59 AM (435, 15.6%) for females.
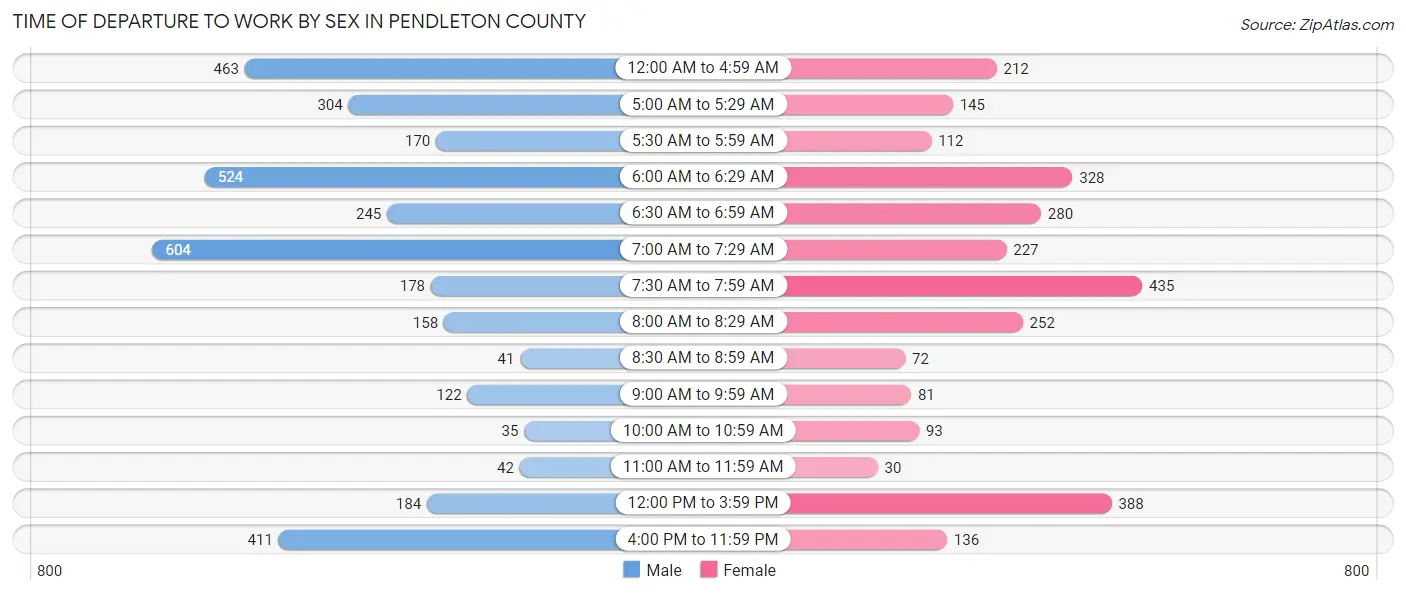
| Time of Departure | Male | Female |
| 12:00 AM to 4:59 AM | 463 (13.3%) | 212 (7.6%) |
| 5:00 AM to 5:29 AM | 304 (8.7%) | 145 (5.2%) |
| 5:30 AM to 5:59 AM | 170 (4.9%) | 112 (4.0%) |
| 6:00 AM to 6:29 AM | 524 (15.0%) | 328 (11.7%) |
| 6:30 AM to 6:59 AM | 245 (7.0%) | 280 (10.0%) |
| 7:00 AM to 7:29 AM | 604 (17.3%) | 227 (8.1%) |
| 7:30 AM to 7:59 AM | 178 (5.1%) | 435 (15.6%) |
| 8:00 AM to 8:29 AM | 158 (4.5%) | 252 (9.0%) |
| 8:30 AM to 8:59 AM | 41 (1.2%) | 72 (2.6%) |
| 9:00 AM to 9:59 AM | 122 (3.5%) | 81 (2.9%) |
| 10:00 AM to 10:59 AM | 35 (1.0%) | 93 (3.3%) |
| 11:00 AM to 11:59 AM | 42 (1.2%) | 30 (1.1%) |
| 12:00 PM to 3:59 PM | 184 (5.3%) | 388 (13.9%) |
| 4:00 PM to 11:59 PM | 411 (11.8%) | 136 (4.9%) |
| Total | 3,481 (100.0%) | 2,791 (100.0%) |
Housing Occupancy in Pendleton County
Occupancy by Ownership in Pendleton County
Of the total 5,270 dwellings in Pendleton County, owner-occupied units account for 3,880 (73.6%), while renter-occupied units make up 1,390 (26.4%).
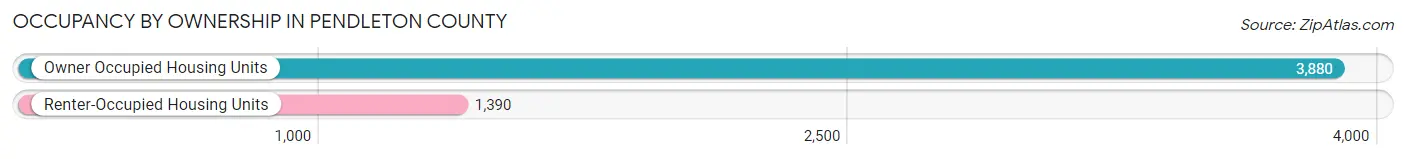
| Occupancy | # Housing Units | % Housing Units |
| Owner Occupied Housing Units | 3,880 | 73.6% |
| Renter-Occupied Housing Units | 1,390 | 26.4% |
| Total Occupied Housing Units | 5,270 | 100.0% |
Occupancy by Household Size in Pendleton County
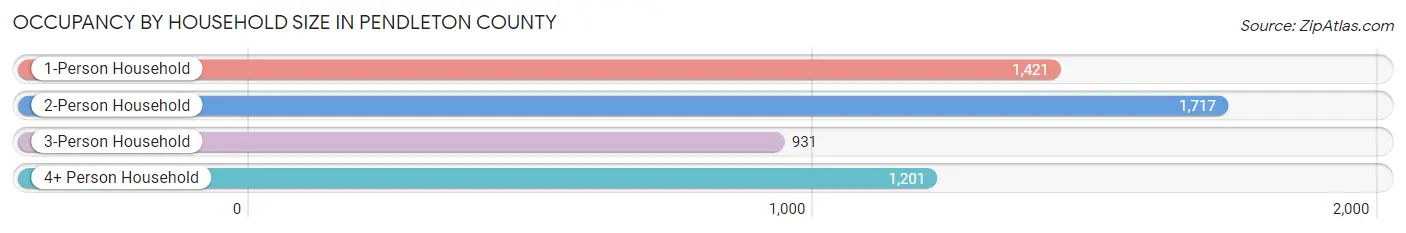
| Household Size | # Housing Units | % Housing Units |
| 1-Person Household | 1,421 | 27.0% |
| 2-Person Household | 1,717 | 32.6% |
| 3-Person Household | 931 | 17.7% |
| 4+ Person Household | 1,201 | 22.8% |
| Total Housing Units | 5,270 | 100.0% |
Occupancy by Ownership by Household Size in Pendleton County
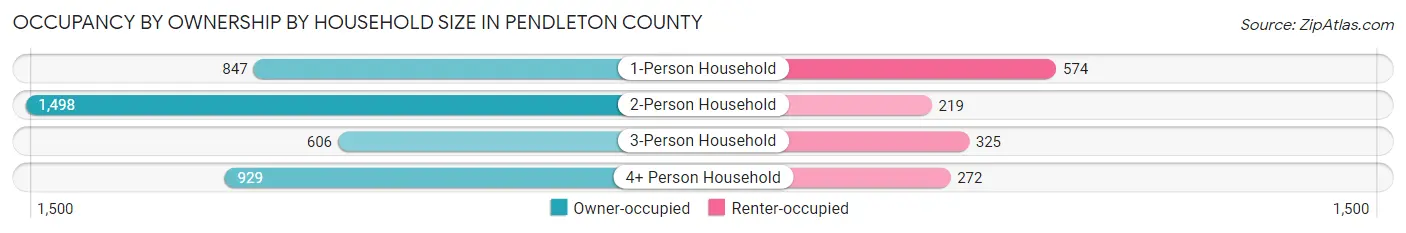
| Household Size | Owner-occupied | Renter-occupied |
| 1-Person Household | 847 (59.6%) | 574 (40.4%) |
| 2-Person Household | 1,498 (87.3%) | 219 (12.8%) |
| 3-Person Household | 606 (65.1%) | 325 (34.9%) |
| 4+ Person Household | 929 (77.3%) | 272 (22.7%) |
| Total Housing Units | 3,880 (73.6%) | 1,390 (26.4%) |
Occupancy by Educational Attainment in Pendleton County
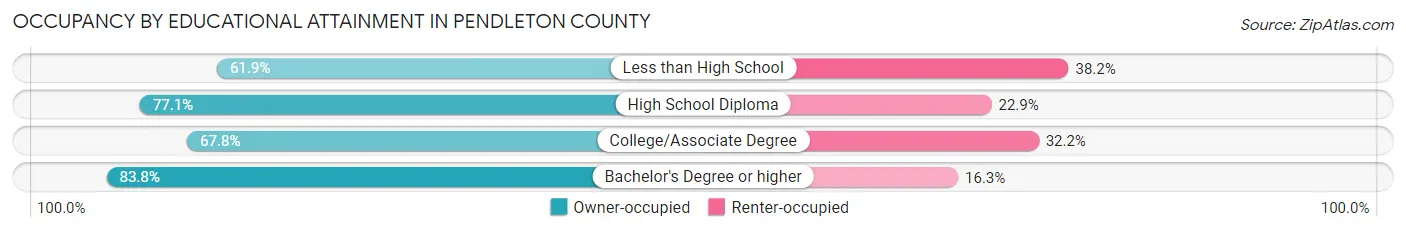
| Household Size | Owner-occupied | Renter-occupied |
| Less than High School | 488 (61.9%) | 301 (38.2%) |
| High School Diploma | 1,760 (77.1%) | 522 (22.9%) |
| College/Associate Degree | 890 (67.8%) | 423 (32.2%) |
| Bachelor's Degree or higher | 742 (83.8%) | 144 (16.3%) |
Occupancy by Age of Householder in Pendleton County
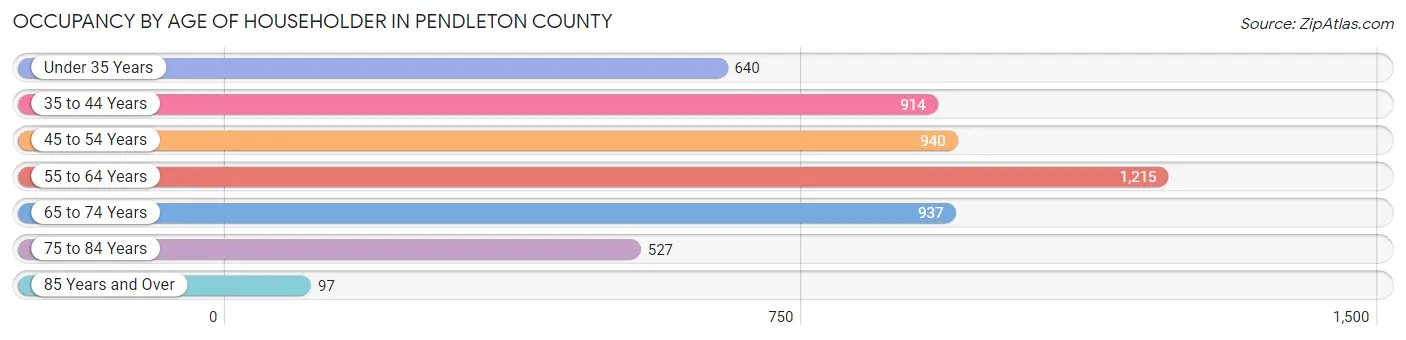
| Age Bracket | # Households | % Households |
| Under 35 Years | 640 | 12.1% |
| 35 to 44 Years | 914 | 17.3% |
| 45 to 54 Years | 940 | 17.8% |
| 55 to 64 Years | 1,215 | 23.1% |
| 65 to 74 Years | 937 | 17.8% |
| 75 to 84 Years | 527 | 10.0% |
| 85 Years and Over | 97 | 1.8% |
| Total | 5,270 | 100.0% |
Housing Finances in Pendleton County
Median Income by Occupancy in Pendleton County
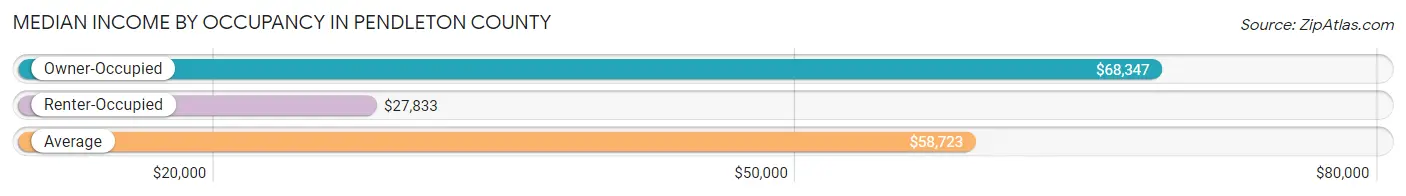
| Occupancy Type | # Households | Median Income |
| Owner-Occupied | 3,880 (73.6%) | $68,347 |
| Renter-Occupied | 1,390 (26.4%) | $27,833 |
| Average | 5,270 (100.0%) | $58,723 |
Occupancy by Householder Income Bracket in Pendleton County
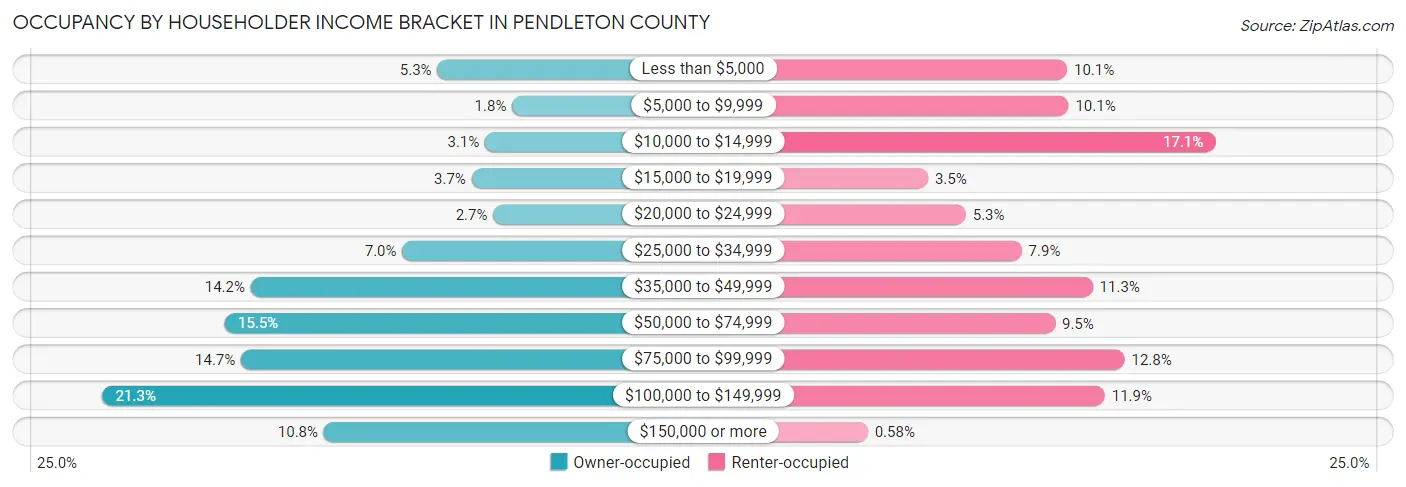
| Income Bracket | Owner-occupied | Renter-occupied |
| Less than $5,000 | 207 (5.3%) | 140 (10.1%) |
| $5,000 to $9,999 | 69 (1.8%) | 141 (10.1%) |
| $10,000 to $14,999 | 119 (3.1%) | 238 (17.1%) |
| $15,000 to $19,999 | 144 (3.7%) | 48 (3.5%) |
| $20,000 to $24,999 | 104 (2.7%) | 73 (5.2%) |
| $25,000 to $34,999 | 272 (7.0%) | 110 (7.9%) |
| $35,000 to $49,999 | 552 (14.2%) | 157 (11.3%) |
| $50,000 to $74,999 | 600 (15.5%) | 132 (9.5%) |
| $75,000 to $99,999 | 570 (14.7%) | 178 (12.8%) |
| $100,000 to $149,999 | 826 (21.3%) | 165 (11.9%) |
| $150,000 or more | 417 (10.7%) | 8 (0.6%) |
| Total | 3,880 (100.0%) | 1,390 (100.0%) |
Monthly Housing Cost Tiers in Pendleton County
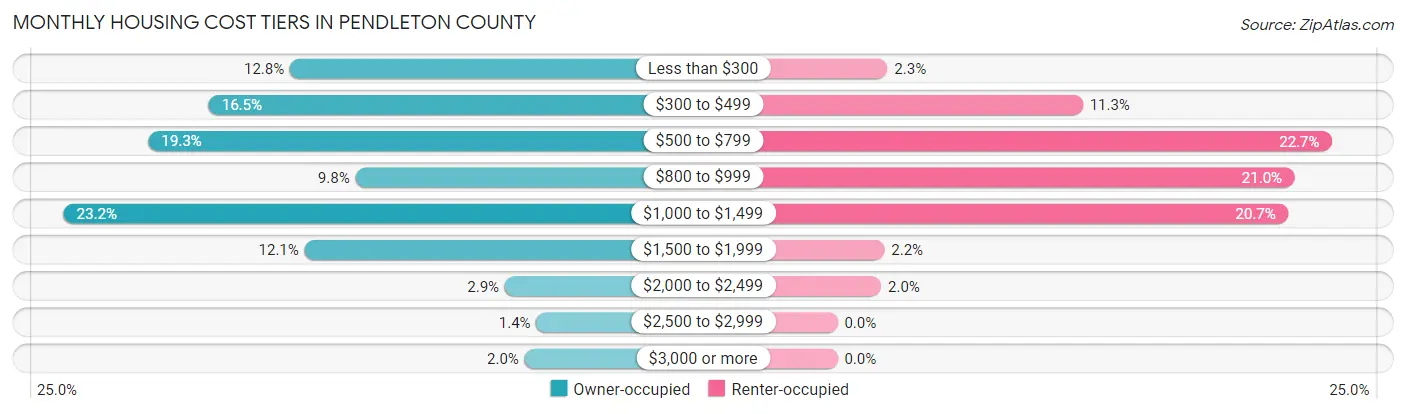
| Monthly Cost | Owner-occupied | Renter-occupied |
| Less than $300 | 496 (12.8%) | 32 (2.3%) |
| $300 to $499 | 641 (16.5%) | 157 (11.3%) |
| $500 to $799 | 749 (19.3%) | 316 (22.7%) |
| $800 to $999 | 379 (9.8%) | 292 (21.0%) |
| $1,000 to $1,499 | 900 (23.2%) | 288 (20.7%) |
| $1,500 to $1,999 | 470 (12.1%) | 30 (2.2%) |
| $2,000 to $2,499 | 112 (2.9%) | 28 (2.0%) |
| $2,500 to $2,999 | 56 (1.4%) | 0 (0.0%) |
| $3,000 or more | 77 (2.0%) | 0 (0.0%) |
| Total | 3,880 (100.0%) | 1,390 (100.0%) |
Physical Housing Characteristics in Pendleton County
Housing Structures in Pendleton County
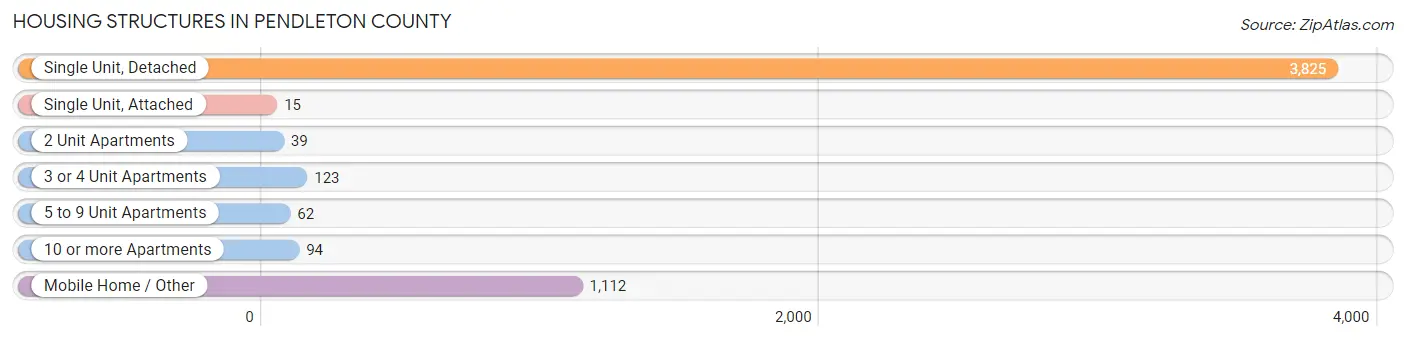
| Structure Type | # Housing Units | % Housing Units |
| Single Unit, Detached | 3,825 | 72.6% |
| Single Unit, Attached | 15 | 0.3% |
| 2 Unit Apartments | 39 | 0.7% |
| 3 or 4 Unit Apartments | 123 | 2.3% |
| 5 to 9 Unit Apartments | 62 | 1.2% |
| 10 or more Apartments | 94 | 1.8% |
| Mobile Home / Other | 1,112 | 21.1% |
| Total | 5,270 | 100.0% |
Housing Structures by Occupancy in Pendleton County
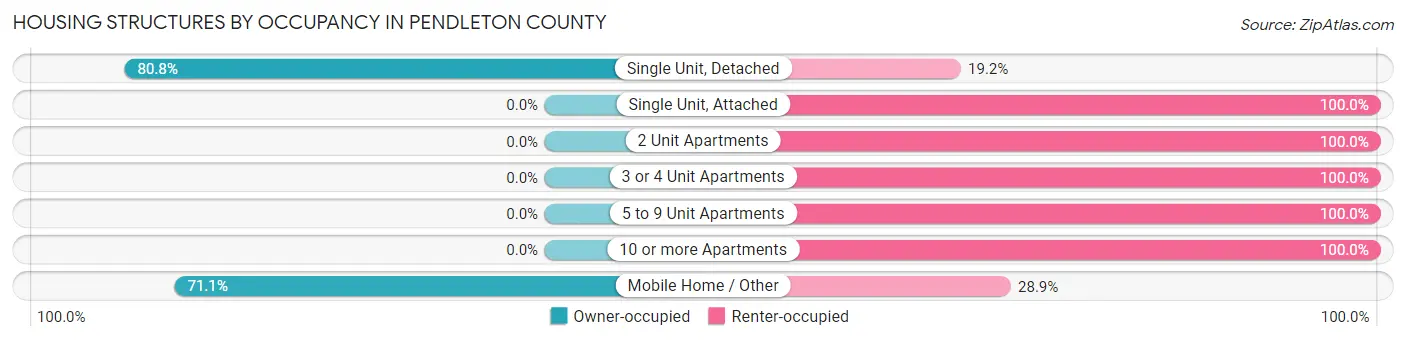
| Structure Type | Owner-occupied | Renter-occupied |
| Single Unit, Detached | 3,089 (80.8%) | 736 (19.2%) |
| Single Unit, Attached | 0 (0.0%) | 15 (100.0%) |
| 2 Unit Apartments | 0 (0.0%) | 39 (100.0%) |
| 3 or 4 Unit Apartments | 0 (0.0%) | 123 (100.0%) |
| 5 to 9 Unit Apartments | 0 (0.0%) | 62 (100.0%) |
| 10 or more Apartments | 0 (0.0%) | 94 (100.0%) |
| Mobile Home / Other | 791 (71.1%) | 321 (28.9%) |
| Total | 3,880 (73.6%) | 1,390 (26.4%) |
Housing Structures by Number of Rooms in Pendleton County
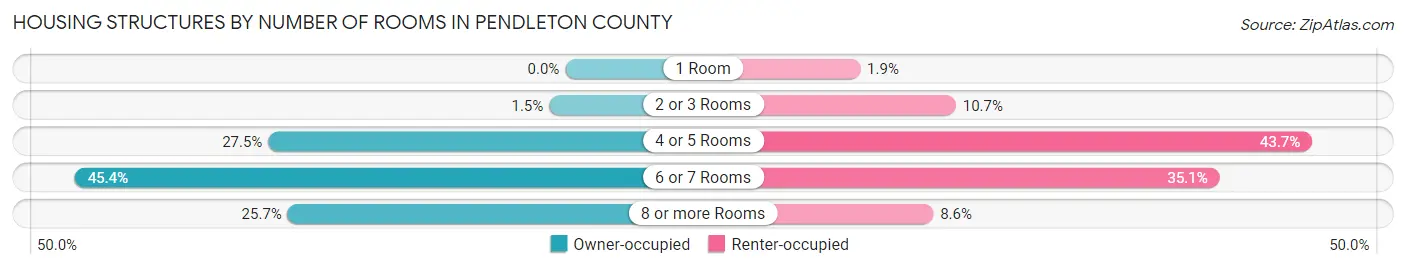
| Number of Rooms | Owner-occupied | Renter-occupied |
| 1 Room | 0 (0.0%) | 26 (1.9%) |
| 2 or 3 Rooms | 58 (1.5%) | 149 (10.7%) |
| 4 or 5 Rooms | 1,066 (27.5%) | 607 (43.7%) |
| 6 or 7 Rooms | 1,760 (45.4%) | 488 (35.1%) |
| 8 or more Rooms | 996 (25.7%) | 120 (8.6%) |
| Total | 3,880 (100.0%) | 1,390 (100.0%) |
Housing Structure by Heating Type in Pendleton County
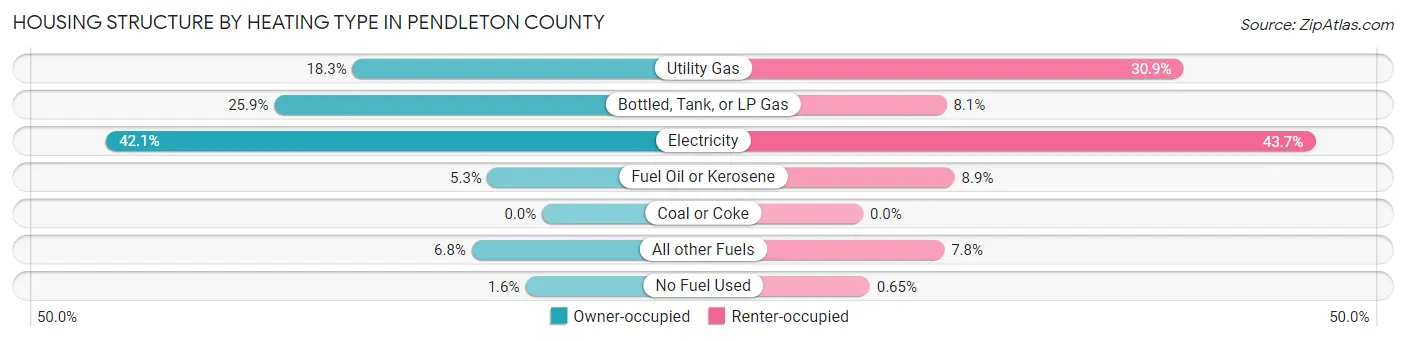
| Heating Type | Owner-occupied | Renter-occupied |
| Utility Gas | 711 (18.3%) | 430 (30.9%) |
| Bottled, Tank, or LP Gas | 1,004 (25.9%) | 112 (8.1%) |
| Electricity | 1,634 (42.1%) | 607 (43.7%) |
| Fuel Oil or Kerosene | 204 (5.3%) | 123 (8.8%) |
| Coal or Coke | 0 (0.0%) | 0 (0.0%) |
| All other Fuels | 264 (6.8%) | 109 (7.8%) |
| No Fuel Used | 63 (1.6%) | 9 (0.6%) |
| Total | 3,880 (100.0%) | 1,390 (100.0%) |
Household Vehicle Usage in Pendleton County
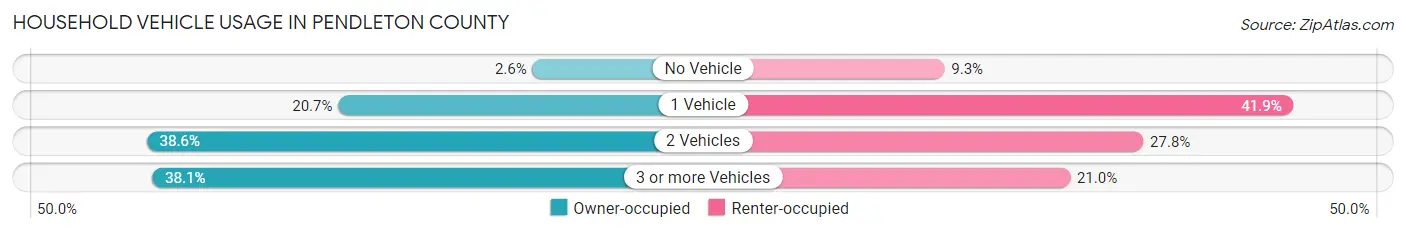
| Vehicles per Household | Owner-occupied | Renter-occupied |
| No Vehicle | 100 (2.6%) | 129 (9.3%) |
| 1 Vehicle | 804 (20.7%) | 582 (41.9%) |
| 2 Vehicles | 1,498 (38.6%) | 387 (27.8%) |
| 3 or more Vehicles | 1,478 (38.1%) | 292 (21.0%) |
| Total | 3,880 (100.0%) | 1,390 (100.0%) |
Real Estate & Mortgages in Pendleton County
Real Estate and Mortgage Overview in Pendleton County
| Characteristic | Without Mortgage | With Mortgage |
| Housing Units | 1,867 | 2,013 |
| Median Property Value | $109,300 | $169,700 |
| Median Household Income | $49,382 | $294 |
| Monthly Housing Costs | $447 | $56 |
| Real Estate Taxes | $942 | $54 |
Property Value by Mortgage Status in Pendleton County
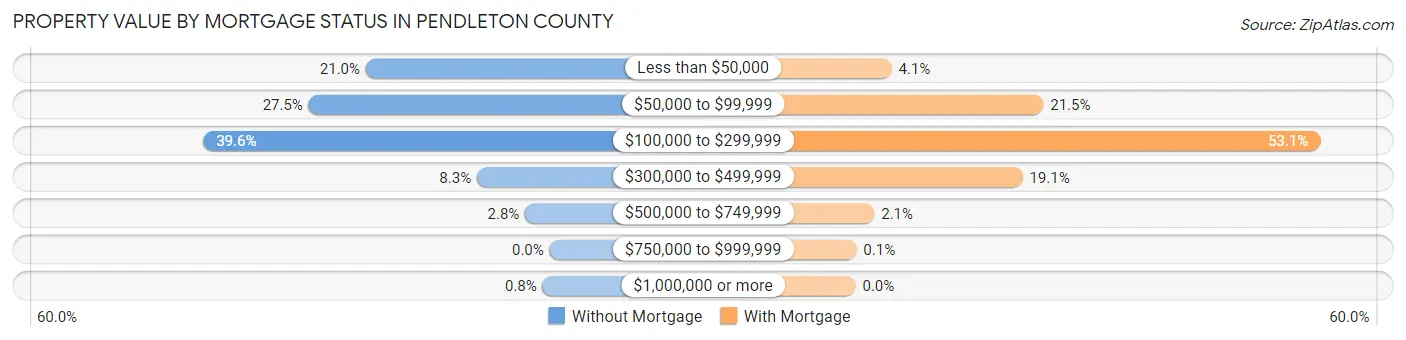
| Property Value | Without Mortgage | With Mortgage |
| Less than $50,000 | 392 (21.0%) | 83 (4.1%) |
| $50,000 to $99,999 | 514 (27.5%) | 432 (21.5%) |
| $100,000 to $299,999 | 739 (39.6%) | 1,069 (53.1%) |
| $300,000 to $499,999 | 155 (8.3%) | 384 (19.1%) |
| $500,000 to $749,999 | 52 (2.8%) | 43 (2.1%) |
| $750,000 to $999,999 | 0 (0.0%) | 2 (0.1%) |
| $1,000,000 or more | 15 (0.8%) | 0 (0.0%) |
| Total | 1,867 (100.0%) | 2,013 (100.0%) |
Household Income by Mortgage Status in Pendleton County
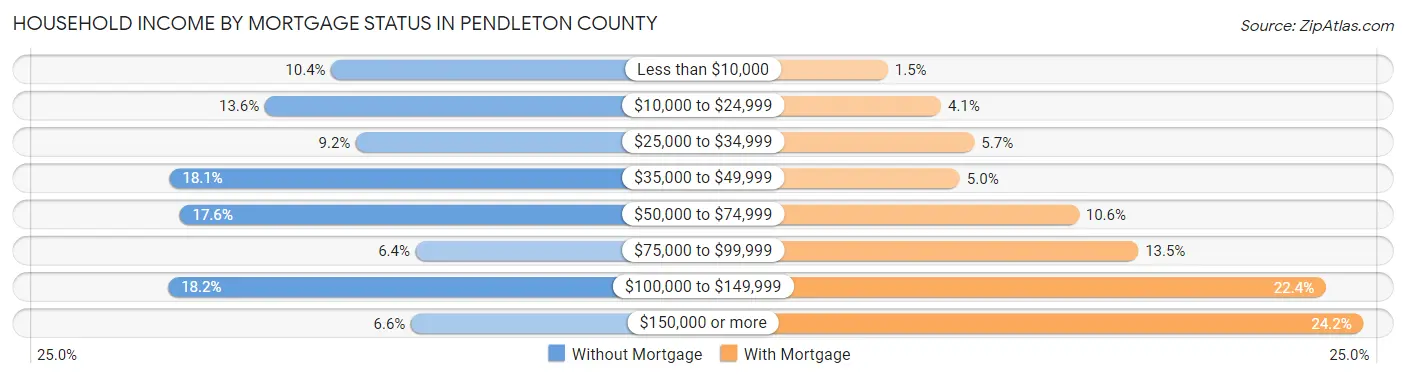
| Household Income | Without Mortgage | With Mortgage |
| Less than $10,000 | 194 (10.4%) | 31 (1.5%) |
| $10,000 to $24,999 | 253 (13.6%) | 82 (4.1%) |
| $25,000 to $34,999 | 172 (9.2%) | 114 (5.7%) |
| $35,000 to $49,999 | 338 (18.1%) | 100 (5.0%) |
| $50,000 to $74,999 | 329 (17.6%) | 214 (10.6%) |
| $75,000 to $99,999 | 119 (6.4%) | 271 (13.5%) |
| $100,000 to $149,999 | 339 (18.2%) | 451 (22.4%) |
| $150,000 or more | 123 (6.6%) | 487 (24.2%) |
| Total | 1,867 (100.0%) | 2,013 (100.0%) |
Property Value to Household Income Ratio in Pendleton County
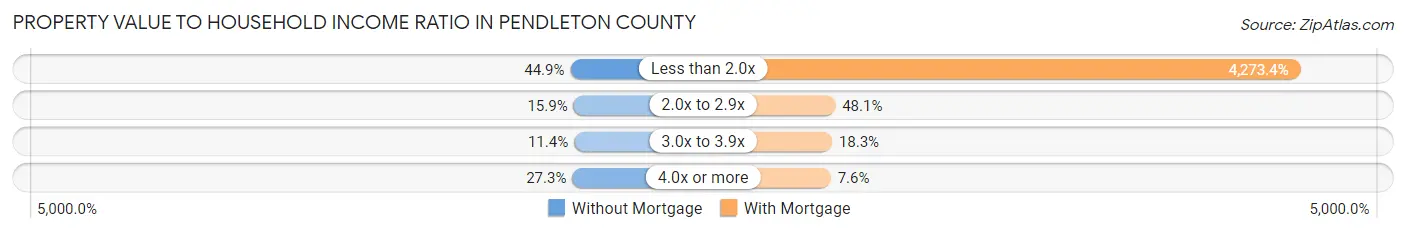
| Value-to-Income Ratio | Without Mortgage | With Mortgage |
| Less than 2.0x | 838 (44.9%) | 86,024 (4,273.4%) |
| 2.0x to 2.9x | 296 (15.9%) | 969 (48.1%) |
| 3.0x to 3.9x | 213 (11.4%) | 369 (18.3%) |
| 4.0x or more | 509 (27.3%) | 152 (7.5%) |
| Total | 1,867 (100.0%) | 2,013 (100.0%) |
Real Estate Taxes by Mortgage Status in Pendleton County
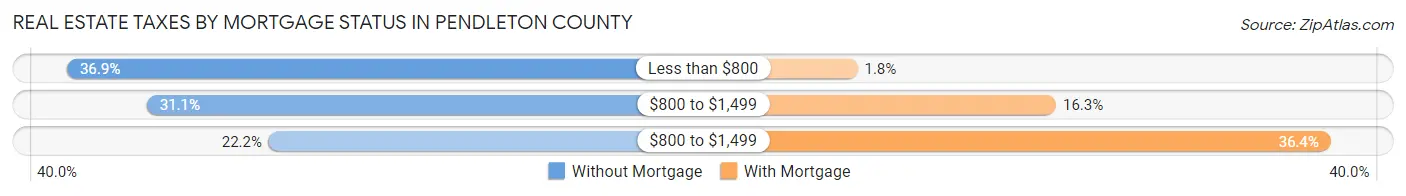
| Property Taxes | Without Mortgage | With Mortgage |
| Less than $800 | 689 (36.9%) | 36 (1.8%) |
| $800 to $1,499 | 580 (31.1%) | 328 (16.3%) |
| $800 to $1,499 | 415 (22.2%) | 732 (36.4%) |
| Total | 1,867 (100.0%) | 2,013 (100.0%) |
Health & Disability in Pendleton County
Health Insurance Coverage by Age in Pendleton County
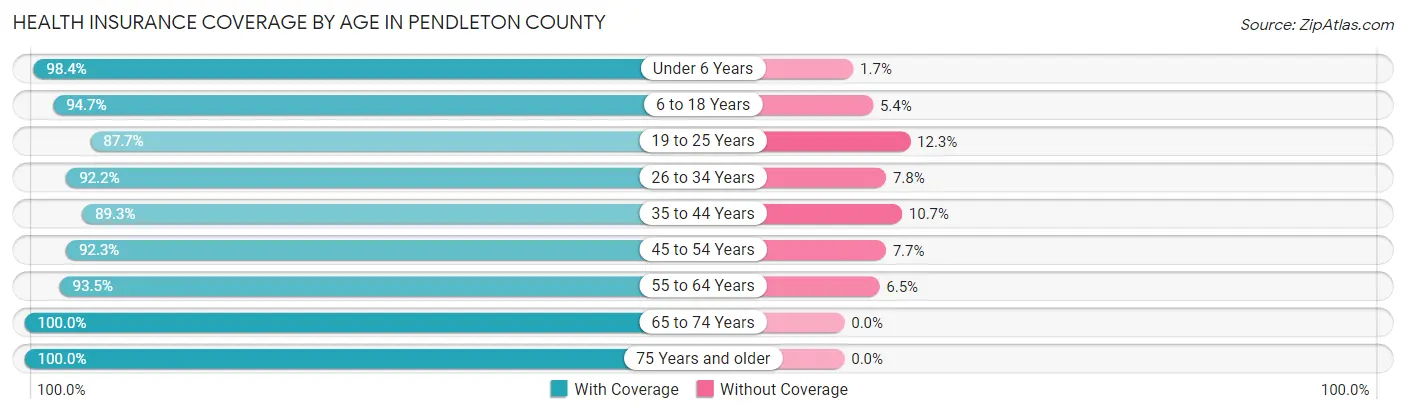
| Age Bracket | With Coverage | Without Coverage |
| Under 6 Years | 1,130 (98.4%) | 19 (1.7%) |
| 6 to 18 Years | 2,406 (94.7%) | 136 (5.3%) |
| 19 to 25 Years | 915 (87.7%) | 128 (12.3%) |
| 26 to 34 Years | 1,460 (92.2%) | 123 (7.8%) |
| 35 to 44 Years | 1,448 (89.3%) | 174 (10.7%) |
| 45 to 54 Years | 1,854 (92.3%) | 155 (7.7%) |
| 55 to 64 Years | 2,086 (93.5%) | 146 (6.5%) |
| 65 to 74 Years | 1,532 (100.0%) | 0 (0.0%) |
| 75 Years and older | 834 (100.0%) | 0 (0.0%) |
| Total | 13,665 (93.9%) | 881 (6.1%) |
Health Insurance Coverage by Citizenship Status in Pendleton County
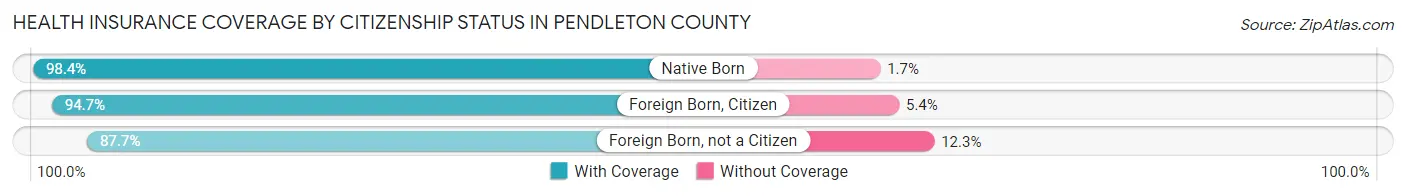
| Citizenship Status | With Coverage | Without Coverage |
| Native Born | 1,130 (98.4%) | 19 (1.7%) |
| Foreign Born, Citizen | 2,406 (94.7%) | 136 (5.3%) |
| Foreign Born, not a Citizen | 915 (87.7%) | 128 (12.3%) |
Health Insurance Coverage by Household Income in Pendleton County
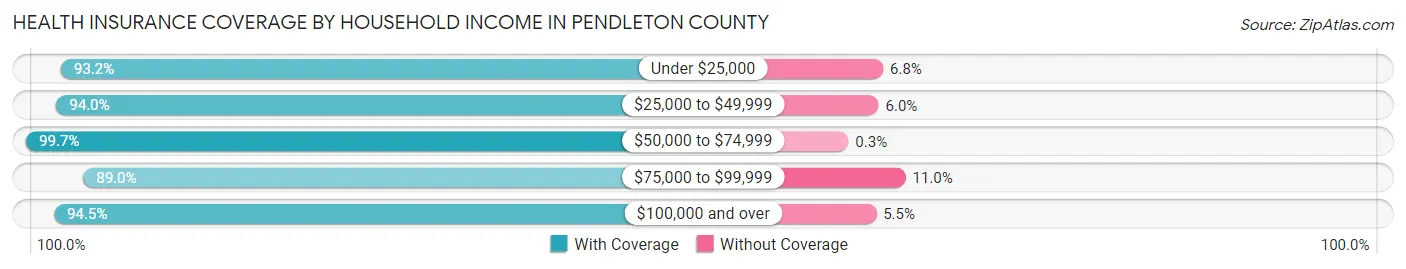
| Household Income | With Coverage | Without Coverage |
| Under $25,000 | 2,082 (93.2%) | 152 (6.8%) |
| $25,000 to $49,999 | 2,305 (94.0%) | 146 (6.0%) |
| $50,000 to $74,999 | 1,970 (99.7%) | 6 (0.3%) |
| $75,000 to $99,999 | 2,152 (89.0%) | 266 (11.0%) |
| $100,000 and over | 4,994 (94.5%) | 291 (5.5%) |
Public vs Private Health Insurance Coverage by Age in Pendleton County
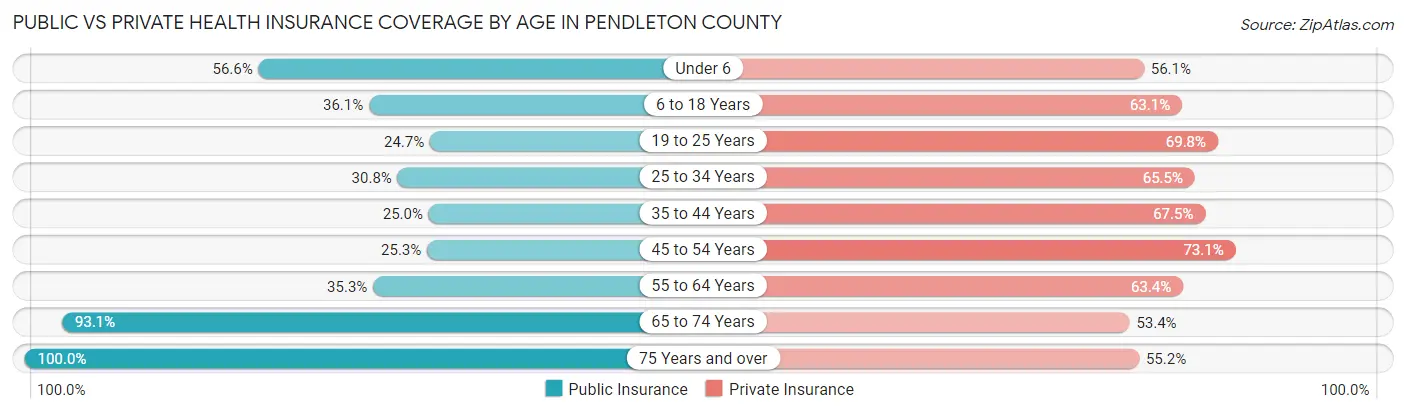
| Age Bracket | Public Insurance | Private Insurance |
| Under 6 | 650 (56.6%) | 644 (56.0%) |
| 6 to 18 Years | 917 (36.1%) | 1,605 (63.1%) |
| 19 to 25 Years | 258 (24.7%) | 728 (69.8%) |
| 25 to 34 Years | 487 (30.8%) | 1,037 (65.5%) |
| 35 to 44 Years | 405 (25.0%) | 1,094 (67.4%) |
| 45 to 54 Years | 508 (25.3%) | 1,468 (73.1%) |
| 55 to 64 Years | 788 (35.3%) | 1,414 (63.3%) |
| 65 to 74 Years | 1,426 (93.1%) | 818 (53.4%) |
| 75 Years and over | 834 (100.0%) | 460 (55.2%) |
| Total | 6,273 (43.1%) | 9,268 (63.7%) |
Disability Status by Sex by Age in Pendleton County
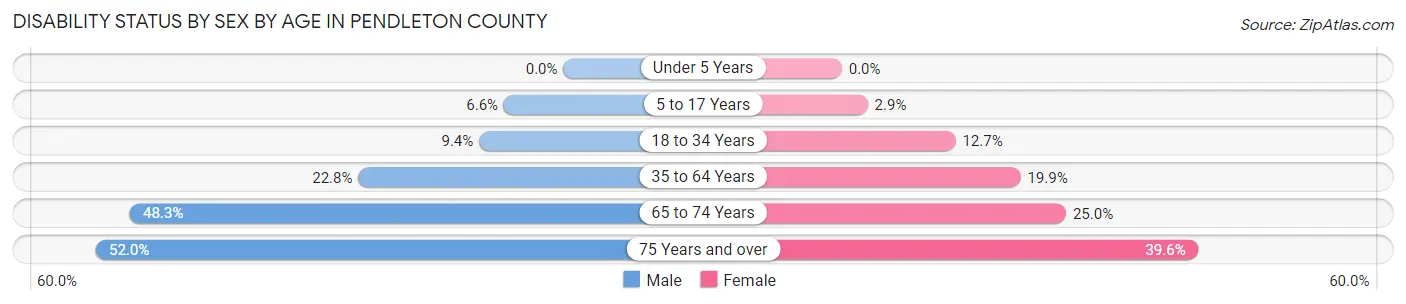
| Age Bracket | Male | Female |
| Under 5 Years | 0 (0.0%) | 0 (0.0%) |
| 5 to 17 Years | 92 (6.6%) | 34 (2.9%) |
| 18 to 34 Years | 144 (9.4%) | 170 (12.7%) |
| 35 to 64 Years | 694 (22.8%) | 562 (19.9%) |
| 65 to 74 Years | 372 (48.2%) | 190 (25.0%) |
| 75 Years and over | 191 (52.0%) | 185 (39.6%) |
Disability Class by Sex by Age in Pendleton County
Disability Class: Hearing Difficulty
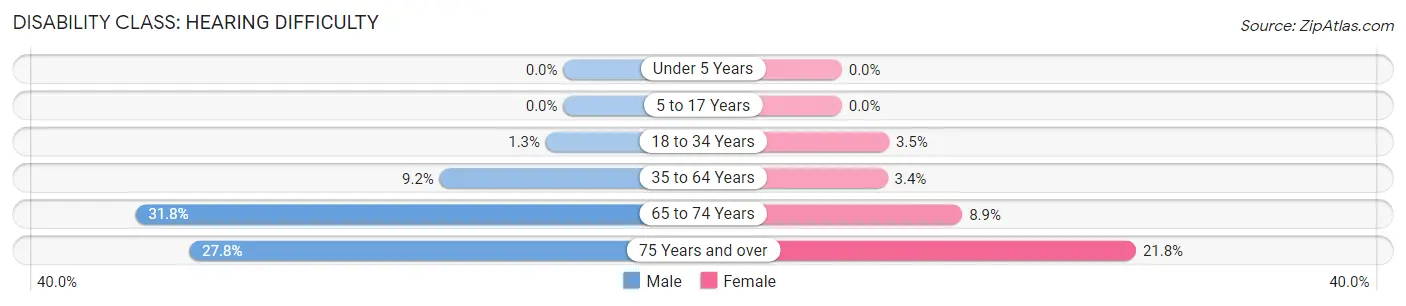
| Age Bracket | Male | Female |
| Under 5 Years | 0 (0.0%) | 0 (0.0%) |
| 5 to 17 Years | 0 (0.0%) | 0 (0.0%) |
| 18 to 34 Years | 20 (1.3%) | 47 (3.5%) |
| 35 to 64 Years | 279 (9.2%) | 96 (3.4%) |
| 65 to 74 Years | 245 (31.8%) | 68 (8.9%) |
| 75 Years and over | 102 (27.8%) | 102 (21.8%) |
Disability Class: Vision Difficulty
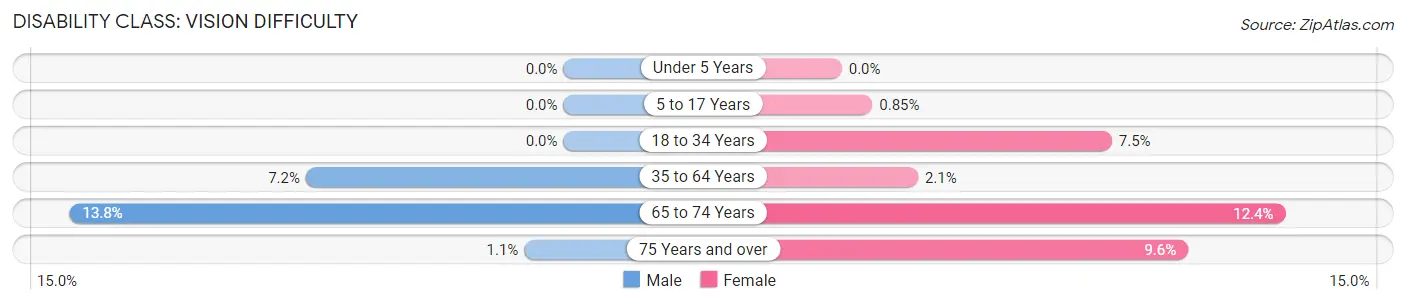
| Age Bracket | Male | Female |
| Under 5 Years | 0 (0.0%) | 0 (0.0%) |
| 5 to 17 Years | 0 (0.0%) | 10 (0.9%) |
| 18 to 34 Years | 0 (0.0%) | 101 (7.5%) |
| 35 to 64 Years | 218 (7.2%) | 60 (2.1%) |
| 65 to 74 Years | 106 (13.8%) | 94 (12.3%) |
| 75 Years and over | 4 (1.1%) | 45 (9.6%) |
Disability Class: Cognitive Difficulty
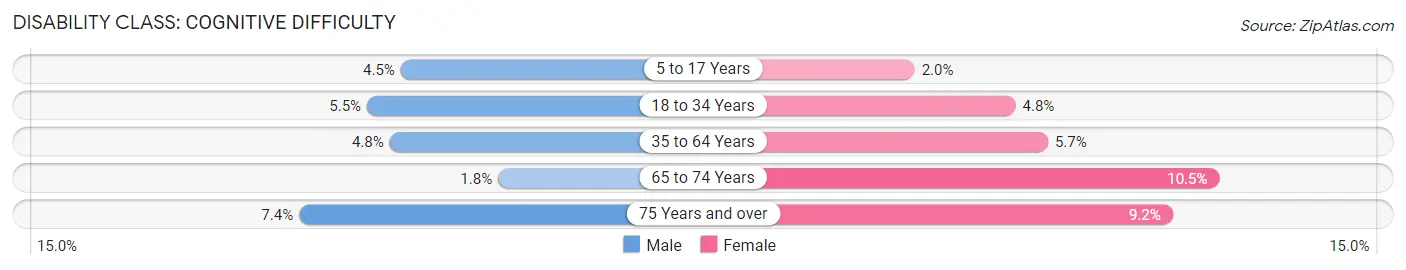
| Age Bracket | Male | Female |
| 5 to 17 Years | 63 (4.5%) | 24 (2.0%) |
| 18 to 34 Years | 84 (5.5%) | 65 (4.8%) |
| 35 to 64 Years | 147 (4.8%) | 162 (5.7%) |
| 65 to 74 Years | 14 (1.8%) | 80 (10.5%) |
| 75 Years and over | 27 (7.4%) | 43 (9.2%) |
Disability Class: Ambulatory Difficulty
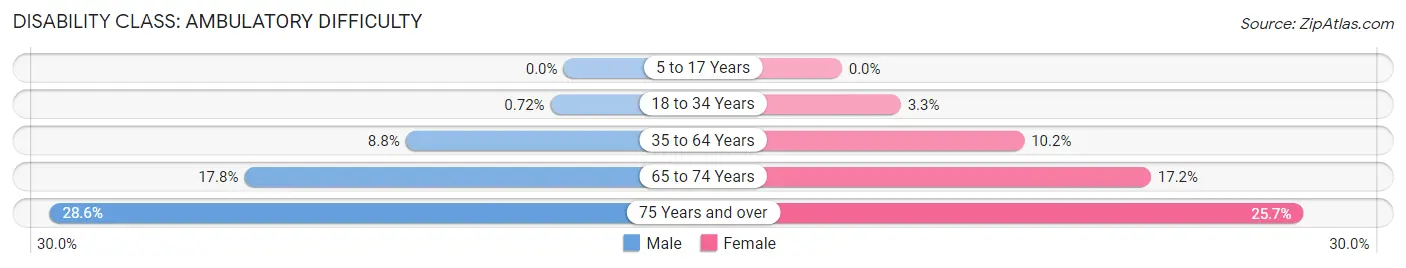
| Age Bracket | Male | Female |
| 5 to 17 Years | 0 (0.0%) | 0 (0.0%) |
| 18 to 34 Years | 11 (0.7%) | 44 (3.3%) |
| 35 to 64 Years | 267 (8.8%) | 287 (10.2%) |
| 65 to 74 Years | 137 (17.8%) | 131 (17.2%) |
| 75 Years and over | 105 (28.6%) | 120 (25.7%) |
Disability Class: Self-Care Difficulty
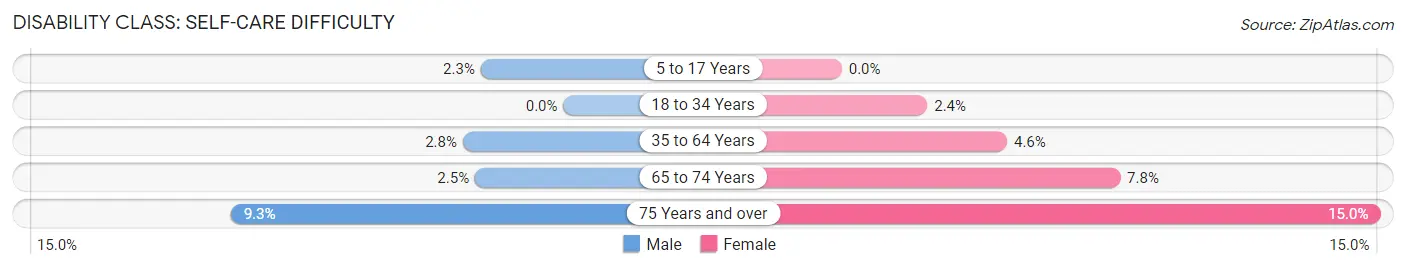
| Age Bracket | Male | Female |
| 5 to 17 Years | 32 (2.3%) | 0 (0.0%) |
| 18 to 34 Years | 0 (0.0%) | 32 (2.4%) |
| 35 to 64 Years | 85 (2.8%) | 130 (4.6%) |
| 65 to 74 Years | 19 (2.5%) | 59 (7.7%) |
| 75 Years and over | 34 (9.3%) | 70 (15.0%) |
Technology Access in Pendleton County
Computing Device Access in Pendleton County
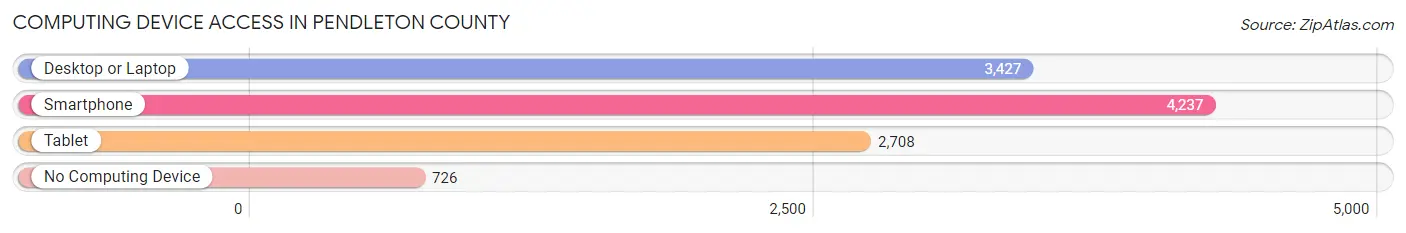
| Device Type | # Households | % Households |
| Desktop or Laptop | 3,427 | 65.0% |
| Smartphone | 4,237 | 80.4% |
| Tablet | 2,708 | 51.4% |
| No Computing Device | 726 | 13.8% |
| Total | 5,270 | 100.0% |
Internet Access in Pendleton County
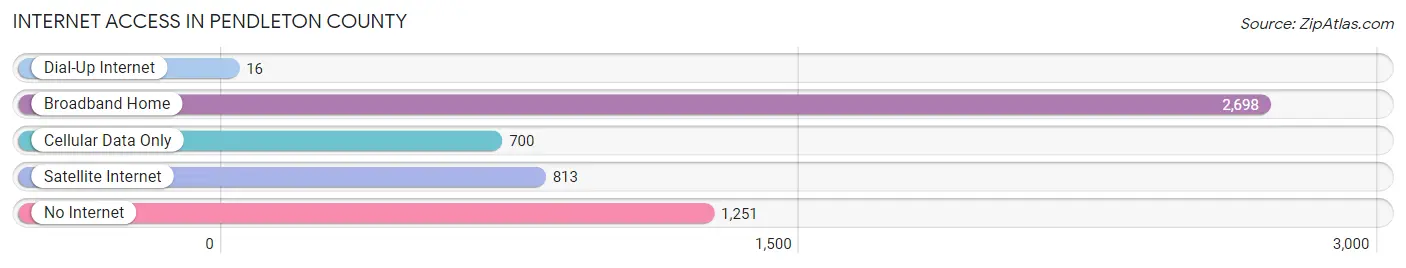
| Internet Type | # Households | % Households |
| Dial-Up Internet | 16 | 0.3% |
| Broadband Home | 2,698 | 51.2% |
| Cellular Data Only | 700 | 13.3% |
| Satellite Internet | 813 | 15.4% |
| No Internet | 1,251 | 23.7% |
| Total | 5,270 | 100.0% |
Pendleton County Summary
Pendleton County is a county located in the U.S. state of Kentucky. As of the 2010 census, the population was 14,877. The county seat is Falmouth. The county was formed in 1798 and is named for Edmund Pendleton, a distinguished Virginia statesman and jurist.
History
Pendleton County was formed in 1798 from parts of Bracken and Mason counties. It was named for Edmund Pendleton, a distinguished Virginia statesman and jurist. The county was originally part of a larger area known as the Northern Neck, which was granted to seven of George Washington's relatives in 1719. The county was divided into two parts in 1818, with the northern part becoming Grant County.
The county was home to several Native American tribes, including the Shawnee, Miami, and Wyandot. The first European settlers arrived in the late 1700s, and the county was officially established in 1798.
Geography
Pendleton County is located in the Bluegrass region of Kentucky. It is bordered by Grant County to the north, Kenton County to the east, Boone County to the south, and Bracken County to the west. The county has a total area of 286 square miles, of which 285 square miles is land and 1 square mile is water.
The county is located in the northern part of the state, and is part of the Cincinnati-Northern Kentucky metropolitan area. The county is mostly rural, with the majority of the population living in small towns and villages.
The county is home to several rivers, including the Licking River, which forms the county's northern border. The county also contains several small lakes, including Lake Pendleton, which is located in the northern part of the county.
Economy
The economy of Pendleton County is largely based on agriculture. The county is home to several large farms, and the majority of the population is employed in the agricultural sector. The county is also home to several small businesses, including a number of restaurants, retail stores, and service providers.
The county is also home to several manufacturing companies, including a large automotive parts manufacturer. The county is also home to several wineries, and is a popular destination for wine enthusiasts.
Demographics
As of the 2010 census, there were 14,877 people, 5,845 households, and 4,093 families living in the county. The population density was 52.3 people per square mile. The racial makeup of the county was 97.3% White, 0.7% African American, 0.2% Native American, 0.2% Asian, 0.1% Pacific Islander, 0.5% from other races, and 1.1% from two or more races. Hispanic or Latino of any race were 1.3% of the population.
The median income for a household in the county was $41,945, and the median income for a family was $50,945. The per capita income for the county was $20,945. About 11.2% of families and 14.2% of the population were below the poverty line, including 19.2% of those under age 18 and 11.2% of those age 65 or over.
Common Questions
What is Per Capita Income in Pendleton County?
Per Capita income in Pendleton County is $28,919.
What is the Median Family Income in Pendleton County?
Median Family Income in Pendleton County is $75,687.
What is the Median Household income in Pendleton County?
Median Household Income in Pendleton County is $58,723.
What is Income or Wage Gap in Pendleton County?
Income or Wage Gap in Pendleton County is 29.2%.
Women in Pendleton County earn 70.8 cents for every dollar earned by a man.
What is Inequality or Gini Index in Pendleton County?
Inequality or Gini Index in Pendleton County is 0.46.
What is the Total Population of Pendleton County?
Total Population of Pendleton County is 14,638.
What is the Total Male Population of Pendleton County?
Total Male Population of Pendleton County is 7,588.
What is the Total Female Population of Pendleton County?
Total Female Population of Pendleton County is 7,050.
What is the Ratio of Males per 100 Females in Pendleton County?
There are 107.63 Males per 100 Females in Pendleton County.
What is the Ratio of Females per 100 Males in Pendleton County?
There are 92.91 Females per 100 Males in Pendleton County.
What is the Median Population Age in Pendleton County?
Median Population Age in Pendleton County is 41.7 Years.
What is the Average Family Size in Pendleton County
Average Family Size in Pendleton County is 3.2 People.
What is the Average Household Size in Pendleton County
Average Household Size in Pendleton County is 2.7 People.
How Large is the Labor Force in Pendleton County?
There are 7,036 People in the Labor Forcein in Pendleton County.
What is the Percentage of People in the Labor Force in Pendleton County?
60.4% of People are in the Labor Force in Pendleton County.
What is the Unemployment Rate in Pendleton County?
Unemployment Rate in Pendleton County is 5.0%.