Owsley County, KY Map & Demographics
Owsley County Map
Owsley County Overview
$19,405
PER CAPITA INCOME
$48,125
AVG FAMILY INCOME
$32,844
AVG HOUSEHOLD INCOME
27.1%
WAGE / INCOME GAP [ % ]
72.9¢/ $1
WAGE / INCOME GAP [ $ ]
$9,058
FAMILY INCOME DEFICIT
0.46
INEQUALITY / GINI INDEX
4,054
TOTAL POPULATION
2,009
MALE POPULATION
2,045
FEMALE POPULATION
98.24
MALES / 100 FEMALES
101.79
FEMALES / 100 MALES
48.0
MEDIAN AGE
3.5
AVG FAMILY SIZE
2.9
AVG HOUSEHOLD SIZE
1,279
LABOR FORCE [ PEOPLE ]
37.2%
PERCENT IN LABOR FORCE
14.2%
UNEMPLOYMENT RATE
Owsley County Area Codes
Income in Owsley County
Income Overview in Owsley County
Per Capita Income in Owsley County is $19,405, while median incomes of families and households are $48,125 and $32,844 respectively.
| Characteristic | Number | Measure |
| Per Capita Income | 4,054 | $19,405 |
| Median Family Income | 842 | $48,125 |
| Mean Family Income | 842 | $61,351 |
| Median Household Income | 1,383 | $32,844 |
| Mean Household Income | 1,383 | $47,393 |
| Income Deficit | 842 | $9,058 |
| Wage / Income Gap (%) | 4,054 | 27.05% |
| Wage / Income Gap ($) | 4,054 | 72.95¢ per $1 |
| Gini / Inequality Index | 4,054 | 0.46 |
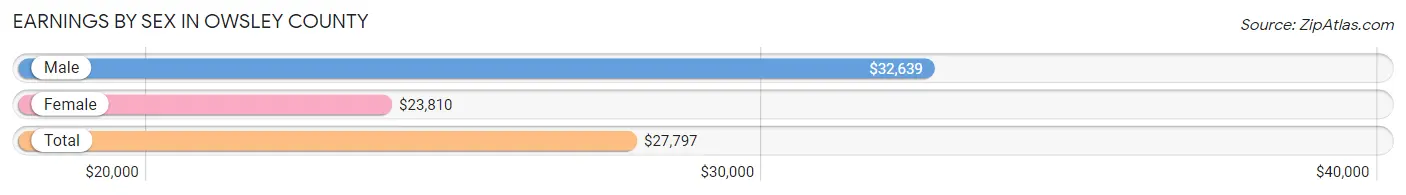
Earnings by Sex in Owsley County
Average Earnings in Owsley County are $27,797, $32,639 for men and $23,810 for women, a difference of 27.1%.
| Sex | Number | Average Earnings |
| Male | 773 (57.8%) | $32,639 |
| Female | 565 (42.2%) | $23,810 |
| Total | 1,338 (100.0%) | $27,797 |
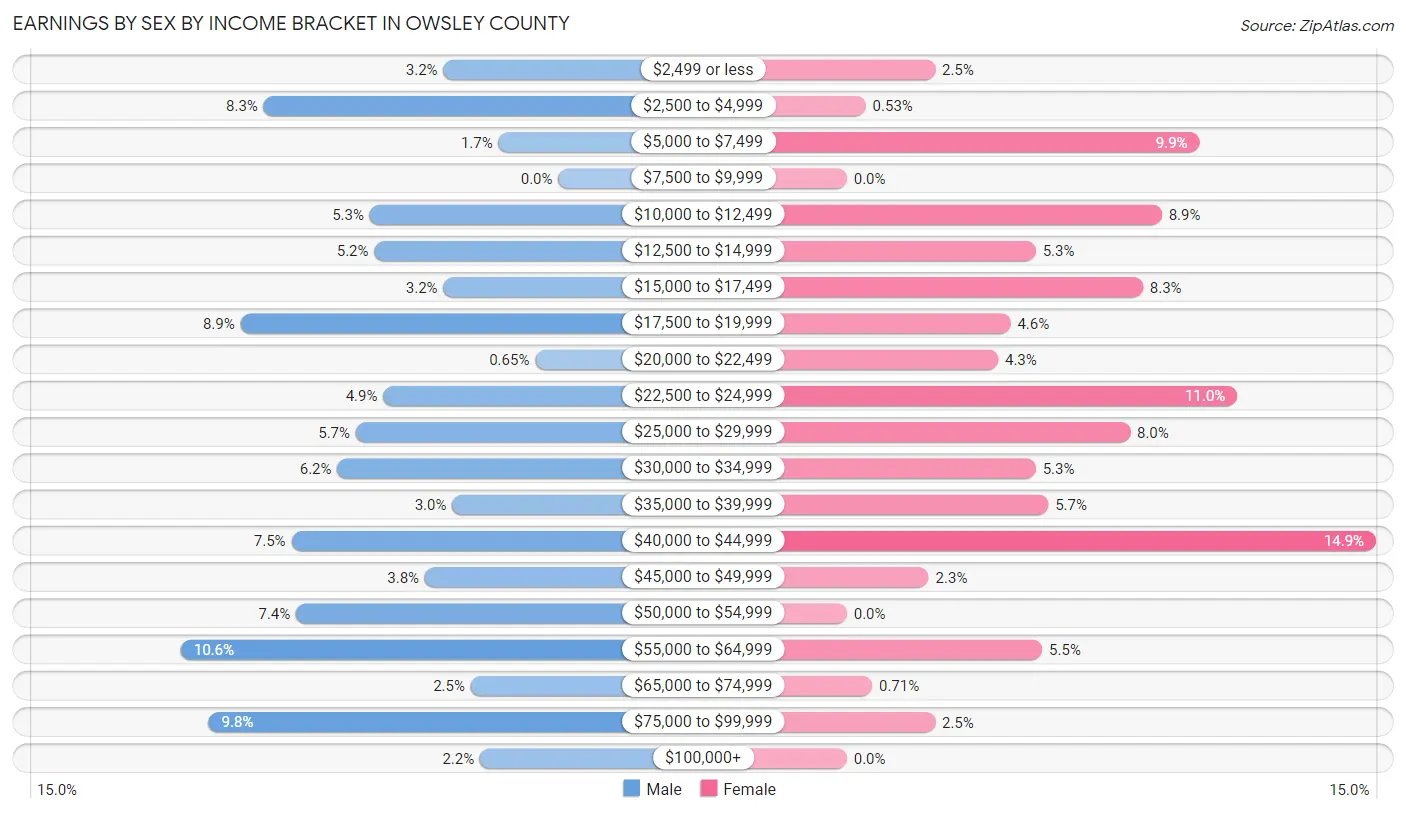
Earnings by Sex by Income Bracket in Owsley County
The most common earnings brackets in Owsley County are $55,000 to $64,999 for men (82 | 10.6%) and $40,000 to $44,999 for women (84 | 14.9%).
| Income | Male | Female |
| $2,499 or less | 25 (3.2%) | 14 (2.5%) |
| $2,500 to $4,999 | 64 (8.3%) | 3 (0.5%) |
| $5,000 to $7,499 | 13 (1.7%) | 56 (9.9%) |
| $7,500 to $9,999 | 0 (0.0%) | 0 (0.0%) |
| $10,000 to $12,499 | 41 (5.3%) | 50 (8.8%) |
| $12,500 to $14,999 | 40 (5.2%) | 30 (5.3%) |
| $15,000 to $17,499 | 25 (3.2%) | 47 (8.3%) |
| $17,500 to $19,999 | 69 (8.9%) | 26 (4.6%) |
| $20,000 to $22,499 | 5 (0.6%) | 24 (4.3%) |
| $22,500 to $24,999 | 38 (4.9%) | 62 (11.0%) |
| $25,000 to $29,999 | 44 (5.7%) | 45 (8.0%) |
| $30,000 to $34,999 | 48 (6.2%) | 30 (5.3%) |
| $35,000 to $39,999 | 23 (3.0%) | 32 (5.7%) |
| $40,000 to $44,999 | 58 (7.5%) | 84 (14.9%) |
| $45,000 to $49,999 | 29 (3.7%) | 13 (2.3%) |
| $50,000 to $54,999 | 57 (7.4%) | 0 (0.0%) |
| $55,000 to $64,999 | 82 (10.6%) | 31 (5.5%) |
| $65,000 to $74,999 | 19 (2.5%) | 4 (0.7%) |
| $75,000 to $99,999 | 76 (9.8%) | 14 (2.5%) |
| $100,000+ | 17 (2.2%) | 0 (0.0%) |
| Total | 773 (100.0%) | 565 (100.0%) |
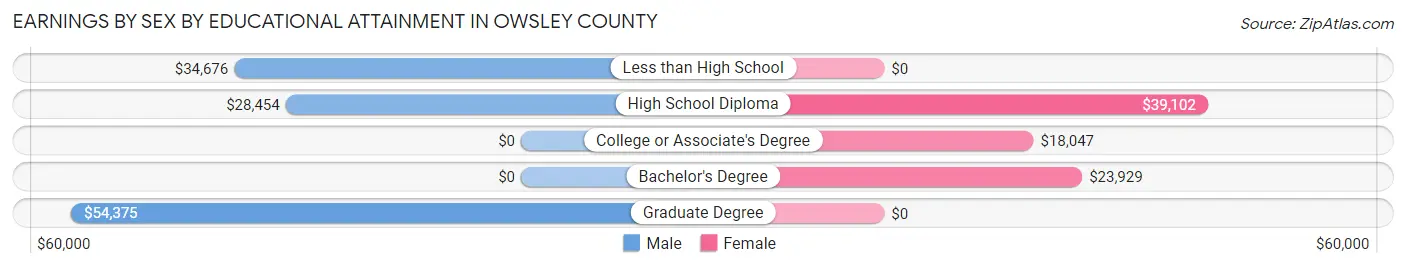
Earnings by Sex by Educational Attainment in Owsley County
Average earnings in Owsley County are $34,907 for men and $24,012 for women, a difference of 31.2%. Men with an educational attainment of graduate degree enjoy the highest average annual earnings of $54,375, while those with high school diploma education earn the least with $28,454. Women with an educational attainment of high school diploma earn the most with the average annual earnings of $39,102, while those with college or associate's degree education have the smallest earnings of $18,047.
| Educational Attainment | Male Income | Female Income |
| Less than High School | $34,676 | $0 |
| High School Diploma | $28,454 | $39,102 |
| College or Associate's Degree | - | - |
| Bachelor's Degree | - | - |
| Graduate Degree | $54,375 | $0 |
| Total | $34,907 | $24,012 |
Family Income in Owsley County
Family Income Brackets in Owsley County
According to the Owsley County family income data, there are 195 families falling into the $75,000 to $99,999 income range, which is the most common income bracket and makes up 23.2% of all families.
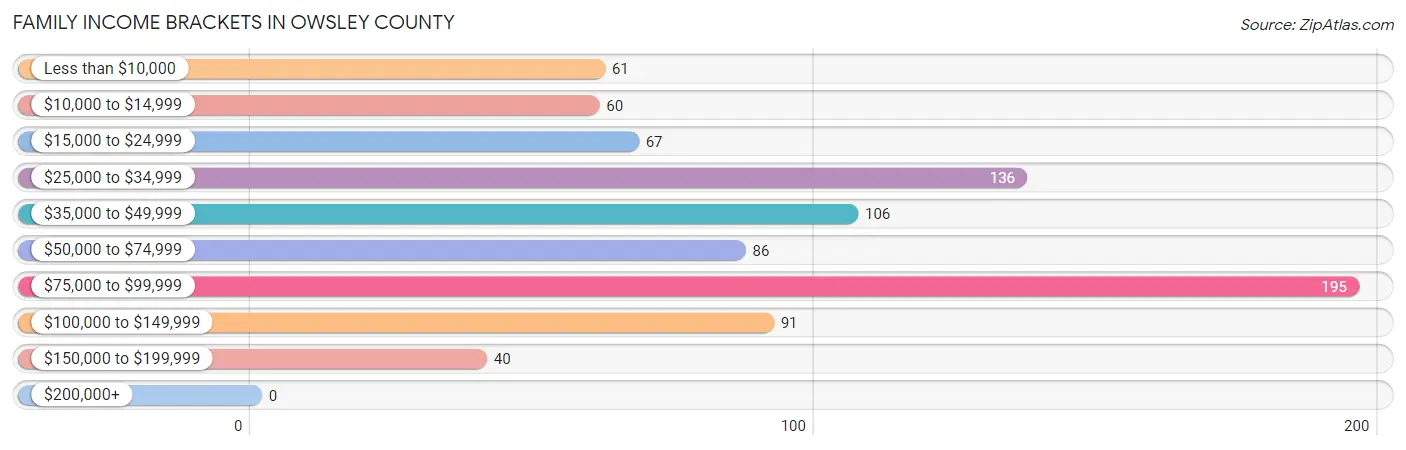
| Income Bracket | # Families | % Families |
| Less than $10,000 | 61 | 7.2% |
| $10,000 to $14,999 | 60 | 7.1% |
| $15,000 to $24,999 | 67 | 8.0% |
| $25,000 to $34,999 | 136 | 16.2% |
| $35,000 to $49,999 | 106 | 12.6% |
| $50,000 to $74,999 | 86 | 10.2% |
| $75,000 to $99,999 | 195 | 23.2% |
| $100,000 to $149,999 | 91 | 10.8% |
| $150,000 to $199,999 | 40 | 4.8% |
| $200,000+ | 0 | 0.0% |
Family Income by Famaliy Size in Owsley County
5-person families (48 | 5.7%) account for the highest median family income in Owsley County with $111,364 per family, while 5-person families (48 | 5.7%) have the highest median income of $22,273 per family member.
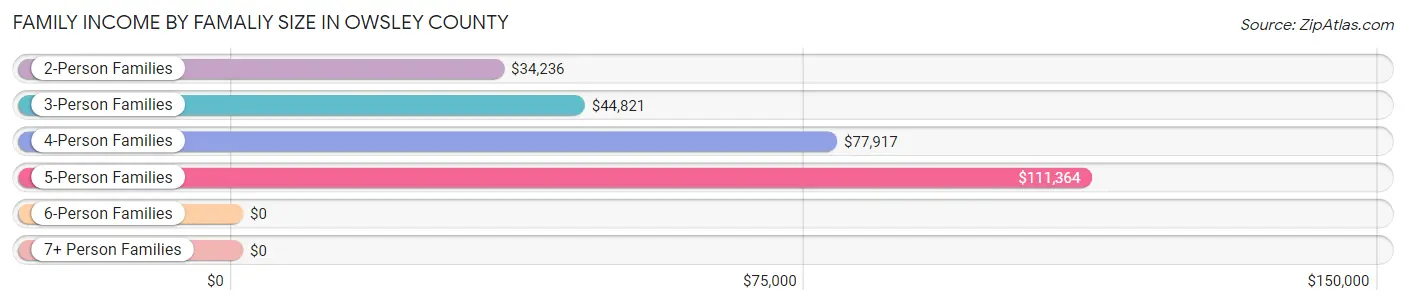
| Income Bracket | # Families | Median Income |
| 2-Person Families | 451 (53.6%) | $34,236 |
| 3-Person Families | 189 (22.5%) | $44,821 |
| 4-Person Families | 116 (13.8%) | $77,917 |
| 5-Person Families | 48 (5.7%) | $111,364 |
| 6-Person Families | 38 (4.5%) | $0 |
| 7+ Person Families | 0 (0.0%) | $0 |
| Total | 842 (100.0%) | $48,125 |
Family Income by Number of Earners in Owsley County
The median family income in Owsley County is $48,125, with families comprising 3+ earners (18) having the highest median family income of $114,375, while families with no earners (278) have the lowest median family income of $29,107, accounting for 2.1% and 33.0% of families, respectively.
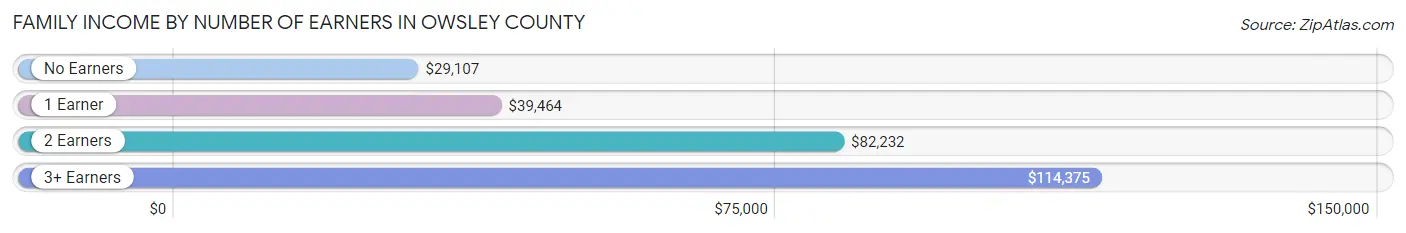
| Number of Earners | # Families | Median Income |
| No Earners | 278 (33.0%) | $29,107 |
| 1 Earner | 302 (35.9%) | $39,464 |
| 2 Earners | 244 (29.0%) | $82,232 |
| 3+ Earners | 18 (2.1%) | $114,375 |
| Total | 842 (100.0%) | $48,125 |
Household Income in Owsley County
Household Income Brackets in Owsley County
With 223 households falling in the category, the $75,000 to $99,999 income range is the most frequent in Owsley County, accounting for 16.1% of all households.
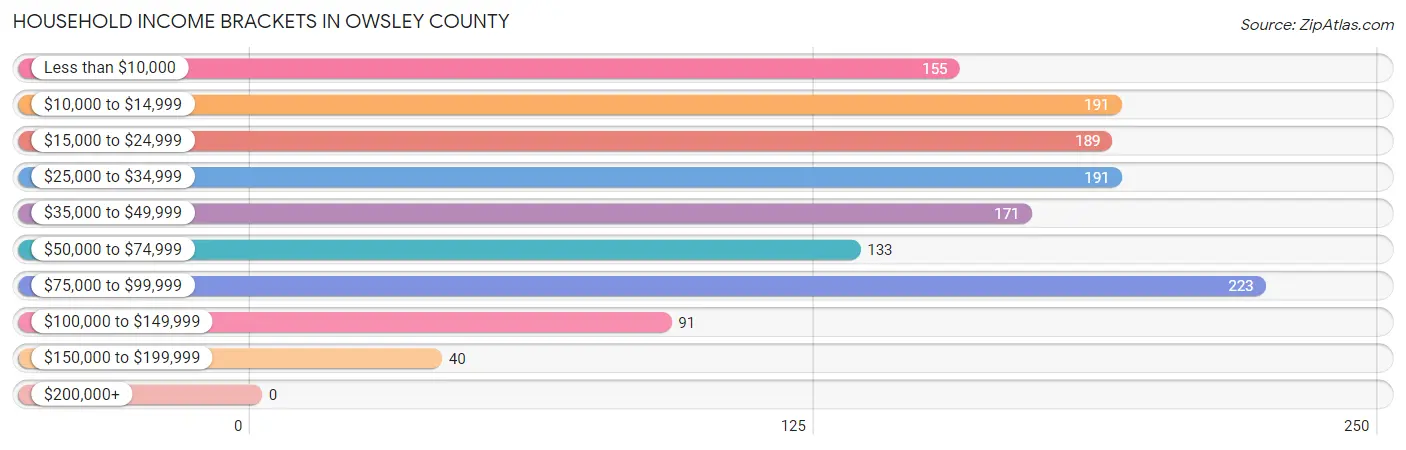
| Income Bracket | # Households | % Households |
| Less than $10,000 | 155 | 11.2% |
| $10,000 to $14,999 | 191 | 13.8% |
| $15,000 to $24,999 | 189 | 13.7% |
| $25,000 to $34,999 | 191 | 13.8% |
| $35,000 to $49,999 | 171 | 12.4% |
| $50,000 to $74,999 | 133 | 9.6% |
| $75,000 to $99,999 | 223 | 16.1% |
| $100,000 to $149,999 | 91 | 6.6% |
| $150,000 to $199,999 | 40 | 2.9% |
| $200,000+ | 0 | 0.0% |
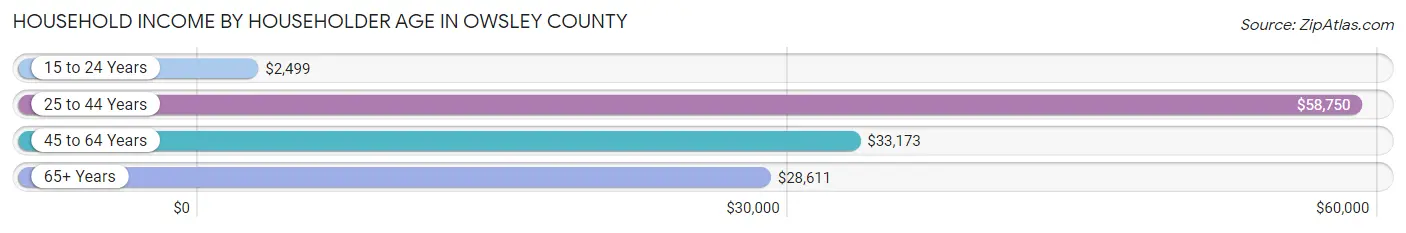
Household Income by Householder Age in Owsley County
The median household income in Owsley County is $32,844, with the highest median household income of $58,750 found in the 25 to 44 years age bracket for the primary householder. A total of 184 households (13.3%) fall into this category. Meanwhile, the 15 to 24 years age bracket for the primary householder has the lowest median household income of $2,499, with 48 households (3.5%) in this group.
| Income Bracket | # Households | Median Income |
| 15 to 24 Years | 48 (3.5%) | $2,499 |
| 25 to 44 Years | 184 (13.3%) | $58,750 |
| 45 to 64 Years | 587 (42.4%) | $33,173 |
| 65+ Years | 564 (40.8%) | $28,611 |
| Total | 1,383 (100.0%) | $32,844 |
Poverty in Owsley County
Income Below Poverty by Sex and Age in Owsley County
With 26.3% poverty level for males and 31.3% for females among the residents of Owsley County, 18 to 24 year old males and 5 year old females are the most vulnerable to poverty, with 95 males (57.9%) and 54 females (100.0%) in their respective age groups living below the poverty level.
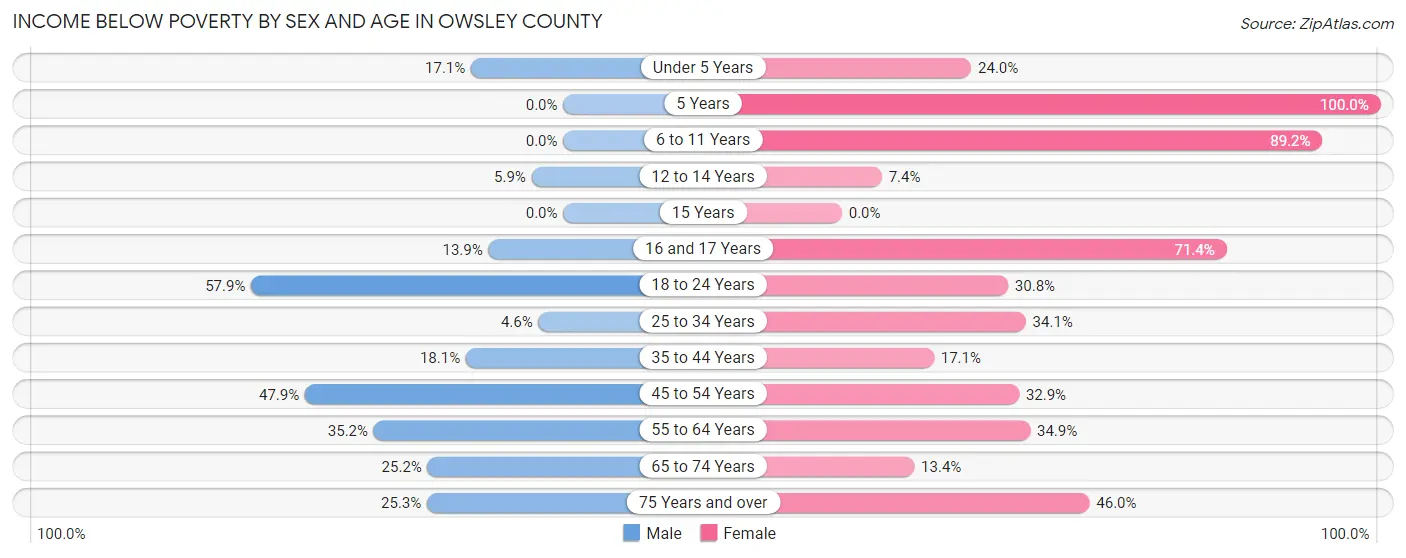
| Age Bracket | Male | Female |
| Under 5 Years | 19 (17.1%) | 12 (24.0%) |
| 5 Years | 0 (0.0%) | 54 (100.0%) |
| 6 to 11 Years | 0 (0.0%) | 33 (89.2%) |
| 12 to 14 Years | 4 (5.9%) | 4 (7.4%) |
| 15 Years | 0 (0.0%) | 0 (0.0%) |
| 16 and 17 Years | 15 (13.9%) | 20 (71.4%) |
| 18 to 24 Years | 95 (57.9%) | 37 (30.8%) |
| 25 to 34 Years | 10 (4.6%) | 57 (34.1%) |
| 35 to 44 Years | 30 (18.1%) | 35 (17.1%) |
| 45 to 54 Years | 128 (47.9%) | 120 (32.9%) |
| 55 to 64 Years | 115 (35.2%) | 138 (34.9%) |
| 65 to 74 Years | 68 (25.2%) | 47 (13.4%) |
| 75 Years and over | 22 (25.3%) | 51 (46.0%) |
| Total | 506 (26.3%) | 608 (31.3%) |
Income Above Poverty by Sex and Age in Owsley County
According to the poverty statistics in Owsley County, males aged 5 years and females aged 15 years are the age groups that are most secure financially, with 100.0% of males and 100.0% of females in these age groups living above the poverty line.
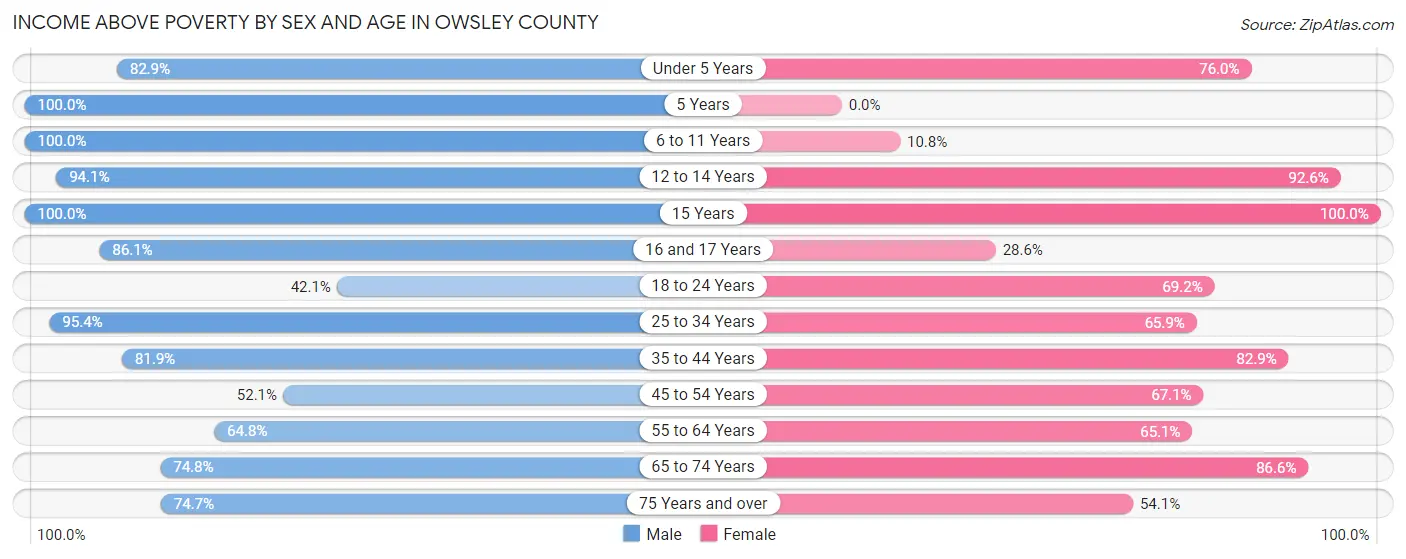
| Age Bracket | Male | Female |
| Under 5 Years | 92 (82.9%) | 38 (76.0%) |
| 5 Years | 2 (100.0%) | 0 (0.0%) |
| 6 to 11 Years | 116 (100.0%) | 4 (10.8%) |
| 12 to 14 Years | 64 (94.1%) | 50 (92.6%) |
| 15 Years | 20 (100.0%) | 7 (100.0%) |
| 16 and 17 Years | 93 (86.1%) | 8 (28.6%) |
| 18 to 24 Years | 69 (42.1%) | 83 (69.2%) |
| 25 to 34 Years | 207 (95.4%) | 110 (65.9%) |
| 35 to 44 Years | 136 (81.9%) | 170 (82.9%) |
| 45 to 54 Years | 139 (52.1%) | 245 (67.1%) |
| 55 to 64 Years | 212 (64.8%) | 257 (65.1%) |
| 65 to 74 Years | 202 (74.8%) | 303 (86.6%) |
| 75 Years and over | 65 (74.7%) | 60 (54.0%) |
| Total | 1,417 (73.7%) | 1,335 (68.7%) |
Income Below Poverty Among Married-Couple Families in Owsley County
The poverty statistics for married-couple families in Owsley County show that 12.0% or 72 of the total 600 families live below the poverty line. Families with 3 or 4 children have the highest poverty rate of 45.5%, comprising of 10 families. On the other hand, families with 1 or 2 children have the lowest poverty rate of 8.3%, which includes 16 families.
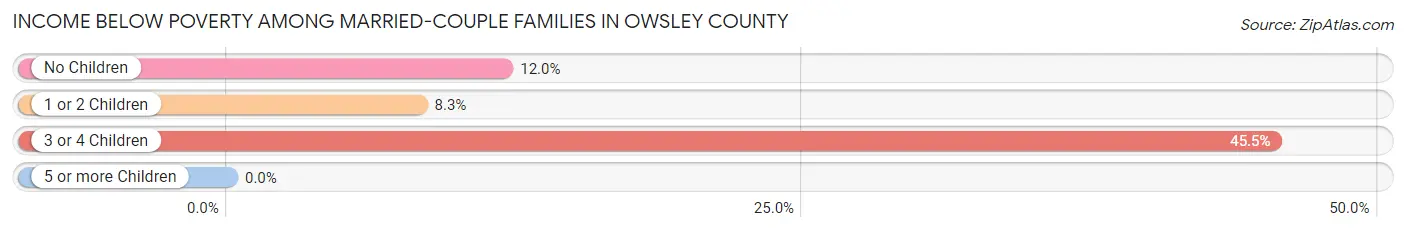
| Children | Above Poverty | Below Poverty |
| No Children | 338 (88.0%) | 46 (12.0%) |
| 1 or 2 Children | 178 (91.7%) | 16 (8.3%) |
| 3 or 4 Children | 12 (54.5%) | 10 (45.5%) |
| 5 or more Children | 0 (0.0%) | 0 (0.0%) |
| Total | 528 (88.0%) | 72 (12.0%) |
Income Below Poverty Among Single-Parent Households in Owsley County
According to the poverty data in Owsley County, 67.0% or 63 single-father households and 27.0% or 40 single-mother households are living below the poverty line. Among single-father households, those with no children have the highest poverty rate, with 47 households (70.2%) experiencing poverty. Likewise, among single-mother households, those with 3 or 4 children have the highest poverty rate, with 19 households (100.0%) falling below the poverty line.
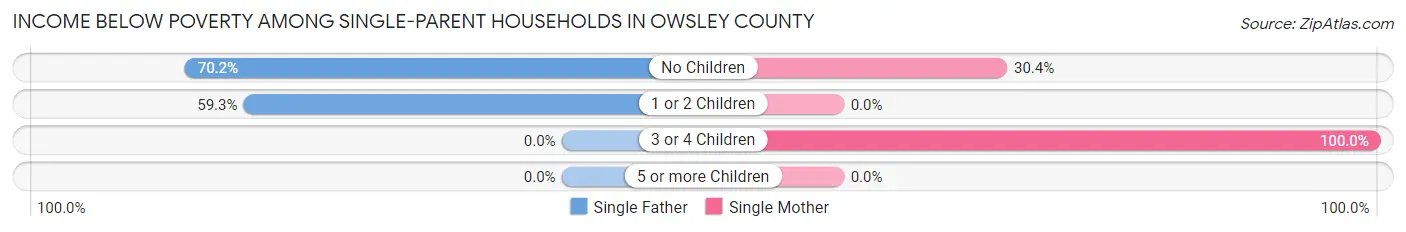
| Children | Single Father | Single Mother |
| No Children | 47 (70.2%) | 21 (30.4%) |
| 1 or 2 Children | 16 (59.3%) | 0 (0.0%) |
| 3 or 4 Children | 0 (0.0%) | 19 (100.0%) |
| 5 or more Children | 0 (0.0%) | 0 (0.0%) |
| Total | 63 (67.0%) | 40 (27.0%) |
Income Below Poverty Among Married-Couple vs Single-Parent Households in Owsley County
The poverty data for Owsley County shows that 72 of the married-couple family households (12.0%) and 103 of the single-parent households (42.6%) are living below the poverty level. Within the married-couple family households, those with 3 or 4 children have the highest poverty rate, with 10 households (45.5%) falling below the poverty line. Among the single-parent households, those with 3 or 4 children have the highest poverty rate, with 19 household (100.0%) living below poverty.
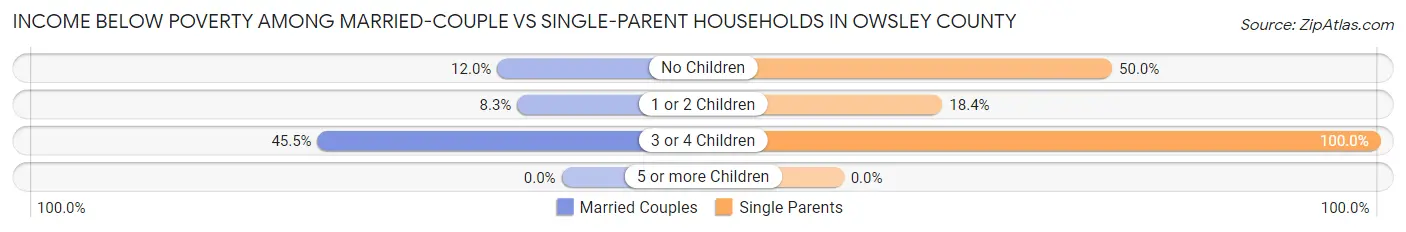
| Children | Married-Couple Families | Single-Parent Households |
| No Children | 46 (12.0%) | 68 (50.0%) |
| 1 or 2 Children | 16 (8.3%) | 16 (18.4%) |
| 3 or 4 Children | 10 (45.5%) | 19 (100.0%) |
| 5 or more Children | 0 (0.0%) | 0 (0.0%) |
| Total | 72 (12.0%) | 103 (42.6%) |
Race in Owsley County
The most populous races in Owsley County are White / Caucasian (3,705 | 91.4%), Two or more Races (216 | 5.3%), and Some other Race (73 | 1.8%).
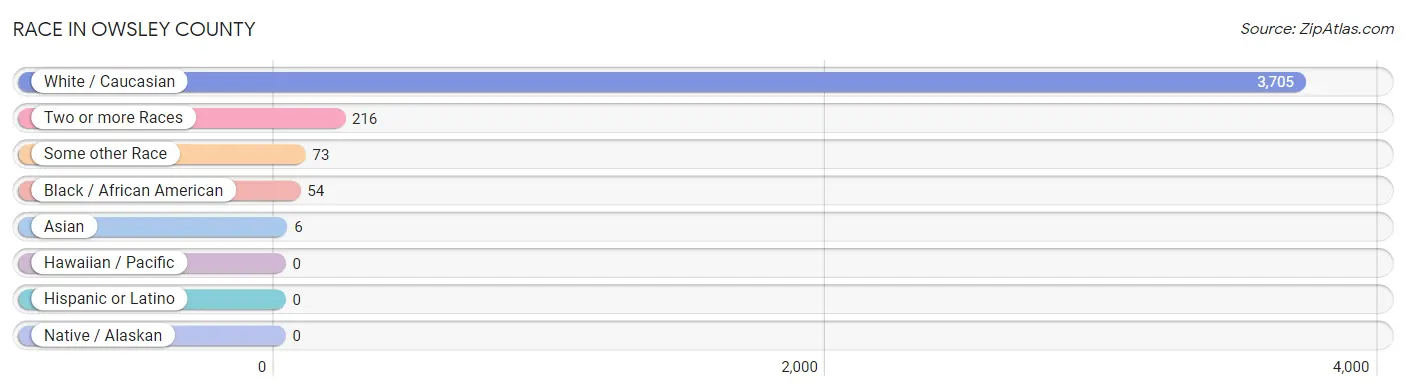
| Race | # Population | % Population |
| Asian | 6 | 0.2% |
| Black / African American | 54 | 1.3% |
| Hawaiian / Pacific | 0 | 0.0% |
| Hispanic or Latino | 0 | 0.0% |
| Native / Alaskan | 0 | 0.0% |
| White / Caucasian | 3,705 | 91.4% |
| Two or more Races | 216 | 5.3% |
| Some other Race | 73 | 1.8% |
| Total | 4,054 | 100.0% |
Ancestry in Owsley County
The most populous ancestries reported in Owsley County are American (2,079 | 51.3%), English (634 | 15.6%), German (230 | 5.7%), Irish (179 | 4.4%), and Scotch-Irish (123 | 3.0%), together accounting for 80.0% of all Owsley County residents.
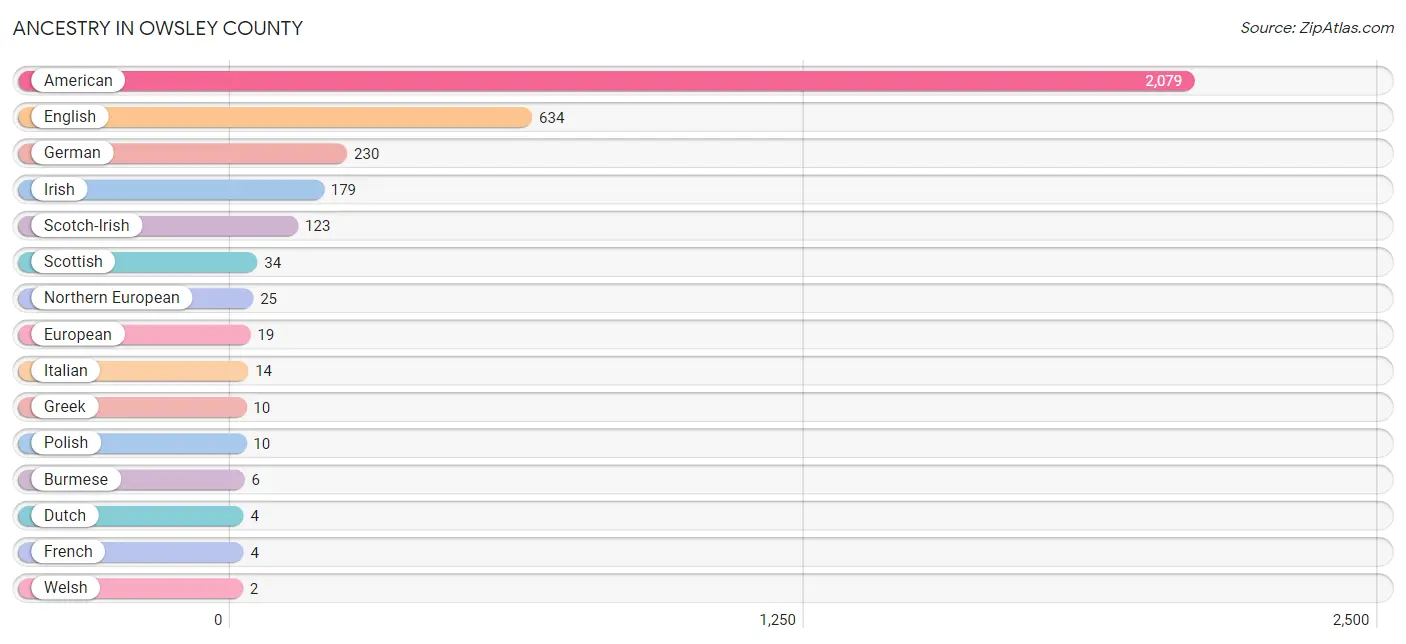
| Ancestry | # Population | % Population |
| American | 2,079 | 51.3% |
| Burmese | 6 | 0.2% |
| Cherokee | 1 | 0.0% |
| Dutch | 4 | 0.1% |
| English | 634 | 15.6% |
| European | 19 | 0.5% |
| French | 4 | 0.1% |
| German | 230 | 5.7% |
| Greek | 10 | 0.3% |
| Irish | 179 | 4.4% |
| Italian | 14 | 0.4% |
| Northern European | 25 | 0.6% |
| Polish | 10 | 0.3% |
| Scotch-Irish | 123 | 3.0% |
| Scottish | 34 | 0.8% |
| Welsh | 2 | 0.1% | View All 16 Rows |
Immigrants in Owsley County
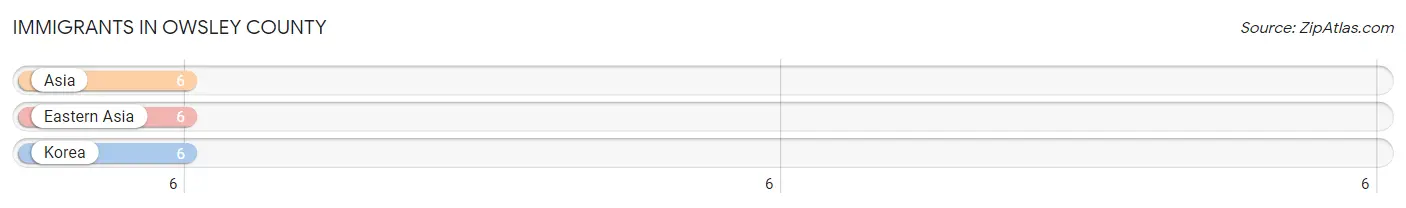
The most numerous immigrant groups reported in Owsley County came from Asia (6 | 0.2%), Eastern Asia (6 | 0.2%), and Korea (6 | 0.2%), together accounting for 0.5% of all Owsley County residents.
| Immigration Origin | # Population | % Population |
| Asia | 6 | 0.2% |
| Eastern Asia | 6 | 0.2% |
| Korea | 6 | 0.2% | View All 3 Rows |
Sex and Age in Owsley County
Sex and Age in Owsley County
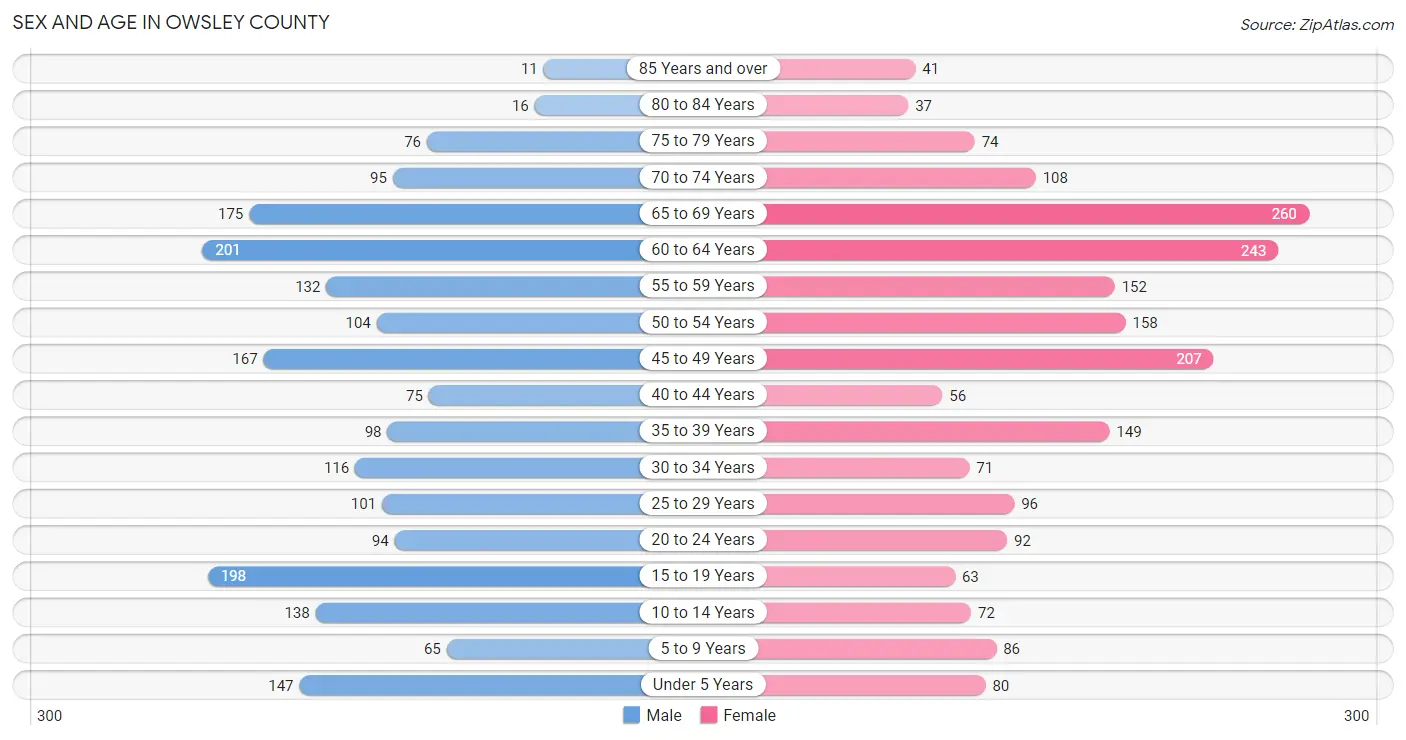
The most populous age groups in Owsley County are 60 to 64 Years (201 | 10.0%) for men and 65 to 69 Years (260 | 12.7%) for women.
| Age Bracket | Male | Female |
| Under 5 Years | 147 (7.3%) | 80 (3.9%) |
| 5 to 9 Years | 65 (3.2%) | 86 (4.2%) |
| 10 to 14 Years | 138 (6.9%) | 72 (3.5%) |
| 15 to 19 Years | 198 (9.9%) | 63 (3.1%) |
| 20 to 24 Years | 94 (4.7%) | 92 (4.5%) |
| 25 to 29 Years | 101 (5.0%) | 96 (4.7%) |
| 30 to 34 Years | 116 (5.8%) | 71 (3.5%) |
| 35 to 39 Years | 98 (4.9%) | 149 (7.3%) |
| 40 to 44 Years | 75 (3.7%) | 56 (2.7%) |
| 45 to 49 Years | 167 (8.3%) | 207 (10.1%) |
| 50 to 54 Years | 104 (5.2%) | 158 (7.7%) |
| 55 to 59 Years | 132 (6.6%) | 152 (7.4%) |
| 60 to 64 Years | 201 (10.0%) | 243 (11.9%) |
| 65 to 69 Years | 175 (8.7%) | 260 (12.7%) |
| 70 to 74 Years | 95 (4.7%) | 108 (5.3%) |
| 75 to 79 Years | 76 (3.8%) | 74 (3.6%) |
| 80 to 84 Years | 16 (0.8%) | 37 (1.8%) |
| 85 Years and over | 11 (0.5%) | 41 (2.0%) |
| Total | 2,009 (100.0%) | 2,045 (100.0%) |
Families and Households in Owsley County
Median Family Size in Owsley County
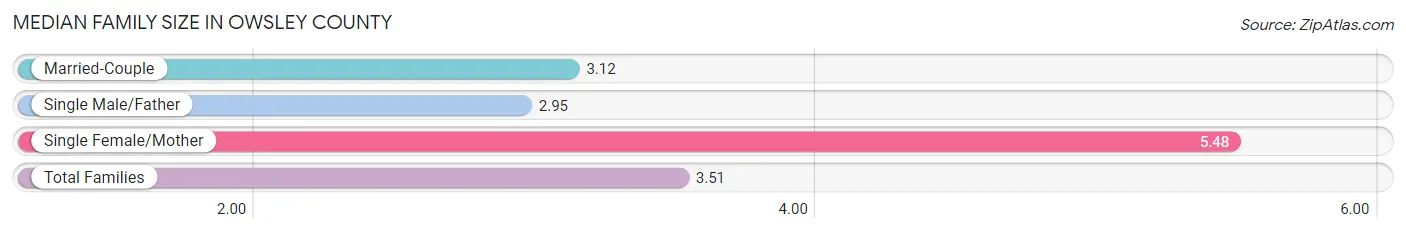
The median family size in Owsley County is 3.51 persons per family, with single female/mother families (148 | 17.6%) accounting for the largest median family size of 5.48 persons per family. On the other hand, single male/father families (94 | 11.2%) represent the smallest median family size with 2.95 persons per family.
| Family Type | # Families | Family Size |
| Married-Couple | 600 (71.3%) | 3.12 |
| Single Male/Father | 94 (11.2%) | 2.95 |
| Single Female/Mother | 148 (17.6%) | 5.48 |
| Total Families | 842 (100.0%) | 3.51 |
Median Household Size in Owsley County
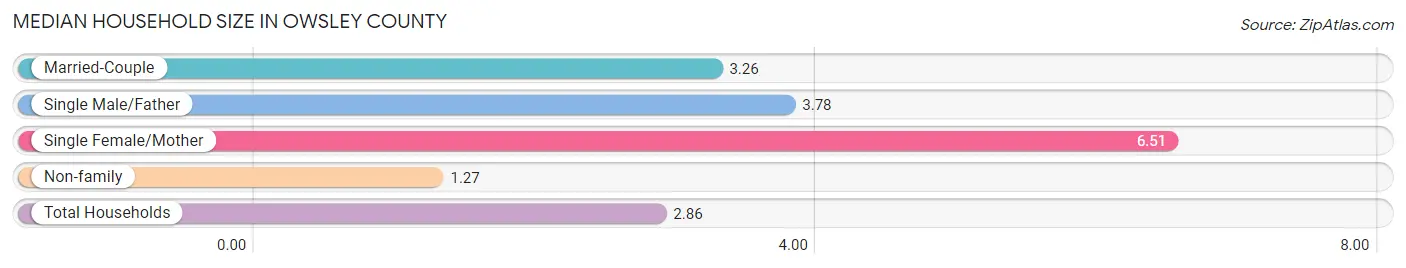
The median household size in Owsley County is 2.86 persons per household, with single female/mother households (148 | 10.7%) accounting for the largest median household size of 6.51 persons per household. non-family households (541 | 39.1%) represent the smallest median household size with 1.27 persons per household.
| Household Type | # Households | Household Size |
| Married-Couple | 600 (43.4%) | 3.26 |
| Single Male/Father | 94 (6.8%) | 3.78 |
| Single Female/Mother | 148 (10.7%) | 6.51 |
| Non-family | 541 (39.1%) | 1.27 |
| Total Households | 1,383 (100.0%) | 2.86 |
Household Size by Marriage Status in Owsley County
Out of a total of 1,383 households in Owsley County, 842 (60.9%) are family households, while 541 (39.1%) are nonfamily households. The most numerous type of family households are 2-person households, comprising 405, and the most common type of nonfamily households are 1-person households, comprising 483.
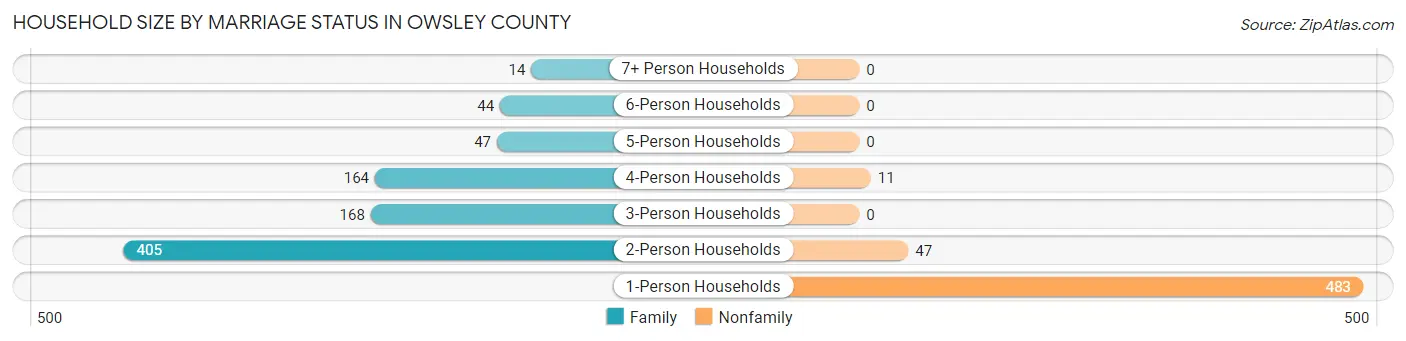
| Household Size | Family Households | Nonfamily Households |
| 1-Person Households | - | 483 (34.9%) |
| 2-Person Households | 405 (29.3%) | 47 (3.4%) |
| 3-Person Households | 168 (12.1%) | 0 (0.0%) |
| 4-Person Households | 164 (11.9%) | 11 (0.8%) |
| 5-Person Households | 47 (3.4%) | 0 (0.0%) |
| 6-Person Households | 44 (3.2%) | 0 (0.0%) |
| 7+ Person Households | 14 (1.0%) | 0 (0.0%) |
| Total | 842 (60.9%) | 541 (39.1%) |
Female Fertility in Owsley County
Fertility by Age in Owsley County
Average fertility rate in Owsley County is 78.0 births per 1,000 women. Women in the age bracket of 20 to 34 years have the highest fertility rate with 205.0 births per 1,000 women. Women in the age bracket of 20 to 34 years acount for 84.1% of all women with births.
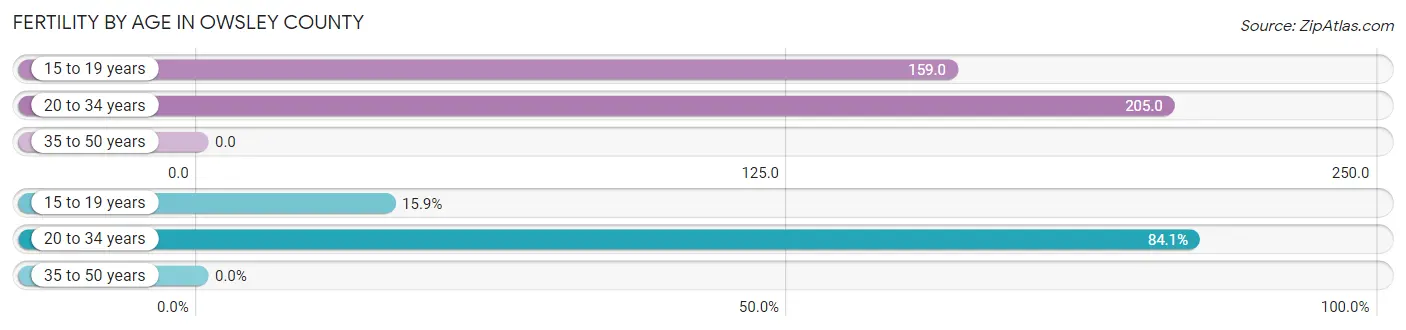
| Age Bracket | Women with Births | Births / 1,000 Women |
| 15 to 19 years | 10 (15.9%) | 159.0 |
| 20 to 34 years | 53 (84.1%) | 205.0 |
| 35 to 50 years | 0 (0.0%) | 0.0 |
| Total | 63 (100.0%) | 78.0 |
Fertility by Age by Marriage Status in Owsley County
66.7% of women with births (63) in Owsley County are married. The highest percentage of unmarried women with births falls into 15 to 19 years age bracket with 100.0% of them unmarried at the time of birth, while the lowest percentage of unmarried women with births belong to 20 to 34 years age bracket with 20.8% of them unmarried.
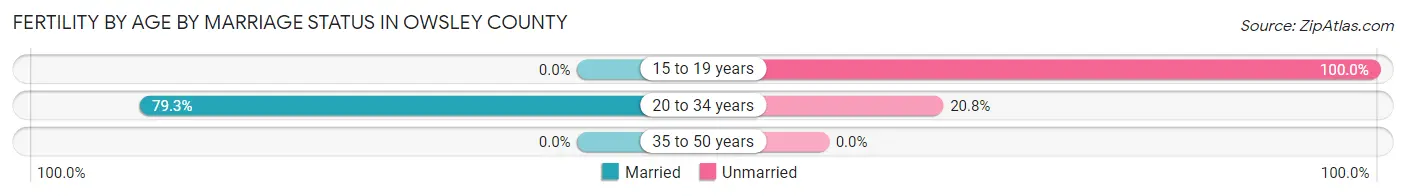
| Age Bracket | Married | Unmarried |
| 15 to 19 years | 0 (0.0%) | 10 (100.0%) |
| 20 to 34 years | 42 (79.2%) | 11 (20.7%) |
| 35 to 50 years | 0 (0.0%) | 0 (0.0%) |
| Total | 42 (66.7%) | 21 (33.3%) |
Fertility by Education in Owsley County
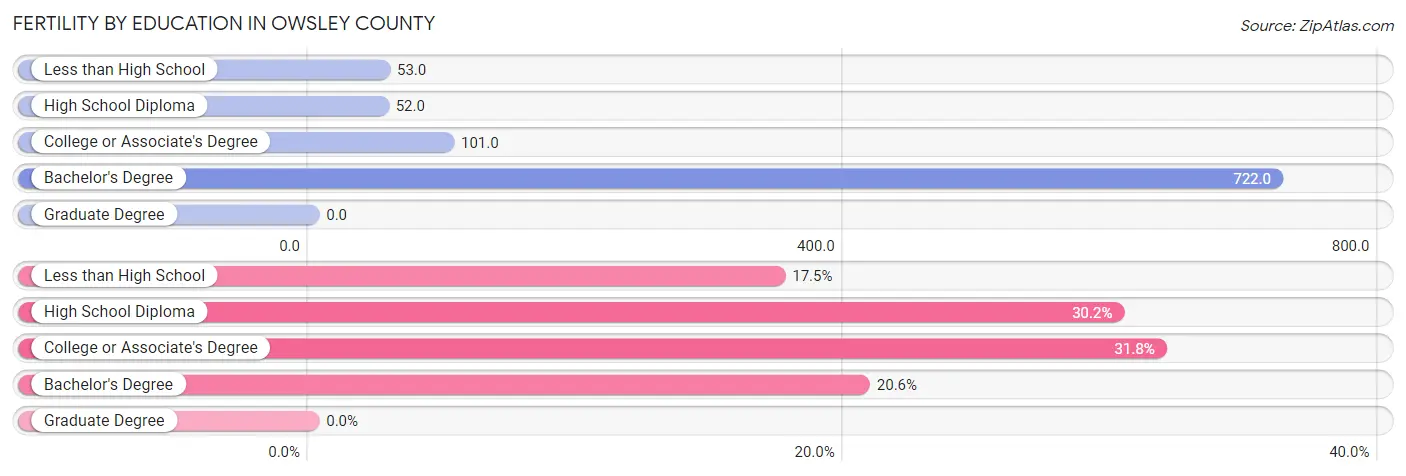
| Educational Attainment | Women with Births | Births / 1,000 Women |
| Less than High School | 11 (17.5%) | 53.0 |
| High School Diploma | 19 (30.2%) | 52.0 |
| College or Associate's Degree | 20 (31.8%) | 101.0 |
| Bachelor's Degree | 13 (20.6%) | 722.0 |
| Graduate Degree | 0 (0.0%) | 0.0 |
| Total | 63 (100.0%) | 78.0 |
Fertility by Education by Marriage Status in Owsley County
33.3% of women with births in Owsley County are unmarried. Women with the educational attainment of high school diploma are most likely to be married with 100.0% of them married at childbirth, while women with the educational attainment of less than high school are least likely to be married with 100.0% of them unmarried at childbirth.
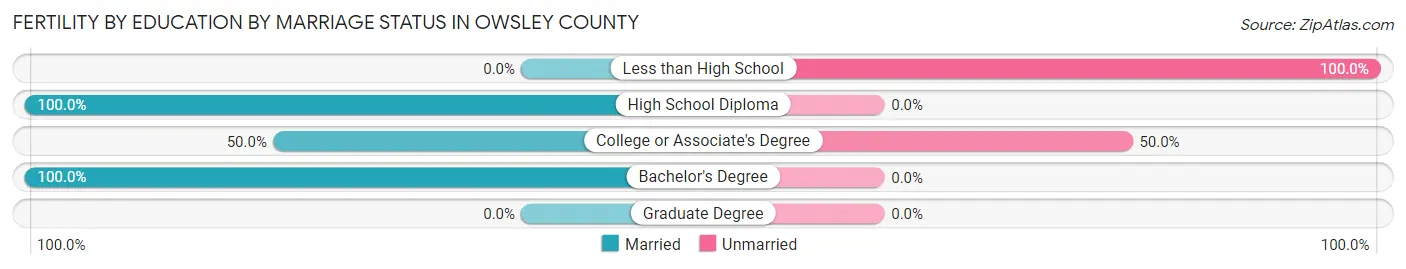
| Educational Attainment | Married | Unmarried |
| Less than High School | 0 (0.0%) | 11 (100.0%) |
| High School Diploma | 19 (100.0%) | 0 (0.0%) |
| College or Associate's Degree | 10 (50.0%) | 10 (50.0%) |
| Bachelor's Degree | 13 (100.0%) | 0 (0.0%) |
| Graduate Degree | 0 (0.0%) | 0 (0.0%) |
| Total | 42 (66.7%) | 21 (33.3%) |
Employment Characteristics in Owsley County
Employment by Class of Employer in Owsley County
Among the 1,091 employed individuals in Owsley County, private company employees (663 | 60.8%), self-employed (not incorporated) (104 | 9.5%), and local government employees (102 | 9.3%) make up the most common classes of employment.
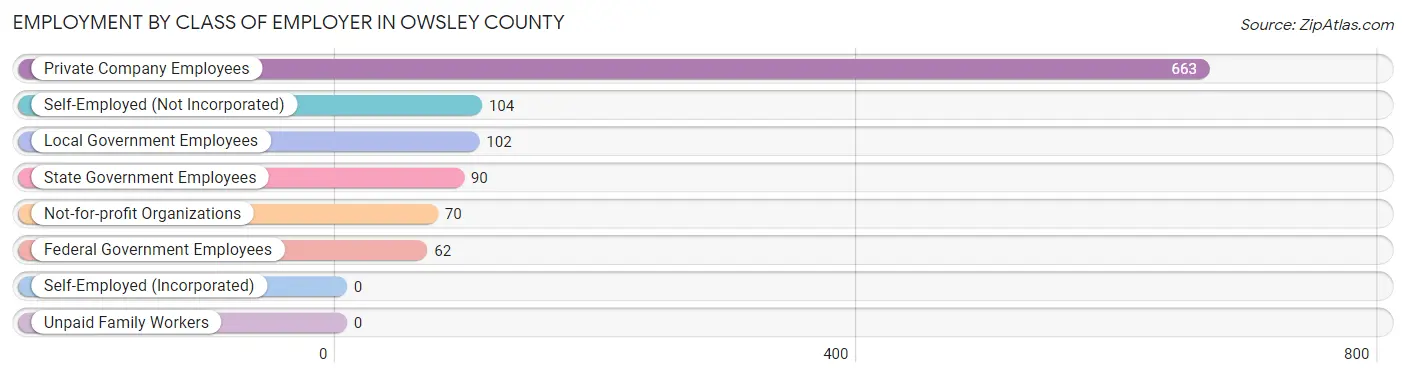
| Employer Class | # Employees | % Employees |
| Private Company Employees | 663 | 60.8% |
| Self-Employed (Incorporated) | 0 | 0.0% |
| Self-Employed (Not Incorporated) | 104 | 9.5% |
| Not-for-profit Organizations | 70 | 6.4% |
| Local Government Employees | 102 | 9.3% |
| State Government Employees | 90 | 8.3% |
| Federal Government Employees | 62 | 5.7% |
| Unpaid Family Workers | 0 | 0.0% |
| Total | 1,091 | 100.0% |
Employment Status by Age in Owsley County
According to the labor force statistics for Owsley County, out of the total population over 16 years of age (3,439), 37.2% or 1,279 individuals are in the labor force, with 14.2% or 182 of them unemployed. The age group with the highest labor force participation rate is 30 to 34 years, with 87.7% or 164 individuals in the labor force. Within the labor force, the 16 to 19 years age range has the highest percentage of unemployed individuals, with 58.9% or 33 of them being unemployed.
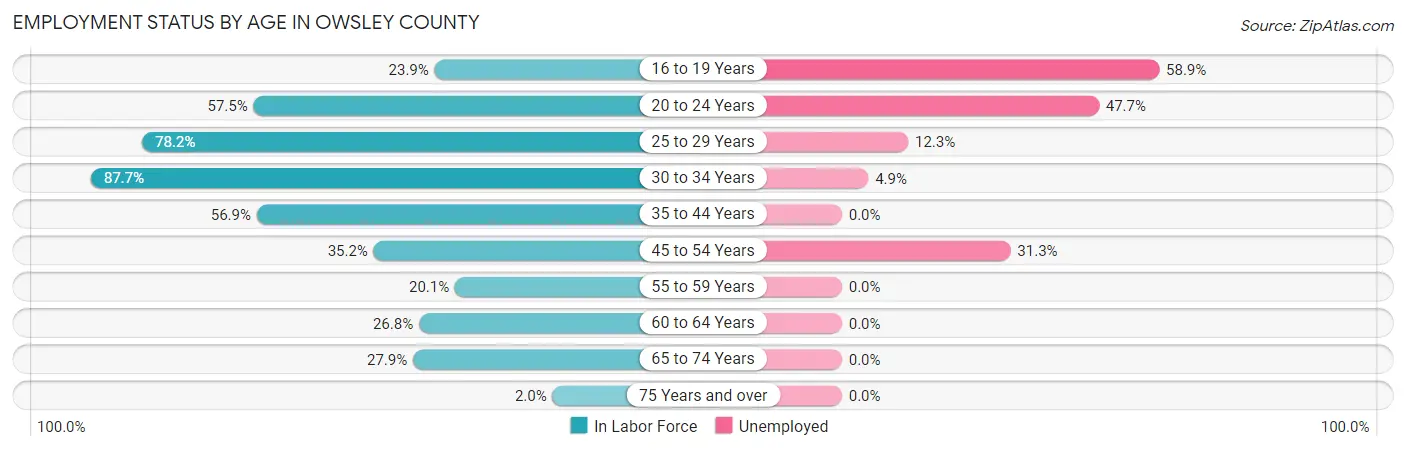
| Age Bracket | In Labor Force | Unemployed |
| 16 to 19 Years | 56 (23.9%) | 33 (58.9%) |
| 20 to 24 Years | 107 (57.5%) | 51 (47.7%) |
| 25 to 29 Years | 154 (78.2%) | 19 (12.3%) |
| 30 to 34 Years | 164 (87.7%) | 8 (4.9%) |
| 35 to 44 Years | 215 (56.9%) | 0 (0.0%) |
| 45 to 54 Years | 224 (35.2%) | 70 (31.3%) |
| 55 to 59 Years | 57 (20.1%) | 0 (0.0%) |
| 60 to 64 Years | 119 (26.8%) | 0 (0.0%) |
| 65 to 74 Years | 178 (27.9%) | 0 (0.0%) |
| 75 Years and over | 5 (2.0%) | 0 (0.0%) |
| Total | 1,279 (37.2%) | 182 (14.2%) |
Employment Status by Educational Attainment in Owsley County
According to labor force statistics for Owsley County, 43.9% of individuals (933) out of the total population between 25 and 64 years of age (2,126) are in the labor force, with 10.4% or 97 of them being unemployed. The group with the highest labor force participation rate are those with the educational attainment of bachelor's degree or higher, with 59.3% or 147 individuals in the labor force. Within the labor force, individuals with less than high school education have the highest percentage of unemployment, with 25.5% or 24 of them being unemployed.
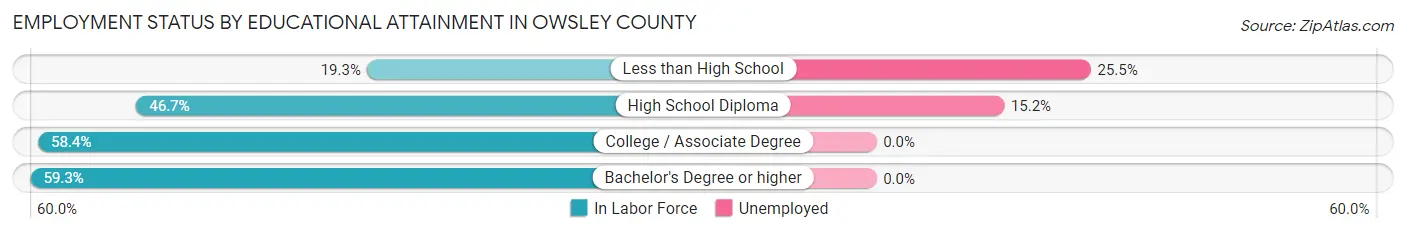
| Educational Attainment | In Labor Force | Unemployed |
| Less than High School | 94 (19.3%) | 124 (25.5%) |
| High School Diploma | 480 (46.7%) | 156 (15.2%) |
| College / Associate Degree | 212 (58.4%) | 0 (0.0%) |
| Bachelor's Degree or higher | 147 (59.3%) | 0 (0.0%) |
| Total | 933 (43.9%) | 221 (10.4%) |
Employment Occupations by Sex in Owsley County
Management, Business, Science and Arts Occupations
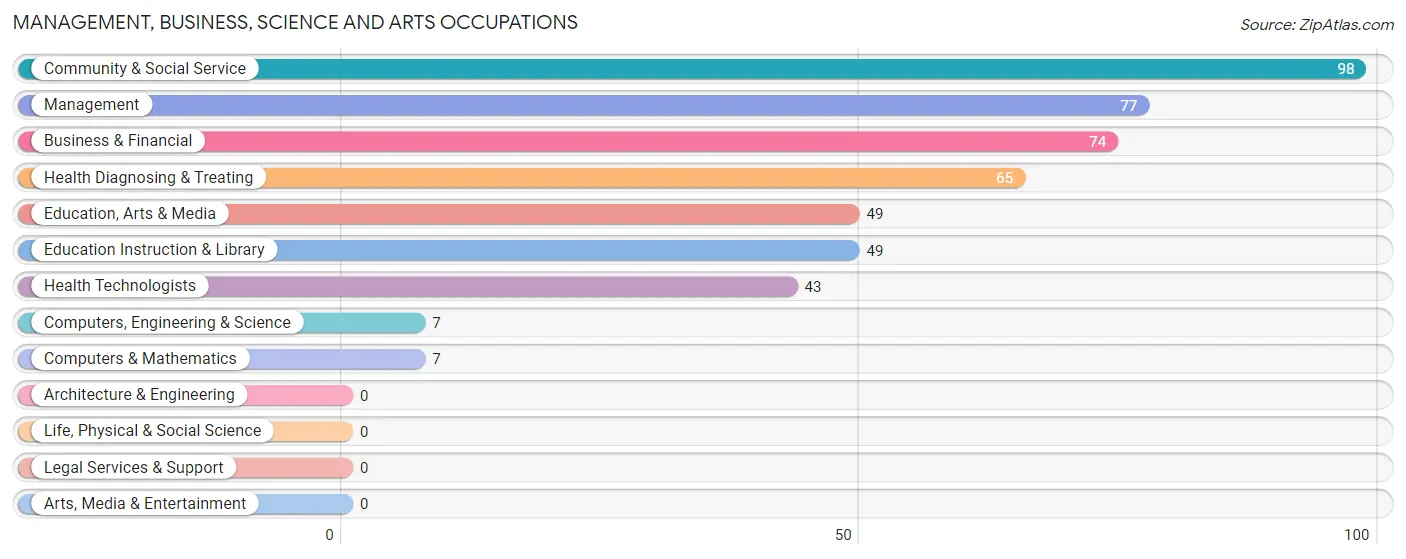
The most common Management, Business, Science and Arts occupations in Owsley County are Community & Social Service (98 | 8.9%), Management (77 | 7.0%), Business & Financial (74 | 6.7%), Health Diagnosing & Treating (65 | 5.9%), and Education, Arts & Media (49 | 4.5%).
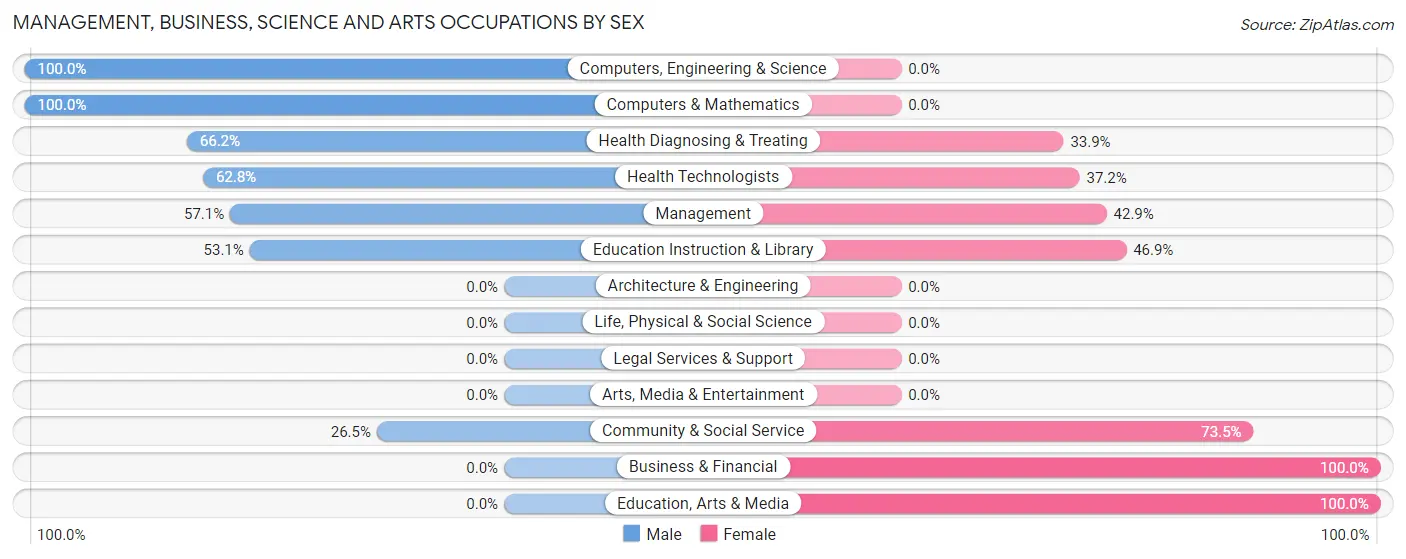
Management, Business, Science and Arts Occupations by Sex
Within the Management, Business, Science and Arts occupations in Owsley County, the most male-oriented occupations are Computers, Engineering & Science (100.0%), Computers & Mathematics (100.0%), and Health Diagnosing & Treating (66.1%), while the most female-oriented occupations are Business & Financial (100.0%), Education, Arts & Media (100.0%), and Community & Social Service (73.5%).
| Occupation | Male | Female |
| Management | 44 (57.1%) | 33 (42.9%) |
| Business & Financial | 0 (0.0%) | 74 (100.0%) |
| Computers, Engineering & Science | 7 (100.0%) | 0 (0.0%) |
| Computers & Mathematics | 7 (100.0%) | 0 (0.0%) |
| Architecture & Engineering | 0 (0.0%) | 0 (0.0%) |
| Life, Physical & Social Science | 0 (0.0%) | 0 (0.0%) |
| Community & Social Service | 26 (26.5%) | 72 (73.5%) |
| Education, Arts & Media | 0 (0.0%) | 49 (100.0%) |
| Legal Services & Support | 0 (0.0%) | 0 (0.0%) |
| Education Instruction & Library | 26 (53.1%) | 23 (46.9%) |
| Arts, Media & Entertainment | 0 (0.0%) | 0 (0.0%) |
| Health Diagnosing & Treating | 43 (66.1%) | 22 (33.9%) |
| Health Technologists | 27 (62.8%) | 16 (37.2%) |
| Total (Category) | 120 (37.4%) | 201 (62.6%) |
| Total (Overall) | 655 (59.7%) | 443 (40.4%) |
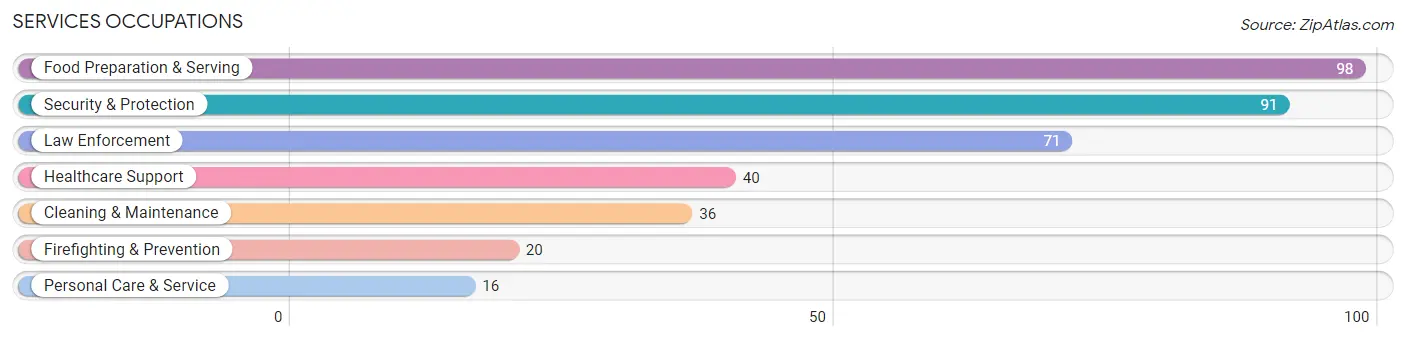
Services Occupations
The most common Services occupations in Owsley County are Food Preparation & Serving (98 | 8.9%), Security & Protection (91 | 8.3%), Law Enforcement (71 | 6.5%), Healthcare Support (40 | 3.6%), and Cleaning & Maintenance (36 | 3.3%).
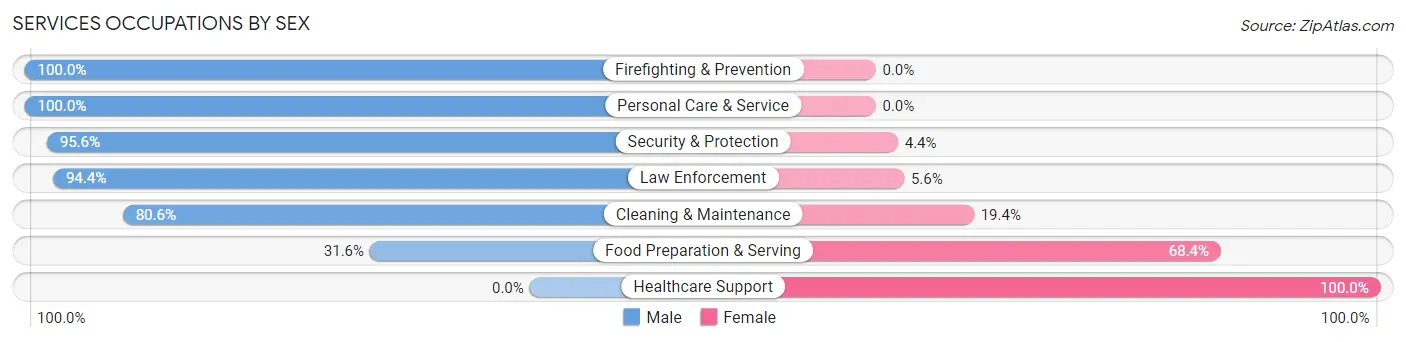
Services Occupations by Sex
Within the Services occupations in Owsley County, the most male-oriented occupations are Firefighting & Prevention (100.0%), Personal Care & Service (100.0%), and Security & Protection (95.6%), while the most female-oriented occupations are Healthcare Support (100.0%), Food Preparation & Serving (68.4%), and Cleaning & Maintenance (19.4%).
| Occupation | Male | Female |
| Healthcare Support | 0 (0.0%) | 40 (100.0%) |
| Security & Protection | 87 (95.6%) | 4 (4.4%) |
| Firefighting & Prevention | 20 (100.0%) | 0 (0.0%) |
| Law Enforcement | 67 (94.4%) | 4 (5.6%) |
| Food Preparation & Serving | 31 (31.6%) | 67 (68.4%) |
| Cleaning & Maintenance | 29 (80.6%) | 7 (19.4%) |
| Personal Care & Service | 16 (100.0%) | 0 (0.0%) |
| Total (Category) | 163 (58.0%) | 118 (42.0%) |
| Total (Overall) | 655 (59.7%) | 443 (40.4%) |
Sales and Office Occupations
The most common Sales and Office occupations in Owsley County are Office & Administration (78 | 7.1%), and Sales & Related (71 | 6.5%).
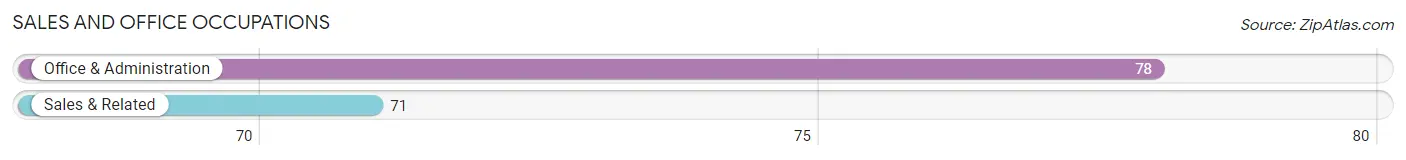
Sales and Office Occupations by Sex
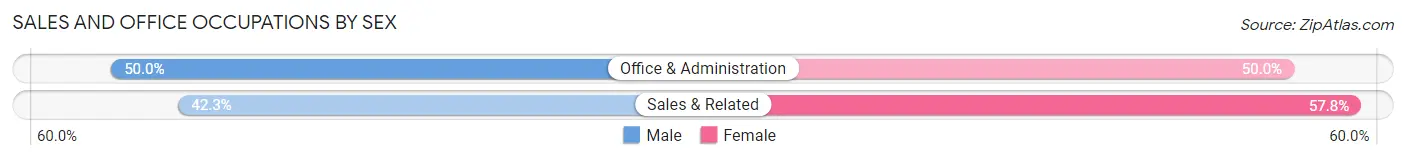
| Occupation | Male | Female |
| Sales & Related | 30 (42.2%) | 41 (57.8%) |
| Office & Administration | 39 (50.0%) | 39 (50.0%) |
| Total (Category) | 69 (46.3%) | 80 (53.7%) |
| Total (Overall) | 655 (59.7%) | 443 (40.4%) |
Natural Resources, Construction and Maintenance Occupations
The most common Natural Resources, Construction and Maintenance occupations in Owsley County are Construction & Extraction (132 | 12.0%), and Installation, Maintenance & Repair (42 | 3.8%).
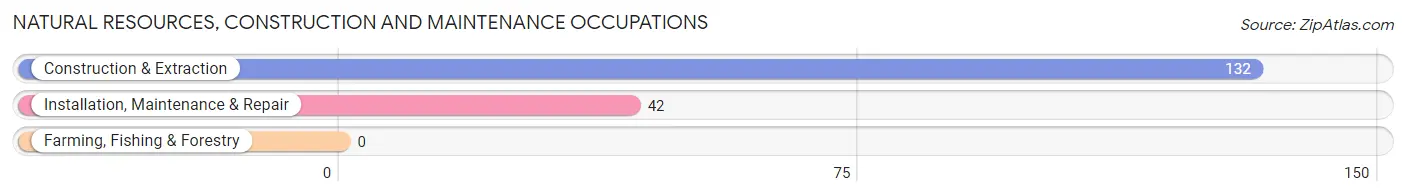
Natural Resources, Construction and Maintenance Occupations by Sex
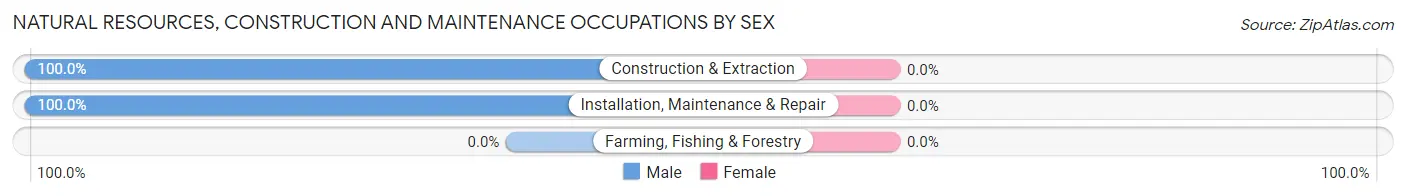
| Occupation | Male | Female |
| Farming, Fishing & Forestry | 0 (0.0%) | 0 (0.0%) |
| Construction & Extraction | 132 (100.0%) | 0 (0.0%) |
| Installation, Maintenance & Repair | 42 (100.0%) | 0 (0.0%) |
| Total (Category) | 174 (100.0%) | 0 (0.0%) |
| Total (Overall) | 655 (59.7%) | 443 (40.4%) |
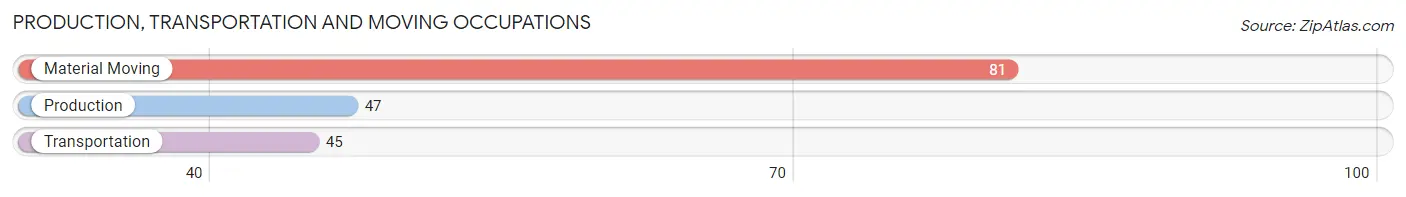
Production, Transportation and Moving Occupations
The most common Production, Transportation and Moving occupations in Owsley County are Material Moving (81 | 7.4%), Production (47 | 4.3%), and Transportation (45 | 4.1%).
Production, Transportation and Moving Occupations by Sex
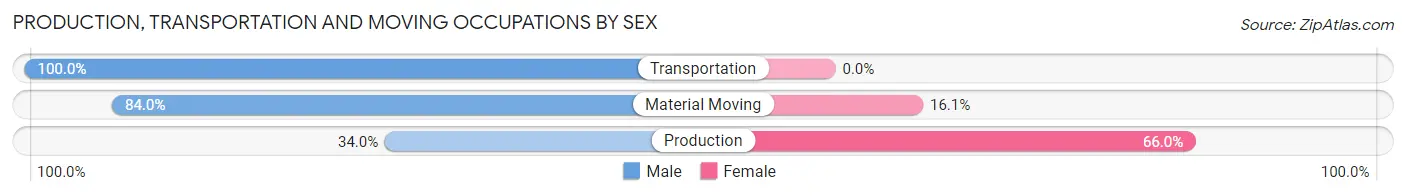
| Occupation | Male | Female |
| Production | 16 (34.0%) | 31 (66.0%) |
| Transportation | 45 (100.0%) | 0 (0.0%) |
| Material Moving | 68 (84.0%) | 13 (16.1%) |
| Total (Category) | 129 (74.6%) | 44 (25.4%) |
| Total (Overall) | 655 (59.7%) | 443 (40.4%) |
Employment Industries by Sex in Owsley County
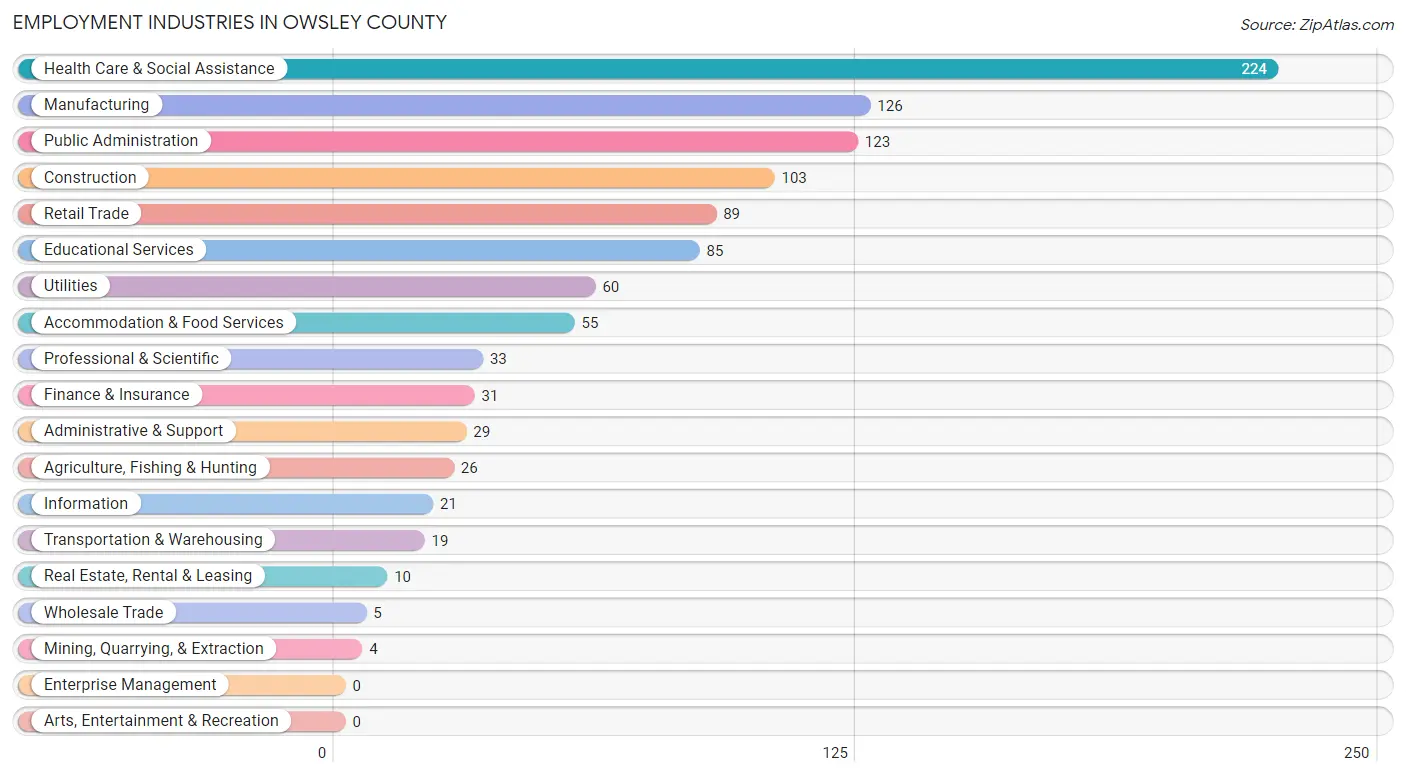
Employment Industries in Owsley County
The major employment industries in Owsley County include Health Care & Social Assistance (224 | 20.4%), Manufacturing (126 | 11.5%), Public Administration (123 | 11.2%), Construction (103 | 9.4%), and Retail Trade (89 | 8.1%).
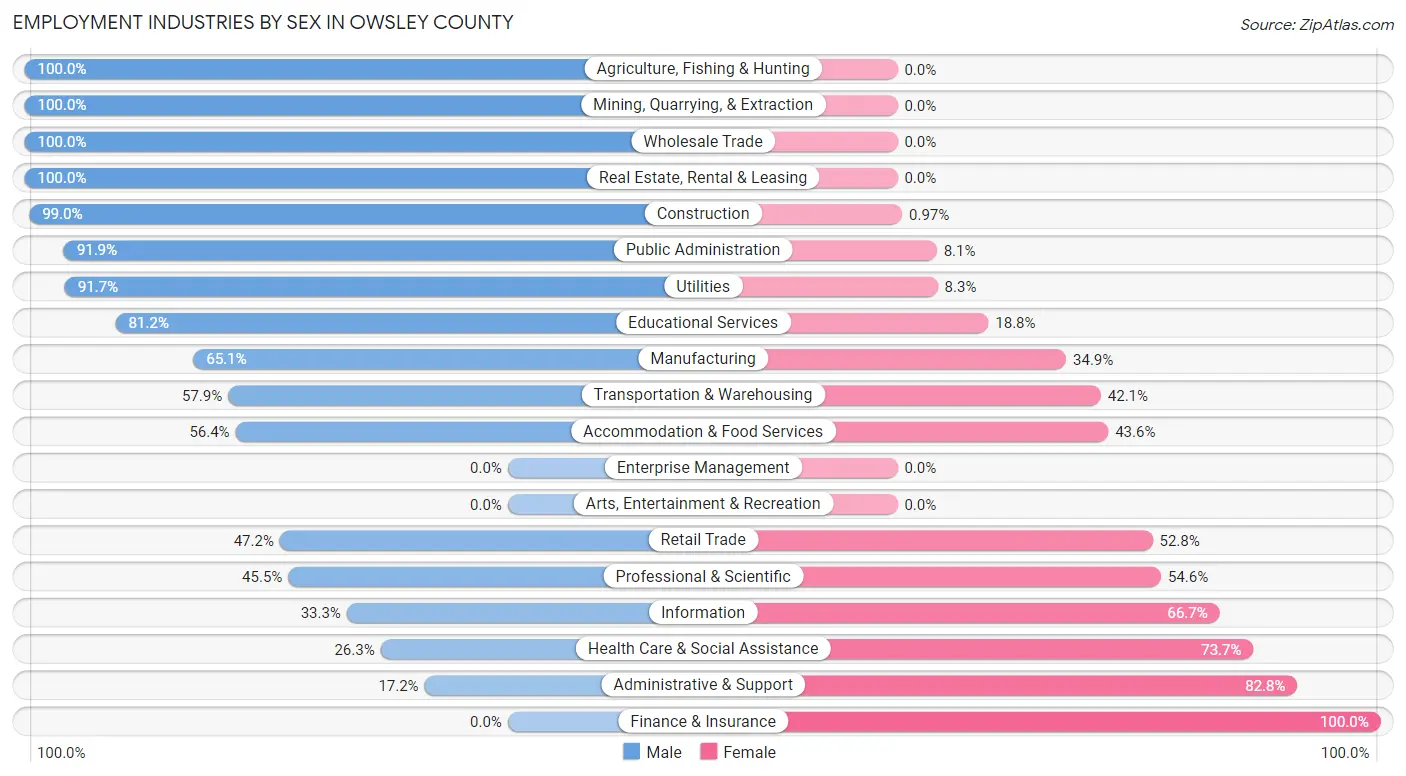
Employment Industries by Sex in Owsley County
The Owsley County industries that see more men than women are Agriculture, Fishing & Hunting (100.0%), Mining, Quarrying, & Extraction (100.0%), and Wholesale Trade (100.0%), whereas the industries that tend to have a higher number of women are Finance & Insurance (100.0%), Administrative & Support (82.8%), and Health Care & Social Assistance (73.7%).
| Industry | Male | Female |
| Agriculture, Fishing & Hunting | 26 (100.0%) | 0 (0.0%) |
| Mining, Quarrying, & Extraction | 4 (100.0%) | 0 (0.0%) |
| Construction | 102 (99.0%) | 1 (1.0%) |
| Manufacturing | 82 (65.1%) | 44 (34.9%) |
| Wholesale Trade | 5 (100.0%) | 0 (0.0%) |
| Retail Trade | 42 (47.2%) | 47 (52.8%) |
| Transportation & Warehousing | 11 (57.9%) | 8 (42.1%) |
| Utilities | 55 (91.7%) | 5 (8.3%) |
| Information | 7 (33.3%) | 14 (66.7%) |
| Finance & Insurance | 0 (0.0%) | 31 (100.0%) |
| Real Estate, Rental & Leasing | 10 (100.0%) | 0 (0.0%) |
| Professional & Scientific | 15 (45.5%) | 18 (54.5%) |
| Enterprise Management | 0 (0.0%) | 0 (0.0%) |
| Administrative & Support | 5 (17.2%) | 24 (82.8%) |
| Educational Services | 69 (81.2%) | 16 (18.8%) |
| Health Care & Social Assistance | 59 (26.3%) | 165 (73.7%) |
| Arts, Entertainment & Recreation | 0 (0.0%) | 0 (0.0%) |
| Accommodation & Food Services | 31 (56.4%) | 24 (43.6%) |
| Public Administration | 113 (91.9%) | 10 (8.1%) |
| Total | 655 (59.7%) | 443 (40.4%) |
Education in Owsley County
School Enrollment in Owsley County
The most common levels of schooling among the 623 students in Owsley County are middle school (176 | 28.2%), high school (164 | 26.3%), and kindergarten (97 | 15.6%).
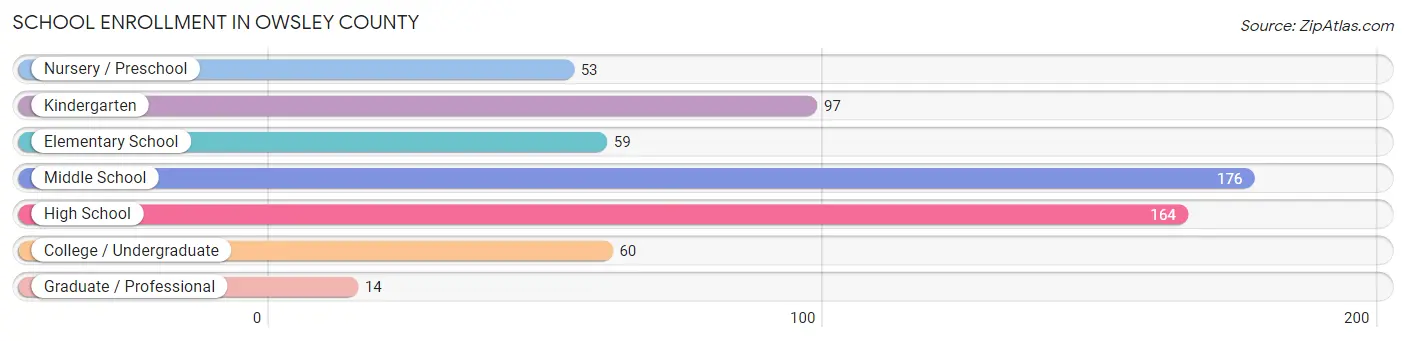
| School Level | # Students | % Students |
| Nursery / Preschool | 53 | 8.5% |
| Kindergarten | 97 | 15.6% |
| Elementary School | 59 | 9.5% |
| Middle School | 176 | 28.2% |
| High School | 164 | 26.3% |
| College / Undergraduate | 60 | 9.6% |
| Graduate / Professional | 14 | 2.2% |
| Total | 623 | 100.0% |
School Enrollment by Age by Funding Source in Owsley County
Out of a total of 623 students who are enrolled in schools in Owsley County, 59 (9.5%) attend a private institution, while the remaining 564 (90.5%) are enrolled in public schools. The age group of 15 to 17 year olds has the highest likelihood of being enrolled in private schools, with 43 (26.5% in the age bracket) enrolled. Conversely, the age group of 3 to 4 year olds has the lowest likelihood of being enrolled in a private school, with 53 (100.0% in the age bracket) attending a public institution.
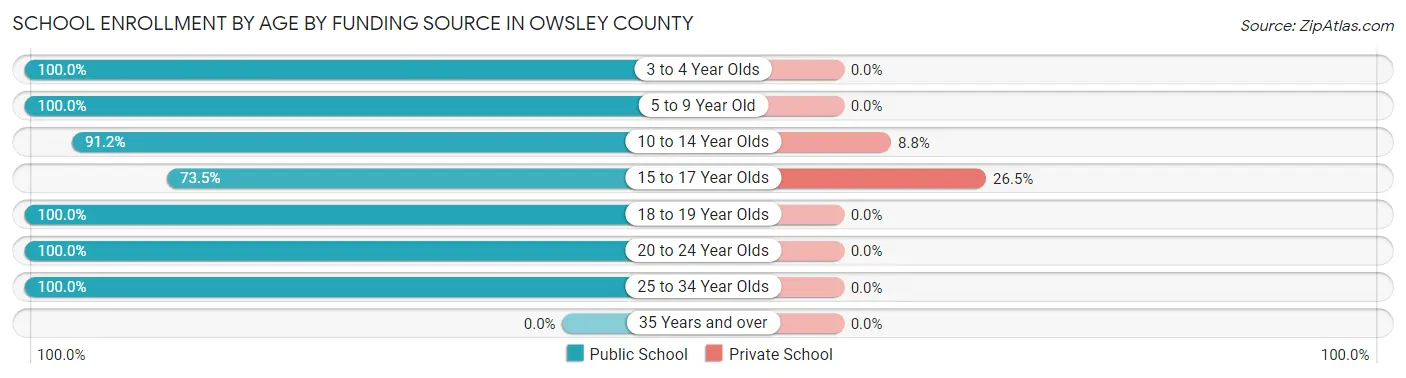
| Age Bracket | Public School | Private School |
| 3 to 4 Year Olds | 53 (100.0%) | 0 (0.0%) |
| 5 to 9 Year Old | 151 (100.0%) | 0 (0.0%) |
| 10 to 14 Year Olds | 165 (91.2%) | 16 (8.8%) |
| 15 to 17 Year Olds | 119 (73.5%) | 43 (26.5%) |
| 18 to 19 Year Olds | 43 (100.0%) | 0 (0.0%) |
| 20 to 24 Year Olds | 19 (100.0%) | 0 (0.0%) |
| 25 to 34 Year Olds | 14 (100.0%) | 0 (0.0%) |
| 35 Years and over | 0 (0.0%) | 0 (0.0%) |
| Total | 564 (90.5%) | 59 (9.5%) |
Educational Attainment by Field of Study in Owsley County
Education (105 | 28.6%), computers & mathematics (49 | 13.4%), social sciences (46 | 12.5%), business (41 | 11.2%), and liberal arts & history (38 | 10.3%) are the most common fields of study among 367 individuals in Owsley County who have obtained a bachelor's degree or higher.
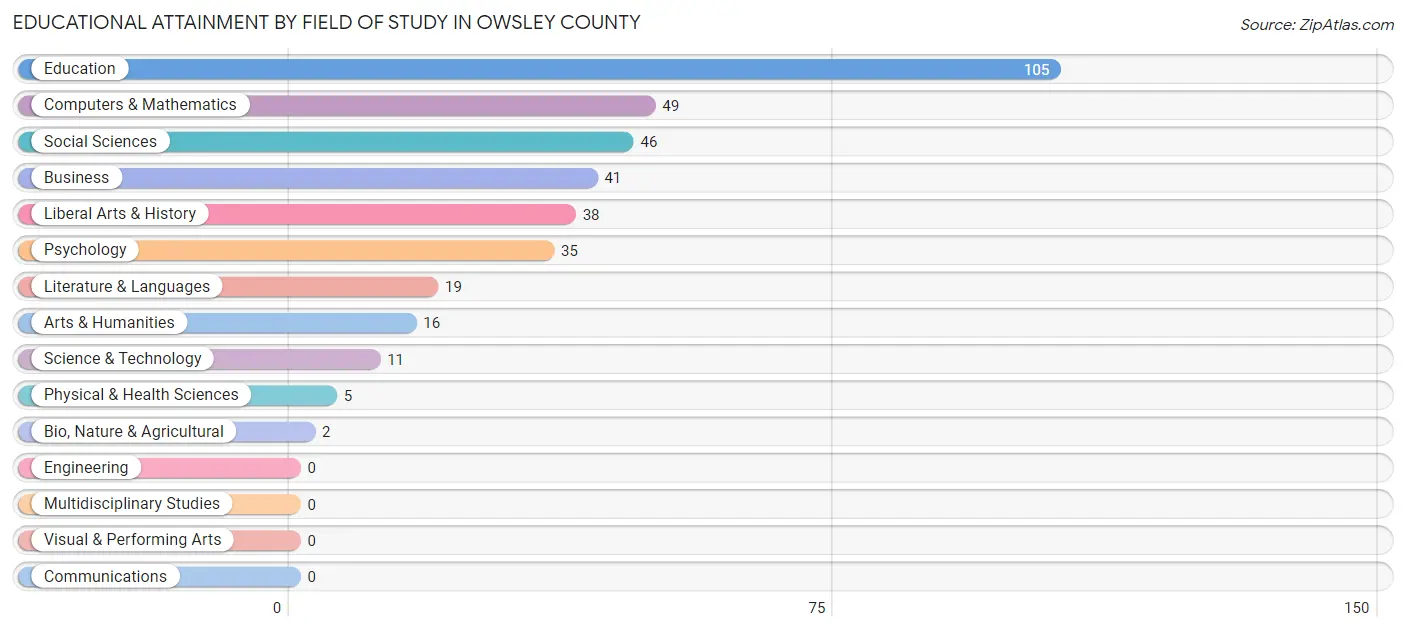
| Field of Study | # Graduates | % Graduates |
| Computers & Mathematics | 49 | 13.4% |
| Bio, Nature & Agricultural | 2 | 0.5% |
| Physical & Health Sciences | 5 | 1.4% |
| Psychology | 35 | 9.5% |
| Social Sciences | 46 | 12.5% |
| Engineering | 0 | 0.0% |
| Multidisciplinary Studies | 0 | 0.0% |
| Science & Technology | 11 | 3.0% |
| Business | 41 | 11.2% |
| Education | 105 | 28.6% |
| Literature & Languages | 19 | 5.2% |
| Liberal Arts & History | 38 | 10.3% |
| Visual & Performing Arts | 0 | 0.0% |
| Communications | 0 | 0.0% |
| Arts & Humanities | 16 | 4.4% |
| Total | 367 | 100.0% |
Transportation & Commute in Owsley County
Vehicle Availability by Sex in Owsley County
The most prevalent vehicle ownership categories in Owsley County are males with 3 vehicles (236, accounting for 36.0%) and females with 3 vehicles (149, making up 54.1%).
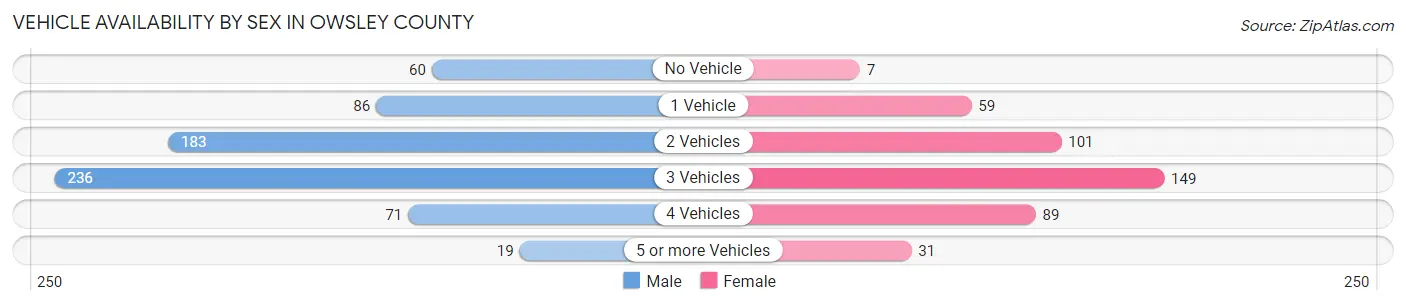
| Vehicles Available | Male | Female |
| No Vehicle | 60 (9.2%) | 7 (1.6%) |
| 1 Vehicle | 86 (13.1%) | 59 (13.5%) |
| 2 Vehicles | 183 (27.9%) | 101 (23.2%) |
| 3 Vehicles | 236 (36.0%) | 149 (34.2%) |
| 4 Vehicles | 71 (10.8%) | 89 (20.4%) |
| 5 or more Vehicles | 19 (2.9%) | 31 (7.1%) |
| Total | 655 (100.0%) | 436 (100.0%) |
Commute Time in Owsley County
The most frequently occuring commute durations in Owsley County are 15 to 19 minutes (228 commuters, 21.8%), 90 or more minutes (180 commuters, 17.2%), and 45 to 59 minutes (157 commuters, 15.0%).
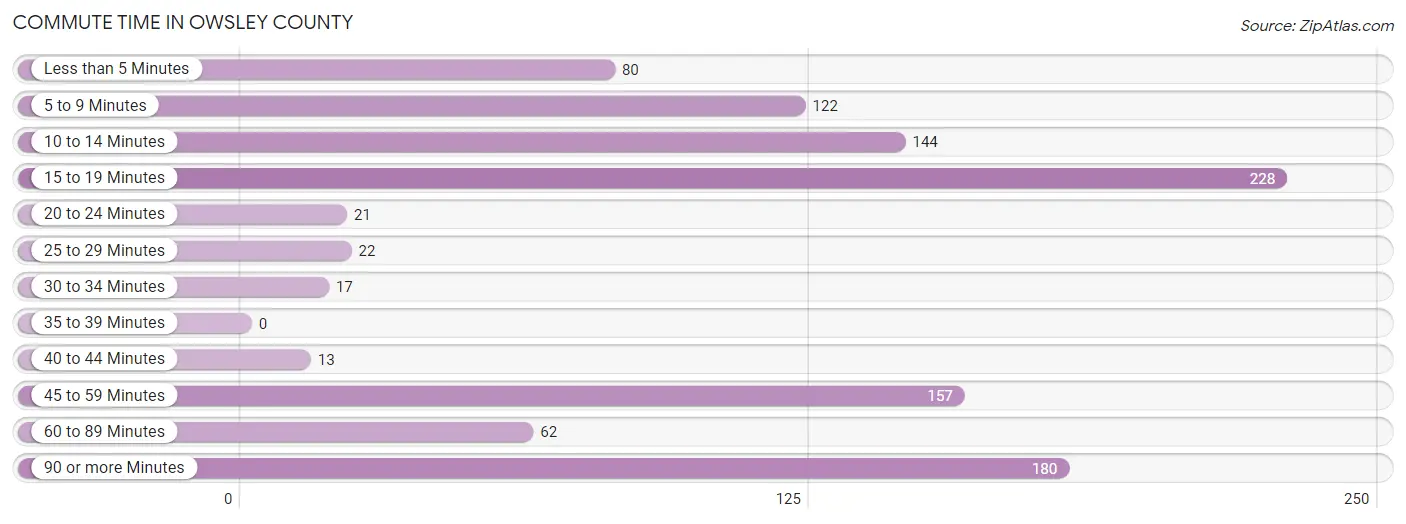
| Commute Time | # Commuters | % Commuters |
| Less than 5 Minutes | 80 | 7.6% |
| 5 to 9 Minutes | 122 | 11.7% |
| 10 to 14 Minutes | 144 | 13.8% |
| 15 to 19 Minutes | 228 | 21.8% |
| 20 to 24 Minutes | 21 | 2.0% |
| 25 to 29 Minutes | 22 | 2.1% |
| 30 to 34 Minutes | 17 | 1.6% |
| 35 to 39 Minutes | 0 | 0.0% |
| 40 to 44 Minutes | 13 | 1.2% |
| 45 to 59 Minutes | 157 | 15.0% |
| 60 to 89 Minutes | 62 | 5.9% |
| 90 or more Minutes | 180 | 17.2% |
Commute Time by Sex in Owsley County
The most common commute times in Owsley County are 90 or more minutes (174 commuters, 27.8%) for males and 15 to 19 minutes (110 commuters, 26.1%) for females.
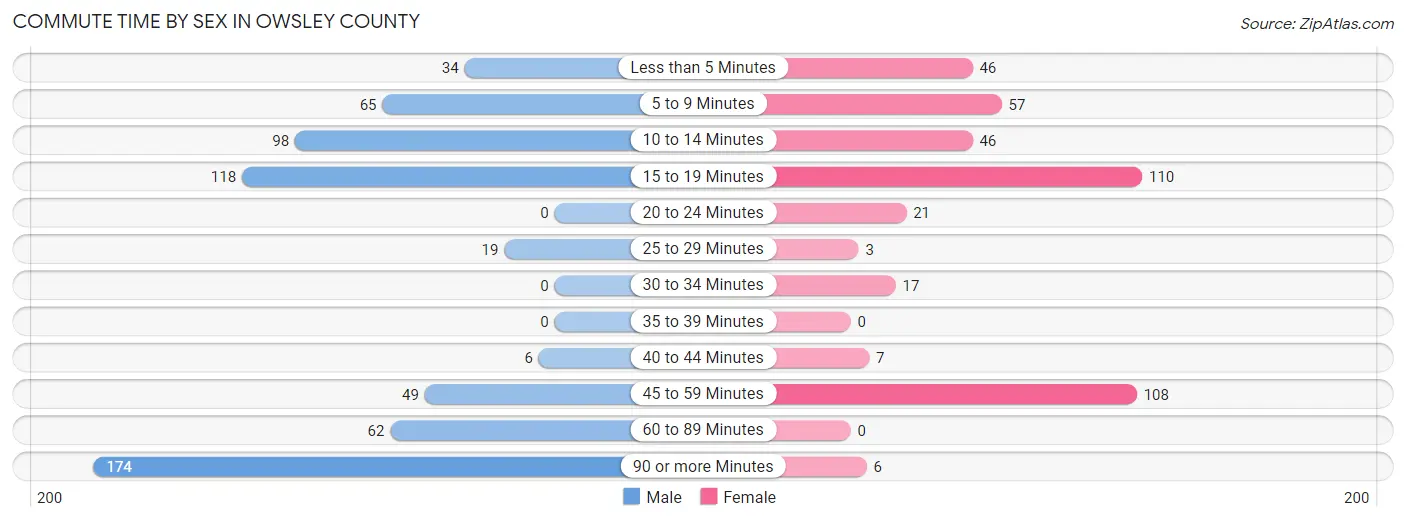
| Commute Time | Male | Female |
| Less than 5 Minutes | 34 (5.4%) | 46 (10.9%) |
| 5 to 9 Minutes | 65 (10.4%) | 57 (13.5%) |
| 10 to 14 Minutes | 98 (15.7%) | 46 (10.9%) |
| 15 to 19 Minutes | 118 (18.9%) | 110 (26.1%) |
| 20 to 24 Minutes | 0 (0.0%) | 21 (5.0%) |
| 25 to 29 Minutes | 19 (3.0%) | 3 (0.7%) |
| 30 to 34 Minutes | 0 (0.0%) | 17 (4.0%) |
| 35 to 39 Minutes | 0 (0.0%) | 0 (0.0%) |
| 40 to 44 Minutes | 6 (1.0%) | 7 (1.7%) |
| 45 to 59 Minutes | 49 (7.8%) | 108 (25.7%) |
| 60 to 89 Minutes | 62 (9.9%) | 0 (0.0%) |
| 90 or more Minutes | 174 (27.8%) | 6 (1.4%) |
Time of Departure to Work by Sex in Owsley County
The most frequent times of departure to work in Owsley County are 12:00 AM to 4:59 AM (145, 23.2%) for males and 7:30 AM to 7:59 AM (91, 21.6%) for females.
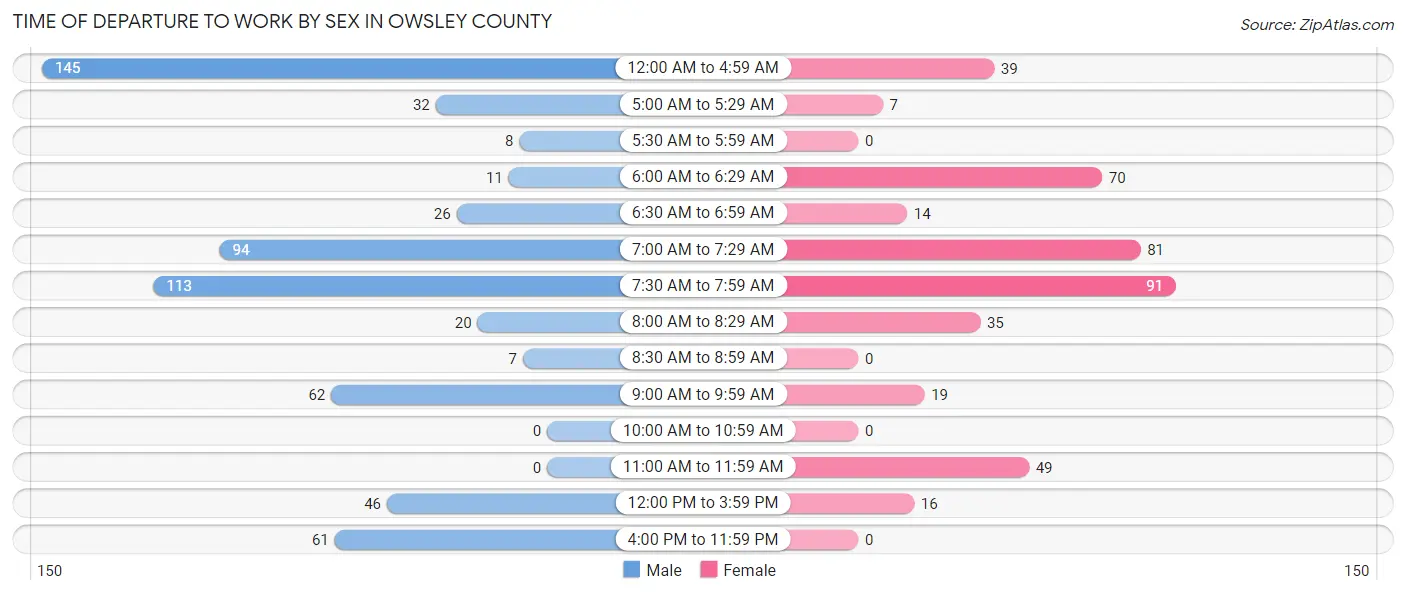
| Time of Departure | Male | Female |
| 12:00 AM to 4:59 AM | 145 (23.2%) | 39 (9.3%) |
| 5:00 AM to 5:29 AM | 32 (5.1%) | 7 (1.7%) |
| 5:30 AM to 5:59 AM | 8 (1.3%) | 0 (0.0%) |
| 6:00 AM to 6:29 AM | 11 (1.8%) | 70 (16.6%) |
| 6:30 AM to 6:59 AM | 26 (4.2%) | 14 (3.3%) |
| 7:00 AM to 7:29 AM | 94 (15.0%) | 81 (19.2%) |
| 7:30 AM to 7:59 AM | 113 (18.1%) | 91 (21.6%) |
| 8:00 AM to 8:29 AM | 20 (3.2%) | 35 (8.3%) |
| 8:30 AM to 8:59 AM | 7 (1.1%) | 0 (0.0%) |
| 9:00 AM to 9:59 AM | 62 (9.9%) | 19 (4.5%) |
| 10:00 AM to 10:59 AM | 0 (0.0%) | 0 (0.0%) |
| 11:00 AM to 11:59 AM | 0 (0.0%) | 49 (11.6%) |
| 12:00 PM to 3:59 PM | 46 (7.4%) | 16 (3.8%) |
| 4:00 PM to 11:59 PM | 61 (9.8%) | 0 (0.0%) |
| Total | 625 (100.0%) | 421 (100.0%) |
Housing Occupancy in Owsley County
Occupancy by Ownership in Owsley County
Of the total 1,383 dwellings in Owsley County, owner-occupied units account for 875 (63.3%), while renter-occupied units make up 508 (36.7%).
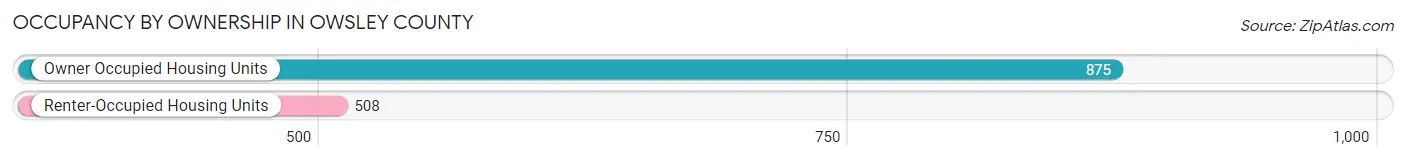
| Occupancy | # Housing Units | % Housing Units |
| Owner Occupied Housing Units | 875 | 63.3% |
| Renter-Occupied Housing Units | 508 | 36.7% |
| Total Occupied Housing Units | 1,383 | 100.0% |
Occupancy by Household Size in Owsley County
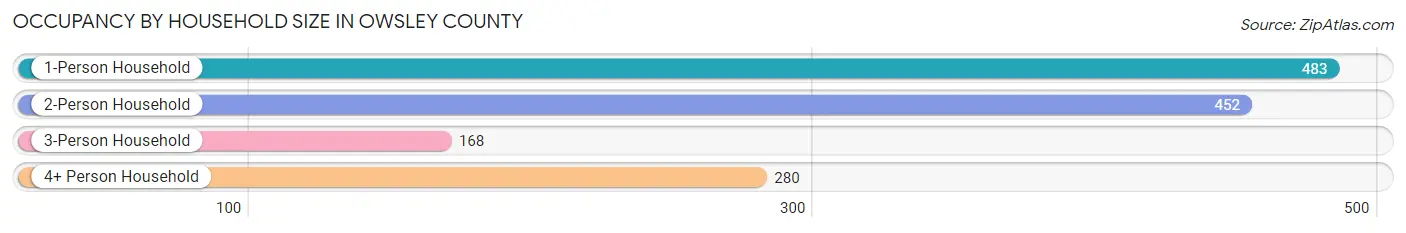
| Household Size | # Housing Units | % Housing Units |
| 1-Person Household | 483 | 34.9% |
| 2-Person Household | 452 | 32.7% |
| 3-Person Household | 168 | 12.1% |
| 4+ Person Household | 280 | 20.3% |
| Total Housing Units | 1,383 | 100.0% |
Occupancy by Ownership by Household Size in Owsley County
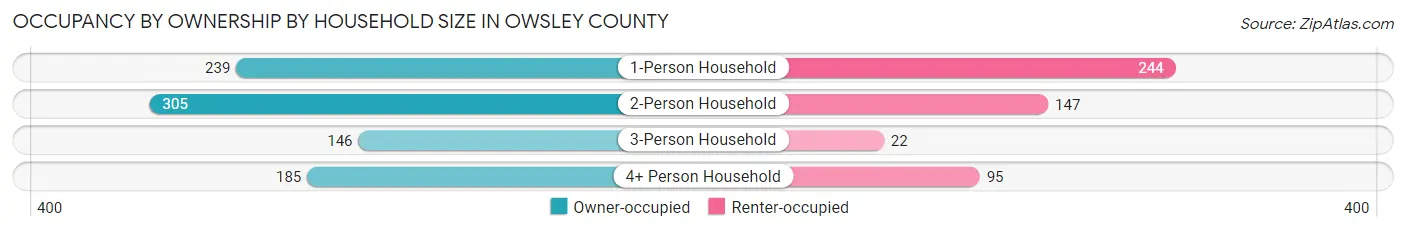
| Household Size | Owner-occupied | Renter-occupied |
| 1-Person Household | 239 (49.5%) | 244 (50.5%) |
| 2-Person Household | 305 (67.5%) | 147 (32.5%) |
| 3-Person Household | 146 (86.9%) | 22 (13.1%) |
| 4+ Person Household | 185 (66.1%) | 95 (33.9%) |
| Total Housing Units | 875 (63.3%) | 508 (36.7%) |
Occupancy by Educational Attainment in Owsley County
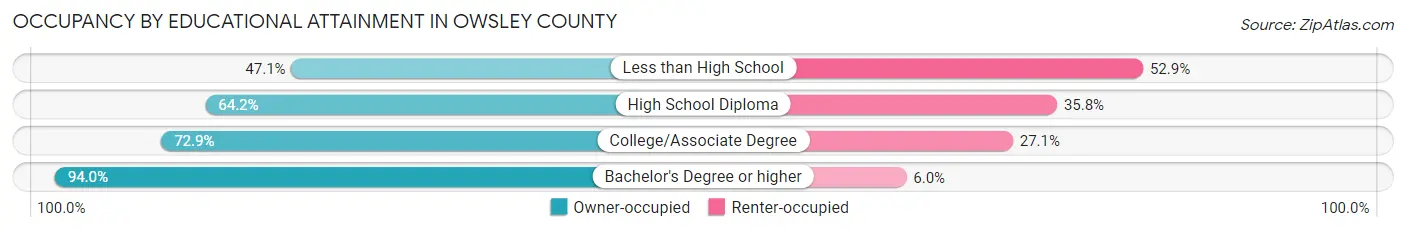
| Household Size | Owner-occupied | Renter-occupied |
| Less than High School | 244 (47.1%) | 274 (52.9%) |
| High School Diploma | 256 (64.2%) | 143 (35.8%) |
| College/Associate Degree | 218 (72.9%) | 81 (27.1%) |
| Bachelor's Degree or higher | 157 (94.0%) | 10 (6.0%) |
Occupancy by Age of Householder in Owsley County
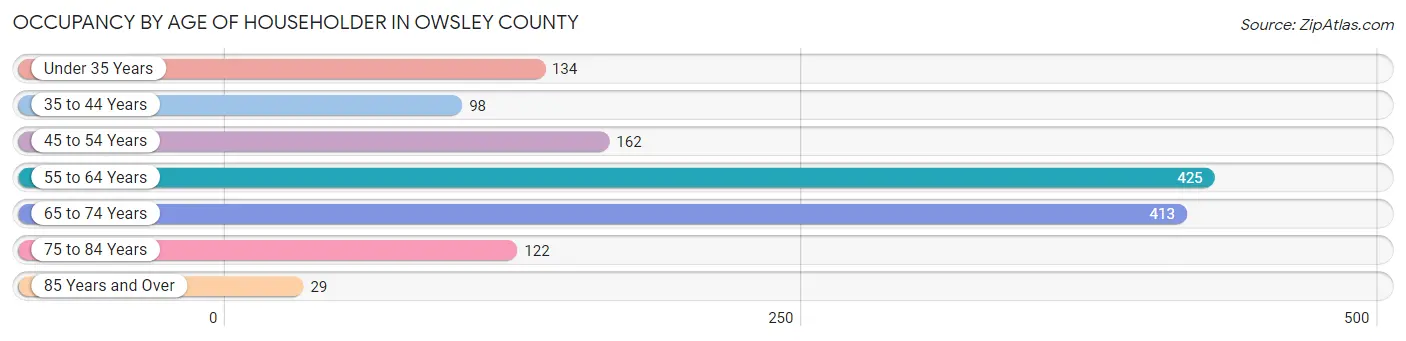
| Age Bracket | # Households | % Households |
| Under 35 Years | 134 | 9.7% |
| 35 to 44 Years | 98 | 7.1% |
| 45 to 54 Years | 162 | 11.7% |
| 55 to 64 Years | 425 | 30.7% |
| 65 to 74 Years | 413 | 29.9% |
| 75 to 84 Years | 122 | 8.8% |
| 85 Years and Over | 29 | 2.1% |
| Total | 1,383 | 100.0% |
Housing Finances in Owsley County
Median Income by Occupancy in Owsley County
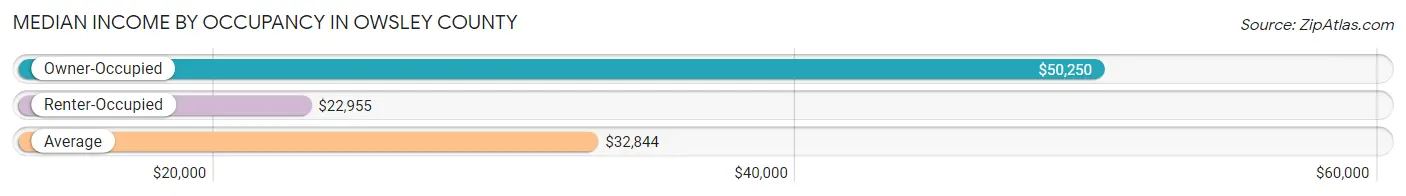
| Occupancy Type | # Households | Median Income |
| Owner-Occupied | 875 (63.3%) | $50,250 |
| Renter-Occupied | 508 (36.7%) | $22,955 |
| Average | 1,383 (100.0%) | $32,844 |
Occupancy by Householder Income Bracket in Owsley County
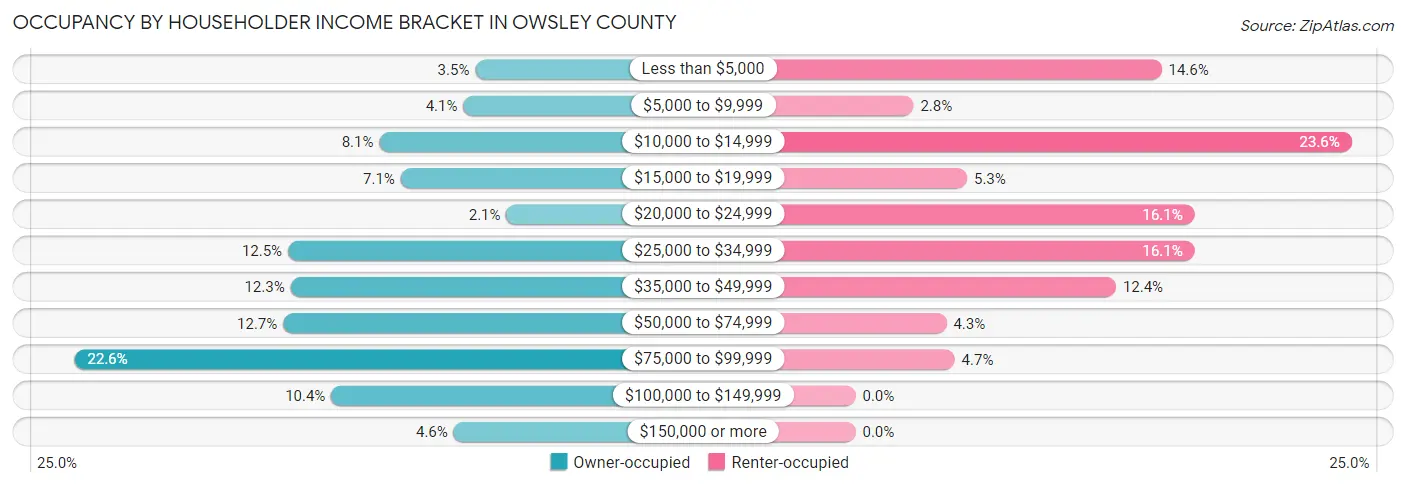
| Income Bracket | Owner-occupied | Renter-occupied |
| Less than $5,000 | 31 (3.5%) | 74 (14.6%) |
| $5,000 to $9,999 | 36 (4.1%) | 14 (2.8%) |
| $10,000 to $14,999 | 71 (8.1%) | 120 (23.6%) |
| $15,000 to $19,999 | 62 (7.1%) | 27 (5.3%) |
| $20,000 to $24,999 | 18 (2.1%) | 82 (16.1%) |
| $25,000 to $34,999 | 109 (12.5%) | 82 (16.1%) |
| $35,000 to $49,999 | 108 (12.3%) | 63 (12.4%) |
| $50,000 to $74,999 | 111 (12.7%) | 22 (4.3%) |
| $75,000 to $99,999 | 198 (22.6%) | 24 (4.7%) |
| $100,000 to $149,999 | 91 (10.4%) | 0 (0.0%) |
| $150,000 or more | 40 (4.6%) | 0 (0.0%) |
| Total | 875 (100.0%) | 508 (100.0%) |
Monthly Housing Cost Tiers in Owsley County
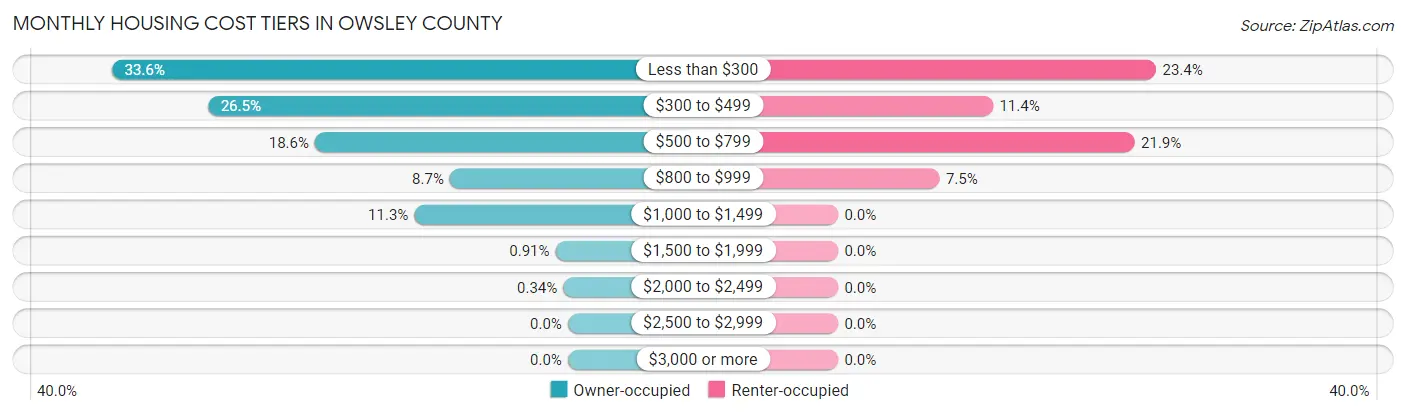
| Monthly Cost | Owner-occupied | Renter-occupied |
| Less than $300 | 294 (33.6%) | 119 (23.4%) |
| $300 to $499 | 232 (26.5%) | 58 (11.4%) |
| $500 to $799 | 163 (18.6%) | 111 (21.8%) |
| $800 to $999 | 76 (8.7%) | 38 (7.5%) |
| $1,000 to $1,499 | 99 (11.3%) | 0 (0.0%) |
| $1,500 to $1,999 | 8 (0.9%) | 0 (0.0%) |
| $2,000 to $2,499 | 3 (0.3%) | 0 (0.0%) |
| $2,500 to $2,999 | 0 (0.0%) | 0 (0.0%) |
| $3,000 or more | 0 (0.0%) | 0 (0.0%) |
| Total | 875 (100.0%) | 508 (100.0%) |
Physical Housing Characteristics in Owsley County
Housing Structures in Owsley County
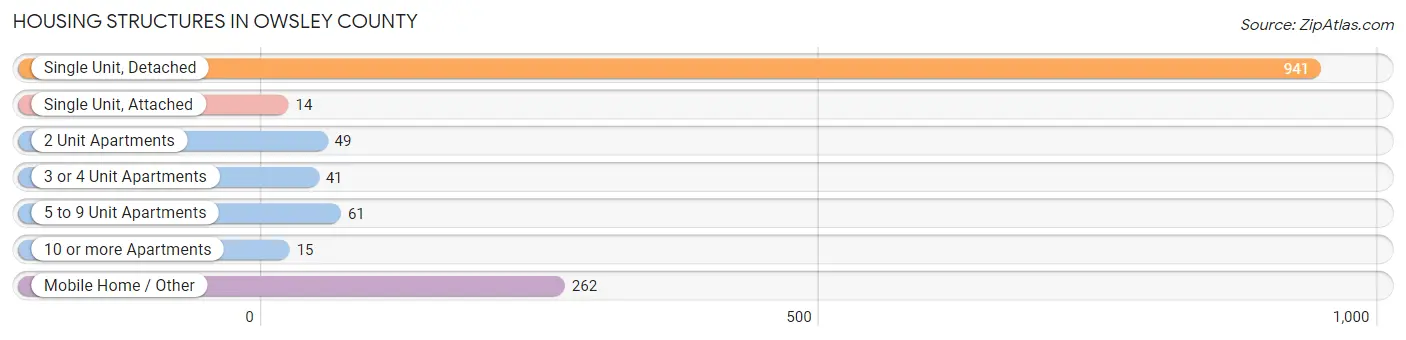
| Structure Type | # Housing Units | % Housing Units |
| Single Unit, Detached | 941 | 68.0% |
| Single Unit, Attached | 14 | 1.0% |
| 2 Unit Apartments | 49 | 3.5% |
| 3 or 4 Unit Apartments | 41 | 3.0% |
| 5 to 9 Unit Apartments | 61 | 4.4% |
| 10 or more Apartments | 15 | 1.1% |
| Mobile Home / Other | 262 | 18.9% |
| Total | 1,383 | 100.0% |
Housing Structures by Occupancy in Owsley County
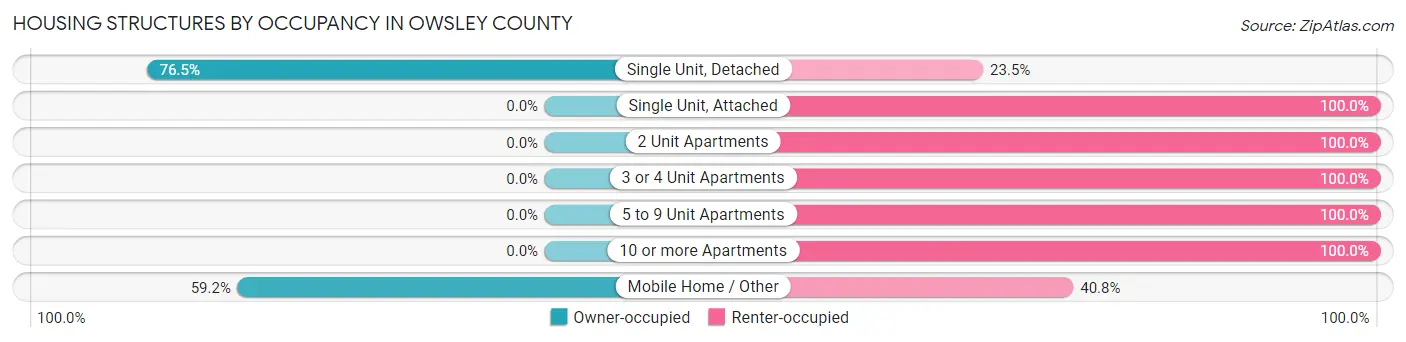
| Structure Type | Owner-occupied | Renter-occupied |
| Single Unit, Detached | 720 (76.5%) | 221 (23.5%) |
| Single Unit, Attached | 0 (0.0%) | 14 (100.0%) |
| 2 Unit Apartments | 0 (0.0%) | 49 (100.0%) |
| 3 or 4 Unit Apartments | 0 (0.0%) | 41 (100.0%) |
| 5 to 9 Unit Apartments | 0 (0.0%) | 61 (100.0%) |
| 10 or more Apartments | 0 (0.0%) | 15 (100.0%) |
| Mobile Home / Other | 155 (59.2%) | 107 (40.8%) |
| Total | 875 (63.3%) | 508 (36.7%) |
Housing Structures by Number of Rooms in Owsley County
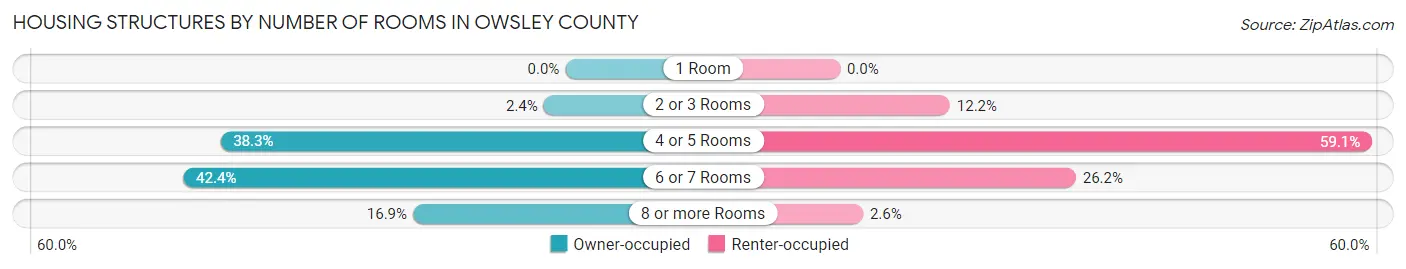
| Number of Rooms | Owner-occupied | Renter-occupied |
| 1 Room | 0 (0.0%) | 0 (0.0%) |
| 2 or 3 Rooms | 21 (2.4%) | 62 (12.2%) |
| 4 or 5 Rooms | 335 (38.3%) | 300 (59.1%) |
| 6 or 7 Rooms | 371 (42.4%) | 133 (26.2%) |
| 8 or more Rooms | 148 (16.9%) | 13 (2.6%) |
| Total | 875 (100.0%) | 508 (100.0%) |
Housing Structure by Heating Type in Owsley County
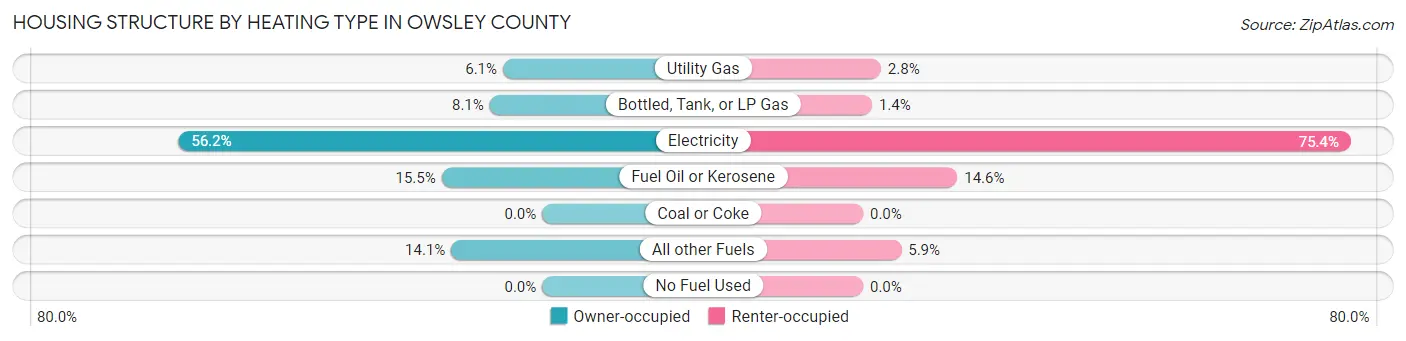
| Heating Type | Owner-occupied | Renter-occupied |
| Utility Gas | 53 (6.1%) | 14 (2.8%) |
| Bottled, Tank, or LP Gas | 71 (8.1%) | 7 (1.4%) |
| Electricity | 492 (56.2%) | 383 (75.4%) |
| Fuel Oil or Kerosene | 136 (15.5%) | 74 (14.6%) |
| Coal or Coke | 0 (0.0%) | 0 (0.0%) |
| All other Fuels | 123 (14.1%) | 30 (5.9%) |
| No Fuel Used | 0 (0.0%) | 0 (0.0%) |
| Total | 875 (100.0%) | 508 (100.0%) |
Household Vehicle Usage in Owsley County
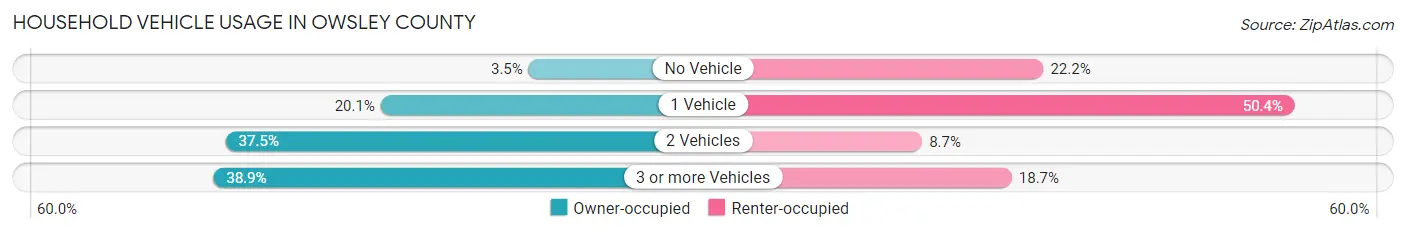
| Vehicles per Household | Owner-occupied | Renter-occupied |
| No Vehicle | 31 (3.5%) | 113 (22.2%) |
| 1 Vehicle | 176 (20.1%) | 256 (50.4%) |
| 2 Vehicles | 328 (37.5%) | 44 (8.7%) |
| 3 or more Vehicles | 340 (38.9%) | 95 (18.7%) |
| Total | 875 (100.0%) | 508 (100.0%) |
Real Estate & Mortgages in Owsley County
Real Estate and Mortgage Overview in Owsley County
| Characteristic | Without Mortgage | With Mortgage |
| Housing Units | 605 | 270 |
| Median Property Value | $69,200 | $96,400 |
| Median Household Income | $40,417 | $0 |
| Monthly Housing Costs | $312 | $0 |
| Real Estate Taxes | $562 | $8 |
Property Value by Mortgage Status in Owsley County
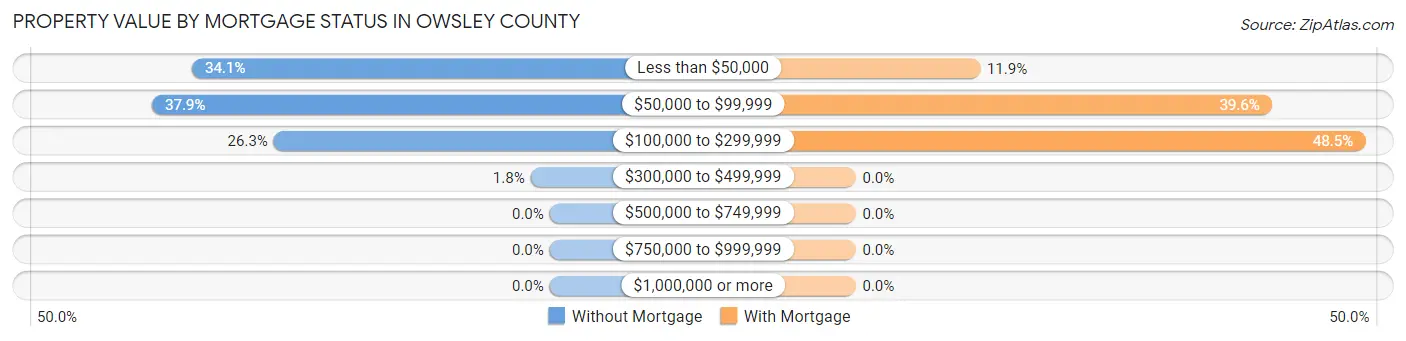
| Property Value | Without Mortgage | With Mortgage |
| Less than $50,000 | 206 (34.1%) | 32 (11.8%) |
| $50,000 to $99,999 | 229 (37.9%) | 107 (39.6%) |
| $100,000 to $299,999 | 159 (26.3%) | 131 (48.5%) |
| $300,000 to $499,999 | 11 (1.8%) | 0 (0.0%) |
| $500,000 to $749,999 | 0 (0.0%) | 0 (0.0%) |
| $750,000 to $999,999 | 0 (0.0%) | 0 (0.0%) |
| $1,000,000 or more | 0 (0.0%) | 0 (0.0%) |
| Total | 605 (100.0%) | 270 (100.0%) |
Household Income by Mortgage Status in Owsley County
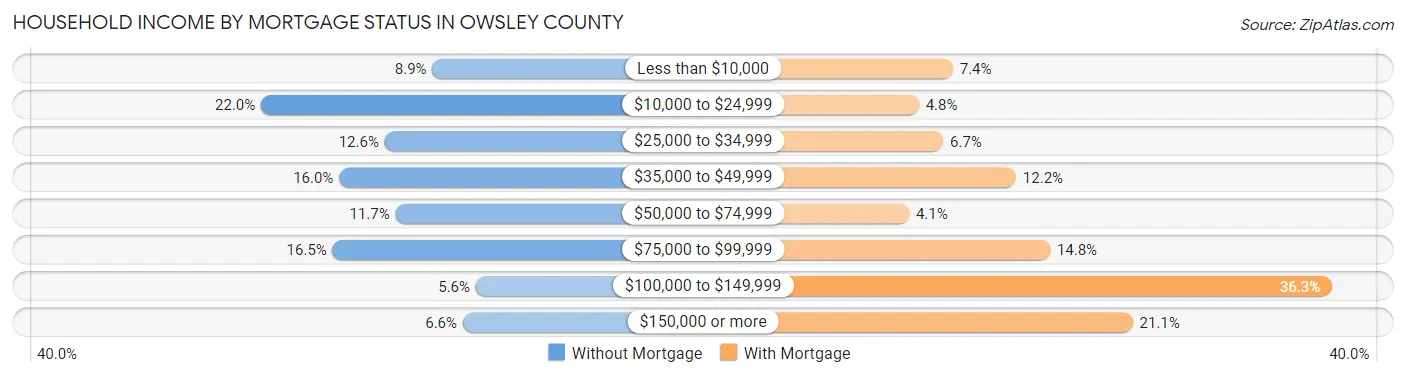
| Household Income | Without Mortgage | With Mortgage |
| Less than $10,000 | 54 (8.9%) | 20 (7.4%) |
| $10,000 to $24,999 | 133 (22.0%) | 13 (4.8%) |
| $25,000 to $34,999 | 76 (12.6%) | 18 (6.7%) |
| $35,000 to $49,999 | 97 (16.0%) | 33 (12.2%) |
| $50,000 to $74,999 | 71 (11.7%) | 11 (4.1%) |
| $75,000 to $99,999 | 100 (16.5%) | 40 (14.8%) |
| $100,000 to $149,999 | 34 (5.6%) | 98 (36.3%) |
| $150,000 or more | 40 (6.6%) | 57 (21.1%) |
| Total | 605 (100.0%) | 270 (100.0%) |
Property Value to Household Income Ratio in Owsley County
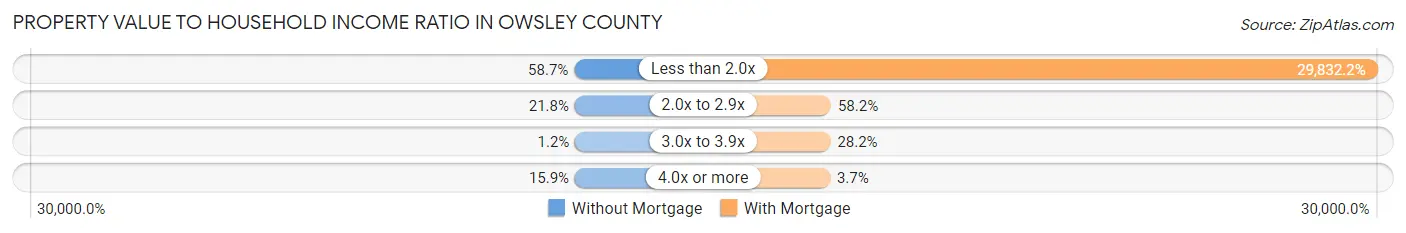
| Value-to-Income Ratio | Without Mortgage | With Mortgage |
| Less than 2.0x | 355 (58.7%) | 80,547 (29,832.2%) |
| 2.0x to 2.9x | 132 (21.8%) | 157 (58.2%) |
| 3.0x to 3.9x | 7 (1.2%) | 76 (28.1%) |
| 4.0x or more | 96 (15.9%) | 10 (3.7%) |
| Total | 605 (100.0%) | 270 (100.0%) |
Real Estate Taxes by Mortgage Status in Owsley County
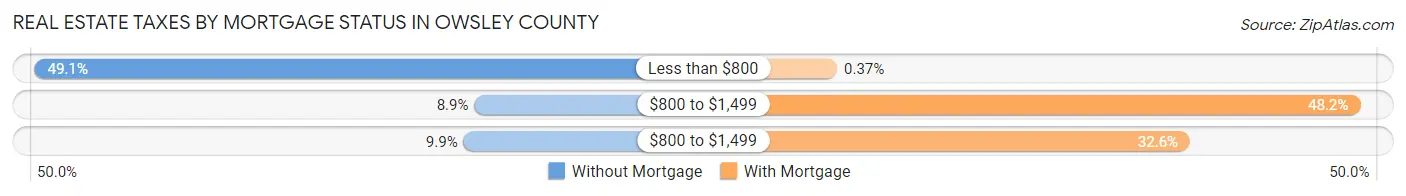
| Property Taxes | Without Mortgage | With Mortgage |
| Less than $800 | 297 (49.1%) | 1 (0.4%) |
| $800 to $1,499 | 54 (8.9%) | 130 (48.1%) |
| $800 to $1,499 | 60 (9.9%) | 88 (32.6%) |
| Total | 605 (100.0%) | 270 (100.0%) |
Health & Disability in Owsley County
Health Insurance Coverage by Age in Owsley County
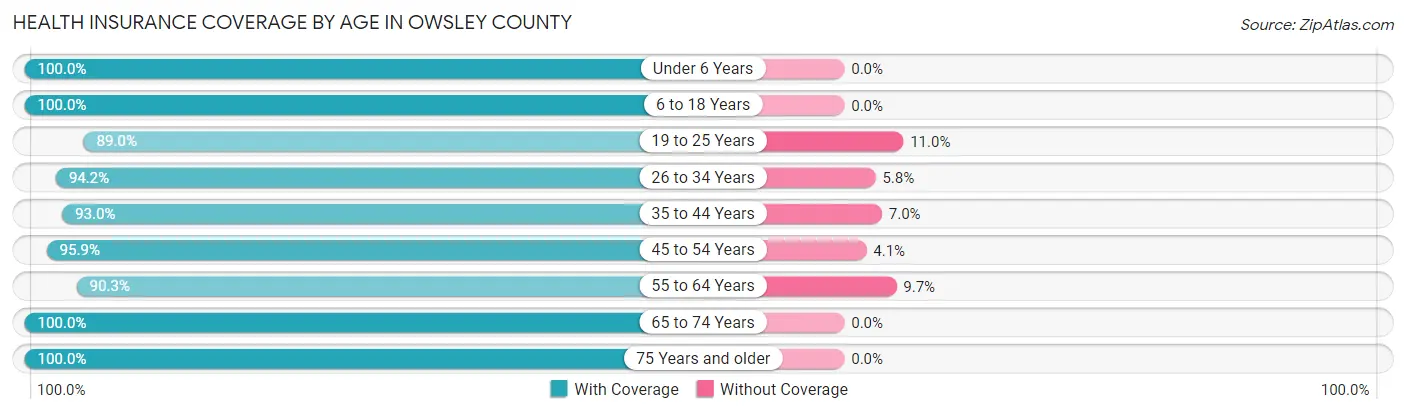
| Age Bracket | With Coverage | Without Coverage |
| Under 6 Years | 283 (100.0%) | 0 (0.0%) |
| 6 to 18 Years | 506 (100.0%) | 0 (0.0%) |
| 19 to 25 Years | 316 (89.0%) | 39 (11.0%) |
| 26 to 34 Years | 259 (94.2%) | 16 (5.8%) |
| 35 to 44 Years | 345 (93.0%) | 26 (7.0%) |
| 45 to 54 Years | 606 (95.9%) | 26 (4.1%) |
| 55 to 64 Years | 652 (90.3%) | 70 (9.7%) |
| 65 to 74 Years | 620 (100.0%) | 0 (0.0%) |
| 75 Years and older | 198 (100.0%) | 0 (0.0%) |
| Total | 3,785 (95.5%) | 177 (4.5%) |
Health Insurance Coverage by Citizenship Status in Owsley County
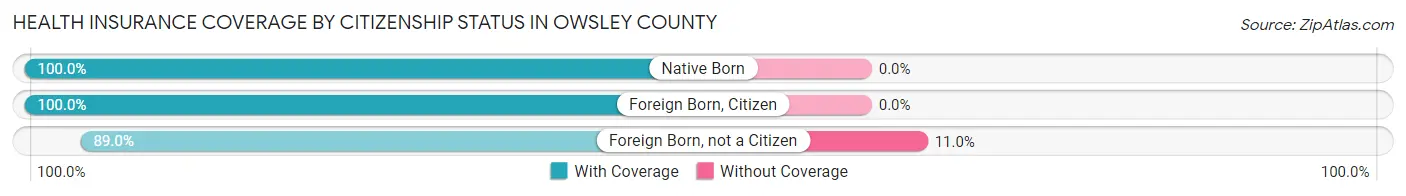
| Citizenship Status | With Coverage | Without Coverage |
| Native Born | 283 (100.0%) | 0 (0.0%) |
| Foreign Born, Citizen | 506 (100.0%) | 0 (0.0%) |
| Foreign Born, not a Citizen | 316 (89.0%) | 39 (11.0%) |
Health Insurance Coverage by Household Income in Owsley County
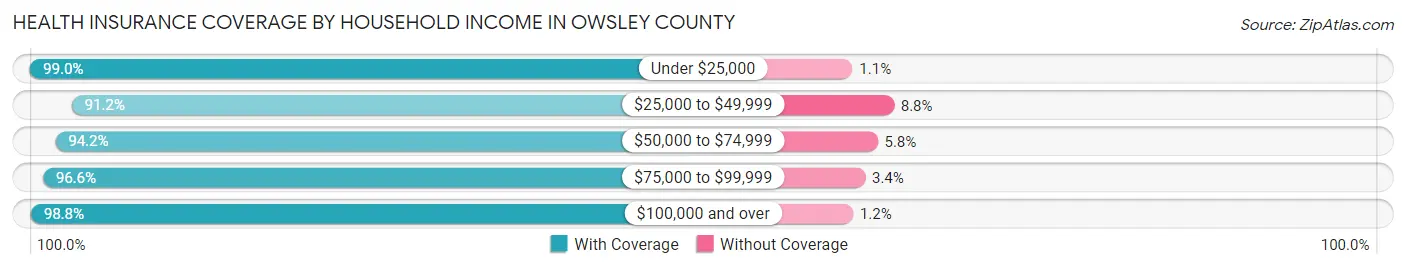
| Household Income | With Coverage | Without Coverage |
| Under $25,000 | 852 (99.0%) | 9 (1.1%) |
| $25,000 to $49,999 | 1,151 (91.2%) | 111 (8.8%) |
| $50,000 to $74,999 | 393 (94.2%) | 24 (5.8%) |
| $75,000 to $99,999 | 706 (96.6%) | 25 (3.4%) |
| $100,000 and over | 683 (98.8%) | 8 (1.2%) |
Public vs Private Health Insurance Coverage by Age in Owsley County
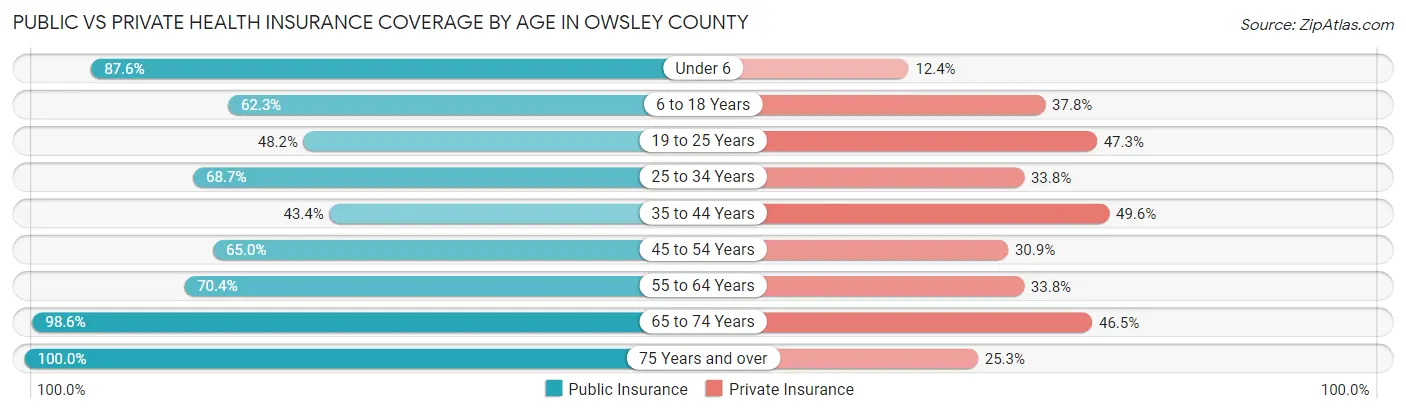
| Age Bracket | Public Insurance | Private Insurance |
| Under 6 | 248 (87.6%) | 35 (12.4%) |
| 6 to 18 Years | 315 (62.3%) | 191 (37.8%) |
| 19 to 25 Years | 171 (48.2%) | 168 (47.3%) |
| 25 to 34 Years | 189 (68.7%) | 93 (33.8%) |
| 35 to 44 Years | 161 (43.4%) | 184 (49.6%) |
| 45 to 54 Years | 411 (65.0%) | 195 (30.8%) |
| 55 to 64 Years | 508 (70.4%) | 244 (33.8%) |
| 65 to 74 Years | 611 (98.6%) | 288 (46.5%) |
| 75 Years and over | 198 (100.0%) | 50 (25.3%) |
| Total | 2,812 (71.0%) | 1,448 (36.5%) |
Disability Status by Sex by Age in Owsley County
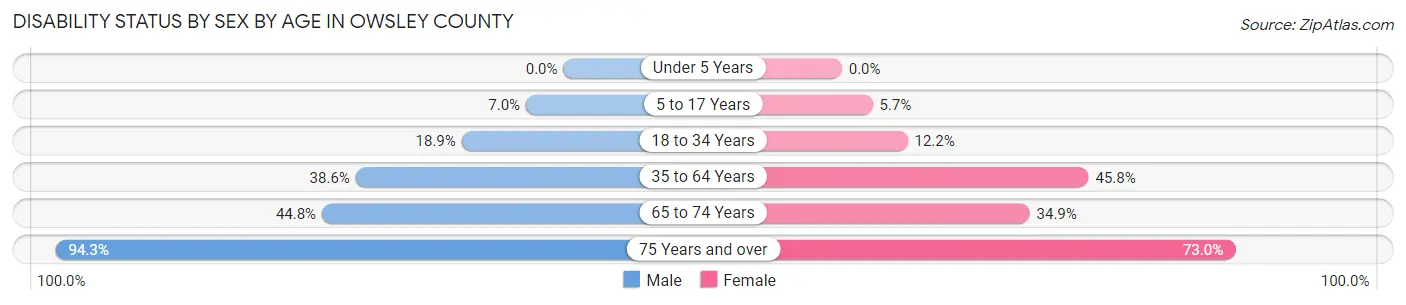
| Age Bracket | Male | Female |
| Under 5 Years | 0 (0.0%) | 0 (0.0%) |
| 5 to 17 Years | 23 (7.0%) | 11 (5.7%) |
| 18 to 34 Years | 72 (18.9%) | 35 (12.2%) |
| 35 to 64 Years | 293 (38.6%) | 442 (45.8%) |
| 65 to 74 Years | 121 (44.8%) | 122 (34.9%) |
| 75 Years and over | 82 (94.3%) | 81 (73.0%) |
Disability Class by Sex by Age in Owsley County
Disability Class: Hearing Difficulty
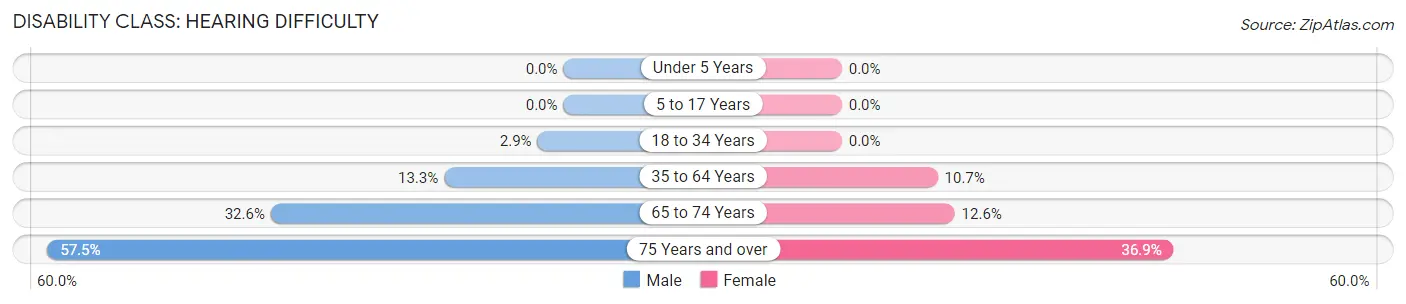
| Age Bracket | Male | Female |
| Under 5 Years | 0 (0.0%) | 0 (0.0%) |
| 5 to 17 Years | 0 (0.0%) | 0 (0.0%) |
| 18 to 34 Years | 11 (2.9%) | 0 (0.0%) |
| 35 to 64 Years | 101 (13.3%) | 103 (10.7%) |
| 65 to 74 Years | 88 (32.6%) | 44 (12.6%) |
| 75 Years and over | 50 (57.5%) | 41 (36.9%) |
Disability Class: Vision Difficulty
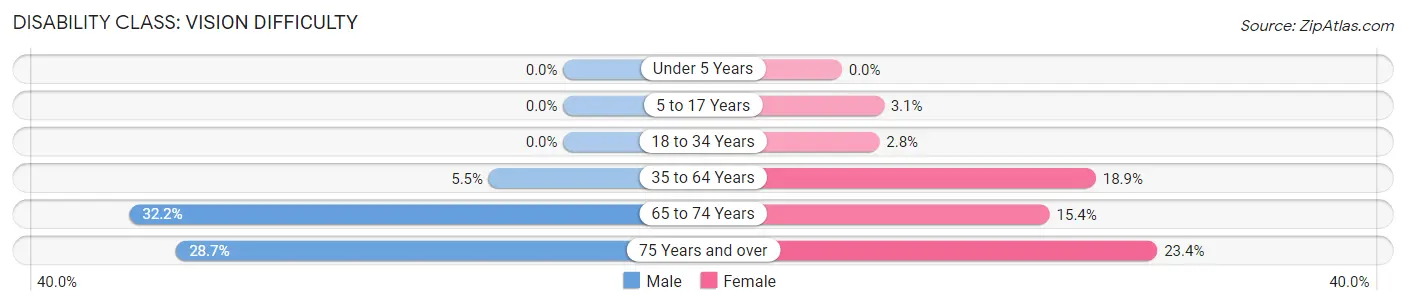
| Age Bracket | Male | Female |
| Under 5 Years | 0 (0.0%) | 0 (0.0%) |
| 5 to 17 Years | 0 (0.0%) | 6 (3.1%) |
| 18 to 34 Years | 0 (0.0%) | 8 (2.8%) |
| 35 to 64 Years | 42 (5.5%) | 182 (18.9%) |
| 65 to 74 Years | 87 (32.2%) | 54 (15.4%) |
| 75 Years and over | 25 (28.7%) | 26 (23.4%) |
Disability Class: Cognitive Difficulty
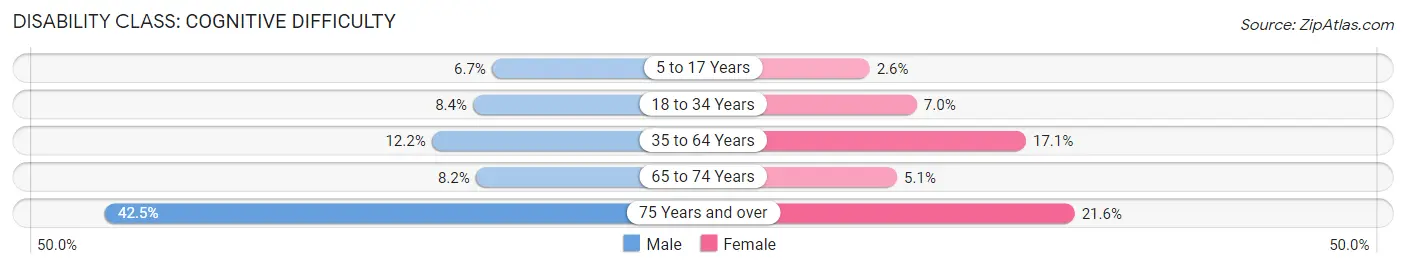
| Age Bracket | Male | Female |
| 5 to 17 Years | 22 (6.7%) | 5 (2.6%) |
| 18 to 34 Years | 32 (8.4%) | 20 (7.0%) |
| 35 to 64 Years | 93 (12.2%) | 165 (17.1%) |
| 65 to 74 Years | 22 (8.2%) | 18 (5.1%) |
| 75 Years and over | 37 (42.5%) | 24 (21.6%) |
Disability Class: Ambulatory Difficulty
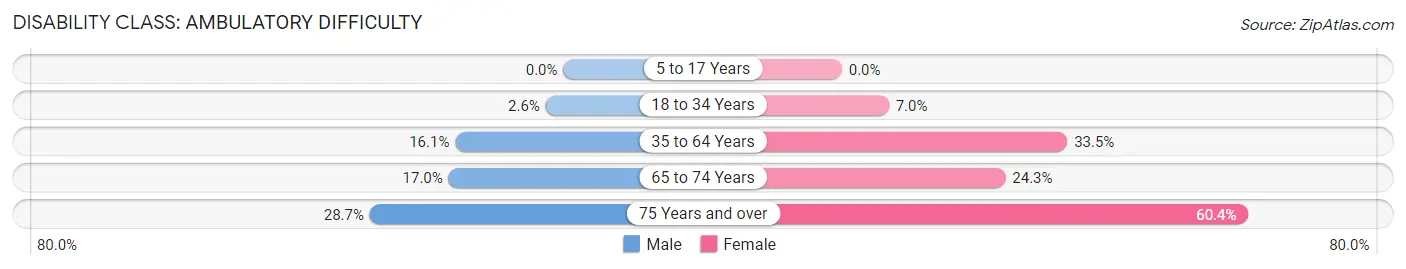
| Age Bracket | Male | Female |
| 5 to 17 Years | 0 (0.0%) | 0 (0.0%) |
| 18 to 34 Years | 10 (2.6%) | 20 (7.0%) |
| 35 to 64 Years | 122 (16.1%) | 323 (33.5%) |
| 65 to 74 Years | 46 (17.0%) | 85 (24.3%) |
| 75 Years and over | 25 (28.7%) | 67 (60.4%) |
Disability Class: Self-Care Difficulty
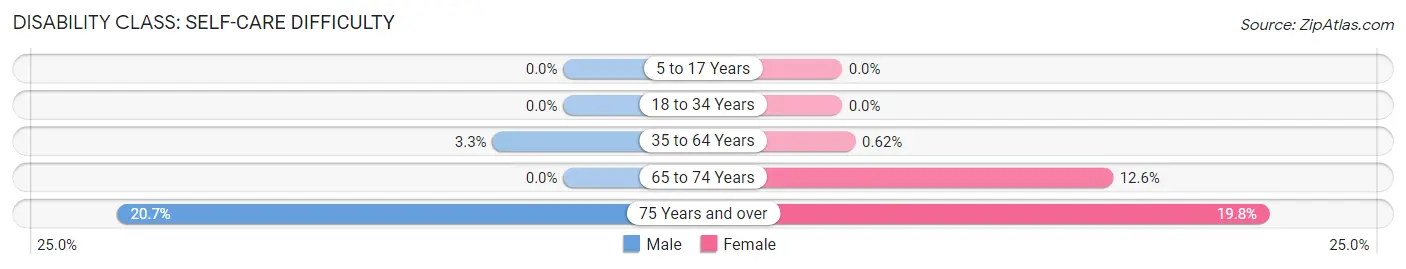
| Age Bracket | Male | Female |
| 5 to 17 Years | 0 (0.0%) | 0 (0.0%) |
| 18 to 34 Years | 0 (0.0%) | 0 (0.0%) |
| 35 to 64 Years | 25 (3.3%) | 6 (0.6%) |
| 65 to 74 Years | 0 (0.0%) | 44 (12.6%) |
| 75 Years and over | 18 (20.7%) | 22 (19.8%) |
Technology Access in Owsley County
Computing Device Access in Owsley County
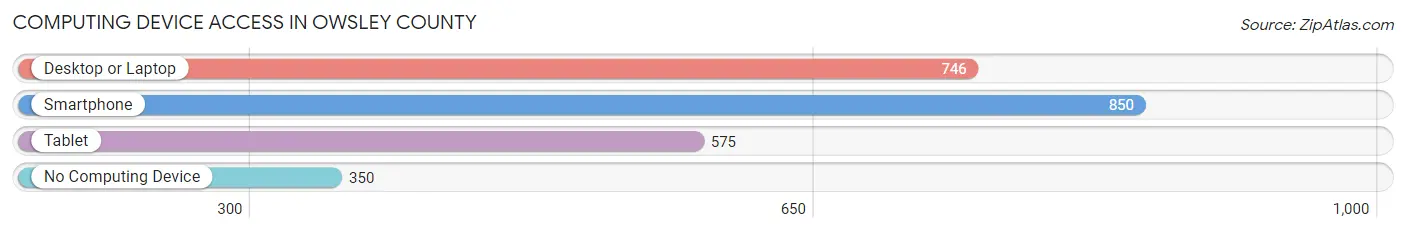
| Device Type | # Households | % Households |
| Desktop or Laptop | 746 | 53.9% |
| Smartphone | 850 | 61.5% |
| Tablet | 575 | 41.6% |
| No Computing Device | 350 | 25.3% |
| Total | 1,383 | 100.0% |
Internet Access in Owsley County
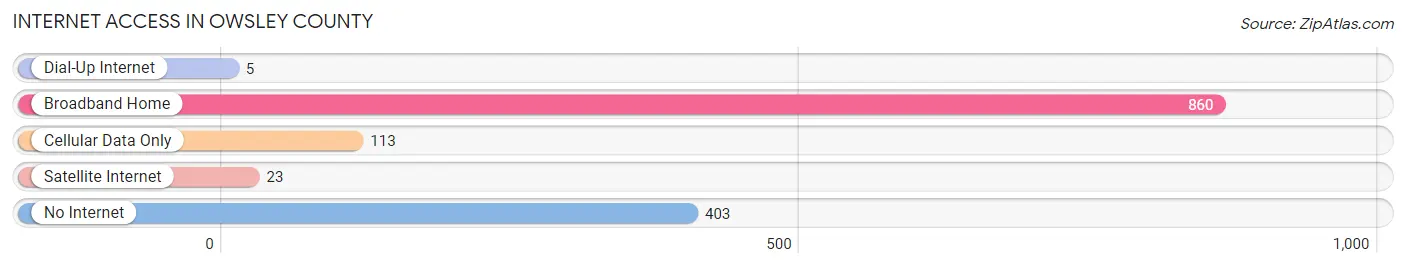
| Internet Type | # Households | % Households |
| Dial-Up Internet | 5 | 0.4% |
| Broadband Home | 860 | 62.2% |
| Cellular Data Only | 113 | 8.2% |
| Satellite Internet | 23 | 1.7% |
| No Internet | 403 | 29.1% |
| Total | 1,383 | 100.0% |
Owsley County Summary
Owsley County is located in the eastern part of Kentucky, in the Appalachian Mountains. It is bordered by Clay County to the north, Jackson County to the east, Lee County to the south, and Breathitt County to the west. The county seat is Booneville, and the county was formed in 1843 from Clay, Estill, and Breathitt counties. The county has a total area of 286 square miles, and a population of 4,755 as of the 2010 census.
Owsley County is known for its rugged terrain and rural lifestyle. The county is mostly mountainous, with the highest point being the summit of Pilot Knob at 2,890 feet. The county is home to the Red River Gorge Geological Area, a National Natural Landmark, and the Daniel Boone National Forest. The county is also home to the Levi Jackson Wilderness Road State Park, which is a recreation area that follows the route of the historic Wilderness Road.
The economy of Owsley County is largely based on agriculture and forestry. The county is home to several large farms, and the majority of the population is employed in the agricultural sector. The county is also home to several timber companies, and the forestry industry is an important part of the local economy.
The demographics of Owsley County are largely rural and white. The population is 97.3% white, 0.7% African American, 0.2% Native American, 0.2% Asian, and 1.6% other. The median household income is $25,944, and the median age is 41.7 years. The poverty rate is 28.3%, and the unemployment rate is 8.2%.
Owsley County is a rural county with a long history and a unique culture. The county is home to a variety of outdoor activities, and the local economy is largely based on agriculture and forestry. The population is largely white, and the median household income is lower than the national average. Despite the challenges of living in a rural area, Owsley County is a beautiful place to live and work.
Common Questions
What is Per Capita Income in Owsley County?
Per Capita income in Owsley County is $19,405.
What is the Median Family Income in Owsley County?
Median Family Income in Owsley County is $48,125.
What is the Median Household income in Owsley County?
Median Household Income in Owsley County is $32,844.
What is Income or Wage Gap in Owsley County?
Income or Wage Gap in Owsley County is 27.1%.
Women in Owsley County earn 72.9 cents for every dollar earned by a man.
What is Family Income Deficit in Owsley County?
Family Income Deficit in Owsley County is $9,058.
Families that are below poverty line in Owsley County earn $9,058 less on average than the poverty threshold level.
What is Inequality or Gini Index in Owsley County?
Inequality or Gini Index in Owsley County is 0.46.
What is the Total Population of Owsley County?
Total Population of Owsley County is 4,054.
What is the Total Male Population of Owsley County?
Total Male Population of Owsley County is 2,009.
What is the Total Female Population of Owsley County?
Total Female Population of Owsley County is 2,045.
What is the Ratio of Males per 100 Females in Owsley County?
There are 98.24 Males per 100 Females in Owsley County.
What is the Ratio of Females per 100 Males in Owsley County?
There are 101.79 Females per 100 Males in Owsley County.
What is the Median Population Age in Owsley County?
Median Population Age in Owsley County is 48.0 Years.
What is the Average Family Size in Owsley County
Average Family Size in Owsley County is 3.5 People.
What is the Average Household Size in Owsley County
Average Household Size in Owsley County is 2.9 People.
How Large is the Labor Force in Owsley County?
There are 1,279 People in the Labor Forcein in Owsley County.
What is the Percentage of People in the Labor Force in Owsley County?
37.2% of People are in the Labor Force in Owsley County.
What is the Unemployment Rate in Owsley County?
Unemployment Rate in Owsley County is 14.2%.