Owen County, KY Map & Demographics
Owen County Overview
$28,446
PER CAPITA INCOME
$74,609
AVG FAMILY INCOME
$56,485
AVG HOUSEHOLD INCOME
7.5%
WAGE / INCOME GAP [ % ]
92.5¢/ $1
WAGE / INCOME GAP [ $ ]
$9,491
FAMILY INCOME DEFICIT
0.44
INEQUALITY / GINI INDEX
11,229
TOTAL POPULATION
5,702
MALE POPULATION
5,527
FEMALE POPULATION
103.17
MALES / 100 FEMALES
96.93
FEMALES / 100 MALES
42.9
MEDIAN AGE
3.3
AVG FAMILY SIZE
2.7
AVG HOUSEHOLD SIZE
5,187
LABOR FORCE [ PEOPLE ]
57.1%
PERCENT IN LABOR FORCE
4.6%
UNEMPLOYMENT RATE
Owen County Area Codes
Income in Owen County
Income Overview in Owen County
Per Capita Income in Owen County is $28,446, while median incomes of families and households are $74,609 and $56,485 respectively.
| Characteristic | Number | Measure |
| Per Capita Income | 11,229 | $28,446 |
| Median Family Income | 2,789 | $74,609 |
| Mean Family Income | 2,789 | $88,380 |
| Median Household Income | 4,146 | $56,485 |
| Mean Household Income | 4,146 | $72,858 |
| Income Deficit | 2,789 | $9,491 |
| Wage / Income Gap (%) | 11,229 | 7.49% |
| Wage / Income Gap ($) | 11,229 | 92.51¢ per $1 |
| Gini / Inequality Index | 11,229 | 0.44 |
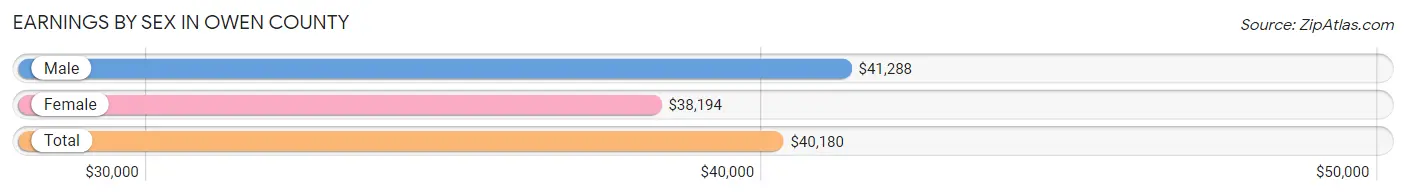
Earnings by Sex in Owen County
Average Earnings in Owen County are $40,180, $41,288 for men and $38,194 for women, a difference of 7.5%.
| Sex | Number | Average Earnings |
| Male | 3,017 (56.8%) | $41,288 |
| Female | 2,298 (43.2%) | $38,194 |
| Total | 5,315 (100.0%) | $40,180 |
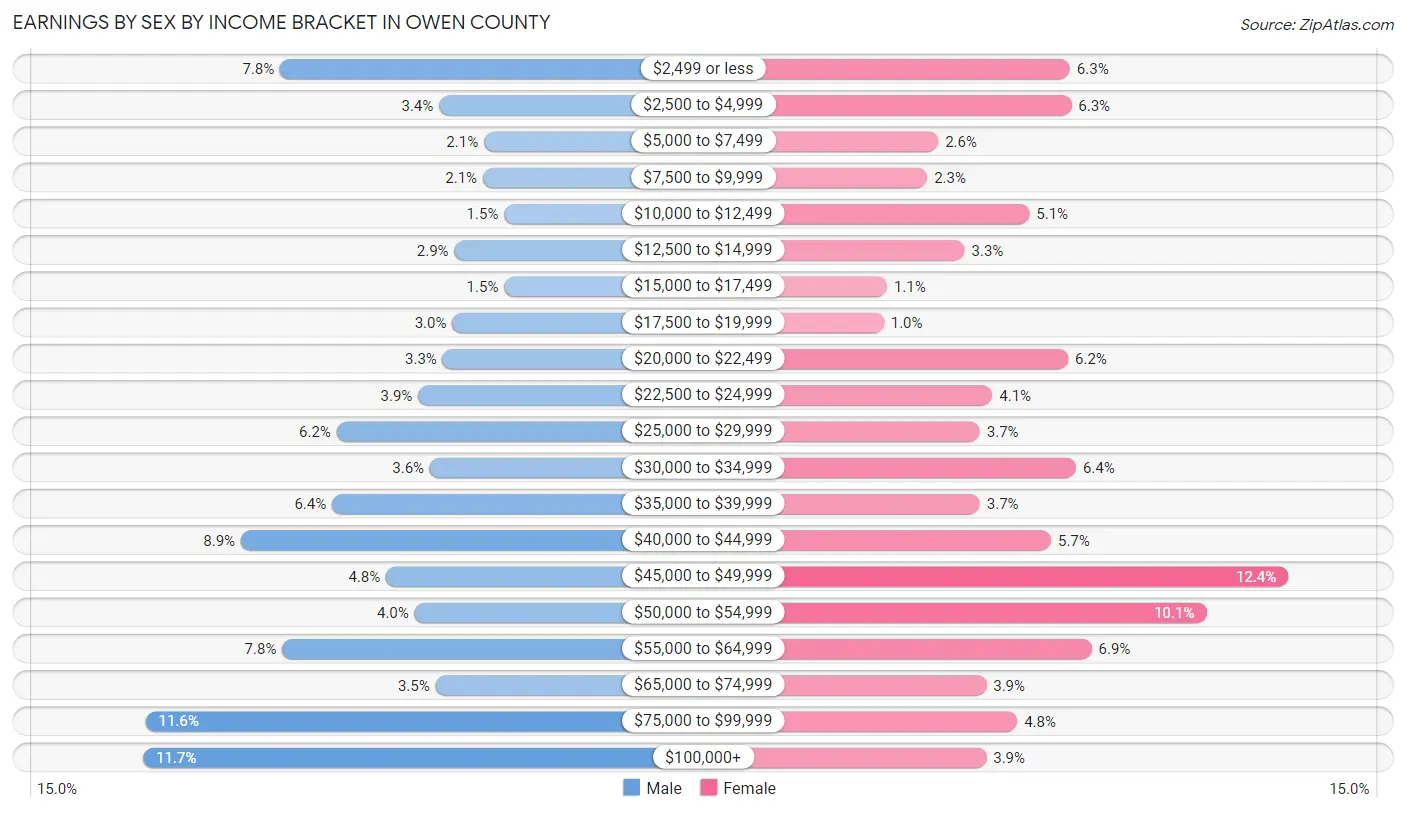
Earnings by Sex by Income Bracket in Owen County
The most common earnings brackets in Owen County are $100,000+ for men (352 | 11.7%) and $45,000 to $49,999 for women (285 | 12.4%).
| Income | Male | Female |
| $2,499 or less | 236 (7.8%) | 144 (6.3%) |
| $2,500 to $4,999 | 101 (3.4%) | 145 (6.3%) |
| $5,000 to $7,499 | 63 (2.1%) | 59 (2.6%) |
| $7,500 to $9,999 | 64 (2.1%) | 52 (2.3%) |
| $10,000 to $12,499 | 46 (1.5%) | 118 (5.1%) |
| $12,500 to $14,999 | 88 (2.9%) | 76 (3.3%) |
| $15,000 to $17,499 | 46 (1.5%) | 26 (1.1%) |
| $17,500 to $19,999 | 90 (3.0%) | 24 (1.0%) |
| $20,000 to $22,499 | 98 (3.3%) | 143 (6.2%) |
| $22,500 to $24,999 | 119 (3.9%) | 94 (4.1%) |
| $25,000 to $29,999 | 188 (6.2%) | 86 (3.7%) |
| $30,000 to $34,999 | 109 (3.6%) | 148 (6.4%) |
| $35,000 to $39,999 | 192 (6.4%) | 86 (3.7%) |
| $40,000 to $44,999 | 269 (8.9%) | 132 (5.7%) |
| $45,000 to $49,999 | 146 (4.8%) | 285 (12.4%) |
| $50,000 to $54,999 | 122 (4.0%) | 232 (10.1%) |
| $55,000 to $64,999 | 234 (7.8%) | 158 (6.9%) |
| $65,000 to $74,999 | 104 (3.5%) | 90 (3.9%) |
| $75,000 to $99,999 | 350 (11.6%) | 110 (4.8%) |
| $100,000+ | 352 (11.7%) | 90 (3.9%) |
| Total | 3,017 (100.0%) | 2,298 (100.0%) |
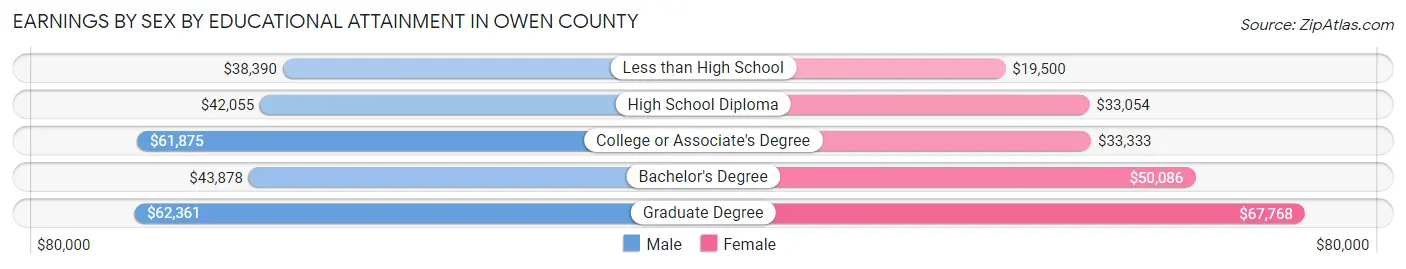
Earnings by Sex by Educational Attainment in Owen County
Average earnings in Owen County are $47,537 for men and $41,419 for women, a difference of 12.9%. Men with an educational attainment of graduate degree enjoy the highest average annual earnings of $62,361, while those with less than high school education earn the least with $38,390. Women with an educational attainment of graduate degree earn the most with the average annual earnings of $67,768, while those with less than high school education have the smallest earnings of $19,500.
| Educational Attainment | Male Income | Female Income |
| Less than High School | $38,390 | $19,500 |
| High School Diploma | $42,055 | $33,054 |
| College or Associate's Degree | $61,875 | $33,333 |
| Bachelor's Degree | $43,878 | $50,086 |
| Graduate Degree | $62,361 | $67,768 |
| Total | $47,537 | $41,419 |
Family Income in Owen County
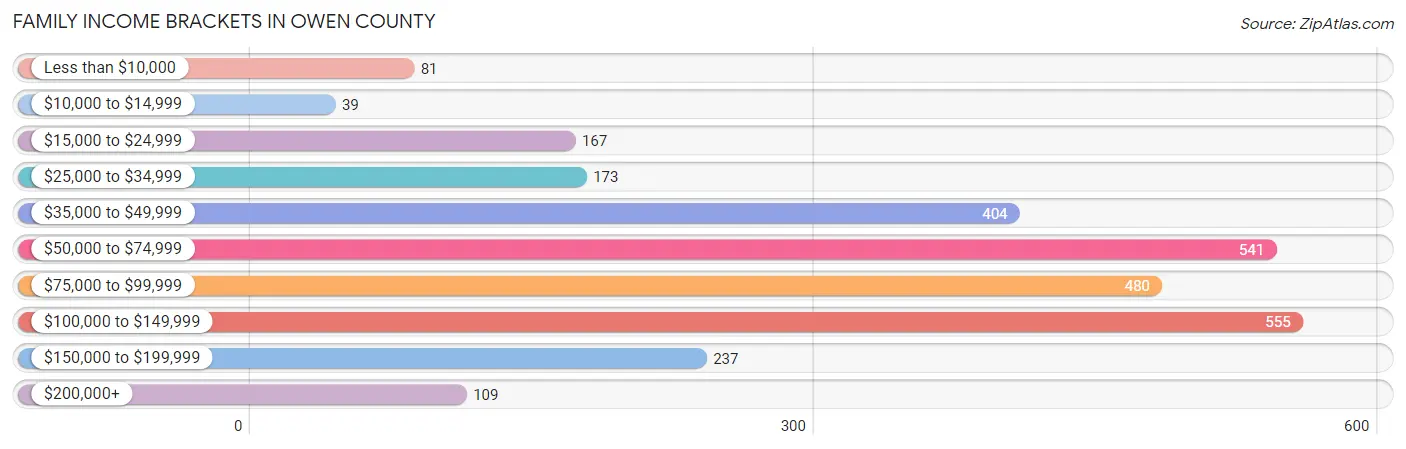
Family Income Brackets in Owen County
According to the Owen County family income data, there are 555 families falling into the $100,000 to $149,999 income range, which is the most common income bracket and makes up 19.9% of all families. Conversely, the $10,000 to $14,999 income bracket is the least frequent group with only 39 families (1.4%) belonging to this category.
| Income Bracket | # Families | % Families |
| Less than $10,000 | 81 | 2.9% |
| $10,000 to $14,999 | 39 | 1.4% |
| $15,000 to $24,999 | 167 | 6.0% |
| $25,000 to $34,999 | 173 | 6.2% |
| $35,000 to $49,999 | 404 | 14.5% |
| $50,000 to $74,999 | 541 | 19.4% |
| $75,000 to $99,999 | 480 | 17.2% |
| $100,000 to $149,999 | 555 | 19.9% |
| $150,000 to $199,999 | 237 | 8.5% |
| $200,000+ | 109 | 3.9% |
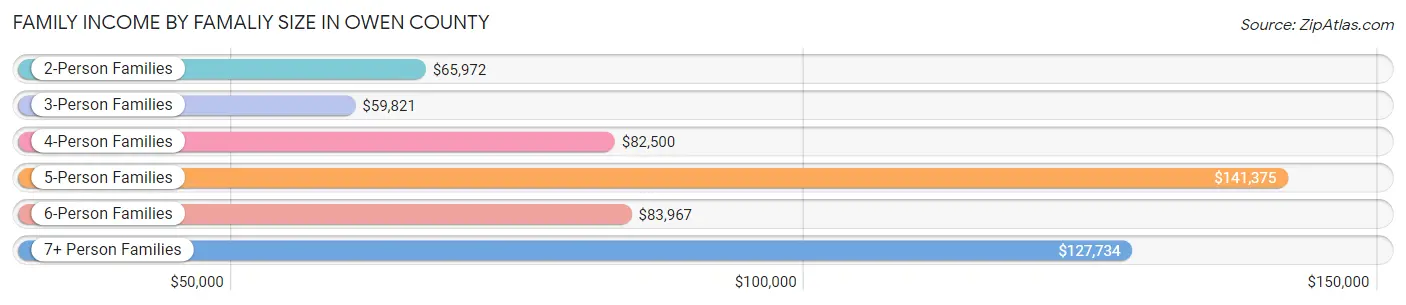
Family Income by Famaliy Size in Owen County
5-person families (144 | 5.2%) account for the highest median family income in Owen County with $141,375 per family, while 2-person families (1,195 | 42.8%) have the highest median income of $32,986 per family member.
| Income Bracket | # Families | Median Income |
| 2-Person Families | 1,195 (42.8%) | $65,972 |
| 3-Person Families | 614 (22.0%) | $59,821 |
| 4-Person Families | 590 (21.1%) | $82,500 |
| 5-Person Families | 144 (5.2%) | $141,375 |
| 6-Person Families | 153 (5.5%) | $83,967 |
| 7+ Person Families | 93 (3.3%) | $127,734 |
| Total | 2,789 (100.0%) | $74,609 |
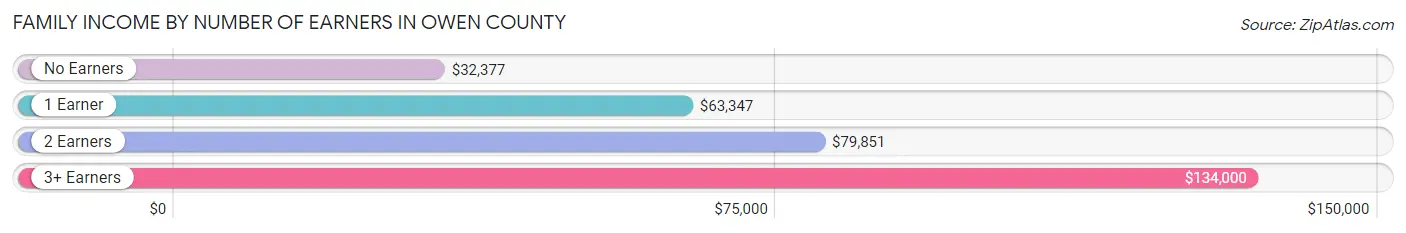
Family Income by Number of Earners in Owen County
The median family income in Owen County is $74,609, with families comprising 3+ earners (432) having the highest median family income of $134,000, while families with no earners (547) have the lowest median family income of $32,377, accounting for 15.5% and 19.6% of families, respectively.
| Number of Earners | # Families | Median Income |
| No Earners | 547 (19.6%) | $32,377 |
| 1 Earner | 693 (24.8%) | $63,347 |
| 2 Earners | 1,117 (40.1%) | $79,851 |
| 3+ Earners | 432 (15.5%) | $134,000 |
| Total | 2,789 (100.0%) | $74,609 |
Household Income in Owen County
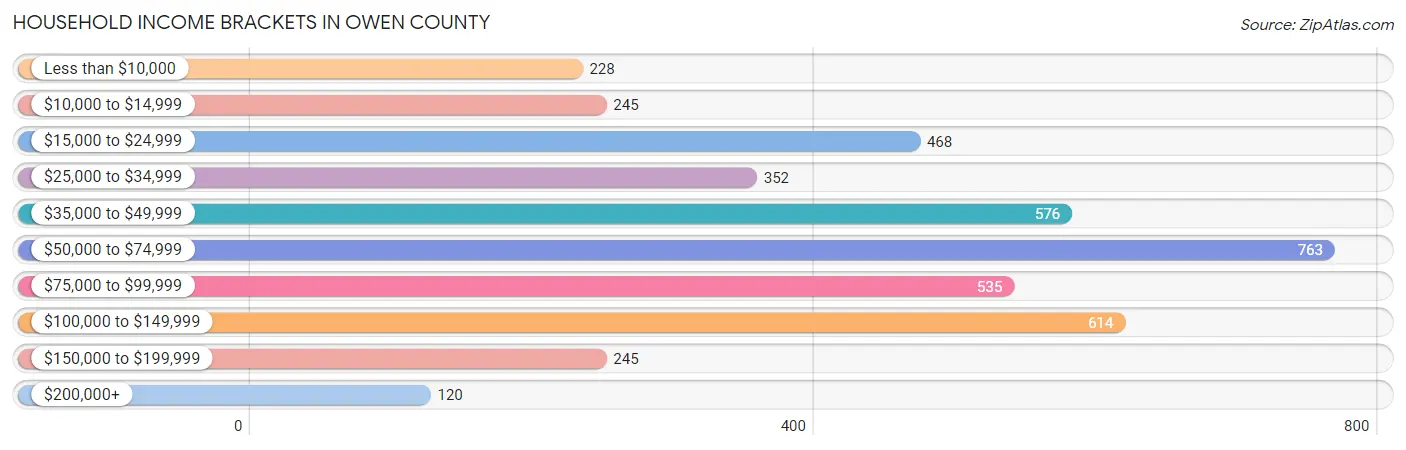
Household Income Brackets in Owen County
With 763 households falling in the category, the $50,000 to $74,999 income range is the most frequent in Owen County, accounting for 18.4% of all households. In contrast, only 120 households (2.9%) fall into the $200,000+ income bracket, making it the least populous group.
| Income Bracket | # Households | % Households |
| Less than $10,000 | 228 | 5.5% |
| $10,000 to $14,999 | 245 | 5.9% |
| $15,000 to $24,999 | 468 | 11.3% |
| $25,000 to $34,999 | 352 | 8.5% |
| $35,000 to $49,999 | 576 | 13.9% |
| $50,000 to $74,999 | 763 | 18.4% |
| $75,000 to $99,999 | 535 | 12.9% |
| $100,000 to $149,999 | 614 | 14.8% |
| $150,000 to $199,999 | 245 | 5.9% |
| $200,000+ | 120 | 2.9% |
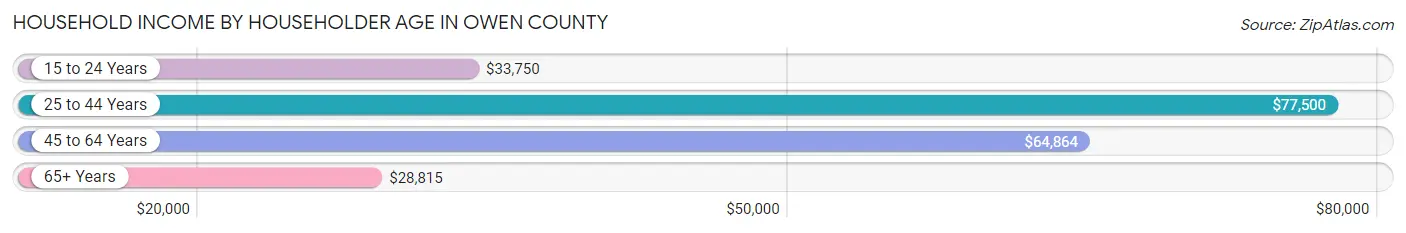
Household Income by Householder Age in Owen County
The median household income in Owen County is $56,485, with the highest median household income of $77,500 found in the 25 to 44 years age bracket for the primary householder. A total of 1,176 households (28.4%) fall into this category. Meanwhile, the 65+ years age bracket for the primary householder has the lowest median household income of $28,815, with 1,343 households (32.4%) in this group.
| Income Bracket | # Households | Median Income |
| 15 to 24 Years | 49 (1.2%) | $33,750 |
| 25 to 44 Years | 1,176 (28.4%) | $77,500 |
| 45 to 64 Years | 1,578 (38.1%) | $64,864 |
| 65+ Years | 1,343 (32.4%) | $28,815 |
| Total | 4,146 (100.0%) | $56,485 |
Poverty in Owen County
Income Below Poverty by Sex and Age in Owen County
With 12.1% poverty level for males and 16.2% for females among the residents of Owen County, 75 year old and over males and 5 year old females are the most vulnerable to poverty, with 154 males (42.9%) and 34 females (58.6%) in their respective age groups living below the poverty level.
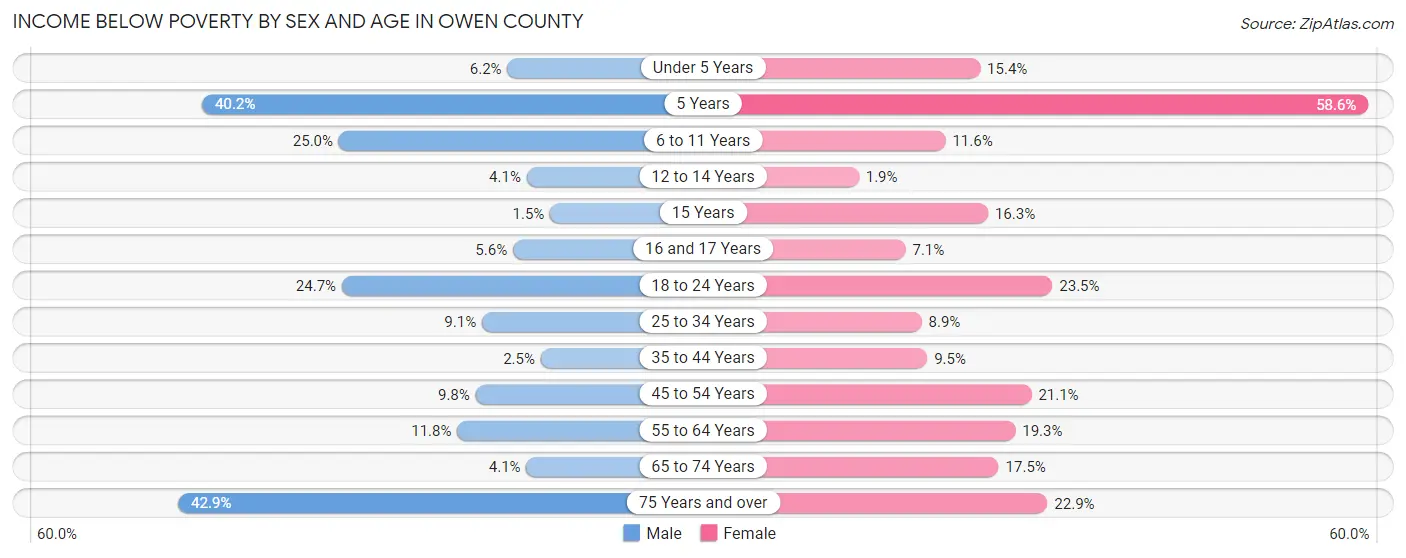
| Age Bracket | Male | Female |
| Under 5 Years | 21 (6.2%) | 43 (15.4%) |
| 5 Years | 33 (40.2%) | 34 (58.6%) |
| 6 to 11 Years | 59 (25.0%) | 56 (11.6%) |
| 12 to 14 Years | 15 (4.1%) | 2 (1.9%) |
| 15 Years | 2 (1.5%) | 7 (16.3%) |
| 16 and 17 Years | 6 (5.6%) | 13 (7.1%) |
| 18 to 24 Years | 126 (24.7%) | 91 (23.4%) |
| 25 to 34 Years | 55 (9.1%) | 55 (8.9%) |
| 35 to 44 Years | 16 (2.5%) | 66 (9.5%) |
| 45 to 54 Years | 73 (9.8%) | 151 (21.1%) |
| 55 to 64 Years | 99 (11.8%) | 158 (19.3%) |
| 65 to 74 Years | 29 (4.1%) | 109 (17.5%) |
| 75 Years and over | 154 (42.9%) | 98 (22.9%) |
| Total | 688 (12.1%) | 883 (16.2%) |
Income Above Poverty by Sex and Age in Owen County
According to the poverty statistics in Owen County, males aged 15 years and females aged 12 to 14 years are the age groups that are most secure financially, with 98.5% of males and 98.1% of females in these age groups living above the poverty line.
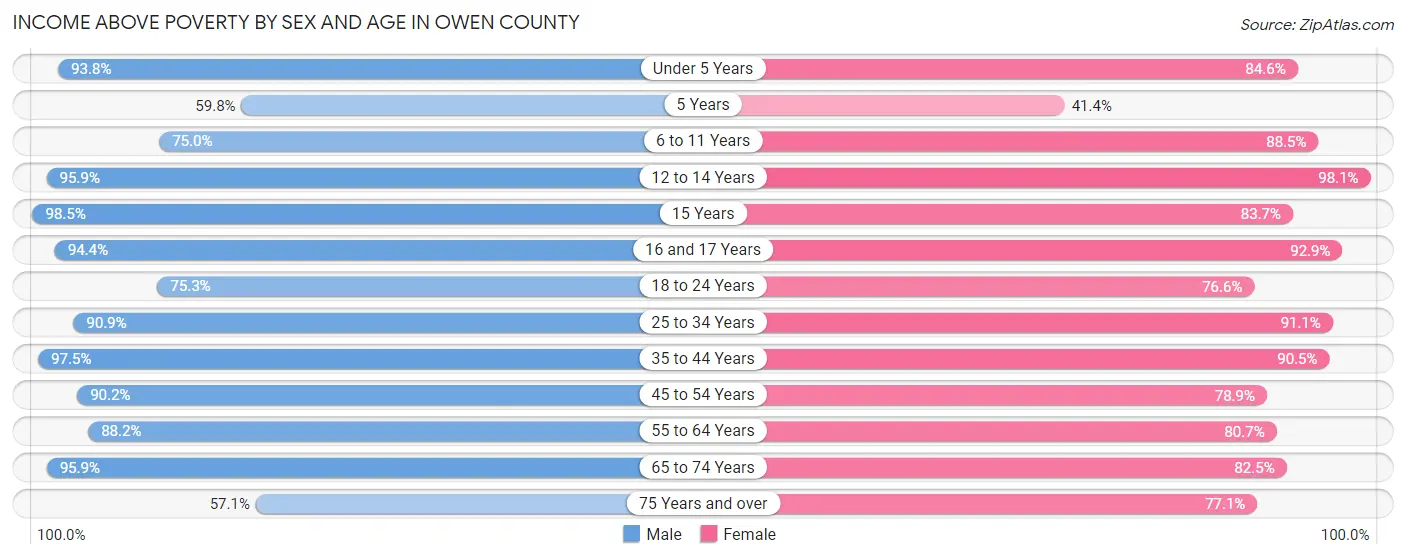
| Age Bracket | Male | Female |
| Under 5 Years | 316 (93.8%) | 236 (84.6%) |
| 5 Years | 49 (59.8%) | 24 (41.4%) |
| 6 to 11 Years | 177 (75.0%) | 429 (88.4%) |
| 12 to 14 Years | 353 (95.9%) | 104 (98.1%) |
| 15 Years | 134 (98.5%) | 36 (83.7%) |
| 16 and 17 Years | 101 (94.4%) | 170 (92.9%) |
| 18 to 24 Years | 385 (75.3%) | 297 (76.5%) |
| 25 to 34 Years | 552 (90.9%) | 564 (91.1%) |
| 35 to 44 Years | 622 (97.5%) | 628 (90.5%) |
| 45 to 54 Years | 674 (90.2%) | 564 (78.9%) |
| 55 to 64 Years | 739 (88.2%) | 660 (80.7%) |
| 65 to 74 Years | 677 (95.9%) | 515 (82.5%) |
| 75 Years and over | 205 (57.1%) | 330 (77.1%) |
| Total | 4,984 (87.9%) | 4,557 (83.8%) |
Income Below Poverty Among Married-Couple Families in Owen County
The poverty statistics for married-couple families in Owen County show that 6.5% or 153 of the total 2,356 families live below the poverty line. Families with 1 or 2 children have the highest poverty rate of 10.2%, comprising of 87 families. On the other hand, families with 5 or more children have the lowest poverty rate of 0.0%, which includes 0 families.
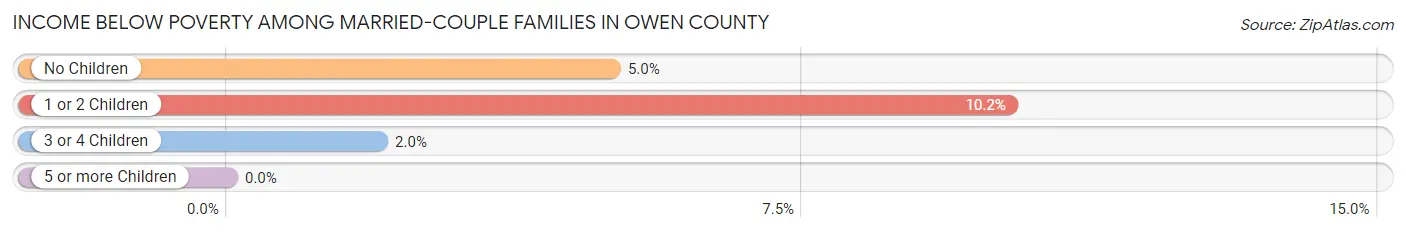
| Children | Above Poverty | Below Poverty |
| No Children | 1,178 (95.0%) | 62 (5.0%) |
| 1 or 2 Children | 768 (89.8%) | 87 (10.2%) |
| 3 or 4 Children | 200 (98.0%) | 4 (2.0%) |
| 5 or more Children | 57 (100.0%) | 0 (0.0%) |
| Total | 2,203 (93.5%) | 153 (6.5%) |
Income Below Poverty Among Single-Parent Households in Owen County
According to the poverty data in Owen County, 12.5% or 24 single-father households and 34.0% or 82 single-mother households are living below the poverty line. Among single-father households, those with 3 or 4 children have the highest poverty rate, with 5 households (100.0%) experiencing poverty. Likewise, among single-mother households, those with 3 or 4 children have the highest poverty rate, with 12 households (100.0%) falling below the poverty line.
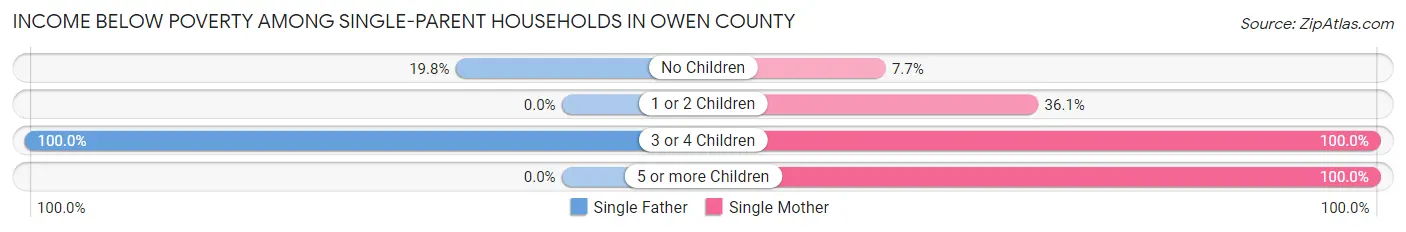
| Children | Single Father | Single Mother |
| No Children | 19 (19.8%) | 5 (7.7%) |
| 1 or 2 Children | 0 (0.0%) | 56 (36.1%) |
| 3 or 4 Children | 5 (100.0%) | 12 (100.0%) |
| 5 or more Children | 0 (0.0%) | 9 (100.0%) |
| Total | 24 (12.5%) | 82 (34.0%) |
Income Below Poverty Among Married-Couple vs Single-Parent Households in Owen County
The poverty data for Owen County shows that 153 of the married-couple family households (6.5%) and 106 of the single-parent households (24.5%) are living below the poverty level. Within the married-couple family households, those with 1 or 2 children have the highest poverty rate, with 87 households (10.2%) falling below the poverty line. Among the single-parent households, those with 3 or 4 children have the highest poverty rate, with 17 household (100.0%) living below poverty.
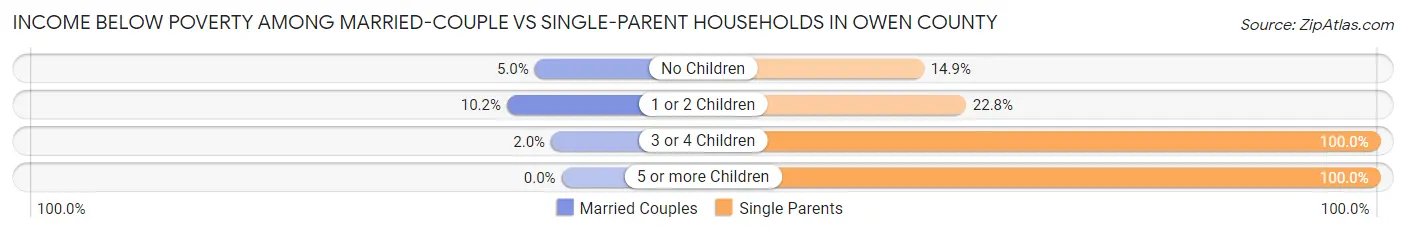
| Children | Married-Couple Families | Single-Parent Households |
| No Children | 62 (5.0%) | 24 (14.9%) |
| 1 or 2 Children | 87 (10.2%) | 56 (22.8%) |
| 3 or 4 Children | 4 (2.0%) | 17 (100.0%) |
| 5 or more Children | 0 (0.0%) | 9 (100.0%) |
| Total | 153 (6.5%) | 106 (24.5%) |
Race in Owen County
The most populous races in Owen County are White / Caucasian (10,588 | 94.3%), Two or more Races (438 | 3.9%), and Black / African American (117 | 1.0%).
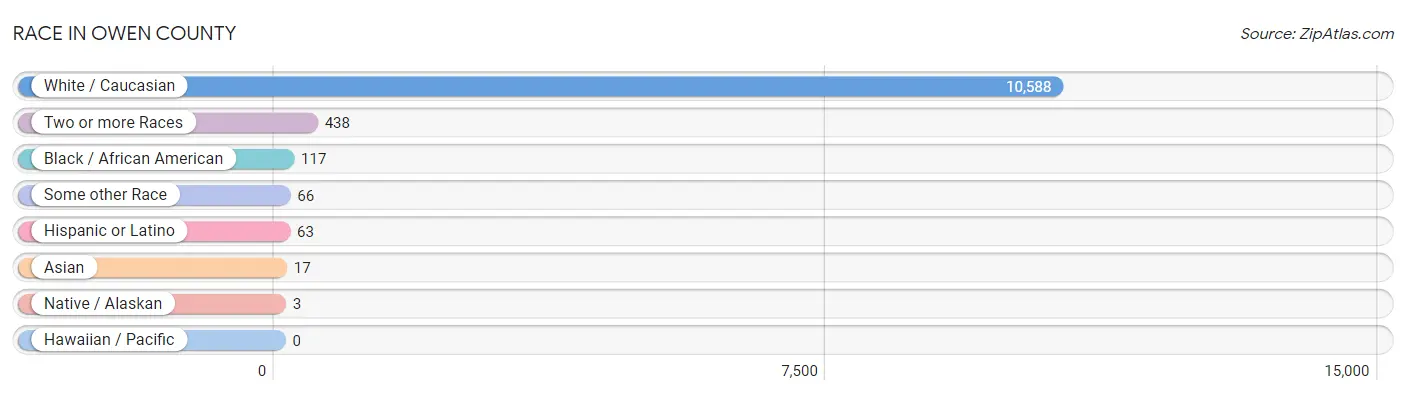
| Race | # Population | % Population |
| Asian | 17 | 0.2% |
| Black / African American | 117 | 1.0% |
| Hawaiian / Pacific | 0 | 0.0% |
| Hispanic or Latino | 63 | 0.6% |
| Native / Alaskan | 3 | 0.0% |
| White / Caucasian | 10,588 | 94.3% |
| Two or more Races | 438 | 3.9% |
| Some other Race | 66 | 0.6% |
| Total | 11,229 | 100.0% |
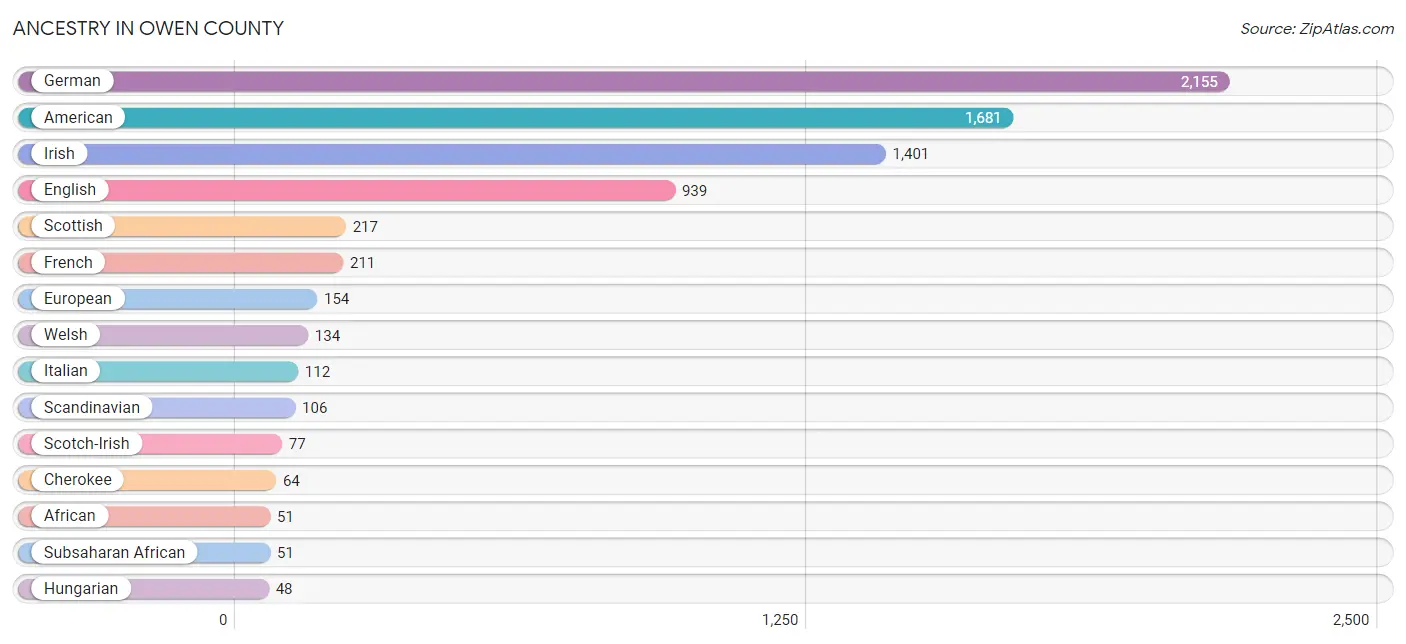
Ancestry in Owen County
The most populous ancestries reported in Owen County are German (2,155 | 19.2%), American (1,681 | 15.0%), Irish (1,401 | 12.5%), English (939 | 8.4%), and Scottish (217 | 1.9%), together accounting for 56.9% of all Owen County residents.
| Ancestry | # Population | % Population |
| African | 51 | 0.4% |
| American | 1,681 | 15.0% |
| Blackfeet | 10 | 0.1% |
| British | 46 | 0.4% |
| Canadian | 4 | 0.0% |
| Celtic | 4 | 0.0% |
| Cherokee | 64 | 0.6% |
| Colombian | 3 | 0.0% |
| Croatian | 9 | 0.1% |
| Czech | 5 | 0.0% |
| Dutch | 36 | 0.3% |
| Eastern European | 32 | 0.3% |
| English | 939 | 8.4% |
| European | 154 | 1.4% |
| French | 211 | 1.9% |
| French Canadian | 5 | 0.0% |
| German | 2,155 | 19.2% |
| Hungarian | 48 | 0.4% |
| Irish | 1,401 | 12.5% |
| Italian | 112 | 1.0% |
| Korean | 48 | 0.4% |
| Mexican | 24 | 0.2% |
| Polish | 27 | 0.2% |
| Puerto Rican | 27 | 0.2% |
| Romanian | 12 | 0.1% |
| Russian | 5 | 0.0% |
| Scandinavian | 106 | 0.9% |
| Scotch-Irish | 77 | 0.7% |
| Scottish | 217 | 1.9% |
| South American | 3 | 0.0% |
| Subsaharan African | 51 | 0.4% |
| Swiss | 8 | 0.1% |
| Ukrainian | 1 | 0.0% |
| Welsh | 134 | 1.2% | View All 34 Rows |
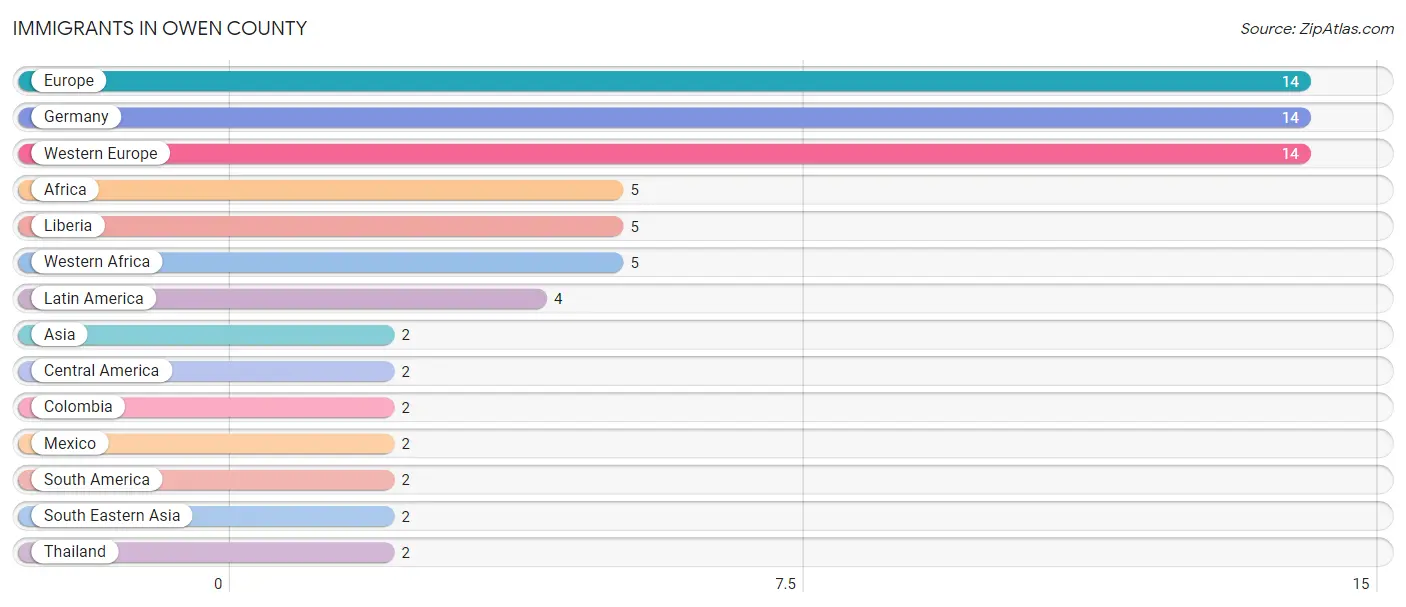
Immigrants in Owen County
The most numerous immigrant groups reported in Owen County came from Europe (14 | 0.1%), Germany (14 | 0.1%), Western Europe (14 | 0.1%), Africa (5 | 0.0%), and Liberia (5 | 0.0%), together accounting for 0.4% of all Owen County residents.
| Immigration Origin | # Population | % Population |
| Africa | 5 | 0.0% |
| Asia | 2 | 0.0% |
| Central America | 2 | 0.0% |
| Colombia | 2 | 0.0% |
| Europe | 14 | 0.1% |
| Germany | 14 | 0.1% |
| Latin America | 4 | 0.0% |
| Liberia | 5 | 0.0% |
| Mexico | 2 | 0.0% |
| South America | 2 | 0.0% |
| South Eastern Asia | 2 | 0.0% |
| Thailand | 2 | 0.0% |
| Western Africa | 5 | 0.0% |
| Western Europe | 14 | 0.1% | View All 14 Rows |
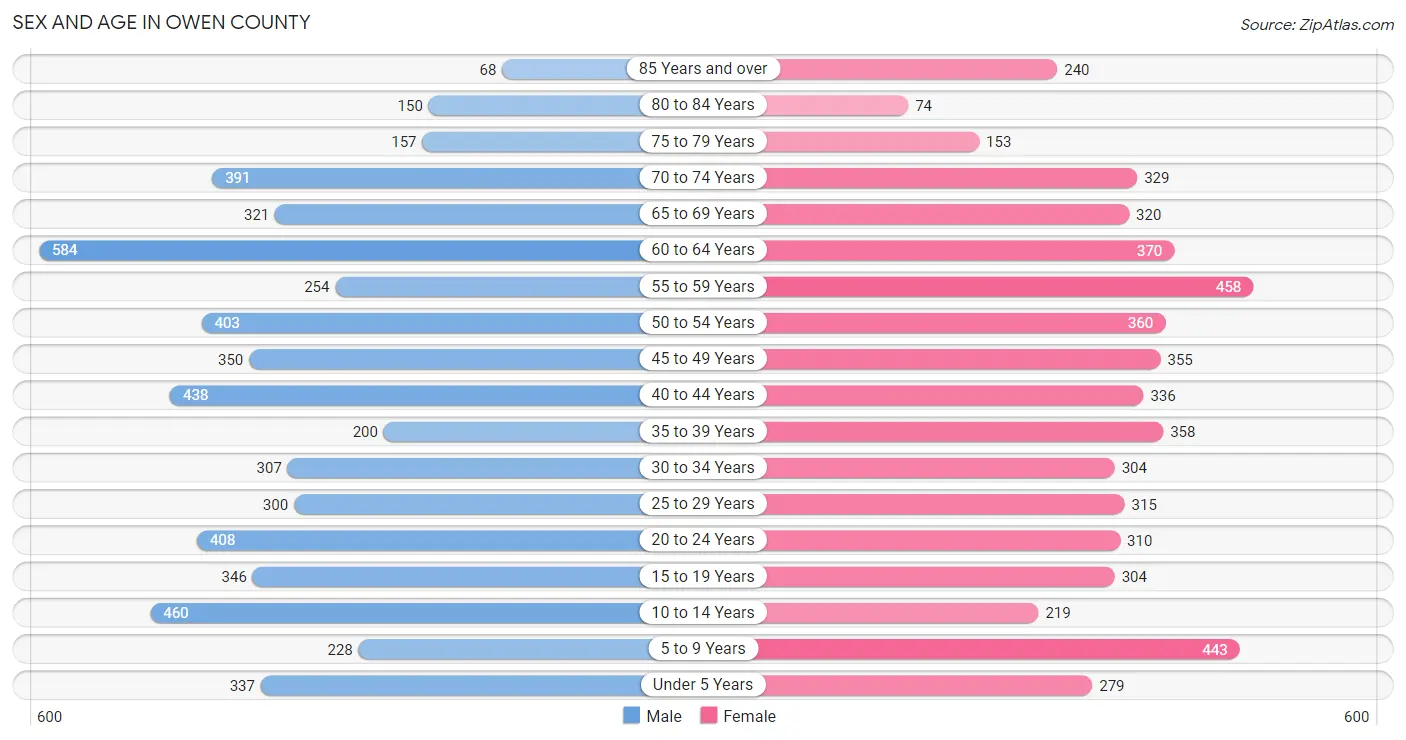
Sex and Age in Owen County
Sex and Age in Owen County
The most populous age groups in Owen County are 60 to 64 Years (584 | 10.2%) for men and 55 to 59 Years (458 | 8.3%) for women.
| Age Bracket | Male | Female |
| Under 5 Years | 337 (5.9%) | 279 (5.1%) |
| 5 to 9 Years | 228 (4.0%) | 443 (8.0%) |
| 10 to 14 Years | 460 (8.1%) | 219 (4.0%) |
| 15 to 19 Years | 346 (6.1%) | 304 (5.5%) |
| 20 to 24 Years | 408 (7.2%) | 310 (5.6%) |
| 25 to 29 Years | 300 (5.3%) | 315 (5.7%) |
| 30 to 34 Years | 307 (5.4%) | 304 (5.5%) |
| 35 to 39 Years | 200 (3.5%) | 358 (6.5%) |
| 40 to 44 Years | 438 (7.7%) | 336 (6.1%) |
| 45 to 49 Years | 350 (6.1%) | 355 (6.4%) |
| 50 to 54 Years | 403 (7.1%) | 360 (6.5%) |
| 55 to 59 Years | 254 (4.4%) | 458 (8.3%) |
| 60 to 64 Years | 584 (10.2%) | 370 (6.7%) |
| 65 to 69 Years | 321 (5.6%) | 320 (5.8%) |
| 70 to 74 Years | 391 (6.9%) | 329 (5.9%) |
| 75 to 79 Years | 157 (2.8%) | 153 (2.8%) |
| 80 to 84 Years | 150 (2.6%) | 74 (1.3%) |
| 85 Years and over | 68 (1.2%) | 240 (4.3%) |
| Total | 5,702 (100.0%) | 5,527 (100.0%) |
Families and Households in Owen County
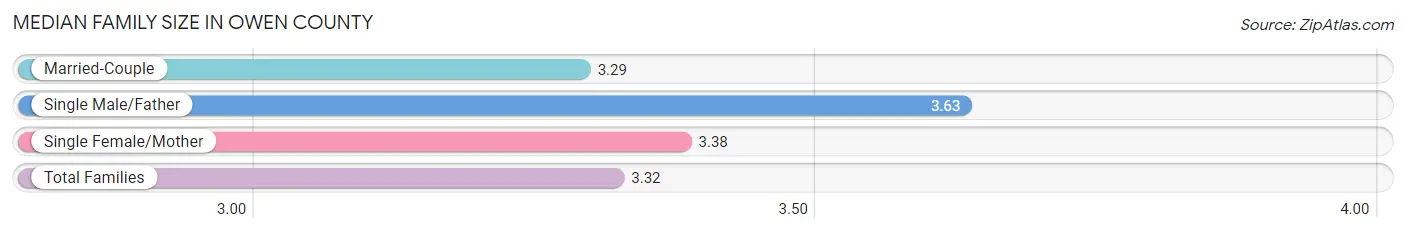
Median Family Size in Owen County
The median family size in Owen County is 3.32 persons per family, with single male/father families (192 | 6.9%) accounting for the largest median family size of 3.63 persons per family. On the other hand, married-couple families (2,356 | 84.5%) represent the smallest median family size with 3.29 persons per family.
| Family Type | # Families | Family Size |
| Married-Couple | 2,356 (84.5%) | 3.29 |
| Single Male/Father | 192 (6.9%) | 3.63 |
| Single Female/Mother | 241 (8.6%) | 3.38 |
| Total Families | 2,789 (100.0%) | 3.32 |
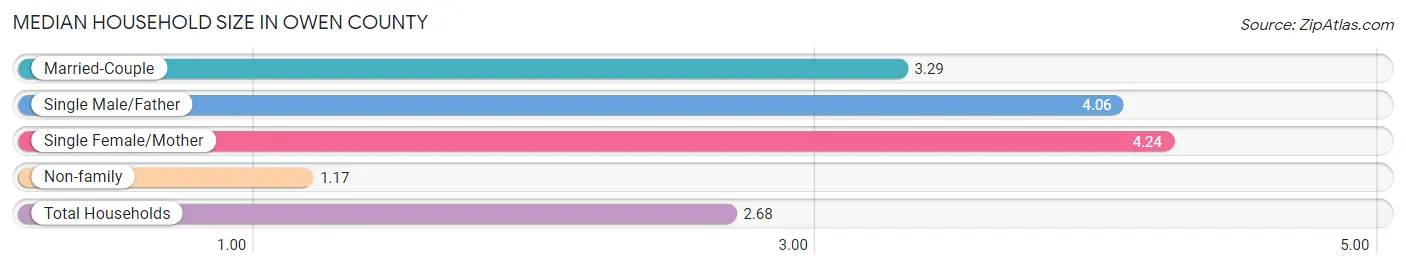
Median Household Size in Owen County
The median household size in Owen County is 2.68 persons per household, with single female/mother households (241 | 5.8%) accounting for the largest median household size of 4.24 persons per household. non-family households (1,357 | 32.7%) represent the smallest median household size with 1.17 persons per household.
| Household Type | # Households | Household Size |
| Married-Couple | 2,356 (56.8%) | 3.29 |
| Single Male/Father | 192 (4.6%) | 4.06 |
| Single Female/Mother | 241 (5.8%) | 4.24 |
| Non-family | 1,357 (32.7%) | 1.17 |
| Total Households | 4,146 (100.0%) | 2.68 |
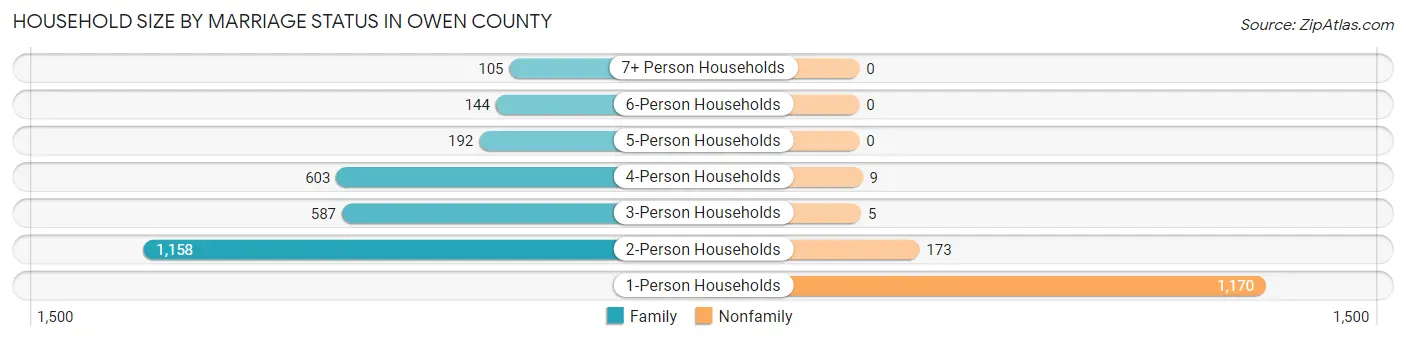
Household Size by Marriage Status in Owen County
Out of a total of 4,146 households in Owen County, 2,789 (67.3%) are family households, while 1,357 (32.7%) are nonfamily households. The most numerous type of family households are 2-person households, comprising 1,158, and the most common type of nonfamily households are 1-person households, comprising 1,170.
| Household Size | Family Households | Nonfamily Households |
| 1-Person Households | - | 1,170 (28.2%) |
| 2-Person Households | 1,158 (27.9%) | 173 (4.2%) |
| 3-Person Households | 587 (14.2%) | 5 (0.1%) |
| 4-Person Households | 603 (14.5%) | 9 (0.2%) |
| 5-Person Households | 192 (4.6%) | 0 (0.0%) |
| 6-Person Households | 144 (3.5%) | 0 (0.0%) |
| 7+ Person Households | 105 (2.5%) | 0 (0.0%) |
| Total | 2,789 (67.3%) | 1,357 (32.7%) |
Female Fertility in Owen County
Fertility by Age in Owen County
Average fertility rate in Owen County is 54.0 births per 1,000 women. Women in the age bracket of 20 to 34 years have the highest fertility rate with 115.0 births per 1,000 women. Women in the age bracket of 20 to 34 years acount for 84.3% of all women with births.
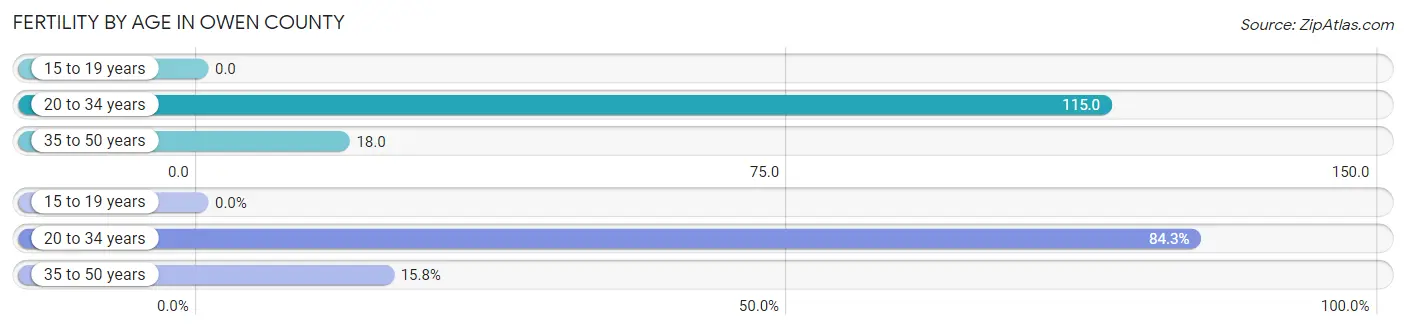
| Age Bracket | Women with Births | Births / 1,000 Women |
| 15 to 19 years | 0 (0.0%) | 0.0 |
| 20 to 34 years | 107 (84.3%) | 115.0 |
| 35 to 50 years | 20 (15.8%) | 18.0 |
| Total | 127 (100.0%) | 54.0 |
Fertility by Age by Marriage Status in Owen County
55.1% of women with births (127) in Owen County are married. The highest percentage of unmarried women with births falls into 20 to 34 years age bracket with 53.3% of them unmarried at the time of birth, while the lowest percentage of unmarried women with births belong to 35 to 50 years age bracket with 0.0% of them unmarried.
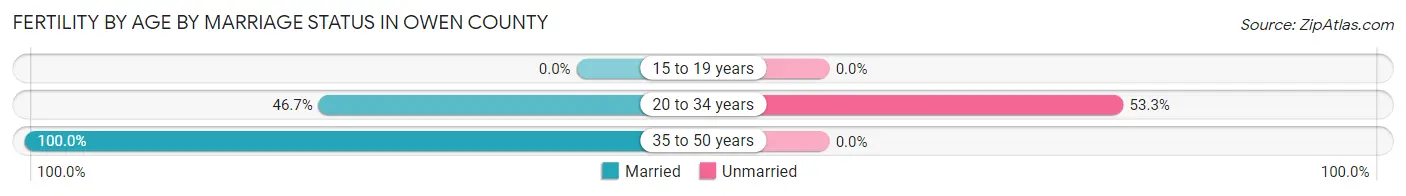
| Age Bracket | Married | Unmarried |
| 15 to 19 years | 0 (0.0%) | 0 (0.0%) |
| 20 to 34 years | 50 (46.7%) | 57 (53.3%) |
| 35 to 50 years | 20 (100.0%) | 0 (0.0%) |
| Total | 70 (55.1%) | 57 (44.9%) |
Fertility by Education in Owen County
Average fertility rate in Owen County is 54.0 births per 1,000 women. Women with the education attainment of college or associate's degree have the highest fertility rate of 104.0 births per 1,000 women, while women with the education attainment of less than high school have the lowest fertility at 7.0 births per 1,000 women. Women with the education attainment of high school diploma represent 47.2% of all women with births.
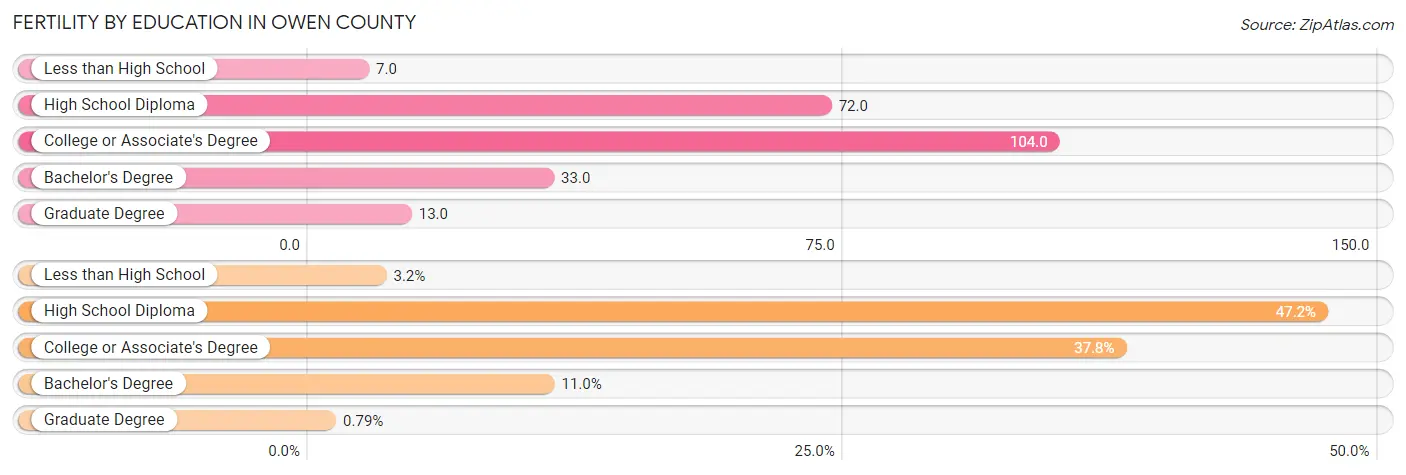
| Educational Attainment | Women with Births | Births / 1,000 Women |
| Less than High School | 4 (3.2%) | 7.0 |
| High School Diploma | 60 (47.2%) | 72.0 |
| College or Associate's Degree | 48 (37.8%) | 104.0 |
| Bachelor's Degree | 14 (11.0%) | 33.0 |
| Graduate Degree | 1 (0.8%) | 13.0 |
| Total | 127 (100.0%) | 54.0 |
Fertility by Education by Marriage Status in Owen County
44.9% of women with births in Owen County are unmarried. Women with the educational attainment of less than high school are most likely to be married with 100.0% of them married at childbirth, while women with the educational attainment of high school diploma are least likely to be married with 75.0% of them unmarried at childbirth.
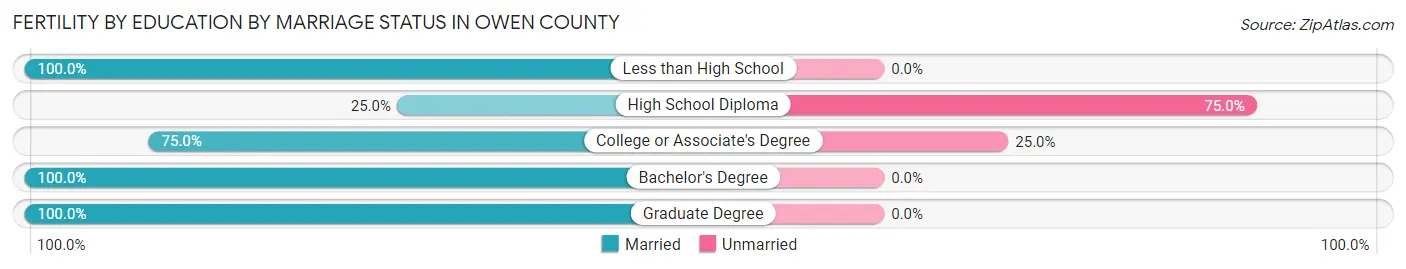
| Educational Attainment | Married | Unmarried |
| Less than High School | 4 (100.0%) | 0 (0.0%) |
| High School Diploma | 15 (25.0%) | 45 (75.0%) |
| College or Associate's Degree | 36 (75.0%) | 12 (25.0%) |
| Bachelor's Degree | 14 (100.0%) | 0 (0.0%) |
| Graduate Degree | 1 (100.0%) | 0 (0.0%) |
| Total | 70 (55.1%) | 57 (44.9%) |
Employment Characteristics in Owen County
Employment by Class of Employer in Owen County
Among the 4,839 employed individuals in Owen County, private company employees (3,019 | 62.4%), state government employees (582 | 12.0%), and self-employed (not incorporated) (396 | 8.2%) make up the most common classes of employment.
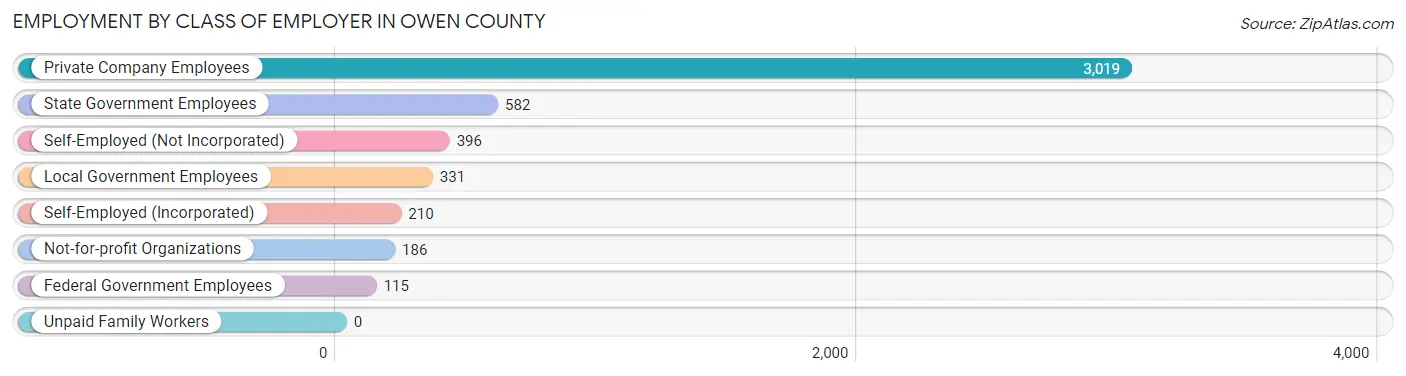
| Employer Class | # Employees | % Employees |
| Private Company Employees | 3,019 | 62.4% |
| Self-Employed (Incorporated) | 210 | 4.3% |
| Self-Employed (Not Incorporated) | 396 | 8.2% |
| Not-for-profit Organizations | 186 | 3.8% |
| Local Government Employees | 331 | 6.8% |
| State Government Employees | 582 | 12.0% |
| Federal Government Employees | 115 | 2.4% |
| Unpaid Family Workers | 0 | 0.0% |
| Total | 4,839 | 100.0% |
Employment Status by Age in Owen County
According to the labor force statistics for Owen County, out of the total population over 16 years of age (9,084), 57.1% or 5,187 individuals are in the labor force, with 4.6% or 239 of them unemployed. The age group with the highest labor force participation rate is 30 to 34 years, with 89.9% or 549 individuals in the labor force. Within the labor force, the 60 to 64 years age range has the highest percentage of unemployed individuals, with 10.6% or 49 of them being unemployed.
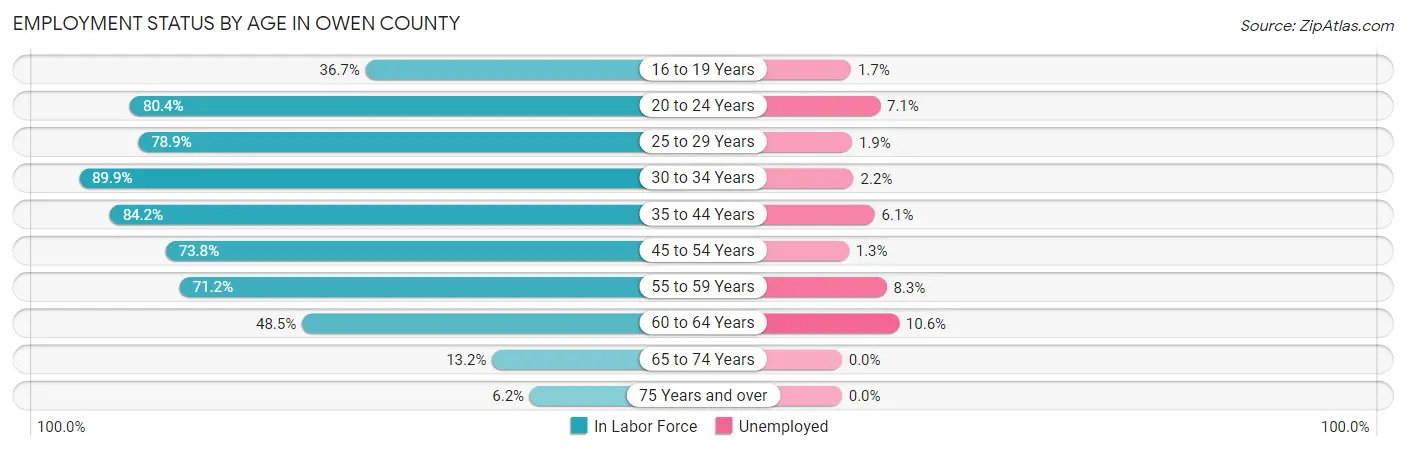
| Age Bracket | In Labor Force | Unemployed |
| 16 to 19 Years | 173 (36.7%) | 3 (1.7%) |
| 20 to 24 Years | 577 (80.4%) | 41 (7.1%) |
| 25 to 29 Years | 485 (78.9%) | 9 (1.9%) |
| 30 to 34 Years | 549 (89.9%) | 12 (2.2%) |
| 35 to 44 Years | 1,122 (84.2%) | 68 (6.1%) |
| 45 to 54 Years | 1,083 (73.8%) | 14 (1.3%) |
| 55 to 59 Years | 507 (71.2%) | 42 (8.3%) |
| 60 to 64 Years | 463 (48.5%) | 49 (10.6%) |
| 65 to 74 Years | 180 (13.2%) | 0 (0.0%) |
| 75 Years and over | 52 (6.2%) | 0 (0.0%) |
| Total | 5,187 (57.1%) | 239 (4.6%) |
Employment Status by Educational Attainment in Owen County
According to labor force statistics for Owen County, 73.9% of individuals (4,206) out of the total population between 25 and 64 years of age (5,692) are in the labor force, with 4.6% or 193 of them being unemployed. The group with the highest labor force participation rate are those with the educational attainment of bachelor's degree or higher, with 94.8% or 1,131 individuals in the labor force. Within the labor force, individuals with less than high school education have the highest percentage of unemployment, with 6.2% or 22 of them being unemployed.
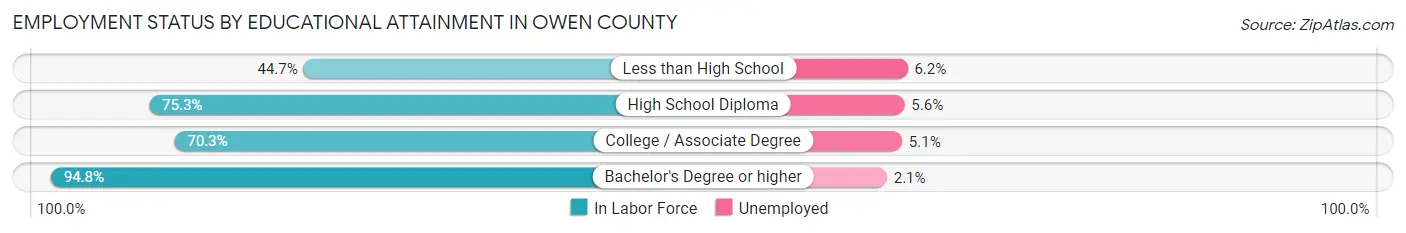
| Educational Attainment | In Labor Force | Unemployed |
| Less than High School | 356 (44.7%) | 49 (6.2%) |
| High School Diploma | 1,801 (75.3%) | 134 (5.6%) |
| College / Associate Degree | 921 (70.3%) | 67 (5.1%) |
| Bachelor's Degree or higher | 1,131 (94.8%) | 25 (2.1%) |
| Total | 4,206 (73.9%) | 262 (4.6%) |
Employment Occupations by Sex in Owen County
Management, Business, Science and Arts Occupations
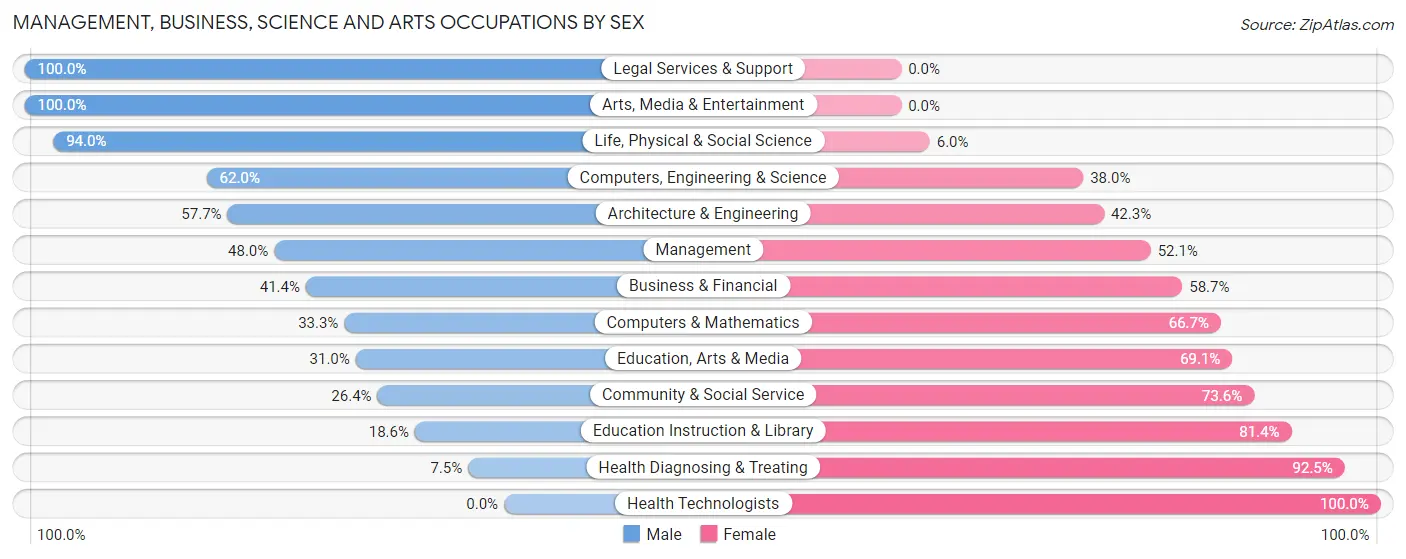
The most common Management, Business, Science and Arts occupations in Owen County are Community & Social Service (356 | 7.2%), Management (342 | 6.9%), Health Diagnosing & Treating (320 | 6.5%), Business & Financial (237 | 4.8%), and Education Instruction & Library (215 | 4.3%).
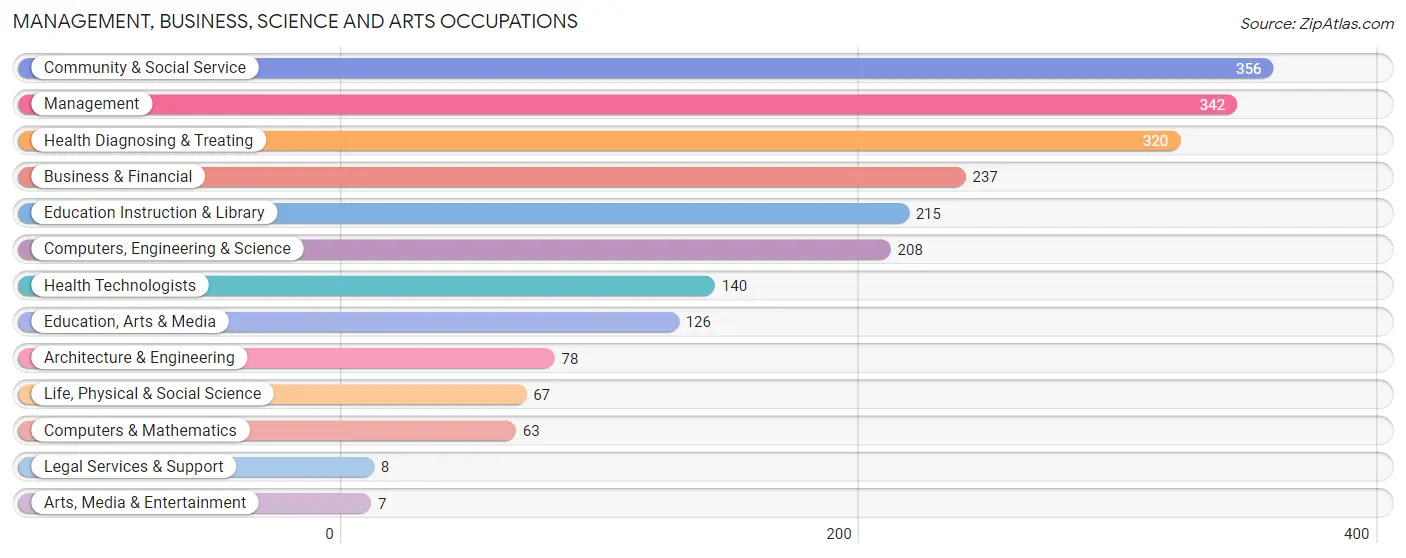
Management, Business, Science and Arts Occupations by Sex
Within the Management, Business, Science and Arts occupations in Owen County, the most male-oriented occupations are Legal Services & Support (100.0%), Arts, Media & Entertainment (100.0%), and Life, Physical & Social Science (94.0%), while the most female-oriented occupations are Health Technologists (100.0%), Health Diagnosing & Treating (92.5%), and Education Instruction & Library (81.4%).
| Occupation | Male | Female |
| Management | 164 (47.9%) | 178 (52.0%) |
| Business & Financial | 98 (41.3%) | 139 (58.7%) |
| Computers, Engineering & Science | 129 (62.0%) | 79 (38.0%) |
| Computers & Mathematics | 21 (33.3%) | 42 (66.7%) |
| Architecture & Engineering | 45 (57.7%) | 33 (42.3%) |
| Life, Physical & Social Science | 63 (94.0%) | 4 (6.0%) |
| Community & Social Service | 94 (26.4%) | 262 (73.6%) |
| Education, Arts & Media | 39 (30.9%) | 87 (69.1%) |
| Legal Services & Support | 8 (100.0%) | 0 (0.0%) |
| Education Instruction & Library | 40 (18.6%) | 175 (81.4%) |
| Arts, Media & Entertainment | 7 (100.0%) | 0 (0.0%) |
| Health Diagnosing & Treating | 24 (7.5%) | 296 (92.5%) |
| Health Technologists | 0 (0.0%) | 140 (100.0%) |
| Total (Category) | 509 (34.8%) | 954 (65.2%) |
| Total (Overall) | 2,787 (56.3%) | 2,165 (43.7%) |
Services Occupations
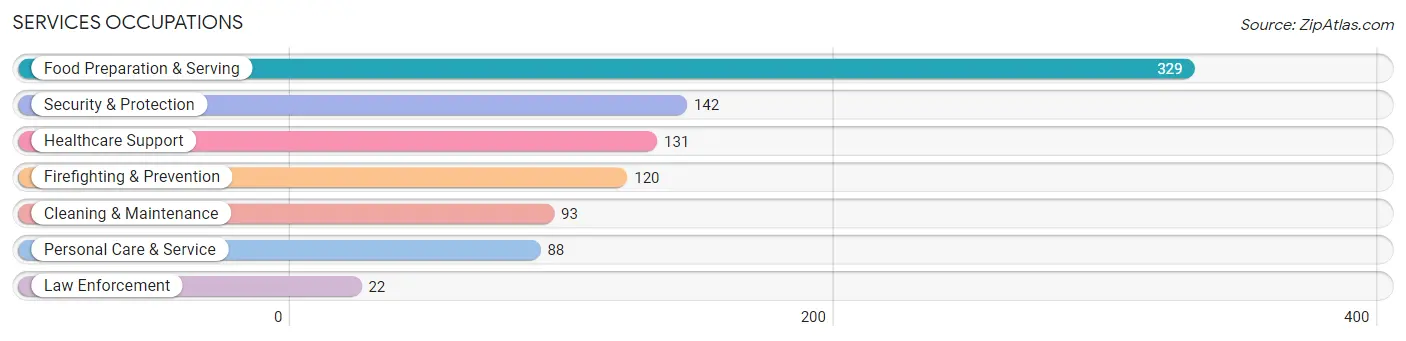
The most common Services occupations in Owen County are Food Preparation & Serving (329 | 6.6%), Security & Protection (142 | 2.9%), Healthcare Support (131 | 2.6%), Firefighting & Prevention (120 | 2.4%), and Cleaning & Maintenance (93 | 1.9%).
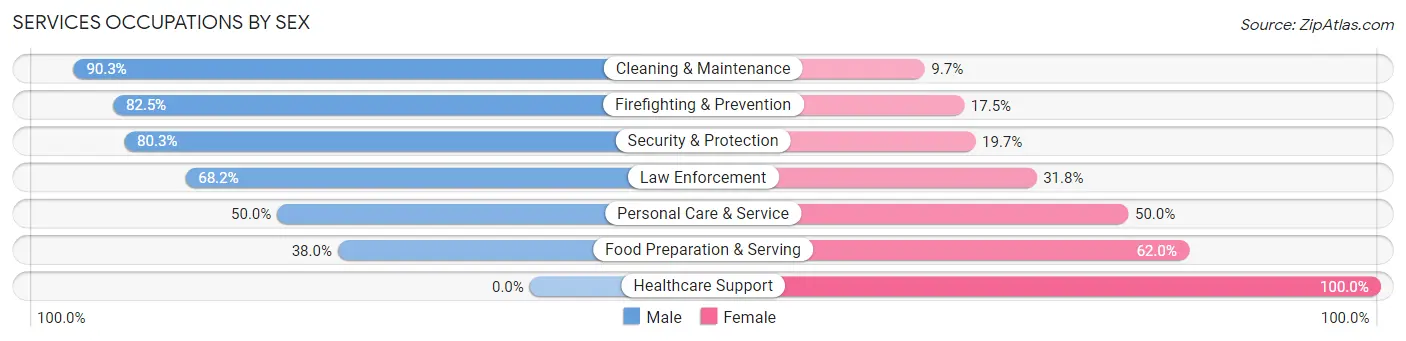
Services Occupations by Sex
Within the Services occupations in Owen County, the most male-oriented occupations are Cleaning & Maintenance (90.3%), Firefighting & Prevention (82.5%), and Security & Protection (80.3%), while the most female-oriented occupations are Healthcare Support (100.0%), Food Preparation & Serving (62.0%), and Personal Care & Service (50.0%).
| Occupation | Male | Female |
| Healthcare Support | 0 (0.0%) | 131 (100.0%) |
| Security & Protection | 114 (80.3%) | 28 (19.7%) |
| Firefighting & Prevention | 99 (82.5%) | 21 (17.5%) |
| Law Enforcement | 15 (68.2%) | 7 (31.8%) |
| Food Preparation & Serving | 125 (38.0%) | 204 (62.0%) |
| Cleaning & Maintenance | 84 (90.3%) | 9 (9.7%) |
| Personal Care & Service | 44 (50.0%) | 44 (50.0%) |
| Total (Category) | 367 (46.9%) | 416 (53.1%) |
| Total (Overall) | 2,787 (56.3%) | 2,165 (43.7%) |
Sales and Office Occupations
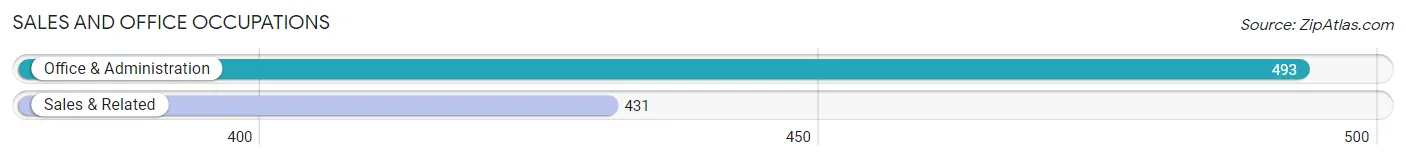
The most common Sales and Office occupations in Owen County are Office & Administration (493 | 10.0%), and Sales & Related (431 | 8.7%).
Sales and Office Occupations by Sex
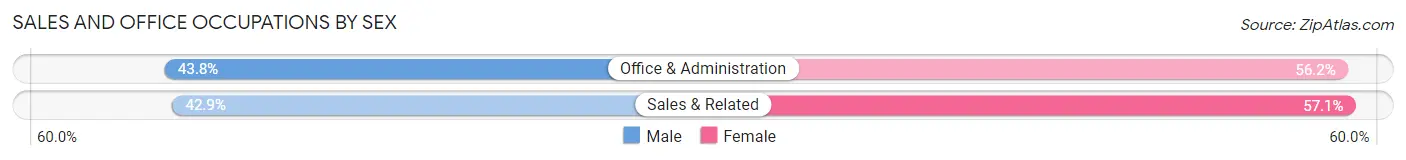
| Occupation | Male | Female |
| Sales & Related | 185 (42.9%) | 246 (57.1%) |
| Office & Administration | 216 (43.8%) | 277 (56.2%) |
| Total (Category) | 401 (43.4%) | 523 (56.6%) |
| Total (Overall) | 2,787 (56.3%) | 2,165 (43.7%) |
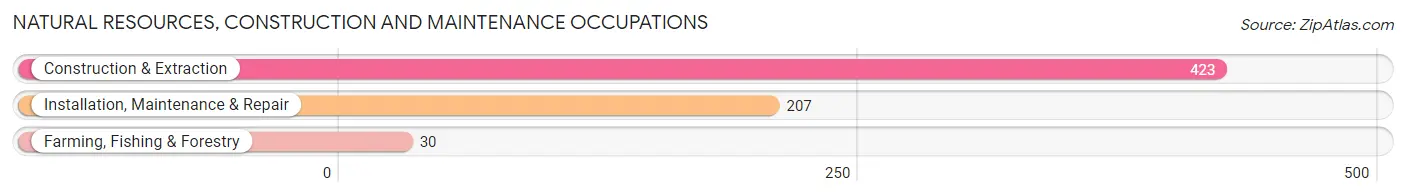
Natural Resources, Construction and Maintenance Occupations
The most common Natural Resources, Construction and Maintenance occupations in Owen County are Construction & Extraction (423 | 8.5%), Installation, Maintenance & Repair (207 | 4.2%), and Farming, Fishing & Forestry (30 | 0.6%).
Natural Resources, Construction and Maintenance Occupations by Sex
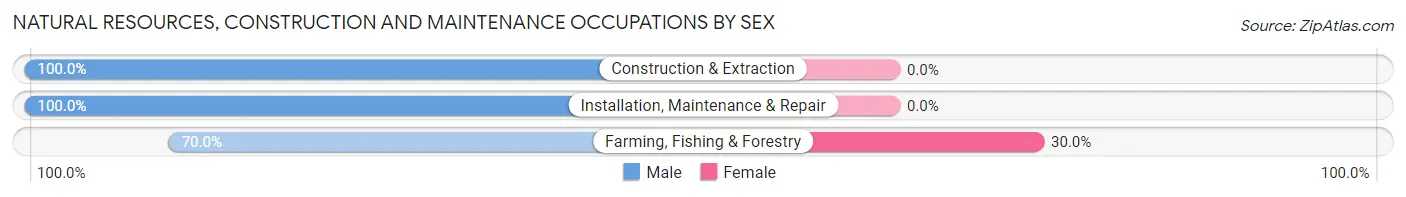
| Occupation | Male | Female |
| Farming, Fishing & Forestry | 21 (70.0%) | 9 (30.0%) |
| Construction & Extraction | 423 (100.0%) | 0 (0.0%) |
| Installation, Maintenance & Repair | 207 (100.0%) | 0 (0.0%) |
| Total (Category) | 651 (98.6%) | 9 (1.4%) |
| Total (Overall) | 2,787 (56.3%) | 2,165 (43.7%) |
Production, Transportation and Moving Occupations
The most common Production, Transportation and Moving occupations in Owen County are Production (621 | 12.5%), Transportation (311 | 6.3%), and Material Moving (190 | 3.8%).
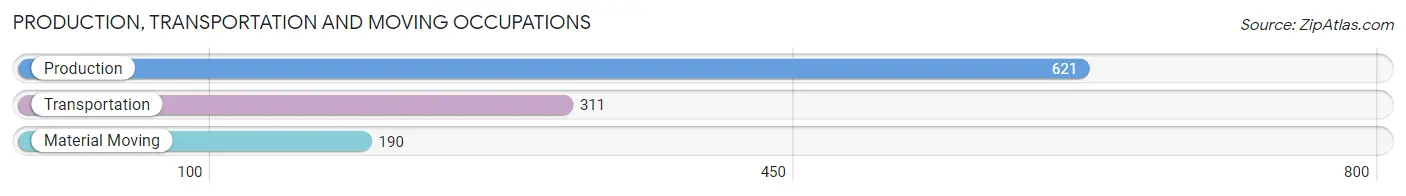
Production, Transportation and Moving Occupations by Sex
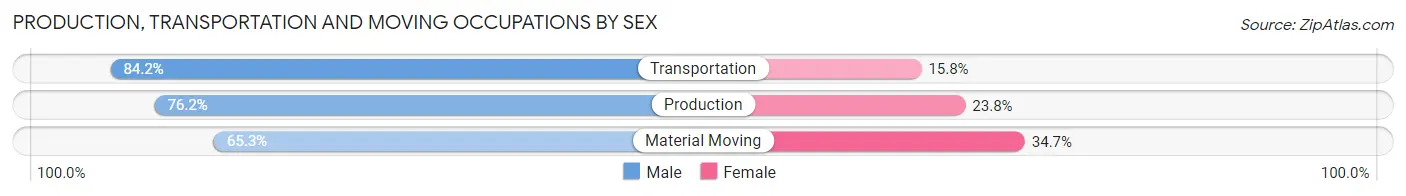
| Occupation | Male | Female |
| Production | 473 (76.2%) | 148 (23.8%) |
| Transportation | 262 (84.2%) | 49 (15.8%) |
| Material Moving | 124 (65.3%) | 66 (34.7%) |
| Total (Category) | 859 (76.6%) | 263 (23.4%) |
| Total (Overall) | 2,787 (56.3%) | 2,165 (43.7%) |
Employment Industries by Sex in Owen County
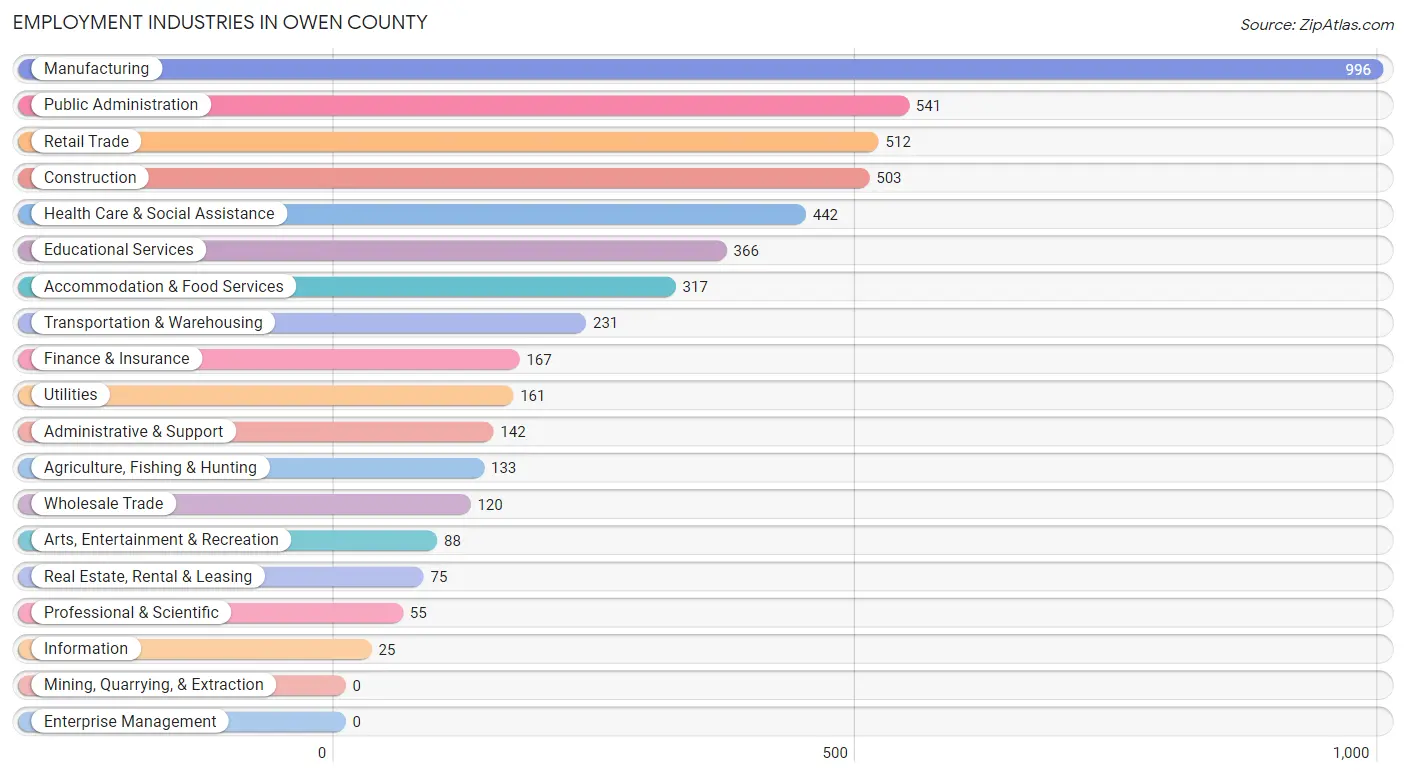
Employment Industries in Owen County
The major employment industries in Owen County include Manufacturing (996 | 20.1%), Public Administration (541 | 10.9%), Retail Trade (512 | 10.3%), Construction (503 | 10.2%), and Health Care & Social Assistance (442 | 8.9%).
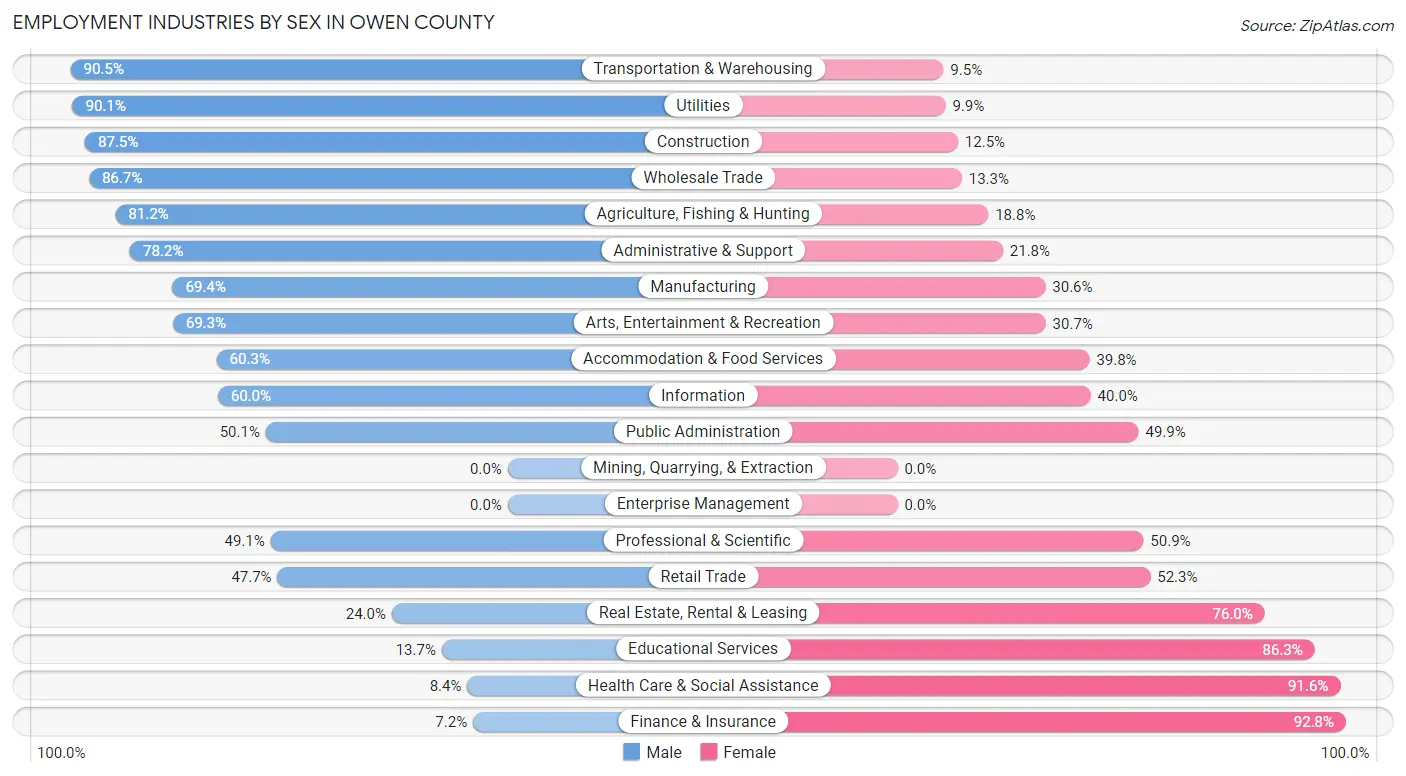
Employment Industries by Sex in Owen County
The Owen County industries that see more men than women are Transportation & Warehousing (90.5%), Utilities (90.1%), and Construction (87.5%), whereas the industries that tend to have a higher number of women are Finance & Insurance (92.8%), Health Care & Social Assistance (91.6%), and Educational Services (86.3%).
| Industry | Male | Female |
| Agriculture, Fishing & Hunting | 108 (81.2%) | 25 (18.8%) |
| Mining, Quarrying, & Extraction | 0 (0.0%) | 0 (0.0%) |
| Construction | 440 (87.5%) | 63 (12.5%) |
| Manufacturing | 691 (69.4%) | 305 (30.6%) |
| Wholesale Trade | 104 (86.7%) | 16 (13.3%) |
| Retail Trade | 244 (47.7%) | 268 (52.3%) |
| Transportation & Warehousing | 209 (90.5%) | 22 (9.5%) |
| Utilities | 145 (90.1%) | 16 (9.9%) |
| Information | 15 (60.0%) | 10 (40.0%) |
| Finance & Insurance | 12 (7.2%) | 155 (92.8%) |
| Real Estate, Rental & Leasing | 18 (24.0%) | 57 (76.0%) |
| Professional & Scientific | 27 (49.1%) | 28 (50.9%) |
| Enterprise Management | 0 (0.0%) | 0 (0.0%) |
| Administrative & Support | 111 (78.2%) | 31 (21.8%) |
| Educational Services | 50 (13.7%) | 316 (86.3%) |
| Health Care & Social Assistance | 37 (8.4%) | 405 (91.6%) |
| Arts, Entertainment & Recreation | 61 (69.3%) | 27 (30.7%) |
| Accommodation & Food Services | 191 (60.3%) | 126 (39.8%) |
| Public Administration | 271 (50.1%) | 270 (49.9%) |
| Total | 2,787 (56.3%) | 2,165 (43.7%) |
Education in Owen County
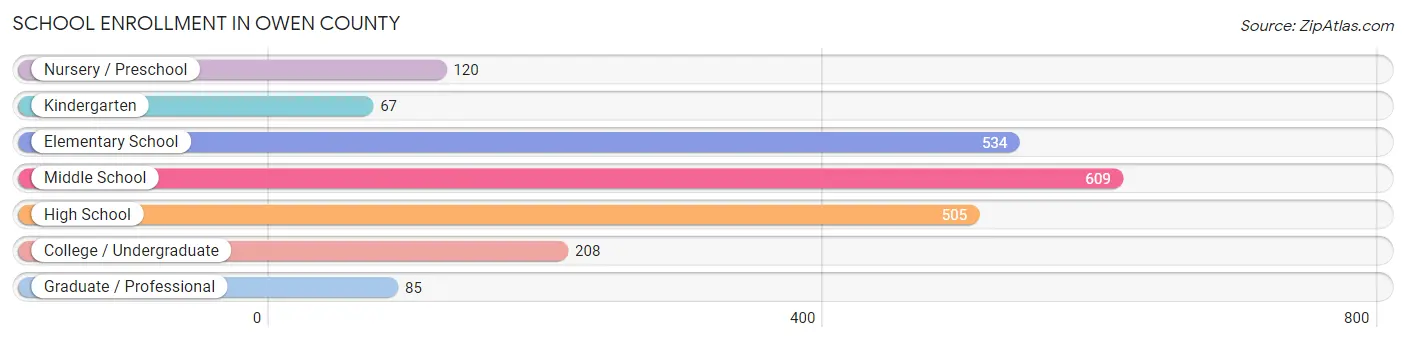
School Enrollment in Owen County
The most common levels of schooling among the 2,128 students in Owen County are middle school (609 | 28.6%), elementary school (534 | 25.1%), and high school (505 | 23.7%).
| School Level | # Students | % Students |
| Nursery / Preschool | 120 | 5.6% |
| Kindergarten | 67 | 3.2% |
| Elementary School | 534 | 25.1% |
| Middle School | 609 | 28.6% |
| High School | 505 | 23.7% |
| College / Undergraduate | 208 | 9.8% |
| Graduate / Professional | 85 | 4.0% |
| Total | 2,128 | 100.0% |
School Enrollment by Age by Funding Source in Owen County
Out of a total of 2,128 students who are enrolled in schools in Owen County, 419 (19.7%) attend a private institution, while the remaining 1,709 (80.3%) are enrolled in public schools. The age group of 3 to 4 year olds has the highest likelihood of being enrolled in private schools, with 17 (54.8% in the age bracket) enrolled. Conversely, the age group of 35 years and over has the lowest likelihood of being enrolled in a private school, with 103 (88.8% in the age bracket) attending a public institution.
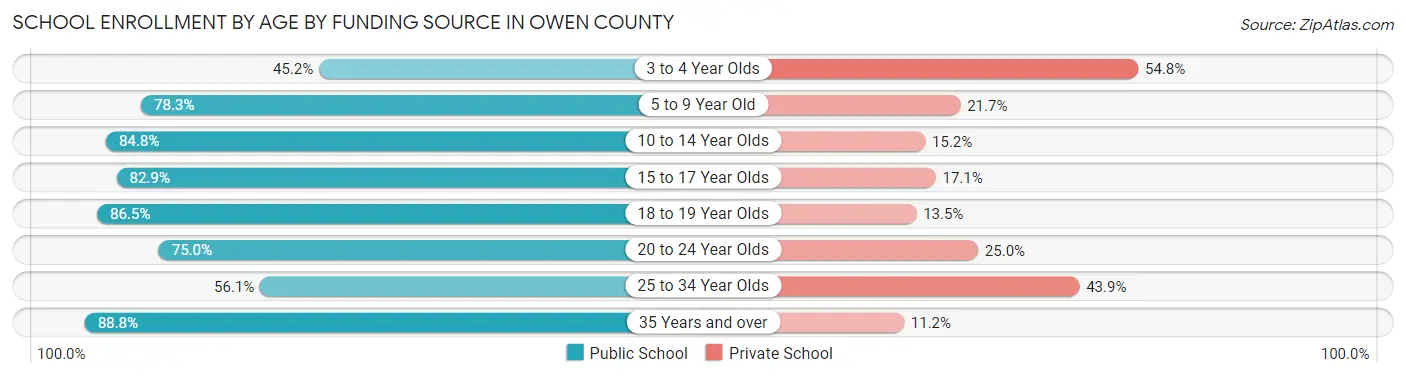
| Age Bracket | Public School | Private School |
| 3 to 4 Year Olds | 14 (45.2%) | 17 (54.8%) |
| 5 to 9 Year Old | 512 (78.3%) | 142 (21.7%) |
| 10 to 14 Year Olds | 576 (84.8%) | 103 (15.2%) |
| 15 to 17 Year Olds | 329 (82.9%) | 68 (17.1%) |
| 18 to 19 Year Olds | 32 (86.5%) | 5 (13.5%) |
| 20 to 24 Year Olds | 87 (75.0%) | 29 (25.0%) |
| 25 to 34 Year Olds | 55 (56.1%) | 43 (43.9%) |
| 35 Years and over | 103 (88.8%) | 13 (11.2%) |
| Total | 1,709 (80.3%) | 419 (19.7%) |
Educational Attainment by Field of Study in Owen County
Education (231 | 14.4%), science & technology (216 | 13.5%), bio, nature & agricultural (203 | 12.7%), arts & humanities (185 | 11.6%), and business (157 | 9.8%) are the most common fields of study among 1,602 individuals in Owen County who have obtained a bachelor's degree or higher.
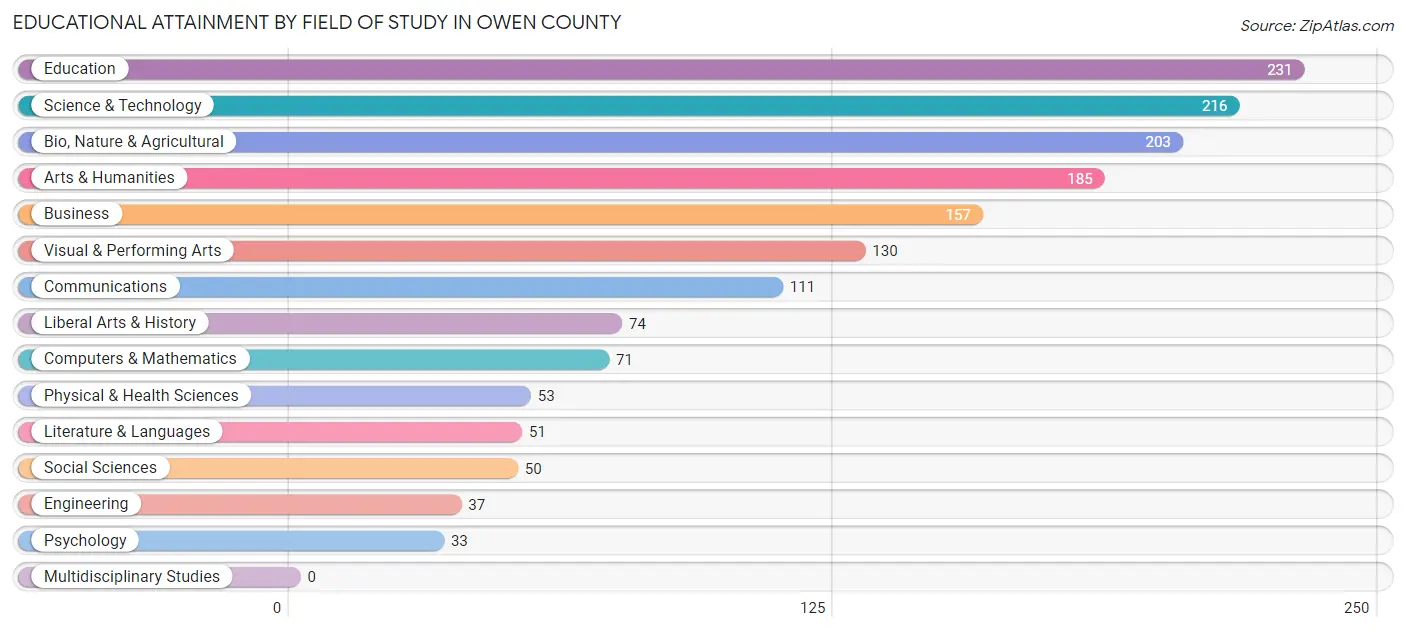
| Field of Study | # Graduates | % Graduates |
| Computers & Mathematics | 71 | 4.4% |
| Bio, Nature & Agricultural | 203 | 12.7% |
| Physical & Health Sciences | 53 | 3.3% |
| Psychology | 33 | 2.1% |
| Social Sciences | 50 | 3.1% |
| Engineering | 37 | 2.3% |
| Multidisciplinary Studies | 0 | 0.0% |
| Science & Technology | 216 | 13.5% |
| Business | 157 | 9.8% |
| Education | 231 | 14.4% |
| Literature & Languages | 51 | 3.2% |
| Liberal Arts & History | 74 | 4.6% |
| Visual & Performing Arts | 130 | 8.1% |
| Communications | 111 | 6.9% |
| Arts & Humanities | 185 | 11.6% |
| Total | 1,602 | 100.0% |
Transportation & Commute in Owen County
Vehicle Availability by Sex in Owen County
The most prevalent vehicle ownership categories in Owen County are males with 3 vehicles (865, accounting for 31.7%) and females with 3 vehicles (629, making up 41.0%).
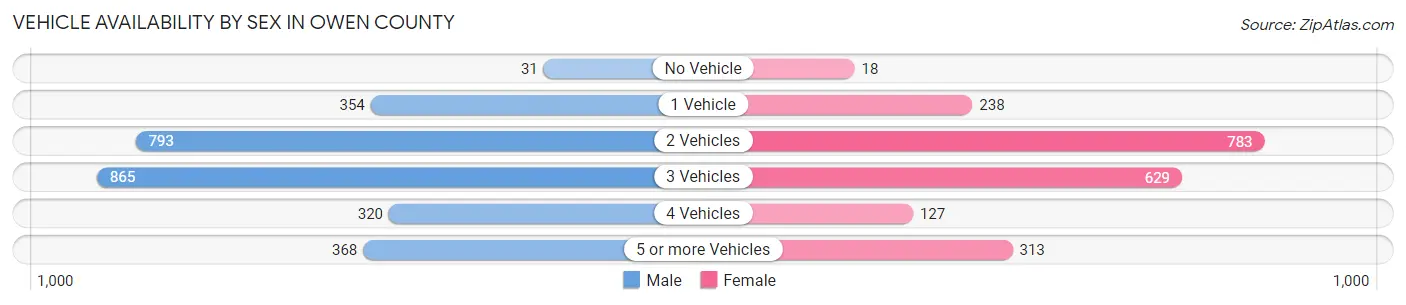
| Vehicles Available | Male | Female |
| No Vehicle | 31 (1.1%) | 18 (0.9%) |
| 1 Vehicle | 354 (13.0%) | 238 (11.3%) |
| 2 Vehicles | 793 (29.0%) | 783 (37.1%) |
| 3 Vehicles | 865 (31.7%) | 629 (29.8%) |
| 4 Vehicles | 320 (11.7%) | 127 (6.0%) |
| 5 or more Vehicles | 368 (13.5%) | 313 (14.8%) |
| Total | 2,731 (100.0%) | 2,108 (100.0%) |
Commute Time in Owen County
The most frequently occuring commute durations in Owen County are 60 to 89 minutes (612 commuters, 13.9%), 30 to 34 minutes (592 commuters, 13.5%), and 45 to 59 minutes (568 commuters, 12.9%).
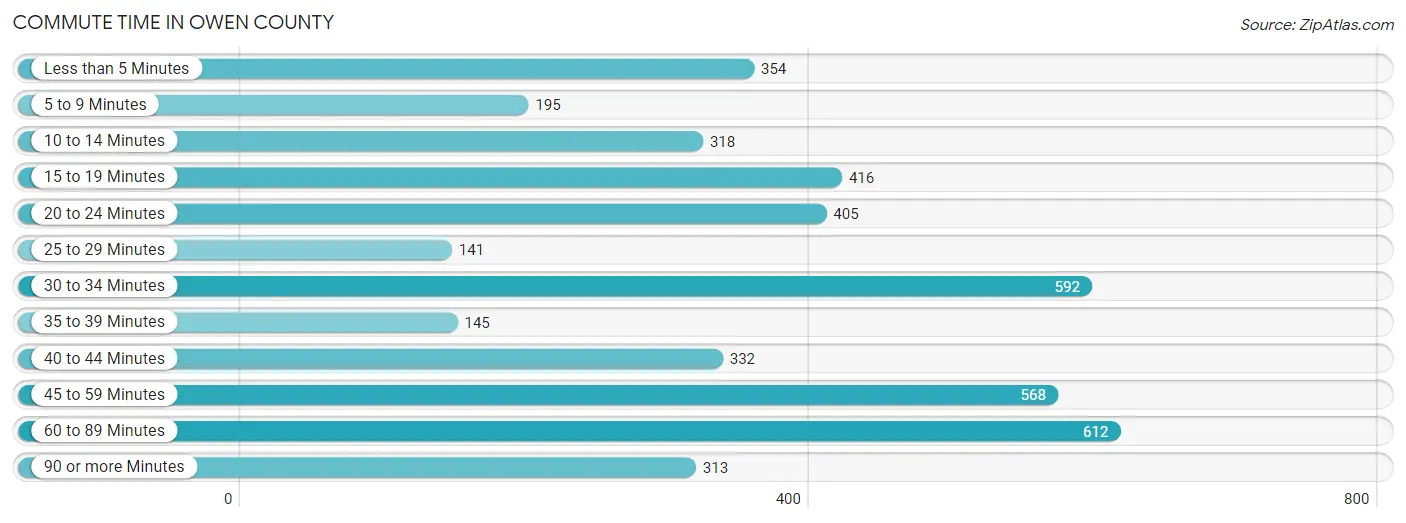
| Commute Time | # Commuters | % Commuters |
| Less than 5 Minutes | 354 | 8.1% |
| 5 to 9 Minutes | 195 | 4.4% |
| 10 to 14 Minutes | 318 | 7.2% |
| 15 to 19 Minutes | 416 | 9.5% |
| 20 to 24 Minutes | 405 | 9.2% |
| 25 to 29 Minutes | 141 | 3.2% |
| 30 to 34 Minutes | 592 | 13.5% |
| 35 to 39 Minutes | 145 | 3.3% |
| 40 to 44 Minutes | 332 | 7.6% |
| 45 to 59 Minutes | 568 | 12.9% |
| 60 to 89 Minutes | 612 | 13.9% |
| 90 or more Minutes | 313 | 7.1% |
Commute Time by Sex in Owen County
The most common commute times in Owen County are 60 to 89 minutes (481 commuters, 18.3%) for males and 30 to 34 minutes (272 commuters, 15.4%) for females.
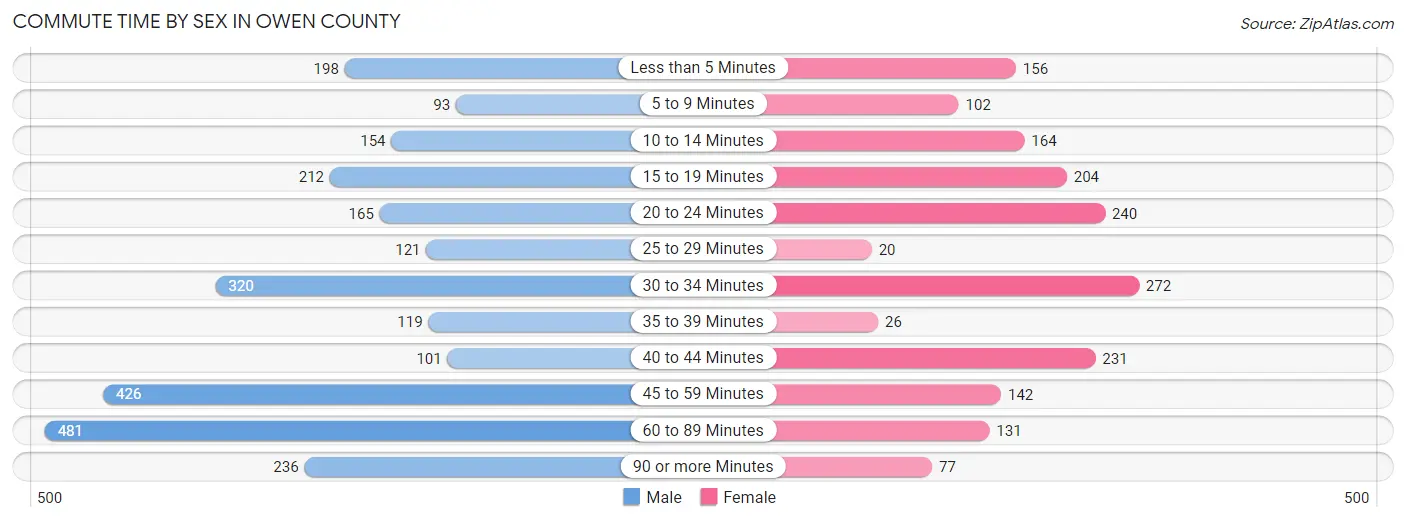
| Commute Time | Male | Female |
| Less than 5 Minutes | 198 (7.5%) | 156 (8.8%) |
| 5 to 9 Minutes | 93 (3.5%) | 102 (5.8%) |
| 10 to 14 Minutes | 154 (5.9%) | 164 (9.3%) |
| 15 to 19 Minutes | 212 (8.1%) | 204 (11.6%) |
| 20 to 24 Minutes | 165 (6.3%) | 240 (13.6%) |
| 25 to 29 Minutes | 121 (4.6%) | 20 (1.1%) |
| 30 to 34 Minutes | 320 (12.2%) | 272 (15.4%) |
| 35 to 39 Minutes | 119 (4.5%) | 26 (1.5%) |
| 40 to 44 Minutes | 101 (3.8%) | 231 (13.1%) |
| 45 to 59 Minutes | 426 (16.2%) | 142 (8.1%) |
| 60 to 89 Minutes | 481 (18.3%) | 131 (7.4%) |
| 90 or more Minutes | 236 (9.0%) | 77 (4.4%) |
Time of Departure to Work by Sex in Owen County
The most frequent times of departure to work in Owen County are 6:00 AM to 6:29 AM (362, 13.8%) for males and 7:30 AM to 7:59 AM (243, 13.8%) for females.
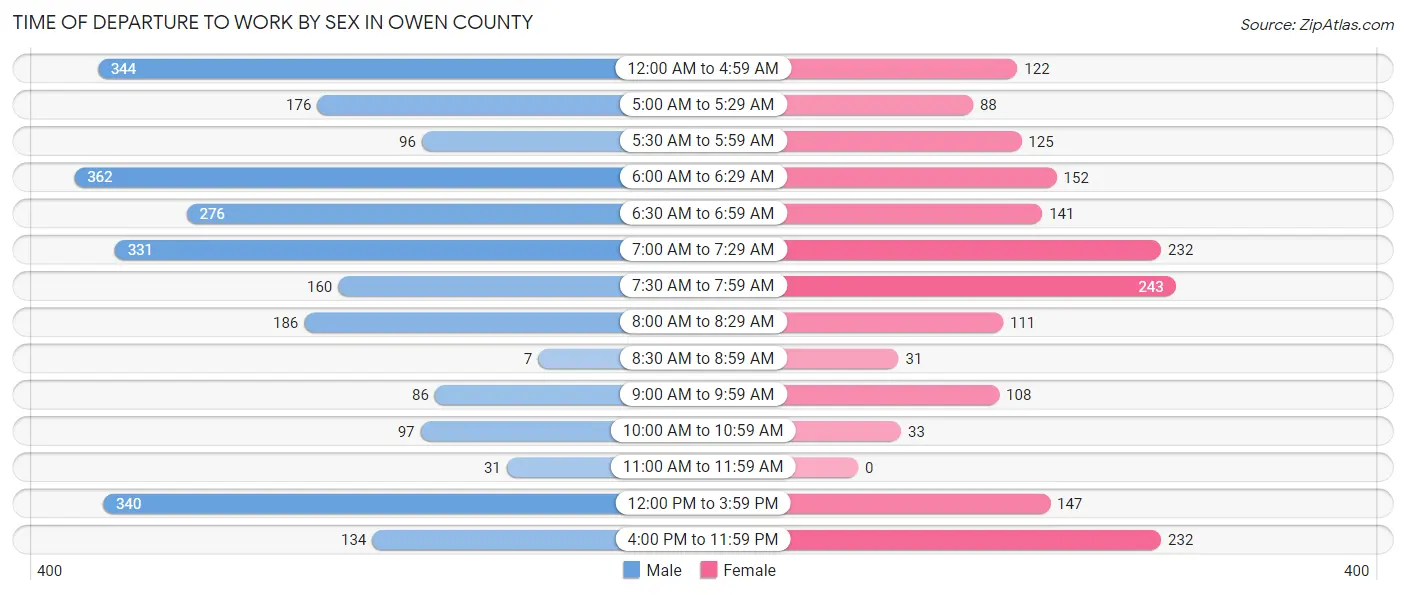
| Time of Departure | Male | Female |
| 12:00 AM to 4:59 AM | 344 (13.1%) | 122 (6.9%) |
| 5:00 AM to 5:29 AM | 176 (6.7%) | 88 (5.0%) |
| 5:30 AM to 5:59 AM | 96 (3.7%) | 125 (7.1%) |
| 6:00 AM to 6:29 AM | 362 (13.8%) | 152 (8.6%) |
| 6:30 AM to 6:59 AM | 276 (10.5%) | 141 (8.0%) |
| 7:00 AM to 7:29 AM | 331 (12.6%) | 232 (13.1%) |
| 7:30 AM to 7:59 AM | 160 (6.1%) | 243 (13.8%) |
| 8:00 AM to 8:29 AM | 186 (7.1%) | 111 (6.3%) |
| 8:30 AM to 8:59 AM | 7 (0.3%) | 31 (1.8%) |
| 9:00 AM to 9:59 AM | 86 (3.3%) | 108 (6.1%) |
| 10:00 AM to 10:59 AM | 97 (3.7%) | 33 (1.9%) |
| 11:00 AM to 11:59 AM | 31 (1.2%) | 0 (0.0%) |
| 12:00 PM to 3:59 PM | 340 (13.0%) | 147 (8.3%) |
| 4:00 PM to 11:59 PM | 134 (5.1%) | 232 (13.1%) |
| Total | 2,626 (100.0%) | 1,765 (100.0%) |
Housing Occupancy in Owen County
Occupancy by Ownership in Owen County
Of the total 4,146 dwellings in Owen County, owner-occupied units account for 3,546 (85.5%), while renter-occupied units make up 600 (14.5%).
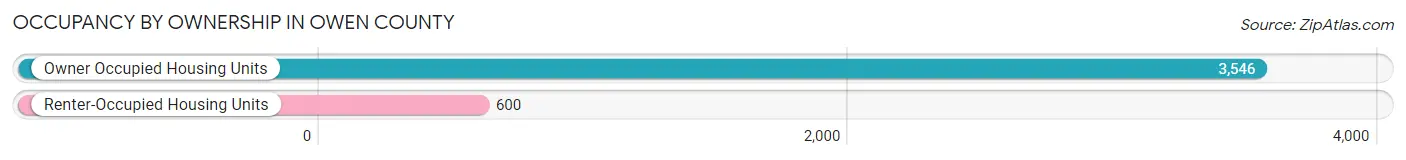
| Occupancy | # Housing Units | % Housing Units |
| Owner Occupied Housing Units | 3,546 | 85.5% |
| Renter-Occupied Housing Units | 600 | 14.5% |
| Total Occupied Housing Units | 4,146 | 100.0% |
Occupancy by Household Size in Owen County
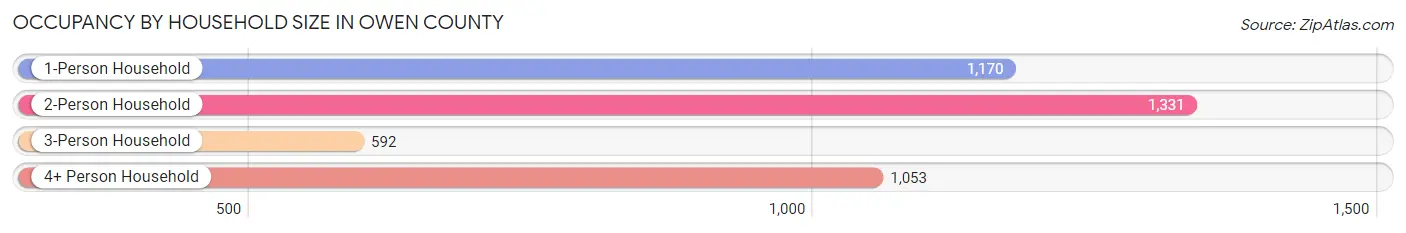
| Household Size | # Housing Units | % Housing Units |
| 1-Person Household | 1,170 | 28.2% |
| 2-Person Household | 1,331 | 32.1% |
| 3-Person Household | 592 | 14.3% |
| 4+ Person Household | 1,053 | 25.4% |
| Total Housing Units | 4,146 | 100.0% |
Occupancy by Ownership by Household Size in Owen County
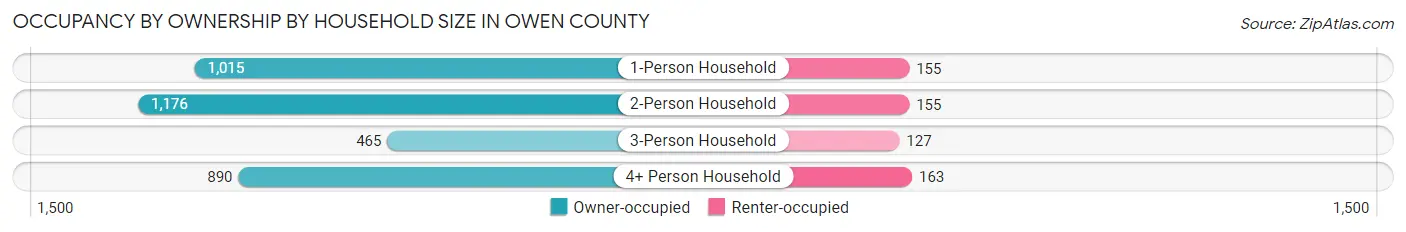
| Household Size | Owner-occupied | Renter-occupied |
| 1-Person Household | 1,015 (86.8%) | 155 (13.3%) |
| 2-Person Household | 1,176 (88.3%) | 155 (11.7%) |
| 3-Person Household | 465 (78.5%) | 127 (21.4%) |
| 4+ Person Household | 890 (84.5%) | 163 (15.5%) |
| Total Housing Units | 3,546 (85.5%) | 600 (14.5%) |
Occupancy by Educational Attainment in Owen County
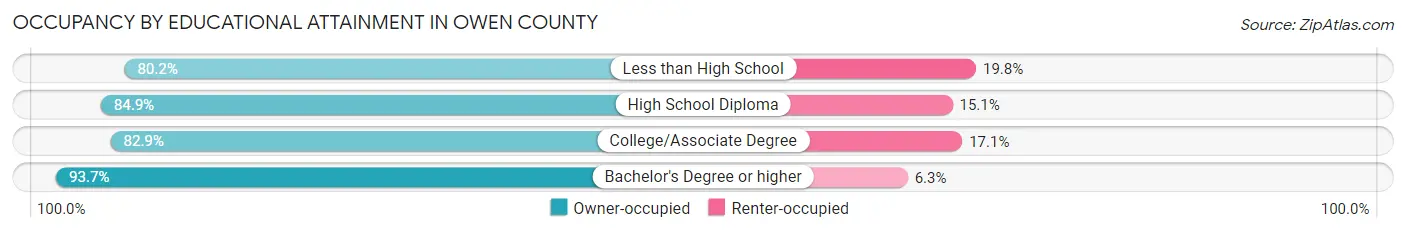
| Household Size | Owner-occupied | Renter-occupied |
| Less than High School | 494 (80.2%) | 122 (19.8%) |
| High School Diploma | 1,373 (84.9%) | 245 (15.1%) |
| College/Associate Degree | 870 (82.9%) | 179 (17.1%) |
| Bachelor's Degree or higher | 809 (93.7%) | 54 (6.3%) |
Occupancy by Age of Householder in Owen County
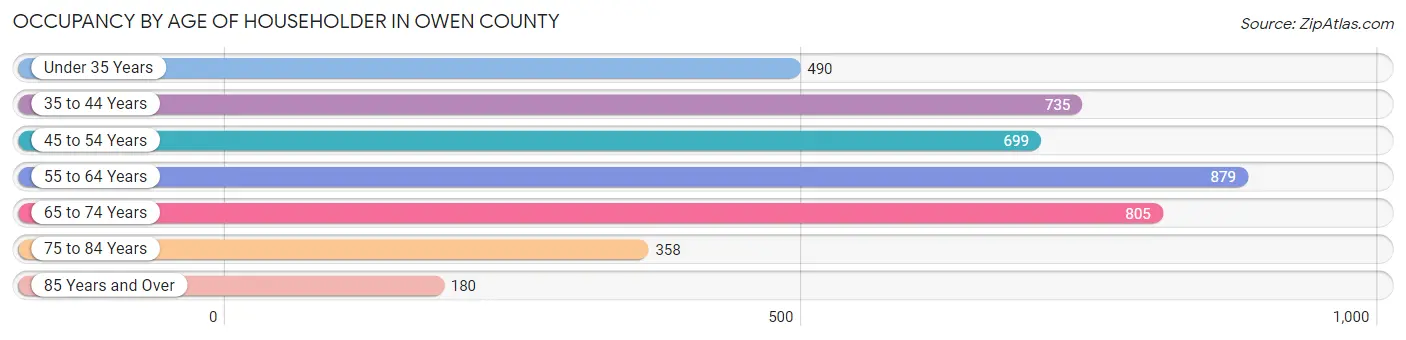
| Age Bracket | # Households | % Households |
| Under 35 Years | 490 | 11.8% |
| 35 to 44 Years | 735 | 17.7% |
| 45 to 54 Years | 699 | 16.9% |
| 55 to 64 Years | 879 | 21.2% |
| 65 to 74 Years | 805 | 19.4% |
| 75 to 84 Years | 358 | 8.6% |
| 85 Years and Over | 180 | 4.3% |
| Total | 4,146 | 100.0% |
Housing Finances in Owen County
Median Income by Occupancy in Owen County
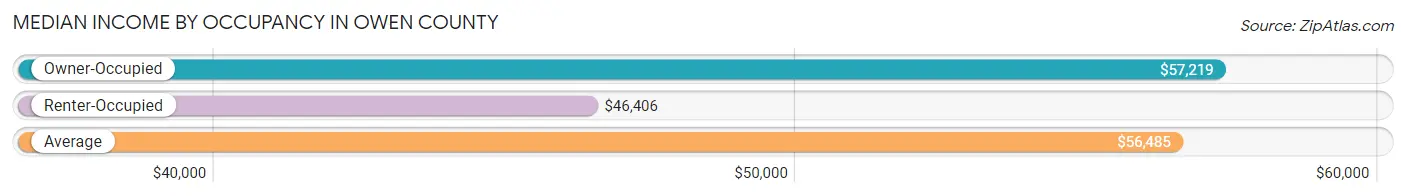
| Occupancy Type | # Households | Median Income |
| Owner-Occupied | 3,546 (85.5%) | $57,219 |
| Renter-Occupied | 600 (14.5%) | $46,406 |
| Average | 4,146 (100.0%) | $56,485 |
Occupancy by Householder Income Bracket in Owen County
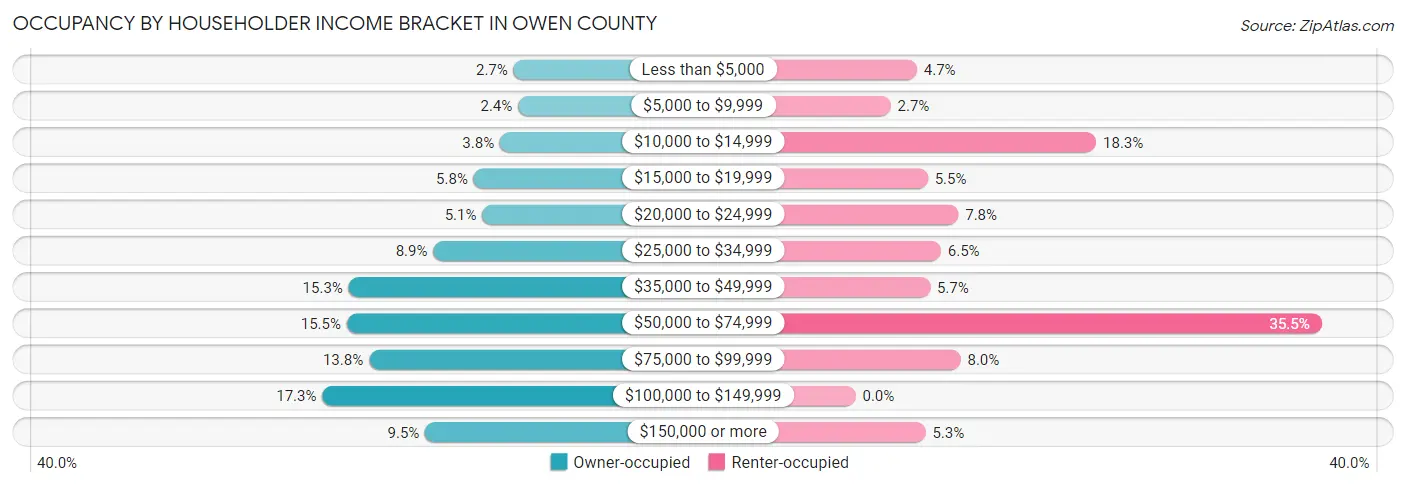
| Income Bracket | Owner-occupied | Renter-occupied |
| Less than $5,000 | 97 (2.7%) | 28 (4.7%) |
| $5,000 to $9,999 | 85 (2.4%) | 16 (2.7%) |
| $10,000 to $14,999 | 134 (3.8%) | 110 (18.3%) |
| $15,000 to $19,999 | 205 (5.8%) | 33 (5.5%) |
| $20,000 to $24,999 | 182 (5.1%) | 47 (7.8%) |
| $25,000 to $34,999 | 314 (8.9%) | 39 (6.5%) |
| $35,000 to $49,999 | 543 (15.3%) | 34 (5.7%) |
| $50,000 to $74,999 | 548 (15.4%) | 213 (35.5%) |
| $75,000 to $99,999 | 488 (13.8%) | 48 (8.0%) |
| $100,000 to $149,999 | 614 (17.3%) | 0 (0.0%) |
| $150,000 or more | 336 (9.5%) | 32 (5.3%) |
| Total | 3,546 (100.0%) | 600 (100.0%) |
Monthly Housing Cost Tiers in Owen County
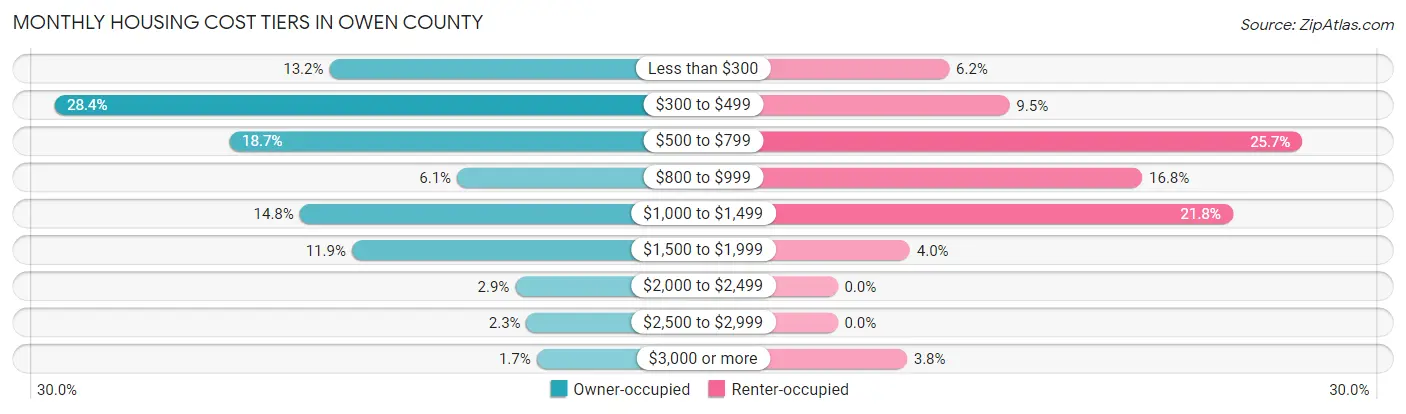
| Monthly Cost | Owner-occupied | Renter-occupied |
| Less than $300 | 467 (13.2%) | 37 (6.2%) |
| $300 to $499 | 1,006 (28.4%) | 57 (9.5%) |
| $500 to $799 | 663 (18.7%) | 154 (25.7%) |
| $800 to $999 | 217 (6.1%) | 101 (16.8%) |
| $1,000 to $1,499 | 525 (14.8%) | 131 (21.8%) |
| $1,500 to $1,999 | 423 (11.9%) | 24 (4.0%) |
| $2,000 to $2,499 | 103 (2.9%) | 0 (0.0%) |
| $2,500 to $2,999 | 81 (2.3%) | 0 (0.0%) |
| $3,000 or more | 61 (1.7%) | 23 (3.8%) |
| Total | 3,546 (100.0%) | 600 (100.0%) |
Physical Housing Characteristics in Owen County
Housing Structures in Owen County
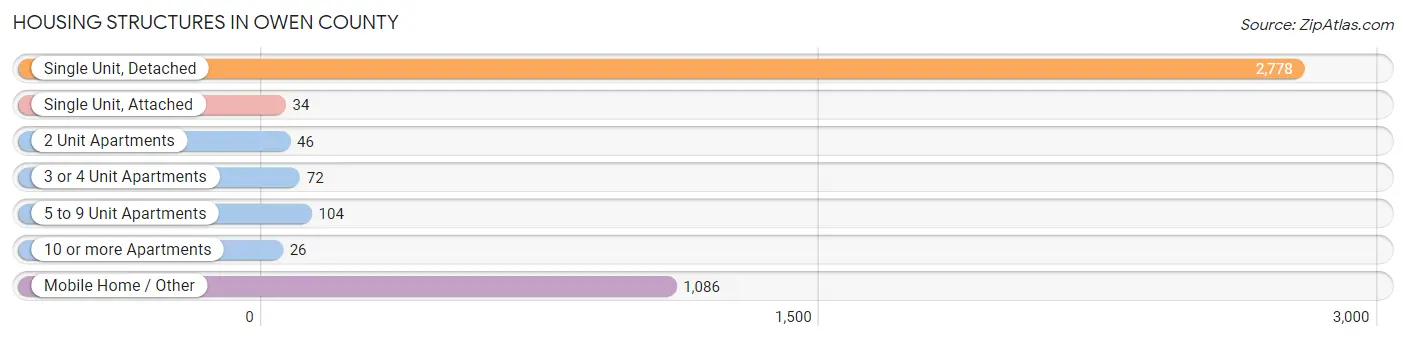
| Structure Type | # Housing Units | % Housing Units |
| Single Unit, Detached | 2,778 | 67.0% |
| Single Unit, Attached | 34 | 0.8% |
| 2 Unit Apartments | 46 | 1.1% |
| 3 or 4 Unit Apartments | 72 | 1.7% |
| 5 to 9 Unit Apartments | 104 | 2.5% |
| 10 or more Apartments | 26 | 0.6% |
| Mobile Home / Other | 1,086 | 26.2% |
| Total | 4,146 | 100.0% |
Housing Structures by Occupancy in Owen County
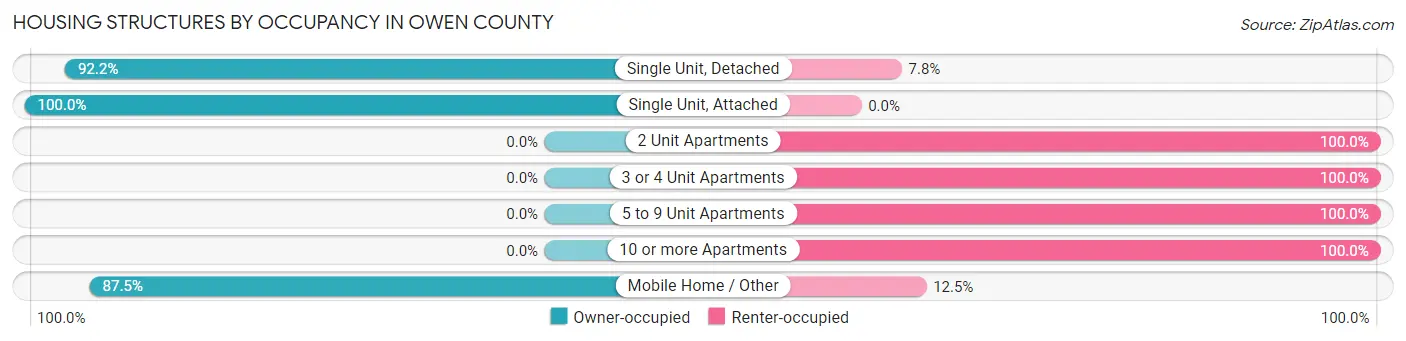
| Structure Type | Owner-occupied | Renter-occupied |
| Single Unit, Detached | 2,562 (92.2%) | 216 (7.8%) |
| Single Unit, Attached | 34 (100.0%) | 0 (0.0%) |
| 2 Unit Apartments | 0 (0.0%) | 46 (100.0%) |
| 3 or 4 Unit Apartments | 0 (0.0%) | 72 (100.0%) |
| 5 to 9 Unit Apartments | 0 (0.0%) | 104 (100.0%) |
| 10 or more Apartments | 0 (0.0%) | 26 (100.0%) |
| Mobile Home / Other | 950 (87.5%) | 136 (12.5%) |
| Total | 3,546 (85.5%) | 600 (14.5%) |
Housing Structures by Number of Rooms in Owen County
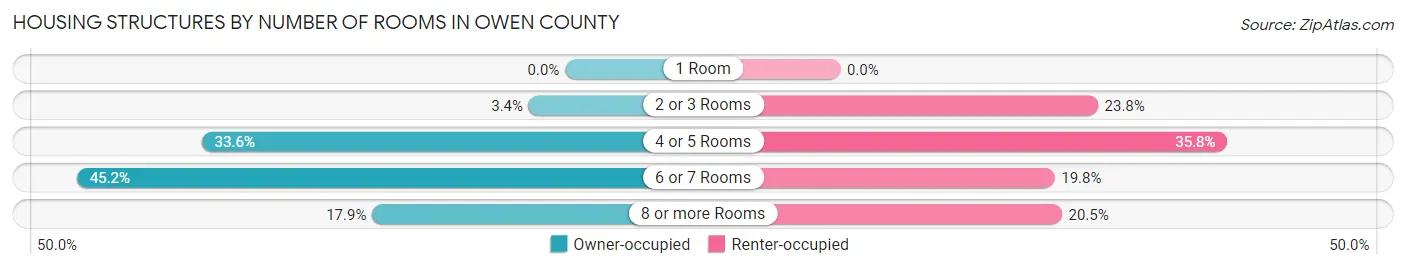
| Number of Rooms | Owner-occupied | Renter-occupied |
| 1 Room | 0 (0.0%) | 0 (0.0%) |
| 2 or 3 Rooms | 119 (3.4%) | 143 (23.8%) |
| 4 or 5 Rooms | 1,192 (33.6%) | 215 (35.8%) |
| 6 or 7 Rooms | 1,602 (45.2%) | 119 (19.8%) |
| 8 or more Rooms | 633 (17.8%) | 123 (20.5%) |
| Total | 3,546 (100.0%) | 600 (100.0%) |
Housing Structure by Heating Type in Owen County
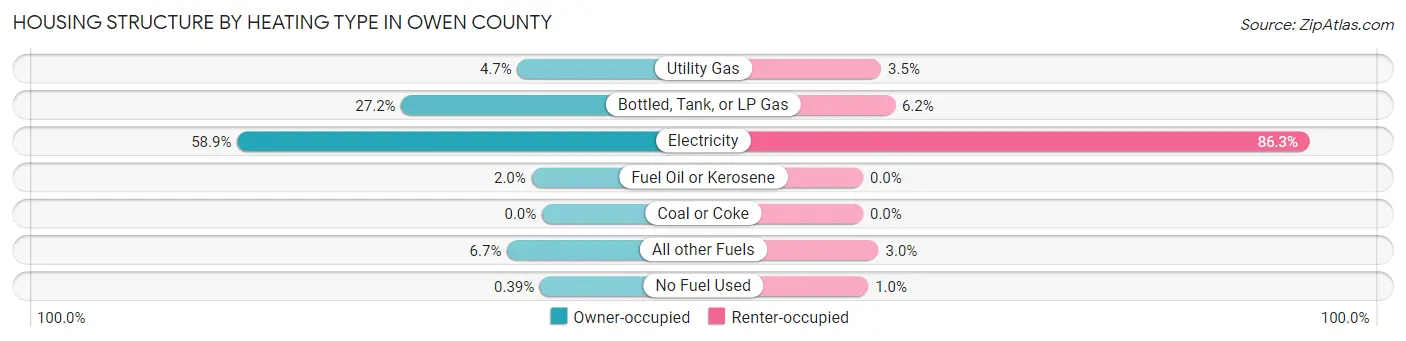
| Heating Type | Owner-occupied | Renter-occupied |
| Utility Gas | 168 (4.7%) | 21 (3.5%) |
| Bottled, Tank, or LP Gas | 964 (27.2%) | 37 (6.2%) |
| Electricity | 2,089 (58.9%) | 518 (86.3%) |
| Fuel Oil or Kerosene | 72 (2.0%) | 0 (0.0%) |
| Coal or Coke | 0 (0.0%) | 0 (0.0%) |
| All other Fuels | 239 (6.7%) | 18 (3.0%) |
| No Fuel Used | 14 (0.4%) | 6 (1.0%) |
| Total | 3,546 (100.0%) | 600 (100.0%) |
Household Vehicle Usage in Owen County
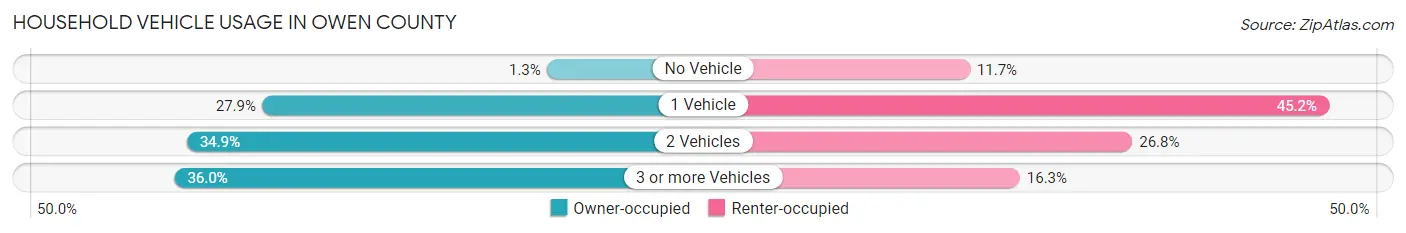
| Vehicles per Household | Owner-occupied | Renter-occupied |
| No Vehicle | 45 (1.3%) | 70 (11.7%) |
| 1 Vehicle | 988 (27.9%) | 271 (45.2%) |
| 2 Vehicles | 1,236 (34.9%) | 161 (26.8%) |
| 3 or more Vehicles | 1,277 (36.0%) | 98 (16.3%) |
| Total | 3,546 (100.0%) | 600 (100.0%) |
Real Estate & Mortgages in Owen County
Real Estate and Mortgage Overview in Owen County
| Characteristic | Without Mortgage | With Mortgage |
| Housing Units | 1,896 | 1,650 |
| Median Property Value | $110,900 | $163,800 |
| Median Household Income | $45,133 | $249 |
| Monthly Housing Costs | $392 | $61 |
| Real Estate Taxes | $939 | $65 |
Property Value by Mortgage Status in Owen County
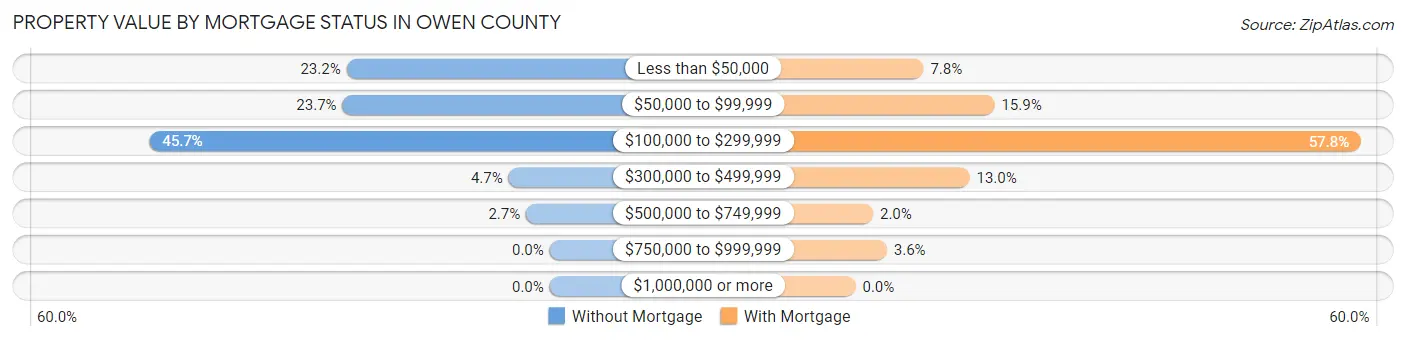
| Property Value | Without Mortgage | With Mortgage |
| Less than $50,000 | 440 (23.2%) | 128 (7.8%) |
| $50,000 to $99,999 | 449 (23.7%) | 262 (15.9%) |
| $100,000 to $299,999 | 867 (45.7%) | 953 (57.8%) |
| $300,000 to $499,999 | 89 (4.7%) | 215 (13.0%) |
| $500,000 to $749,999 | 51 (2.7%) | 33 (2.0%) |
| $750,000 to $999,999 | 0 (0.0%) | 59 (3.6%) |
| $1,000,000 or more | 0 (0.0%) | 0 (0.0%) |
| Total | 1,896 (100.0%) | 1,650 (100.0%) |
Household Income by Mortgage Status in Owen County
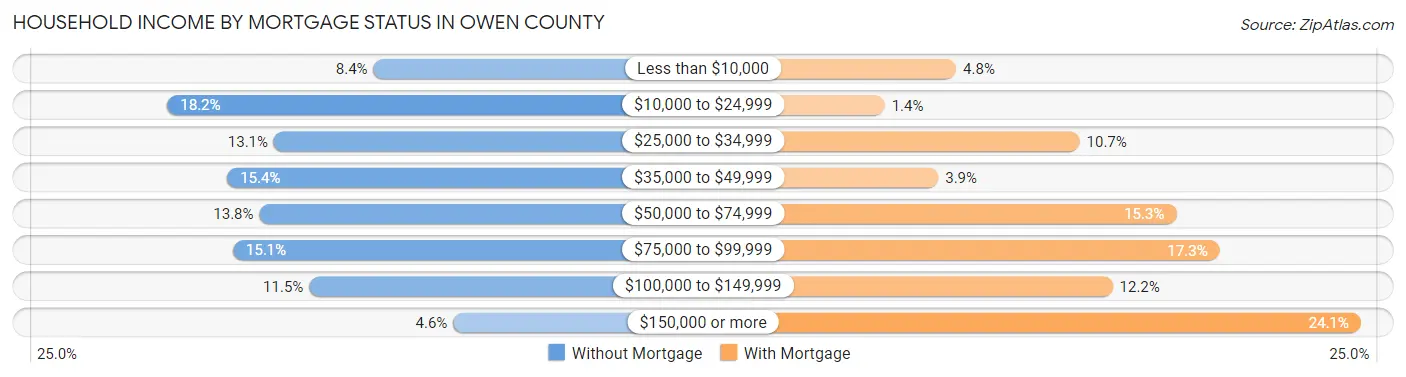
| Household Income | Without Mortgage | With Mortgage |
| Less than $10,000 | 159 (8.4%) | 79 (4.8%) |
| $10,000 to $24,999 | 345 (18.2%) | 23 (1.4%) |
| $25,000 to $34,999 | 249 (13.1%) | 176 (10.7%) |
| $35,000 to $49,999 | 291 (15.3%) | 65 (3.9%) |
| $50,000 to $74,999 | 262 (13.8%) | 252 (15.3%) |
| $75,000 to $99,999 | 286 (15.1%) | 286 (17.3%) |
| $100,000 to $149,999 | 217 (11.5%) | 202 (12.2%) |
| $150,000 or more | 87 (4.6%) | 397 (24.1%) |
| Total | 1,896 (100.0%) | 1,650 (100.0%) |
Property Value to Household Income Ratio in Owen County
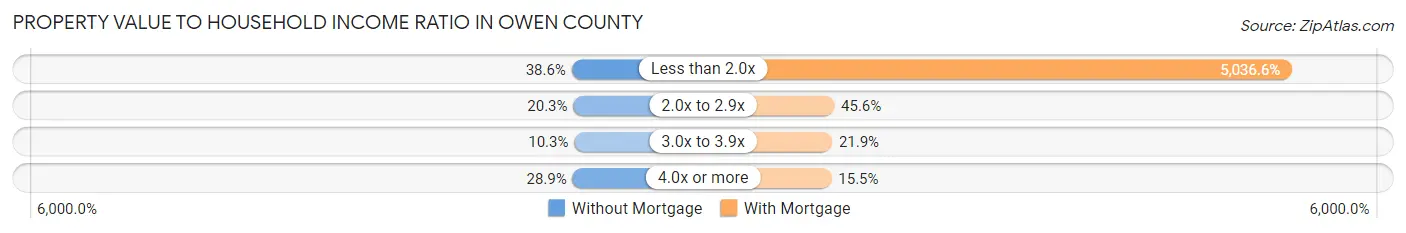
| Value-to-Income Ratio | Without Mortgage | With Mortgage |
| Less than 2.0x | 732 (38.6%) | 83,103 (5,036.5%) |
| 2.0x to 2.9x | 385 (20.3%) | 753 (45.6%) |
| 3.0x to 3.9x | 196 (10.3%) | 362 (21.9%) |
| 4.0x or more | 548 (28.9%) | 256 (15.5%) |
| Total | 1,896 (100.0%) | 1,650 (100.0%) |
Real Estate Taxes by Mortgage Status in Owen County
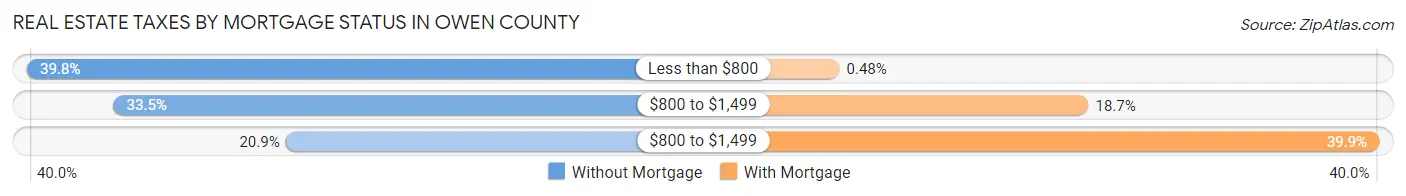
| Property Taxes | Without Mortgage | With Mortgage |
| Less than $800 | 755 (39.8%) | 8 (0.5%) |
| $800 to $1,499 | 635 (33.5%) | 308 (18.7%) |
| $800 to $1,499 | 397 (20.9%) | 658 (39.9%) |
| Total | 1,896 (100.0%) | 1,650 (100.0%) |
Health & Disability in Owen County
Health Insurance Coverage by Age in Owen County
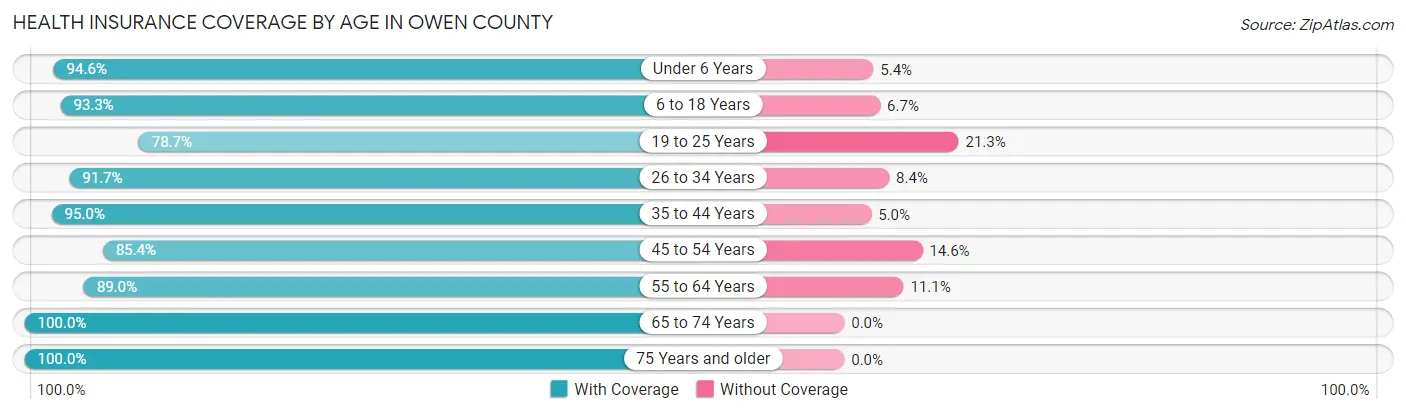
| Age Bracket | With Coverage | Without Coverage |
| Under 6 Years | 715 (94.6%) | 41 (5.4%) |
| 6 to 18 Years | 1,619 (93.3%) | 116 (6.7%) |
| 19 to 25 Years | 827 (78.7%) | 224 (21.3%) |
| 26 to 34 Years | 933 (91.6%) | 85 (8.4%) |
| 35 to 44 Years | 1,265 (95.0%) | 67 (5.0%) |
| 45 to 54 Years | 1,249 (85.4%) | 213 (14.6%) |
| 55 to 64 Years | 1,473 (88.9%) | 183 (11.1%) |
| 65 to 74 Years | 1,330 (100.0%) | 0 (0.0%) |
| 75 Years and older | 787 (100.0%) | 0 (0.0%) |
| Total | 10,198 (91.6%) | 929 (8.4%) |
Health Insurance Coverage by Citizenship Status in Owen County
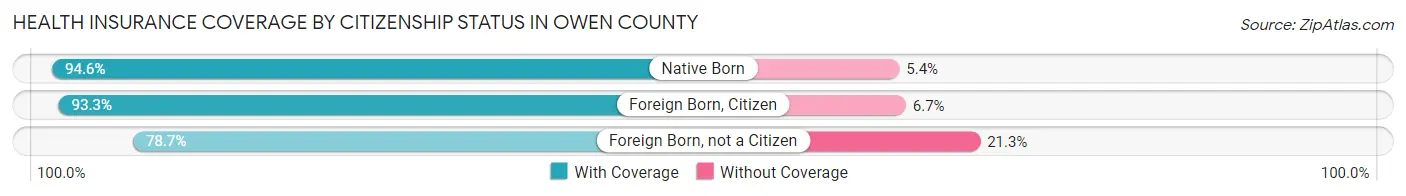
| Citizenship Status | With Coverage | Without Coverage |
| Native Born | 715 (94.6%) | 41 (5.4%) |
| Foreign Born, Citizen | 1,619 (93.3%) | 116 (6.7%) |
| Foreign Born, not a Citizen | 827 (78.7%) | 224 (21.3%) |
Health Insurance Coverage by Household Income in Owen County
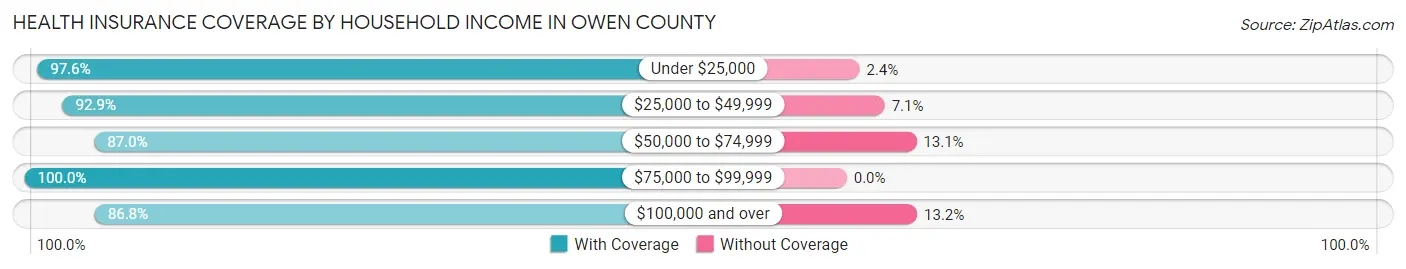
| Household Income | With Coverage | Without Coverage |
| Under $25,000 | 1,676 (97.6%) | 41 (2.4%) |
| $25,000 to $49,999 | 2,168 (92.9%) | 166 (7.1%) |
| $50,000 to $74,999 | 1,752 (87.0%) | 263 (13.1%) |
| $75,000 to $99,999 | 1,575 (100.0%) | 0 (0.0%) |
| $100,000 and over | 3,027 (86.8%) | 459 (13.2%) |
Public vs Private Health Insurance Coverage by Age in Owen County
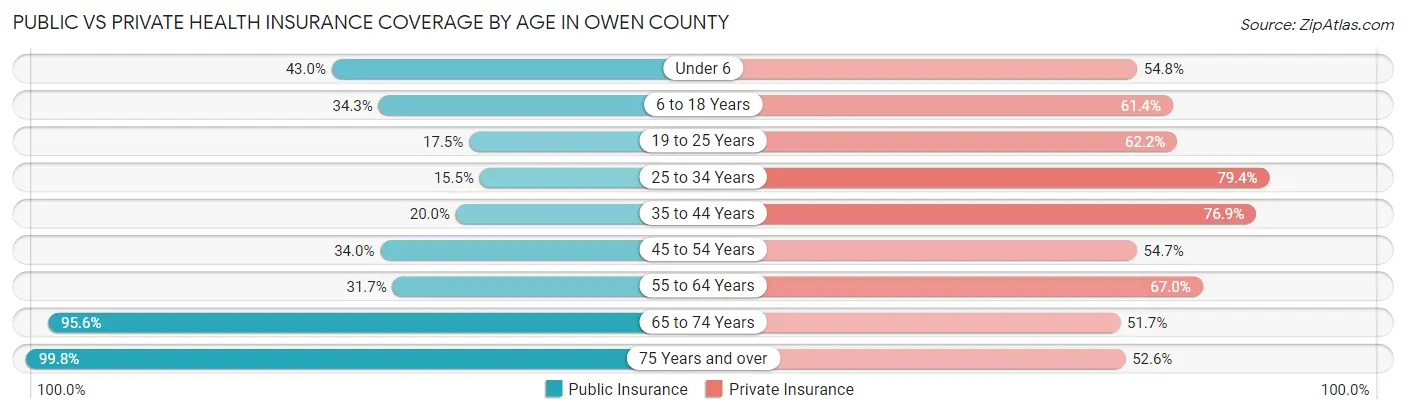
| Age Bracket | Public Insurance | Private Insurance |
| Under 6 | 325 (43.0%) | 414 (54.8%) |
| 6 to 18 Years | 595 (34.3%) | 1,066 (61.4%) |
| 19 to 25 Years | 184 (17.5%) | 654 (62.2%) |
| 25 to 34 Years | 158 (15.5%) | 808 (79.4%) |
| 35 to 44 Years | 266 (20.0%) | 1,024 (76.9%) |
| 45 to 54 Years | 497 (34.0%) | 800 (54.7%) |
| 55 to 64 Years | 525 (31.7%) | 1,109 (67.0%) |
| 65 to 74 Years | 1,272 (95.6%) | 687 (51.6%) |
| 75 Years and over | 785 (99.8%) | 414 (52.6%) |
| Total | 4,607 (41.4%) | 6,976 (62.7%) |
Disability Status by Sex by Age in Owen County
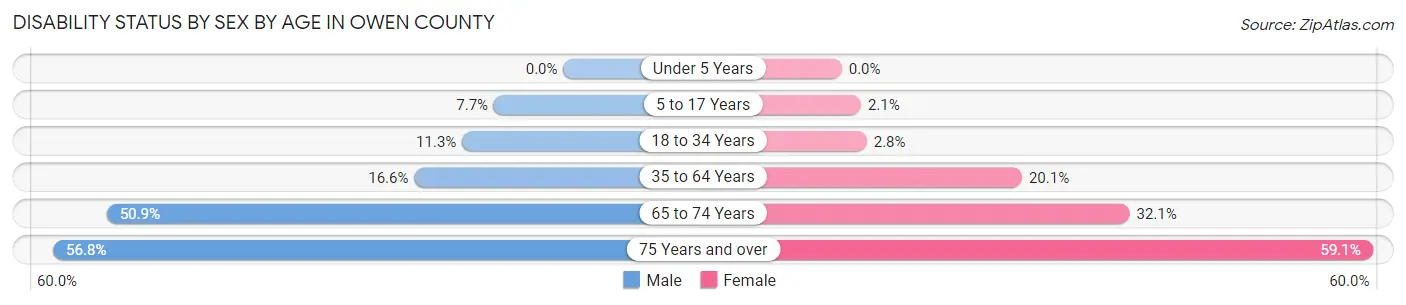
| Age Bracket | Male | Female |
| Under 5 Years | 0 (0.0%) | 0 (0.0%) |
| 5 to 17 Years | 72 (7.7%) | 19 (2.1%) |
| 18 to 34 Years | 126 (11.3%) | 28 (2.8%) |
| 35 to 64 Years | 369 (16.6%) | 447 (20.1%) |
| 65 to 74 Years | 359 (50.8%) | 200 (32.1%) |
| 75 Years and over | 204 (56.8%) | 253 (59.1%) |
Disability Class by Sex by Age in Owen County
Disability Class: Hearing Difficulty
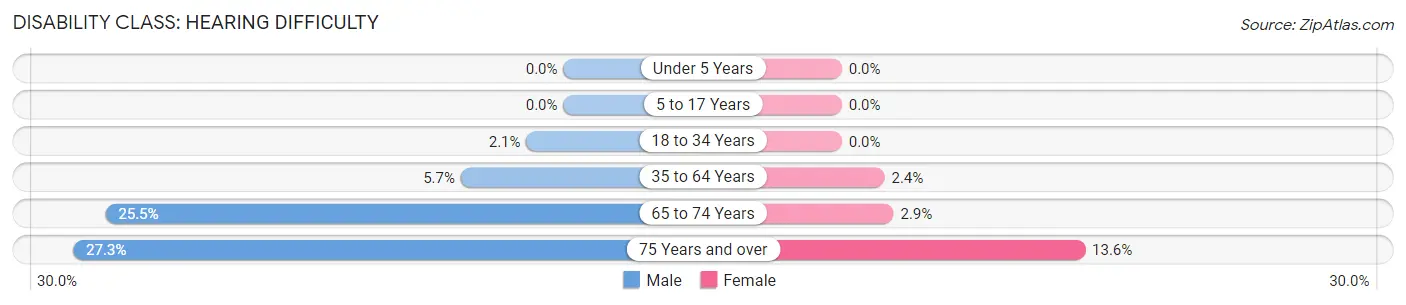
| Age Bracket | Male | Female |
| Under 5 Years | 0 (0.0%) | 0 (0.0%) |
| 5 to 17 Years | 0 (0.0%) | 0 (0.0%) |
| 18 to 34 Years | 23 (2.1%) | 0 (0.0%) |
| 35 to 64 Years | 127 (5.7%) | 53 (2.4%) |
| 65 to 74 Years | 180 (25.5%) | 18 (2.9%) |
| 75 Years and over | 98 (27.3%) | 58 (13.6%) |
Disability Class: Vision Difficulty
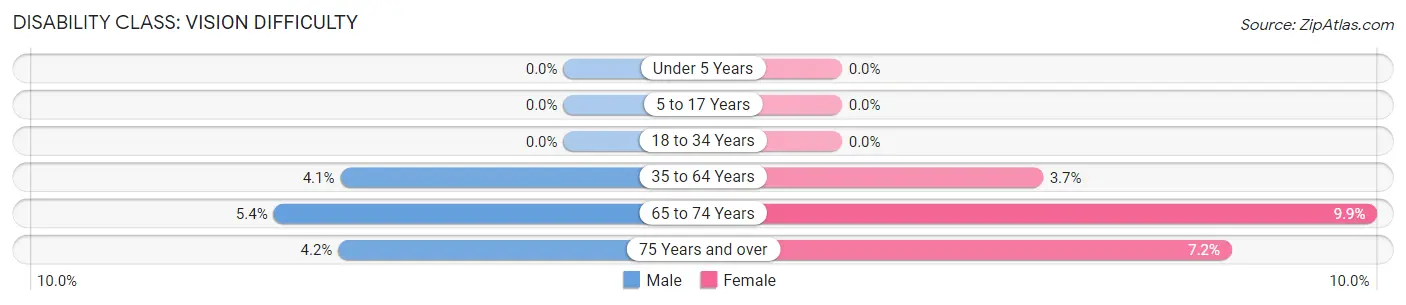
| Age Bracket | Male | Female |
| Under 5 Years | 0 (0.0%) | 0 (0.0%) |
| 5 to 17 Years | 0 (0.0%) | 0 (0.0%) |
| 18 to 34 Years | 0 (0.0%) | 0 (0.0%) |
| 35 to 64 Years | 92 (4.1%) | 83 (3.7%) |
| 65 to 74 Years | 38 (5.4%) | 62 (9.9%) |
| 75 Years and over | 15 (4.2%) | 31 (7.2%) |
Disability Class: Cognitive Difficulty
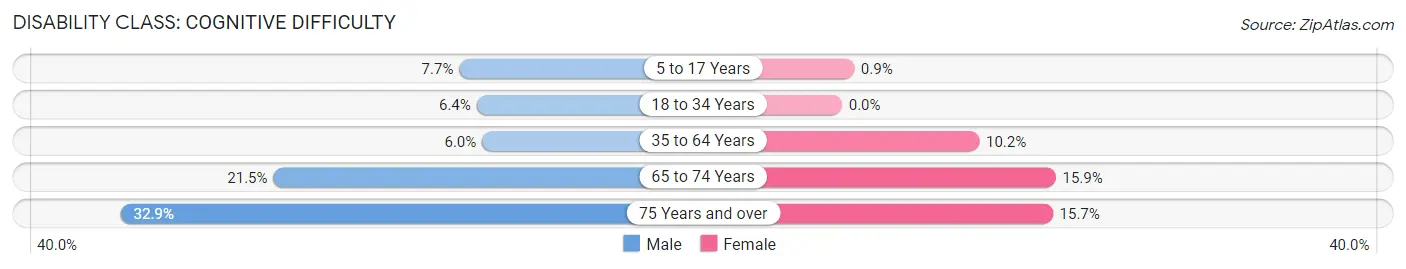
| Age Bracket | Male | Female |
| 5 to 17 Years | 72 (7.7%) | 8 (0.9%) |
| 18 to 34 Years | 72 (6.4%) | 0 (0.0%) |
| 35 to 64 Years | 134 (6.0%) | 227 (10.2%) |
| 65 to 74 Years | 152 (21.5%) | 99 (15.9%) |
| 75 Years and over | 118 (32.9%) | 67 (15.7%) |
Disability Class: Ambulatory Difficulty
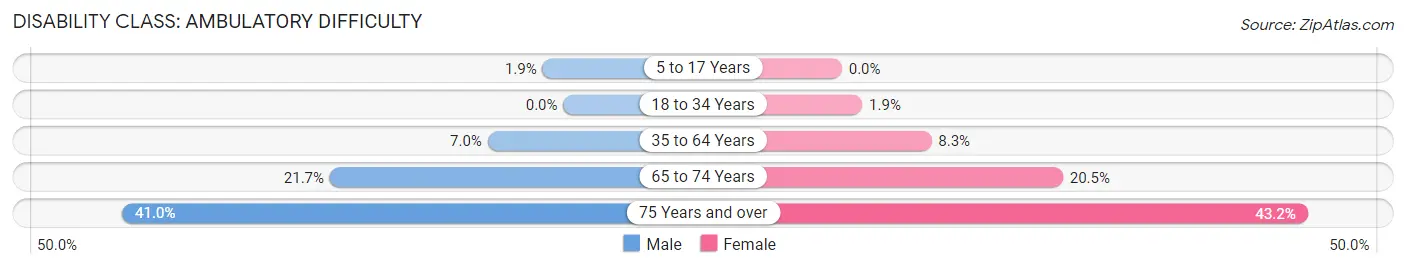
| Age Bracket | Male | Female |
| 5 to 17 Years | 18 (1.9%) | 0 (0.0%) |
| 18 to 34 Years | 0 (0.0%) | 19 (1.9%) |
| 35 to 64 Years | 156 (7.0%) | 185 (8.3%) |
| 65 to 74 Years | 153 (21.7%) | 128 (20.5%) |
| 75 Years and over | 147 (40.9%) | 185 (43.2%) |
Disability Class: Self-Care Difficulty
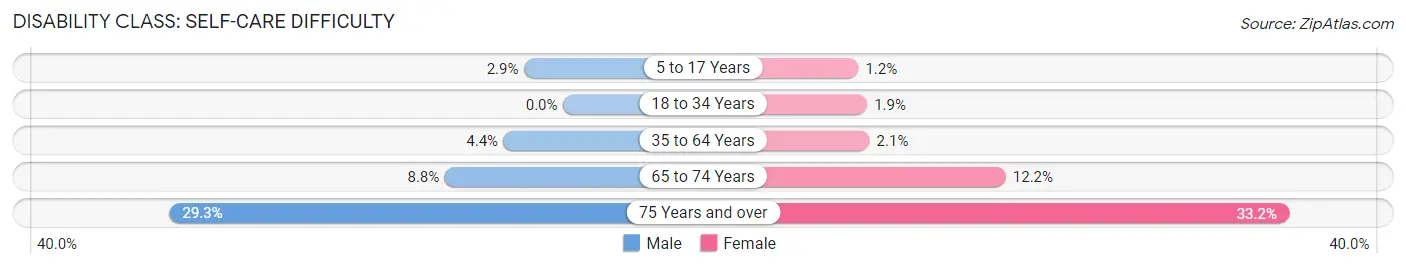
| Age Bracket | Male | Female |
| 5 to 17 Years | 27 (2.9%) | 11 (1.2%) |
| 18 to 34 Years | 0 (0.0%) | 19 (1.9%) |
| 35 to 64 Years | 98 (4.4%) | 46 (2.1%) |
| 65 to 74 Years | 62 (8.8%) | 76 (12.2%) |
| 75 Years and over | 105 (29.2%) | 142 (33.2%) |
Technology Access in Owen County
Computing Device Access in Owen County
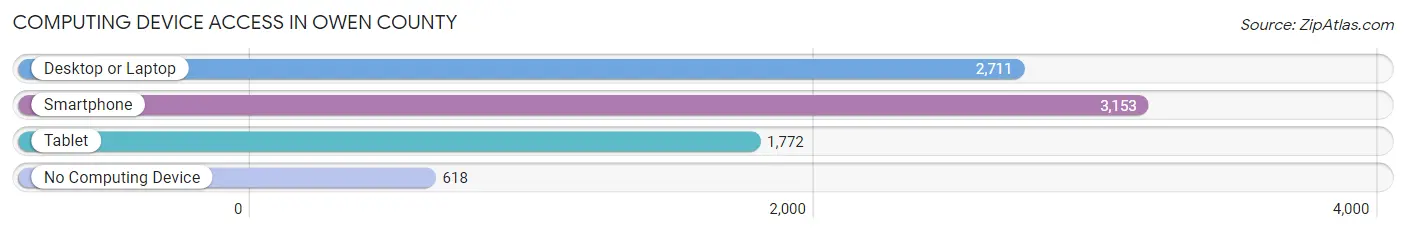
| Device Type | # Households | % Households |
| Desktop or Laptop | 2,711 | 65.4% |
| Smartphone | 3,153 | 76.0% |
| Tablet | 1,772 | 42.7% |
| No Computing Device | 618 | 14.9% |
| Total | 4,146 | 100.0% |
Internet Access in Owen County
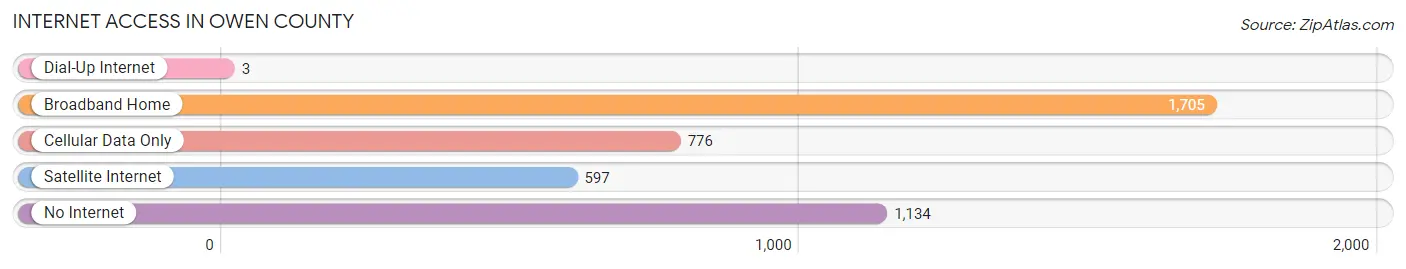
| Internet Type | # Households | % Households |
| Dial-Up Internet | 3 | 0.1% |
| Broadband Home | 1,705 | 41.1% |
| Cellular Data Only | 776 | 18.7% |
| Satellite Internet | 597 | 14.4% |
| No Internet | 1,134 | 27.4% |
| Total | 4,146 | 100.0% |
Owen County Summary
Owen County is located in the Bluegrass region of Kentucky, and is bordered by Grant, Gallatin, Carroll, and Henry counties. The county seat is Owenton, and the county was established in 1819. The county is named for Colonel Abraham Owen, a Revolutionary War veteran.
Geography
Owen County is located in the Bluegrass region of Kentucky, and is bordered by Grant, Gallatin, Carroll, and Henry counties. The county has a total area of 246 square miles, of which 246 square miles is land and 0.2 square miles is water. The county is located in the Inner Bluegrass region of Kentucky, and is characterized by rolling hills and fertile soils. The county is drained by the Kentucky River and its tributaries, including the Elkhorn Creek, Eagle Creek, and Licking River.
The highest point in the county is located in the northwest corner, at an elevation of 890 feet. The lowest point is located in the southeast corner, at an elevation of 590 feet. The county is home to several state parks, including the Kentucky River Palisades State Nature Preserve, the Elkhorn Creek State Nature Preserve, and the Eagle Creek State Nature Preserve.
Economy
Owen County has a diverse economy, with a mix of agriculture, manufacturing, and services. The county is home to several large employers, including the Kentucky River Palisades State Nature Preserve, the Elkhorn Creek State Nature Preserve, and the Eagle Creek State Nature Preserve. The county is also home to several small businesses, including a number of farms, restaurants, and retail stores.
Agriculture is a major part of the county's economy, with corn, soybeans, wheat, and hay being the primary crops. Livestock production is also important, with beef cattle, dairy cattle, and hogs being the primary animals raised.
Manufacturing is also an important part of the county's economy, with several large employers located in the county. The largest employer is the Owensboro-Daviess County Industrial Park, which is home to several large manufacturing companies. Other major employers include the Owensboro-Daviess County Airport, the Owensboro-Daviess County Convention Center, and the Owensboro-Daviess County Public Library.
Demographics
As of the 2010 census, the population of Owen County was 10,845, with a population density of 44.3 people per square mile. The median age was 40.2 years, and the median household income was $41,945. The racial makeup of the county was 95.3% White, 1.7% African American, 0.3% Native American, 0.3% Asian, 0.1% Pacific Islander, 1.2% from other races, and 1.3% from two or more races. Hispanic or Latino of any race were 2.7% of the population.
The largest ancestry groups in the county were German (25.3%), Irish (17.2%), English (14.2%), and American (13.2%). The largest religious affiliations were Baptist (30.2%), Methodist (14.2%), and Catholic (10.2%).
Conclusion
Owen County is located in the Bluegrass region of Kentucky, and is bordered by Grant, Gallatin, Carroll, and Henry counties. The county has a total area of 246 square miles, and is characterized by rolling hills and fertile soils. The county has a diverse economy, with a mix of agriculture, manufacturing, and services. As of the 2010 census, the population of Owen County was 10,845, with a median age of 40.2 years and a median household income of $41,945. The largest ancestry groups in the county were German, Irish, English, and American. The largest religious affiliations were Baptist, Methodist, and Catholic.
Common Questions
What is Per Capita Income in Owen County?
Per Capita income in Owen County is $28,446.
What is the Median Family Income in Owen County?
Median Family Income in Owen County is $74,609.
What is the Median Household income in Owen County?
Median Household Income in Owen County is $56,485.
What is Income or Wage Gap in Owen County?
Income or Wage Gap in Owen County is 7.5%.
Women in Owen County earn 92.5 cents for every dollar earned by a man.
What is Family Income Deficit in Owen County?
Family Income Deficit in Owen County is $9,491.
Families that are below poverty line in Owen County earn $9,491 less on average than the poverty threshold level.
What is Inequality or Gini Index in Owen County?
Inequality or Gini Index in Owen County is 0.44.
What is the Total Population of Owen County?
Total Population of Owen County is 11,229.
What is the Total Male Population of Owen County?
Total Male Population of Owen County is 5,702.
What is the Total Female Population of Owen County?
Total Female Population of Owen County is 5,527.
What is the Ratio of Males per 100 Females in Owen County?
There are 103.17 Males per 100 Females in Owen County.
What is the Ratio of Females per 100 Males in Owen County?
There are 96.93 Females per 100 Males in Owen County.
What is the Median Population Age in Owen County?
Median Population Age in Owen County is 42.9 Years.
What is the Average Family Size in Owen County
Average Family Size in Owen County is 3.3 People.
What is the Average Household Size in Owen County
Average Household Size in Owen County is 2.7 People.
How Large is the Labor Force in Owen County?
There are 5,187 People in the Labor Forcein in Owen County.
What is the Percentage of People in the Labor Force in Owen County?
57.1% of People are in the Labor Force in Owen County.
What is the Unemployment Rate in Owen County?
Unemployment Rate in Owen County is 4.6%.