Ohio County, KY Map & Demographics
Ohio County Map
Ohio County Overview
$26,712
PER CAPITA INCOME
$58,676
AVG FAMILY INCOME
$52,474
AVG HOUSEHOLD INCOME
35.4%
WAGE / INCOME GAP [ % ]
64.6¢/ $1
WAGE / INCOME GAP [ $ ]
$14,133
FAMILY INCOME DEFICIT
0.43
INEQUALITY / GINI INDEX
23,782
TOTAL POPULATION
11,966
MALE POPULATION
11,816
FEMALE POPULATION
101.27
MALES / 100 FEMALES
98.75
FEMALES / 100 MALES
41.0
MEDIAN AGE
3.0
AVG FAMILY SIZE
2.6
AVG HOUSEHOLD SIZE
10,492
LABOR FORCE [ PEOPLE ]
55.3%
PERCENT IN LABOR FORCE
4.5%
UNEMPLOYMENT RATE
Ohio County Area Codes
Income in Ohio County
Income Overview in Ohio County
Per Capita Income in Ohio County is $26,712, while median incomes of families and households are $58,676 and $52,474 respectively.
| Characteristic | Number | Measure |
| Per Capita Income | 23,782 | $26,712 |
| Median Family Income | 6,326 | $58,676 |
| Mean Family Income | 6,326 | $77,257 |
| Median Household Income | 9,041 | $52,474 |
| Mean Household Income | 9,041 | $67,297 |
| Income Deficit | 6,326 | $14,133 |
| Wage / Income Gap (%) | 23,782 | 35.36% |
| Wage / Income Gap ($) | 23,782 | 64.64¢ per $1 |
| Gini / Inequality Index | 23,782 | 0.43 |
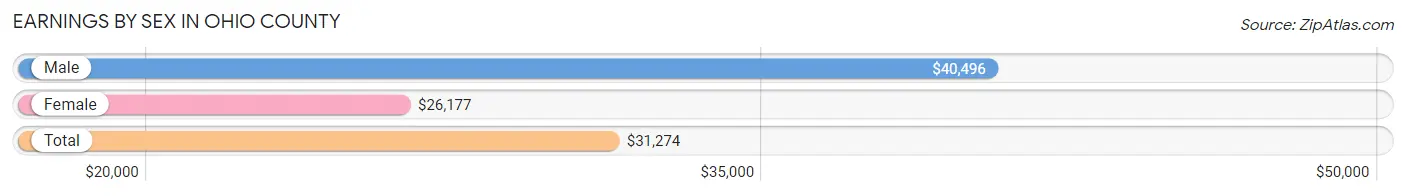
Earnings by Sex in Ohio County
Average Earnings in Ohio County are $31,274, $40,496 for men and $26,177 for women, a difference of 35.4%.
| Sex | Number | Average Earnings |
| Male | 6,001 (53.5%) | $40,496 |
| Female | 5,222 (46.5%) | $26,177 |
| Total | 11,223 (100.0%) | $31,274 |
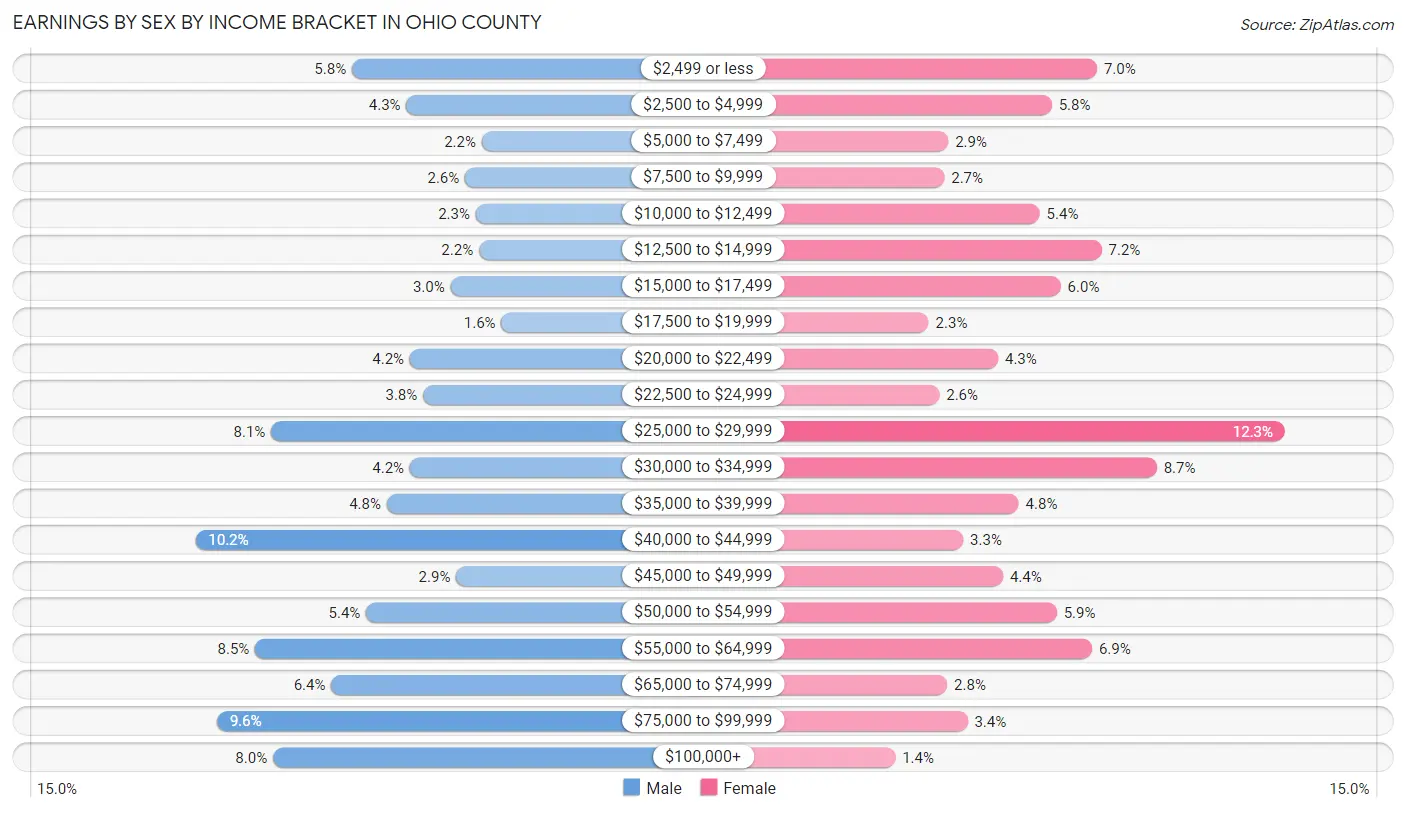
Earnings by Sex by Income Bracket in Ohio County
The most common earnings brackets in Ohio County are $40,000 to $44,999 for men (612 | 10.2%) and $25,000 to $29,999 for women (643 | 12.3%).
| Income | Male | Female |
| $2,499 or less | 348 (5.8%) | 367 (7.0%) |
| $2,500 to $4,999 | 256 (4.3%) | 301 (5.8%) |
| $5,000 to $7,499 | 129 (2.1%) | 149 (2.9%) |
| $7,500 to $9,999 | 157 (2.6%) | 143 (2.7%) |
| $10,000 to $12,499 | 139 (2.3%) | 283 (5.4%) |
| $12,500 to $14,999 | 134 (2.2%) | 374 (7.2%) |
| $15,000 to $17,499 | 182 (3.0%) | 314 (6.0%) |
| $17,500 to $19,999 | 96 (1.6%) | 120 (2.3%) |
| $20,000 to $22,499 | 250 (4.2%) | 222 (4.3%) |
| $22,500 to $24,999 | 228 (3.8%) | 136 (2.6%) |
| $25,000 to $29,999 | 484 (8.1%) | 643 (12.3%) |
| $30,000 to $34,999 | 250 (4.2%) | 455 (8.7%) |
| $35,000 to $39,999 | 289 (4.8%) | 252 (4.8%) |
| $40,000 to $44,999 | 612 (10.2%) | 171 (3.3%) |
| $45,000 to $49,999 | 172 (2.9%) | 229 (4.4%) |
| $50,000 to $54,999 | 324 (5.4%) | 308 (5.9%) |
| $55,000 to $64,999 | 511 (8.5%) | 360 (6.9%) |
| $65,000 to $74,999 | 383 (6.4%) | 147 (2.8%) |
| $75,000 to $99,999 | 576 (9.6%) | 177 (3.4%) |
| $100,000+ | 481 (8.0%) | 71 (1.4%) |
| Total | 6,001 (100.0%) | 5,222 (100.0%) |
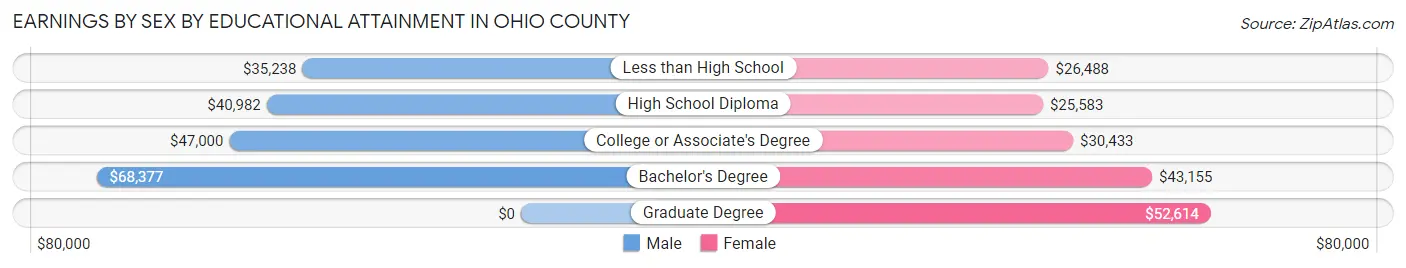
Earnings by Sex by Educational Attainment in Ohio County
Average earnings in Ohio County are $43,197 for men and $28,836 for women, a difference of 33.3%. Men with an educational attainment of bachelor's degree enjoy the highest average annual earnings of $68,377, while those with less than high school education earn the least with $35,238. Women with an educational attainment of graduate degree earn the most with the average annual earnings of $52,614, while those with high school diploma education have the smallest earnings of $25,583.
| Educational Attainment | Male Income | Female Income |
| Less than High School | $35,238 | $26,488 |
| High School Diploma | $40,982 | $25,583 |
| College or Associate's Degree | $47,000 | $30,433 |
| Bachelor's Degree | $68,377 | $43,155 |
| Graduate Degree | - | - |
| Total | $43,197 | $28,836 |
Family Income in Ohio County
Family Income Brackets in Ohio County
According to the Ohio County family income data, there are 1,272 families falling into the $50,000 to $74,999 income range, which is the most common income bracket and makes up 20.1% of all families. Conversely, the $10,000 to $14,999 income bracket is the least frequent group with only 57 families (0.9%) belonging to this category.
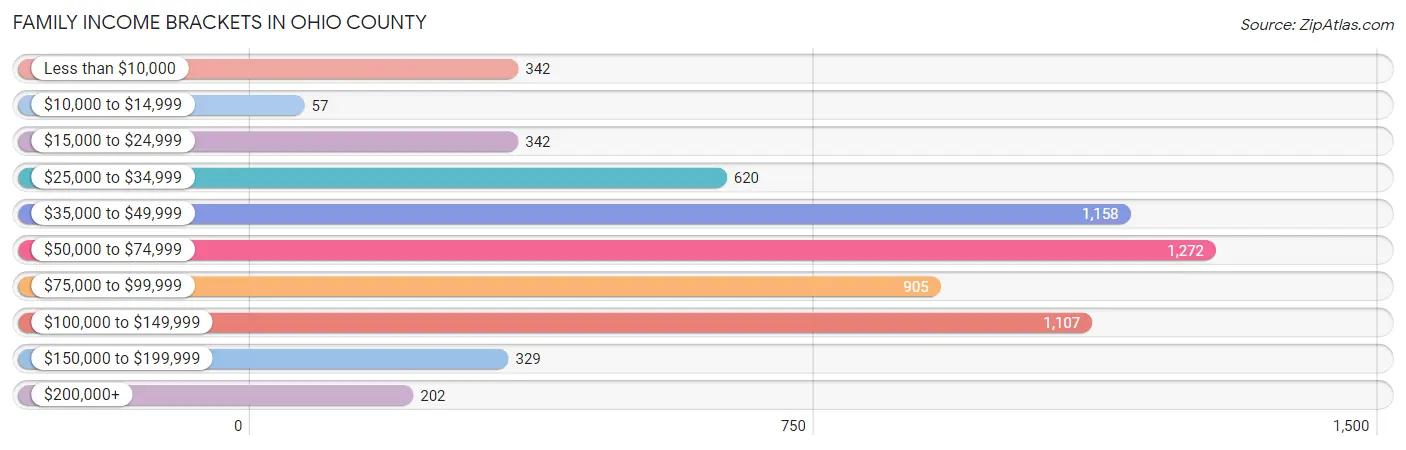
| Income Bracket | # Families | % Families |
| Less than $10,000 | 342 | 5.4% |
| $10,000 to $14,999 | 57 | 0.9% |
| $15,000 to $24,999 | 342 | 5.4% |
| $25,000 to $34,999 | 620 | 9.8% |
| $35,000 to $49,999 | 1,158 | 18.3% |
| $50,000 to $74,999 | 1,272 | 20.1% |
| $75,000 to $99,999 | 905 | 14.3% |
| $100,000 to $149,999 | 1,107 | 17.5% |
| $150,000 to $199,999 | 329 | 5.2% |
| $200,000+ | 202 | 3.2% |
Family Income by Famaliy Size in Ohio County
7+ person families (47 | 0.7%) account for the highest median family income in Ohio County with $105,417 per family, while 2-person families (2,991 | 47.3%) have the highest median income of $26,766 per family member.
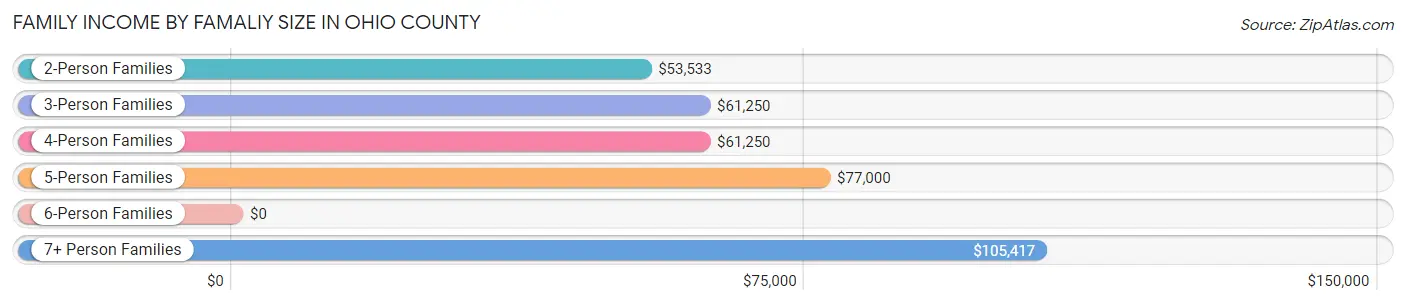
| Income Bracket | # Families | Median Income |
| 2-Person Families | 2,991 (47.3%) | $53,533 |
| 3-Person Families | 1,647 (26.0%) | $61,250 |
| 4-Person Families | 1,120 (17.7%) | $61,250 |
| 5-Person Families | 344 (5.4%) | $77,000 |
| 6-Person Families | 177 (2.8%) | $0 |
| 7+ Person Families | 47 (0.7%) | $105,417 |
| Total | 6,326 (100.0%) | $58,676 |
Family Income by Number of Earners in Ohio County
The median family income in Ohio County is $58,676, with families comprising 3+ earners (660) having the highest median family income of $111,127, while families with no earners (1,320) have the lowest median family income of $44,224, accounting for 10.4% and 20.9% of families, respectively.
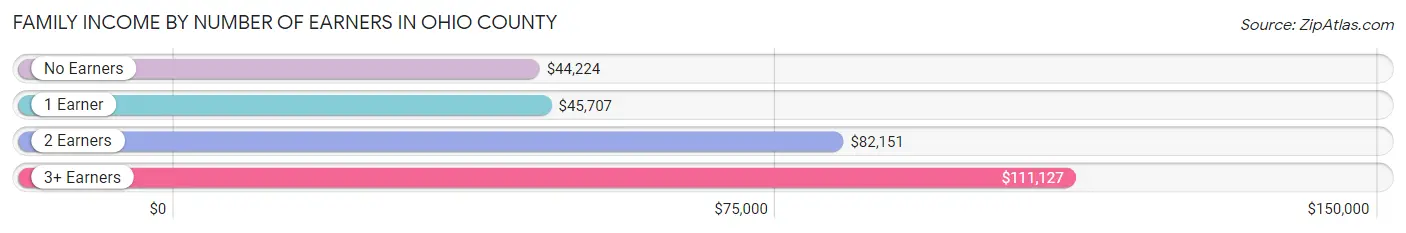
| Number of Earners | # Families | Median Income |
| No Earners | 1,320 (20.9%) | $44,224 |
| 1 Earner | 2,168 (34.3%) | $45,707 |
| 2 Earners | 2,178 (34.4%) | $82,151 |
| 3+ Earners | 660 (10.4%) | $111,127 |
| Total | 6,326 (100.0%) | $58,676 |
Household Income in Ohio County
Household Income Brackets in Ohio County
With 1,917 households falling in the category, the $50,000 to $74,999 income range is the most frequent in Ohio County, accounting for 21.2% of all households. In contrast, only 208 households (2.3%) fall into the $200,000+ income bracket, making it the least populous group.
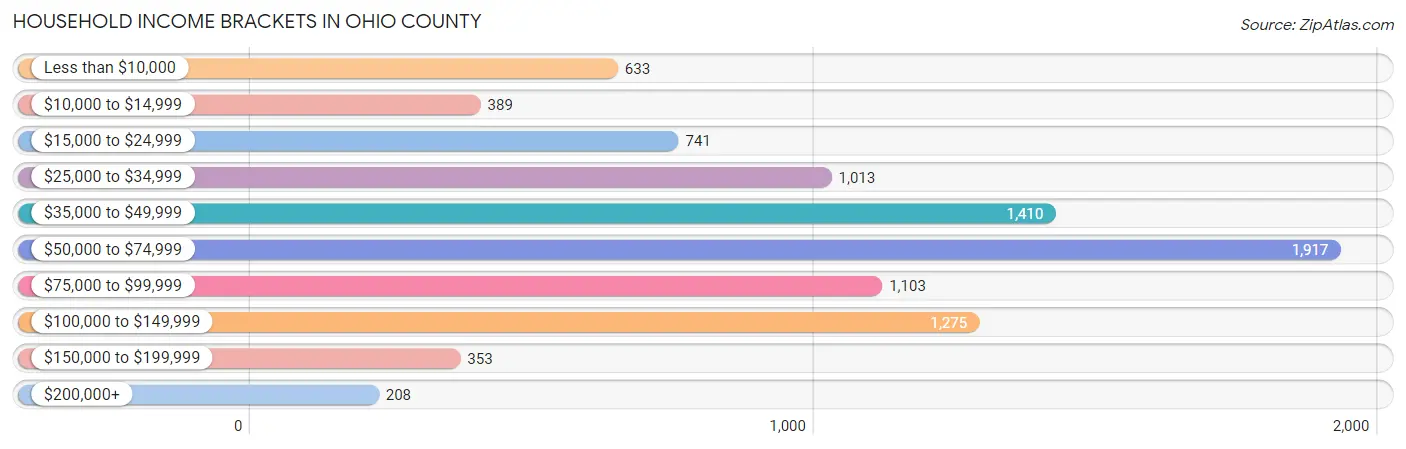
| Income Bracket | # Households | % Households |
| Less than $10,000 | 633 | 7.0% |
| $10,000 to $14,999 | 389 | 4.3% |
| $15,000 to $24,999 | 741 | 8.2% |
| $25,000 to $34,999 | 1,013 | 11.2% |
| $35,000 to $49,999 | 1,410 | 15.6% |
| $50,000 to $74,999 | 1,917 | 21.2% |
| $75,000 to $99,999 | 1,103 | 12.2% |
| $100,000 to $149,999 | 1,275 | 14.1% |
| $150,000 to $199,999 | 353 | 3.9% |
| $200,000+ | 208 | 2.3% |
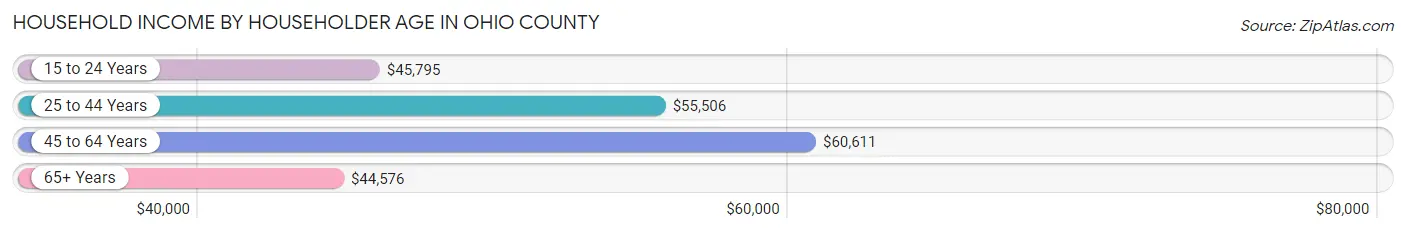
Household Income by Householder Age in Ohio County
The median household income in Ohio County is $52,474, with the highest median household income of $60,611 found in the 45 to 64 years age bracket for the primary householder. A total of 3,263 households (36.1%) fall into this category. Meanwhile, the 65+ years age bracket for the primary householder has the lowest median household income of $44,576, with 2,590 households (28.6%) in this group.
| Income Bracket | # Households | Median Income |
| 15 to 24 Years | 475 (5.2%) | $45,795 |
| 25 to 44 Years | 2,713 (30.0%) | $55,506 |
| 45 to 64 Years | 3,263 (36.1%) | $60,611 |
| 65+ Years | 2,590 (28.6%) | $44,576 |
| Total | 9,041 (100.0%) | $52,474 |
Poverty in Ohio County
Income Below Poverty by Sex and Age in Ohio County
With 13.4% poverty level for males and 14.7% for females among the residents of Ohio County, 5 year old males and 5 year old females are the most vulnerable to poverty, with 30 males (33.3%) and 27 females (32.5%) in their respective age groups living below the poverty level.
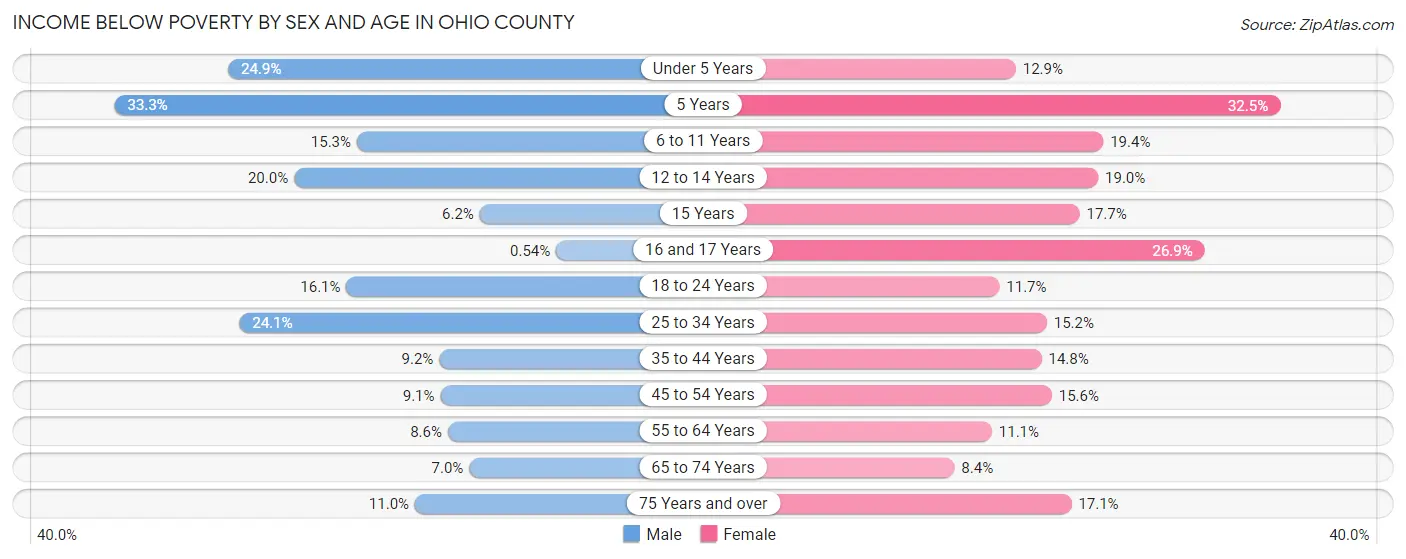
| Age Bracket | Male | Female |
| Under 5 Years | 169 (24.9%) | 77 (12.9%) |
| 5 Years | 30 (33.3%) | 27 (32.5%) |
| 6 to 11 Years | 140 (15.3%) | 196 (19.4%) |
| 12 to 14 Years | 110 (20.0%) | 82 (19.0%) |
| 15 Years | 9 (6.2%) | 12 (17.6%) |
| 16 and 17 Years | 2 (0.5%) | 108 (26.9%) |
| 18 to 24 Years | 154 (16.1%) | 102 (11.7%) |
| 25 to 34 Years | 389 (24.1%) | 200 (15.2%) |
| 35 to 44 Years | 134 (9.2%) | 218 (14.8%) |
| 45 to 54 Years | 134 (9.1%) | 236 (15.6%) |
| 55 to 64 Years | 133 (8.6%) | 175 (11.1%) |
| 65 to 74 Years | 85 (7.0%) | 104 (8.4%) |
| 75 Years and over | 83 (11.0%) | 154 (17.1%) |
| Total | 1,572 (13.4%) | 1,691 (14.7%) |
Income Above Poverty by Sex and Age in Ohio County
According to the poverty statistics in Ohio County, males aged 16 and 17 years and females aged 65 to 74 years are the age groups that are most secure financially, with 99.5% of males and 91.6% of females in these age groups living above the poverty line.
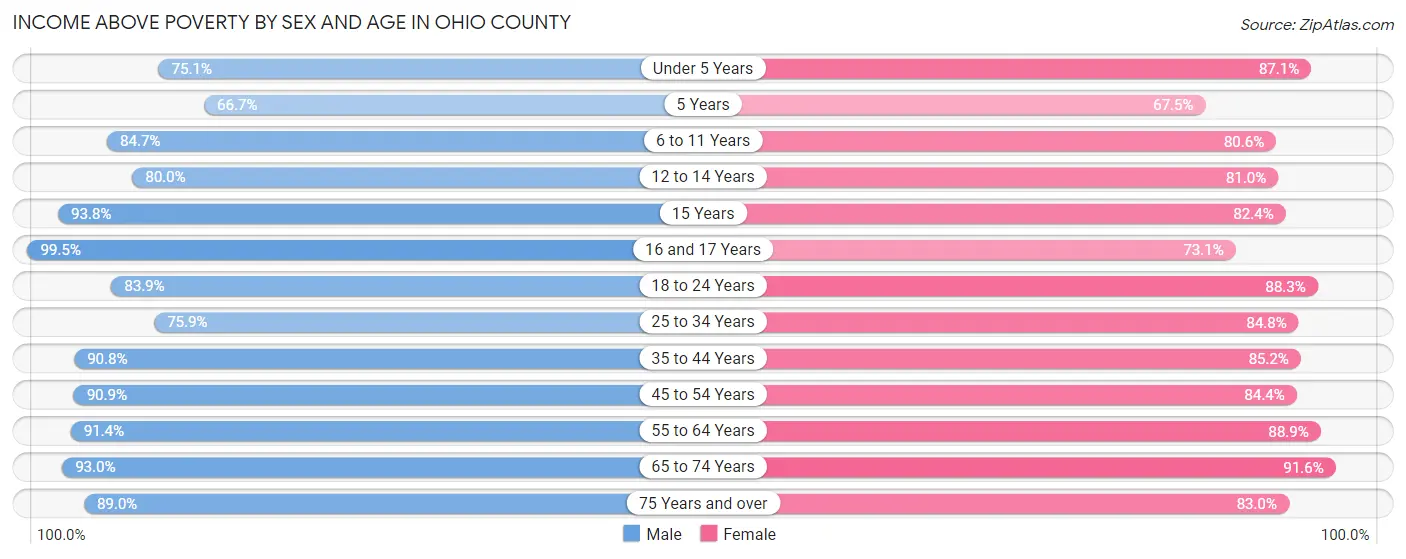
| Age Bracket | Male | Female |
| Under 5 Years | 510 (75.1%) | 519 (87.1%) |
| 5 Years | 60 (66.7%) | 56 (67.5%) |
| 6 to 11 Years | 773 (84.7%) | 814 (80.6%) |
| 12 to 14 Years | 440 (80.0%) | 349 (81.0%) |
| 15 Years | 136 (93.8%) | 56 (82.4%) |
| 16 and 17 Years | 371 (99.5%) | 293 (73.1%) |
| 18 to 24 Years | 802 (83.9%) | 770 (88.3%) |
| 25 to 34 Years | 1,228 (75.9%) | 1,114 (84.8%) |
| 35 to 44 Years | 1,319 (90.8%) | 1,252 (85.2%) |
| 45 to 54 Years | 1,334 (90.9%) | 1,278 (84.4%) |
| 55 to 64 Years | 1,418 (91.4%) | 1,396 (88.9%) |
| 65 to 74 Years | 1,131 (93.0%) | 1,140 (91.6%) |
| 75 Years and over | 670 (89.0%) | 749 (83.0%) |
| Total | 10,192 (86.6%) | 9,786 (85.3%) |
Income Below Poverty Among Married-Couple Families in Ohio County
The poverty statistics for married-couple families in Ohio County show that 5.6% or 265 of the total 4,774 families live below the poverty line. Families with 3 or 4 children have the highest poverty rate of 19.3%, comprising of 66 families. On the other hand, families with 5 or more children have the lowest poverty rate of 0.0%, which includes 0 families.
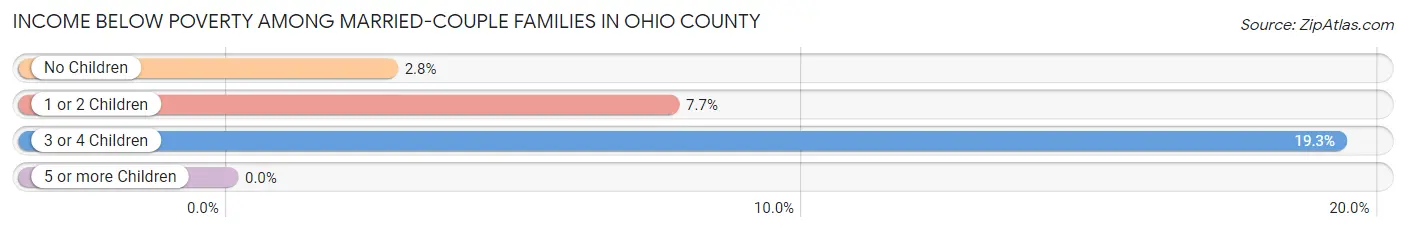
| Children | Above Poverty | Below Poverty |
| No Children | 2,764 (97.2%) | 79 (2.8%) |
| 1 or 2 Children | 1,442 (92.3%) | 120 (7.7%) |
| 3 or 4 Children | 276 (80.7%) | 66 (19.3%) |
| 5 or more Children | 27 (100.0%) | 0 (0.0%) |
| Total | 4,509 (94.5%) | 265 (5.6%) |
Income Below Poverty Among Single-Parent Households in Ohio County
According to the poverty data in Ohio County, 10.1% or 58 single-father households and 27.0% or 264 single-mother households are living below the poverty line. Among single-father households, those with 3 or 4 children have the highest poverty rate, with 35 households (64.8%) experiencing poverty. Likewise, among single-mother households, those with 3 or 4 children have the highest poverty rate, with 46 households (69.7%) falling below the poverty line.
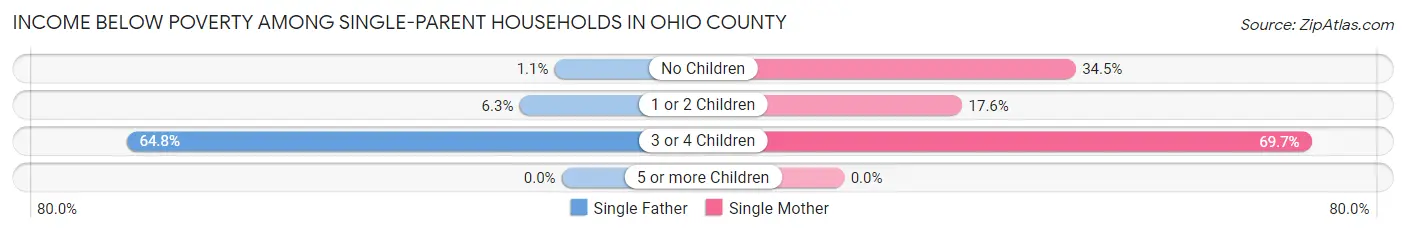
| Children | Single Father | Single Mother |
| No Children | 2 (1.1%) | 118 (34.5%) |
| 1 or 2 Children | 21 (6.3%) | 100 (17.6%) |
| 3 or 4 Children | 35 (64.8%) | 46 (69.7%) |
| 5 or more Children | 0 (0.0%) | 0 (0.0%) |
| Total | 58 (10.1%) | 264 (27.0%) |
Income Below Poverty Among Married-Couple vs Single-Parent Households in Ohio County
The poverty data for Ohio County shows that 265 of the married-couple family households (5.6%) and 322 of the single-parent households (20.7%) are living below the poverty level. Within the married-couple family households, those with 3 or 4 children have the highest poverty rate, with 66 households (19.3%) falling below the poverty line. Among the single-parent households, those with 3 or 4 children have the highest poverty rate, with 81 household (67.5%) living below poverty.
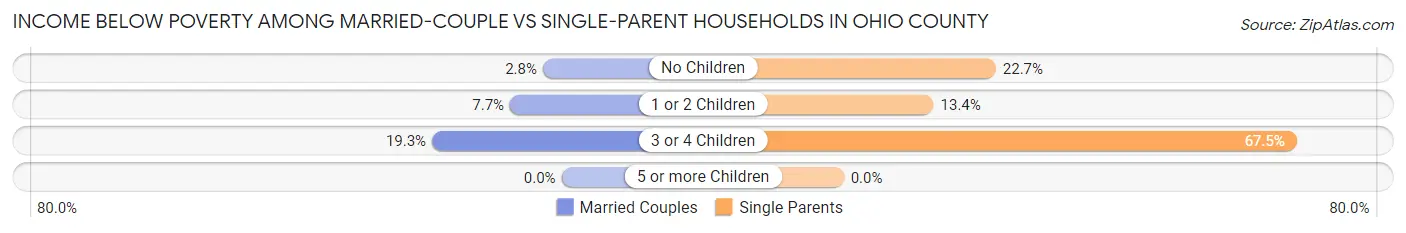
| Children | Married-Couple Families | Single-Parent Households |
| No Children | 79 (2.8%) | 120 (22.7%) |
| 1 or 2 Children | 120 (7.7%) | 121 (13.4%) |
| 3 or 4 Children | 66 (19.3%) | 81 (67.5%) |
| 5 or more Children | 0 (0.0%) | 0 (0.0%) |
| Total | 265 (5.6%) | 322 (20.7%) |
Race in Ohio County
The most populous races in Ohio County are White / Caucasian (22,431 | 94.3%), Hispanic or Latino (822 | 3.5%), and Two or more Races (621 | 2.6%).
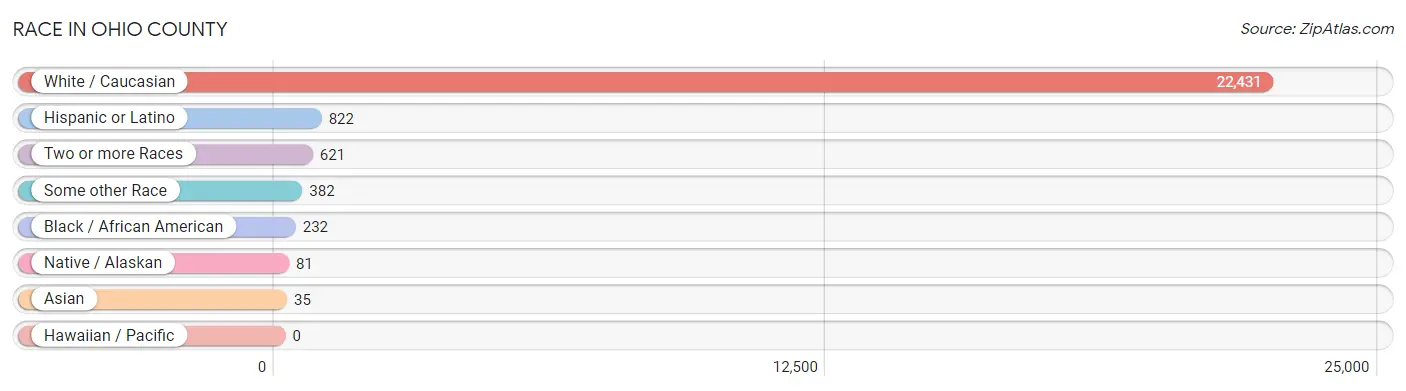
| Race | # Population | % Population |
| Asian | 35 | 0.2% |
| Black / African American | 232 | 1.0% |
| Hawaiian / Pacific | 0 | 0.0% |
| Hispanic or Latino | 822 | 3.5% |
| Native / Alaskan | 81 | 0.3% |
| White / Caucasian | 22,431 | 94.3% |
| Two or more Races | 621 | 2.6% |
| Some other Race | 382 | 1.6% |
| Total | 23,782 | 100.0% |
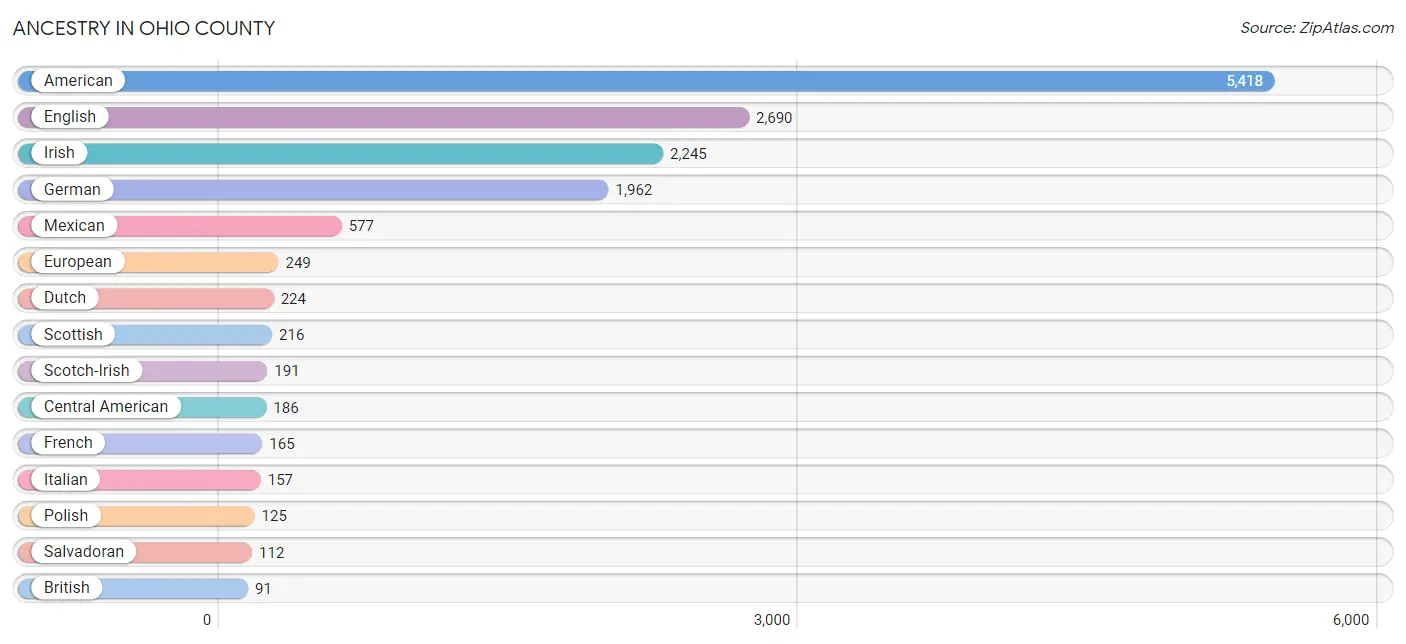
Ancestry in Ohio County
The most populous ancestries reported in Ohio County are American (5,418 | 22.8%), English (2,690 | 11.3%), Irish (2,245 | 9.4%), German (1,962 | 8.3%), and Mexican (577 | 2.4%), together accounting for 54.2% of all Ohio County residents.
| Ancestry | # Population | % Population |
| African | 24 | 0.1% |
| American | 5,418 | 22.8% |
| Arab | 49 | 0.2% |
| Armenian | 8 | 0.0% |
| Bhutanese | 44 | 0.2% |
| Blackfeet | 24 | 0.1% |
| British | 91 | 0.4% |
| Burmese | 8 | 0.0% |
| Canadian | 10 | 0.0% |
| Central American | 186 | 0.8% |
| Cherokee | 58 | 0.2% |
| Chippewa | 12 | 0.1% |
| Dutch | 224 | 0.9% |
| English | 2,690 | 11.3% |
| European | 249 | 1.1% |
| French | 165 | 0.7% |
| French Canadian | 4 | 0.0% |
| German | 1,962 | 8.3% |
| Guamanian / Chamorro | 8 | 0.0% |
| Honduran | 74 | 0.3% |
| Indonesian | 7 | 0.0% |
| Irish | 2,245 | 9.4% |
| Italian | 157 | 0.7% |
| Korean | 12 | 0.1% |
| Mexican | 577 | 2.4% |
| Mexican American Indian | 76 | 0.3% |
| Moroccan | 49 | 0.2% |
| Norwegian | 83 | 0.4% |
| Polish | 125 | 0.5% |
| Portuguese | 3 | 0.0% |
| Puerto Rican | 53 | 0.2% |
| Salvadoran | 112 | 0.5% |
| Scandinavian | 2 | 0.0% |
| Scotch-Irish | 191 | 0.8% |
| Scottish | 216 | 0.9% |
| Sioux | 8 | 0.0% |
| Slovak | 10 | 0.0% |
| Sri Lankan | 12 | 0.1% |
| Subsaharan African | 24 | 0.1% |
| Swedish | 35 | 0.2% |
| Swiss | 16 | 0.1% |
| Thai | 10 | 0.0% |
| Welsh | 30 | 0.1% | View All 43 Rows |
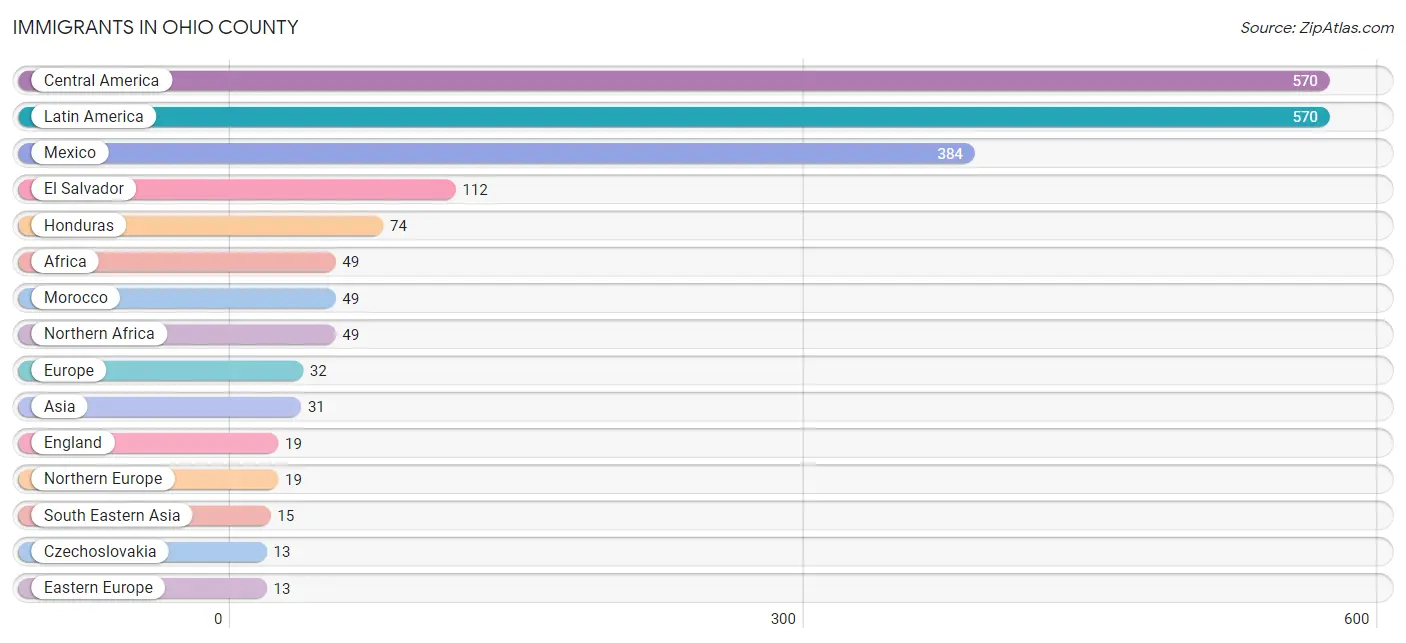
Immigrants in Ohio County
The most numerous immigrant groups reported in Ohio County came from Central America (570 | 2.4%), Latin America (570 | 2.4%), Mexico (384 | 1.6%), El Salvador (112 | 0.5%), and Honduras (74 | 0.3%), together accounting for 7.2% of all Ohio County residents.
| Immigration Origin | # Population | % Population |
| Africa | 49 | 0.2% |
| Asia | 31 | 0.1% |
| Central America | 570 | 2.4% |
| Czechoslovakia | 13 | 0.1% |
| Eastern Asia | 8 | 0.0% |
| Eastern Europe | 13 | 0.1% |
| El Salvador | 112 | 0.5% |
| England | 19 | 0.1% |
| Europe | 32 | 0.1% |
| Honduras | 74 | 0.3% |
| India | 8 | 0.0% |
| Korea | 8 | 0.0% |
| Latin America | 570 | 2.4% |
| Mexico | 384 | 1.6% |
| Morocco | 49 | 0.2% |
| Northern Africa | 49 | 0.2% |
| Northern Europe | 19 | 0.1% |
| South Central Asia | 8 | 0.0% |
| South Eastern Asia | 15 | 0.1% |
| Vietnam | 12 | 0.1% | View All 20 Rows |
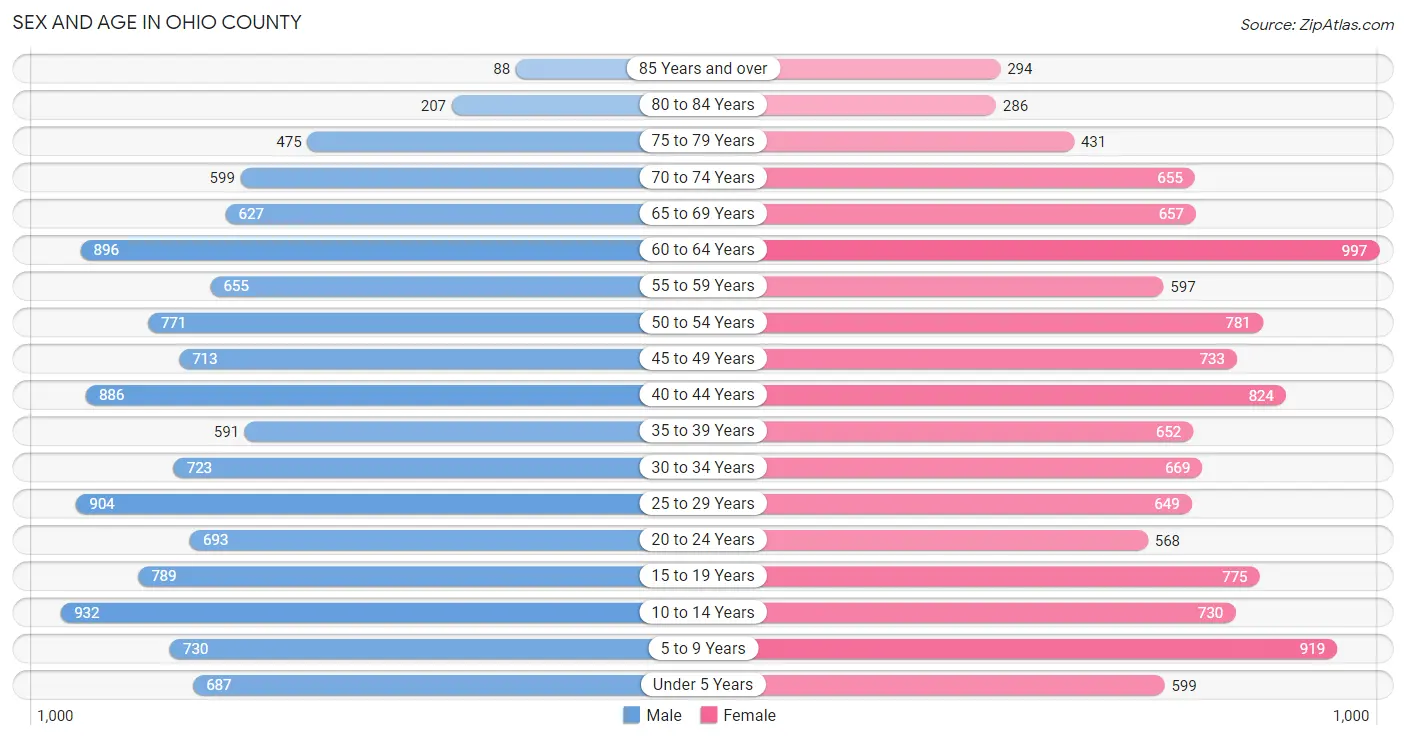
Sex and Age in Ohio County
Sex and Age in Ohio County
The most populous age groups in Ohio County are 10 to 14 Years (932 | 7.8%) for men and 60 to 64 Years (997 | 8.4%) for women.
| Age Bracket | Male | Female |
| Under 5 Years | 687 (5.7%) | 599 (5.1%) |
| 5 to 9 Years | 730 (6.1%) | 919 (7.8%) |
| 10 to 14 Years | 932 (7.8%) | 730 (6.2%) |
| 15 to 19 Years | 789 (6.6%) | 775 (6.6%) |
| 20 to 24 Years | 693 (5.8%) | 568 (4.8%) |
| 25 to 29 Years | 904 (7.5%) | 649 (5.5%) |
| 30 to 34 Years | 723 (6.0%) | 669 (5.7%) |
| 35 to 39 Years | 591 (4.9%) | 652 (5.5%) |
| 40 to 44 Years | 886 (7.4%) | 824 (7.0%) |
| 45 to 49 Years | 713 (6.0%) | 733 (6.2%) |
| 50 to 54 Years | 771 (6.4%) | 781 (6.6%) |
| 55 to 59 Years | 655 (5.5%) | 597 (5.1%) |
| 60 to 64 Years | 896 (7.5%) | 997 (8.4%) |
| 65 to 69 Years | 627 (5.2%) | 657 (5.6%) |
| 70 to 74 Years | 599 (5.0%) | 655 (5.5%) |
| 75 to 79 Years | 475 (4.0%) | 431 (3.6%) |
| 80 to 84 Years | 207 (1.7%) | 286 (2.4%) |
| 85 Years and over | 88 (0.7%) | 294 (2.5%) |
| Total | 11,966 (100.0%) | 11,816 (100.0%) |
Families and Households in Ohio County
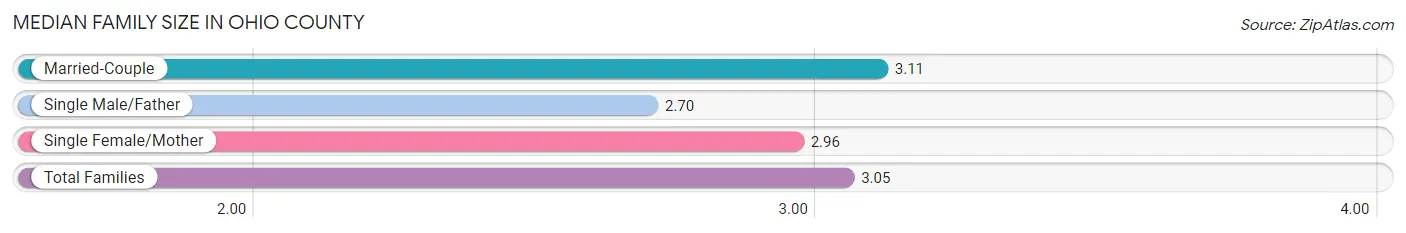
Median Family Size in Ohio County
The median family size in Ohio County is 3.05 persons per family, with married-couple families (4,774 | 75.5%) accounting for the largest median family size of 3.11 persons per family. On the other hand, single male/father families (575 | 9.1%) represent the smallest median family size with 2.70 persons per family.
| Family Type | # Families | Family Size |
| Married-Couple | 4,774 (75.5%) | 3.11 |
| Single Male/Father | 575 (9.1%) | 2.70 |
| Single Female/Mother | 977 (15.4%) | 2.96 |
| Total Families | 6,326 (100.0%) | 3.05 |
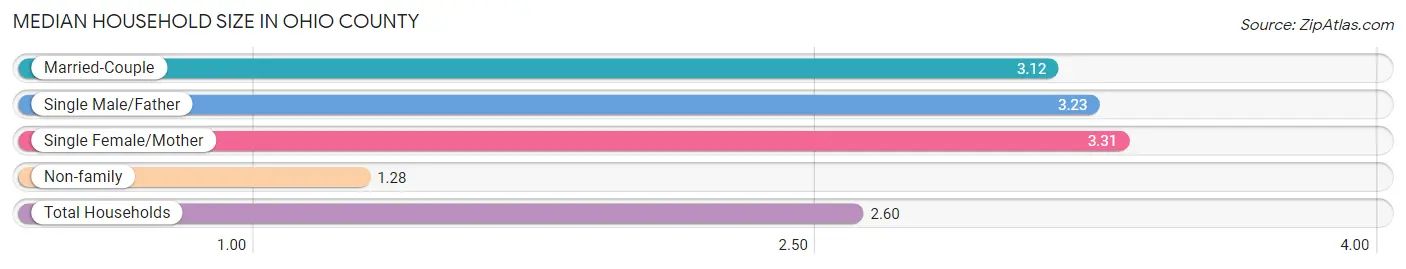
Median Household Size in Ohio County
The median household size in Ohio County is 2.60 persons per household, with single female/mother households (977 | 10.8%) accounting for the largest median household size of 3.31 persons per household. non-family households (2,715 | 30.0%) represent the smallest median household size with 1.28 persons per household.
| Household Type | # Households | Household Size |
| Married-Couple | 4,774 (52.8%) | 3.12 |
| Single Male/Father | 575 (6.4%) | 3.23 |
| Single Female/Mother | 977 (10.8%) | 3.31 |
| Non-family | 2,715 (30.0%) | 1.28 |
| Total Households | 9,041 (100.0%) | 2.60 |
Household Size by Marriage Status in Ohio County
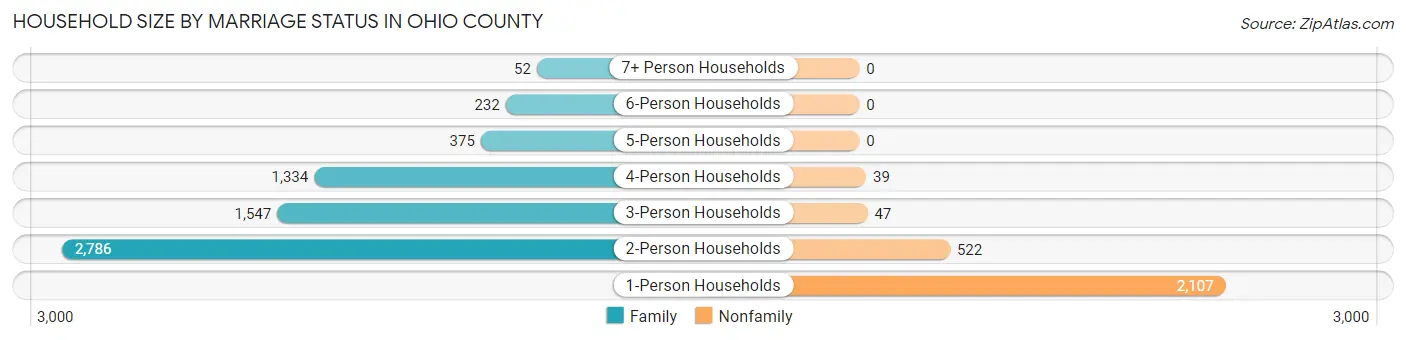
Out of a total of 9,041 households in Ohio County, 6,326 (70.0%) are family households, while 2,715 (30.0%) are nonfamily households. The most numerous type of family households are 2-person households, comprising 2,786, and the most common type of nonfamily households are 1-person households, comprising 2,107.
| Household Size | Family Households | Nonfamily Households |
| 1-Person Households | - | 2,107 (23.3%) |
| 2-Person Households | 2,786 (30.8%) | 522 (5.8%) |
| 3-Person Households | 1,547 (17.1%) | 47 (0.5%) |
| 4-Person Households | 1,334 (14.8%) | 39 (0.4%) |
| 5-Person Households | 375 (4.2%) | 0 (0.0%) |
| 6-Person Households | 232 (2.6%) | 0 (0.0%) |
| 7+ Person Households | 52 (0.6%) | 0 (0.0%) |
| Total | 6,326 (70.0%) | 2,715 (30.0%) |
Female Fertility in Ohio County
Fertility by Age in Ohio County
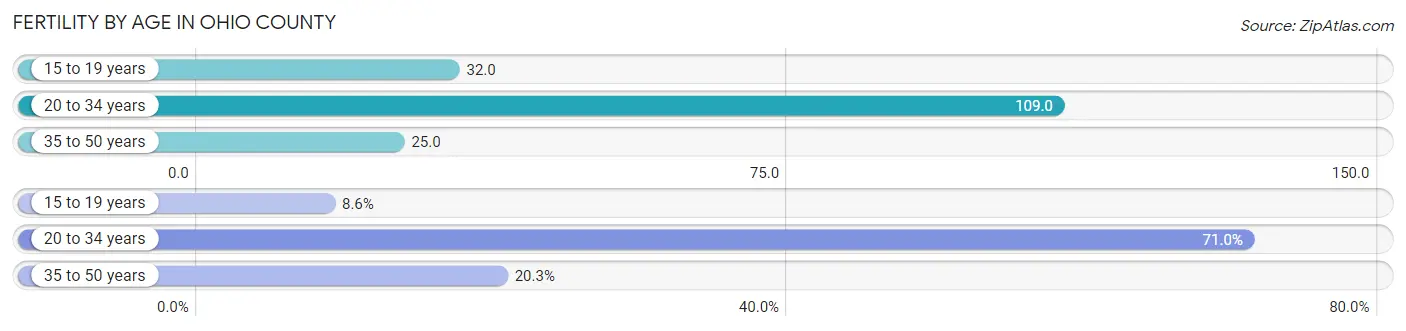
Average fertility rate in Ohio County is 58.0 births per 1,000 women. Women in the age bracket of 20 to 34 years have the highest fertility rate with 109.0 births per 1,000 women. Women in the age bracket of 20 to 34 years acount for 71.0% of all women with births.
| Age Bracket | Women with Births | Births / 1,000 Women |
| 15 to 19 years | 25 (8.6%) | 32.0 |
| 20 to 34 years | 206 (71.0%) | 109.0 |
| 35 to 50 years | 59 (20.3%) | 25.0 |
| Total | 290 (100.0%) | 58.0 |
Fertility by Age by Marriage Status in Ohio County
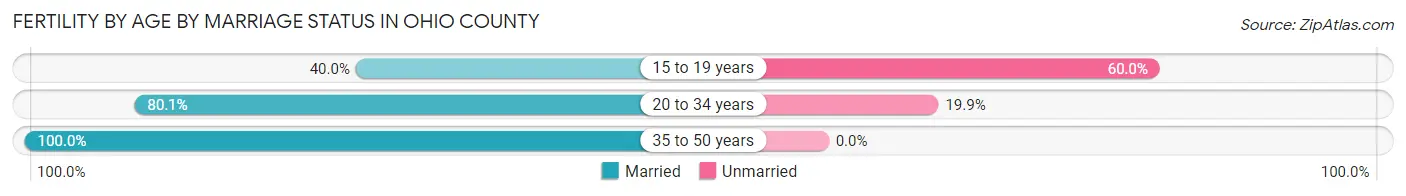
80.7% of women with births (290) in Ohio County are married. The highest percentage of unmarried women with births falls into 15 to 19 years age bracket with 60.0% of them unmarried at the time of birth, while the lowest percentage of unmarried women with births belong to 35 to 50 years age bracket with 0.0% of them unmarried.
| Age Bracket | Married | Unmarried |
| 15 to 19 years | 10 (40.0%) | 15 (60.0%) |
| 20 to 34 years | 165 (80.1%) | 41 (19.9%) |
| 35 to 50 years | 59 (100.0%) | 0 (0.0%) |
| Total | 234 (80.7%) | 56 (19.3%) |
Fertility by Education in Ohio County
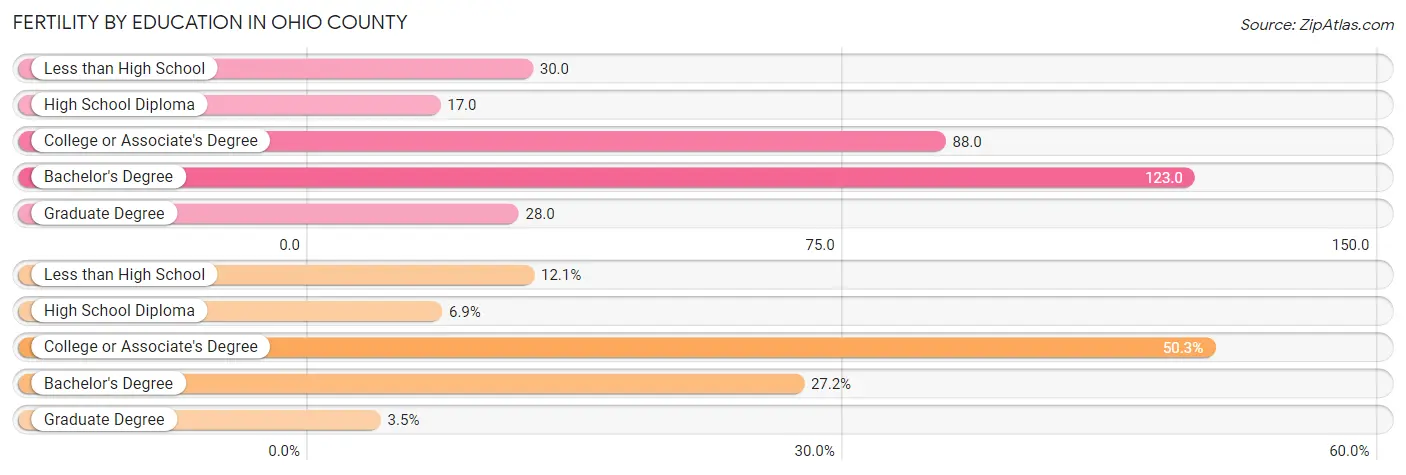
Average fertility rate in Ohio County is 58.0 births per 1,000 women. Women with the education attainment of bachelor's degree have the highest fertility rate of 123.0 births per 1,000 women, while women with the education attainment of high school diploma have the lowest fertility at 17.0 births per 1,000 women. Women with the education attainment of college or associate's degree represent 50.3% of all women with births.
| Educational Attainment | Women with Births | Births / 1,000 Women |
| Less than High School | 35 (12.1%) | 30.0 |
| High School Diploma | 20 (6.9%) | 17.0 |
| College or Associate's Degree | 146 (50.3%) | 88.0 |
| Bachelor's Degree | 79 (27.2%) | 123.0 |
| Graduate Degree | 10 (3.5%) | 28.0 |
| Total | 290 (100.0%) | 58.0 |
Fertility by Education by Marriage Status in Ohio County
19.3% of women with births in Ohio County are unmarried. Women with the educational attainment of graduate degree are most likely to be married with 100.0% of them married at childbirth, while women with the educational attainment of high school diploma are least likely to be married with 75.0% of them unmarried at childbirth.
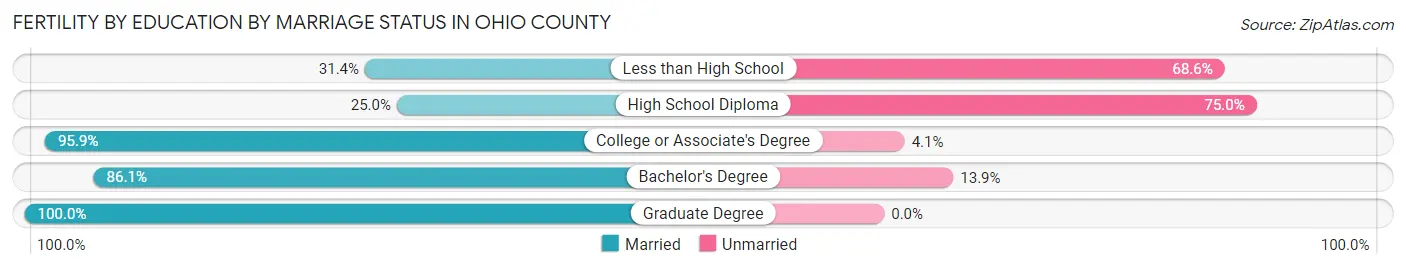
| Educational Attainment | Married | Unmarried |
| Less than High School | 11 (31.4%) | 24 (68.6%) |
| High School Diploma | 5 (25.0%) | 15 (75.0%) |
| College or Associate's Degree | 140 (95.9%) | 6 (4.1%) |
| Bachelor's Degree | 68 (86.1%) | 11 (13.9%) |
| Graduate Degree | 10 (100.0%) | 0 (0.0%) |
| Total | 234 (80.7%) | 56 (19.3%) |
Employment Characteristics in Ohio County
Employment by Class of Employer in Ohio County
Among the 9,620 employed individuals in Ohio County, private company employees (6,592 | 68.5%), not-for-profit organizations (817 | 8.5%), and local government employees (799 | 8.3%) make up the most common classes of employment.
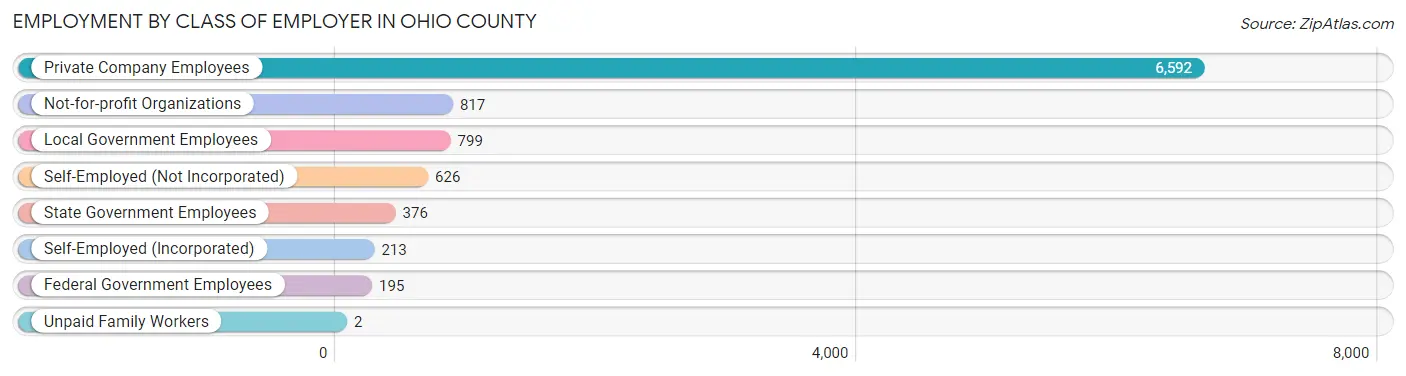
| Employer Class | # Employees | % Employees |
| Private Company Employees | 6,592 | 68.5% |
| Self-Employed (Incorporated) | 213 | 2.2% |
| Self-Employed (Not Incorporated) | 626 | 6.5% |
| Not-for-profit Organizations | 817 | 8.5% |
| Local Government Employees | 799 | 8.3% |
| State Government Employees | 376 | 3.9% |
| Federal Government Employees | 195 | 2.0% |
| Unpaid Family Workers | 2 | 0.0% |
| Total | 9,620 | 100.0% |
Employment Status by Age in Ohio County
According to the labor force statistics for Ohio County, out of the total population over 16 years of age (18,972), 55.3% or 10,492 individuals are in the labor force, with 4.5% or 472 of them unemployed. The age group with the highest labor force participation rate is 30 to 34 years, with 81.3% or 1,132 individuals in the labor force. Within the labor force, the 16 to 19 years age range has the highest percentage of unemployed individuals, with 16.0% or 114 of them being unemployed.
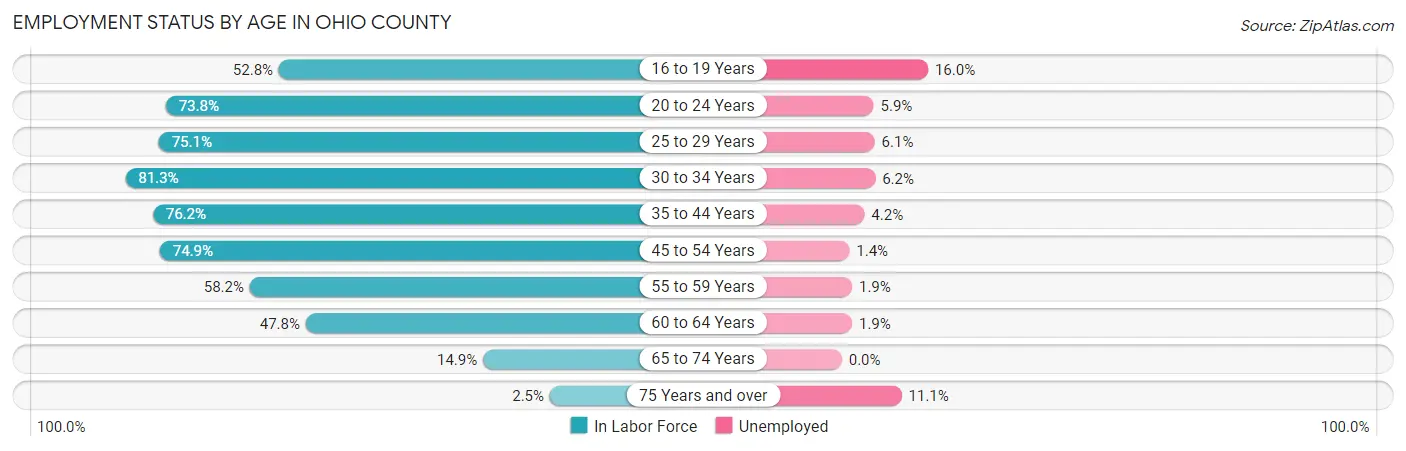
| Age Bracket | In Labor Force | Unemployed |
| 16 to 19 Years | 713 (52.8%) | 114 (16.0%) |
| 20 to 24 Years | 931 (73.8%) | 55 (5.9%) |
| 25 to 29 Years | 1,166 (75.1%) | 71 (6.1%) |
| 30 to 34 Years | 1,132 (81.3%) | 70 (6.2%) |
| 35 to 44 Years | 2,250 (76.2%) | 94 (4.2%) |
| 45 to 54 Years | 2,246 (74.9%) | 31 (1.4%) |
| 55 to 59 Years | 729 (58.2%) | 14 (1.9%) |
| 60 to 64 Years | 905 (47.8%) | 17 (1.9%) |
| 65 to 74 Years | 378 (14.9%) | 0 (0.0%) |
| 75 Years and over | 45 (2.5%) | 5 (11.1%) |
| Total | 10,492 (55.3%) | 472 (4.5%) |
Employment Status by Educational Attainment in Ohio County
According to labor force statistics for Ohio County, 70.0% of individuals (8,429) out of the total population between 25 and 64 years of age (12,041) are in the labor force, with 3.5% or 295 of them being unemployed. The group with the highest labor force participation rate are those with the educational attainment of bachelor's degree or higher, with 93.1% or 1,566 individuals in the labor force. Within the labor force, individuals with high school diploma education have the highest percentage of unemployment, with 5.2% or 162 of them being unemployed.
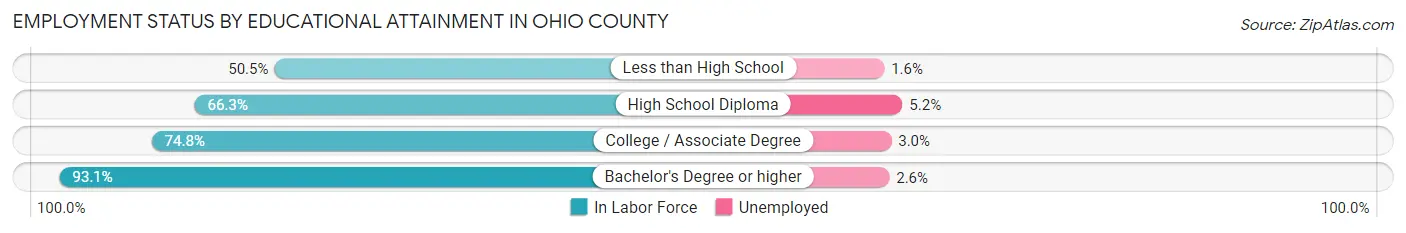
| Educational Attainment | In Labor Force | Unemployed |
| Less than High School | 1,016 (50.5%) | 32 (1.6%) |
| High School Diploma | 3,107 (66.3%) | 244 (5.2%) |
| College / Associate Degree | 2,738 (74.8%) | 110 (3.0%) |
| Bachelor's Degree or higher | 1,566 (93.1%) | 44 (2.6%) |
| Total | 8,429 (70.0%) | 421 (3.5%) |
Employment Occupations by Sex in Ohio County
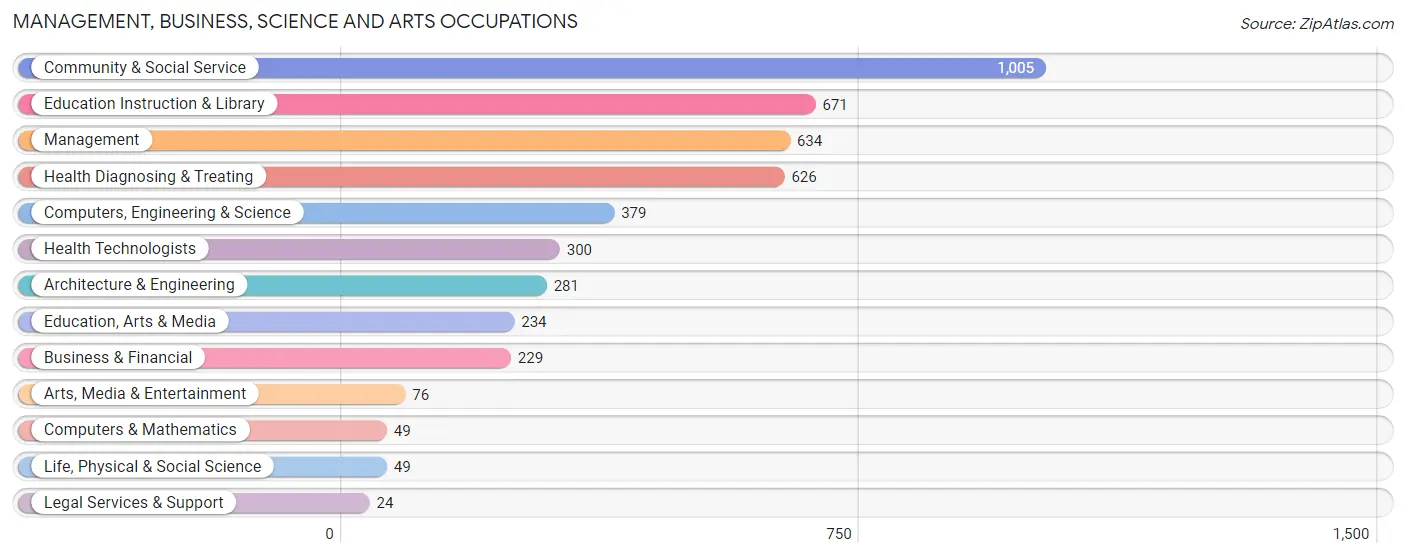
Management, Business, Science and Arts Occupations
The most common Management, Business, Science and Arts occupations in Ohio County are Community & Social Service (1,005 | 10.1%), Education Instruction & Library (671 | 6.7%), Management (634 | 6.3%), Health Diagnosing & Treating (626 | 6.3%), and Computers, Engineering & Science (379 | 3.8%).
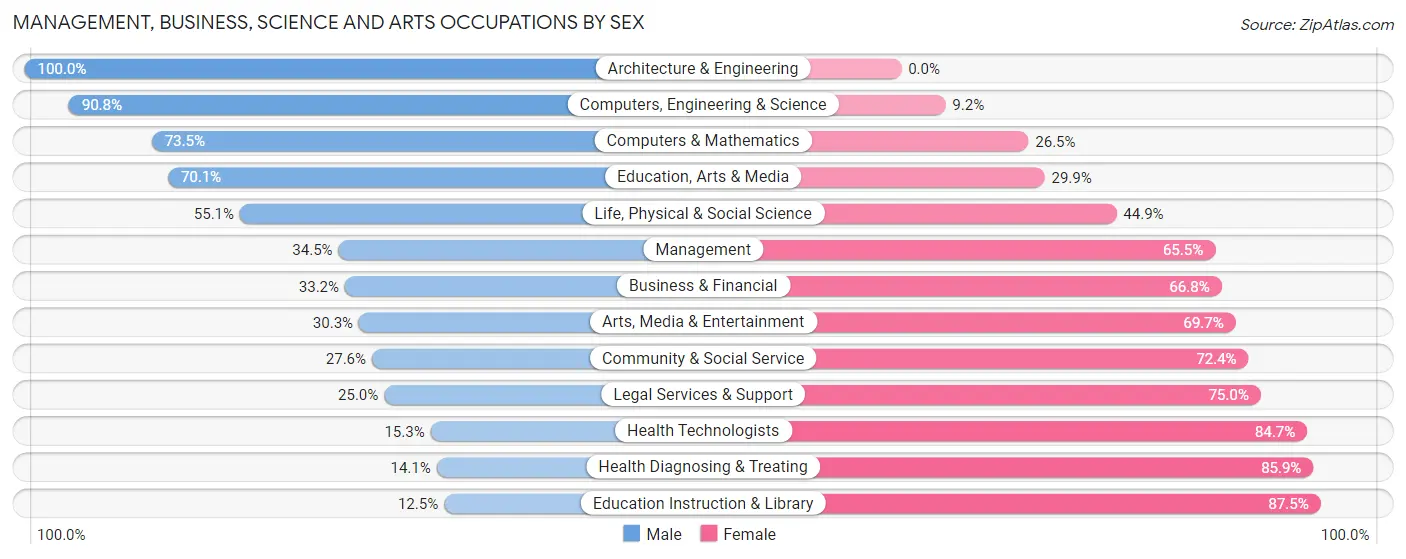
Management, Business, Science and Arts Occupations by Sex
Within the Management, Business, Science and Arts occupations in Ohio County, the most male-oriented occupations are Architecture & Engineering (100.0%), Computers, Engineering & Science (90.8%), and Computers & Mathematics (73.5%), while the most female-oriented occupations are Education Instruction & Library (87.5%), Health Diagnosing & Treating (85.9%), and Health Technologists (84.7%).
| Occupation | Male | Female |
| Management | 219 (34.5%) | 415 (65.5%) |
| Business & Financial | 76 (33.2%) | 153 (66.8%) |
| Computers, Engineering & Science | 344 (90.8%) | 35 (9.2%) |
| Computers & Mathematics | 36 (73.5%) | 13 (26.5%) |
| Architecture & Engineering | 281 (100.0%) | 0 (0.0%) |
| Life, Physical & Social Science | 27 (55.1%) | 22 (44.9%) |
| Community & Social Service | 277 (27.6%) | 728 (72.4%) |
| Education, Arts & Media | 164 (70.1%) | 70 (29.9%) |
| Legal Services & Support | 6 (25.0%) | 18 (75.0%) |
| Education Instruction & Library | 84 (12.5%) | 587 (87.5%) |
| Arts, Media & Entertainment | 23 (30.3%) | 53 (69.7%) |
| Health Diagnosing & Treating | 88 (14.1%) | 538 (85.9%) |
| Health Technologists | 46 (15.3%) | 254 (84.7%) |
| Total (Category) | 1,004 (34.9%) | 1,869 (65.0%) |
| Total (Overall) | 5,312 (53.1%) | 4,688 (46.9%) |
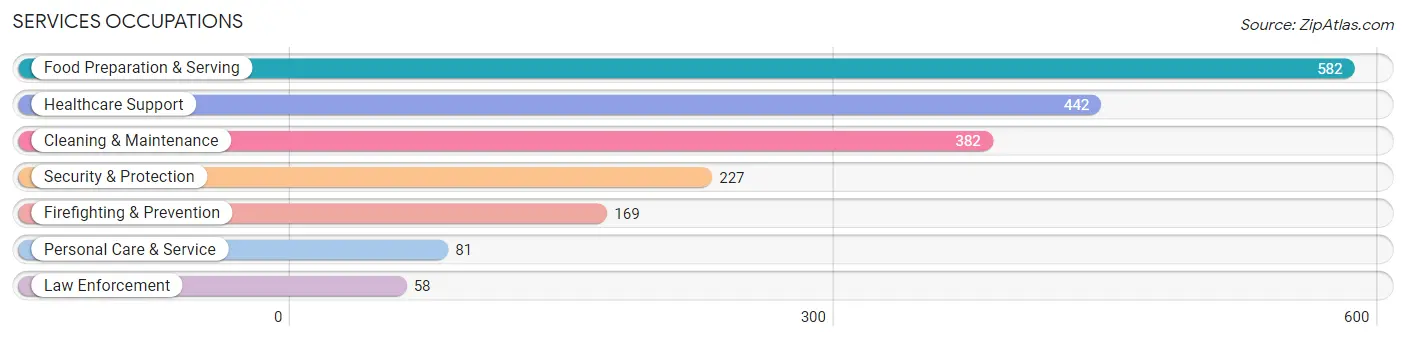
Services Occupations
The most common Services occupations in Ohio County are Food Preparation & Serving (582 | 5.8%), Healthcare Support (442 | 4.4%), Cleaning & Maintenance (382 | 3.8%), Security & Protection (227 | 2.3%), and Firefighting & Prevention (169 | 1.7%).
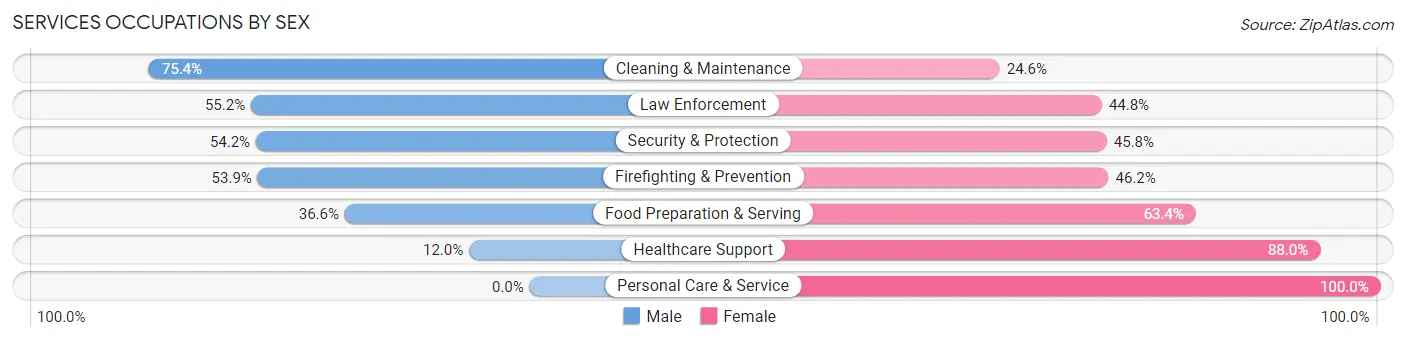
Services Occupations by Sex
Within the Services occupations in Ohio County, the most male-oriented occupations are Cleaning & Maintenance (75.4%), Law Enforcement (55.2%), and Security & Protection (54.2%), while the most female-oriented occupations are Personal Care & Service (100.0%), Healthcare Support (88.0%), and Food Preparation & Serving (63.4%).
| Occupation | Male | Female |
| Healthcare Support | 53 (12.0%) | 389 (88.0%) |
| Security & Protection | 123 (54.2%) | 104 (45.8%) |
| Firefighting & Prevention | 91 (53.8%) | 78 (46.2%) |
| Law Enforcement | 32 (55.2%) | 26 (44.8%) |
| Food Preparation & Serving | 213 (36.6%) | 369 (63.4%) |
| Cleaning & Maintenance | 288 (75.4%) | 94 (24.6%) |
| Personal Care & Service | 0 (0.0%) | 81 (100.0%) |
| Total (Category) | 677 (39.5%) | 1,037 (60.5%) |
| Total (Overall) | 5,312 (53.1%) | 4,688 (46.9%) |
Sales and Office Occupations
The most common Sales and Office occupations in Ohio County are Office & Administration (969 | 9.7%), and Sales & Related (709 | 7.1%).

Sales and Office Occupations by Sex

| Occupation | Male | Female |
| Sales & Related | 348 (49.1%) | 361 (50.9%) |
| Office & Administration | 163 (16.8%) | 806 (83.2%) |
| Total (Category) | 511 (30.4%) | 1,167 (69.6%) |
| Total (Overall) | 5,312 (53.1%) | 4,688 (46.9%) |
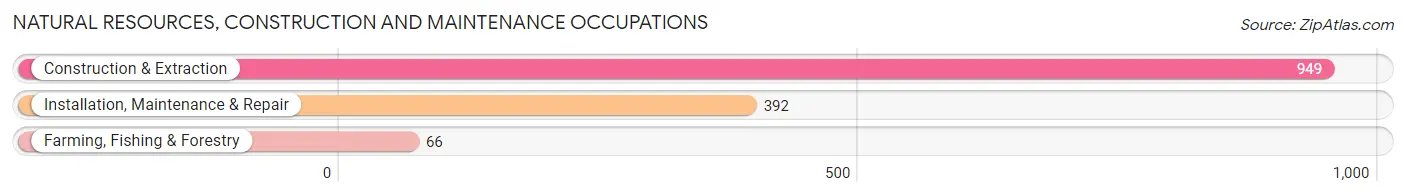
Natural Resources, Construction and Maintenance Occupations
The most common Natural Resources, Construction and Maintenance occupations in Ohio County are Construction & Extraction (949 | 9.5%), Installation, Maintenance & Repair (392 | 3.9%), and Farming, Fishing & Forestry (66 | 0.7%).
Natural Resources, Construction and Maintenance Occupations by Sex
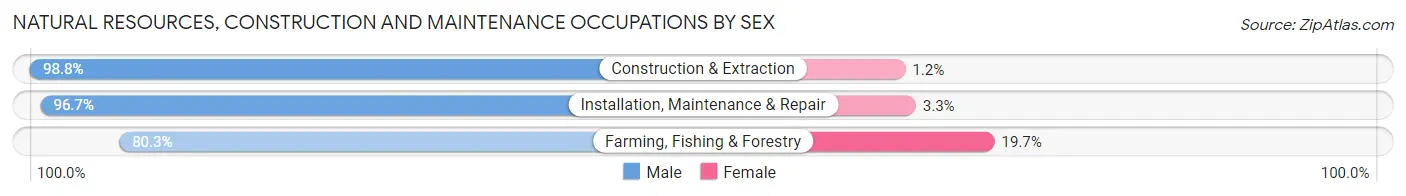
| Occupation | Male | Female |
| Farming, Fishing & Forestry | 53 (80.3%) | 13 (19.7%) |
| Construction & Extraction | 938 (98.8%) | 11 (1.2%) |
| Installation, Maintenance & Repair | 379 (96.7%) | 13 (3.3%) |
| Total (Category) | 1,370 (97.4%) | 37 (2.6%) |
| Total (Overall) | 5,312 (53.1%) | 4,688 (46.9%) |
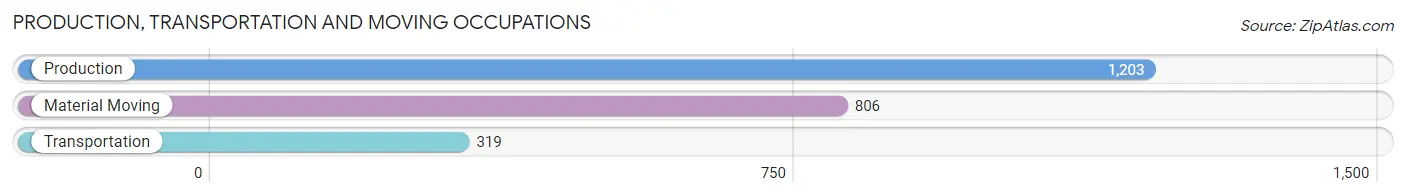
Production, Transportation and Moving Occupations
The most common Production, Transportation and Moving occupations in Ohio County are Production (1,203 | 12.0%), Material Moving (806 | 8.1%), and Transportation (319 | 3.2%).
Production, Transportation and Moving Occupations by Sex
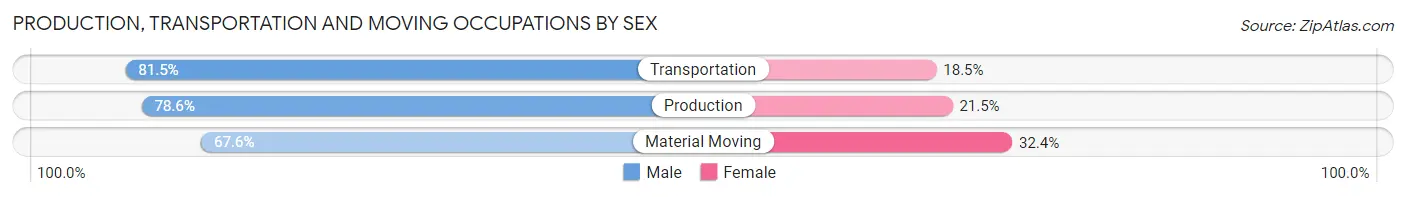
| Occupation | Male | Female |
| Production | 945 (78.5%) | 258 (21.4%) |
| Transportation | 260 (81.5%) | 59 (18.5%) |
| Material Moving | 545 (67.6%) | 261 (32.4%) |
| Total (Category) | 1,750 (75.2%) | 578 (24.8%) |
| Total (Overall) | 5,312 (53.1%) | 4,688 (46.9%) |
Employment Industries by Sex in Ohio County
Employment Industries in Ohio County
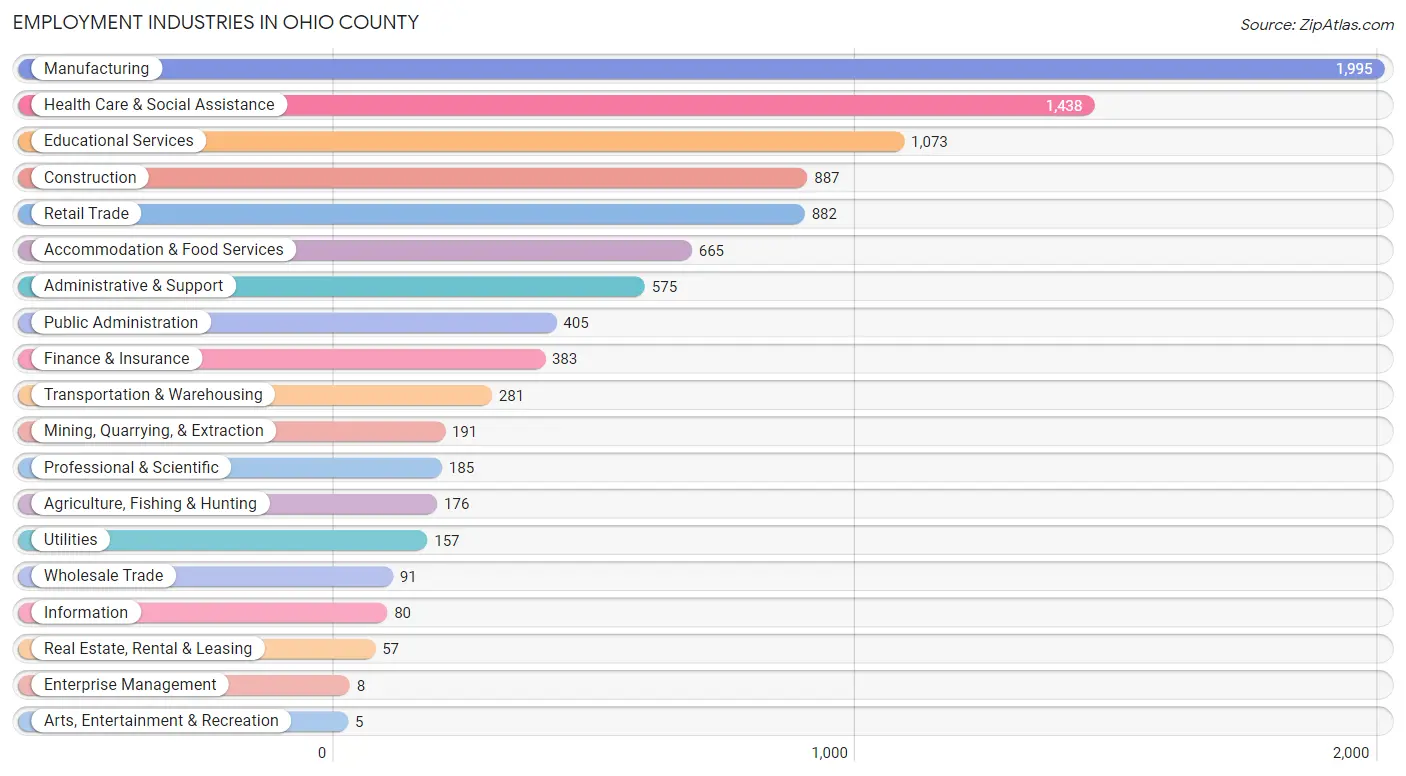
The major employment industries in Ohio County include Manufacturing (1,995 | 20.0%), Health Care & Social Assistance (1,438 | 14.4%), Educational Services (1,073 | 10.7%), Construction (887 | 8.9%), and Retail Trade (882 | 8.8%).
Employment Industries by Sex in Ohio County
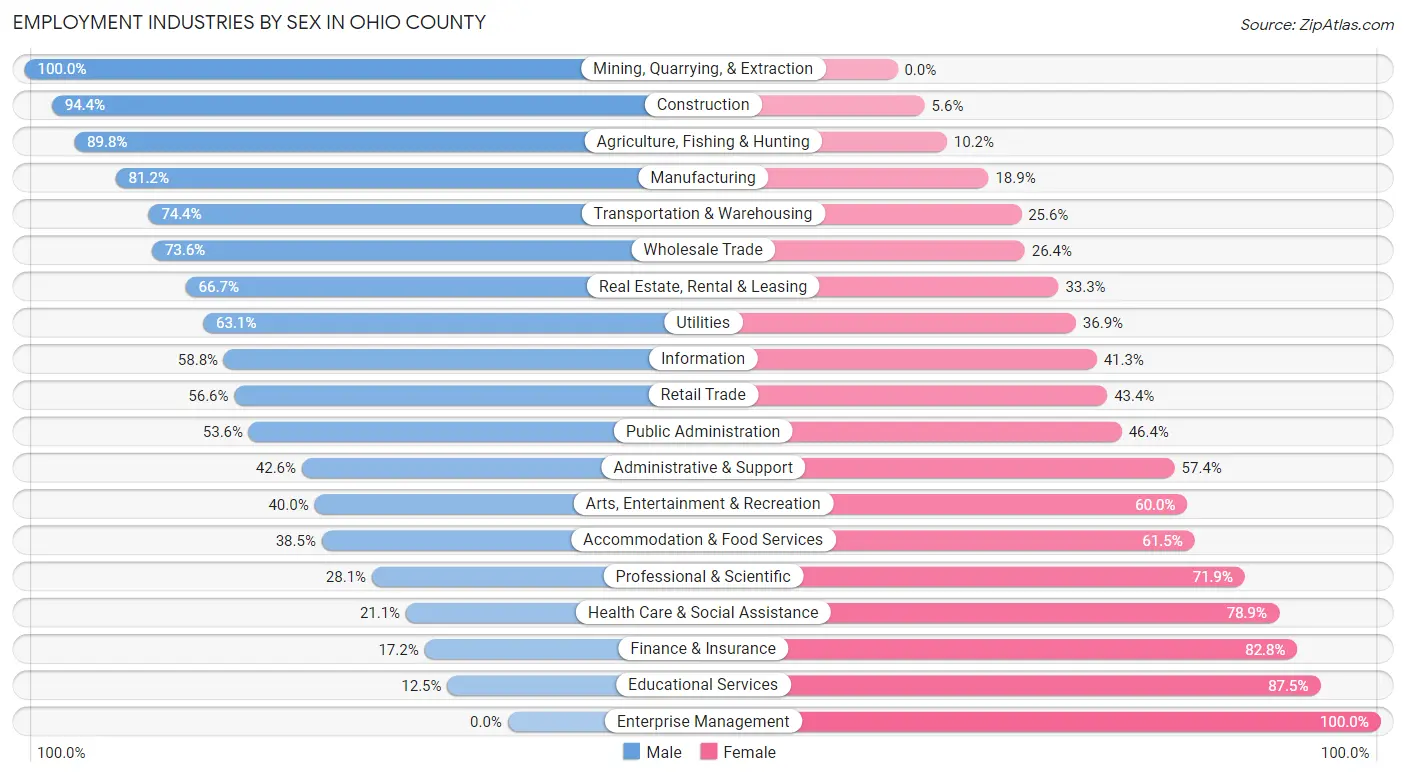
The Ohio County industries that see more men than women are Mining, Quarrying, & Extraction (100.0%), Construction (94.4%), and Agriculture, Fishing & Hunting (89.8%), whereas the industries that tend to have a higher number of women are Enterprise Management (100.0%), Educational Services (87.5%), and Finance & Insurance (82.8%).
| Industry | Male | Female |
| Agriculture, Fishing & Hunting | 158 (89.8%) | 18 (10.2%) |
| Mining, Quarrying, & Extraction | 191 (100.0%) | 0 (0.0%) |
| Construction | 837 (94.4%) | 50 (5.6%) |
| Manufacturing | 1,619 (81.1%) | 376 (18.9%) |
| Wholesale Trade | 67 (73.6%) | 24 (26.4%) |
| Retail Trade | 499 (56.6%) | 383 (43.4%) |
| Transportation & Warehousing | 209 (74.4%) | 72 (25.6%) |
| Utilities | 99 (63.1%) | 58 (36.9%) |
| Information | 47 (58.8%) | 33 (41.2%) |
| Finance & Insurance | 66 (17.2%) | 317 (82.8%) |
| Real Estate, Rental & Leasing | 38 (66.7%) | 19 (33.3%) |
| Professional & Scientific | 52 (28.1%) | 133 (71.9%) |
| Enterprise Management | 0 (0.0%) | 8 (100.0%) |
| Administrative & Support | 245 (42.6%) | 330 (57.4%) |
| Educational Services | 134 (12.5%) | 939 (87.5%) |
| Health Care & Social Assistance | 303 (21.1%) | 1,135 (78.9%) |
| Arts, Entertainment & Recreation | 2 (40.0%) | 3 (60.0%) |
| Accommodation & Food Services | 256 (38.5%) | 409 (61.5%) |
| Public Administration | 217 (53.6%) | 188 (46.4%) |
| Total | 5,312 (53.1%) | 4,688 (46.9%) |
Education in Ohio County
School Enrollment in Ohio County
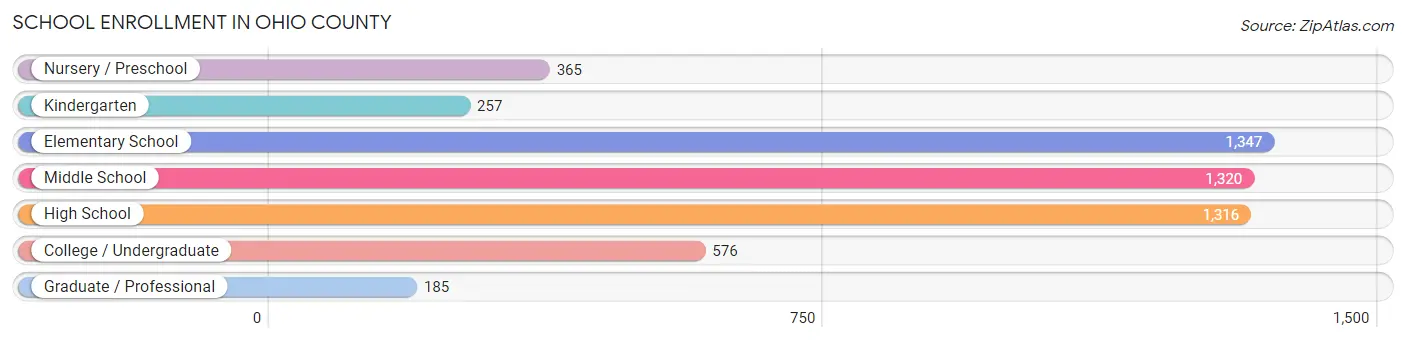
The most common levels of schooling among the 5,366 students in Ohio County are elementary school (1,347 | 25.1%), middle school (1,320 | 24.6%), and high school (1,316 | 24.5%).
| School Level | # Students | % Students |
| Nursery / Preschool | 365 | 6.8% |
| Kindergarten | 257 | 4.8% |
| Elementary School | 1,347 | 25.1% |
| Middle School | 1,320 | 24.6% |
| High School | 1,316 | 24.5% |
| College / Undergraduate | 576 | 10.7% |
| Graduate / Professional | 185 | 3.5% |
| Total | 5,366 | 100.0% |
School Enrollment by Age by Funding Source in Ohio County
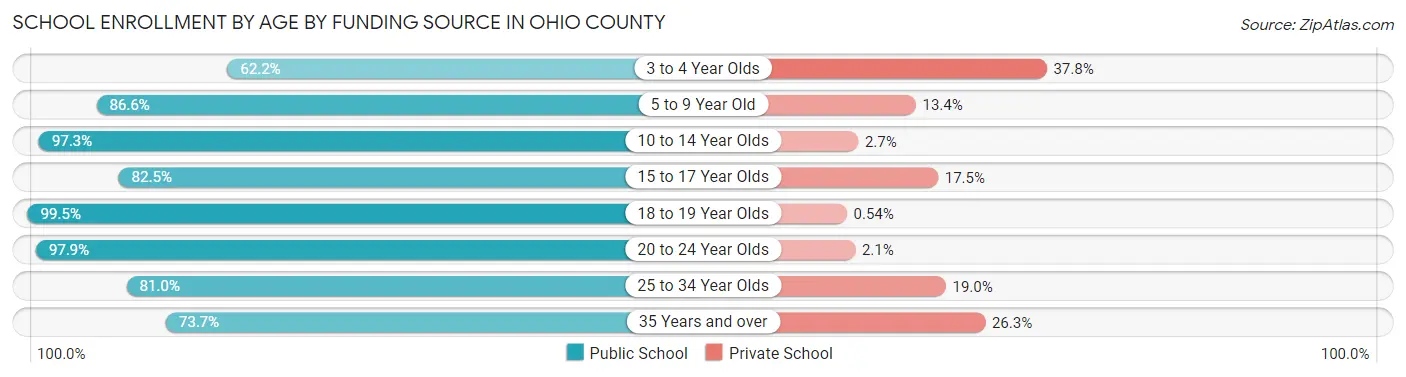
Out of a total of 5,366 students who are enrolled in schools in Ohio County, 601 (11.2%) attend a private institution, while the remaining 4,765 (88.8%) are enrolled in public schools. The age group of 3 to 4 year olds has the highest likelihood of being enrolled in private schools, with 102 (37.8% in the age bracket) enrolled. Conversely, the age group of 18 to 19 year olds has the lowest likelihood of being enrolled in a private school, with 369 (99.5% in the age bracket) attending a public institution.
| Age Bracket | Public School | Private School |
| 3 to 4 Year Olds | 168 (62.2%) | 102 (37.8%) |
| 5 to 9 Year Old | 1,352 (86.6%) | 209 (13.4%) |
| 10 to 14 Year Olds | 1,609 (97.3%) | 44 (2.7%) |
| 15 to 17 Year Olds | 762 (82.5%) | 162 (17.5%) |
| 18 to 19 Year Olds | 369 (99.5%) | 2 (0.5%) |
| 20 to 24 Year Olds | 233 (97.9%) | 5 (2.1%) |
| 25 to 34 Year Olds | 175 (81.0%) | 41 (19.0%) |
| 35 Years and over | 98 (73.7%) | 35 (26.3%) |
| Total | 4,765 (88.8%) | 601 (11.2%) |
Educational Attainment by Field of Study in Ohio County
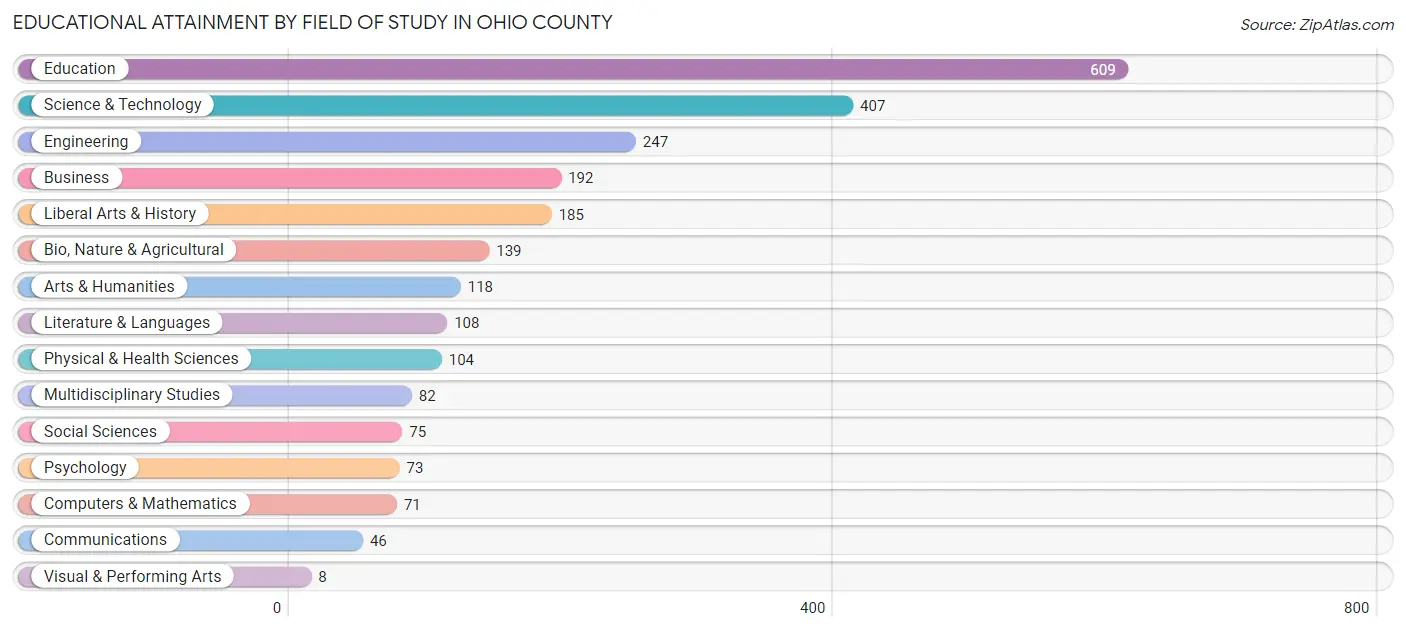
Education (609 | 24.7%), science & technology (407 | 16.5%), engineering (247 | 10.0%), business (192 | 7.8%), and liberal arts & history (185 | 7.5%) are the most common fields of study among 2,464 individuals in Ohio County who have obtained a bachelor's degree or higher.
| Field of Study | # Graduates | % Graduates |
| Computers & Mathematics | 71 | 2.9% |
| Bio, Nature & Agricultural | 139 | 5.6% |
| Physical & Health Sciences | 104 | 4.2% |
| Psychology | 73 | 3.0% |
| Social Sciences | 75 | 3.0% |
| Engineering | 247 | 10.0% |
| Multidisciplinary Studies | 82 | 3.3% |
| Science & Technology | 407 | 16.5% |
| Business | 192 | 7.8% |
| Education | 609 | 24.7% |
| Literature & Languages | 108 | 4.4% |
| Liberal Arts & History | 185 | 7.5% |
| Visual & Performing Arts | 8 | 0.3% |
| Communications | 46 | 1.9% |
| Arts & Humanities | 118 | 4.8% |
| Total | 2,464 | 100.0% |
Transportation & Commute in Ohio County
Vehicle Availability by Sex in Ohio County
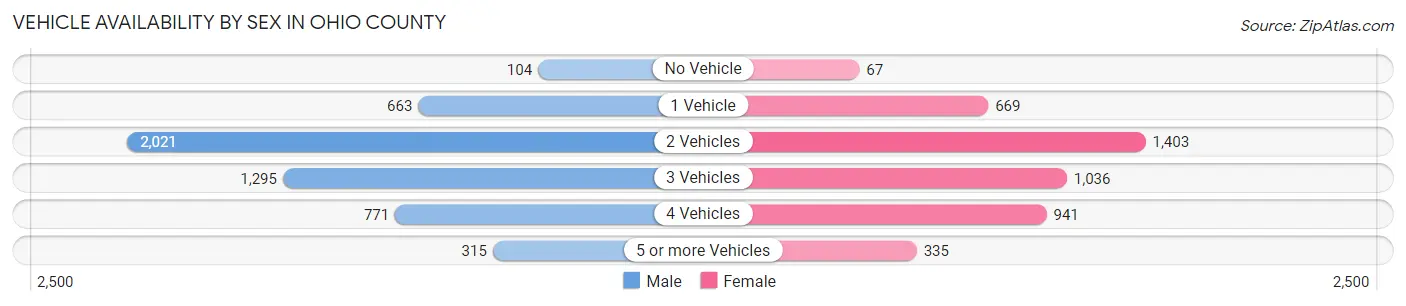
The most prevalent vehicle ownership categories in Ohio County are males with 2 vehicles (2,021, accounting for 39.1%) and females with 2 vehicles (1,403, making up 45.4%).
| Vehicles Available | Male | Female |
| No Vehicle | 104 (2.0%) | 67 (1.5%) |
| 1 Vehicle | 663 (12.8%) | 669 (15.0%) |
| 2 Vehicles | 2,021 (39.1%) | 1,403 (31.5%) |
| 3 Vehicles | 1,295 (25.1%) | 1,036 (23.3%) |
| 4 Vehicles | 771 (14.9%) | 941 (21.1%) |
| 5 or more Vehicles | 315 (6.1%) | 335 (7.5%) |
| Total | 5,169 (100.0%) | 4,451 (100.0%) |
Commute Time in Ohio County
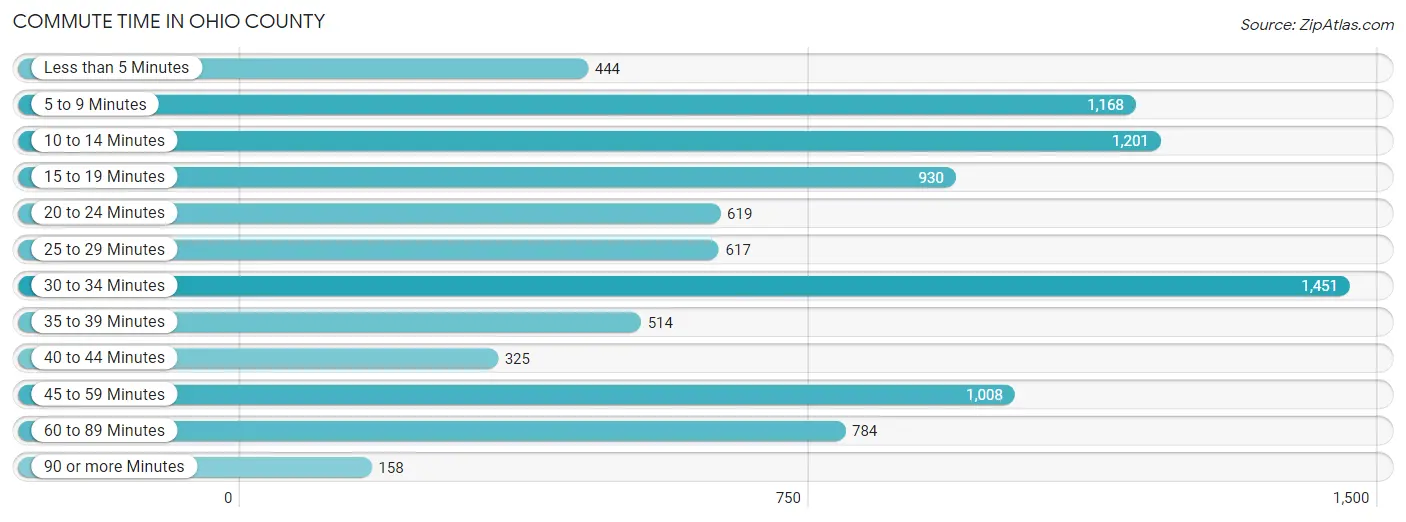
The most frequently occuring commute durations in Ohio County are 30 to 34 minutes (1,451 commuters, 15.7%), 10 to 14 minutes (1,201 commuters, 13.0%), and 5 to 9 minutes (1,168 commuters, 12.7%).
| Commute Time | # Commuters | % Commuters |
| Less than 5 Minutes | 444 | 4.8% |
| 5 to 9 Minutes | 1,168 | 12.7% |
| 10 to 14 Minutes | 1,201 | 13.0% |
| 15 to 19 Minutes | 930 | 10.1% |
| 20 to 24 Minutes | 619 | 6.7% |
| 25 to 29 Minutes | 617 | 6.7% |
| 30 to 34 Minutes | 1,451 | 15.7% |
| 35 to 39 Minutes | 514 | 5.6% |
| 40 to 44 Minutes | 325 | 3.5% |
| 45 to 59 Minutes | 1,008 | 10.9% |
| 60 to 89 Minutes | 784 | 8.5% |
| 90 or more Minutes | 158 | 1.7% |
Commute Time by Sex in Ohio County
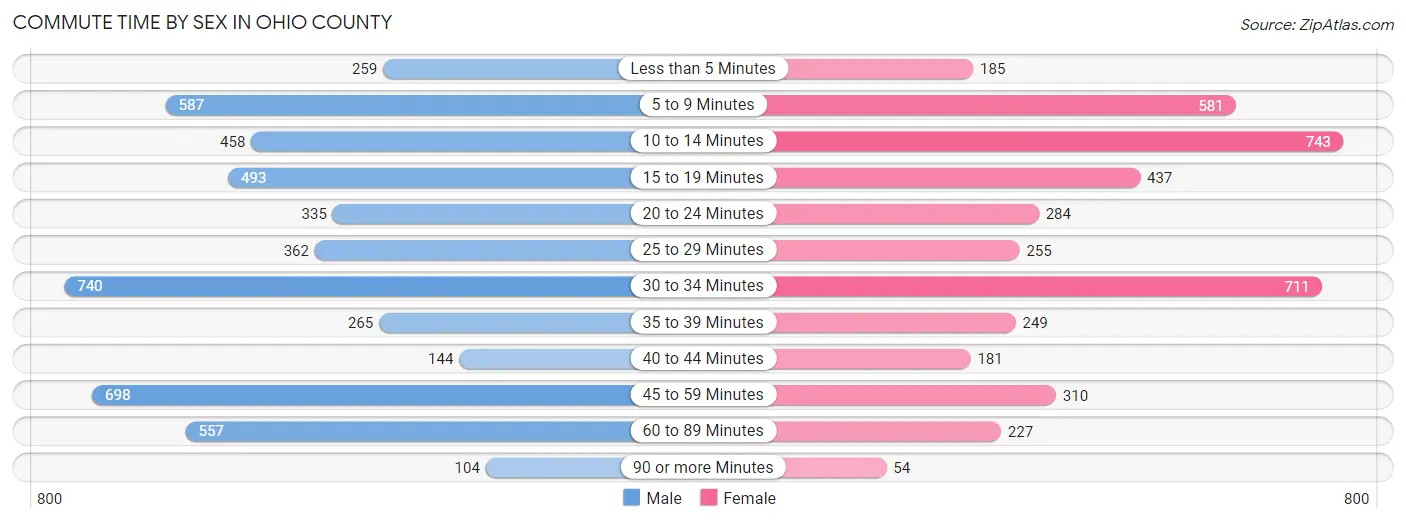
The most common commute times in Ohio County are 30 to 34 minutes (740 commuters, 14.8%) for males and 10 to 14 minutes (743 commuters, 17.6%) for females.
| Commute Time | Male | Female |
| Less than 5 Minutes | 259 (5.2%) | 185 (4.4%) |
| 5 to 9 Minutes | 587 (11.7%) | 581 (13.8%) |
| 10 to 14 Minutes | 458 (9.2%) | 743 (17.6%) |
| 15 to 19 Minutes | 493 (9.9%) | 437 (10.4%) |
| 20 to 24 Minutes | 335 (6.7%) | 284 (6.7%) |
| 25 to 29 Minutes | 362 (7.2%) | 255 (6.0%) |
| 30 to 34 Minutes | 740 (14.8%) | 711 (16.9%) |
| 35 to 39 Minutes | 265 (5.3%) | 249 (5.9%) |
| 40 to 44 Minutes | 144 (2.9%) | 181 (4.3%) |
| 45 to 59 Minutes | 698 (14.0%) | 310 (7.3%) |
| 60 to 89 Minutes | 557 (11.1%) | 227 (5.4%) |
| 90 or more Minutes | 104 (2.1%) | 54 (1.3%) |
Time of Departure to Work by Sex in Ohio County
The most frequent times of departure to work in Ohio County are 5:30 AM to 5:59 AM (877, 17.5%) for males and 7:00 AM to 7:29 AM (1,196, 28.4%) for females.
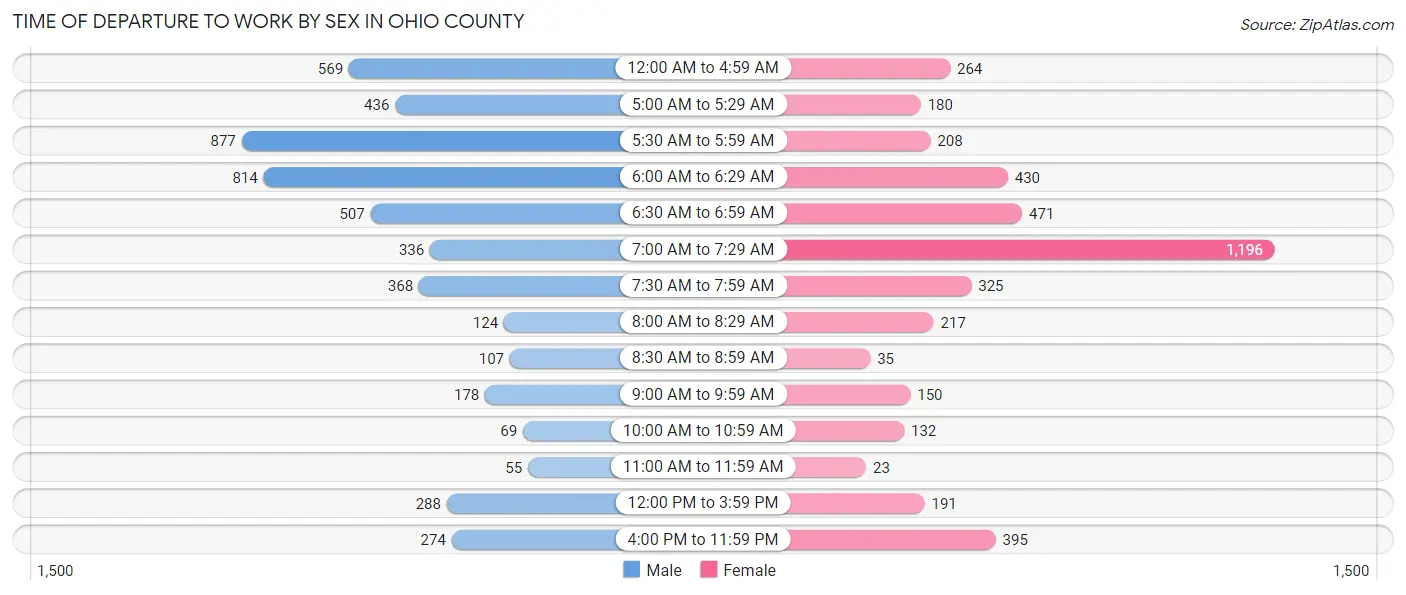
| Time of Departure | Male | Female |
| 12:00 AM to 4:59 AM | 569 (11.4%) | 264 (6.3%) |
| 5:00 AM to 5:29 AM | 436 (8.7%) | 180 (4.3%) |
| 5:30 AM to 5:59 AM | 877 (17.5%) | 208 (4.9%) |
| 6:00 AM to 6:29 AM | 814 (16.3%) | 430 (10.2%) |
| 6:30 AM to 6:59 AM | 507 (10.1%) | 471 (11.2%) |
| 7:00 AM to 7:29 AM | 336 (6.7%) | 1,196 (28.4%) |
| 7:30 AM to 7:59 AM | 368 (7.4%) | 325 (7.7%) |
| 8:00 AM to 8:29 AM | 124 (2.5%) | 217 (5.1%) |
| 8:30 AM to 8:59 AM | 107 (2.1%) | 35 (0.8%) |
| 9:00 AM to 9:59 AM | 178 (3.6%) | 150 (3.6%) |
| 10:00 AM to 10:59 AM | 69 (1.4%) | 132 (3.1%) |
| 11:00 AM to 11:59 AM | 55 (1.1%) | 23 (0.5%) |
| 12:00 PM to 3:59 PM | 288 (5.8%) | 191 (4.5%) |
| 4:00 PM to 11:59 PM | 274 (5.5%) | 395 (9.4%) |
| Total | 5,002 (100.0%) | 4,217 (100.0%) |
Housing Occupancy in Ohio County
Occupancy by Ownership in Ohio County
Of the total 9,041 dwellings in Ohio County, owner-occupied units account for 7,038 (77.8%), while renter-occupied units make up 2,003 (22.2%).
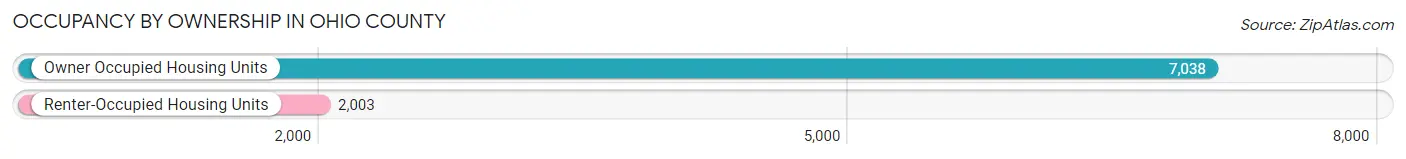
| Occupancy | # Housing Units | % Housing Units |
| Owner Occupied Housing Units | 7,038 | 77.8% |
| Renter-Occupied Housing Units | 2,003 | 22.2% |
| Total Occupied Housing Units | 9,041 | 100.0% |
Occupancy by Household Size in Ohio County
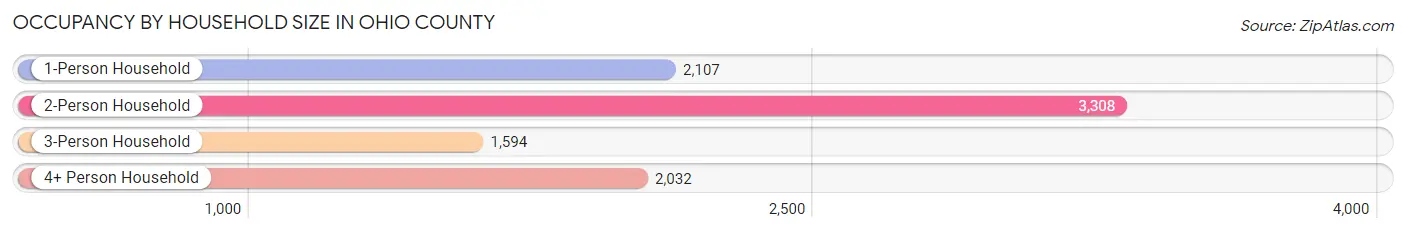
| Household Size | # Housing Units | % Housing Units |
| 1-Person Household | 2,107 | 23.3% |
| 2-Person Household | 3,308 | 36.6% |
| 3-Person Household | 1,594 | 17.6% |
| 4+ Person Household | 2,032 | 22.5% |
| Total Housing Units | 9,041 | 100.0% |
Occupancy by Ownership by Household Size in Ohio County
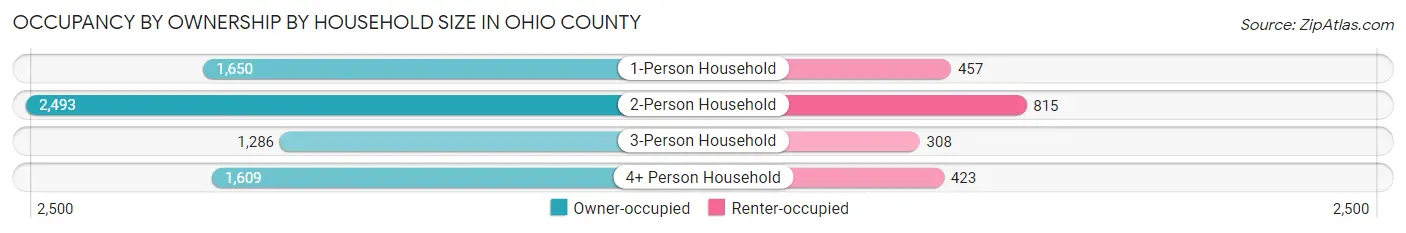
| Household Size | Owner-occupied | Renter-occupied |
| 1-Person Household | 1,650 (78.3%) | 457 (21.7%) |
| 2-Person Household | 2,493 (75.4%) | 815 (24.6%) |
| 3-Person Household | 1,286 (80.7%) | 308 (19.3%) |
| 4+ Person Household | 1,609 (79.2%) | 423 (20.8%) |
| Total Housing Units | 7,038 (77.8%) | 2,003 (22.2%) |
Occupancy by Educational Attainment in Ohio County
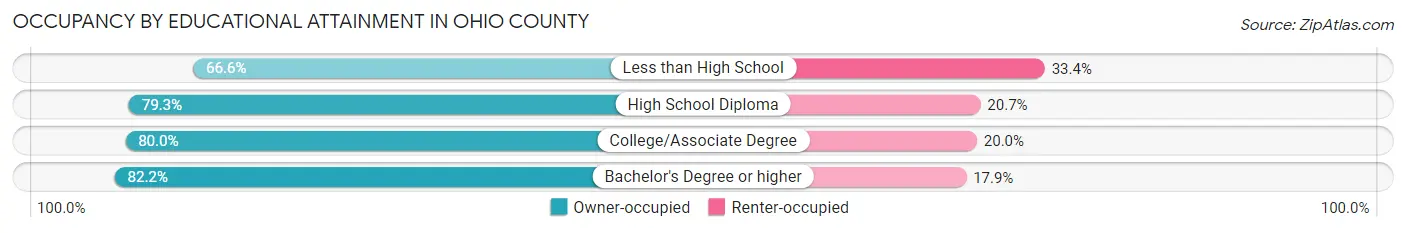
| Household Size | Owner-occupied | Renter-occupied |
| Less than High School | 1,002 (66.6%) | 503 (33.4%) |
| High School Diploma | 2,801 (79.3%) | 730 (20.7%) |
| College/Associate Degree | 2,089 (80.0%) | 521 (20.0%) |
| Bachelor's Degree or higher | 1,146 (82.2%) | 249 (17.8%) |
Occupancy by Age of Householder in Ohio County
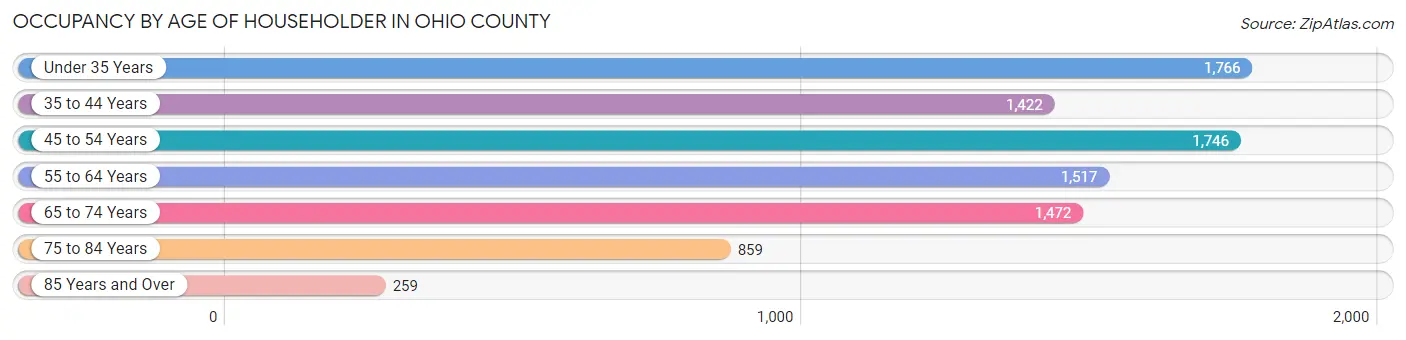
| Age Bracket | # Households | % Households |
| Under 35 Years | 1,766 | 19.5% |
| 35 to 44 Years | 1,422 | 15.7% |
| 45 to 54 Years | 1,746 | 19.3% |
| 55 to 64 Years | 1,517 | 16.8% |
| 65 to 74 Years | 1,472 | 16.3% |
| 75 to 84 Years | 859 | 9.5% |
| 85 Years and Over | 259 | 2.9% |
| Total | 9,041 | 100.0% |
Housing Finances in Ohio County
Median Income by Occupancy in Ohio County
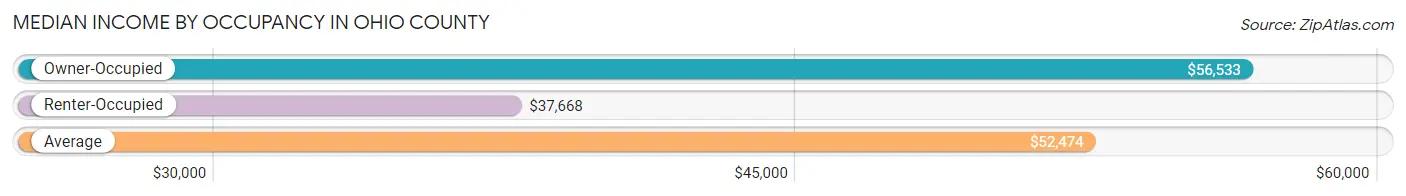
| Occupancy Type | # Households | Median Income |
| Owner-Occupied | 7,038 (77.8%) | $56,533 |
| Renter-Occupied | 2,003 (22.2%) | $37,668 |
| Average | 9,041 (100.0%) | $52,474 |
Occupancy by Householder Income Bracket in Ohio County
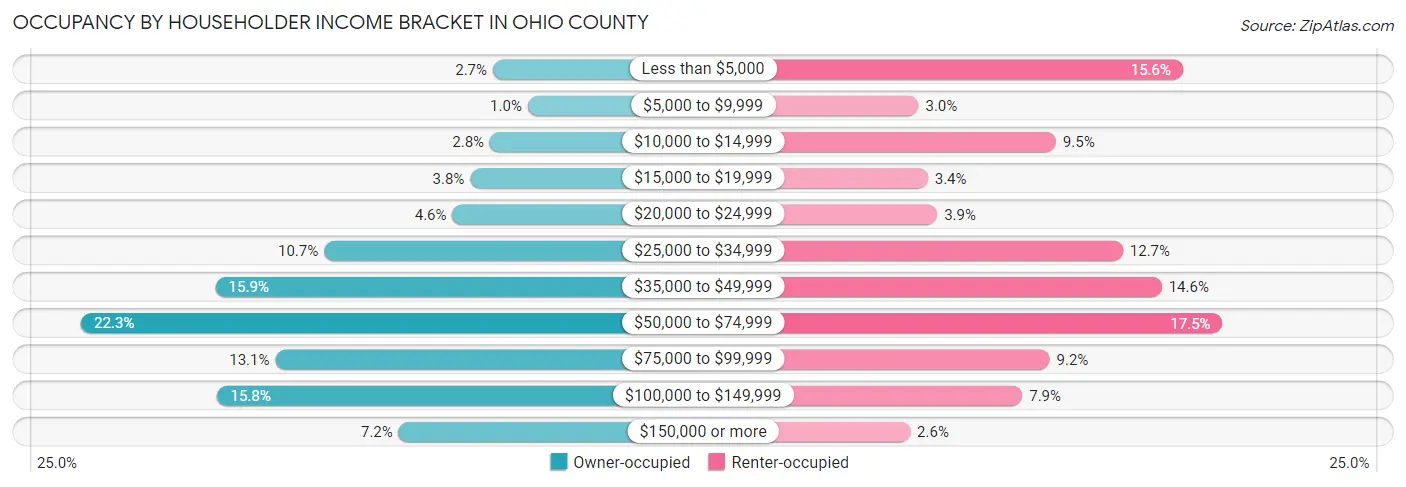
| Income Bracket | Owner-occupied | Renter-occupied |
| Less than $5,000 | 190 (2.7%) | 312 (15.6%) |
| $5,000 to $9,999 | 73 (1.0%) | 60 (3.0%) |
| $10,000 to $14,999 | 200 (2.8%) | 191 (9.5%) |
| $15,000 to $19,999 | 266 (3.8%) | 69 (3.4%) |
| $20,000 to $24,999 | 326 (4.6%) | 78 (3.9%) |
| $25,000 to $34,999 | 756 (10.7%) | 255 (12.7%) |
| $35,000 to $49,999 | 1,119 (15.9%) | 292 (14.6%) |
| $50,000 to $74,999 | 1,570 (22.3%) | 350 (17.5%) |
| $75,000 to $99,999 | 919 (13.1%) | 185 (9.2%) |
| $100,000 to $149,999 | 1,113 (15.8%) | 159 (7.9%) |
| $150,000 or more | 506 (7.2%) | 52 (2.6%) |
| Total | 7,038 (100.0%) | 2,003 (100.0%) |
Monthly Housing Cost Tiers in Ohio County
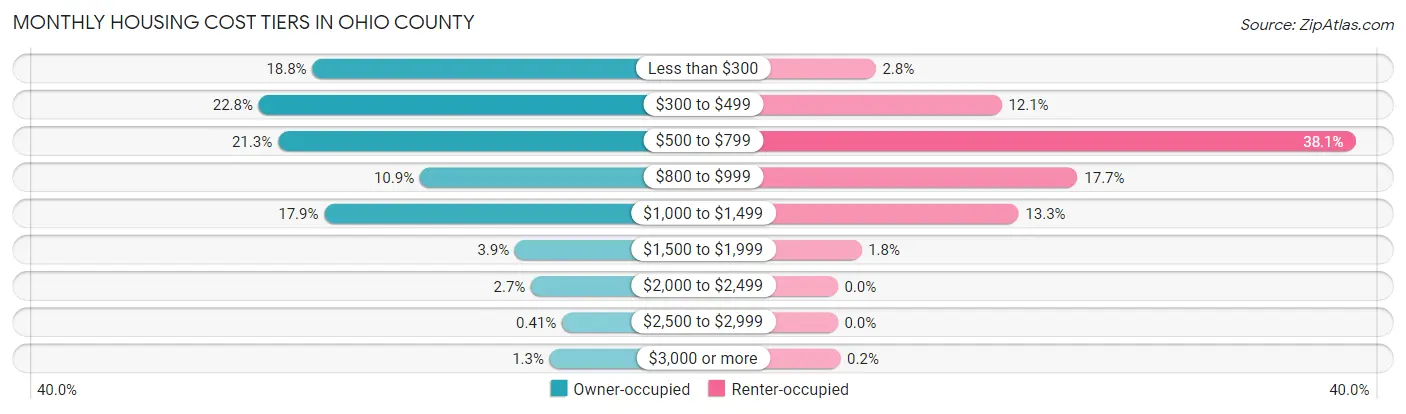
| Monthly Cost | Owner-occupied | Renter-occupied |
| Less than $300 | 1,323 (18.8%) | 56 (2.8%) |
| $300 to $499 | 1,601 (22.8%) | 242 (12.1%) |
| $500 to $799 | 1,502 (21.3%) | 764 (38.1%) |
| $800 to $999 | 766 (10.9%) | 354 (17.7%) |
| $1,000 to $1,499 | 1,262 (17.9%) | 267 (13.3%) |
| $1,500 to $1,999 | 273 (3.9%) | 35 (1.8%) |
| $2,000 to $2,499 | 189 (2.7%) | 0 (0.0%) |
| $2,500 to $2,999 | 29 (0.4%) | 0 (0.0%) |
| $3,000 or more | 93 (1.3%) | 4 (0.2%) |
| Total | 7,038 (100.0%) | 2,003 (100.0%) |
Physical Housing Characteristics in Ohio County
Housing Structures in Ohio County
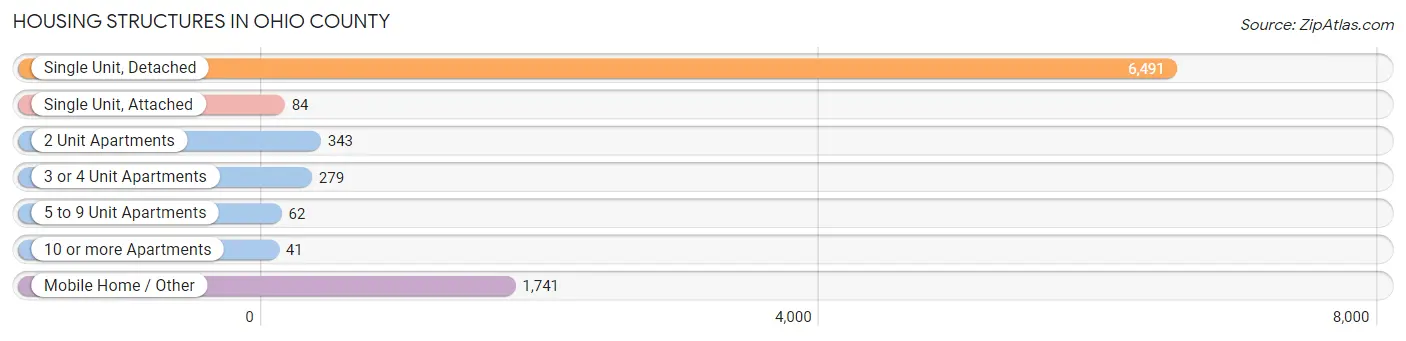
| Structure Type | # Housing Units | % Housing Units |
| Single Unit, Detached | 6,491 | 71.8% |
| Single Unit, Attached | 84 | 0.9% |
| 2 Unit Apartments | 343 | 3.8% |
| 3 or 4 Unit Apartments | 279 | 3.1% |
| 5 to 9 Unit Apartments | 62 | 0.7% |
| 10 or more Apartments | 41 | 0.4% |
| Mobile Home / Other | 1,741 | 19.3% |
| Total | 9,041 | 100.0% |
Housing Structures by Occupancy in Ohio County
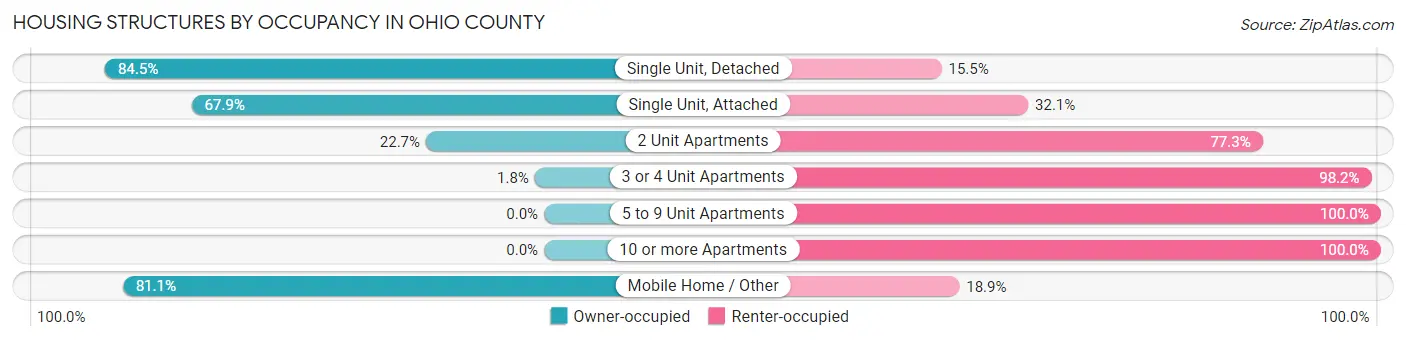
| Structure Type | Owner-occupied | Renter-occupied |
| Single Unit, Detached | 5,486 (84.5%) | 1,005 (15.5%) |
| Single Unit, Attached | 57 (67.9%) | 27 (32.1%) |
| 2 Unit Apartments | 78 (22.7%) | 265 (77.3%) |
| 3 or 4 Unit Apartments | 5 (1.8%) | 274 (98.2%) |
| 5 to 9 Unit Apartments | 0 (0.0%) | 62 (100.0%) |
| 10 or more Apartments | 0 (0.0%) | 41 (100.0%) |
| Mobile Home / Other | 1,412 (81.1%) | 329 (18.9%) |
| Total | 7,038 (77.8%) | 2,003 (22.2%) |
Housing Structures by Number of Rooms in Ohio County
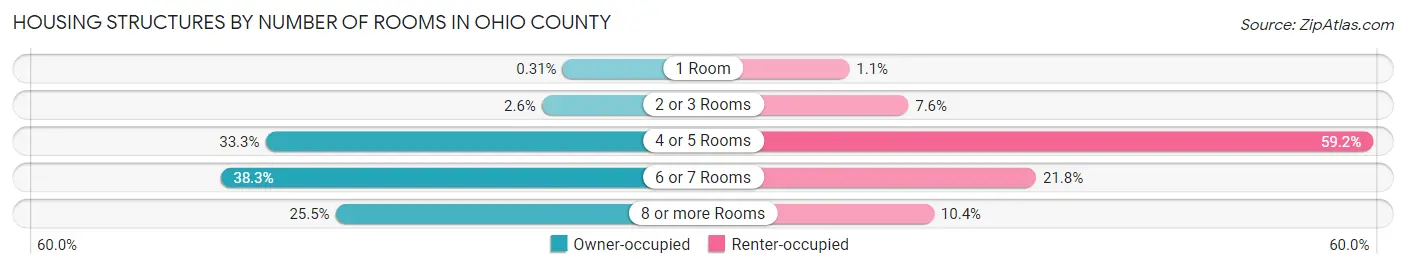
| Number of Rooms | Owner-occupied | Renter-occupied |
| 1 Room | 22 (0.3%) | 21 (1.1%) |
| 2 or 3 Rooms | 184 (2.6%) | 152 (7.6%) |
| 4 or 5 Rooms | 2,343 (33.3%) | 1,185 (59.2%) |
| 6 or 7 Rooms | 2,694 (38.3%) | 436 (21.8%) |
| 8 or more Rooms | 1,795 (25.5%) | 209 (10.4%) |
| Total | 7,038 (100.0%) | 2,003 (100.0%) |
Housing Structure by Heating Type in Ohio County
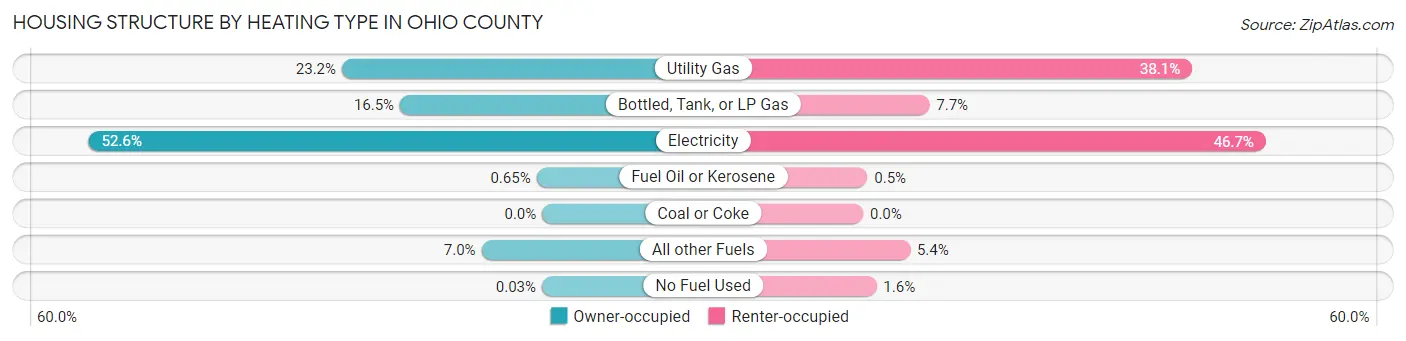
| Heating Type | Owner-occupied | Renter-occupied |
| Utility Gas | 1,634 (23.2%) | 764 (38.1%) |
| Bottled, Tank, or LP Gas | 1,160 (16.5%) | 154 (7.7%) |
| Electricity | 3,701 (52.6%) | 935 (46.7%) |
| Fuel Oil or Kerosene | 46 (0.6%) | 10 (0.5%) |
| Coal or Coke | 0 (0.0%) | 0 (0.0%) |
| All other Fuels | 495 (7.0%) | 109 (5.4%) |
| No Fuel Used | 2 (0.0%) | 31 (1.5%) |
| Total | 7,038 (100.0%) | 2,003 (100.0%) |
Household Vehicle Usage in Ohio County
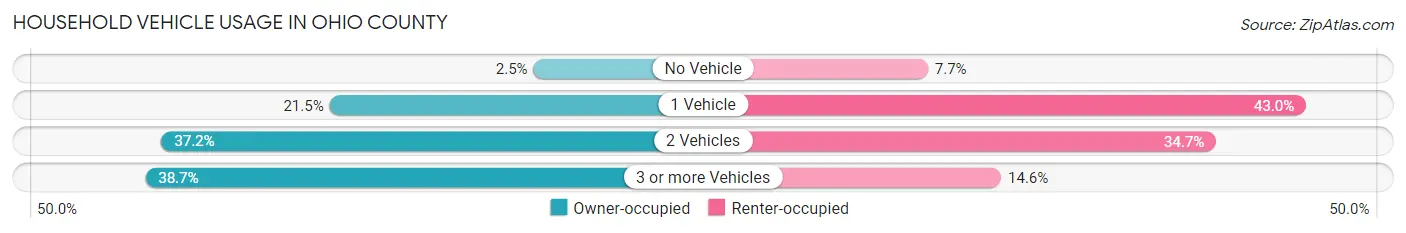
| Vehicles per Household | Owner-occupied | Renter-occupied |
| No Vehicle | 176 (2.5%) | 155 (7.7%) |
| 1 Vehicle | 1,516 (21.5%) | 862 (43.0%) |
| 2 Vehicles | 2,620 (37.2%) | 694 (34.6%) |
| 3 or more Vehicles | 2,726 (38.7%) | 292 (14.6%) |
| Total | 7,038 (100.0%) | 2,003 (100.0%) |
Real Estate & Mortgages in Ohio County
Real Estate and Mortgage Overview in Ohio County
| Characteristic | Without Mortgage | With Mortgage |
| Housing Units | 3,844 | 3,194 |
| Median Property Value | $108,000 | $124,300 |
| Median Household Income | $48,557 | $391 |
| Monthly Housing Costs | $356 | $93 |
| Real Estate Taxes | $516 | $182 |
Property Value by Mortgage Status in Ohio County
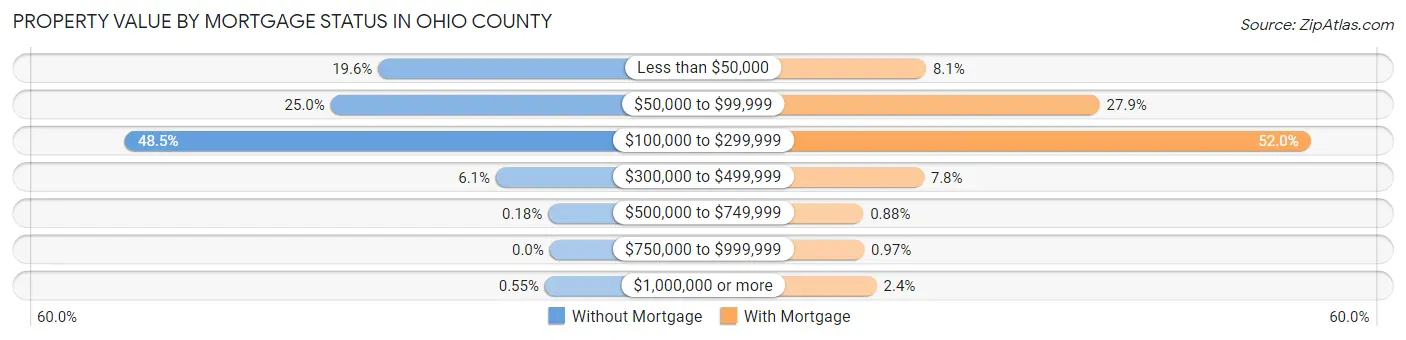
| Property Value | Without Mortgage | With Mortgage |
| Less than $50,000 | 753 (19.6%) | 257 (8.1%) |
| $50,000 to $99,999 | 962 (25.0%) | 891 (27.9%) |
| $100,000 to $299,999 | 1,865 (48.5%) | 1,661 (52.0%) |
| $300,000 to $499,999 | 236 (6.1%) | 249 (7.8%) |
| $500,000 to $749,999 | 7 (0.2%) | 28 (0.9%) |
| $750,000 to $999,999 | 0 (0.0%) | 31 (1.0%) |
| $1,000,000 or more | 21 (0.5%) | 77 (2.4%) |
| Total | 3,844 (100.0%) | 3,194 (100.0%) |
Household Income by Mortgage Status in Ohio County
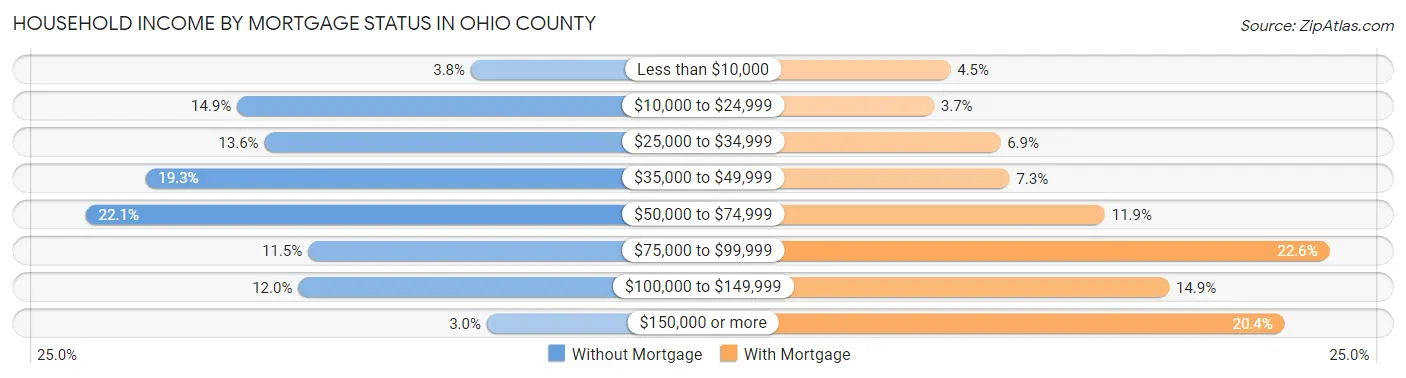
| Household Income | Without Mortgage | With Mortgage |
| Less than $10,000 | 144 (3.7%) | 144 (4.5%) |
| $10,000 to $24,999 | 572 (14.9%) | 119 (3.7%) |
| $25,000 to $34,999 | 522 (13.6%) | 220 (6.9%) |
| $35,000 to $49,999 | 740 (19.3%) | 234 (7.3%) |
| $50,000 to $74,999 | 849 (22.1%) | 379 (11.9%) |
| $75,000 to $99,999 | 442 (11.5%) | 721 (22.6%) |
| $100,000 to $149,999 | 460 (12.0%) | 477 (14.9%) |
| $150,000 or more | 115 (3.0%) | 653 (20.4%) |
| Total | 3,844 (100.0%) | 3,194 (100.0%) |
Property Value to Household Income Ratio in Ohio County
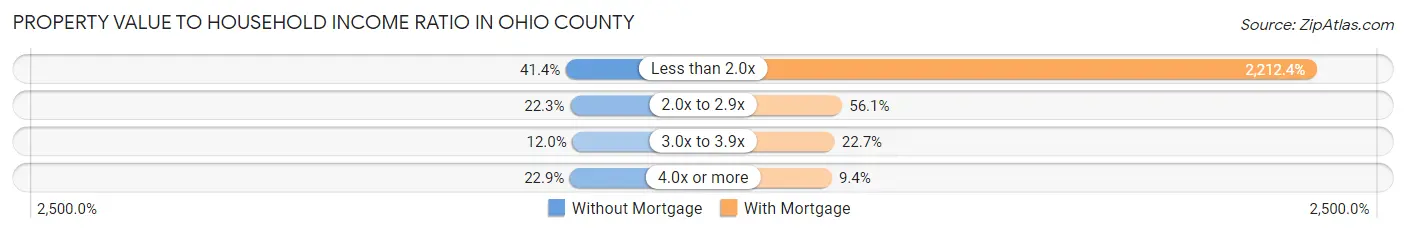
| Value-to-Income Ratio | Without Mortgage | With Mortgage |
| Less than 2.0x | 1,593 (41.4%) | 70,664 (2,212.4%) |
| 2.0x to 2.9x | 857 (22.3%) | 1,793 (56.1%) |
| 3.0x to 3.9x | 463 (12.0%) | 725 (22.7%) |
| 4.0x or more | 879 (22.9%) | 299 (9.4%) |
| Total | 3,844 (100.0%) | 3,194 (100.0%) |
Real Estate Taxes by Mortgage Status in Ohio County
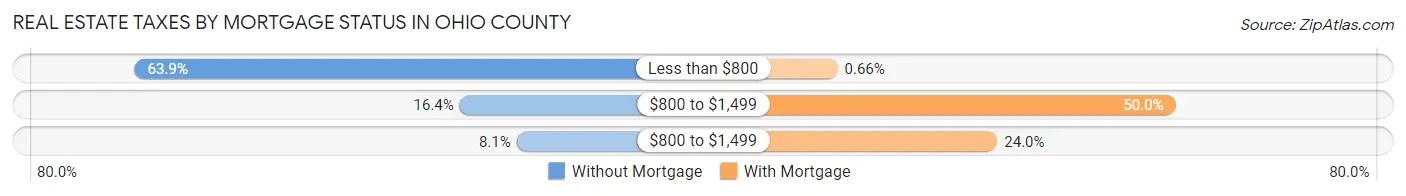
| Property Taxes | Without Mortgage | With Mortgage |
| Less than $800 | 2,458 (63.9%) | 21 (0.7%) |
| $800 to $1,499 | 632 (16.4%) | 1,598 (50.0%) |
| $800 to $1,499 | 312 (8.1%) | 767 (24.0%) |
| Total | 3,844 (100.0%) | 3,194 (100.0%) |
Health & Disability in Ohio County
Health Insurance Coverage by Age in Ohio County
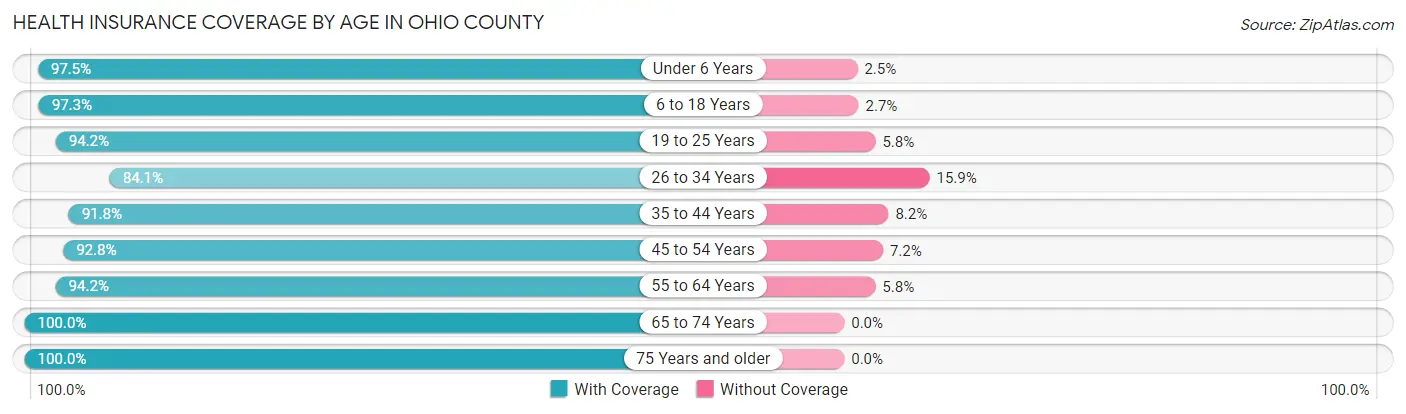
| Age Bracket | With Coverage | Without Coverage |
| Under 6 Years | 1,427 (97.5%) | 36 (2.5%) |
| 6 to 18 Years | 4,397 (97.3%) | 120 (2.7%) |
| 19 to 25 Years | 1,667 (94.2%) | 103 (5.8%) |
| 26 to 34 Years | 2,163 (84.1%) | 409 (15.9%) |
| 35 to 44 Years | 2,682 (91.8%) | 241 (8.2%) |
| 45 to 54 Years | 2,767 (92.8%) | 215 (7.2%) |
| 55 to 64 Years | 2,941 (94.2%) | 181 (5.8%) |
| 65 to 74 Years | 2,460 (100.0%) | 0 (0.0%) |
| 75 Years and older | 1,656 (100.0%) | 0 (0.0%) |
| Total | 22,160 (94.4%) | 1,305 (5.6%) |
Health Insurance Coverage by Citizenship Status in Ohio County
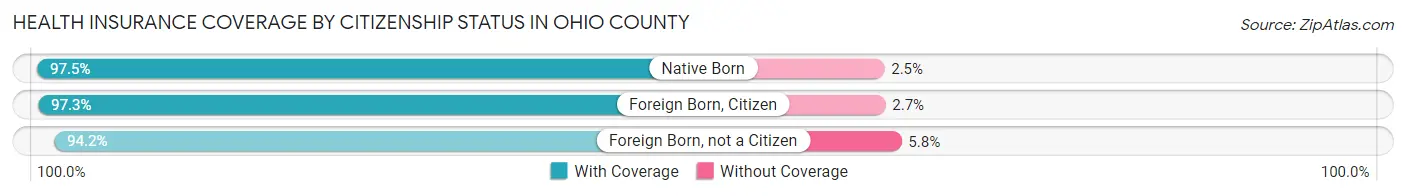
| Citizenship Status | With Coverage | Without Coverage |
| Native Born | 1,427 (97.5%) | 36 (2.5%) |
| Foreign Born, Citizen | 4,397 (97.3%) | 120 (2.7%) |
| Foreign Born, not a Citizen | 1,667 (94.2%) | 103 (5.8%) |
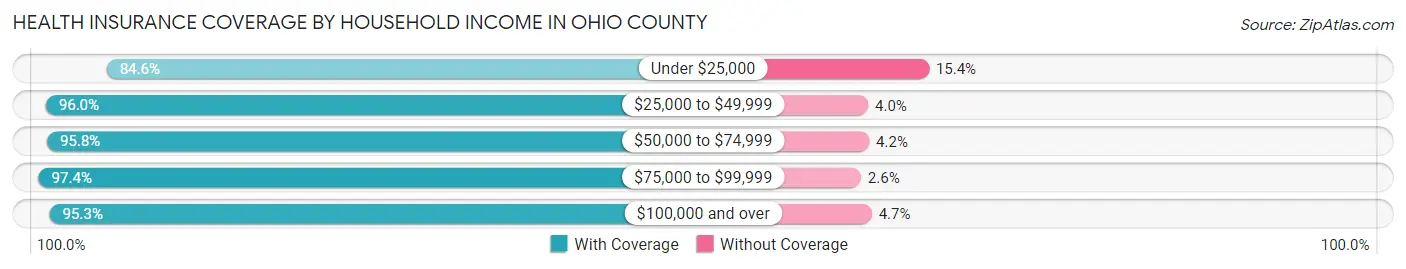
Health Insurance Coverage by Household Income in Ohio County
| Household Income | With Coverage | Without Coverage |
| Under $25,000 | 2,661 (84.6%) | 484 (15.4%) |
| $25,000 to $49,999 | 5,540 (96.0%) | 230 (4.0%) |
| $50,000 to $74,999 | 5,144 (95.8%) | 225 (4.2%) |
| $75,000 to $99,999 | 3,023 (97.4%) | 82 (2.6%) |
| $100,000 and over | 5,792 (95.3%) | 284 (4.7%) |
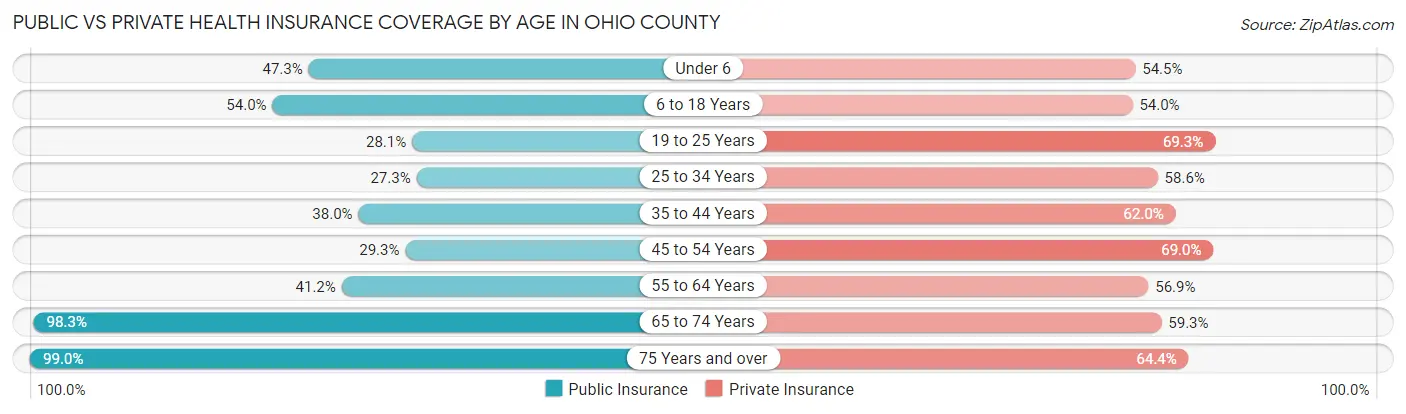
Public vs Private Health Insurance Coverage by Age in Ohio County
| Age Bracket | Public Insurance | Private Insurance |
| Under 6 | 692 (47.3%) | 797 (54.5%) |
| 6 to 18 Years | 2,439 (54.0%) | 2,437 (53.9%) |
| 19 to 25 Years | 497 (28.1%) | 1,226 (69.3%) |
| 25 to 34 Years | 701 (27.3%) | 1,508 (58.6%) |
| 35 to 44 Years | 1,112 (38.0%) | 1,811 (62.0%) |
| 45 to 54 Years | 875 (29.3%) | 2,056 (69.0%) |
| 55 to 64 Years | 1,285 (41.2%) | 1,776 (56.9%) |
| 65 to 74 Years | 2,419 (98.3%) | 1,459 (59.3%) |
| 75 Years and over | 1,639 (99.0%) | 1,066 (64.4%) |
| Total | 11,659 (49.7%) | 14,136 (60.2%) |
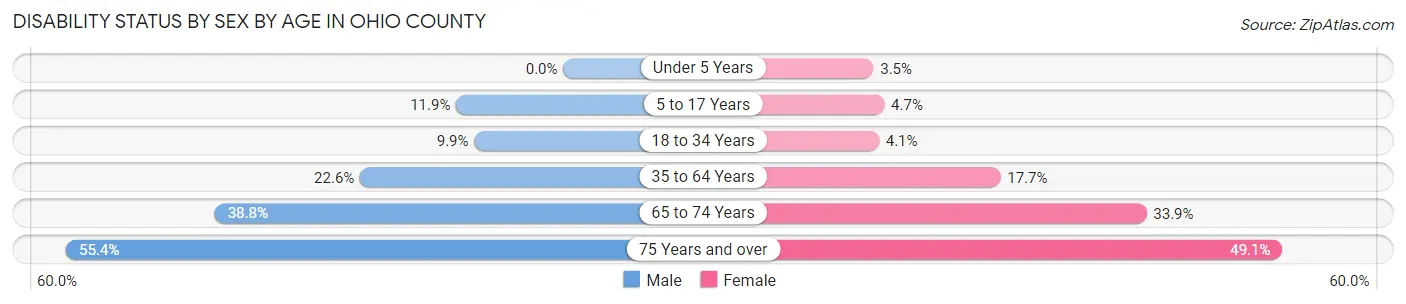
Disability Status by Sex by Age in Ohio County
| Age Bracket | Male | Female |
| Under 5 Years | 0 (0.0%) | 21 (3.5%) |
| 5 to 17 Years | 260 (11.9%) | 100 (4.7%) |
| 18 to 34 Years | 253 (9.9%) | 90 (4.1%) |
| 35 to 64 Years | 1,012 (22.6%) | 804 (17.6%) |
| 65 to 74 Years | 472 (38.8%) | 422 (33.9%) |
| 75 Years and over | 417 (55.4%) | 443 (49.1%) |
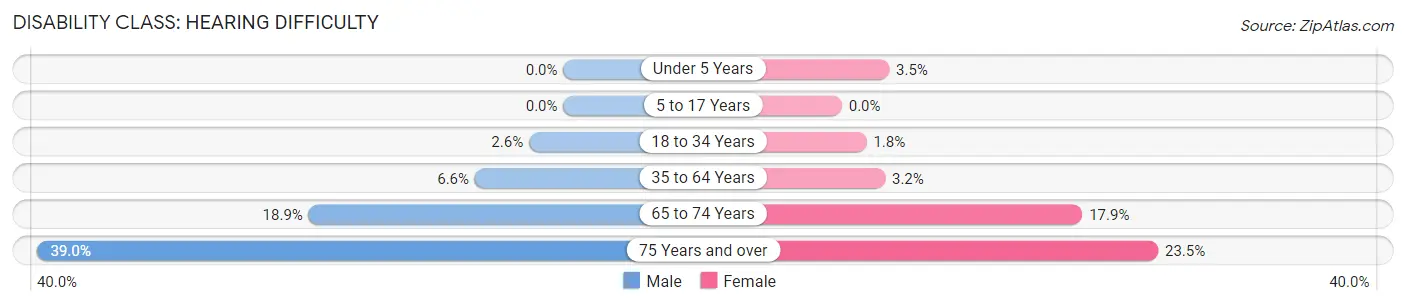
Disability Class by Sex by Age in Ohio County
Disability Class: Hearing Difficulty
| Age Bracket | Male | Female |
| Under 5 Years | 0 (0.0%) | 21 (3.5%) |
| 5 to 17 Years | 0 (0.0%) | 0 (0.0%) |
| 18 to 34 Years | 65 (2.5%) | 40 (1.8%) |
| 35 to 64 Years | 294 (6.6%) | 146 (3.2%) |
| 65 to 74 Years | 230 (18.9%) | 222 (17.8%) |
| 75 Years and over | 294 (39.0%) | 212 (23.5%) |
Disability Class: Vision Difficulty
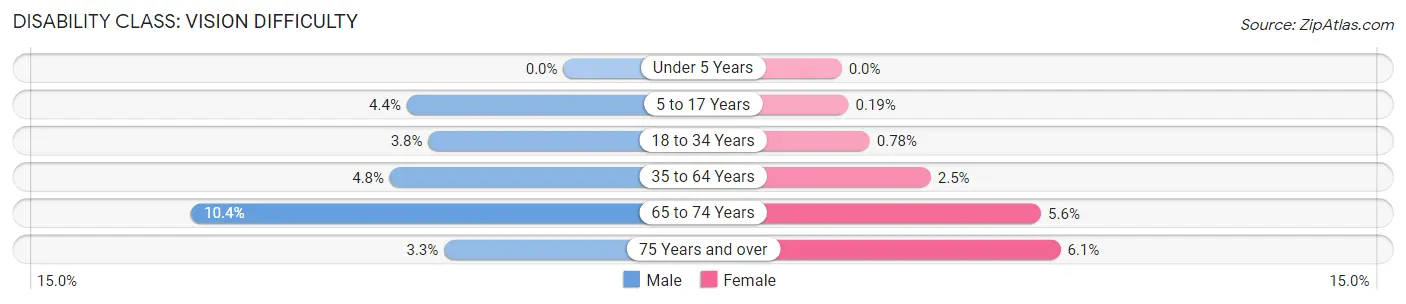
| Age Bracket | Male | Female |
| Under 5 Years | 0 (0.0%) | 0 (0.0%) |
| 5 to 17 Years | 95 (4.4%) | 4 (0.2%) |
| 18 to 34 Years | 96 (3.8%) | 17 (0.8%) |
| 35 to 64 Years | 216 (4.8%) | 113 (2.5%) |
| 65 to 74 Years | 126 (10.4%) | 69 (5.6%) |
| 75 Years and over | 25 (3.3%) | 55 (6.1%) |
Disability Class: Cognitive Difficulty
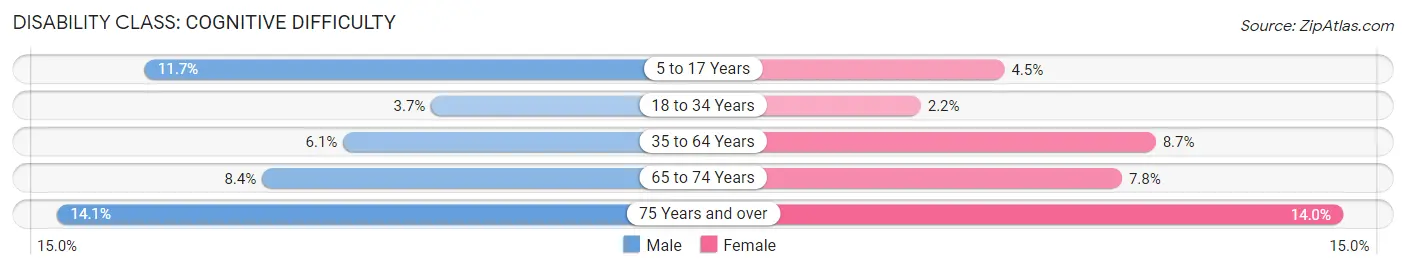
| Age Bracket | Male | Female |
| 5 to 17 Years | 254 (11.7%) | 96 (4.5%) |
| 18 to 34 Years | 94 (3.7%) | 48 (2.2%) |
| 35 to 64 Years | 274 (6.1%) | 398 (8.7%) |
| 65 to 74 Years | 102 (8.4%) | 97 (7.8%) |
| 75 Years and over | 106 (14.1%) | 126 (14.0%) |
Disability Class: Ambulatory Difficulty
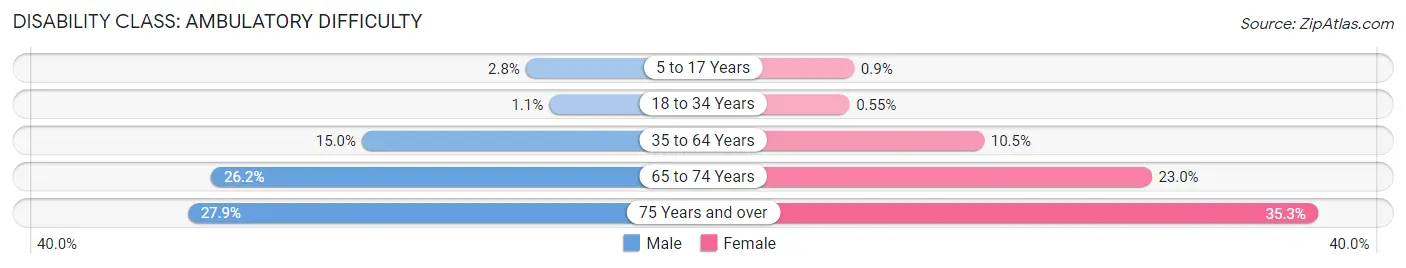
| Age Bracket | Male | Female |
| 5 to 17 Years | 61 (2.8%) | 19 (0.9%) |
| 18 to 34 Years | 27 (1.1%) | 12 (0.5%) |
| 35 to 64 Years | 669 (15.0%) | 480 (10.5%) |
| 65 to 74 Years | 318 (26.2%) | 286 (23.0%) |
| 75 Years and over | 210 (27.9%) | 319 (35.3%) |
Disability Class: Self-Care Difficulty
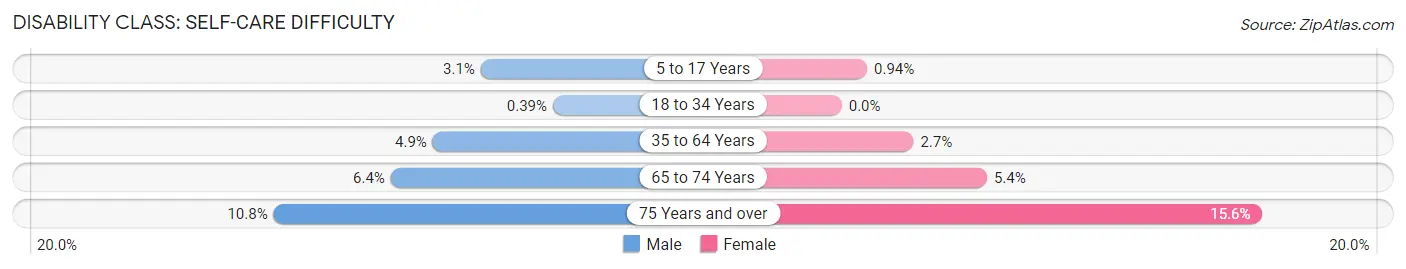
| Age Bracket | Male | Female |
| 5 to 17 Years | 67 (3.1%) | 20 (0.9%) |
| 18 to 34 Years | 10 (0.4%) | 0 (0.0%) |
| 35 to 64 Years | 217 (4.9%) | 121 (2.7%) |
| 65 to 74 Years | 78 (6.4%) | 67 (5.4%) |
| 75 Years and over | 81 (10.8%) | 141 (15.6%) |
Technology Access in Ohio County
Computing Device Access in Ohio County
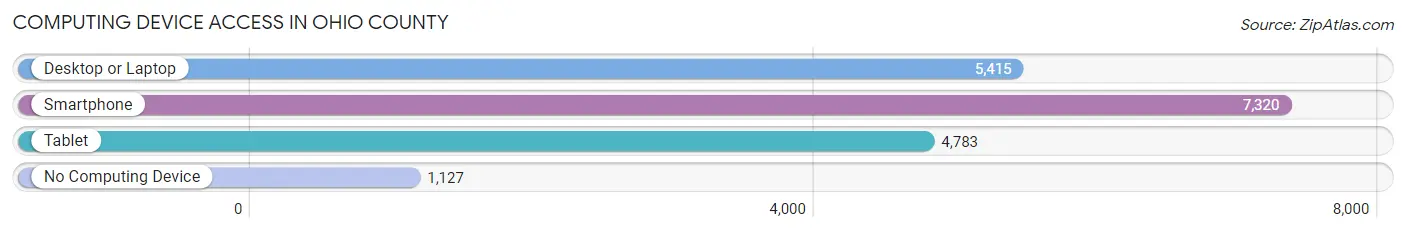
| Device Type | # Households | % Households |
| Desktop or Laptop | 5,415 | 59.9% |
| Smartphone | 7,320 | 81.0% |
| Tablet | 4,783 | 52.9% |
| No Computing Device | 1,127 | 12.5% |
| Total | 9,041 | 100.0% |
Internet Access in Ohio County
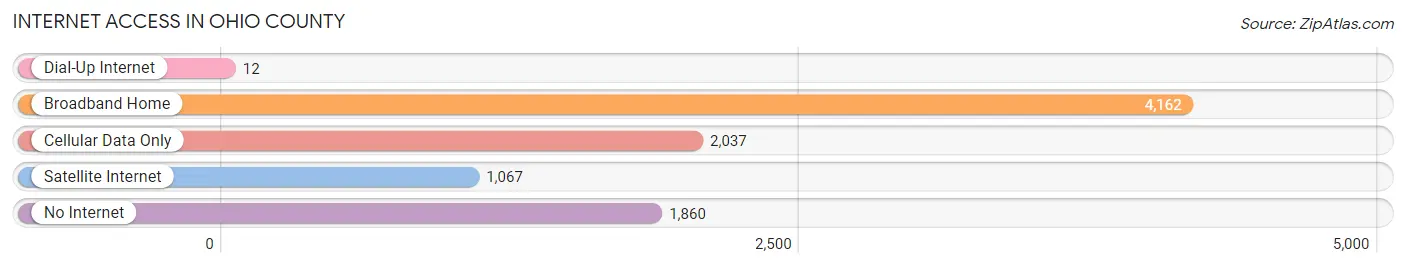
| Internet Type | # Households | % Households |
| Dial-Up Internet | 12 | 0.1% |
| Broadband Home | 4,162 | 46.0% |
| Cellular Data Only | 2,037 | 22.5% |
| Satellite Internet | 1,067 | 11.8% |
| No Internet | 1,860 | 20.6% |
| Total | 9,041 | 100.0% |
Ohio County Summary
History
Ohio County is located in the western part of Kentucky, and is part of the Owensboro Metropolitan Statistical Area. The county was formed in 1798 from parts of Hardin and Logan counties, and was named after the Ohio River, which forms its northern border. The county seat is Hartford, and the county has a population of approximately 12,000 people.
The first settlers in Ohio County were Native Americans, who lived in the area for thousands of years before the arrival of Europeans. The first Europeans to settle in the area were French fur traders, who established trading posts in the area in the late 1700s. The first permanent settlers in the county were mostly Scots-Irish immigrants, who arrived in the early 1800s.
The county was an important center of the Underground Railroad during the Civil War, and many escaped slaves found refuge in the county. After the war, the county experienced a period of economic growth, as the railroad and other industries began to develop in the area.
Geography
Ohio County is located in the western part of Kentucky, and is bordered by the Ohio River to the north, the Green River to the east, and the Rough River to the south. The county has a total area of 437 square miles, and is mostly rural, with a few small towns and villages. The county is mostly flat, with some rolling hills in the northern part of the county. The highest point in the county is located in the northern part of the county, and is approximately 860 feet above sea level.
The climate in Ohio County is generally mild, with hot summers and cold winters. The average annual temperature is around 55 degrees Fahrenheit, and the average annual precipitation is around 45 inches.
Economy
The economy of Ohio County is largely based on agriculture, with corn, soybeans, and wheat being the main crops. The county also has a strong manufacturing sector, with several factories producing furniture, clothing, and other products. The county also has a growing tourism industry, with several attractions, such as the Ohio County Historical Museum and the Ohio County Fairgrounds.
Demographics
As of the 2010 census, Ohio County had a population of 12,068 people. The racial makeup of the county was 95.3% White, 2.2% African American, 0.3% Native American, 0.3% Asian, 0.1% Pacific Islander, 0.7% from other races, and 1.2% from two or more races. Hispanic or Latino of any race were 1.7% of the population.
The median income for a household in the county was $35,945, and the median income for a family was $43,945. The per capita income for the county was $17,945. About 15.2% of the population was below the poverty line.
Common Questions
What is Per Capita Income in Ohio County?
Per Capita income in Ohio County is $26,712.
What is the Median Family Income in Ohio County?
Median Family Income in Ohio County is $58,676.
What is the Median Household income in Ohio County?
Median Household Income in Ohio County is $52,474.
What is Income or Wage Gap in Ohio County?
Income or Wage Gap in Ohio County is 35.4%.
Women in Ohio County earn 64.6 cents for every dollar earned by a man.
What is Family Income Deficit in Ohio County?
Family Income Deficit in Ohio County is $14,133.
Families that are below poverty line in Ohio County earn $14,133 less on average than the poverty threshold level.
What is Inequality or Gini Index in Ohio County?
Inequality or Gini Index in Ohio County is 0.43.
What is the Total Population of Ohio County?
Total Population of Ohio County is 23,782.
What is the Total Male Population of Ohio County?
Total Male Population of Ohio County is 11,966.
What is the Total Female Population of Ohio County?
Total Female Population of Ohio County is 11,816.
What is the Ratio of Males per 100 Females in Ohio County?
There are 101.27 Males per 100 Females in Ohio County.
What is the Ratio of Females per 100 Males in Ohio County?
There are 98.75 Females per 100 Males in Ohio County.
What is the Median Population Age in Ohio County?
Median Population Age in Ohio County is 41.0 Years.
What is the Average Family Size in Ohio County
Average Family Size in Ohio County is 3.0 People.
What is the Average Household Size in Ohio County
Average Household Size in Ohio County is 2.6 People.
How Large is the Labor Force in Ohio County?
There are 10,492 People in the Labor Forcein in Ohio County.
What is the Percentage of People in the Labor Force in Ohio County?
55.3% of People are in the Labor Force in Ohio County.
What is the Unemployment Rate in Ohio County?
Unemployment Rate in Ohio County is 4.5%.