Muhlenberg County, KY Map & Demographics
Muhlenberg County Map
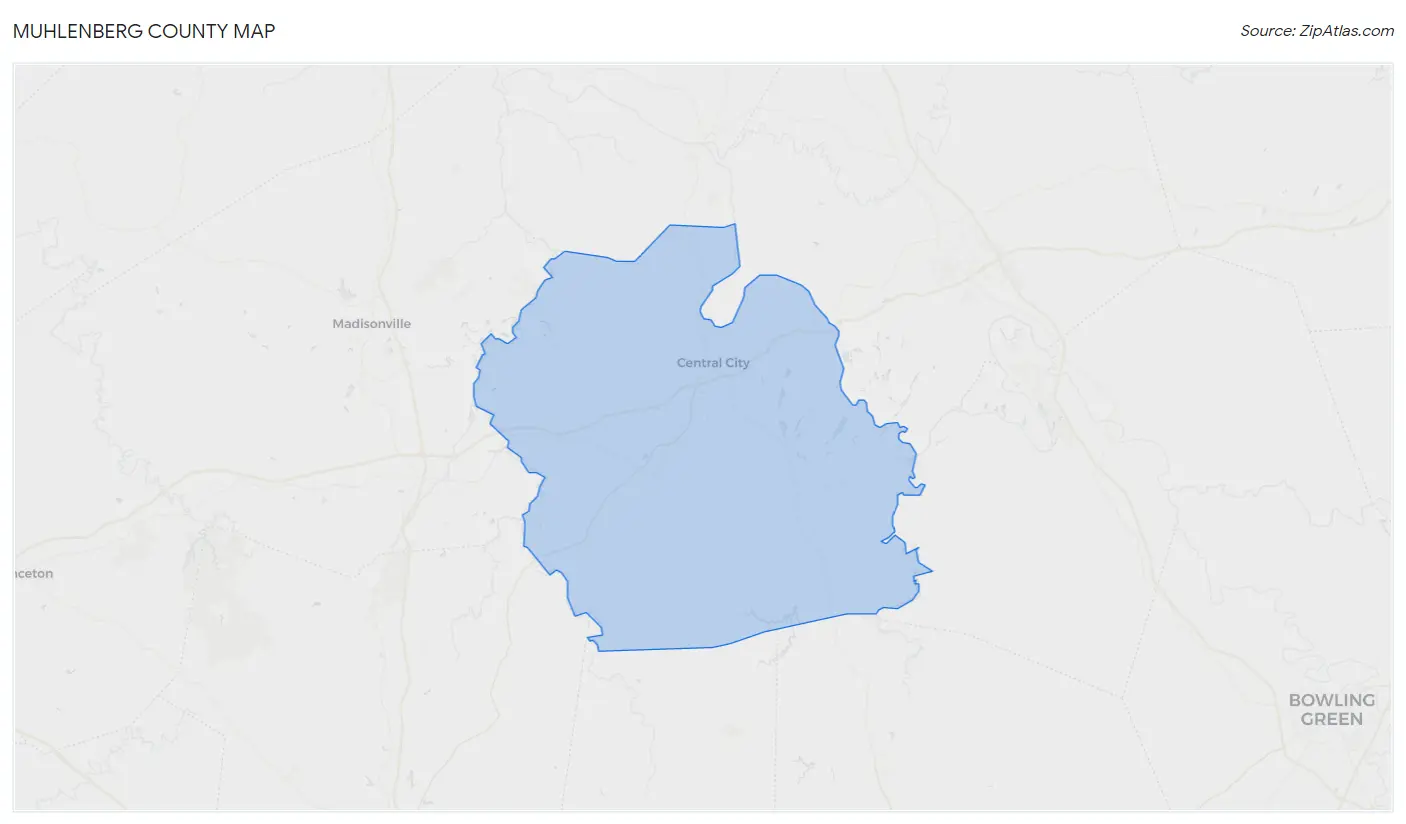
Muhlenberg County Overview
$31,621
PER CAPITA INCOME
$69,150
AVG FAMILY INCOME
$50,935
AVG HOUSEHOLD INCOME
37.6%
WAGE / INCOME GAP [ % ]
62.4¢/ $1
WAGE / INCOME GAP [ $ ]
$10,672
FAMILY INCOME DEFICIT
0.51
INEQUALITY / GINI INDEX
30,735
TOTAL POPULATION
15,577
MALE POPULATION
15,158
FEMALE POPULATION
102.76
MALES / 100 FEMALES
97.31
FEMALES / 100 MALES
43.0
MEDIAN AGE
3.0
AVG FAMILY SIZE
2.5
AVG HOUSEHOLD SIZE
13,183
LABOR FORCE [ PEOPLE ]
52.5%
PERCENT IN LABOR FORCE
4.9%
UNEMPLOYMENT RATE
Muhlenberg County Area Codes
Income in Muhlenberg County
Income Overview in Muhlenberg County
Per Capita Income in Muhlenberg County is $31,621, while median incomes of families and households are $69,150 and $50,935 respectively.
| Characteristic | Number | Measure |
| Per Capita Income | 30,735 | $31,621 |
| Median Family Income | 8,149 | $69,150 |
| Mean Family Income | 8,149 | $94,071 |
| Median Household Income | 11,847 | $50,935 |
| Mean Household Income | 11,847 | $78,421 |
| Income Deficit | 8,149 | $10,672 |
| Wage / Income Gap (%) | 30,735 | 37.64% |
| Wage / Income Gap ($) | 30,735 | 62.36¢ per $1 |
| Gini / Inequality Index | 30,735 | 0.51 |
Earnings by Sex in Muhlenberg County
Average Earnings in Muhlenberg County are $36,634, $43,862 for men and $27,353 for women, a difference of 37.6%.
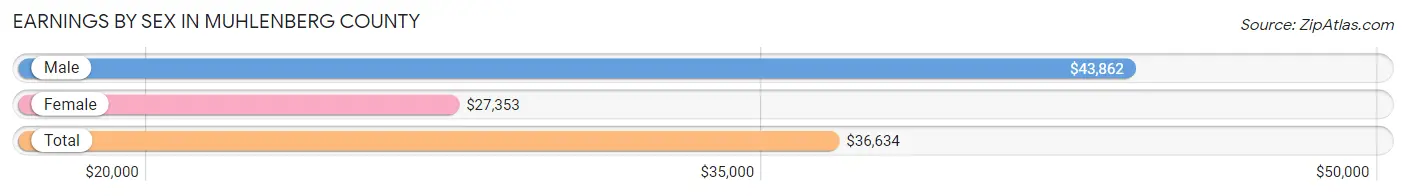
| Sex | Number | Average Earnings |
| Male | 7,763 (55.6%) | $43,862 |
| Female | 6,192 (44.4%) | $27,353 |
| Total | 13,955 (100.0%) | $36,634 |
Earnings by Sex by Income Bracket in Muhlenberg County
The most common earnings brackets in Muhlenberg County are $100,000+ for men (992 | 12.8%) and $25,000 to $29,999 for women (653 | 10.5%).
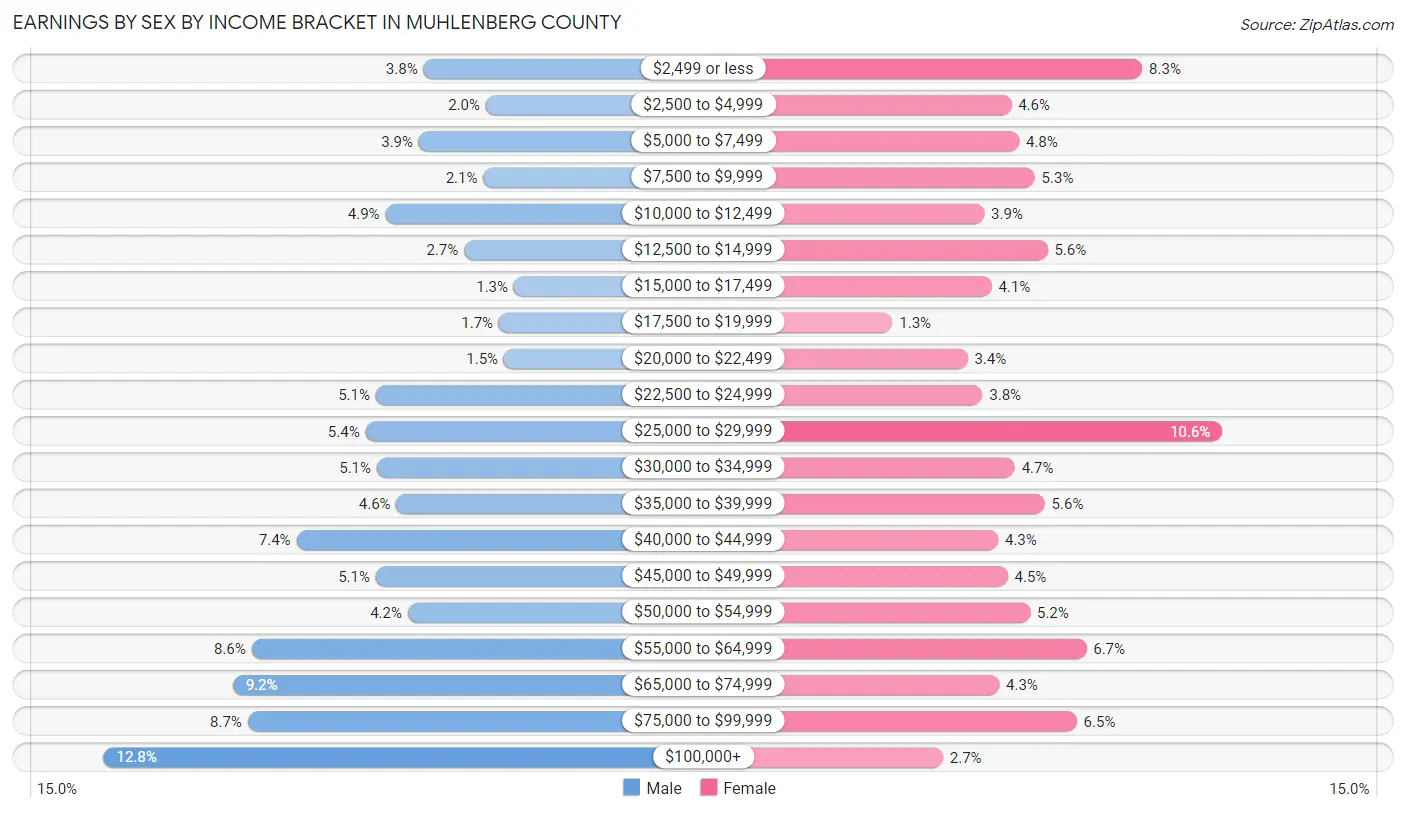
| Income | Male | Female |
| $2,499 or less | 294 (3.8%) | 514 (8.3%) |
| $2,500 to $4,999 | 158 (2.0%) | 286 (4.6%) |
| $5,000 to $7,499 | 304 (3.9%) | 300 (4.8%) |
| $7,500 to $9,999 | 164 (2.1%) | 327 (5.3%) |
| $10,000 to $12,499 | 377 (4.9%) | 239 (3.9%) |
| $12,500 to $14,999 | 206 (2.6%) | 349 (5.6%) |
| $15,000 to $17,499 | 97 (1.3%) | 252 (4.1%) |
| $17,500 to $19,999 | 130 (1.7%) | 79 (1.3%) |
| $20,000 to $22,499 | 119 (1.5%) | 210 (3.4%) |
| $22,500 to $24,999 | 398 (5.1%) | 236 (3.8%) |
| $25,000 to $29,999 | 421 (5.4%) | 653 (10.5%) |
| $30,000 to $34,999 | 396 (5.1%) | 292 (4.7%) |
| $35,000 to $39,999 | 353 (4.5%) | 344 (5.6%) |
| $40,000 to $44,999 | 571 (7.4%) | 263 (4.3%) |
| $45,000 to $49,999 | 398 (5.1%) | 280 (4.5%) |
| $50,000 to $54,999 | 328 (4.2%) | 319 (5.1%) |
| $55,000 to $64,999 | 669 (8.6%) | 417 (6.7%) |
| $65,000 to $74,999 | 710 (9.1%) | 265 (4.3%) |
| $75,000 to $99,999 | 678 (8.7%) | 400 (6.5%) |
| $100,000+ | 992 (12.8%) | 167 (2.7%) |
| Total | 7,763 (100.0%) | 6,192 (100.0%) |
Earnings by Sex by Educational Attainment in Muhlenberg County
Average earnings in Muhlenberg County are $48,121 for men and $30,897 for women, a difference of 35.8%. Men with an educational attainment of bachelor's degree enjoy the highest average annual earnings of $109,133, while those with less than high school education earn the least with $26,606. Women with an educational attainment of graduate degree earn the most with the average annual earnings of $56,843, while those with less than high school education have the smallest earnings of $15,761.
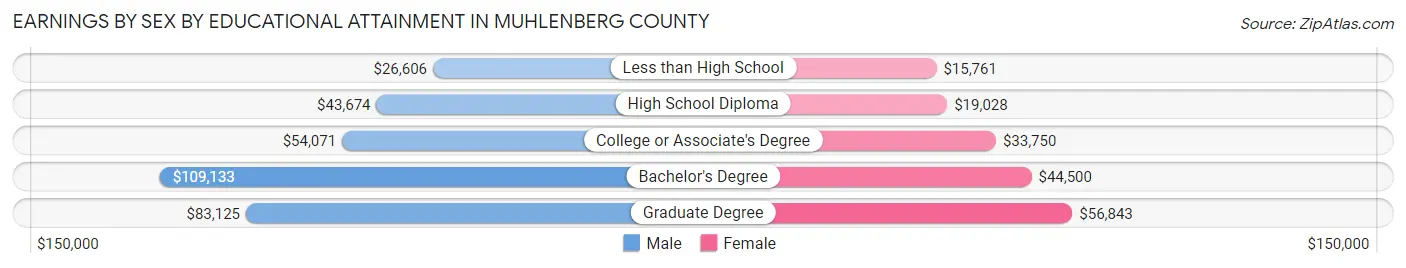
| Educational Attainment | Male Income | Female Income |
| Less than High School | $26,606 | $15,761 |
| High School Diploma | $43,674 | $19,028 |
| College or Associate's Degree | $54,071 | $33,750 |
| Bachelor's Degree | $109,133 | $44,500 |
| Graduate Degree | $83,125 | $56,843 |
| Total | $48,121 | $30,897 |
Family Income in Muhlenberg County
Family Income Brackets in Muhlenberg County
According to the Muhlenberg County family income data, there are 1,491 families falling into the $50,000 to $74,999 income range, which is the most common income bracket and makes up 18.3% of all families. Conversely, the less than $10,000 income bracket is the least frequent group with only 228 families (2.8%) belonging to this category.
| Income Bracket | # Families | % Families |
| Less than $10,000 | 228 | 2.8% |
| $10,000 to $14,999 | 399 | 4.9% |
| $15,000 to $24,999 | 497 | 6.1% |
| $25,000 to $34,999 | 652 | 8.0% |
| $35,000 to $49,999 | 1,157 | 14.2% |
| $50,000 to $74,999 | 1,491 | 18.3% |
| $75,000 to $99,999 | 1,263 | 15.5% |
| $100,000 to $149,999 | 1,190 | 14.6% |
| $150,000 to $199,999 | 652 | 8.0% |
| $200,000+ | 619 | 7.6% |
Family Income by Famaliy Size in Muhlenberg County
6-person families (46 | 0.6%) account for the highest median family income in Muhlenberg County with $250,001 per family, while 6-person families (46 | 0.6%) have the highest median income of $41,667 per family member.
| Income Bracket | # Families | Median Income |
| 2-Person Families | 4,220 (51.8%) | $61,164 |
| 3-Person Families | 2,040 (25.0%) | $70,127 |
| 4-Person Families | 1,287 (15.8%) | $94,761 |
| 5-Person Families | 477 (5.9%) | $79,375 |
| 6-Person Families | 46 (0.6%) | $250,001 |
| 7+ Person Families | 79 (1.0%) | $47,986 |
| Total | 8,149 (100.0%) | $69,150 |
Family Income by Number of Earners in Muhlenberg County
The median family income in Muhlenberg County is $69,150, with families comprising 3+ earners (592) having the highest median family income of $166,737, while families with no earners (1,835) have the lowest median family income of $37,055, accounting for 7.3% and 22.5% of families, respectively.
| Number of Earners | # Families | Median Income |
| No Earners | 1,835 (22.5%) | $37,055 |
| 1 Earner | 2,559 (31.4%) | $49,142 |
| 2 Earners | 3,163 (38.8%) | $101,369 |
| 3+ Earners | 592 (7.3%) | $166,737 |
| Total | 8,149 (100.0%) | $69,150 |
Household Income in Muhlenberg County
Household Income Brackets in Muhlenberg County
With 1,813 households falling in the category, the $50,000 to $74,999 income range is the most frequent in Muhlenberg County, accounting for 15.3% of all households. In contrast, only 640 households (5.4%) fall into the less than $10,000 income bracket, making it the least populous group.
| Income Bracket | # Households | % Households |
| Less than $10,000 | 640 | 5.4% |
| $10,000 to $14,999 | 995 | 8.4% |
| $15,000 to $24,999 | 1,256 | 10.6% |
| $25,000 to $34,999 | 1,291 | 10.9% |
| $35,000 to $49,999 | 1,670 | 14.1% |
| $50,000 to $74,999 | 1,813 | 15.3% |
| $75,000 to $99,999 | 1,445 | 12.2% |
| $100,000 to $149,999 | 1,386 | 11.7% |
| $150,000 to $199,999 | 699 | 5.9% |
| $200,000+ | 663 | 5.6% |
Household Income by Householder Age in Muhlenberg County
The median household income in Muhlenberg County is $50,935, with the highest median household income of $65,658 found in the 45 to 64 years age bracket for the primary householder. A total of 4,756 households (40.2%) fall into this category. Meanwhile, the 65+ years age bracket for the primary householder has the lowest median household income of $37,247, with 3,768 households (31.8%) in this group.
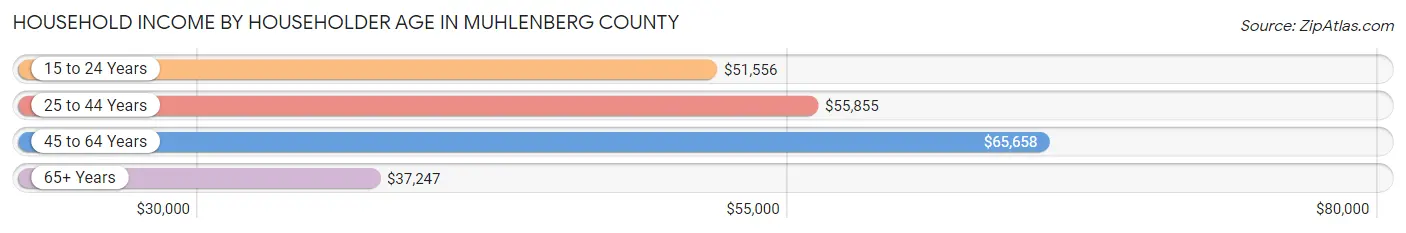
| Income Bracket | # Households | Median Income |
| 15 to 24 Years | 472 (4.0%) | $51,556 |
| 25 to 44 Years | 2,851 (24.1%) | $55,855 |
| 45 to 64 Years | 4,756 (40.2%) | $65,658 |
| 65+ Years | 3,768 (31.8%) | $37,247 |
| Total | 11,847 (100.0%) | $50,935 |
Poverty in Muhlenberg County
Income Below Poverty by Sex and Age in Muhlenberg County
With 14.9% poverty level for males and 17.8% for females among the residents of Muhlenberg County, 16 and 17 year old males and 15 year old females are the most vulnerable to poverty, with 174 males (38.9%) and 73 females (31.5%) in their respective age groups living below the poverty level.
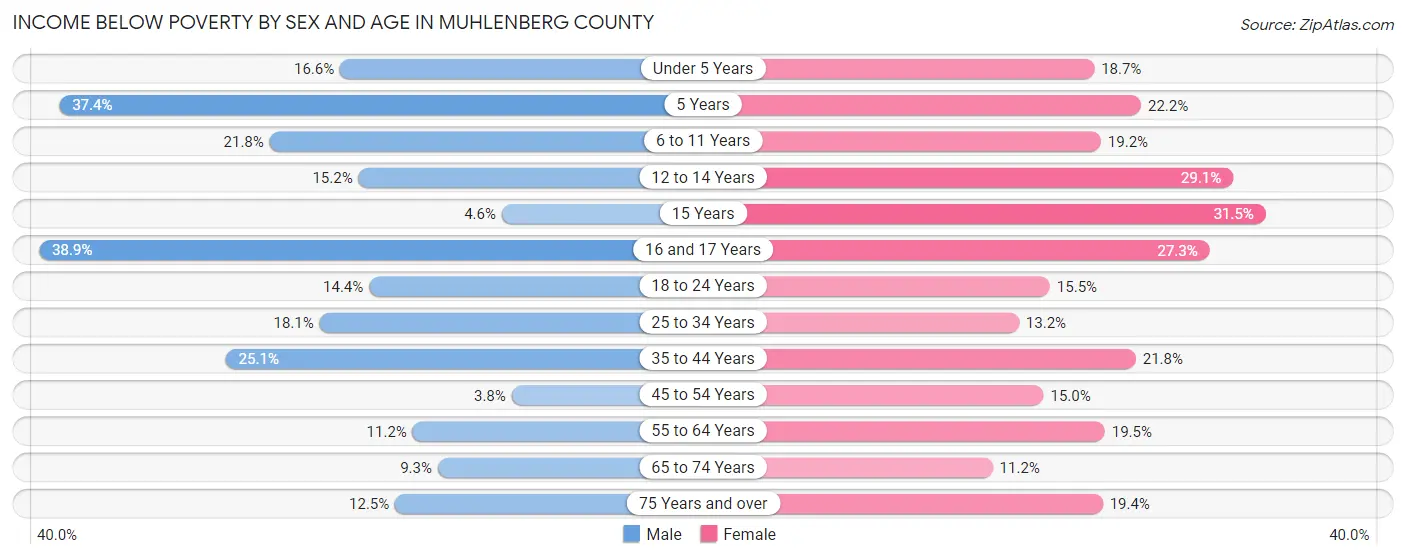
| Age Bracket | Male | Female |
| Under 5 Years | 135 (16.6%) | 163 (18.7%) |
| 5 Years | 64 (37.4%) | 38 (22.2%) |
| 6 to 11 Years | 227 (21.8%) | 207 (19.2%) |
| 12 to 14 Years | 87 (15.2%) | 104 (29.0%) |
| 15 Years | 8 (4.6%) | 73 (31.5%) |
| 16 and 17 Years | 174 (38.9%) | 89 (27.3%) |
| 18 to 24 Years | 180 (14.4%) | 169 (15.4%) |
| 25 to 34 Years | 305 (18.1%) | 229 (13.2%) |
| 35 to 44 Years | 427 (25.1%) | 396 (21.8%) |
| 45 to 54 Years | 87 (3.8%) | 282 (15.0%) |
| 55 to 64 Years | 224 (11.2%) | 406 (19.5%) |
| 65 to 74 Years | 160 (9.3%) | 193 (11.2%) |
| 75 Years and over | 116 (12.5%) | 297 (19.4%) |
| Total | 2,194 (14.9%) | 2,646 (17.8%) |
Income Above Poverty by Sex and Age in Muhlenberg County
According to the poverty statistics in Muhlenberg County, males aged 45 to 54 years and females aged 65 to 74 years are the age groups that are most secure financially, with 96.2% of males and 88.8% of females in these age groups living above the poverty line.
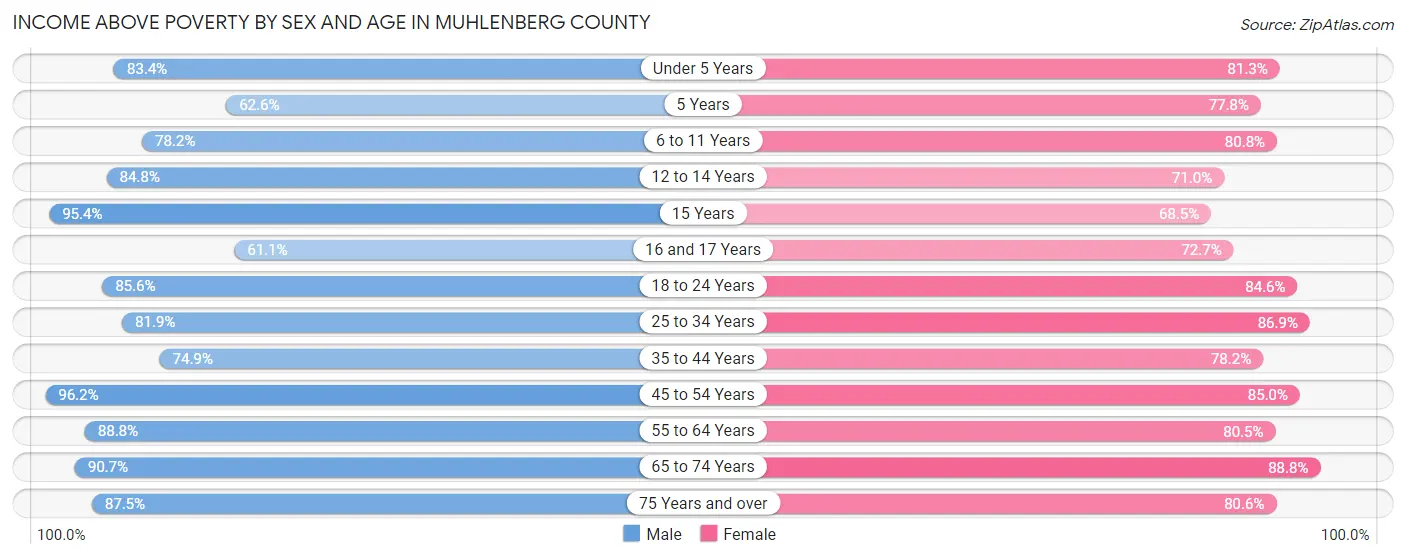
| Age Bracket | Male | Female |
| Under 5 Years | 679 (83.4%) | 707 (81.3%) |
| 5 Years | 107 (62.6%) | 133 (77.8%) |
| 6 to 11 Years | 814 (78.2%) | 869 (80.8%) |
| 12 to 14 Years | 485 (84.8%) | 254 (71.0%) |
| 15 Years | 167 (95.4%) | 159 (68.5%) |
| 16 and 17 Years | 273 (61.1%) | 237 (72.7%) |
| 18 to 24 Years | 1,068 (85.6%) | 925 (84.6%) |
| 25 to 34 Years | 1,380 (81.9%) | 1,512 (86.9%) |
| 35 to 44 Years | 1,276 (74.9%) | 1,418 (78.2%) |
| 45 to 54 Years | 2,176 (96.2%) | 1,601 (85.0%) |
| 55 to 64 Years | 1,777 (88.8%) | 1,673 (80.5%) |
| 65 to 74 Years | 1,557 (90.7%) | 1,530 (88.8%) |
| 75 Years and over | 813 (87.5%) | 1,236 (80.6%) |
| Total | 12,572 (85.1%) | 12,254 (82.2%) |
Income Below Poverty Among Married-Couple Families in Muhlenberg County
The poverty statistics for married-couple families in Muhlenberg County show that 6.5% or 431 of the total 6,595 families live below the poverty line. Families with 5 or more children have the highest poverty rate of 42.9%, comprising of 12 families. On the other hand, families with no children have the lowest poverty rate of 5.0%, which includes 208 families.
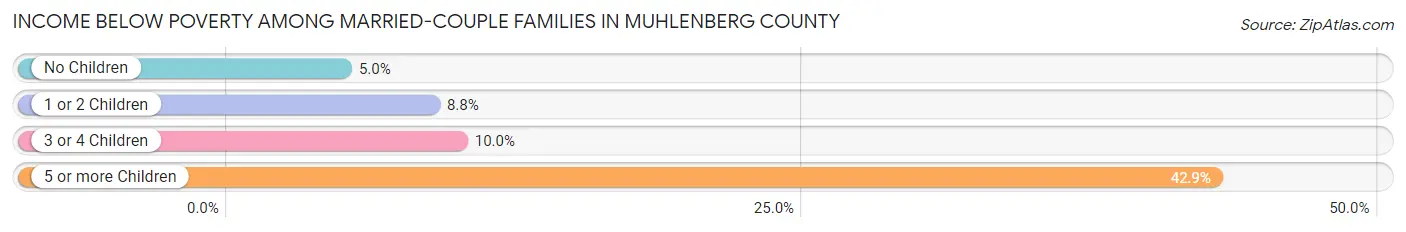
| Children | Above Poverty | Below Poverty |
| No Children | 3,988 (95.0%) | 208 (5.0%) |
| 1 or 2 Children | 1,962 (91.2%) | 189 (8.8%) |
| 3 or 4 Children | 198 (90.0%) | 22 (10.0%) |
| 5 or more Children | 16 (57.1%) | 12 (42.9%) |
| Total | 6,164 (93.5%) | 431 (6.5%) |
Income Below Poverty Among Single-Parent Households in Muhlenberg County
According to the poverty data in Muhlenberg County, 13.3% or 75 single-father households and 40.2% or 398 single-mother households are living below the poverty line. Among single-father households, those with 1 or 2 children have the highest poverty rate, with 69 households (31.8%) experiencing poverty. Likewise, among single-mother households, those with 3 or 4 children have the highest poverty rate, with 88 households (100.0%) falling below the poverty line.
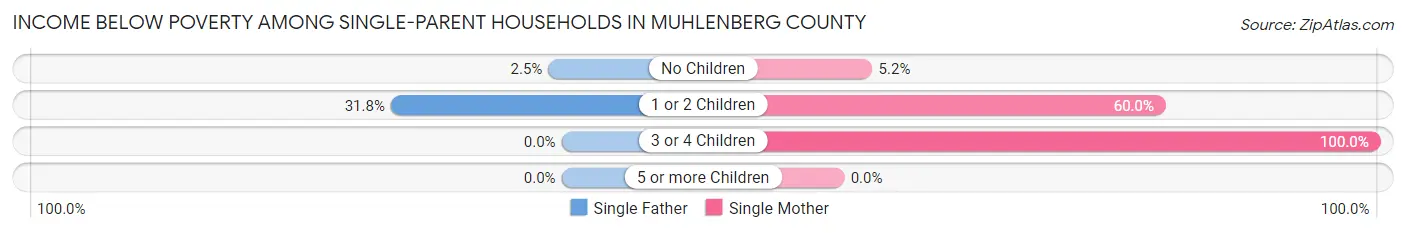
| Children | Single Father | Single Mother |
| No Children | 6 (2.5%) | 22 (5.2%) |
| 1 or 2 Children | 69 (31.8%) | 288 (60.0%) |
| 3 or 4 Children | 0 (0.0%) | 88 (100.0%) |
| 5 or more Children | 0 (0.0%) | 0 (0.0%) |
| Total | 75 (13.3%) | 398 (40.2%) |
Income Below Poverty Among Married-Couple vs Single-Parent Households in Muhlenberg County
The poverty data for Muhlenberg County shows that 431 of the married-couple family households (6.5%) and 473 of the single-parent households (30.4%) are living below the poverty level. Within the married-couple family households, those with 5 or more children have the highest poverty rate, with 12 households (42.9%) falling below the poverty line. Among the single-parent households, those with 1 or 2 children have the highest poverty rate, with 357 household (51.2%) living below poverty.
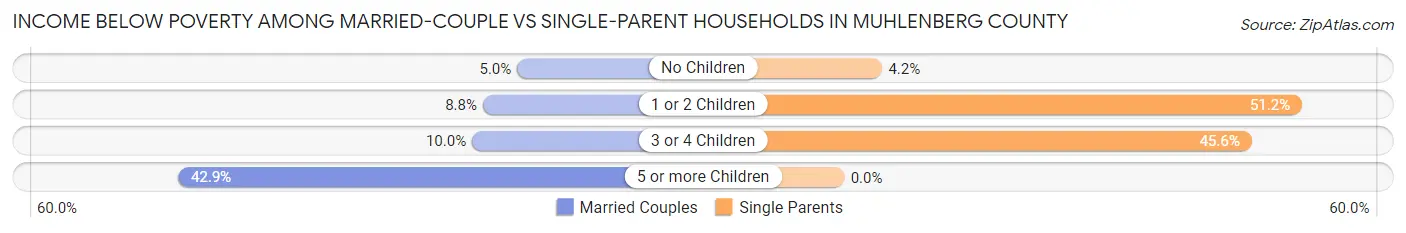
| Children | Married-Couple Families | Single-Parent Households |
| No Children | 208 (5.0%) | 28 (4.2%) |
| 1 or 2 Children | 189 (8.8%) | 357 (51.2%) |
| 3 or 4 Children | 22 (10.0%) | 88 (45.6%) |
| 5 or more Children | 12 (42.9%) | 0 (0.0%) |
| Total | 431 (6.5%) | 473 (30.4%) |
Race in Muhlenberg County
The most populous races in Muhlenberg County are White / Caucasian (28,586 | 93.0%), Two or more Races (879 | 2.9%), and Black / African American (722 | 2.4%).
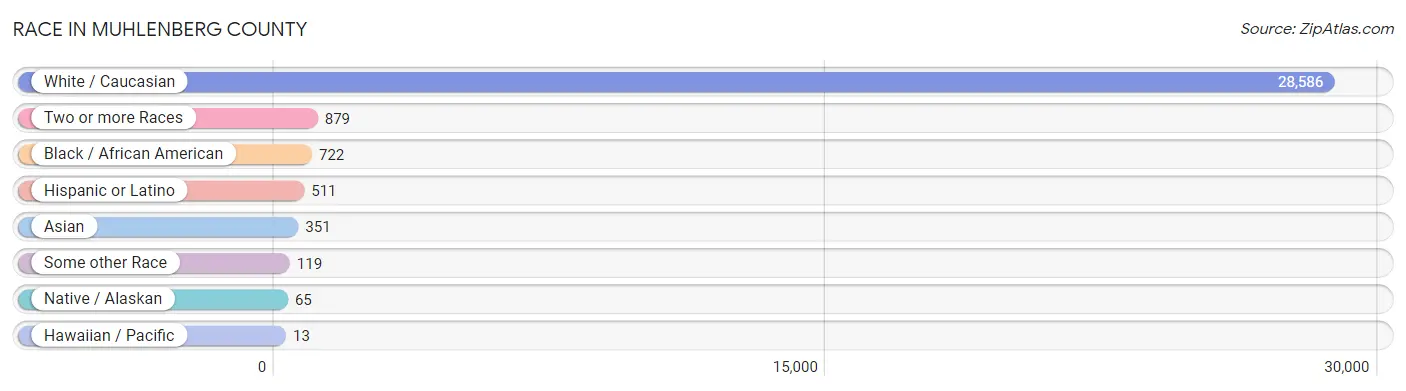
| Race | # Population | % Population |
| Asian | 351 | 1.1% |
| Black / African American | 722 | 2.4% |
| Hawaiian / Pacific | 13 | 0.0% |
| Hispanic or Latino | 511 | 1.7% |
| Native / Alaskan | 65 | 0.2% |
| White / Caucasian | 28,586 | 93.0% |
| Two or more Races | 879 | 2.9% |
| Some other Race | 119 | 0.4% |
| Total | 30,735 | 100.0% |
Ancestry in Muhlenberg County
The most populous ancestries reported in Muhlenberg County are American (4,453 | 14.5%), English (3,802 | 12.4%), Irish (2,617 | 8.5%), German (2,133 | 6.9%), and Scottish (648 | 2.1%), together accounting for 44.4% of all Muhlenberg County residents.
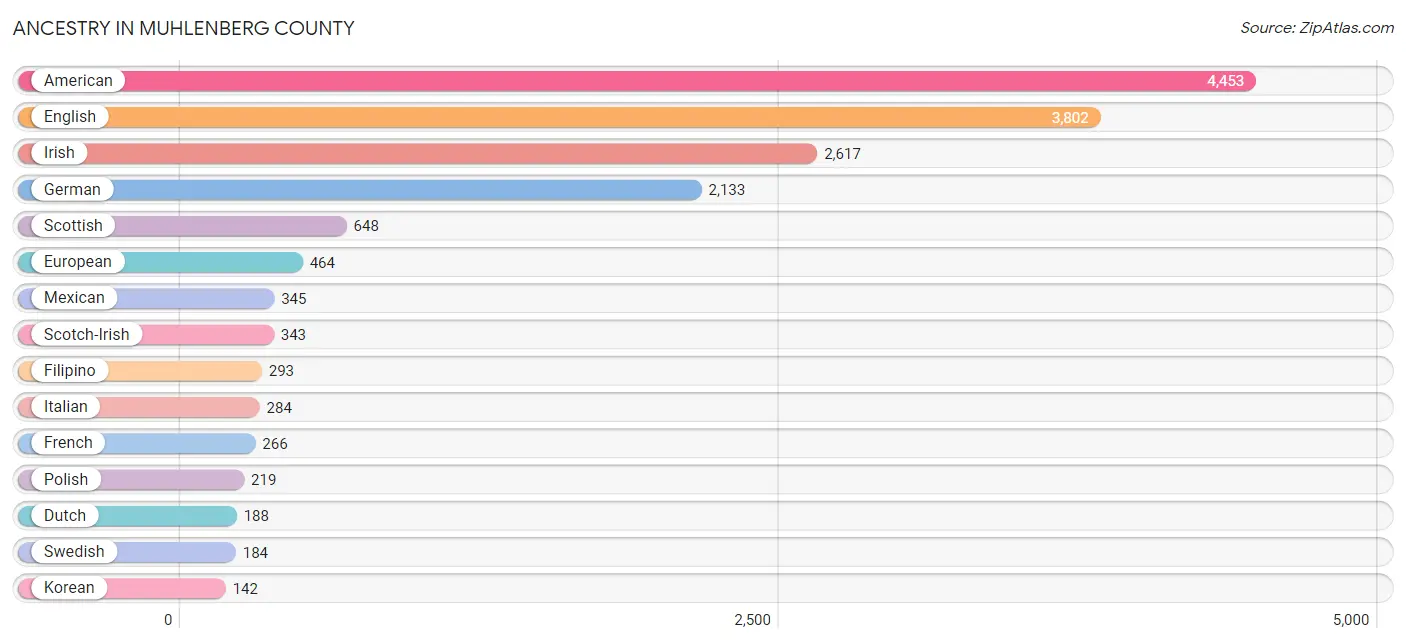
| Ancestry | # Population | % Population |
| African | 45 | 0.2% |
| American | 4,453 | 14.5% |
| Arab | 24 | 0.1% |
| Austrian | 5 | 0.0% |
| Barbadian | 16 | 0.1% |
| Blackfeet | 5 | 0.0% |
| British | 90 | 0.3% |
| Cajun | 2 | 0.0% |
| Central American | 50 | 0.2% |
| Cherokee | 35 | 0.1% |
| Chippewa | 53 | 0.2% |
| Croatian | 6 | 0.0% |
| Cuban | 38 | 0.1% |
| Czech | 3 | 0.0% |
| Dominican | 16 | 0.1% |
| Dutch | 188 | 0.6% |
| Eastern European | 18 | 0.1% |
| English | 3,802 | 12.4% |
| European | 464 | 1.5% |
| Filipino | 293 | 0.9% |
| French | 266 | 0.9% |
| French Canadian | 14 | 0.1% |
| German | 2,133 | 6.9% |
| Greek | 88 | 0.3% |
| Guamanian / Chamorro | 13 | 0.0% |
| Guatemalan | 41 | 0.1% |
| Hungarian | 11 | 0.0% |
| Indian (Asian) | 2 | 0.0% |
| Irish | 2,617 | 8.5% |
| Italian | 284 | 0.9% |
| Korean | 142 | 0.5% |
| Mexican | 345 | 1.1% |
| Nigerian | 2 | 0.0% |
| Northern European | 18 | 0.1% |
| Norwegian | 95 | 0.3% |
| Polish | 219 | 0.7% |
| Puerto Rican | 41 | 0.1% |
| Romanian | 24 | 0.1% |
| Salvadoran | 9 | 0.0% |
| Scandinavian | 41 | 0.1% |
| Scotch-Irish | 343 | 1.1% |
| Scottish | 648 | 2.1% |
| Subsaharan African | 71 | 0.2% |
| Swedish | 184 | 0.6% |
| Swiss | 2 | 0.0% |
| Thai | 82 | 0.3% |
| U.S. Virgin Islander | 4 | 0.0% |
| Ukrainian | 56 | 0.2% |
| Welsh | 71 | 0.2% | View All 49 Rows |
Immigrants in Muhlenberg County
The most numerous immigrant groups reported in Muhlenberg County came from Asia (394 | 1.3%), China (300 | 1.0%), Eastern Asia (300 | 1.0%), Taiwan (293 | 0.9%), and Latin America (219 | 0.7%), together accounting for 4.9% of all Muhlenberg County residents.
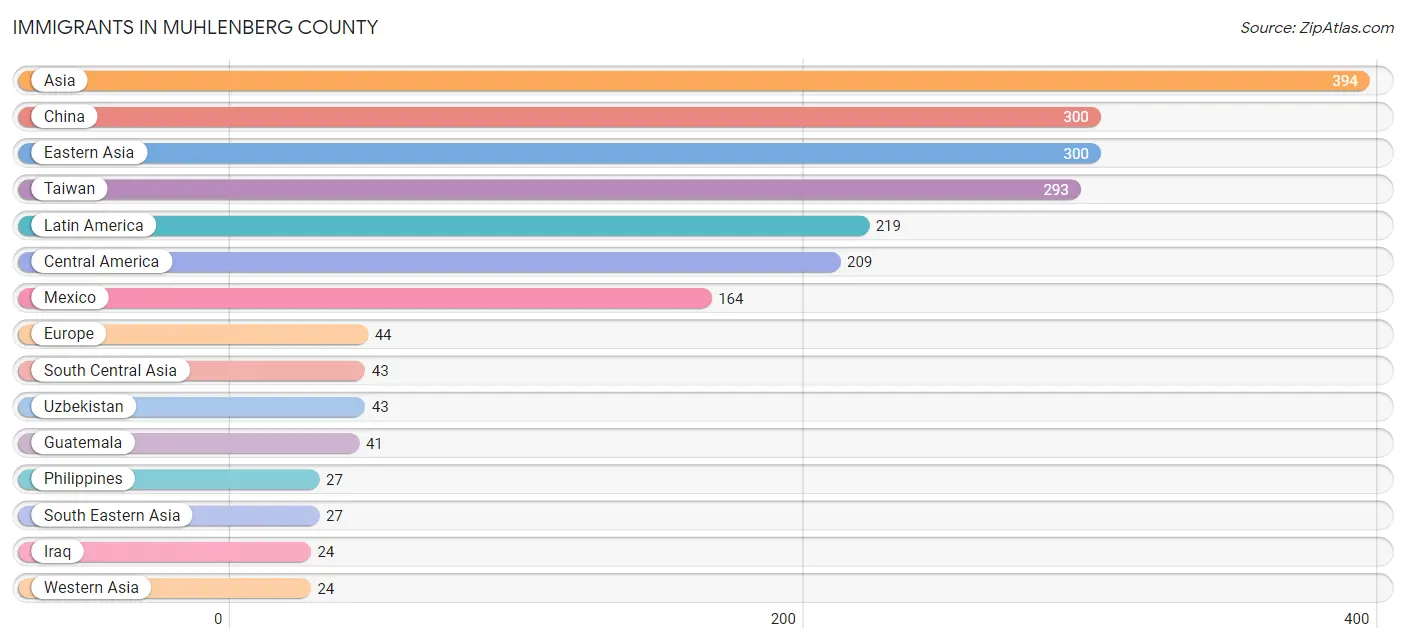
| Immigration Origin | # Population | % Population |
| Asia | 394 | 1.3% |
| Barbados | 10 | 0.0% |
| Caribbean | 10 | 0.0% |
| Central America | 209 | 0.7% |
| China | 300 | 1.0% |
| Croatia | 6 | 0.0% |
| Eastern Asia | 300 | 1.0% |
| Eastern Europe | 22 | 0.1% |
| El Salvador | 4 | 0.0% |
| Europe | 44 | 0.1% |
| Germany | 22 | 0.1% |
| Guatemala | 41 | 0.1% |
| Iraq | 24 | 0.1% |
| Latin America | 219 | 0.7% |
| Mexico | 164 | 0.5% |
| Philippines | 27 | 0.1% |
| Russia | 16 | 0.1% |
| South Central Asia | 43 | 0.1% |
| South Eastern Asia | 27 | 0.1% |
| Taiwan | 293 | 0.9% |
| Uzbekistan | 43 | 0.1% |
| Western Asia | 24 | 0.1% |
| Western Europe | 22 | 0.1% | View All 23 Rows |
Sex and Age in Muhlenberg County
Sex and Age in Muhlenberg County
The most populous age groups in Muhlenberg County are 50 to 54 Years (1,329 | 8.5%) for men and 55 to 59 Years (1,104 | 7.3%) for women.
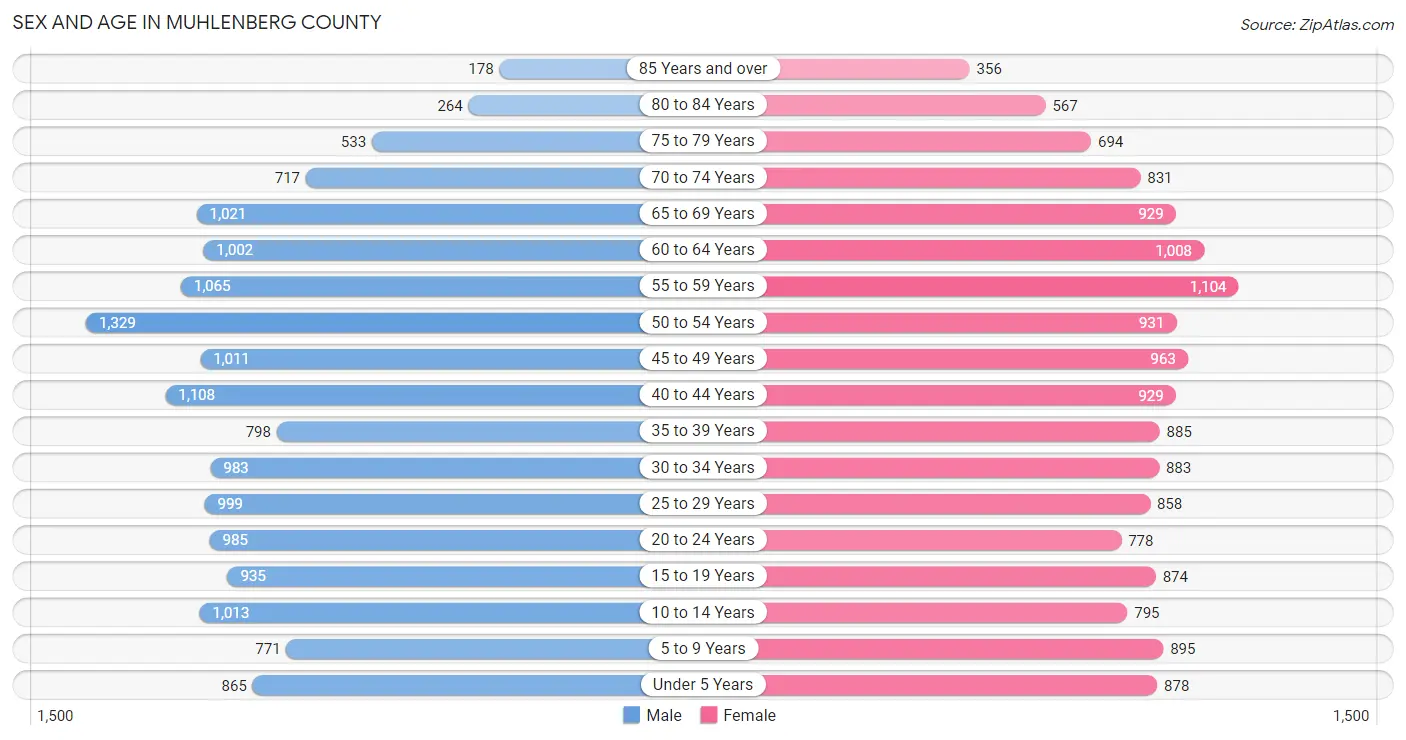
| Age Bracket | Male | Female |
| Under 5 Years | 865 (5.6%) | 878 (5.8%) |
| 5 to 9 Years | 771 (5.0%) | 895 (5.9%) |
| 10 to 14 Years | 1,013 (6.5%) | 795 (5.2%) |
| 15 to 19 Years | 935 (6.0%) | 874 (5.8%) |
| 20 to 24 Years | 985 (6.3%) | 778 (5.1%) |
| 25 to 29 Years | 999 (6.4%) | 858 (5.7%) |
| 30 to 34 Years | 983 (6.3%) | 883 (5.8%) |
| 35 to 39 Years | 798 (5.1%) | 885 (5.8%) |
| 40 to 44 Years | 1,108 (7.1%) | 929 (6.1%) |
| 45 to 49 Years | 1,011 (6.5%) | 963 (6.4%) |
| 50 to 54 Years | 1,329 (8.5%) | 931 (6.1%) |
| 55 to 59 Years | 1,065 (6.8%) | 1,104 (7.3%) |
| 60 to 64 Years | 1,002 (6.4%) | 1,008 (6.7%) |
| 65 to 69 Years | 1,021 (6.6%) | 929 (6.1%) |
| 70 to 74 Years | 717 (4.6%) | 831 (5.5%) |
| 75 to 79 Years | 533 (3.4%) | 694 (4.6%) |
| 80 to 84 Years | 264 (1.7%) | 567 (3.7%) |
| 85 Years and over | 178 (1.1%) | 356 (2.4%) |
| Total | 15,577 (100.0%) | 15,158 (100.0%) |
Families and Households in Muhlenberg County
Median Family Size in Muhlenberg County
The median family size in Muhlenberg County is 3.02 persons per family, with single male/father families (564 | 6.9%) accounting for the largest median family size of 3.24 persons per family. On the other hand, single female/mother families (990 | 12.1%) represent the smallest median family size with 2.93 persons per family.
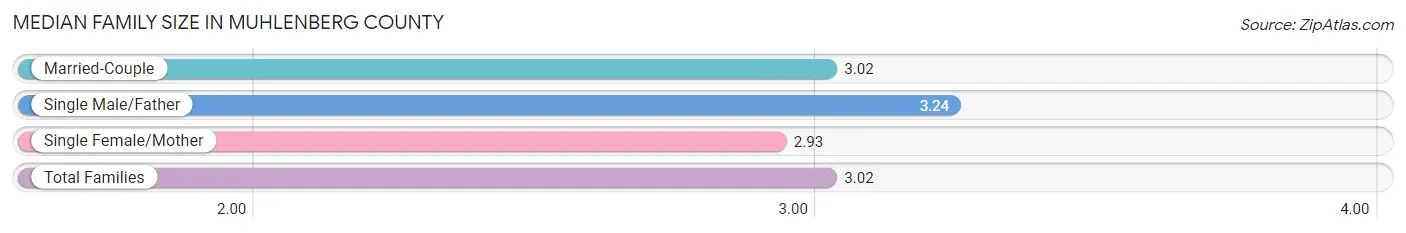
| Family Type | # Families | Family Size |
| Married-Couple | 6,595 (80.9%) | 3.02 |
| Single Male/Father | 564 (6.9%) | 3.24 |
| Single Female/Mother | 990 (12.1%) | 2.93 |
| Total Families | 8,149 (100.0%) | 3.02 |
Median Household Size in Muhlenberg County
The median household size in Muhlenberg County is 2.51 persons per household, with single male/father households (564 | 4.8%) accounting for the largest median household size of 3.51 persons per household. non-family households (3,698 | 31.2%) represent the smallest median household size with 1.27 persons per household.
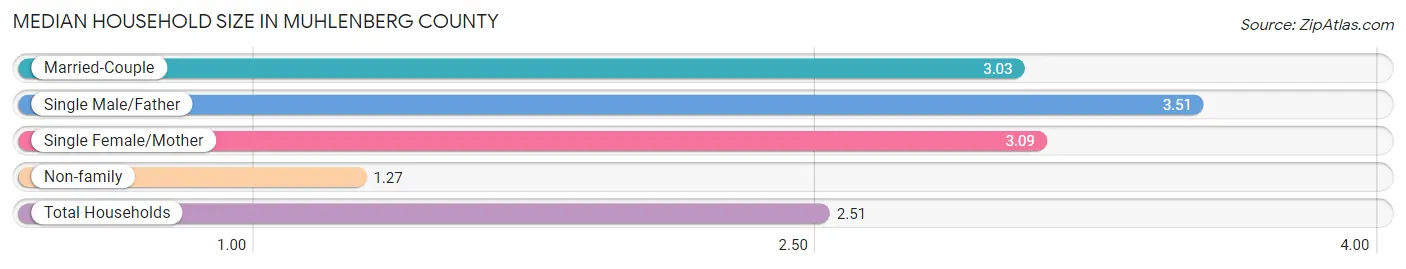
| Household Type | # Households | Household Size |
| Married-Couple | 6,595 (55.7%) | 3.03 |
| Single Male/Father | 564 (4.8%) | 3.51 |
| Single Female/Mother | 990 (8.4%) | 3.09 |
| Non-family | 3,698 (31.2%) | 1.27 |
| Total Households | 11,847 (100.0%) | 2.51 |
Household Size by Marriage Status in Muhlenberg County
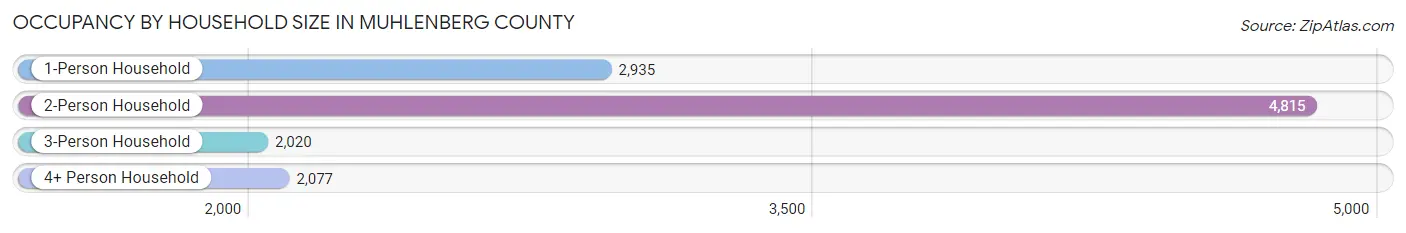
Out of a total of 11,847 households in Muhlenberg County, 8,149 (68.8%) are family households, while 3,698 (31.2%) are nonfamily households. The most numerous type of family households are 2-person households, comprising 4,138, and the most common type of nonfamily households are 1-person households, comprising 2,935.
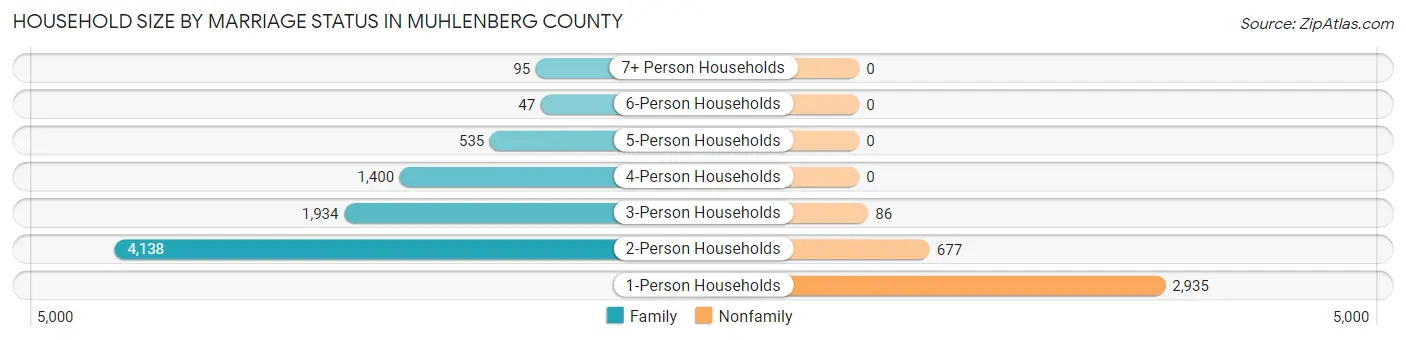
| Household Size | Family Households | Nonfamily Households |
| 1-Person Households | - | 2,935 (24.8%) |
| 2-Person Households | 4,138 (34.9%) | 677 (5.7%) |
| 3-Person Households | 1,934 (16.3%) | 86 (0.7%) |
| 4-Person Households | 1,400 (11.8%) | 0 (0.0%) |
| 5-Person Households | 535 (4.5%) | 0 (0.0%) |
| 6-Person Households | 47 (0.4%) | 0 (0.0%) |
| 7+ Person Households | 95 (0.8%) | 0 (0.0%) |
| Total | 8,149 (68.8%) | 3,698 (31.2%) |
Female Fertility in Muhlenberg County
Fertility by Age in Muhlenberg County
Average fertility rate in Muhlenberg County is 68.0 births per 1,000 women. Women in the age bracket of 20 to 34 years have the highest fertility rate with 158.0 births per 1,000 women. Women in the age bracket of 20 to 34 years acount for 91.7% of all women with births.
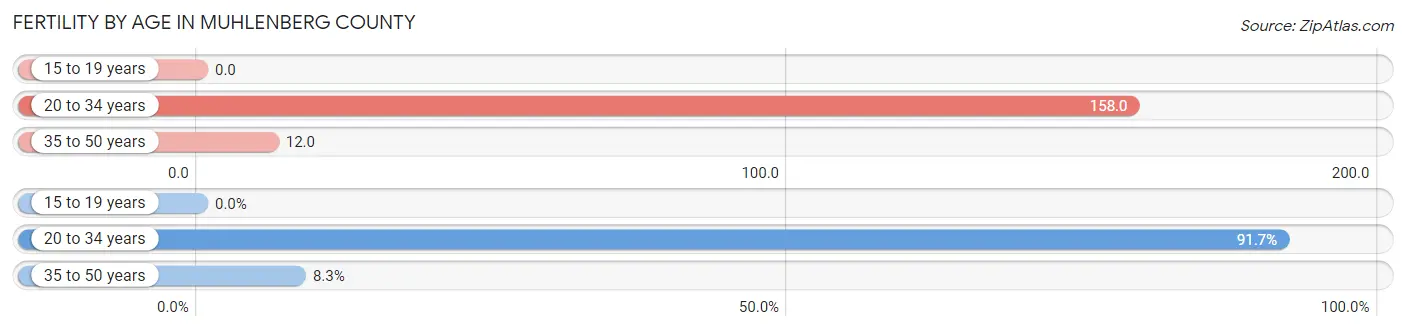
| Age Bracket | Women with Births | Births / 1,000 Women |
| 15 to 19 years | 0 (0.0%) | 0.0 |
| 20 to 34 years | 397 (91.7%) | 158.0 |
| 35 to 50 years | 36 (8.3%) | 12.0 |
| Total | 433 (100.0%) | 68.0 |
Fertility by Age by Marriage Status in Muhlenberg County
85.2% of women with births (433) in Muhlenberg County are married. The highest percentage of unmarried women with births falls into 35 to 50 years age bracket with 38.9% of them unmarried at the time of birth, while the lowest percentage of unmarried women with births belong to 20 to 34 years age bracket with 12.6% of them unmarried.
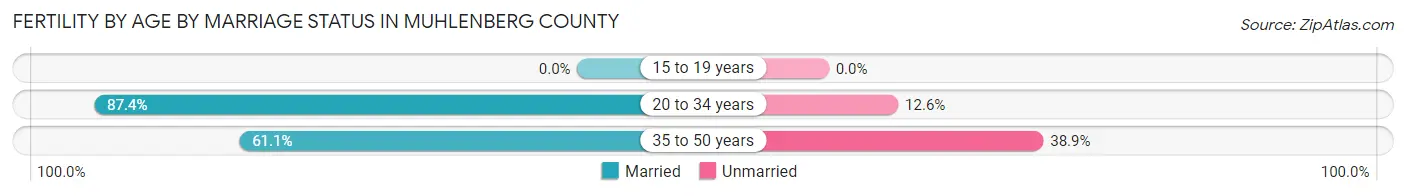
| Age Bracket | Married | Unmarried |
| 15 to 19 years | 0 (0.0%) | 0 (0.0%) |
| 20 to 34 years | 347 (87.4%) | 50 (12.6%) |
| 35 to 50 years | 22 (61.1%) | 14 (38.9%) |
| Total | 369 (85.2%) | 64 (14.8%) |
Fertility by Education in Muhlenberg County
Average fertility rate in Muhlenberg County is 68.0 births per 1,000 women. Women with the education attainment of bachelor's degree have the highest fertility rate of 114.0 births per 1,000 women, while women with the education attainment of college or associate's degree have the lowest fertility at 48.0 births per 1,000 women. Women with the education attainment of high school diploma represent 35.6% of all women with births.
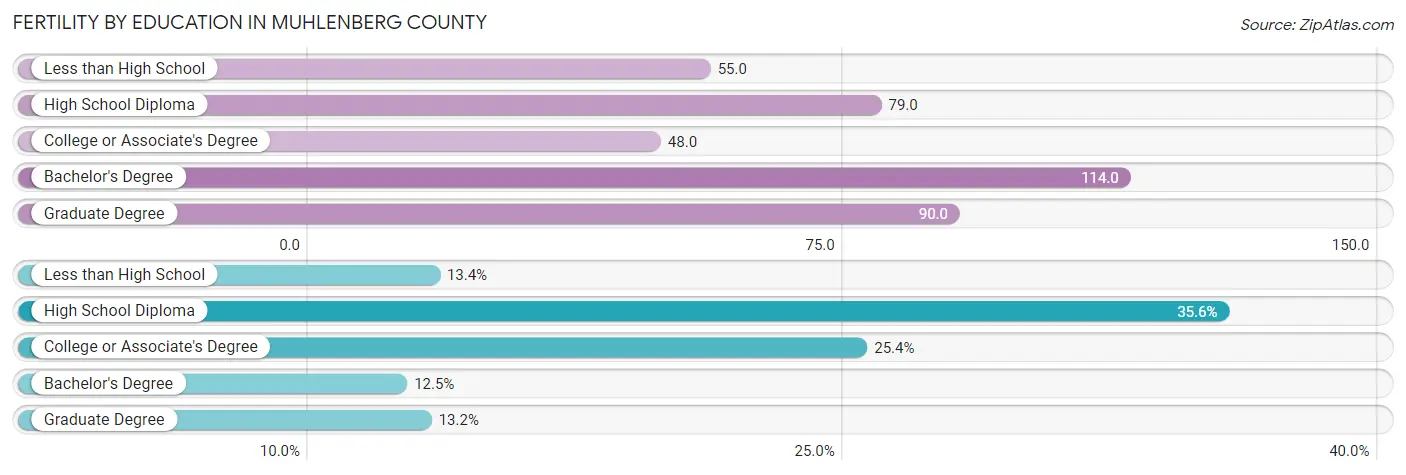
| Educational Attainment | Women with Births | Births / 1,000 Women |
| Less than High School | 58 (13.4%) | 55.0 |
| High School Diploma | 154 (35.6%) | 79.0 |
| College or Associate's Degree | 110 (25.4%) | 48.0 |
| Bachelor's Degree | 54 (12.5%) | 114.0 |
| Graduate Degree | 57 (13.2%) | 90.0 |
| Total | 433 (100.0%) | 68.0 |
Fertility by Education by Marriage Status in Muhlenberg County
14.8% of women with births in Muhlenberg County are unmarried. Women with the educational attainment of bachelor's degree are most likely to be married with 100.0% of them married at childbirth, while women with the educational attainment of less than high school are least likely to be married with 29.3% of them unmarried at childbirth.
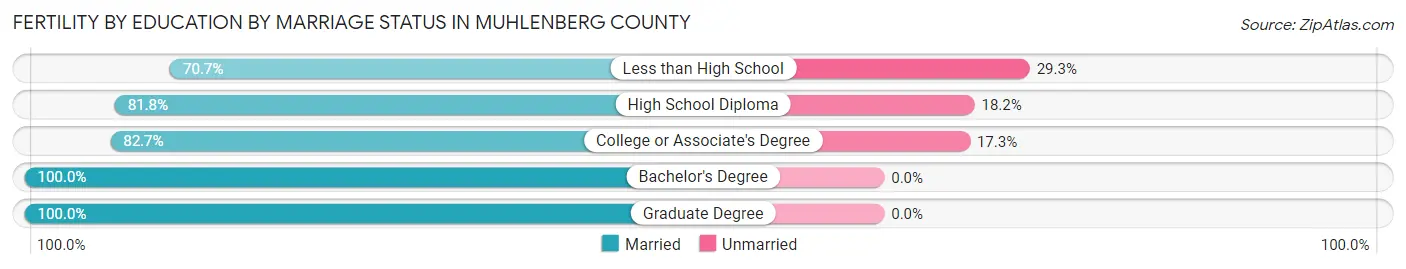
| Educational Attainment | Married | Unmarried |
| Less than High School | 41 (70.7%) | 17 (29.3%) |
| High School Diploma | 126 (81.8%) | 28 (18.2%) |
| College or Associate's Degree | 91 (82.7%) | 19 (17.3%) |
| Bachelor's Degree | 54 (100.0%) | 0 (0.0%) |
| Graduate Degree | 57 (100.0%) | 0 (0.0%) |
| Total | 369 (85.2%) | 64 (14.8%) |
Employment Characteristics in Muhlenberg County
Employment by Class of Employer in Muhlenberg County
Among the 12,094 employed individuals in Muhlenberg County, private company employees (8,142 | 67.3%), local government employees (905 | 7.5%), and not-for-profit organizations (837 | 6.9%) make up the most common classes of employment.
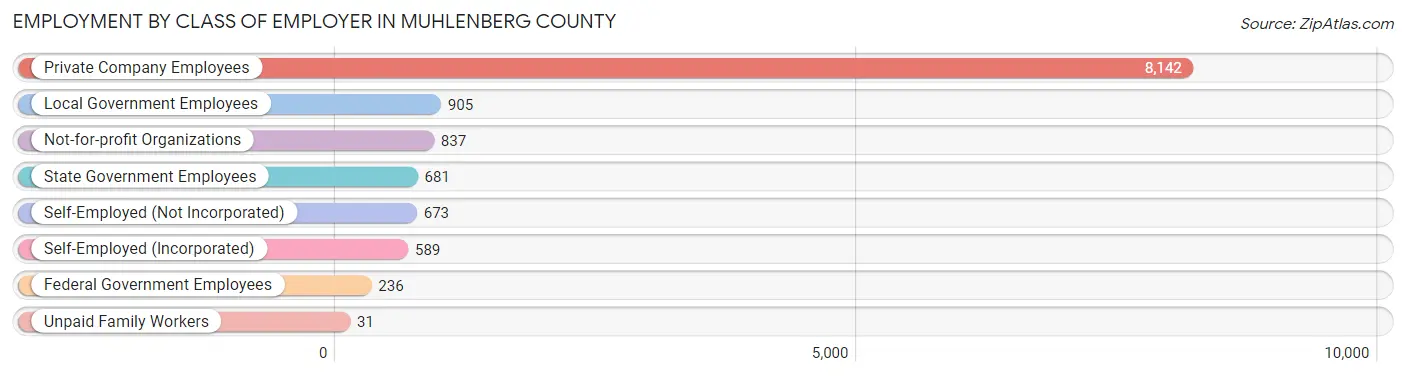
| Employer Class | # Employees | % Employees |
| Private Company Employees | 8,142 | 67.3% |
| Self-Employed (Incorporated) | 589 | 4.9% |
| Self-Employed (Not Incorporated) | 673 | 5.6% |
| Not-for-profit Organizations | 837 | 6.9% |
| Local Government Employees | 905 | 7.5% |
| State Government Employees | 681 | 5.6% |
| Federal Government Employees | 236 | 1.9% |
| Unpaid Family Workers | 31 | 0.3% |
| Total | 12,094 | 100.0% |
Employment Status by Age in Muhlenberg County
According to the labor force statistics for Muhlenberg County, out of the total population over 16 years of age (25,111), 52.5% or 13,183 individuals are in the labor force, with 4.9% or 646 of them unemployed. The age group with the highest labor force participation rate is 25 to 29 years, with 75.8% or 1,408 individuals in the labor force. Within the labor force, the 25 to 29 years age range has the highest percentage of unemployed individuals, with 14.5% or 204 of them being unemployed.
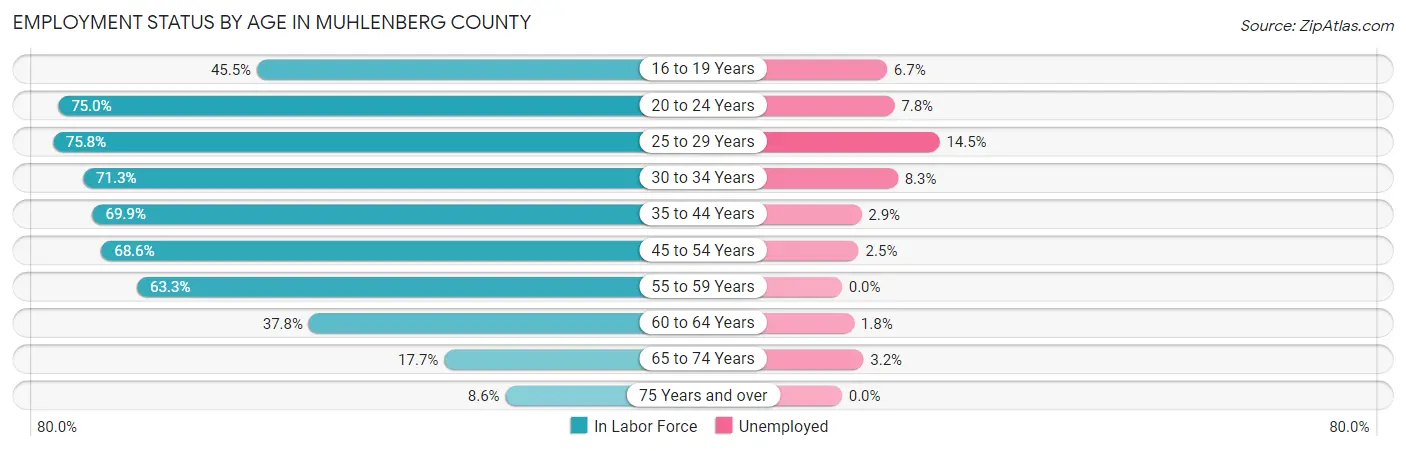
| Age Bracket | In Labor Force | Unemployed |
| 16 to 19 Years | 638 (45.5%) | 43 (6.7%) |
| 20 to 24 Years | 1,322 (75.0%) | 103 (7.8%) |
| 25 to 29 Years | 1,408 (75.8%) | 204 (14.5%) |
| 30 to 34 Years | 1,330 (71.3%) | 110 (8.3%) |
| 35 to 44 Years | 2,600 (69.9%) | 75 (2.9%) |
| 45 to 54 Years | 2,905 (68.6%) | 73 (2.5%) |
| 55 to 59 Years | 1,373 (63.3%) | 0 (0.0%) |
| 60 to 64 Years | 760 (37.8%) | 14 (1.8%) |
| 65 to 74 Years | 619 (17.7%) | 20 (3.2%) |
| 75 Years and over | 223 (8.6%) | 0 (0.0%) |
| Total | 13,183 (52.5%) | 646 (4.9%) |
Employment Status by Educational Attainment in Muhlenberg County
According to labor force statistics for Muhlenberg County, 65.4% of individuals (10,370) out of the total population between 25 and 64 years of age (15,856) are in the labor force, with 4.6% or 477 of them being unemployed. The group with the highest labor force participation rate are those with the educational attainment of bachelor's degree or higher, with 92.2% or 2,244 individuals in the labor force. Within the labor force, individuals with college / associate degree education have the highest percentage of unemployment, with 6.4% or 230 of them being unemployed.
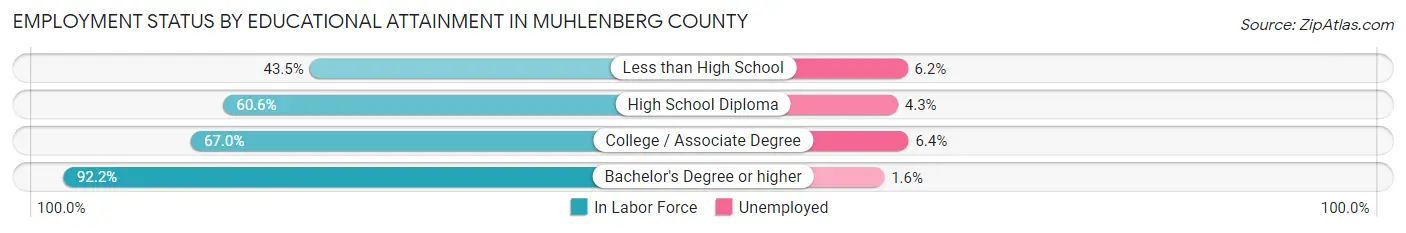
| Educational Attainment | In Labor Force | Unemployed |
| Less than High School | 882 (43.5%) | 126 (6.2%) |
| High School Diploma | 3,661 (60.6%) | 260 (4.3%) |
| College / Associate Degree | 3,586 (67.0%) | 343 (6.4%) |
| Bachelor's Degree or higher | 2,244 (92.2%) | 39 (1.6%) |
| Total | 10,370 (65.4%) | 729 (4.6%) |
Employment Occupations by Sex in Muhlenberg County
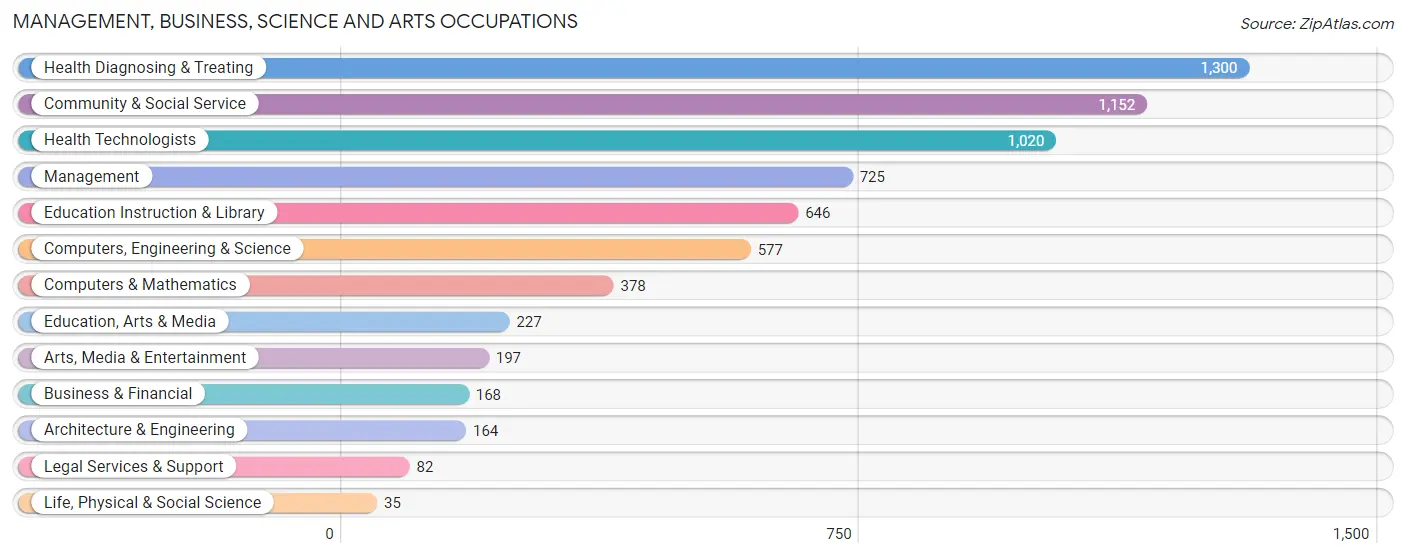
Management, Business, Science and Arts Occupations
The most common Management, Business, Science and Arts occupations in Muhlenberg County are Health Diagnosing & Treating (1,300 | 10.4%), Community & Social Service (1,152 | 9.2%), Health Technologists (1,020 | 8.1%), Management (725 | 5.8%), and Education Instruction & Library (646 | 5.2%).
Management, Business, Science and Arts Occupations by Sex
Within the Management, Business, Science and Arts occupations in Muhlenberg County, the most male-oriented occupations are Business & Financial (92.3%), Computers & Mathematics (87.6%), and Computers, Engineering & Science (78.7%), while the most female-oriented occupations are Legal Services & Support (100.0%), Life, Physical & Social Science (94.3%), and Education Instruction & Library (78.6%).
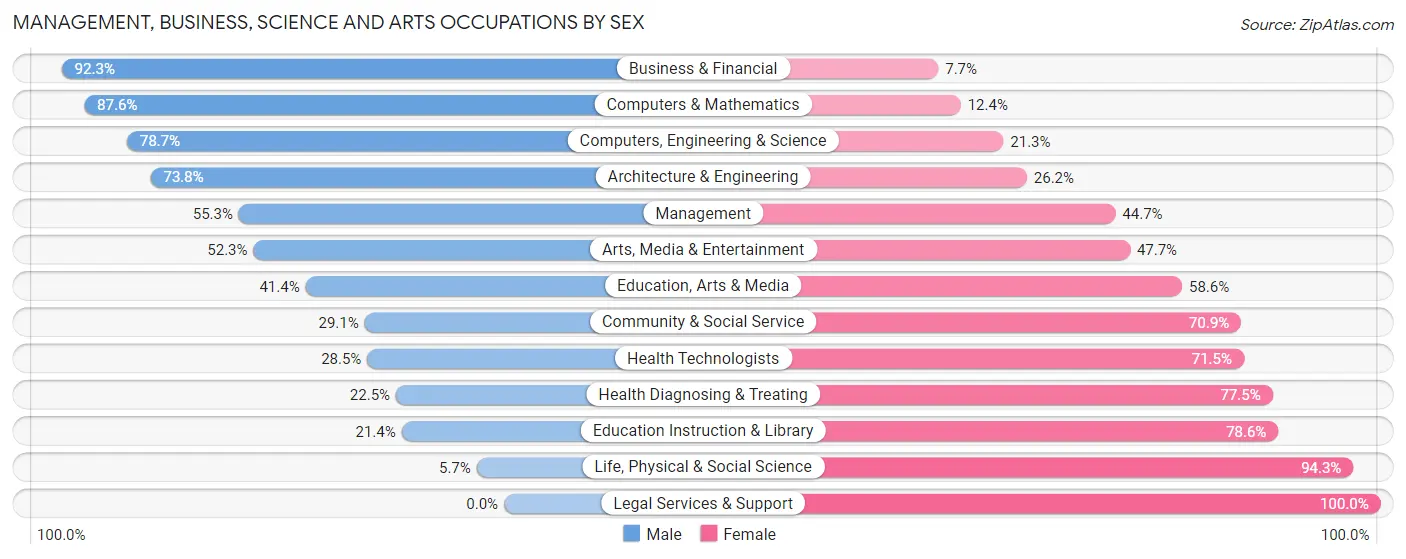
| Occupation | Male | Female |
| Management | 401 (55.3%) | 324 (44.7%) |
| Business & Financial | 155 (92.3%) | 13 (7.7%) |
| Computers, Engineering & Science | 454 (78.7%) | 123 (21.3%) |
| Computers & Mathematics | 331 (87.6%) | 47 (12.4%) |
| Architecture & Engineering | 121 (73.8%) | 43 (26.2%) |
| Life, Physical & Social Science | 2 (5.7%) | 33 (94.3%) |
| Community & Social Service | 335 (29.1%) | 817 (70.9%) |
| Education, Arts & Media | 94 (41.4%) | 133 (58.6%) |
| Legal Services & Support | 0 (0.0%) | 82 (100.0%) |
| Education Instruction & Library | 138 (21.4%) | 508 (78.6%) |
| Arts, Media & Entertainment | 103 (52.3%) | 94 (47.7%) |
| Health Diagnosing & Treating | 293 (22.5%) | 1,007 (77.5%) |
| Health Technologists | 291 (28.5%) | 729 (71.5%) |
| Total (Category) | 1,638 (41.8%) | 2,284 (58.2%) |
| Total (Overall) | 6,856 (54.7%) | 5,670 (45.3%) |
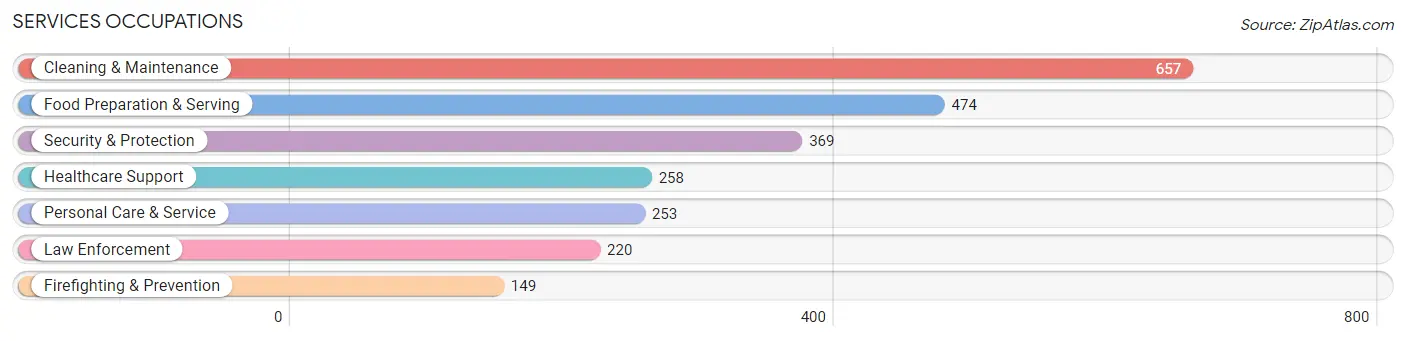
Services Occupations
The most common Services occupations in Muhlenberg County are Cleaning & Maintenance (657 | 5.2%), Food Preparation & Serving (474 | 3.8%), Security & Protection (369 | 2.9%), Healthcare Support (258 | 2.1%), and Personal Care & Service (253 | 2.0%).
Services Occupations by Sex
Within the Services occupations in Muhlenberg County, the most male-oriented occupations are Firefighting & Prevention (98.0%), Security & Protection (93.5%), and Law Enforcement (90.4%), while the most female-oriented occupations are Healthcare Support (83.7%), Food Preparation & Serving (77.6%), and Personal Care & Service (74.3%).
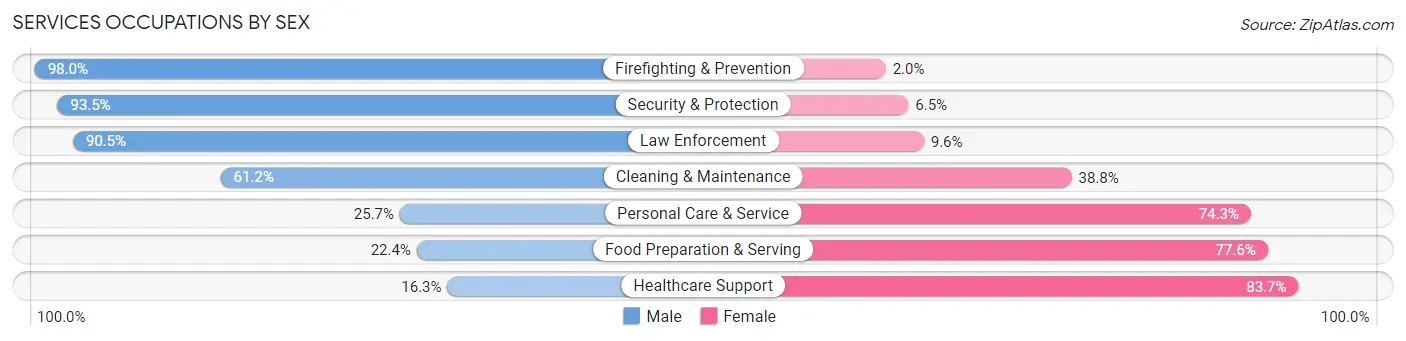
| Occupation | Male | Female |
| Healthcare Support | 42 (16.3%) | 216 (83.7%) |
| Security & Protection | 345 (93.5%) | 24 (6.5%) |
| Firefighting & Prevention | 146 (98.0%) | 3 (2.0%) |
| Law Enforcement | 199 (90.4%) | 21 (9.6%) |
| Food Preparation & Serving | 106 (22.4%) | 368 (77.6%) |
| Cleaning & Maintenance | 402 (61.2%) | 255 (38.8%) |
| Personal Care & Service | 65 (25.7%) | 188 (74.3%) |
| Total (Category) | 960 (47.7%) | 1,051 (52.3%) |
| Total (Overall) | 6,856 (54.7%) | 5,670 (45.3%) |
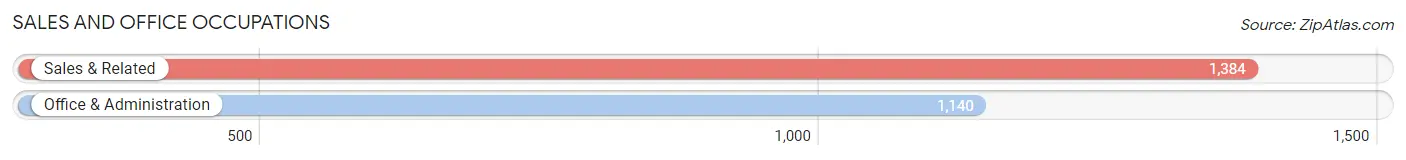
Sales and Office Occupations
The most common Sales and Office occupations in Muhlenberg County are Sales & Related (1,384 | 11.1%), and Office & Administration (1,140 | 9.1%).
Sales and Office Occupations by Sex
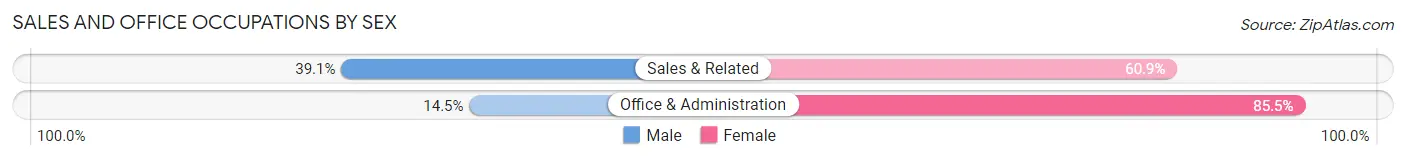
| Occupation | Male | Female |
| Sales & Related | 541 (39.1%) | 843 (60.9%) |
| Office & Administration | 165 (14.5%) | 975 (85.5%) |
| Total (Category) | 706 (28.0%) | 1,818 (72.0%) |
| Total (Overall) | 6,856 (54.7%) | 5,670 (45.3%) |
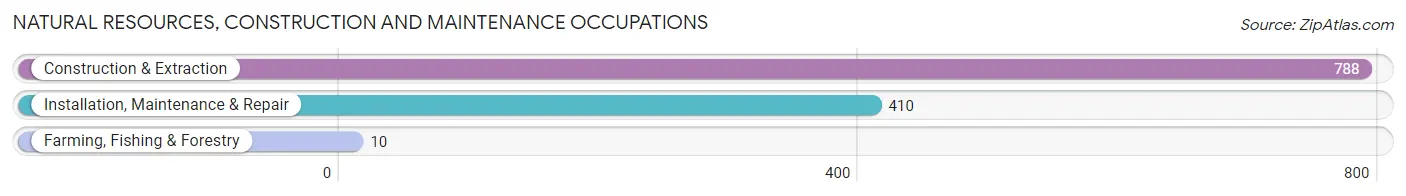
Natural Resources, Construction and Maintenance Occupations
The most common Natural Resources, Construction and Maintenance occupations in Muhlenberg County are Construction & Extraction (788 | 6.3%), Installation, Maintenance & Repair (410 | 3.3%), and Farming, Fishing & Forestry (10 | 0.1%).
Natural Resources, Construction and Maintenance Occupations by Sex
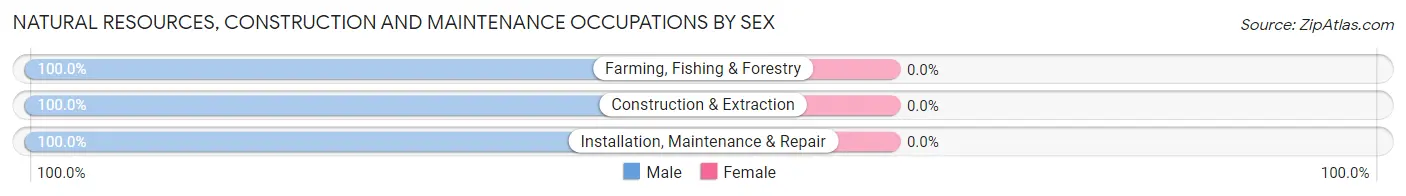
| Occupation | Male | Female |
| Farming, Fishing & Forestry | 10 (100.0%) | 0 (0.0%) |
| Construction & Extraction | 788 (100.0%) | 0 (0.0%) |
| Installation, Maintenance & Repair | 410 (100.0%) | 0 (0.0%) |
| Total (Category) | 1,208 (100.0%) | 0 (0.0%) |
| Total (Overall) | 6,856 (54.7%) | 5,670 (45.3%) |
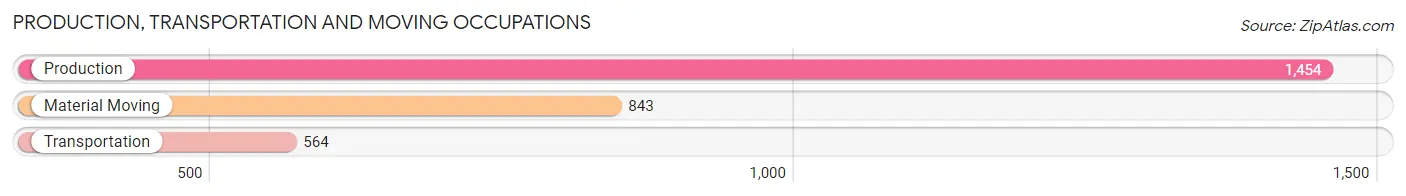
Production, Transportation and Moving Occupations
The most common Production, Transportation and Moving occupations in Muhlenberg County are Production (1,454 | 11.6%), Material Moving (843 | 6.7%), and Transportation (564 | 4.5%).
Production, Transportation and Moving Occupations by Sex
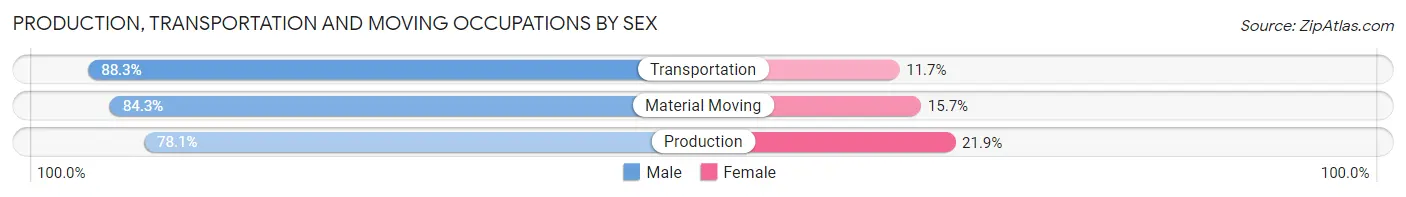
| Occupation | Male | Female |
| Production | 1,135 (78.1%) | 319 (21.9%) |
| Transportation | 498 (88.3%) | 66 (11.7%) |
| Material Moving | 711 (84.3%) | 132 (15.7%) |
| Total (Category) | 2,344 (81.9%) | 517 (18.1%) |
| Total (Overall) | 6,856 (54.7%) | 5,670 (45.3%) |
Employment Industries by Sex in Muhlenberg County
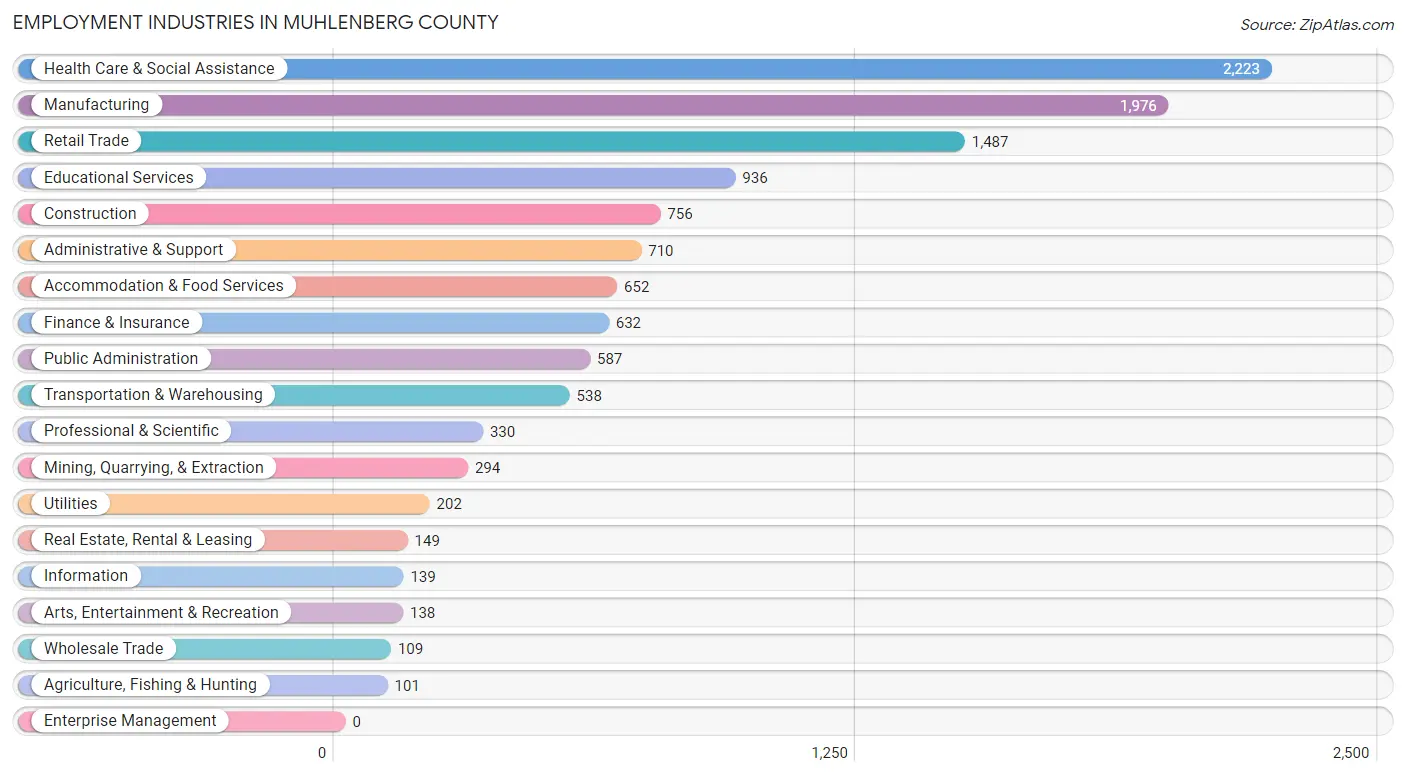
Employment Industries in Muhlenberg County
The major employment industries in Muhlenberg County include Health Care & Social Assistance (2,223 | 17.7%), Manufacturing (1,976 | 15.8%), Retail Trade (1,487 | 11.9%), Educational Services (936 | 7.5%), and Construction (756 | 6.0%).
Employment Industries by Sex in Muhlenberg County
The Muhlenberg County industries that see more men than women are Transportation & Warehousing (96.1%), Construction (93.9%), and Agriculture, Fishing & Hunting (88.1%), whereas the industries that tend to have a higher number of women are Health Care & Social Assistance (81.1%), Educational Services (71.1%), and Accommodation & Food Services (67.9%).
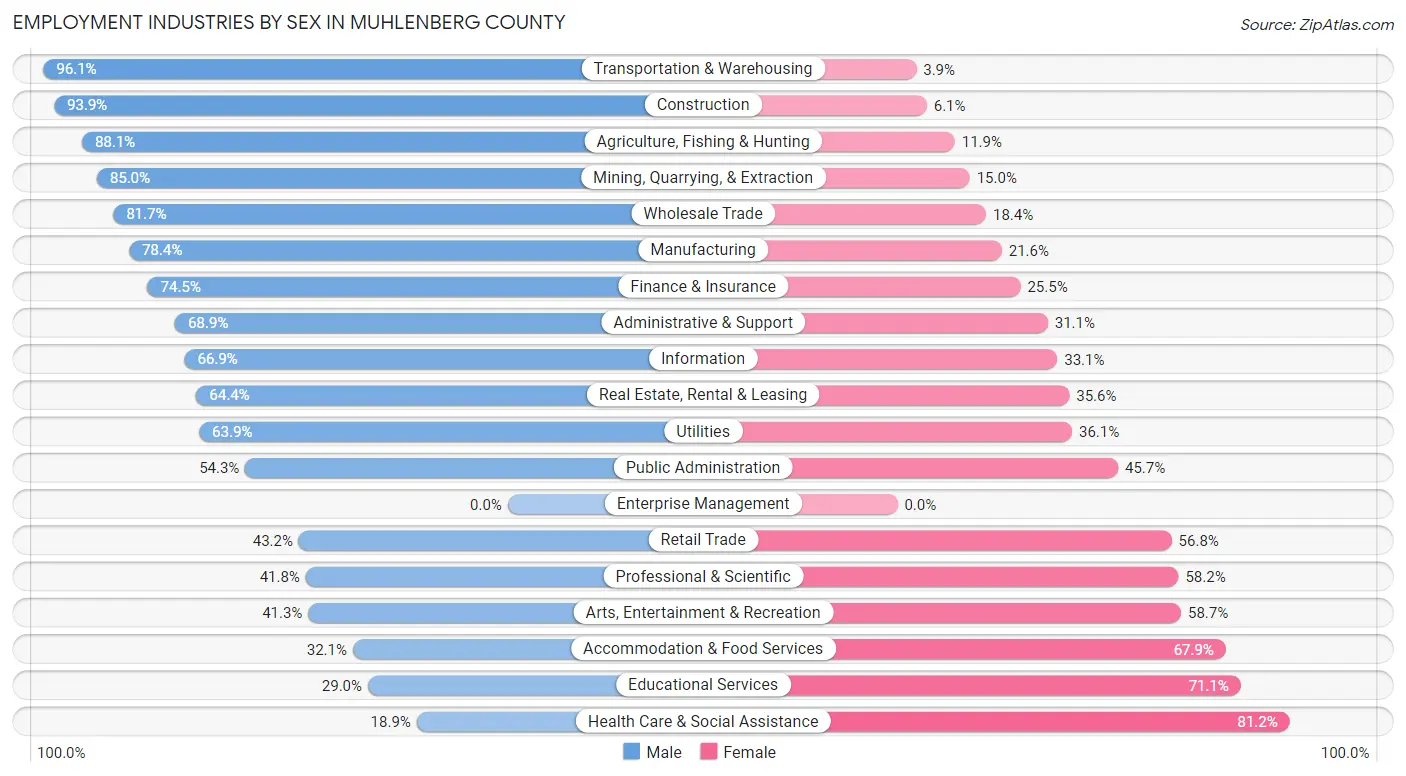
| Industry | Male | Female |
| Agriculture, Fishing & Hunting | 89 (88.1%) | 12 (11.9%) |
| Mining, Quarrying, & Extraction | 250 (85.0%) | 44 (15.0%) |
| Construction | 710 (93.9%) | 46 (6.1%) |
| Manufacturing | 1,549 (78.4%) | 427 (21.6%) |
| Wholesale Trade | 89 (81.7%) | 20 (18.3%) |
| Retail Trade | 643 (43.2%) | 844 (56.8%) |
| Transportation & Warehousing | 517 (96.1%) | 21 (3.9%) |
| Utilities | 129 (63.9%) | 73 (36.1%) |
| Information | 93 (66.9%) | 46 (33.1%) |
| Finance & Insurance | 471 (74.5%) | 161 (25.5%) |
| Real Estate, Rental & Leasing | 96 (64.4%) | 53 (35.6%) |
| Professional & Scientific | 138 (41.8%) | 192 (58.2%) |
| Enterprise Management | 0 (0.0%) | 0 (0.0%) |
| Administrative & Support | 489 (68.9%) | 221 (31.1%) |
| Educational Services | 271 (28.9%) | 665 (71.1%) |
| Health Care & Social Assistance | 419 (18.9%) | 1,804 (81.1%) |
| Arts, Entertainment & Recreation | 57 (41.3%) | 81 (58.7%) |
| Accommodation & Food Services | 209 (32.1%) | 443 (67.9%) |
| Public Administration | 319 (54.3%) | 268 (45.7%) |
| Total | 6,856 (54.7%) | 5,670 (45.3%) |
Education in Muhlenberg County
School Enrollment in Muhlenberg County
The most common levels of schooling among the 5,990 students in Muhlenberg County are middle school (1,428 | 23.8%), high school (1,391 | 23.2%), and elementary school (1,382 | 23.1%).
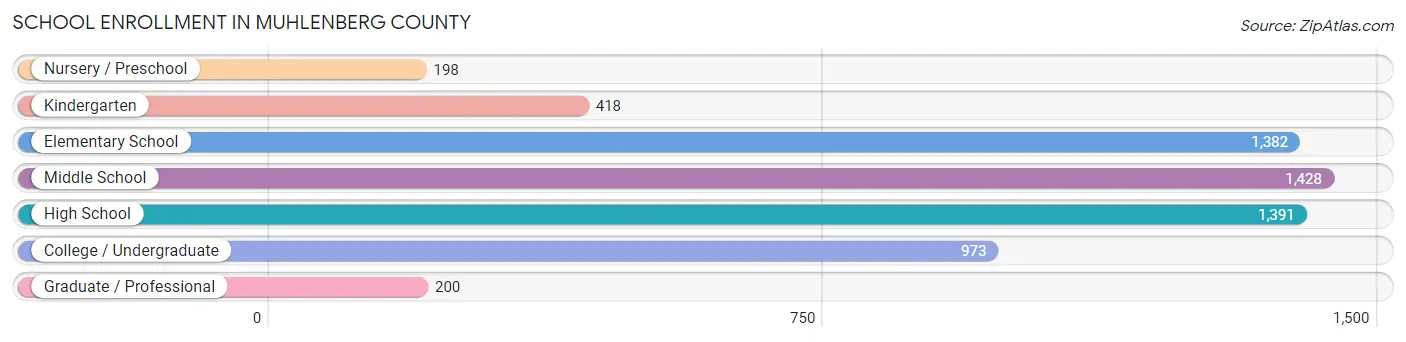
| School Level | # Students | % Students |
| Nursery / Preschool | 198 | 3.3% |
| Kindergarten | 418 | 7.0% |
| Elementary School | 1,382 | 23.1% |
| Middle School | 1,428 | 23.8% |
| High School | 1,391 | 23.2% |
| College / Undergraduate | 973 | 16.2% |
| Graduate / Professional | 200 | 3.3% |
| Total | 5,990 | 100.0% |
School Enrollment by Age by Funding Source in Muhlenberg County
Out of a total of 5,990 students who are enrolled in schools in Muhlenberg County, 677 (11.3%) attend a private institution, while the remaining 5,313 (88.7%) are enrolled in public schools. The age group of 15 to 17 year olds has the highest likelihood of being enrolled in private schools, with 240 (20.4% in the age bracket) enrolled. Conversely, the age group of 20 to 24 year olds has the lowest likelihood of being enrolled in a private school, with 406 (100.0% in the age bracket) attending a public institution.
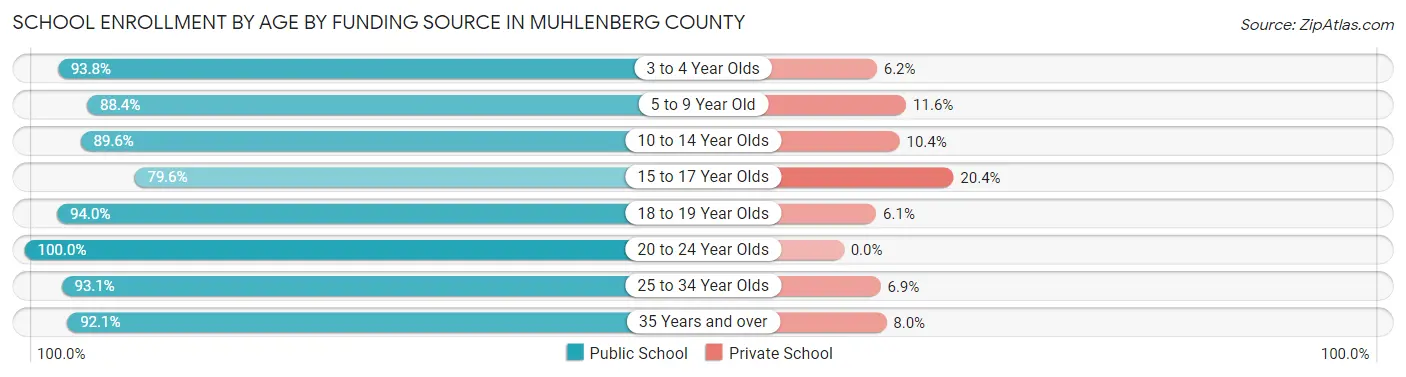
| Age Bracket | Public School | Private School |
| 3 to 4 Year Olds | 76 (93.8%) | 5 (6.2%) |
| 5 to 9 Year Old | 1,366 (88.4%) | 180 (11.6%) |
| 10 to 14 Year Olds | 1,601 (89.6%) | 186 (10.4%) |
| 15 to 17 Year Olds | 934 (79.6%) | 240 (20.4%) |
| 18 to 19 Year Olds | 373 (94.0%) | 24 (6.0%) |
| 20 to 24 Year Olds | 406 (100.0%) | 0 (0.0%) |
| 25 to 34 Year Olds | 312 (93.1%) | 23 (6.9%) |
| 35 Years and over | 243 (92.0%) | 21 (8.0%) |
| Total | 5,313 (88.7%) | 677 (11.3%) |
Educational Attainment by Field of Study in Muhlenberg County
Education (816 | 22.1%), science & technology (615 | 16.6%), arts & humanities (409 | 11.1%), business (398 | 10.7%), and physical & health sciences (362 | 9.8%) are the most common fields of study among 3,701 individuals in Muhlenberg County who have obtained a bachelor's degree or higher.
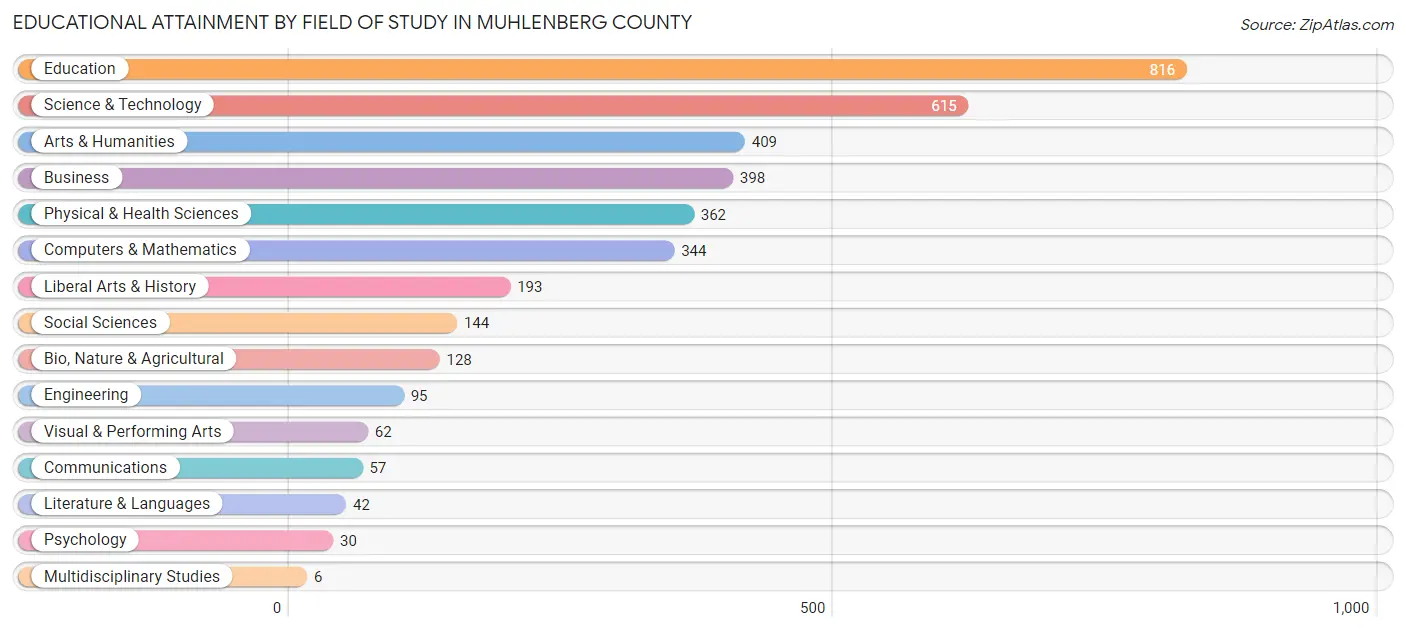
| Field of Study | # Graduates | % Graduates |
| Computers & Mathematics | 344 | 9.3% |
| Bio, Nature & Agricultural | 128 | 3.5% |
| Physical & Health Sciences | 362 | 9.8% |
| Psychology | 30 | 0.8% |
| Social Sciences | 144 | 3.9% |
| Engineering | 95 | 2.6% |
| Multidisciplinary Studies | 6 | 0.2% |
| Science & Technology | 615 | 16.6% |
| Business | 398 | 10.7% |
| Education | 816 | 22.1% |
| Literature & Languages | 42 | 1.1% |
| Liberal Arts & History | 193 | 5.2% |
| Visual & Performing Arts | 62 | 1.7% |
| Communications | 57 | 1.5% |
| Arts & Humanities | 409 | 11.1% |
| Total | 3,701 | 100.0% |
Transportation & Commute in Muhlenberg County
Vehicle Availability by Sex in Muhlenberg County
The most prevalent vehicle ownership categories in Muhlenberg County are males with 2 vehicles (2,677, accounting for 40.0%) and females with 2 vehicles (1,822, making up 49.8%).
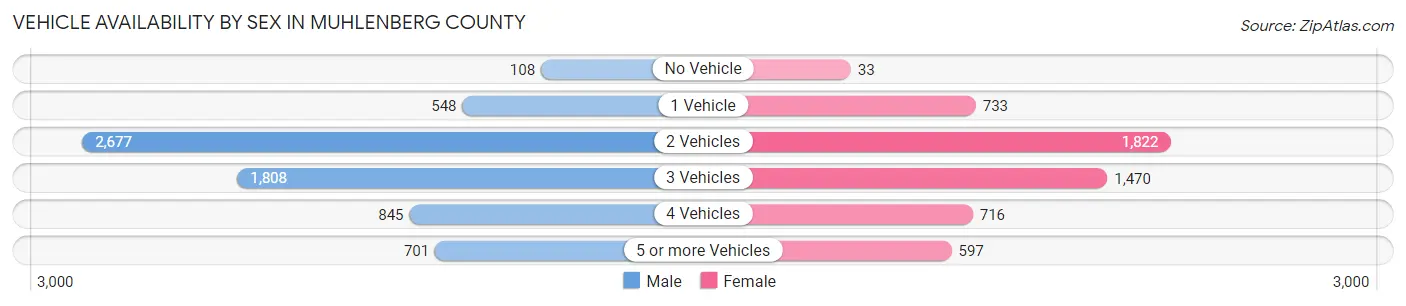
| Vehicles Available | Male | Female |
| No Vehicle | 108 (1.6%) | 33 (0.6%) |
| 1 Vehicle | 548 (8.2%) | 733 (13.7%) |
| 2 Vehicles | 2,677 (40.0%) | 1,822 (33.9%) |
| 3 Vehicles | 1,808 (27.0%) | 1,470 (27.4%) |
| 4 Vehicles | 845 (12.6%) | 716 (13.3%) |
| 5 or more Vehicles | 701 (10.5%) | 597 (11.1%) |
| Total | 6,687 (100.0%) | 5,371 (100.0%) |
Commute Time in Muhlenberg County
The most frequently occuring commute durations in Muhlenberg County are 20 to 24 minutes (1,923 commuters, 16.3%), 10 to 14 minutes (1,609 commuters, 13.6%), and 15 to 19 minutes (1,480 commuters, 12.5%).
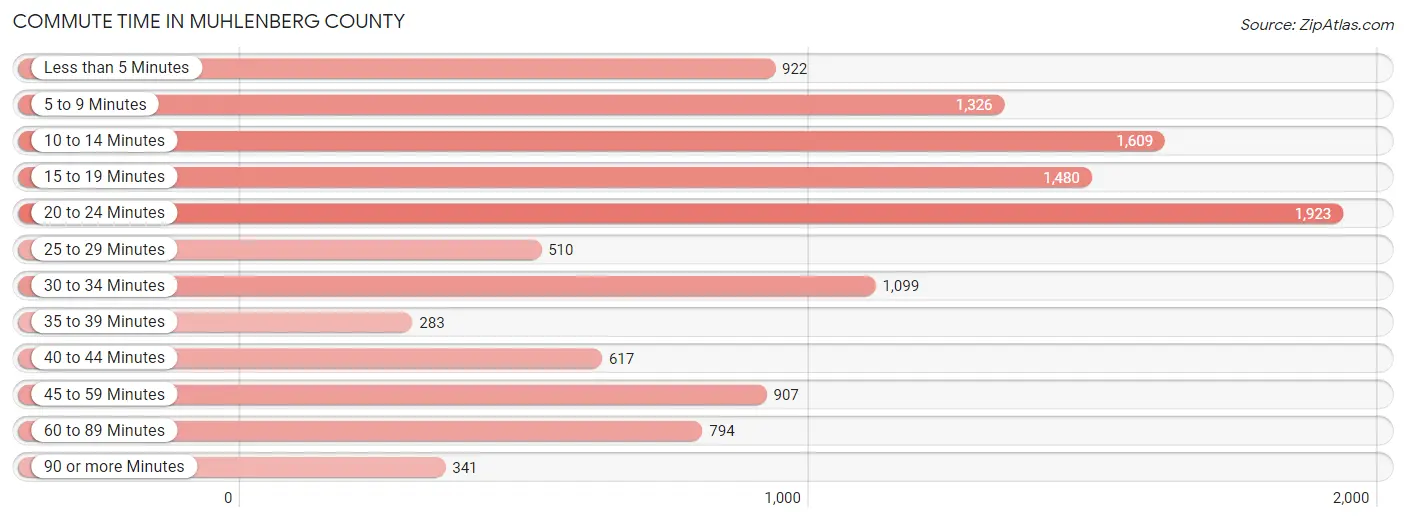
| Commute Time | # Commuters | % Commuters |
| Less than 5 Minutes | 922 | 7.8% |
| 5 to 9 Minutes | 1,326 | 11.2% |
| 10 to 14 Minutes | 1,609 | 13.6% |
| 15 to 19 Minutes | 1,480 | 12.5% |
| 20 to 24 Minutes | 1,923 | 16.3% |
| 25 to 29 Minutes | 510 | 4.3% |
| 30 to 34 Minutes | 1,099 | 9.3% |
| 35 to 39 Minutes | 283 | 2.4% |
| 40 to 44 Minutes | 617 | 5.2% |
| 45 to 59 Minutes | 907 | 7.7% |
| 60 to 89 Minutes | 794 | 6.7% |
| 90 or more Minutes | 341 | 2.9% |
Commute Time by Sex in Muhlenberg County
The most common commute times in Muhlenberg County are 20 to 24 minutes (1,036 commuters, 15.8%) for males and 20 to 24 minutes (887 commuters, 16.9%) for females.
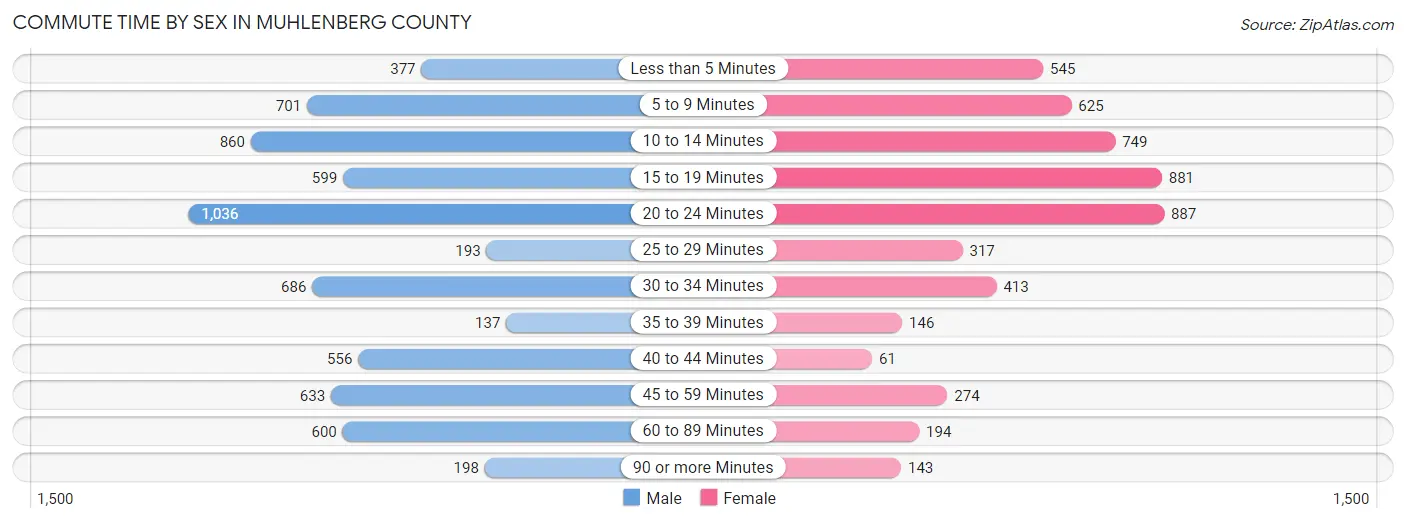
| Commute Time | Male | Female |
| Less than 5 Minutes | 377 (5.7%) | 545 (10.4%) |
| 5 to 9 Minutes | 701 (10.7%) | 625 (11.9%) |
| 10 to 14 Minutes | 860 (13.1%) | 749 (14.3%) |
| 15 to 19 Minutes | 599 (9.1%) | 881 (16.8%) |
| 20 to 24 Minutes | 1,036 (15.8%) | 887 (16.9%) |
| 25 to 29 Minutes | 193 (2.9%) | 317 (6.1%) |
| 30 to 34 Minutes | 686 (10.4%) | 413 (7.9%) |
| 35 to 39 Minutes | 137 (2.1%) | 146 (2.8%) |
| 40 to 44 Minutes | 556 (8.5%) | 61 (1.2%) |
| 45 to 59 Minutes | 633 (9.6%) | 274 (5.2%) |
| 60 to 89 Minutes | 600 (9.1%) | 194 (3.7%) |
| 90 or more Minutes | 198 (3.0%) | 143 (2.7%) |
Time of Departure to Work by Sex in Muhlenberg County
The most frequent times of departure to work in Muhlenberg County are 5:30 AM to 5:59 AM (1,182, 18.0%) for males and 7:30 AM to 7:59 AM (884, 16.9%) for females.
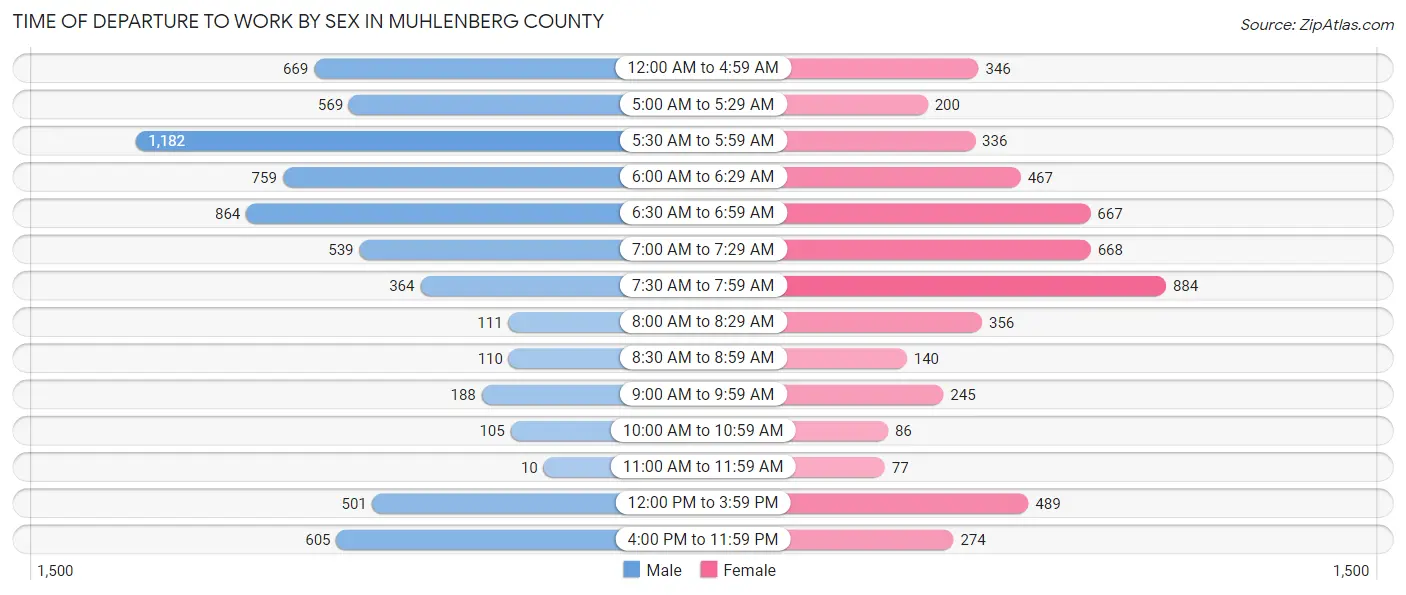
| Time of Departure | Male | Female |
| 12:00 AM to 4:59 AM | 669 (10.2%) | 346 (6.6%) |
| 5:00 AM to 5:29 AM | 569 (8.6%) | 200 (3.8%) |
| 5:30 AM to 5:59 AM | 1,182 (18.0%) | 336 (6.4%) |
| 6:00 AM to 6:29 AM | 759 (11.5%) | 467 (8.9%) |
| 6:30 AM to 6:59 AM | 864 (13.1%) | 667 (12.7%) |
| 7:00 AM to 7:29 AM | 539 (8.2%) | 668 (12.8%) |
| 7:30 AM to 7:59 AM | 364 (5.5%) | 884 (16.9%) |
| 8:00 AM to 8:29 AM | 111 (1.7%) | 356 (6.8%) |
| 8:30 AM to 8:59 AM | 110 (1.7%) | 140 (2.7%) |
| 9:00 AM to 9:59 AM | 188 (2.9%) | 245 (4.7%) |
| 10:00 AM to 10:59 AM | 105 (1.6%) | 86 (1.6%) |
| 11:00 AM to 11:59 AM | 10 (0.2%) | 77 (1.5%) |
| 12:00 PM to 3:59 PM | 501 (7.6%) | 489 (9.3%) |
| 4:00 PM to 11:59 PM | 605 (9.2%) | 274 (5.2%) |
| Total | 6,576 (100.0%) | 5,235 (100.0%) |
Housing Occupancy in Muhlenberg County
Occupancy by Ownership in Muhlenberg County
Of the total 11,847 dwellings in Muhlenberg County, owner-occupied units account for 9,763 (82.4%), while renter-occupied units make up 2,084 (17.6%).
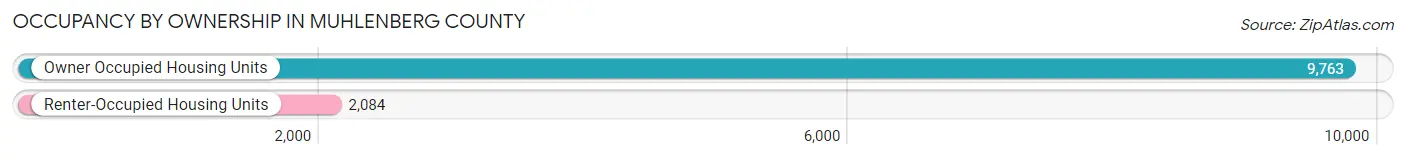
| Occupancy | # Housing Units | % Housing Units |
| Owner Occupied Housing Units | 9,763 | 82.4% |
| Renter-Occupied Housing Units | 2,084 | 17.6% |
| Total Occupied Housing Units | 11,847 | 100.0% |
Occupancy by Household Size in Muhlenberg County
| Household Size | # Housing Units | % Housing Units |
| 1-Person Household | 2,935 | 24.8% |
| 2-Person Household | 4,815 | 40.6% |
| 3-Person Household | 2,020 | 17.1% |
| 4+ Person Household | 2,077 | 17.5% |
| Total Housing Units | 11,847 | 100.0% |
Occupancy by Ownership by Household Size in Muhlenberg County
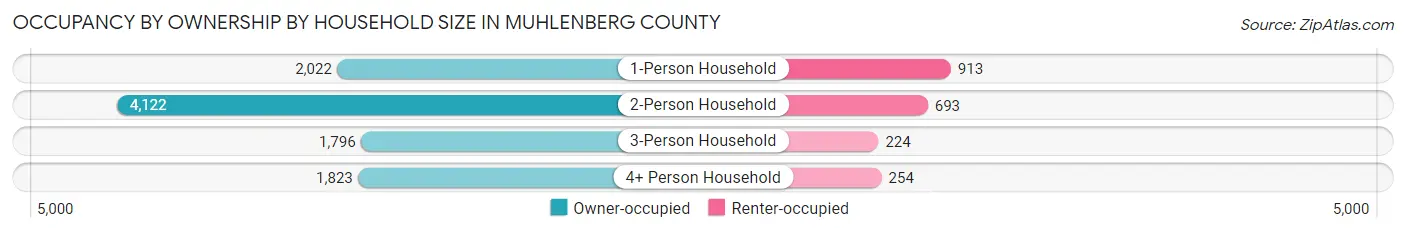
| Household Size | Owner-occupied | Renter-occupied |
| 1-Person Household | 2,022 (68.9%) | 913 (31.1%) |
| 2-Person Household | 4,122 (85.6%) | 693 (14.4%) |
| 3-Person Household | 1,796 (88.9%) | 224 (11.1%) |
| 4+ Person Household | 1,823 (87.8%) | 254 (12.2%) |
| Total Housing Units | 9,763 (82.4%) | 2,084 (17.6%) |
Occupancy by Educational Attainment in Muhlenberg County
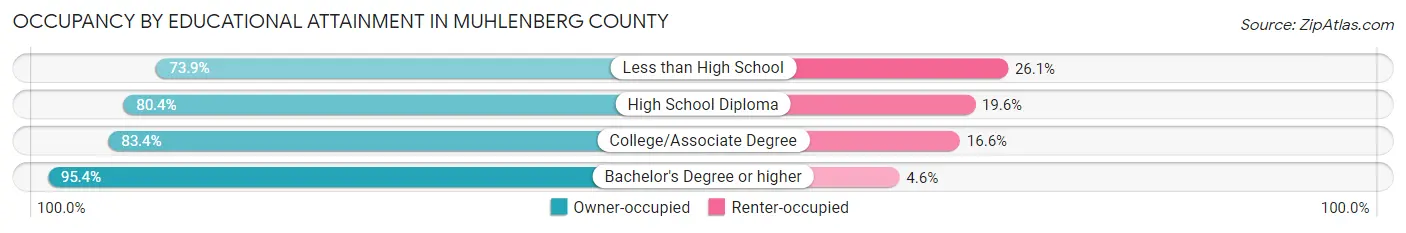
| Household Size | Owner-occupied | Renter-occupied |
| Less than High School | 1,374 (73.9%) | 486 (26.1%) |
| High School Diploma | 3,864 (80.4%) | 941 (19.6%) |
| College/Associate Degree | 2,910 (83.4%) | 579 (16.6%) |
| Bachelor's Degree or higher | 1,615 (95.4%) | 78 (4.6%) |
Occupancy by Age of Householder in Muhlenberg County
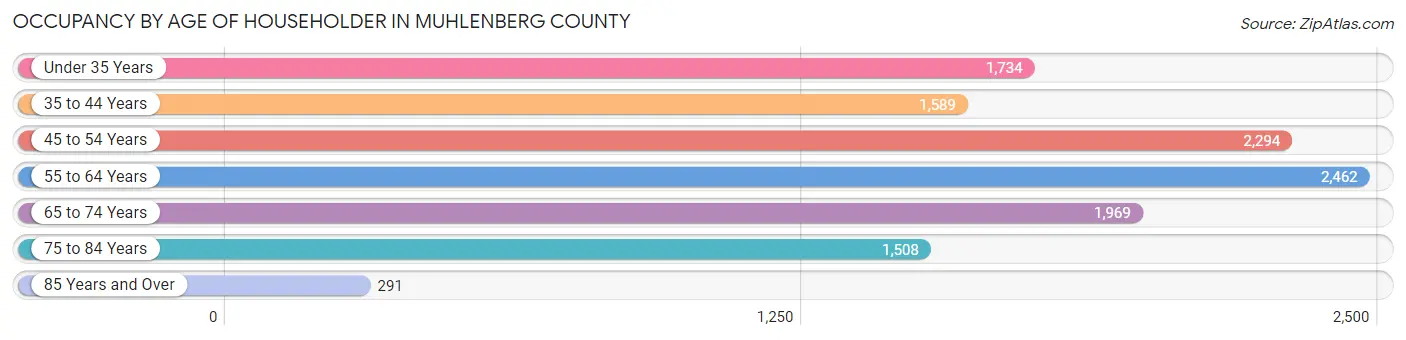
| Age Bracket | # Households | % Households |
| Under 35 Years | 1,734 | 14.6% |
| 35 to 44 Years | 1,589 | 13.4% |
| 45 to 54 Years | 2,294 | 19.4% |
| 55 to 64 Years | 2,462 | 20.8% |
| 65 to 74 Years | 1,969 | 16.6% |
| 75 to 84 Years | 1,508 | 12.7% |
| 85 Years and Over | 291 | 2.5% |
| Total | 11,847 | 100.0% |
Housing Finances in Muhlenberg County
Median Income by Occupancy in Muhlenberg County
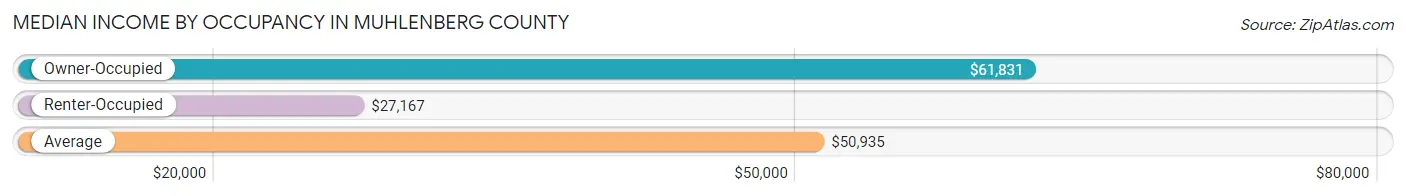
| Occupancy Type | # Households | Median Income |
| Owner-Occupied | 9,763 (82.4%) | $61,831 |
| Renter-Occupied | 2,084 (17.6%) | $27,167 |
| Average | 11,847 (100.0%) | $50,935 |
Occupancy by Householder Income Bracket in Muhlenberg County
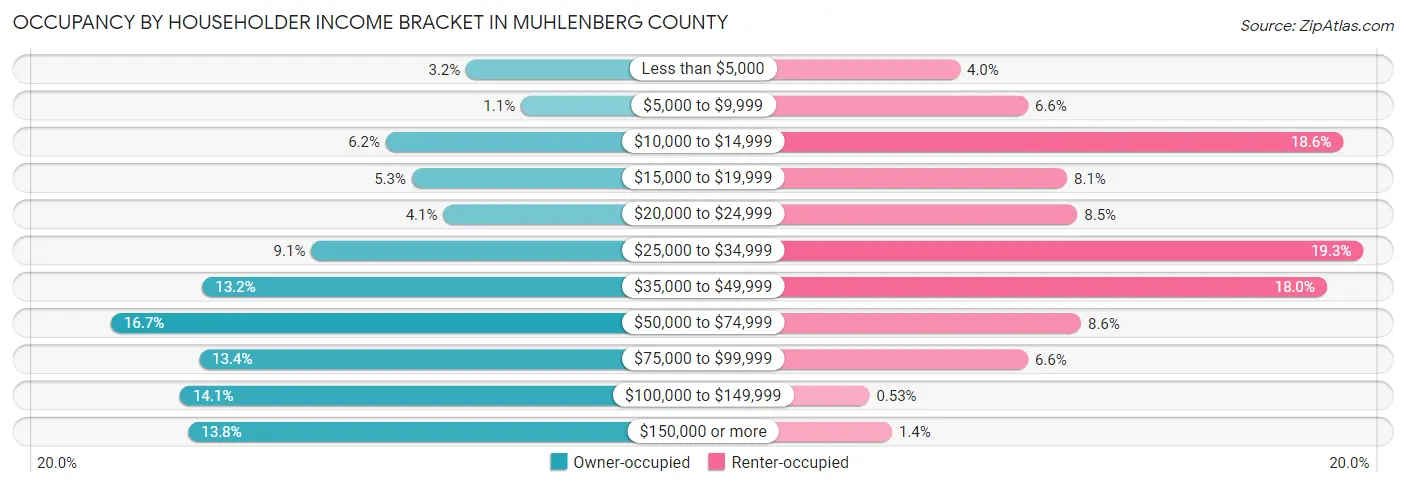
| Income Bracket | Owner-occupied | Renter-occupied |
| Less than $5,000 | 310 (3.2%) | 83 (4.0%) |
| $5,000 to $9,999 | 106 (1.1%) | 137 (6.6%) |
| $10,000 to $14,999 | 609 (6.2%) | 387 (18.6%) |
| $15,000 to $19,999 | 513 (5.2%) | 168 (8.1%) |
| $20,000 to $24,999 | 395 (4.1%) | 176 (8.5%) |
| $25,000 to $34,999 | 886 (9.1%) | 403 (19.3%) |
| $35,000 to $49,999 | 1,292 (13.2%) | 374 (17.9%) |
| $50,000 to $74,999 | 1,631 (16.7%) | 179 (8.6%) |
| $75,000 to $99,999 | 1,303 (13.4%) | 137 (6.6%) |
| $100,000 to $149,999 | 1,375 (14.1%) | 11 (0.5%) |
| $150,000 or more | 1,343 (13.8%) | 29 (1.4%) |
| Total | 9,763 (100.0%) | 2,084 (100.0%) |
Monthly Housing Cost Tiers in Muhlenberg County
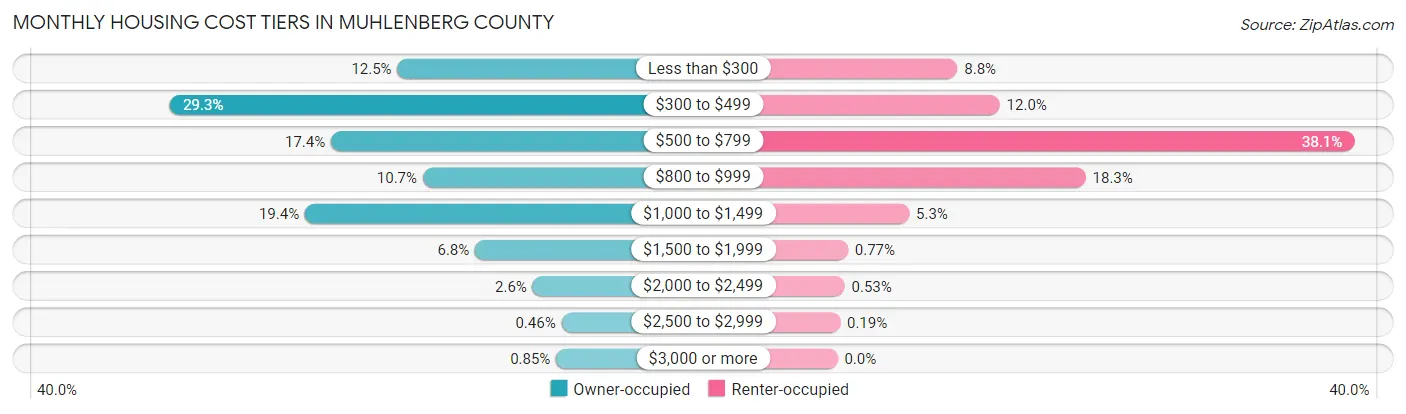
| Monthly Cost | Owner-occupied | Renter-occupied |
| Less than $300 | 1,224 (12.5%) | 184 (8.8%) |
| $300 to $499 | 2,860 (29.3%) | 249 (11.9%) |
| $500 to $799 | 1,702 (17.4%) | 793 (38.1%) |
| $800 to $999 | 1,042 (10.7%) | 381 (18.3%) |
| $1,000 to $1,499 | 1,889 (19.4%) | 110 (5.3%) |
| $1,500 to $1,999 | 666 (6.8%) | 16 (0.8%) |
| $2,000 to $2,499 | 252 (2.6%) | 11 (0.5%) |
| $2,500 to $2,999 | 45 (0.5%) | 4 (0.2%) |
| $3,000 or more | 83 (0.9%) | 0 (0.0%) |
| Total | 9,763 (100.0%) | 2,084 (100.0%) |
Physical Housing Characteristics in Muhlenberg County
Housing Structures in Muhlenberg County
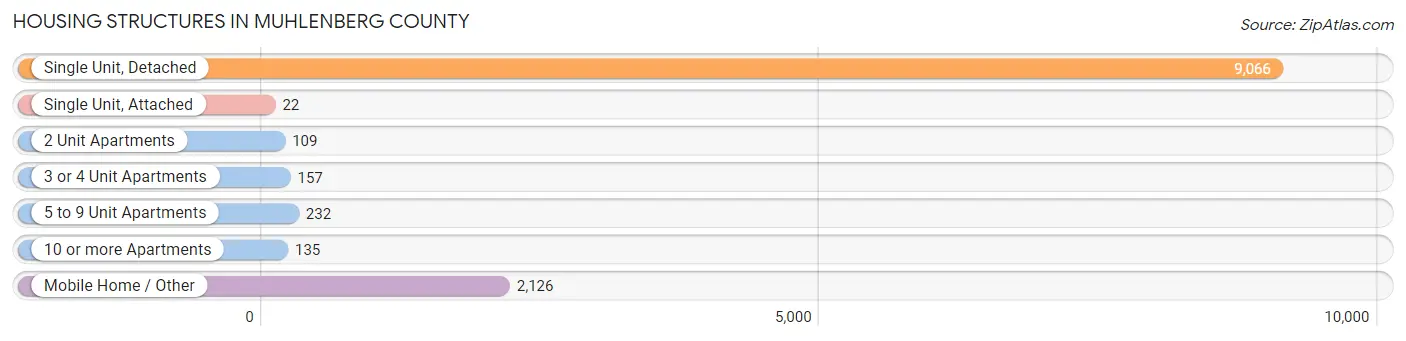
| Structure Type | # Housing Units | % Housing Units |
| Single Unit, Detached | 9,066 | 76.5% |
| Single Unit, Attached | 22 | 0.2% |
| 2 Unit Apartments | 109 | 0.9% |
| 3 or 4 Unit Apartments | 157 | 1.3% |
| 5 to 9 Unit Apartments | 232 | 2.0% |
| 10 or more Apartments | 135 | 1.1% |
| Mobile Home / Other | 2,126 | 17.9% |
| Total | 11,847 | 100.0% |
Housing Structures by Occupancy in Muhlenberg County
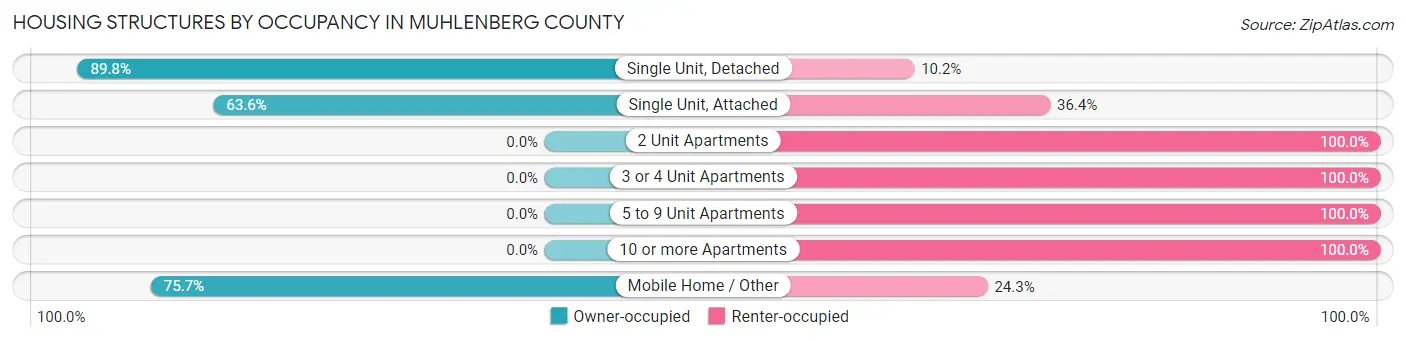
| Structure Type | Owner-occupied | Renter-occupied |
| Single Unit, Detached | 8,140 (89.8%) | 926 (10.2%) |
| Single Unit, Attached | 14 (63.6%) | 8 (36.4%) |
| 2 Unit Apartments | 0 (0.0%) | 109 (100.0%) |
| 3 or 4 Unit Apartments | 0 (0.0%) | 157 (100.0%) |
| 5 to 9 Unit Apartments | 0 (0.0%) | 232 (100.0%) |
| 10 or more Apartments | 0 (0.0%) | 135 (100.0%) |
| Mobile Home / Other | 1,609 (75.7%) | 517 (24.3%) |
| Total | 9,763 (82.4%) | 2,084 (17.6%) |
Housing Structures by Number of Rooms in Muhlenberg County
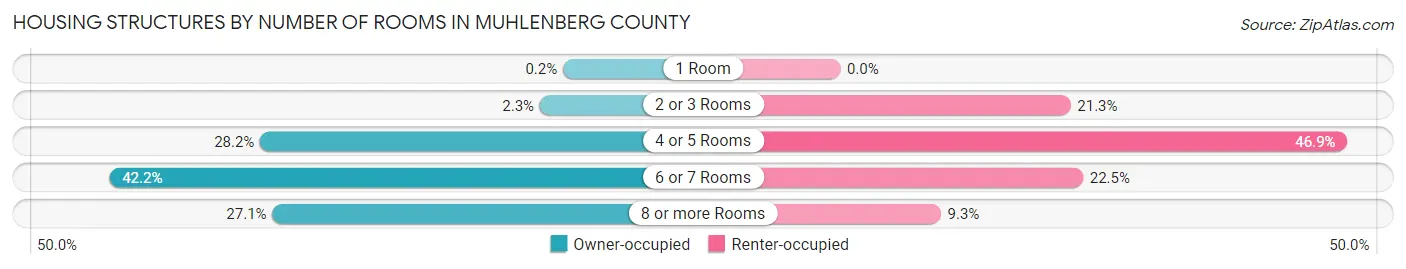
| Number of Rooms | Owner-occupied | Renter-occupied |
| 1 Room | 20 (0.2%) | 0 (0.0%) |
| 2 or 3 Rooms | 228 (2.3%) | 444 (21.3%) |
| 4 or 5 Rooms | 2,754 (28.2%) | 978 (46.9%) |
| 6 or 7 Rooms | 4,117 (42.2%) | 468 (22.5%) |
| 8 or more Rooms | 2,644 (27.1%) | 194 (9.3%) |
| Total | 9,763 (100.0%) | 2,084 (100.0%) |
Housing Structure by Heating Type in Muhlenberg County
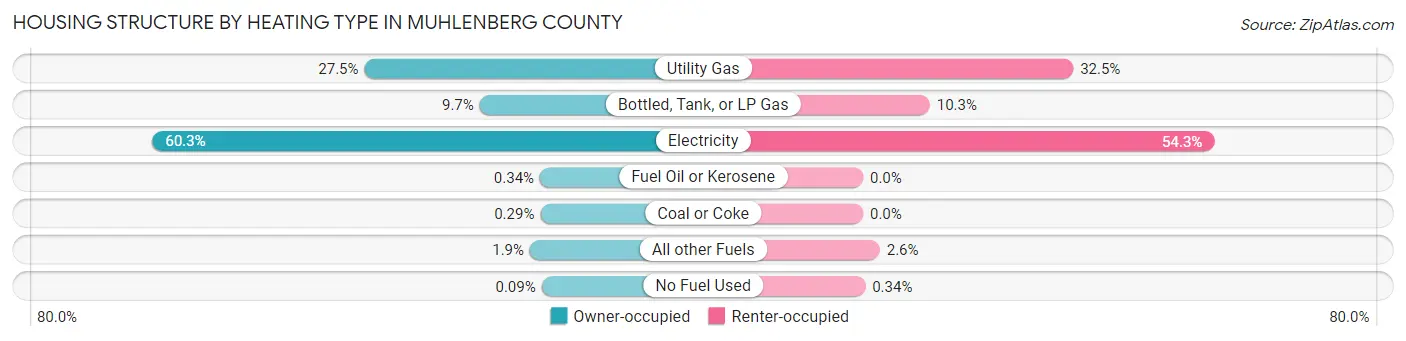
| Heating Type | Owner-occupied | Renter-occupied |
| Utility Gas | 2,683 (27.5%) | 677 (32.5%) |
| Bottled, Tank, or LP Gas | 943 (9.7%) | 215 (10.3%) |
| Electricity | 5,882 (60.3%) | 1,131 (54.3%) |
| Fuel Oil or Kerosene | 33 (0.3%) | 0 (0.0%) |
| Coal or Coke | 28 (0.3%) | 0 (0.0%) |
| All other Fuels | 185 (1.9%) | 54 (2.6%) |
| No Fuel Used | 9 (0.1%) | 7 (0.3%) |
| Total | 9,763 (100.0%) | 2,084 (100.0%) |
Household Vehicle Usage in Muhlenberg County
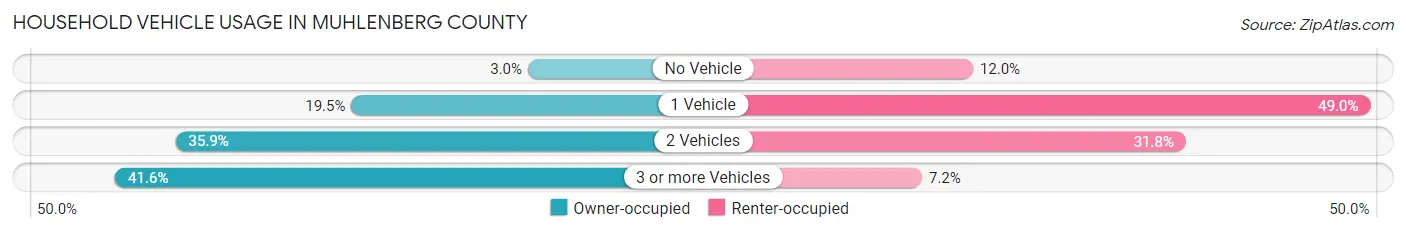
| Vehicles per Household | Owner-occupied | Renter-occupied |
| No Vehicle | 295 (3.0%) | 249 (11.9%) |
| 1 Vehicle | 1,904 (19.5%) | 1,022 (49.0%) |
| 2 Vehicles | 3,507 (35.9%) | 663 (31.8%) |
| 3 or more Vehicles | 4,057 (41.5%) | 150 (7.2%) |
| Total | 9,763 (100.0%) | 2,084 (100.0%) |
Real Estate & Mortgages in Muhlenberg County
Real Estate and Mortgage Overview in Muhlenberg County
| Characteristic | Without Mortgage | With Mortgage |
| Housing Units | 5,068 | 4,695 |
| Median Property Value | $94,200 | $135,400 |
| Median Household Income | $44,192 | $748 |
| Monthly Housing Costs | $379 | $70 |
| Real Estate Taxes | $573 | $221 |
Property Value by Mortgage Status in Muhlenberg County
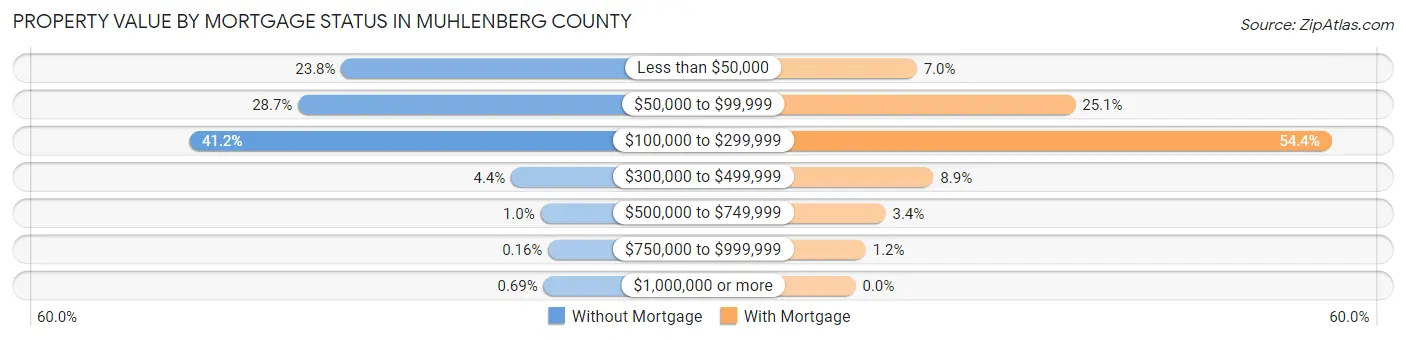
| Property Value | Without Mortgage | With Mortgage |
| Less than $50,000 | 1,206 (23.8%) | 328 (7.0%) |
| $50,000 to $99,999 | 1,456 (28.7%) | 1,179 (25.1%) |
| $100,000 to $299,999 | 2,088 (41.2%) | 2,554 (54.4%) |
| $300,000 to $499,999 | 223 (4.4%) | 418 (8.9%) |
| $500,000 to $749,999 | 52 (1.0%) | 161 (3.4%) |
| $750,000 to $999,999 | 8 (0.2%) | 55 (1.2%) |
| $1,000,000 or more | 35 (0.7%) | 0 (0.0%) |
| Total | 5,068 (100.0%) | 4,695 (100.0%) |
Household Income by Mortgage Status in Muhlenberg County
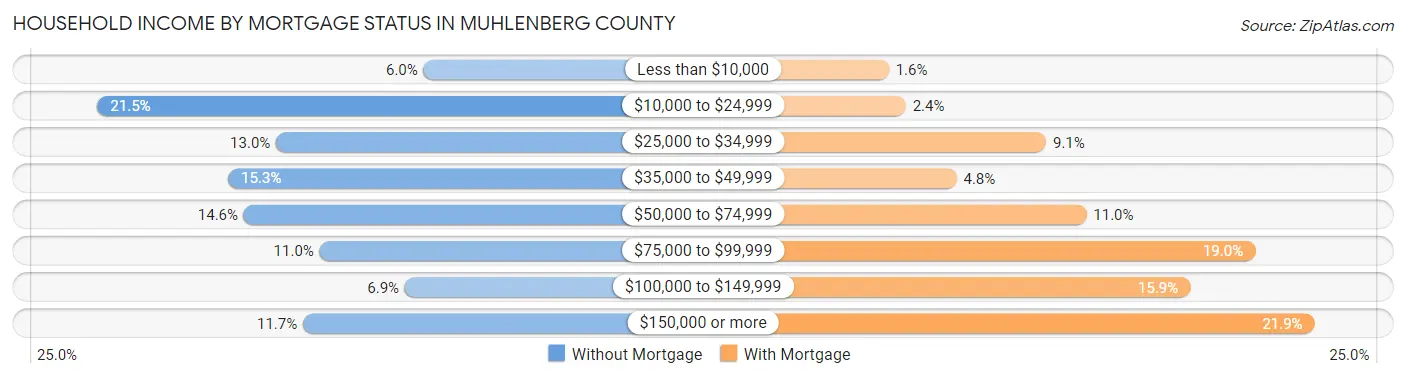
| Household Income | Without Mortgage | With Mortgage |
| Less than $10,000 | 304 (6.0%) | 74 (1.6%) |
| $10,000 to $24,999 | 1,091 (21.5%) | 112 (2.4%) |
| $25,000 to $34,999 | 660 (13.0%) | 426 (9.1%) |
| $35,000 to $49,999 | 776 (15.3%) | 226 (4.8%) |
| $50,000 to $74,999 | 738 (14.6%) | 516 (11.0%) |
| $75,000 to $99,999 | 555 (11.0%) | 893 (19.0%) |
| $100,000 to $149,999 | 349 (6.9%) | 748 (15.9%) |
| $150,000 or more | 595 (11.7%) | 1,026 (21.8%) |
| Total | 5,068 (100.0%) | 4,695 (100.0%) |
Property Value to Household Income Ratio in Muhlenberg County
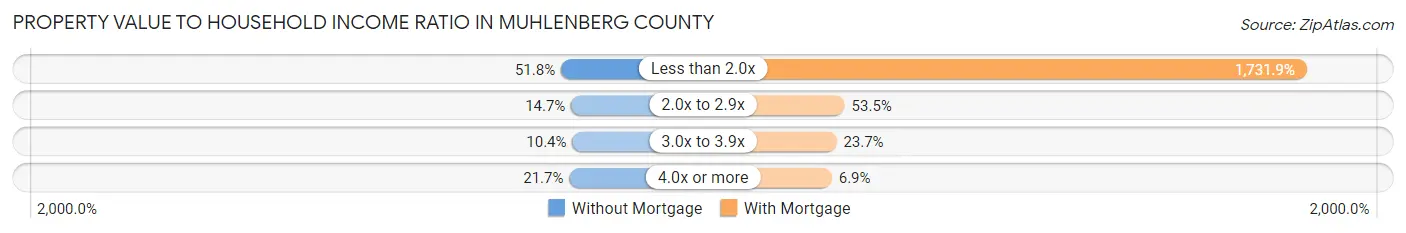
| Value-to-Income Ratio | Without Mortgage | With Mortgage |
| Less than 2.0x | 2,623 (51.8%) | 81,314 (1,731.9%) |
| 2.0x to 2.9x | 744 (14.7%) | 2,511 (53.5%) |
| 3.0x to 3.9x | 525 (10.4%) | 1,114 (23.7%) |
| 4.0x or more | 1,099 (21.7%) | 322 (6.9%) |
| Total | 5,068 (100.0%) | 4,695 (100.0%) |
Real Estate Taxes by Mortgage Status in Muhlenberg County
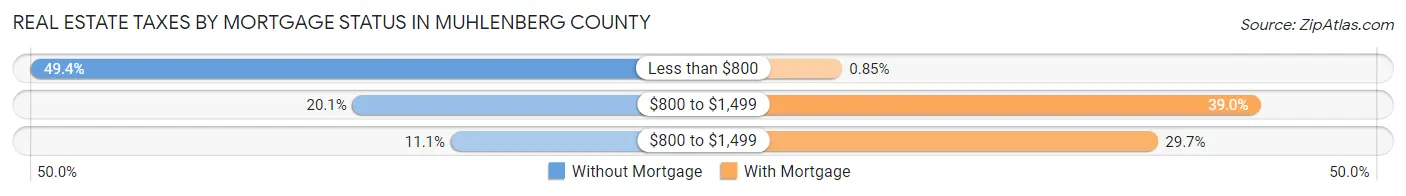
| Property Taxes | Without Mortgage | With Mortgage |
| Less than $800 | 2,504 (49.4%) | 40 (0.9%) |
| $800 to $1,499 | 1,016 (20.1%) | 1,832 (39.0%) |
| $800 to $1,499 | 561 (11.1%) | 1,395 (29.7%) |
| Total | 5,068 (100.0%) | 4,695 (100.0%) |
Health & Disability in Muhlenberg County
Health Insurance Coverage by Age in Muhlenberg County
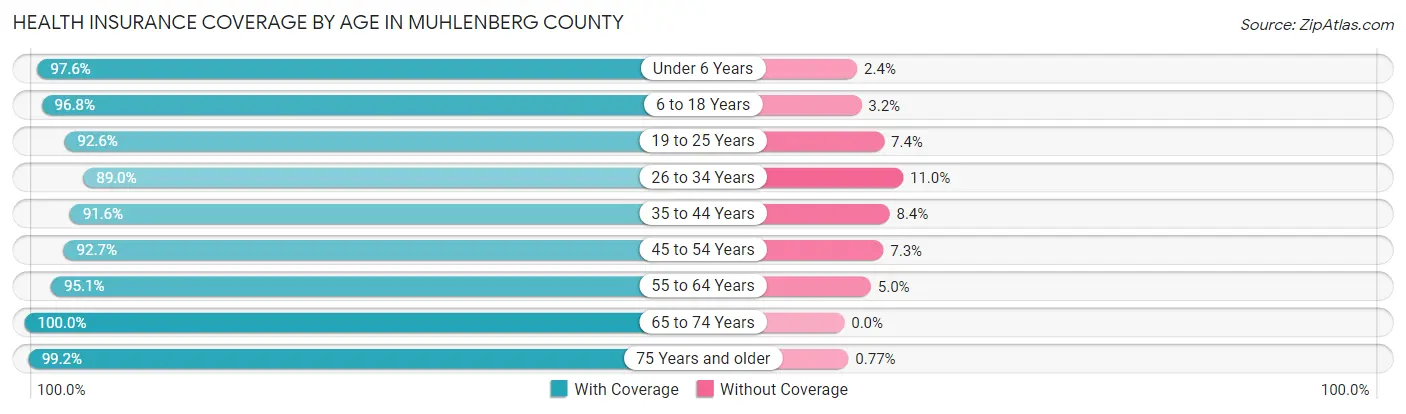
| Age Bracket | With Coverage | Without Coverage |
| Under 6 Years | 2,035 (97.6%) | 50 (2.4%) |
| 6 to 18 Years | 4,414 (96.8%) | 145 (3.2%) |
| 19 to 25 Years | 2,316 (92.6%) | 186 (7.4%) |
| 26 to 34 Years | 2,688 (89.0%) | 331 (11.0%) |
| 35 to 44 Years | 3,213 (91.6%) | 296 (8.4%) |
| 45 to 54 Years | 3,844 (92.7%) | 302 (7.3%) |
| 55 to 64 Years | 3,878 (95.1%) | 202 (5.0%) |
| 65 to 74 Years | 3,440 (100.0%) | 0 (0.0%) |
| 75 Years and older | 2,443 (99.2%) | 19 (0.8%) |
| Total | 28,271 (94.9%) | 1,531 (5.1%) |
Health Insurance Coverage by Citizenship Status in Muhlenberg County
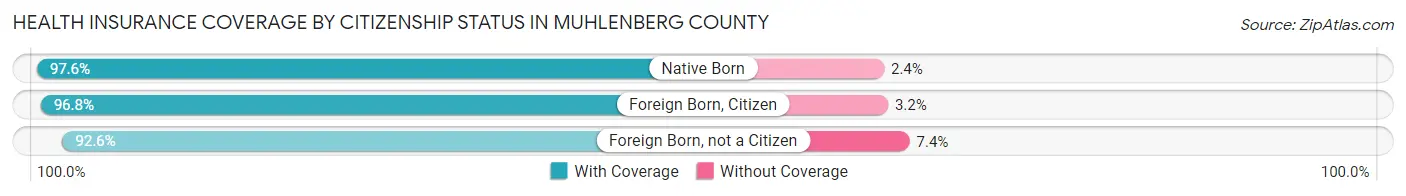
| Citizenship Status | With Coverage | Without Coverage |
| Native Born | 2,035 (97.6%) | 50 (2.4%) |
| Foreign Born, Citizen | 4,414 (96.8%) | 145 (3.2%) |
| Foreign Born, not a Citizen | 2,316 (92.6%) | 186 (7.4%) |
Health Insurance Coverage by Household Income in Muhlenberg County
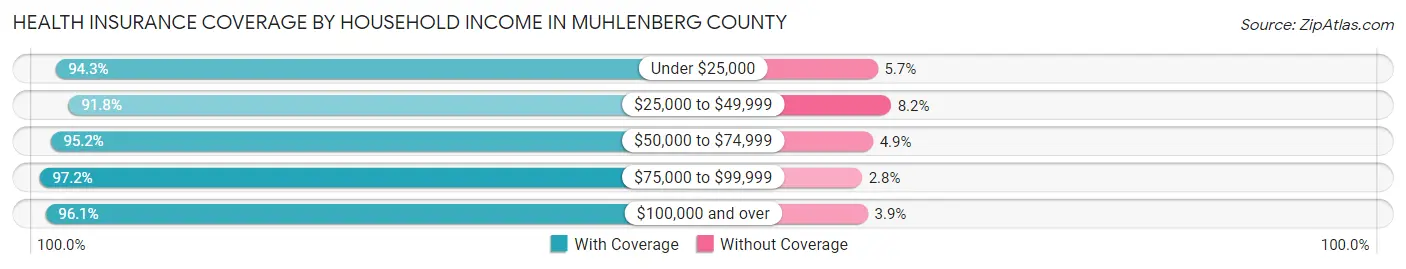
| Household Income | With Coverage | Without Coverage |
| Under $25,000 | 4,926 (94.3%) | 300 (5.7%) |
| $25,000 to $49,999 | 5,798 (91.8%) | 520 (8.2%) |
| $50,000 to $74,999 | 5,062 (95.2%) | 258 (4.9%) |
| $75,000 to $99,999 | 4,243 (97.2%) | 122 (2.8%) |
| $100,000 and over | 8,148 (96.1%) | 331 (3.9%) |
Public vs Private Health Insurance Coverage by Age in Muhlenberg County
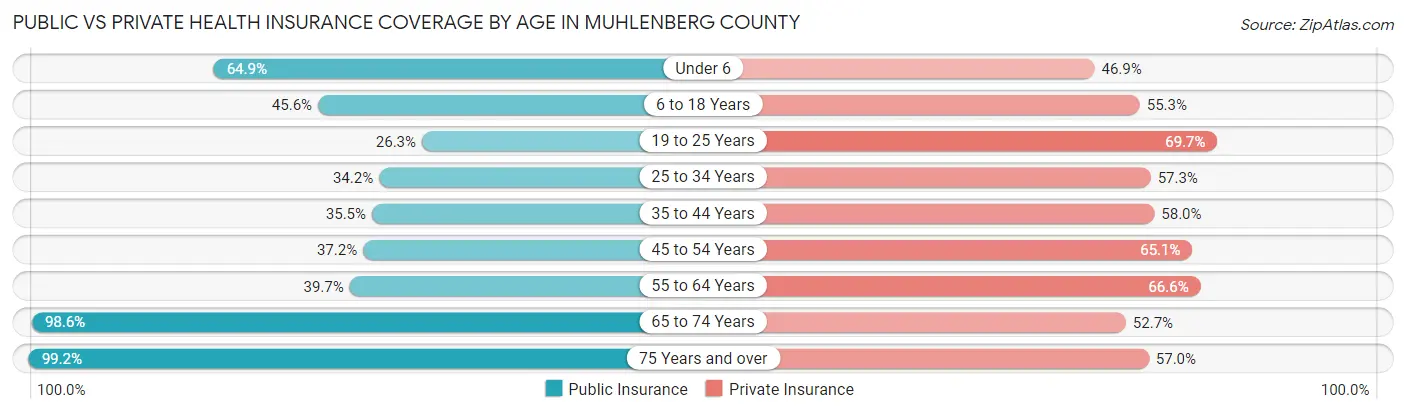
| Age Bracket | Public Insurance | Private Insurance |
| Under 6 | 1,353 (64.9%) | 978 (46.9%) |
| 6 to 18 Years | 2,077 (45.6%) | 2,522 (55.3%) |
| 19 to 25 Years | 657 (26.3%) | 1,744 (69.7%) |
| 25 to 34 Years | 1,033 (34.2%) | 1,731 (57.3%) |
| 35 to 44 Years | 1,247 (35.5%) | 2,036 (58.0%) |
| 45 to 54 Years | 1,542 (37.2%) | 2,697 (65.0%) |
| 55 to 64 Years | 1,619 (39.7%) | 2,716 (66.6%) |
| 65 to 74 Years | 3,393 (98.6%) | 1,814 (52.7%) |
| 75 Years and over | 2,443 (99.2%) | 1,403 (57.0%) |
| Total | 15,364 (51.5%) | 17,641 (59.2%) |
Disability Status by Sex by Age in Muhlenberg County
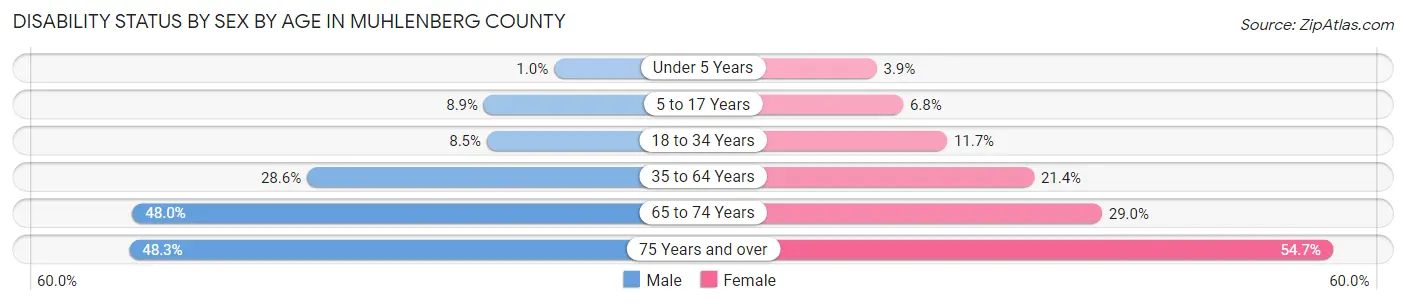
| Age Bracket | Male | Female |
| Under 5 Years | 9 (1.0%) | 34 (3.9%) |
| 5 to 17 Years | 213 (8.8%) | 153 (6.8%) |
| 18 to 34 Years | 250 (8.5%) | 332 (11.7%) |
| 35 to 64 Years | 1,701 (28.5%) | 1,236 (21.4%) |
| 65 to 74 Years | 824 (48.0%) | 499 (29.0%) |
| 75 Years and over | 449 (48.3%) | 838 (54.7%) |
Disability Class by Sex by Age in Muhlenberg County
Disability Class: Hearing Difficulty
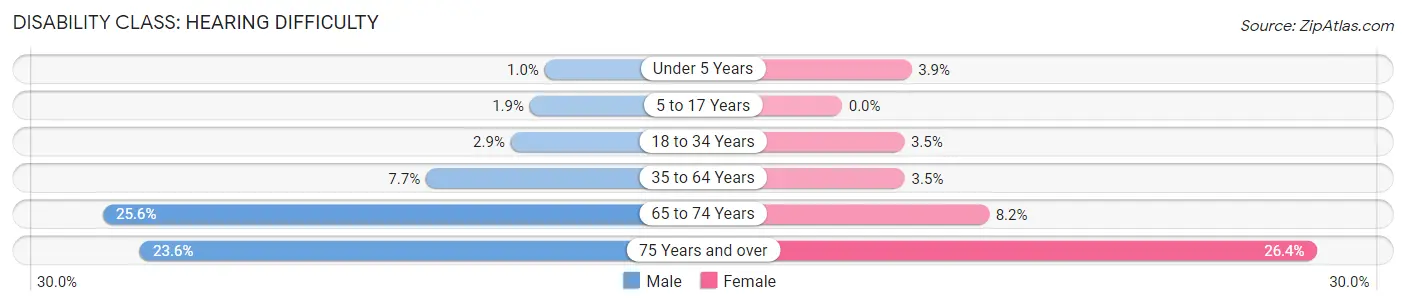
| Age Bracket | Male | Female |
| Under 5 Years | 9 (1.0%) | 34 (3.9%) |
| 5 to 17 Years | 45 (1.9%) | 0 (0.0%) |
| 18 to 34 Years | 86 (2.9%) | 98 (3.5%) |
| 35 to 64 Years | 456 (7.6%) | 202 (3.5%) |
| 65 to 74 Years | 440 (25.6%) | 141 (8.2%) |
| 75 Years and over | 219 (23.6%) | 405 (26.4%) |
Disability Class: Vision Difficulty
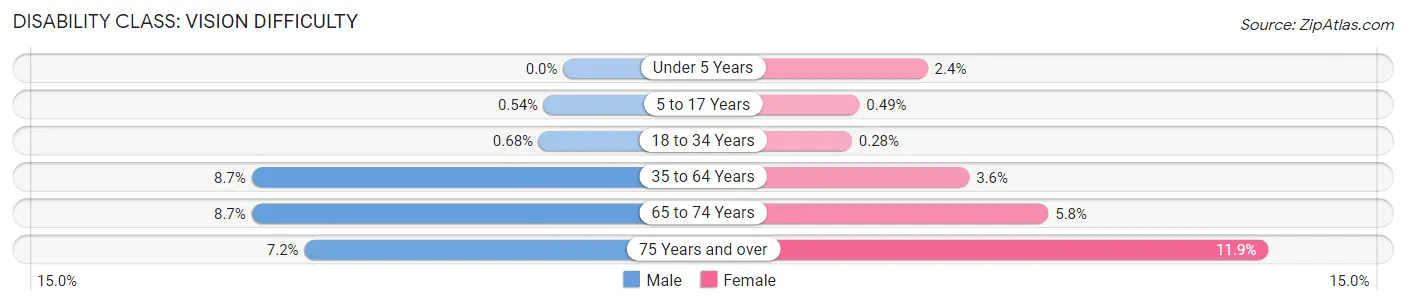
| Age Bracket | Male | Female |
| Under 5 Years | 0 (0.0%) | 21 (2.4%) |
| 5 to 17 Years | 13 (0.5%) | 11 (0.5%) |
| 18 to 34 Years | 20 (0.7%) | 8 (0.3%) |
| 35 to 64 Years | 517 (8.7%) | 205 (3.5%) |
| 65 to 74 Years | 149 (8.7%) | 99 (5.8%) |
| 75 Years and over | 67 (7.2%) | 182 (11.9%) |
Disability Class: Cognitive Difficulty
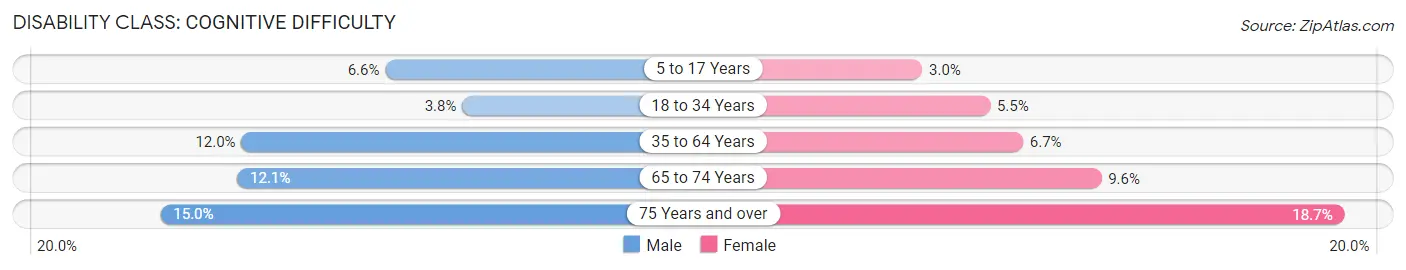
| Age Bracket | Male | Female |
| 5 to 17 Years | 159 (6.6%) | 67 (3.0%) |
| 18 to 34 Years | 110 (3.7%) | 156 (5.5%) |
| 35 to 64 Years | 712 (11.9%) | 388 (6.7%) |
| 65 to 74 Years | 208 (12.1%) | 166 (9.6%) |
| 75 Years and over | 139 (15.0%) | 286 (18.7%) |
Disability Class: Ambulatory Difficulty
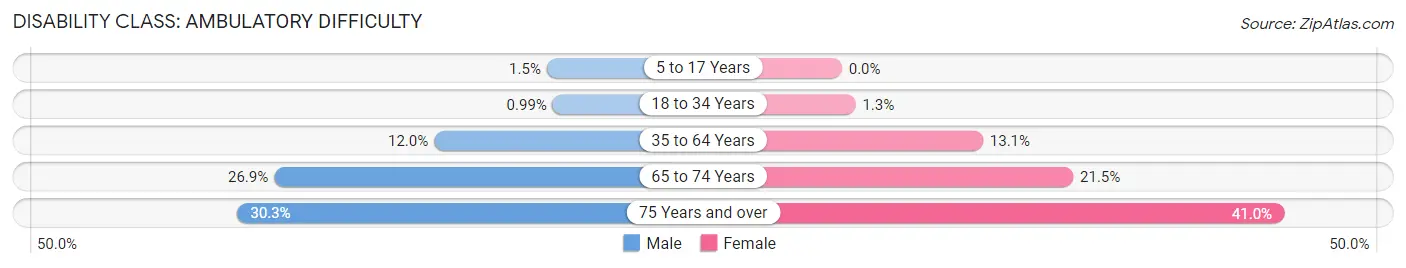
| Age Bracket | Male | Female |
| 5 to 17 Years | 37 (1.5%) | 0 (0.0%) |
| 18 to 34 Years | 29 (1.0%) | 36 (1.3%) |
| 35 to 64 Years | 715 (12.0%) | 756 (13.1%) |
| 65 to 74 Years | 461 (26.9%) | 370 (21.5%) |
| 75 Years and over | 281 (30.2%) | 629 (41.0%) |
Disability Class: Self-Care Difficulty
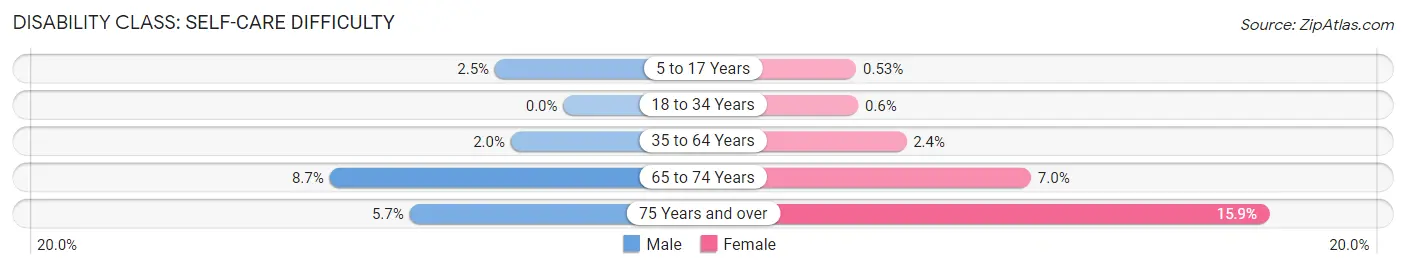
| Age Bracket | Male | Female |
| 5 to 17 Years | 61 (2.5%) | 12 (0.5%) |
| 18 to 34 Years | 0 (0.0%) | 17 (0.6%) |
| 35 to 64 Years | 116 (1.9%) | 138 (2.4%) |
| 65 to 74 Years | 149 (8.7%) | 121 (7.0%) |
| 75 Years and over | 53 (5.7%) | 243 (15.9%) |
Technology Access in Muhlenberg County
Computing Device Access in Muhlenberg County
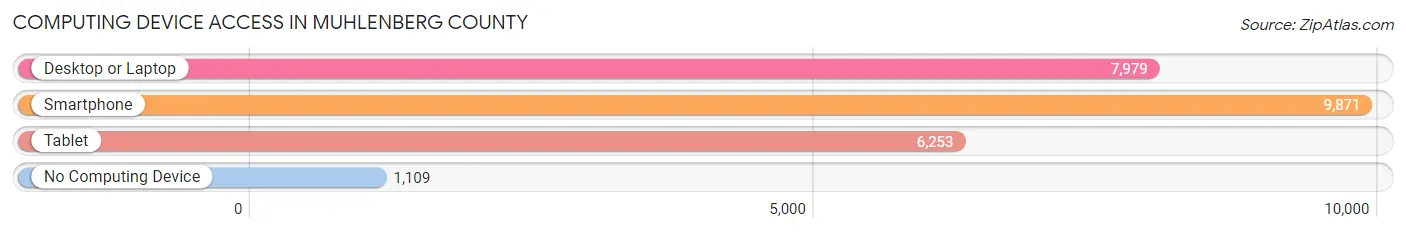
| Device Type | # Households | % Households |
| Desktop or Laptop | 7,979 | 67.3% |
| Smartphone | 9,871 | 83.3% |
| Tablet | 6,253 | 52.8% |
| No Computing Device | 1,109 | 9.4% |
| Total | 11,847 | 100.0% |
Internet Access in Muhlenberg County
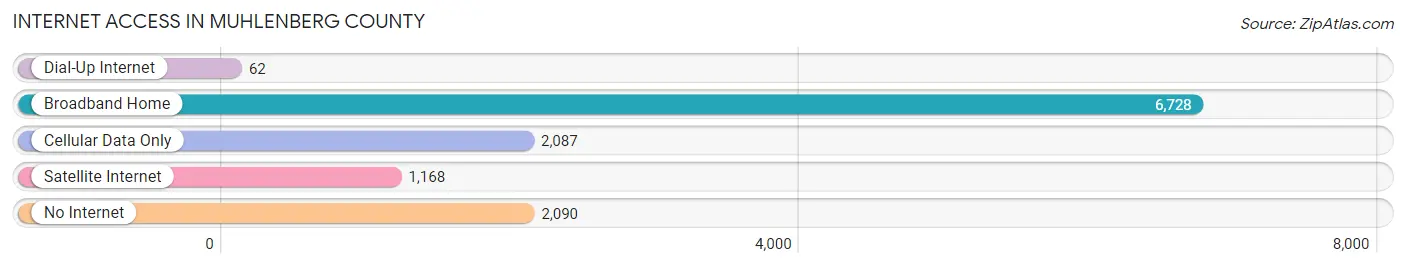
| Internet Type | # Households | % Households |
| Dial-Up Internet | 62 | 0.5% |
| Broadband Home | 6,728 | 56.8% |
| Cellular Data Only | 2,087 | 17.6% |
| Satellite Internet | 1,168 | 9.9% |
| No Internet | 2,090 | 17.6% |
| Total | 11,847 | 100.0% |
Muhlenberg County Summary
Muhlenberg County is a county located in the U.S. state of Kentucky. As of the 2010 census, the population was 31,499. The county seat is Greenville. The county was founded in 1798 and named for General Peter Muhlenberg, a colonial general during the American Revolutionary War.
Geography
Muhlenberg County is located in the western part of Kentucky, in the Pennyroyal region. It is bordered by Ohio County to the north, McLean County to the east, Hopkins County to the south, and Christian County to the west. The county has a total area of 441 square miles, of which 439 square miles is land and 2.2 square miles (0.5%) is water.
The county is located in the Western Coal Fields region of Kentucky. The terrain is mostly rolling hills, with some flat areas in the northern part of the county. The Green River runs through the county, and is a major source of recreation and economic activity.
Demographics
As of the 2010 census, there were 31,499 people, 12,717 households, and 8,945 families residing in the county. The population density was 71.7 people per square mile. There were 14,072 housing units at an average density of 31.9 per square mile. The racial makeup of the county was 94.2% White, 3.3% Black or African American, 0.2% Native American, 0.3% Asian, 0.2% Pacific Islander, 0.7% from other races, and 1.2% from two or more races. 1.7% of the population were Hispanic or Latino of any race.
There were 12,717 households, out of which 30.2% had children under the age of 18 living with them, 53.2% were married couples living together, 12.2% had a female householder with no husband present, and 30.2% were non-families. 26.2% of all households were made up of individuals, and 11.7% had someone living alone who was 65 years of age or older. The average household size was 2.44 and the average family size was 2.93.
The age distribution was 23.2% under the age of 18, 8.7% from 18 to 24, 28.2% from 25 to 44, 25.2% from 45 to 64, and 14.7% who were 65 years of age or older. The median age was 38 years. For every 100 females, there were 94.2 males. For every 100 females age 18 and over, there were 91.2 males.
The median income for a household in the county was $31,945, and the median income for a family was $38,945. Males had a median income of $31,945 versus $21,945 for females. The per capita income for the county was $16,945. About 11.7% of families and 14.7% of the population were below the poverty line, including 19.7% of those under age 18 and 14.7% of those age 65 or over.
Economy
Muhlenberg County is a rural county with a largely agricultural economy. The county is home to several large farms, as well as smaller family farms. The county is also home to several large coal mines, which provide jobs for many of the county's residents.
The county is home to several large manufacturing companies, including a large automotive parts plant and a large paper mill. The county is also home to several small businesses, including restaurants, retail stores, and service businesses.
The county is served by two major highways, US Route 431 and Kentucky Route 81. The county is also served by several smaller roads, as well as a rail line.
Conclusion
Muhlenberg County is a rural county located in the western part of Kentucky. The county has a population of 31,499, and is home to several large farms, coal mines, and manufacturing companies. The county is served by two major highways, US Route 431 and Kentucky Route 81, as well as several smaller roads and a rail line. The county has a largely agricultural economy, with several small businesses providing additional economic activity.
Common Questions
What is Per Capita Income in Muhlenberg County?
Per Capita income in Muhlenberg County is $31,621.
What is the Median Family Income in Muhlenberg County?
Median Family Income in Muhlenberg County is $69,150.
What is the Median Household income in Muhlenberg County?
Median Household Income in Muhlenberg County is $50,935.
What is Income or Wage Gap in Muhlenberg County?
Income or Wage Gap in Muhlenberg County is 37.6%.
Women in Muhlenberg County earn 62.4 cents for every dollar earned by a man.
What is Family Income Deficit in Muhlenberg County?
Family Income Deficit in Muhlenberg County is $10,672.
Families that are below poverty line in Muhlenberg County earn $10,672 less on average than the poverty threshold level.
What is Inequality or Gini Index in Muhlenberg County?
Inequality or Gini Index in Muhlenberg County is 0.51.
What is the Total Population of Muhlenberg County?
Total Population of Muhlenberg County is 30,735.
What is the Total Male Population of Muhlenberg County?
Total Male Population of Muhlenberg County is 15,577.
What is the Total Female Population of Muhlenberg County?
Total Female Population of Muhlenberg County is 15,158.
What is the Ratio of Males per 100 Females in Muhlenberg County?
There are 102.76 Males per 100 Females in Muhlenberg County.
What is the Ratio of Females per 100 Males in Muhlenberg County?
There are 97.31 Females per 100 Males in Muhlenberg County.
What is the Median Population Age in Muhlenberg County?
Median Population Age in Muhlenberg County is 43.0 Years.
What is the Average Family Size in Muhlenberg County
Average Family Size in Muhlenberg County is 3.0 People.
What is the Average Household Size in Muhlenberg County
Average Household Size in Muhlenberg County is 2.5 People.
How Large is the Labor Force in Muhlenberg County?
There are 13,183 People in the Labor Forcein in Muhlenberg County.
What is the Percentage of People in the Labor Force in Muhlenberg County?
52.5% of People are in the Labor Force in Muhlenberg County.
What is the Unemployment Rate in Muhlenberg County?
Unemployment Rate in Muhlenberg County is 4.9%.