Morgan County, KY Map & Demographics
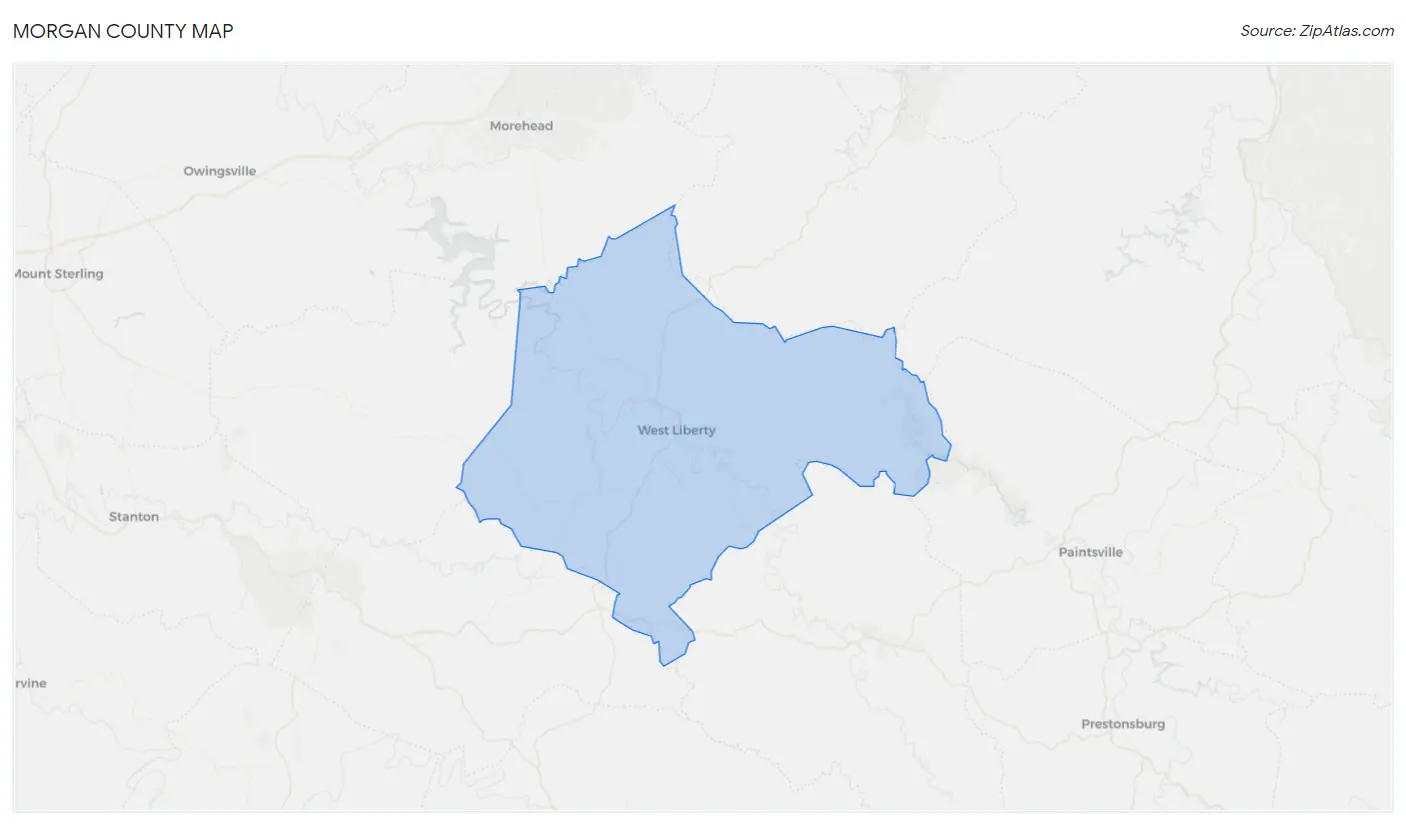
Morgan County Map
Morgan County Overview
$23,257
PER CAPITA INCOME
$58,773
AVG FAMILY INCOME
$46,018
AVG HOUSEHOLD INCOME
25.6%
WAGE / INCOME GAP [ % ]
74.4¢/ $1
WAGE / INCOME GAP [ $ ]
$10,916
FAMILY INCOME DEFICIT
0.49
INEQUALITY / GINI INDEX
13,840
TOTAL POPULATION
8,000
MALE POPULATION
5,840
FEMALE POPULATION
136.99
MALES / 100 FEMALES
73.00
FEMALES / 100 MALES
42.3
MEDIAN AGE
3.2
AVG FAMILY SIZE
2.6
AVG HOUSEHOLD SIZE
4,528
LABOR FORCE [ PEOPLE ]
38.9%
PERCENT IN LABOR FORCE
3.1%
UNEMPLOYMENT RATE
Morgan County Area Codes
Income in Morgan County
Income Overview in Morgan County
Per Capita Income in Morgan County is $23,257, while median incomes of families and households are $58,773 and $46,018 respectively.
| Characteristic | Number | Measure |
| Per Capita Income | 13,840 | $23,257 |
| Median Family Income | 3,199 | $58,773 |
| Mean Family Income | 3,199 | $76,541 |
| Median Household Income | 4,665 | $46,018 |
| Mean Household Income | 4,665 | $65,134 |
| Income Deficit | 3,199 | $10,916 |
| Wage / Income Gap (%) | 13,840 | 25.64% |
| Wage / Income Gap ($) | 13,840 | 74.36¢ per $1 |
| Gini / Inequality Index | 13,840 | 0.49 |
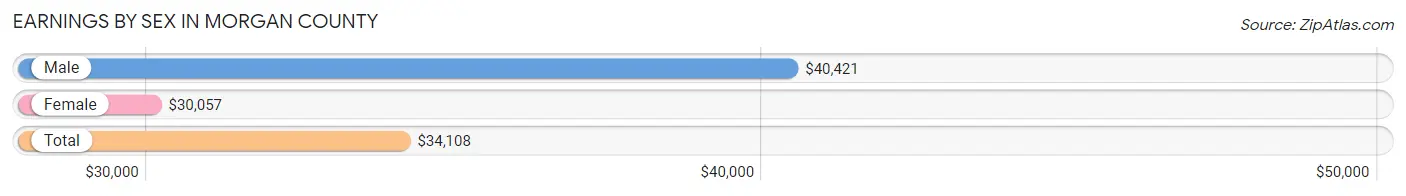
Earnings by Sex in Morgan County
Average Earnings in Morgan County are $34,108, $40,421 for men and $30,057 for women, a difference of 25.6%.
| Sex | Number | Average Earnings |
| Male | 2,744 (55.5%) | $40,421 |
| Female | 2,197 (44.5%) | $30,057 |
| Total | 4,941 (100.0%) | $34,108 |
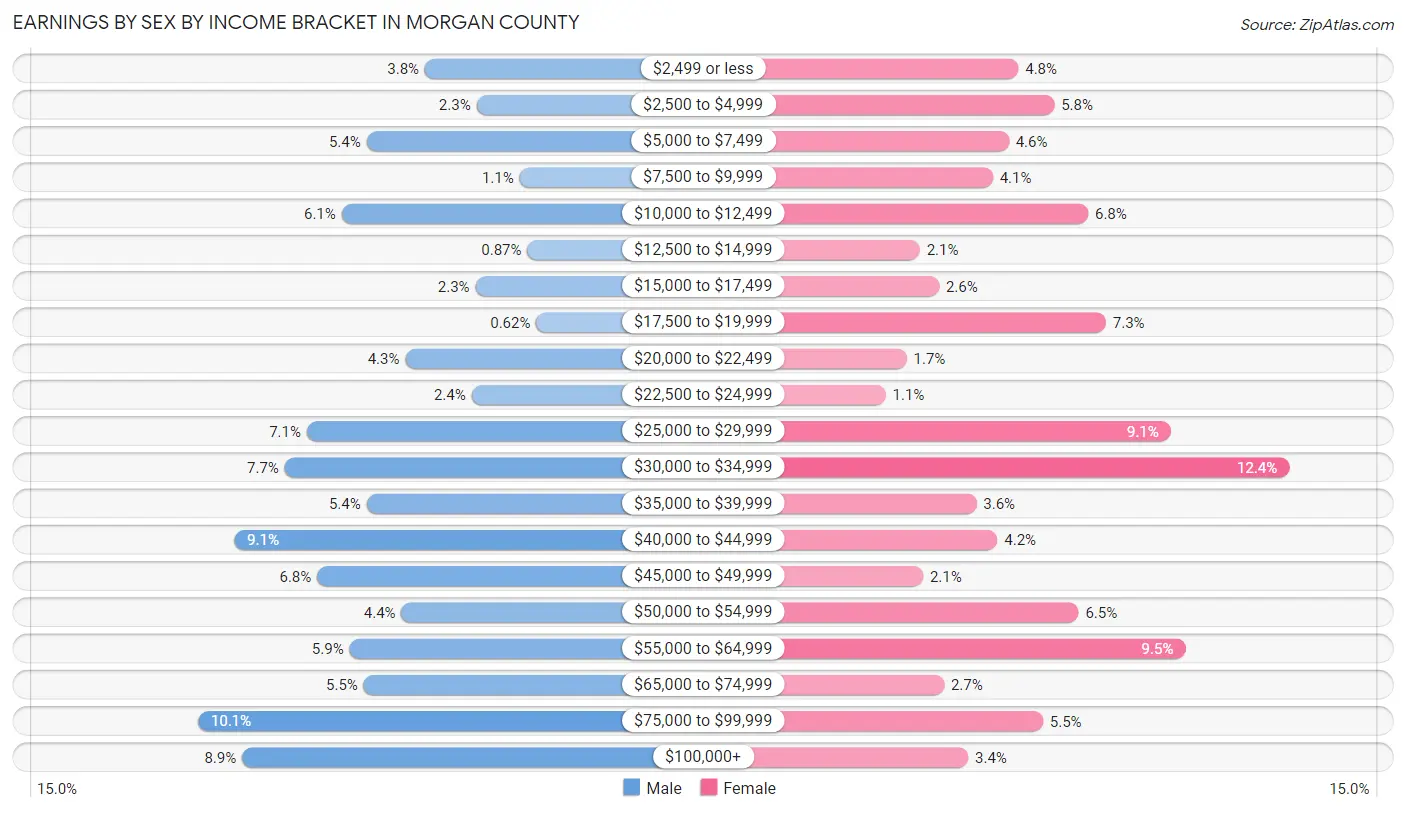
Earnings by Sex by Income Bracket in Morgan County
The most common earnings brackets in Morgan County are $75,000 to $99,999 for men (278 | 10.1%) and $30,000 to $34,999 for women (273 | 12.4%).
| Income | Male | Female |
| $2,499 or less | 103 (3.7%) | 106 (4.8%) |
| $2,500 to $4,999 | 63 (2.3%) | 128 (5.8%) |
| $5,000 to $7,499 | 148 (5.4%) | 100 (4.5%) |
| $7,500 to $9,999 | 30 (1.1%) | 90 (4.1%) |
| $10,000 to $12,499 | 167 (6.1%) | 149 (6.8%) |
| $12,500 to $14,999 | 24 (0.9%) | 45 (2.1%) |
| $15,000 to $17,499 | 64 (2.3%) | 57 (2.6%) |
| $17,500 to $19,999 | 17 (0.6%) | 160 (7.3%) |
| $20,000 to $22,499 | 118 (4.3%) | 37 (1.7%) |
| $22,500 to $24,999 | 67 (2.4%) | 24 (1.1%) |
| $25,000 to $29,999 | 194 (7.1%) | 200 (9.1%) |
| $30,000 to $34,999 | 211 (7.7%) | 273 (12.4%) |
| $35,000 to $39,999 | 148 (5.4%) | 80 (3.6%) |
| $40,000 to $44,999 | 250 (9.1%) | 93 (4.2%) |
| $45,000 to $49,999 | 186 (6.8%) | 47 (2.1%) |
| $50,000 to $54,999 | 121 (4.4%) | 143 (6.5%) |
| $55,000 to $64,999 | 161 (5.9%) | 209 (9.5%) |
| $65,000 to $74,999 | 150 (5.5%) | 60 (2.7%) |
| $75,000 to $99,999 | 278 (10.1%) | 121 (5.5%) |
| $100,000+ | 244 (8.9%) | 75 (3.4%) |
| Total | 2,744 (100.0%) | 2,197 (100.0%) |
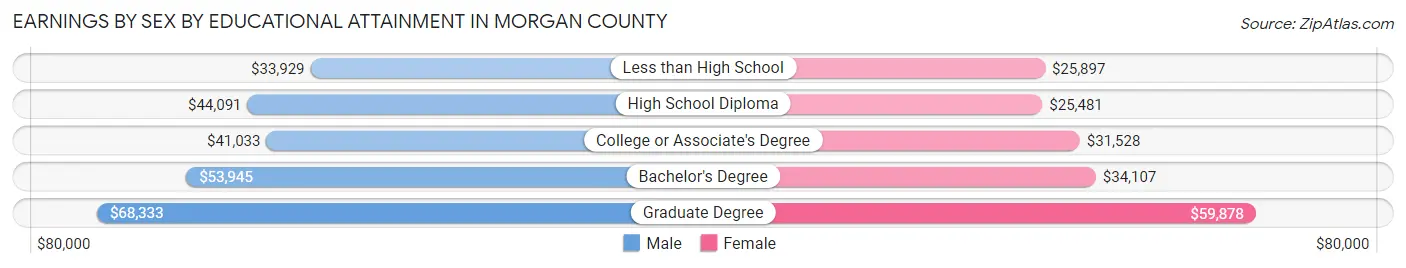
Earnings by Sex by Educational Attainment in Morgan County
Average earnings in Morgan County are $44,336 for men and $31,971 for women, a difference of 27.9%. Men with an educational attainment of graduate degree enjoy the highest average annual earnings of $68,333, while those with less than high school education earn the least with $33,929. Women with an educational attainment of graduate degree earn the most with the average annual earnings of $59,878, while those with high school diploma education have the smallest earnings of $25,481.
| Educational Attainment | Male Income | Female Income |
| Less than High School | $33,929 | $25,897 |
| High School Diploma | $44,091 | $25,481 |
| College or Associate's Degree | $41,033 | $31,528 |
| Bachelor's Degree | $53,945 | $34,107 |
| Graduate Degree | $68,333 | $59,878 |
| Total | $44,336 | $31,971 |
Family Income in Morgan County
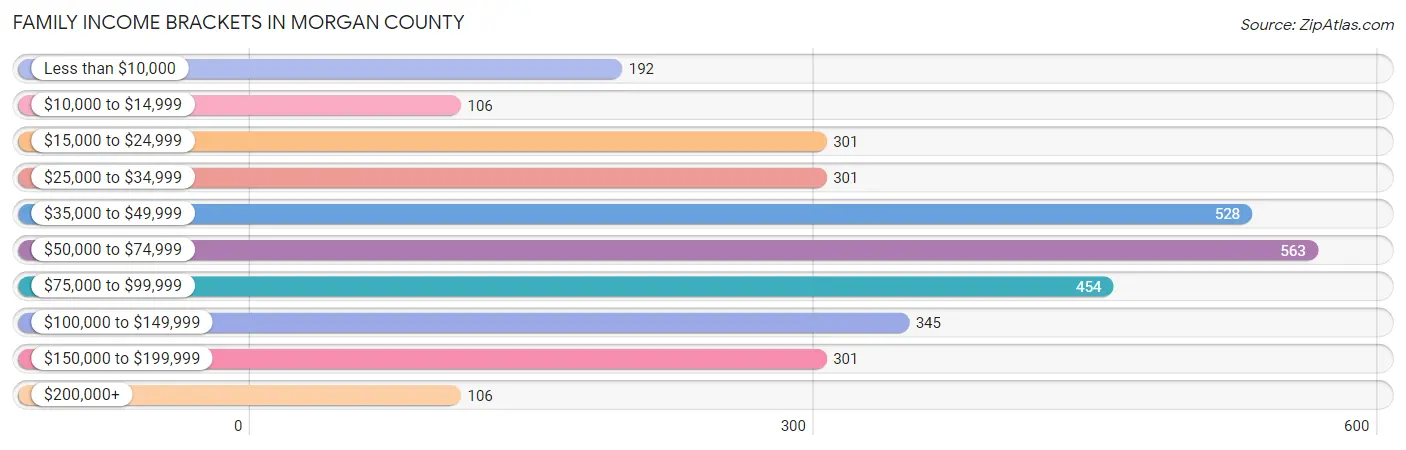
Family Income Brackets in Morgan County
According to the Morgan County family income data, there are 563 families falling into the $50,000 to $74,999 income range, which is the most common income bracket and makes up 17.6% of all families. Conversely, the $10,000 to $14,999 income bracket is the least frequent group with only 106 families (3.3%) belonging to this category.
| Income Bracket | # Families | % Families |
| Less than $10,000 | 192 | 6.0% |
| $10,000 to $14,999 | 106 | 3.3% |
| $15,000 to $24,999 | 301 | 9.4% |
| $25,000 to $34,999 | 301 | 9.4% |
| $35,000 to $49,999 | 528 | 16.5% |
| $50,000 to $74,999 | 563 | 17.6% |
| $75,000 to $99,999 | 454 | 14.2% |
| $100,000 to $149,999 | 345 | 10.8% |
| $150,000 to $199,999 | 301 | 9.4% |
| $200,000+ | 106 | 3.3% |
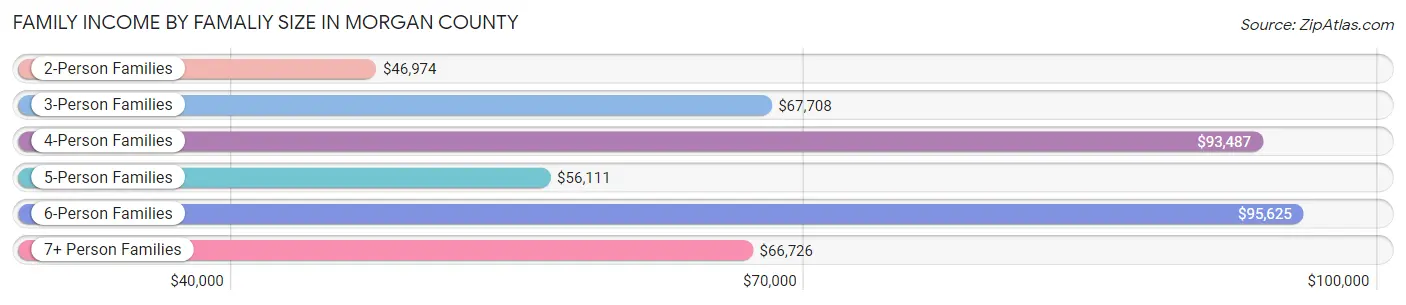
Family Income by Famaliy Size in Morgan County
6-person families (96 | 3.0%) account for the highest median family income in Morgan County with $95,625 per family, while 2-person families (1,498 | 46.8%) have the highest median income of $23,487 per family member.
| Income Bracket | # Families | Median Income |
| 2-Person Families | 1,498 (46.8%) | $46,974 |
| 3-Person Families | 633 (19.8%) | $67,708 |
| 4-Person Families | 661 (20.7%) | $93,487 |
| 5-Person Families | 272 (8.5%) | $56,111 |
| 6-Person Families | 96 (3.0%) | $95,625 |
| 7+ Person Families | 39 (1.2%) | $66,726 |
| Total | 3,199 (100.0%) | $58,773 |
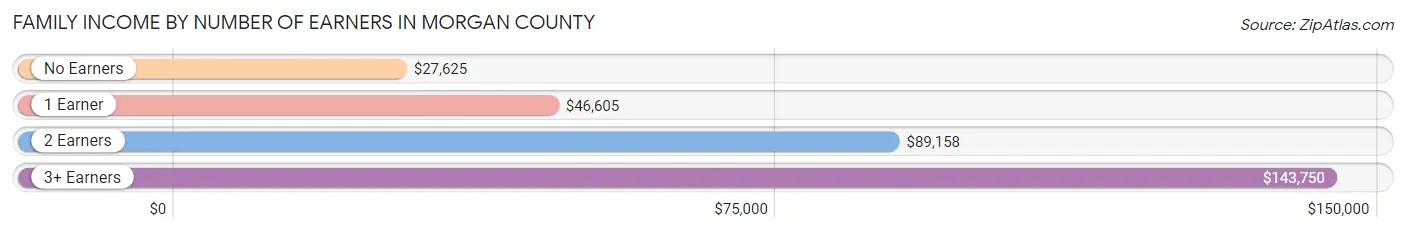
Family Income by Number of Earners in Morgan County
The median family income in Morgan County is $58,773, with families comprising 3+ earners (311) having the highest median family income of $143,750, while families with no earners (881) have the lowest median family income of $27,625, accounting for 9.7% and 27.5% of families, respectively.
| Number of Earners | # Families | Median Income |
| No Earners | 881 (27.5%) | $27,625 |
| 1 Earner | 1,040 (32.5%) | $46,605 |
| 2 Earners | 967 (30.2%) | $89,158 |
| 3+ Earners | 311 (9.7%) | $143,750 |
| Total | 3,199 (100.0%) | $58,773 |
Household Income in Morgan County
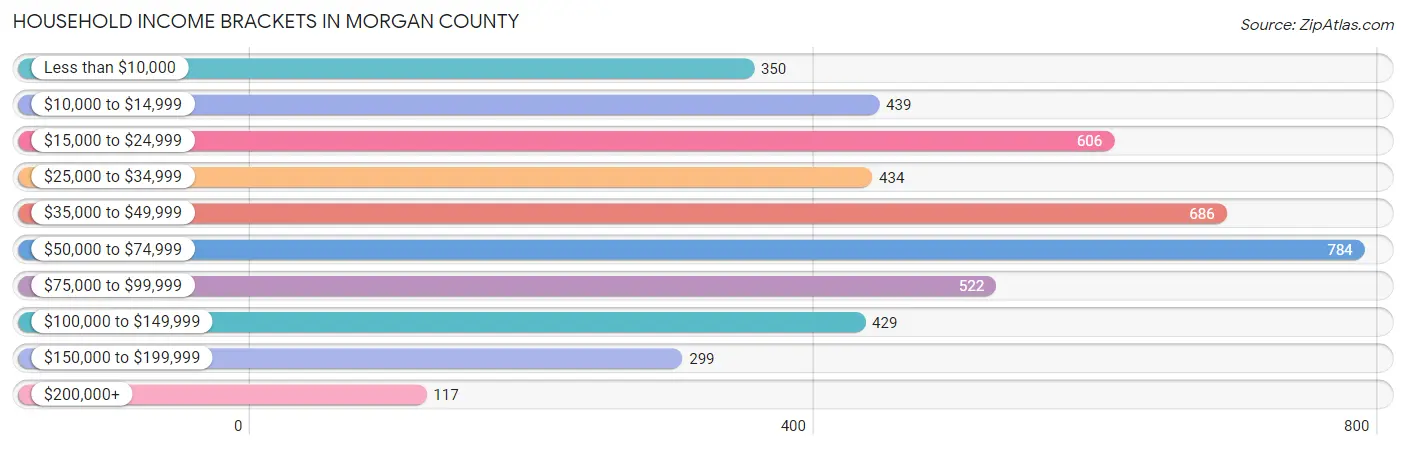
Household Income Brackets in Morgan County
With 784 households falling in the category, the $50,000 to $74,999 income range is the most frequent in Morgan County, accounting for 16.8% of all households. In contrast, only 117 households (2.5%) fall into the $200,000+ income bracket, making it the least populous group.
| Income Bracket | # Households | % Households |
| Less than $10,000 | 350 | 7.5% |
| $10,000 to $14,999 | 439 | 9.4% |
| $15,000 to $24,999 | 606 | 13.0% |
| $25,000 to $34,999 | 434 | 9.3% |
| $35,000 to $49,999 | 686 | 14.7% |
| $50,000 to $74,999 | 784 | 16.8% |
| $75,000 to $99,999 | 522 | 11.2% |
| $100,000 to $149,999 | 429 | 9.2% |
| $150,000 to $199,999 | 299 | 6.4% |
| $200,000+ | 117 | 2.5% |
Household Income by Householder Age in Morgan County
The median household income in Morgan County is $46,018, with the highest median household income of $64,194 found in the 25 to 44 years age bracket for the primary householder. A total of 1,312 households (28.1%) fall into this category. Meanwhile, the 65+ years age bracket for the primary householder has the lowest median household income of $30,119, with 1,520 households (32.6%) in this group.
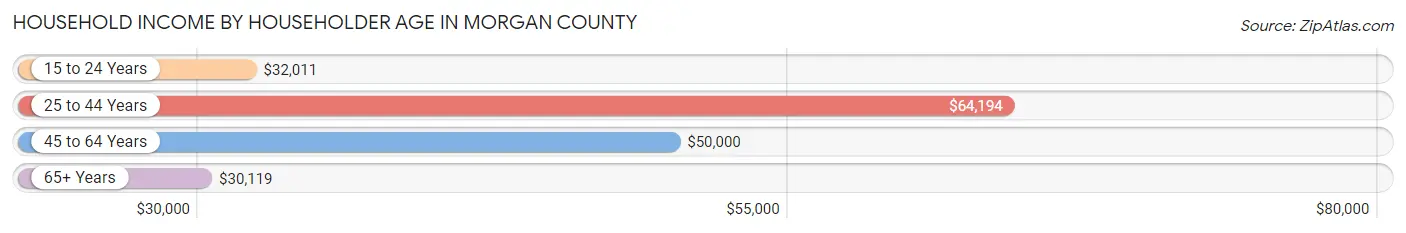
| Income Bracket | # Households | Median Income |
| 15 to 24 Years | 91 (1.9%) | $32,011 |
| 25 to 44 Years | 1,312 (28.1%) | $64,194 |
| 45 to 64 Years | 1,742 (37.3%) | $50,000 |
| 65+ Years | 1,520 (32.6%) | $30,119 |
| Total | 4,665 (100.0%) | $46,018 |
Poverty in Morgan County
Income Below Poverty by Sex and Age in Morgan County
With 17.1% poverty level for males and 24.1% for females among the residents of Morgan County, 15 year old males and 5 year old females are the most vulnerable to poverty, with 20 males (28.6%) and 38 females (62.3%) in their respective age groups living below the poverty level.
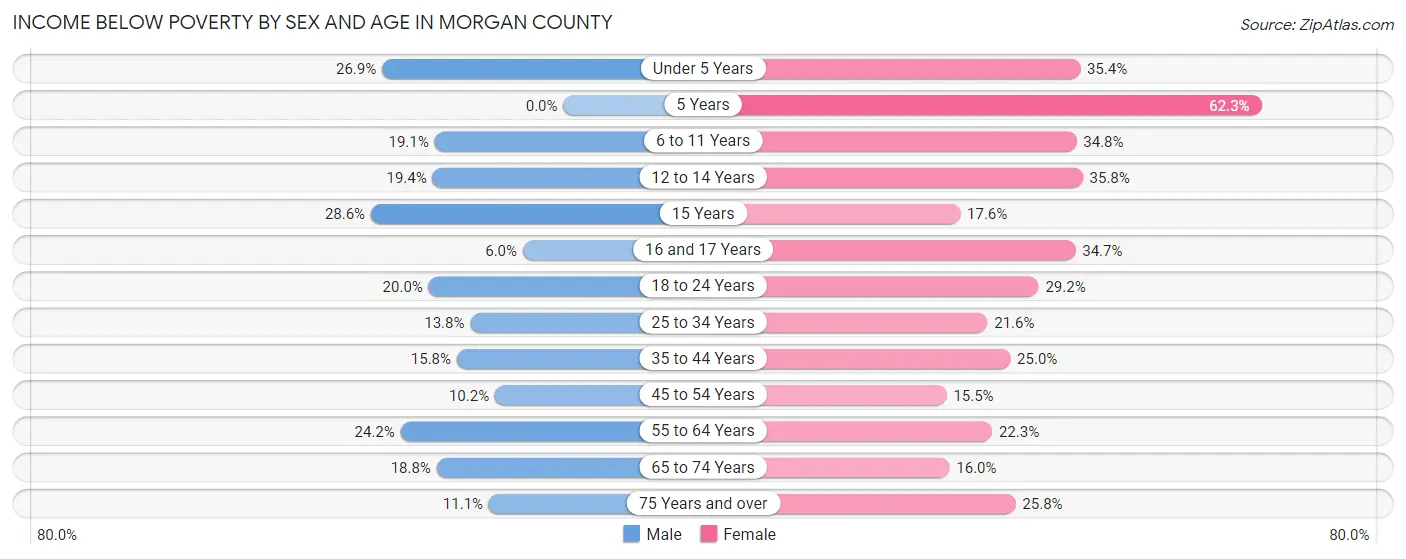
| Age Bracket | Male | Female |
| Under 5 Years | 91 (26.9%) | 110 (35.4%) |
| 5 Years | 0 (0.0%) | 38 (62.3%) |
| 6 to 11 Years | 88 (19.1%) | 132 (34.8%) |
| 12 to 14 Years | 54 (19.4%) | 59 (35.8%) |
| 15 Years | 20 (28.6%) | 13 (17.6%) |
| 16 and 17 Years | 14 (6.0%) | 52 (34.7%) |
| 18 to 24 Years | 113 (20.0%) | 104 (29.2%) |
| 25 to 34 Years | 106 (13.8%) | 145 (21.6%) |
| 35 to 44 Years | 129 (15.8%) | 188 (25.0%) |
| 45 to 54 Years | 88 (10.2%) | 127 (15.5%) |
| 55 to 64 Years | 213 (24.2%) | 196 (22.3%) |
| 65 to 74 Years | 142 (18.8%) | 118 (16.0%) |
| 75 Years and over | 39 (11.1%) | 115 (25.8%) |
| Total | 1,097 (17.1%) | 1,397 (24.1%) |
Income Above Poverty by Sex and Age in Morgan County
According to the poverty statistics in Morgan County, males aged 5 years and females aged 45 to 54 years are the age groups that are most secure financially, with 100.0% of males and 84.5% of females in these age groups living above the poverty line.
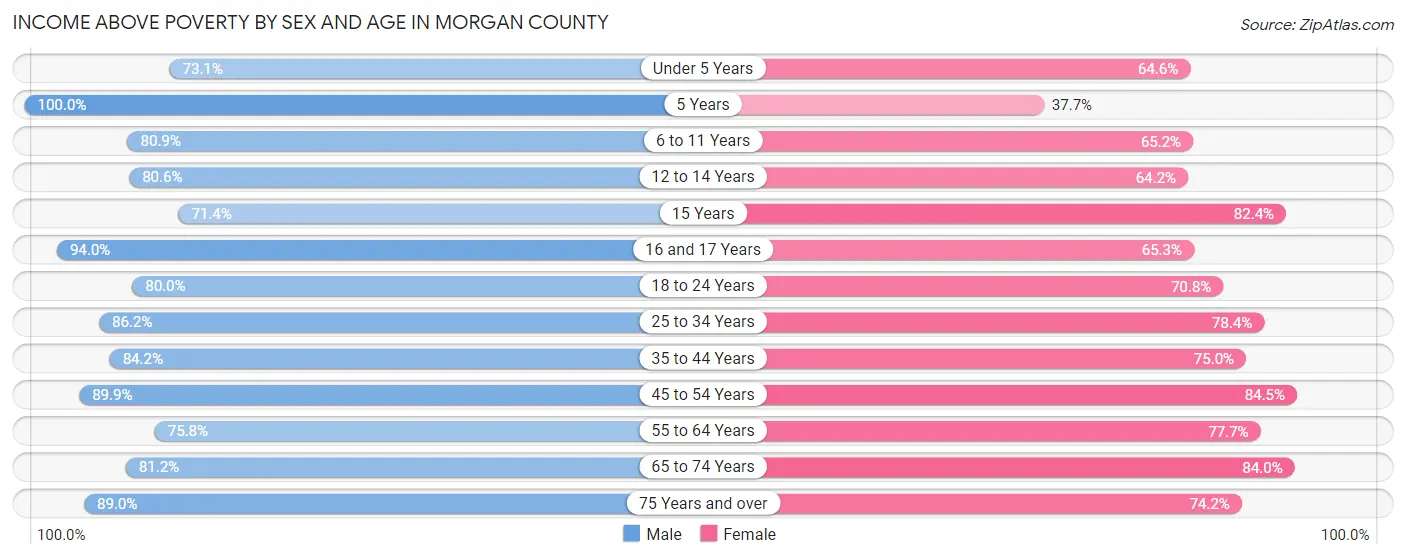
| Age Bracket | Male | Female |
| Under 5 Years | 247 (73.1%) | 201 (64.6%) |
| 5 Years | 22 (100.0%) | 23 (37.7%) |
| 6 to 11 Years | 372 (80.9%) | 247 (65.2%) |
| 12 to 14 Years | 224 (80.6%) | 106 (64.2%) |
| 15 Years | 50 (71.4%) | 61 (82.4%) |
| 16 and 17 Years | 219 (94.0%) | 98 (65.3%) |
| 18 to 24 Years | 452 (80.0%) | 252 (70.8%) |
| 25 to 34 Years | 661 (86.2%) | 526 (78.4%) |
| 35 to 44 Years | 687 (84.2%) | 564 (75.0%) |
| 45 to 54 Years | 779 (89.8%) | 690 (84.5%) |
| 55 to 64 Years | 668 (75.8%) | 683 (77.7%) |
| 65 to 74 Years | 613 (81.2%) | 621 (84.0%) |
| 75 Years and over | 314 (88.9%) | 331 (74.2%) |
| Total | 5,308 (82.9%) | 4,403 (75.9%) |
Income Below Poverty Among Married-Couple Families in Morgan County
The poverty statistics for married-couple families in Morgan County show that 9.9% or 246 of the total 2,488 families live below the poverty line. Families with 3 or 4 children have the highest poverty rate of 23.6%, comprising of 49 families. On the other hand, families with 5 or more children have the lowest poverty rate of 0.0%, which includes 0 families.
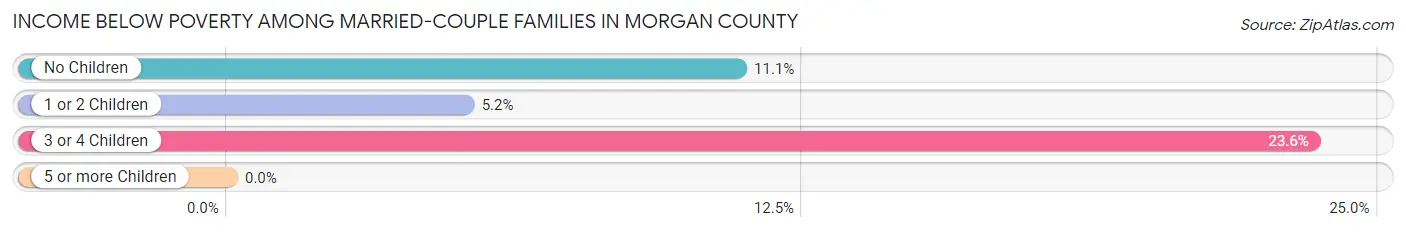
| Children | Above Poverty | Below Poverty |
| No Children | 1,196 (88.9%) | 149 (11.1%) |
| 1 or 2 Children | 884 (94.9%) | 48 (5.1%) |
| 3 or 4 Children | 159 (76.4%) | 49 (23.6%) |
| 5 or more Children | 3 (100.0%) | 0 (0.0%) |
| Total | 2,242 (90.1%) | 246 (9.9%) |
Income Below Poverty Among Single-Parent Households in Morgan County
According to the poverty data in Morgan County, 19.0% or 31 single-father households and 47.3% or 259 single-mother households are living below the poverty line. Among single-father households, those with 1 or 2 children have the highest poverty rate, with 28 households (40.6%) experiencing poverty. Likewise, among single-mother households, those with 3 or 4 children have the highest poverty rate, with 68 households (100.0%) falling below the poverty line.
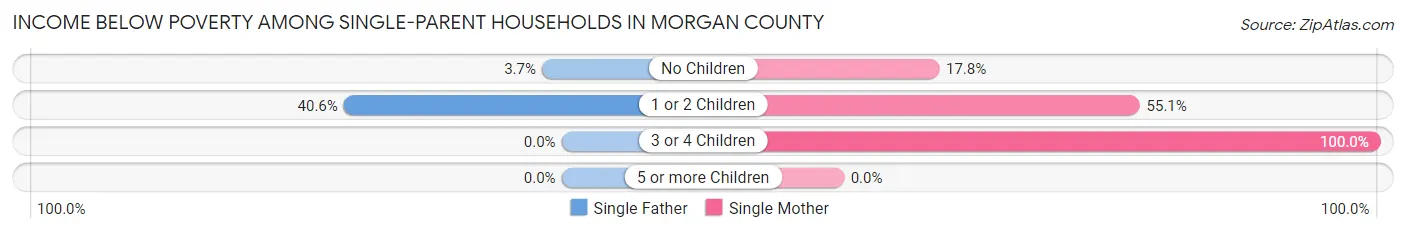
| Children | Single Father | Single Mother |
| No Children | 3 (3.7%) | 35 (17.8%) |
| 1 or 2 Children | 28 (40.6%) | 156 (55.1%) |
| 3 or 4 Children | 0 (0.0%) | 68 (100.0%) |
| 5 or more Children | 0 (0.0%) | 0 (0.0%) |
| Total | 31 (19.0%) | 259 (47.3%) |
Income Below Poverty Among Married-Couple vs Single-Parent Households in Morgan County
The poverty data for Morgan County shows that 246 of the married-couple family households (9.9%) and 290 of the single-parent households (40.8%) are living below the poverty level. Within the married-couple family households, those with 3 or 4 children have the highest poverty rate, with 49 households (23.6%) falling below the poverty line. Among the single-parent households, those with 3 or 4 children have the highest poverty rate, with 68 household (90.7%) living below poverty.
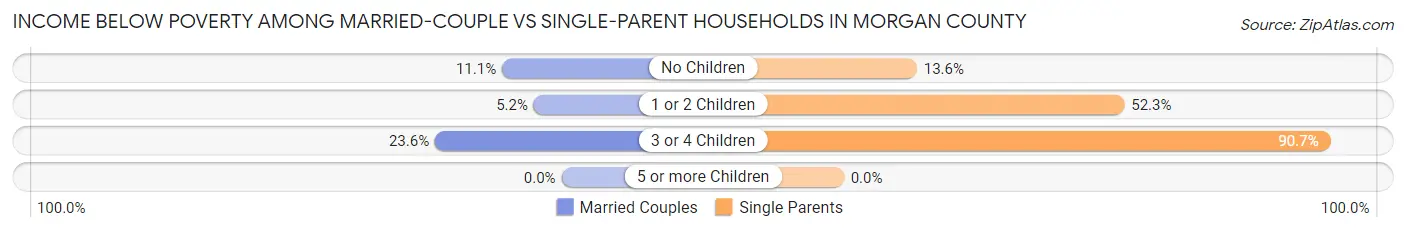
| Children | Married-Couple Families | Single-Parent Households |
| No Children | 149 (11.1%) | 38 (13.6%) |
| 1 or 2 Children | 48 (5.1%) | 184 (52.3%) |
| 3 or 4 Children | 49 (23.6%) | 68 (90.7%) |
| 5 or more Children | 0 (0.0%) | 0 (0.0%) |
| Total | 246 (9.9%) | 290 (40.8%) |
Race in Morgan County
The most populous races in Morgan County are White / Caucasian (12,764 | 92.2%), Black / African American (563 | 4.1%), and Two or more Races (157 | 1.1%).
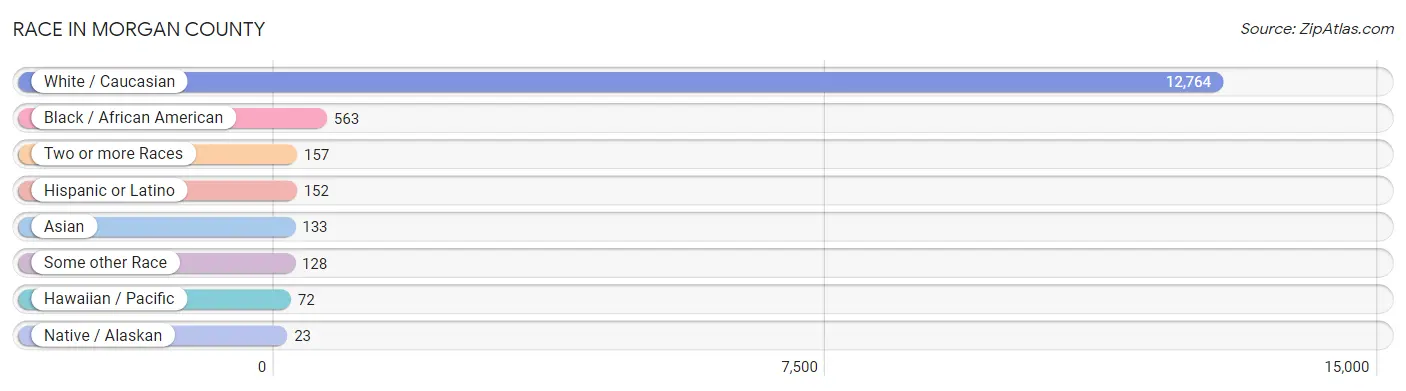
| Race | # Population | % Population |
| Asian | 133 | 1.0% |
| Black / African American | 563 | 4.1% |
| Hawaiian / Pacific | 72 | 0.5% |
| Hispanic or Latino | 152 | 1.1% |
| Native / Alaskan | 23 | 0.2% |
| White / Caucasian | 12,764 | 92.2% |
| Two or more Races | 157 | 1.1% |
| Some other Race | 128 | 0.9% |
| Total | 13,840 | 100.0% |
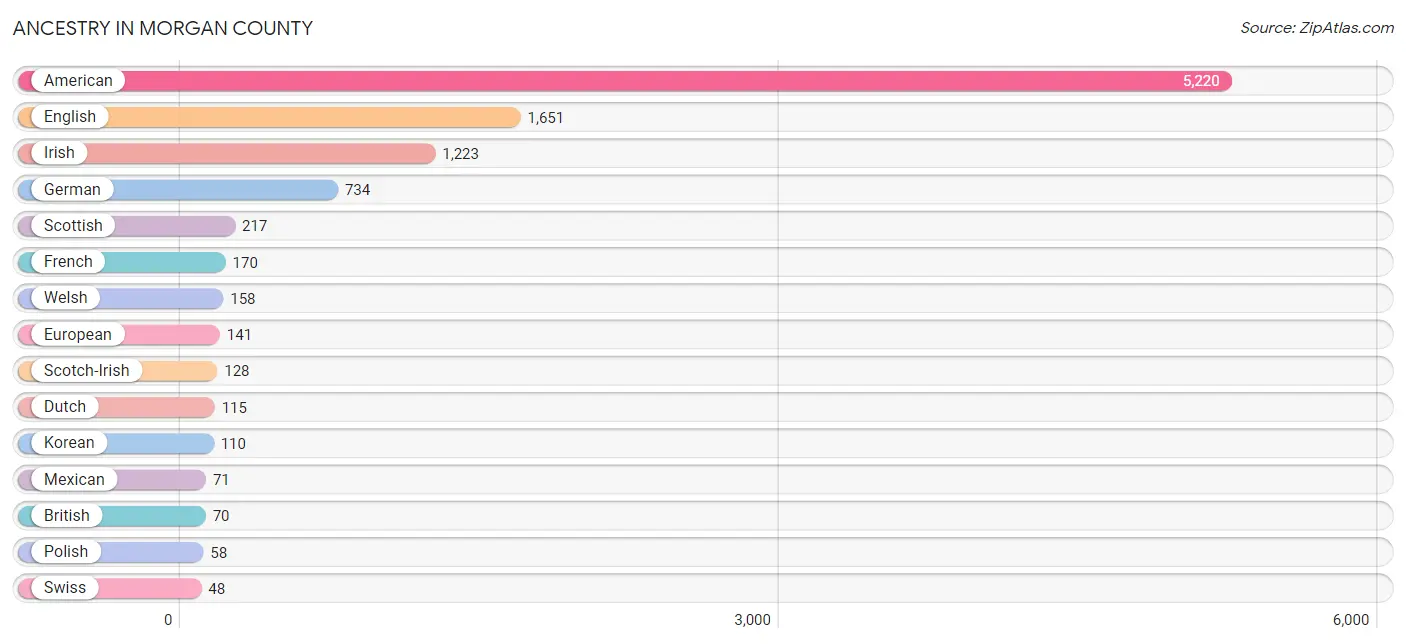
Ancestry in Morgan County
The most populous ancestries reported in Morgan County are American (5,220 | 37.7%), English (1,651 | 11.9%), Irish (1,223 | 8.8%), German (734 | 5.3%), and Scottish (217 | 1.6%), together accounting for 65.4% of all Morgan County residents.
| Ancestry | # Population | % Population |
| African | 7 | 0.1% |
| American | 5,220 | 37.7% |
| Blackfeet | 7 | 0.1% |
| British | 70 | 0.5% |
| Canadian | 11 | 0.1% |
| Central American | 28 | 0.2% |
| Cherokee | 4 | 0.0% |
| Cuban | 8 | 0.1% |
| Czech | 1 | 0.0% |
| Danish | 9 | 0.1% |
| Dutch | 115 | 0.8% |
| English | 1,651 | 11.9% |
| European | 141 | 1.0% |
| French | 170 | 1.2% |
| French Canadian | 23 | 0.2% |
| German | 734 | 5.3% |
| Greek | 31 | 0.2% |
| Honduran | 28 | 0.2% |
| Indian (Asian) | 16 | 0.1% |
| Irish | 1,223 | 8.8% |
| Italian | 37 | 0.3% |
| Korean | 110 | 0.8% |
| Mexican | 71 | 0.5% |
| Norwegian | 16 | 0.1% |
| Polish | 58 | 0.4% |
| Portuguese | 4 | 0.0% |
| Puerto Rican | 7 | 0.1% |
| Scotch-Irish | 128 | 0.9% |
| Scottish | 217 | 1.6% |
| Somali | 8 | 0.1% |
| Subsaharan African | 15 | 0.1% |
| Swedish | 5 | 0.0% |
| Swiss | 48 | 0.4% |
| Ute | 15 | 0.1% |
| Welsh | 158 | 1.1% | View All 35 Rows |
Immigrants in Morgan County
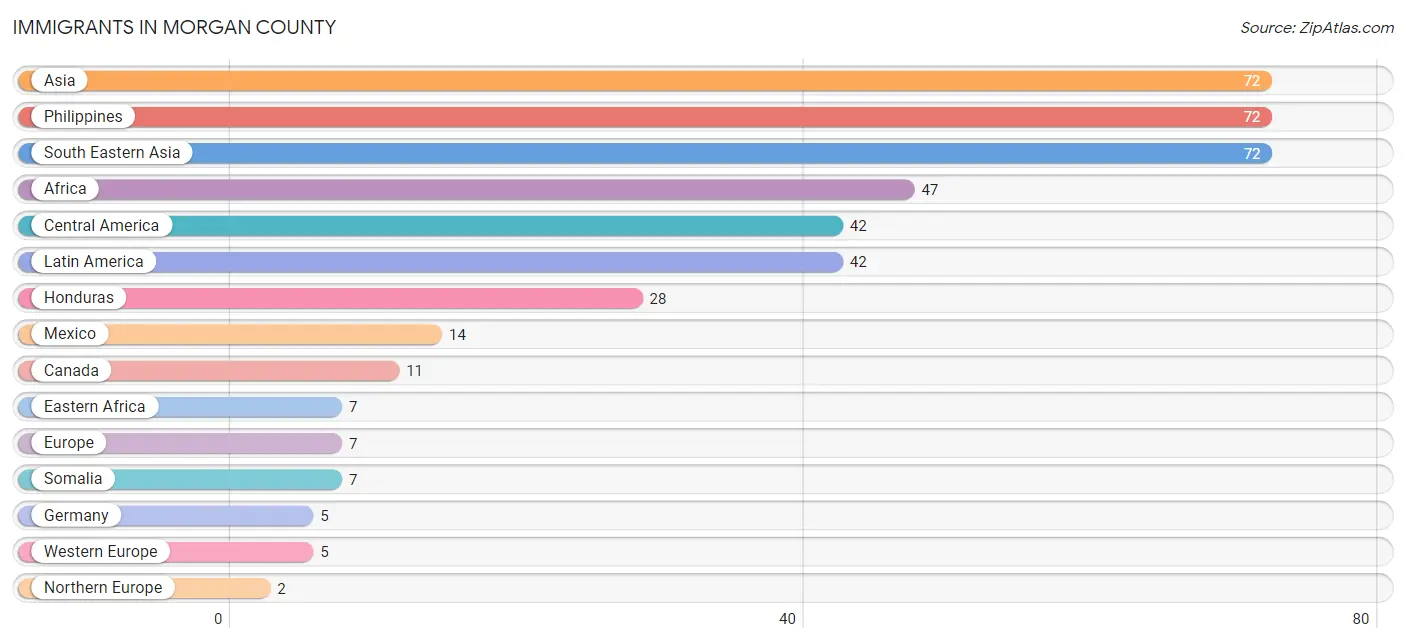
The most numerous immigrant groups reported in Morgan County came from Asia (72 | 0.5%), Philippines (72 | 0.5%), South Eastern Asia (72 | 0.5%), Africa (47 | 0.3%), and Central America (42 | 0.3%), together accounting for 2.2% of all Morgan County residents.
| Immigration Origin | # Population | % Population |
| Africa | 47 | 0.3% |
| Asia | 72 | 0.5% |
| Canada | 11 | 0.1% |
| Central America | 42 | 0.3% |
| Eastern Africa | 7 | 0.1% |
| Europe | 7 | 0.1% |
| Germany | 5 | 0.0% |
| Honduras | 28 | 0.2% |
| Latin America | 42 | 0.3% |
| Mexico | 14 | 0.1% |
| Northern Europe | 2 | 0.0% |
| Philippines | 72 | 0.5% |
| Somalia | 7 | 0.1% |
| South Eastern Asia | 72 | 0.5% |
| Western Europe | 5 | 0.0% | View All 15 Rows |
Sex and Age in Morgan County
Sex and Age in Morgan County
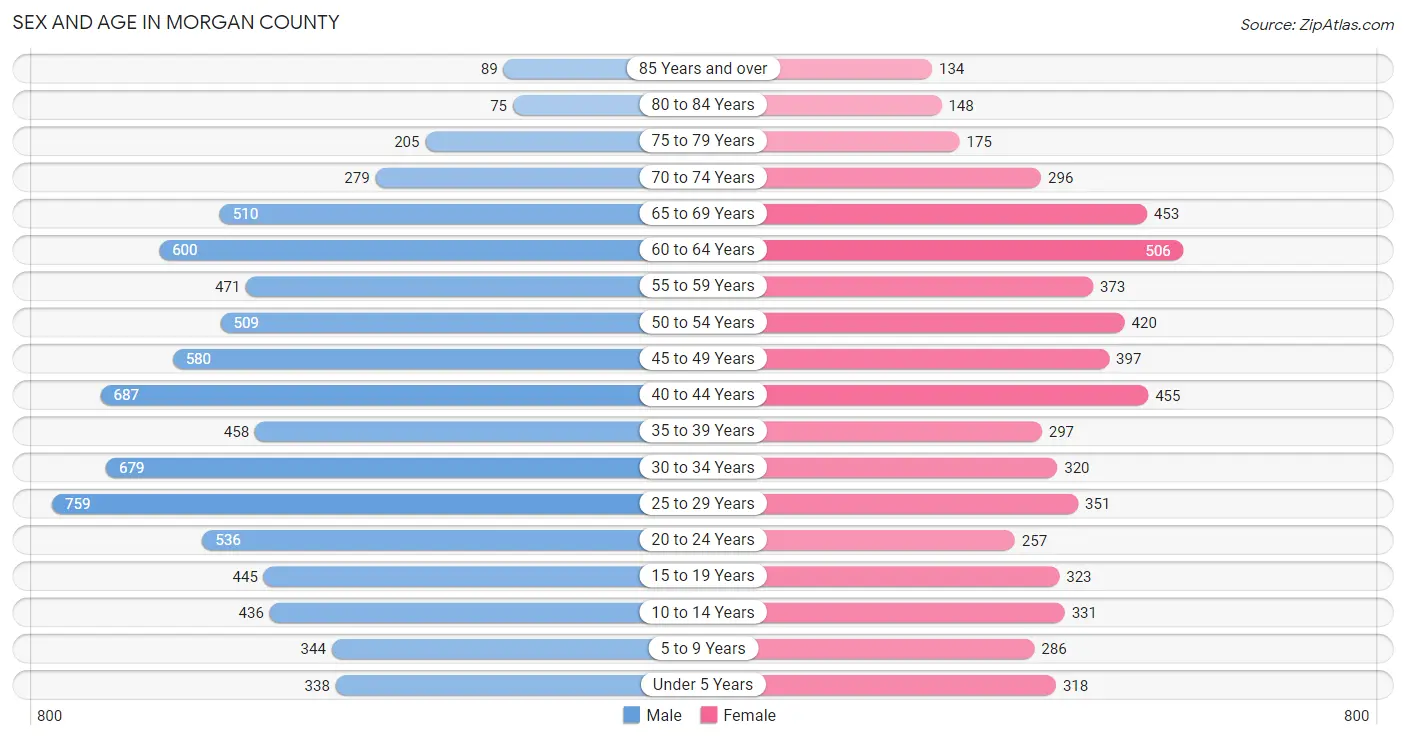
The most populous age groups in Morgan County are 25 to 29 Years (759 | 9.5%) for men and 60 to 64 Years (506 | 8.7%) for women.
| Age Bracket | Male | Female |
| Under 5 Years | 338 (4.2%) | 318 (5.4%) |
| 5 to 9 Years | 344 (4.3%) | 286 (4.9%) |
| 10 to 14 Years | 436 (5.4%) | 331 (5.7%) |
| 15 to 19 Years | 445 (5.6%) | 323 (5.5%) |
| 20 to 24 Years | 536 (6.7%) | 257 (4.4%) |
| 25 to 29 Years | 759 (9.5%) | 351 (6.0%) |
| 30 to 34 Years | 679 (8.5%) | 320 (5.5%) |
| 35 to 39 Years | 458 (5.7%) | 297 (5.1%) |
| 40 to 44 Years | 687 (8.6%) | 455 (7.8%) |
| 45 to 49 Years | 580 (7.2%) | 397 (6.8%) |
| 50 to 54 Years | 509 (6.4%) | 420 (7.2%) |
| 55 to 59 Years | 471 (5.9%) | 373 (6.4%) |
| 60 to 64 Years | 600 (7.5%) | 506 (8.7%) |
| 65 to 69 Years | 510 (6.4%) | 453 (7.8%) |
| 70 to 74 Years | 279 (3.5%) | 296 (5.1%) |
| 75 to 79 Years | 205 (2.6%) | 175 (3.0%) |
| 80 to 84 Years | 75 (0.9%) | 148 (2.5%) |
| 85 Years and over | 89 (1.1%) | 134 (2.3%) |
| Total | 8,000 (100.0%) | 5,840 (100.0%) |
Families and Households in Morgan County
Median Family Size in Morgan County
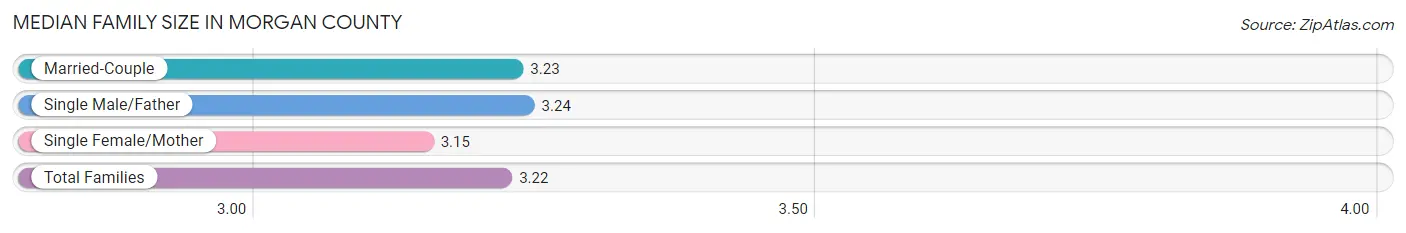
The median family size in Morgan County is 3.22 persons per family, with single male/father families (163 | 5.1%) accounting for the largest median family size of 3.24 persons per family. On the other hand, single female/mother families (548 | 17.1%) represent the smallest median family size with 3.15 persons per family.
| Family Type | # Families | Family Size |
| Married-Couple | 2,488 (77.8%) | 3.23 |
| Single Male/Father | 163 (5.1%) | 3.24 |
| Single Female/Mother | 548 (17.1%) | 3.15 |
| Total Families | 3,199 (100.0%) | 3.22 |
Median Household Size in Morgan County
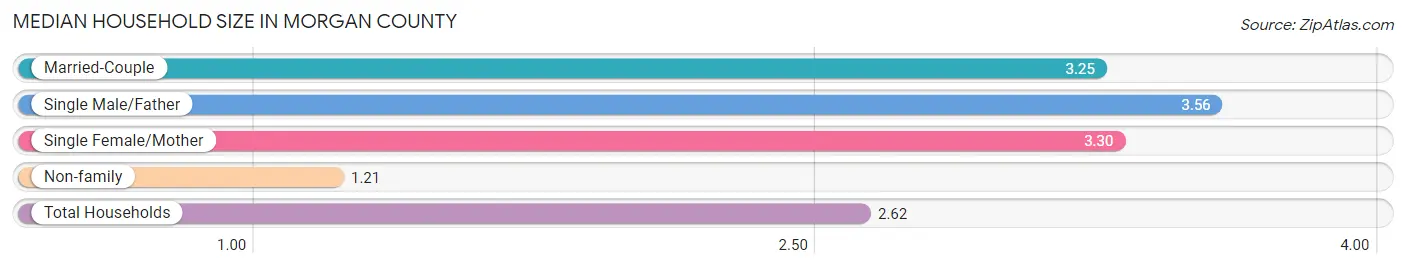
The median household size in Morgan County is 2.62 persons per household, with single male/father households (163 | 3.5%) accounting for the largest median household size of 3.56 persons per household. non-family households (1,466 | 31.4%) represent the smallest median household size with 1.21 persons per household.
| Household Type | # Households | Household Size |
| Married-Couple | 2,488 (53.3%) | 3.25 |
| Single Male/Father | 163 (3.5%) | 3.56 |
| Single Female/Mother | 548 (11.7%) | 3.30 |
| Non-family | 1,466 (31.4%) | 1.21 |
| Total Households | 4,665 (100.0%) | 2.62 |
Household Size by Marriage Status in Morgan County
Out of a total of 4,665 households in Morgan County, 3,199 (68.6%) are family households, while 1,466 (31.4%) are nonfamily households. The most numerous type of family households are 2-person households, comprising 1,466, and the most common type of nonfamily households are 1-person households, comprising 1,167.
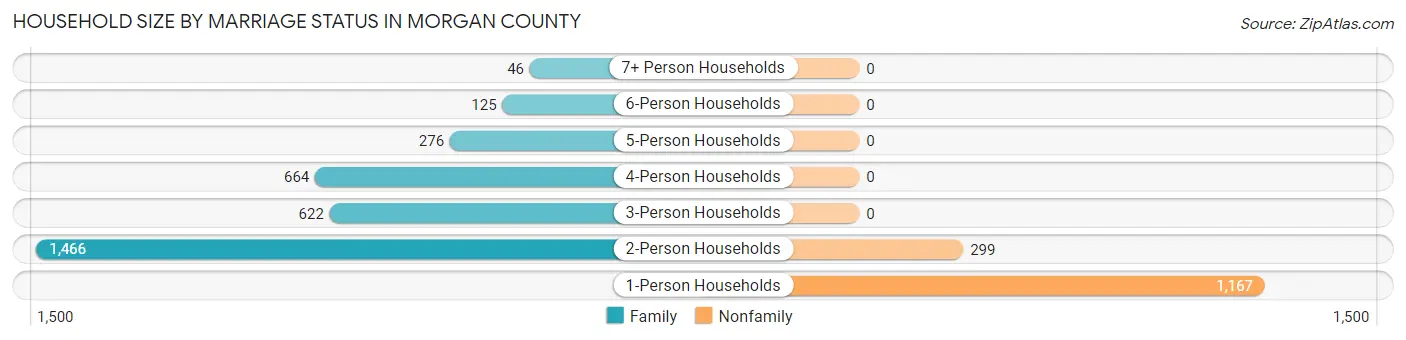
| Household Size | Family Households | Nonfamily Households |
| 1-Person Households | - | 1,167 (25.0%) |
| 2-Person Households | 1,466 (31.4%) | 299 (6.4%) |
| 3-Person Households | 622 (13.3%) | 0 (0.0%) |
| 4-Person Households | 664 (14.2%) | 0 (0.0%) |
| 5-Person Households | 276 (5.9%) | 0 (0.0%) |
| 6-Person Households | 125 (2.7%) | 0 (0.0%) |
| 7+ Person Households | 46 (1.0%) | 0 (0.0%) |
| Total | 3,199 (68.6%) | 1,466 (31.4%) |
Female Fertility in Morgan County
Fertility by Age in Morgan County
Average fertility rate in Morgan County is 47.0 births per 1,000 women. Women in the age bracket of 20 to 34 years have the highest fertility rate with 91.0 births per 1,000 women. Women in the age bracket of 20 to 34 years acount for 71.8% of all women with births.
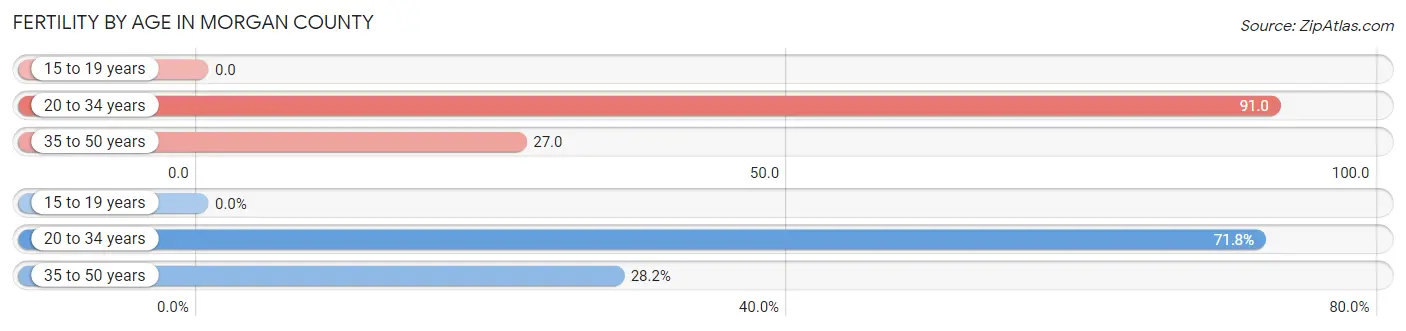
| Age Bracket | Women with Births | Births / 1,000 Women |
| 15 to 19 years | 0 (0.0%) | 0.0 |
| 20 to 34 years | 84 (71.8%) | 91.0 |
| 35 to 50 years | 33 (28.2%) | 27.0 |
| Total | 117 (100.0%) | 47.0 |
Fertility by Age by Marriage Status in Morgan County
88.0% of women with births (117) in Morgan County are married. The highest percentage of unmarried women with births falls into 35 to 50 years age bracket with 42.4% of them unmarried at the time of birth, while the lowest percentage of unmarried women with births belong to 20 to 34 years age bracket with 0.0% of them unmarried.
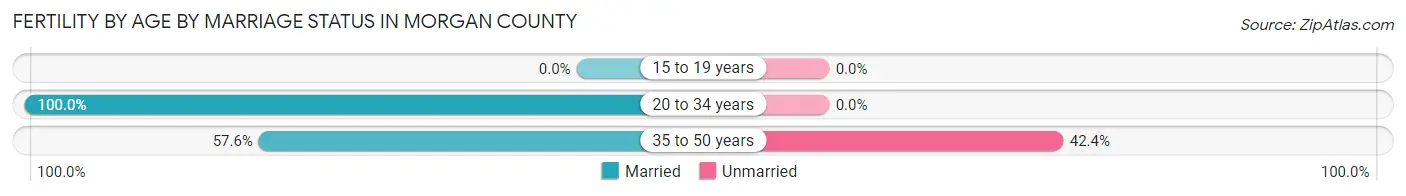
| Age Bracket | Married | Unmarried |
| 15 to 19 years | 0 (0.0%) | 0 (0.0%) |
| 20 to 34 years | 84 (100.0%) | 0 (0.0%) |
| 35 to 50 years | 19 (57.6%) | 14 (42.4%) |
| Total | 103 (88.0%) | 14 (12.0%) |
Fertility by Education in Morgan County
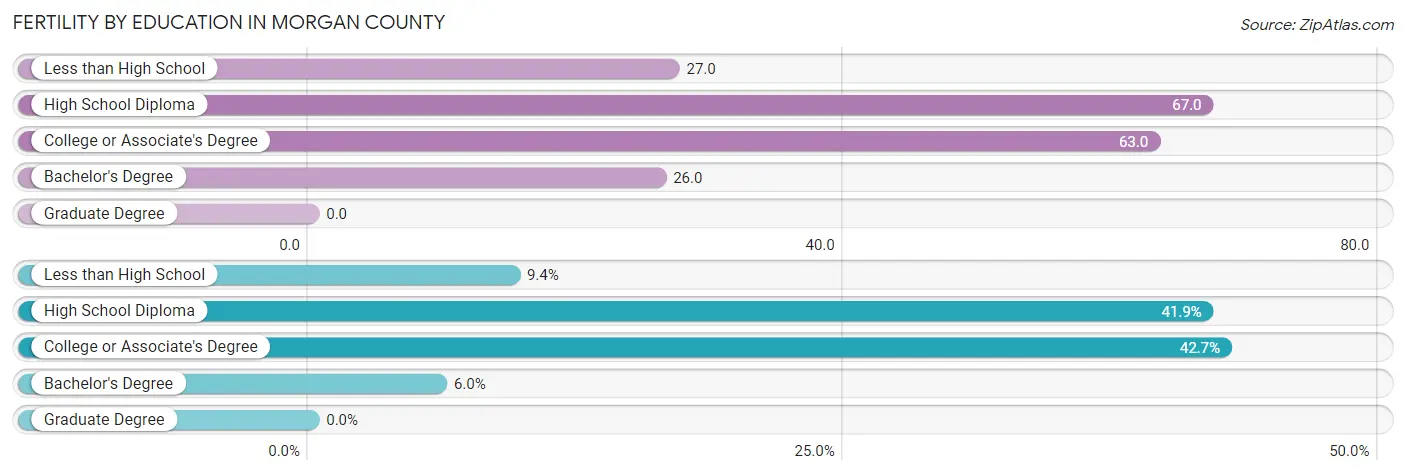
| Educational Attainment | Women with Births | Births / 1,000 Women |
| Less than High School | 11 (9.4%) | 27.0 |
| High School Diploma | 49 (41.9%) | 67.0 |
| College or Associate's Degree | 50 (42.7%) | 63.0 |
| Bachelor's Degree | 7 (6.0%) | 26.0 |
| Graduate Degree | 0 (0.0%) | 0.0 |
| Total | 117 (100.0%) | 47.0 |
Fertility by Education by Marriage Status in Morgan County
12.0% of women with births in Morgan County are unmarried. Women with the educational attainment of less than high school are most likely to be married with 100.0% of them married at childbirth, while women with the educational attainment of college or associate's degree are least likely to be married with 28.0% of them unmarried at childbirth.
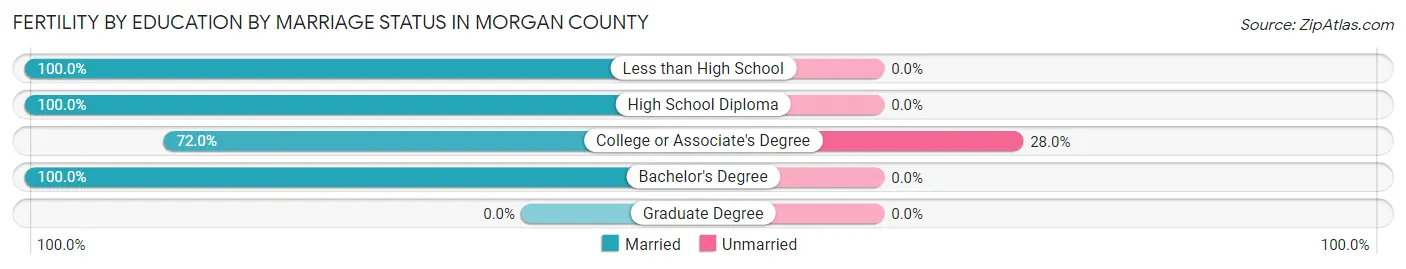
| Educational Attainment | Married | Unmarried |
| Less than High School | 11 (100.0%) | 0 (0.0%) |
| High School Diploma | 49 (100.0%) | 0 (0.0%) |
| College or Associate's Degree | 36 (72.0%) | 14 (28.0%) |
| Bachelor's Degree | 7 (100.0%) | 0 (0.0%) |
| Graduate Degree | 0 (0.0%) | 0 (0.0%) |
| Total | 103 (88.0%) | 14 (12.0%) |
Employment Characteristics in Morgan County
Employment by Class of Employer in Morgan County
Among the 4,323 employed individuals in Morgan County, private company employees (2,280 | 52.7%), state government employees (640 | 14.8%), and not-for-profit organizations (403 | 9.3%) make up the most common classes of employment.
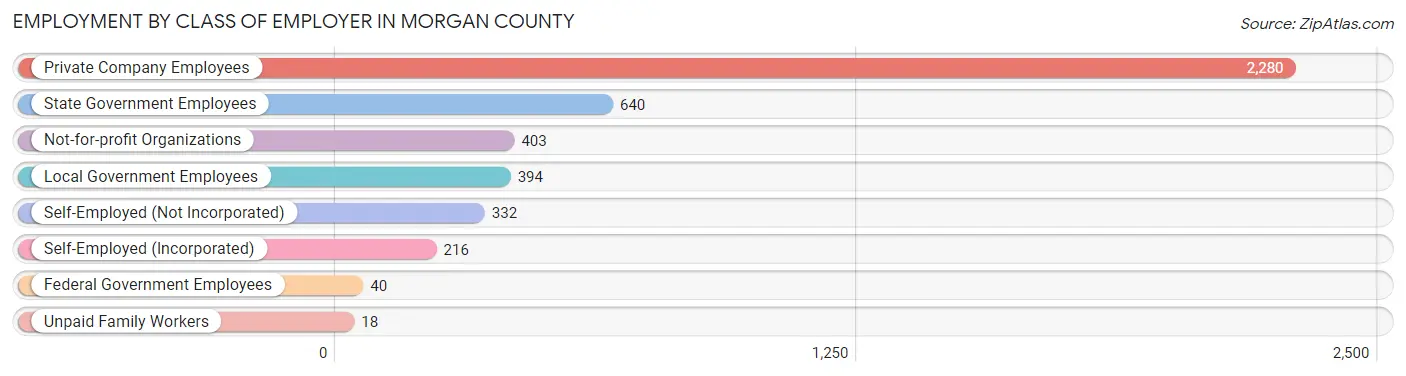
| Employer Class | # Employees | % Employees |
| Private Company Employees | 2,280 | 52.7% |
| Self-Employed (Incorporated) | 216 | 5.0% |
| Self-Employed (Not Incorporated) | 332 | 7.7% |
| Not-for-profit Organizations | 403 | 9.3% |
| Local Government Employees | 394 | 9.1% |
| State Government Employees | 640 | 14.8% |
| Federal Government Employees | 40 | 0.9% |
| Unpaid Family Workers | 18 | 0.4% |
| Total | 4,323 | 100.0% |
Employment Status by Age in Morgan County
According to the labor force statistics for Morgan County, out of the total population over 16 years of age (11,641), 38.9% or 4,528 individuals are in the labor force, with 3.1% or 140 of them unemployed. The age group with the highest labor force participation rate is 45 to 54 years, with 58.2% or 1,109 individuals in the labor force. Within the labor force, the 65 to 74 years age range has the highest percentage of unemployed individuals, with 5.9% or 12 of them being unemployed.
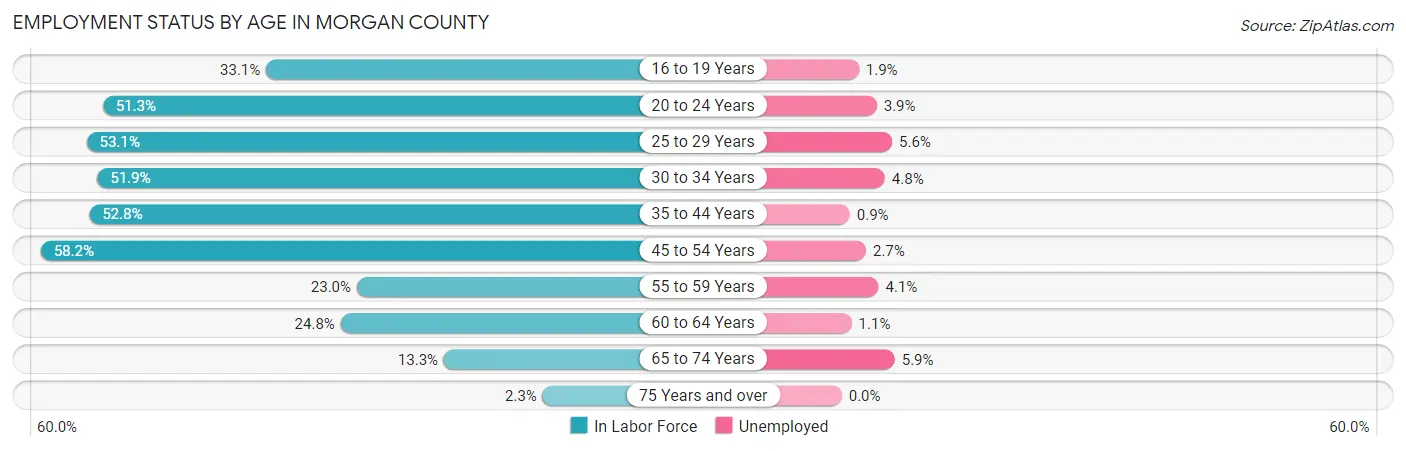
| Age Bracket | In Labor Force | Unemployed |
| 16 to 19 Years | 206 (33.1%) | 4 (1.9%) |
| 20 to 24 Years | 407 (51.3%) | 16 (3.9%) |
| 25 to 29 Years | 589 (53.1%) | 33 (5.6%) |
| 30 to 34 Years | 518 (51.9%) | 25 (4.8%) |
| 35 to 44 Years | 1,002 (52.8%) | 9 (0.9%) |
| 45 to 54 Years | 1,109 (58.2%) | 30 (2.7%) |
| 55 to 59 Years | 194 (23.0%) | 8 (4.1%) |
| 60 to 64 Years | 274 (24.8%) | 3 (1.1%) |
| 65 to 74 Years | 205 (13.3%) | 12 (5.9%) |
| 75 Years and over | 19 (2.3%) | 0 (0.0%) |
| Total | 4,528 (38.9%) | 140 (3.1%) |
Employment Status by Educational Attainment in Morgan County
According to labor force statistics for Morgan County, 46.9% of individuals (3,687) out of the total population between 25 and 64 years of age (7,862) are in the labor force, with 2.9% or 107 of them being unemployed. The group with the highest labor force participation rate are those with the educational attainment of bachelor's degree or higher, with 76.2% or 1,145 individuals in the labor force. Within the labor force, individuals with less than high school education have the highest percentage of unemployment, with 11.6% or 44 of them being unemployed.
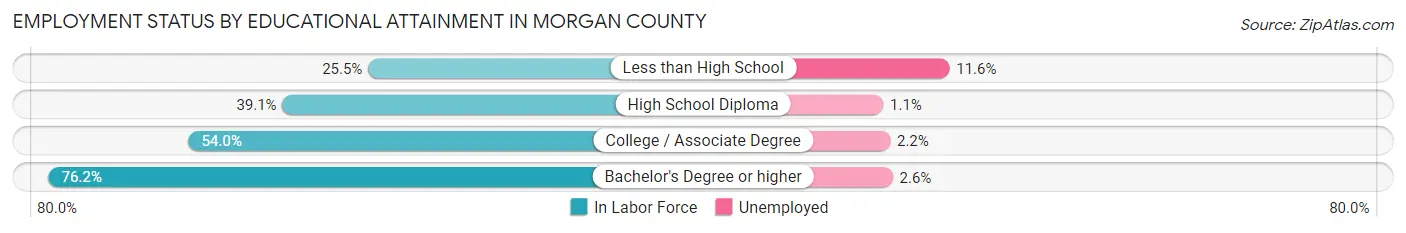
| Educational Attainment | In Labor Force | Unemployed |
| Less than High School | 380 (25.5%) | 173 (11.6%) |
| High School Diploma | 1,227 (39.1%) | 35 (1.1%) |
| College / Associate Degree | 936 (54.0%) | 38 (2.2%) |
| Bachelor's Degree or higher | 1,145 (76.2%) | 39 (2.6%) |
| Total | 3,687 (46.9%) | 228 (2.9%) |
Employment Occupations by Sex in Morgan County
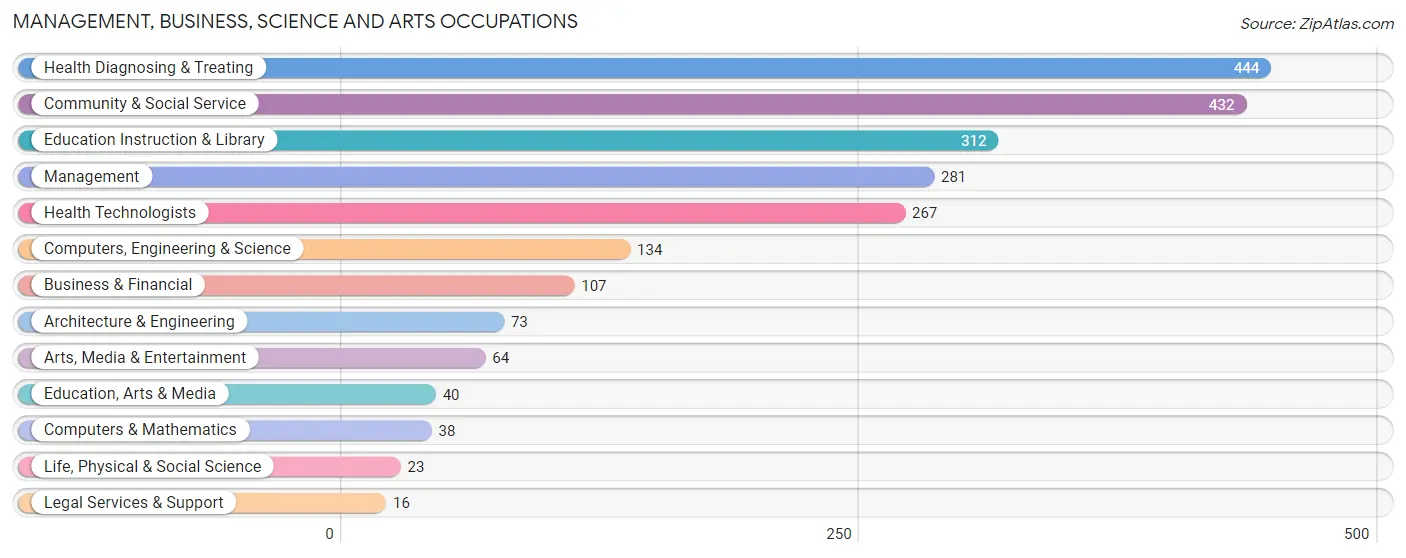
Management, Business, Science and Arts Occupations
The most common Management, Business, Science and Arts occupations in Morgan County are Health Diagnosing & Treating (444 | 10.2%), Community & Social Service (432 | 9.9%), Education Instruction & Library (312 | 7.1%), Management (281 | 6.4%), and Health Technologists (267 | 6.1%).
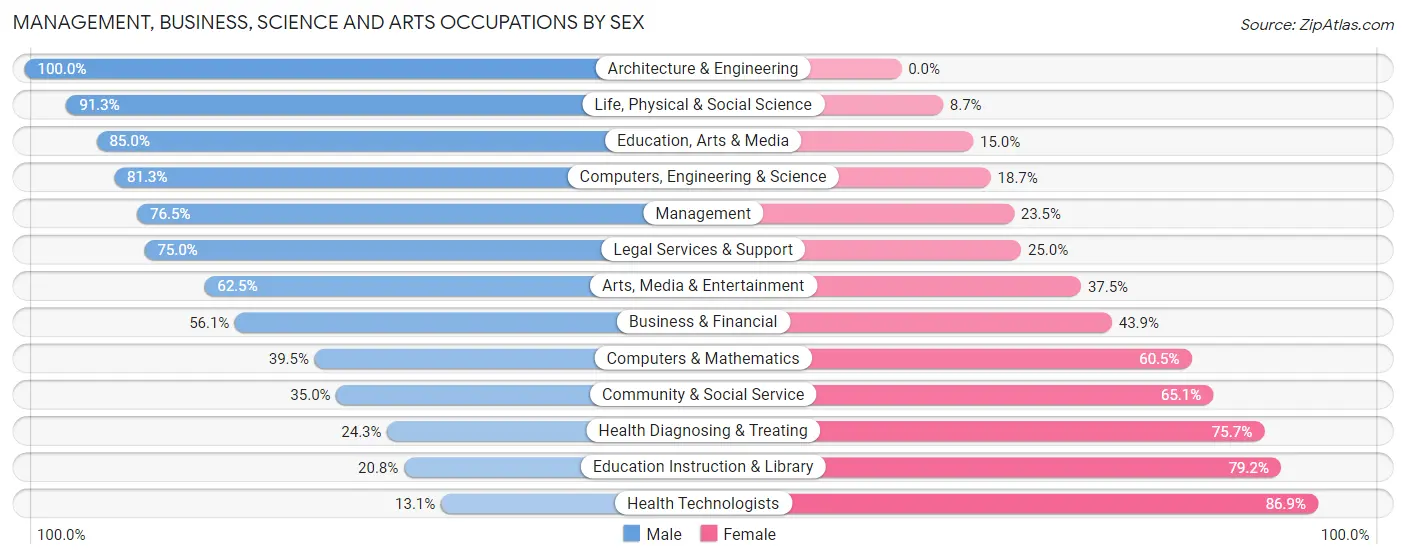
Management, Business, Science and Arts Occupations by Sex
Within the Management, Business, Science and Arts occupations in Morgan County, the most male-oriented occupations are Architecture & Engineering (100.0%), Life, Physical & Social Science (91.3%), and Education, Arts & Media (85.0%), while the most female-oriented occupations are Health Technologists (86.9%), Education Instruction & Library (79.2%), and Health Diagnosing & Treating (75.7%).
| Occupation | Male | Female |
| Management | 215 (76.5%) | 66 (23.5%) |
| Business & Financial | 60 (56.1%) | 47 (43.9%) |
| Computers, Engineering & Science | 109 (81.3%) | 25 (18.7%) |
| Computers & Mathematics | 15 (39.5%) | 23 (60.5%) |
| Architecture & Engineering | 73 (100.0%) | 0 (0.0%) |
| Life, Physical & Social Science | 21 (91.3%) | 2 (8.7%) |
| Community & Social Service | 151 (34.9%) | 281 (65.0%) |
| Education, Arts & Media | 34 (85.0%) | 6 (15.0%) |
| Legal Services & Support | 12 (75.0%) | 4 (25.0%) |
| Education Instruction & Library | 65 (20.8%) | 247 (79.2%) |
| Arts, Media & Entertainment | 40 (62.5%) | 24 (37.5%) |
| Health Diagnosing & Treating | 108 (24.3%) | 336 (75.7%) |
| Health Technologists | 35 (13.1%) | 232 (86.9%) |
| Total (Category) | 643 (46.0%) | 755 (54.0%) |
| Total (Overall) | 2,435 (55.8%) | 1,932 (44.2%) |
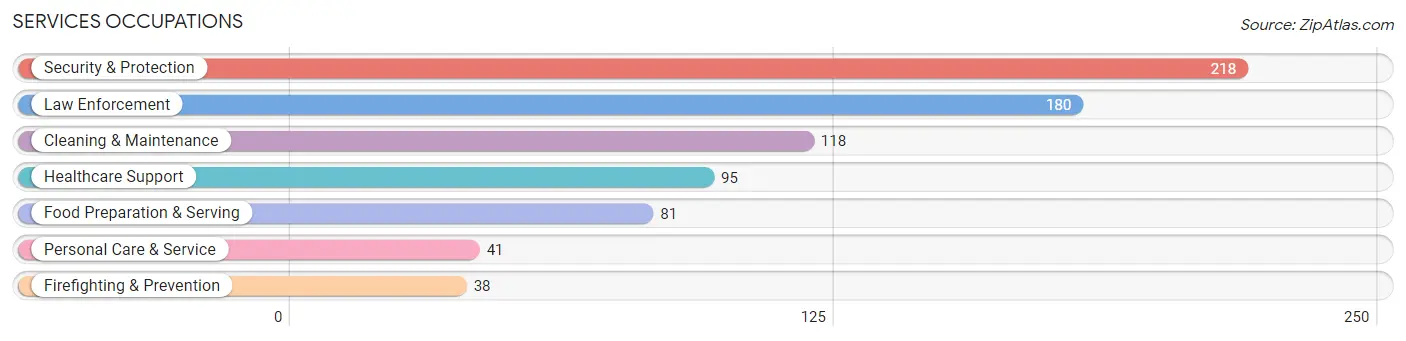
Services Occupations
The most common Services occupations in Morgan County are Security & Protection (218 | 5.0%), Law Enforcement (180 | 4.1%), Cleaning & Maintenance (118 | 2.7%), Healthcare Support (95 | 2.2%), and Food Preparation & Serving (81 | 1.8%).
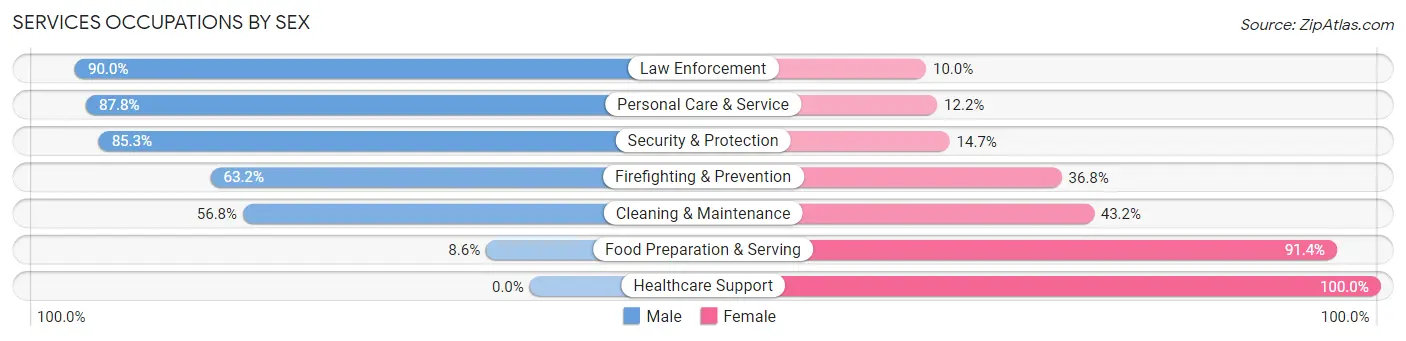
Services Occupations by Sex
Within the Services occupations in Morgan County, the most male-oriented occupations are Law Enforcement (90.0%), Personal Care & Service (87.8%), and Security & Protection (85.3%), while the most female-oriented occupations are Healthcare Support (100.0%), Food Preparation & Serving (91.4%), and Cleaning & Maintenance (43.2%).
| Occupation | Male | Female |
| Healthcare Support | 0 (0.0%) | 95 (100.0%) |
| Security & Protection | 186 (85.3%) | 32 (14.7%) |
| Firefighting & Prevention | 24 (63.2%) | 14 (36.8%) |
| Law Enforcement | 162 (90.0%) | 18 (10.0%) |
| Food Preparation & Serving | 7 (8.6%) | 74 (91.4%) |
| Cleaning & Maintenance | 67 (56.8%) | 51 (43.2%) |
| Personal Care & Service | 36 (87.8%) | 5 (12.2%) |
| Total (Category) | 296 (53.5%) | 257 (46.5%) |
| Total (Overall) | 2,435 (55.8%) | 1,932 (44.2%) |
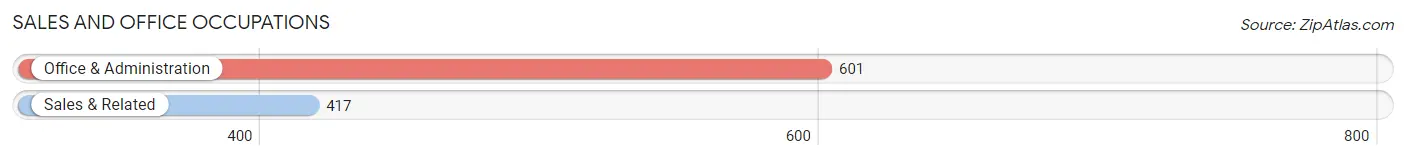
Sales and Office Occupations
The most common Sales and Office occupations in Morgan County are Office & Administration (601 | 13.8%), and Sales & Related (417 | 9.6%).
Sales and Office Occupations by Sex
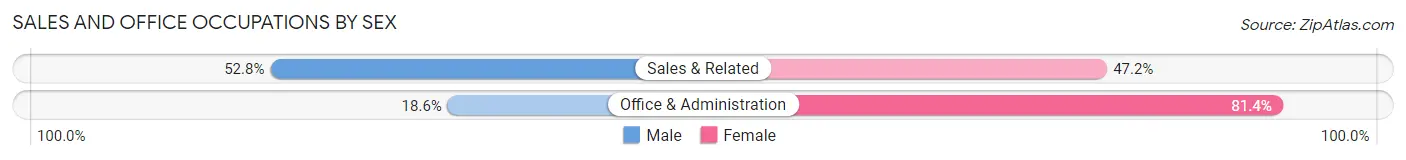
| Occupation | Male | Female |
| Sales & Related | 220 (52.8%) | 197 (47.2%) |
| Office & Administration | 112 (18.6%) | 489 (81.4%) |
| Total (Category) | 332 (32.6%) | 686 (67.4%) |
| Total (Overall) | 2,435 (55.8%) | 1,932 (44.2%) |
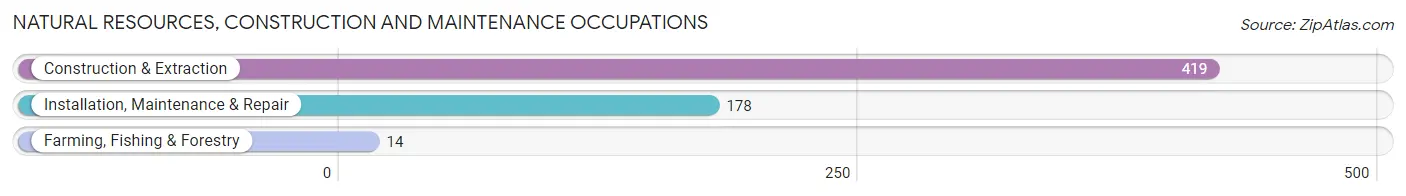
Natural Resources, Construction and Maintenance Occupations
The most common Natural Resources, Construction and Maintenance occupations in Morgan County are Construction & Extraction (419 | 9.6%), Installation, Maintenance & Repair (178 | 4.1%), and Farming, Fishing & Forestry (14 | 0.3%).
Natural Resources, Construction and Maintenance Occupations by Sex
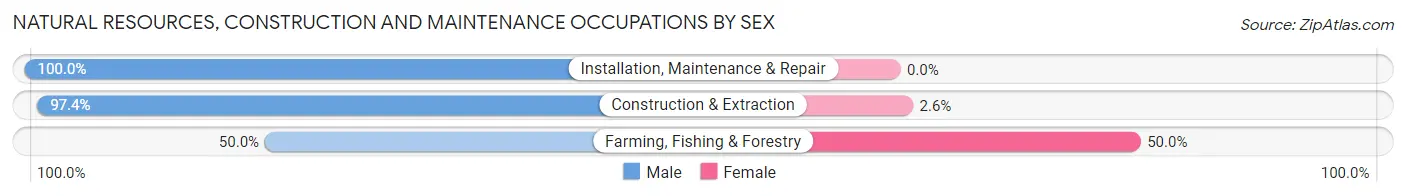
| Occupation | Male | Female |
| Farming, Fishing & Forestry | 7 (50.0%) | 7 (50.0%) |
| Construction & Extraction | 408 (97.4%) | 11 (2.6%) |
| Installation, Maintenance & Repair | 178 (100.0%) | 0 (0.0%) |
| Total (Category) | 593 (97.1%) | 18 (2.9%) |
| Total (Overall) | 2,435 (55.8%) | 1,932 (44.2%) |
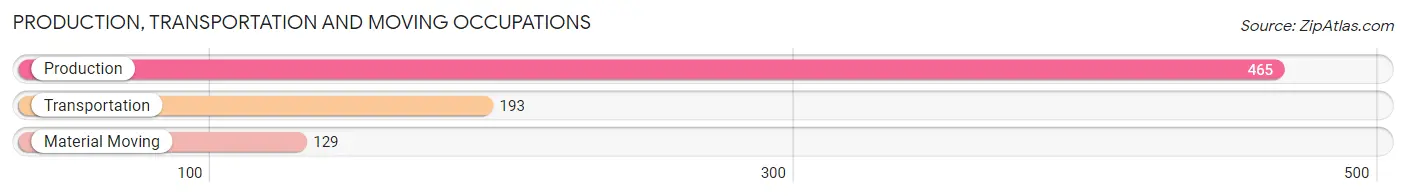
Production, Transportation and Moving Occupations
The most common Production, Transportation and Moving occupations in Morgan County are Production (465 | 10.6%), Transportation (193 | 4.4%), and Material Moving (129 | 2.9%).
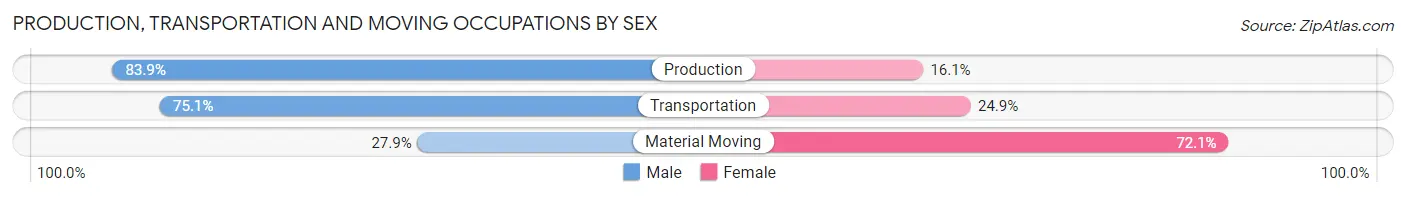
Production, Transportation and Moving Occupations by Sex
| Occupation | Male | Female |
| Production | 390 (83.9%) | 75 (16.1%) |
| Transportation | 145 (75.1%) | 48 (24.9%) |
| Material Moving | 36 (27.9%) | 93 (72.1%) |
| Total (Category) | 571 (72.6%) | 216 (27.5%) |
| Total (Overall) | 2,435 (55.8%) | 1,932 (44.2%) |
Employment Industries by Sex in Morgan County
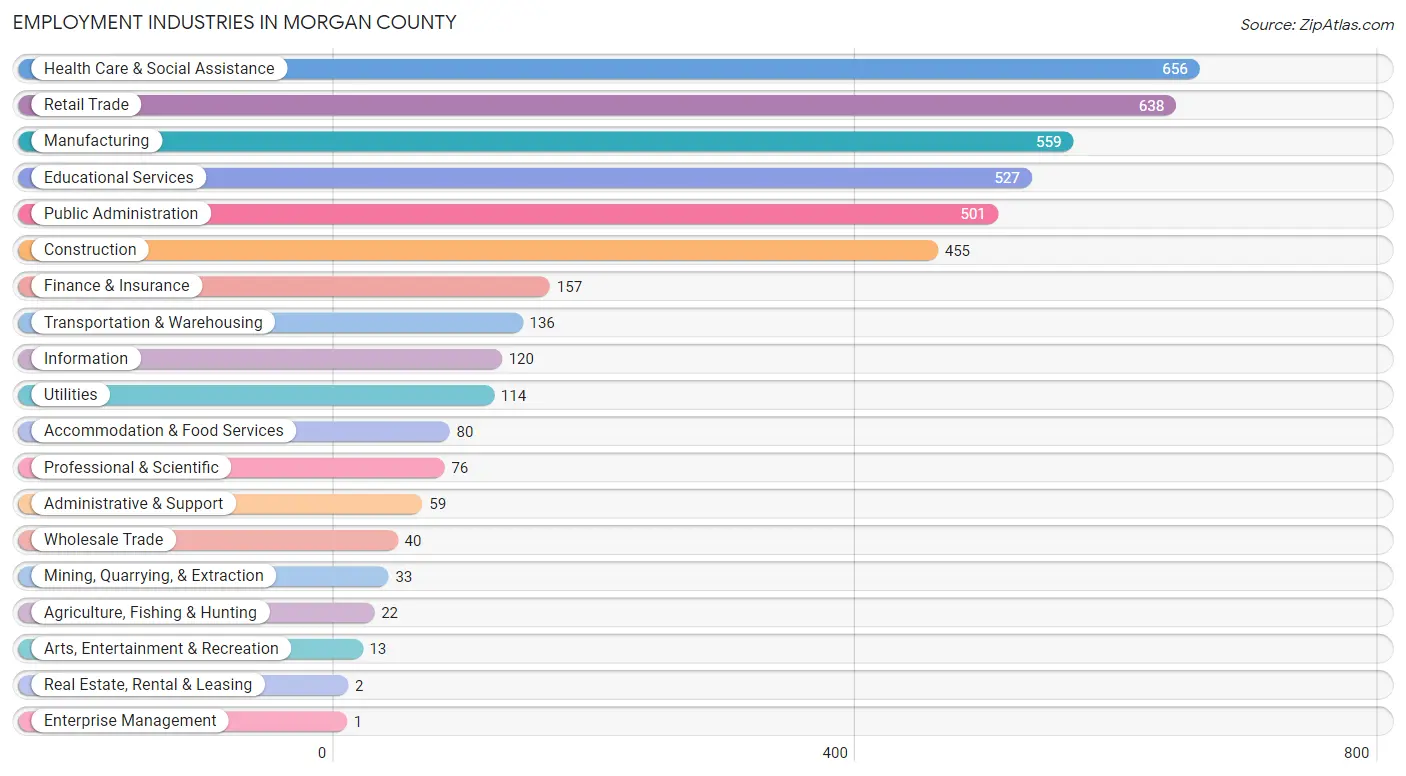
Employment Industries in Morgan County
The major employment industries in Morgan County include Health Care & Social Assistance (656 | 15.0%), Retail Trade (638 | 14.6%), Manufacturing (559 | 12.8%), Educational Services (527 | 12.1%), and Public Administration (501 | 11.5%).
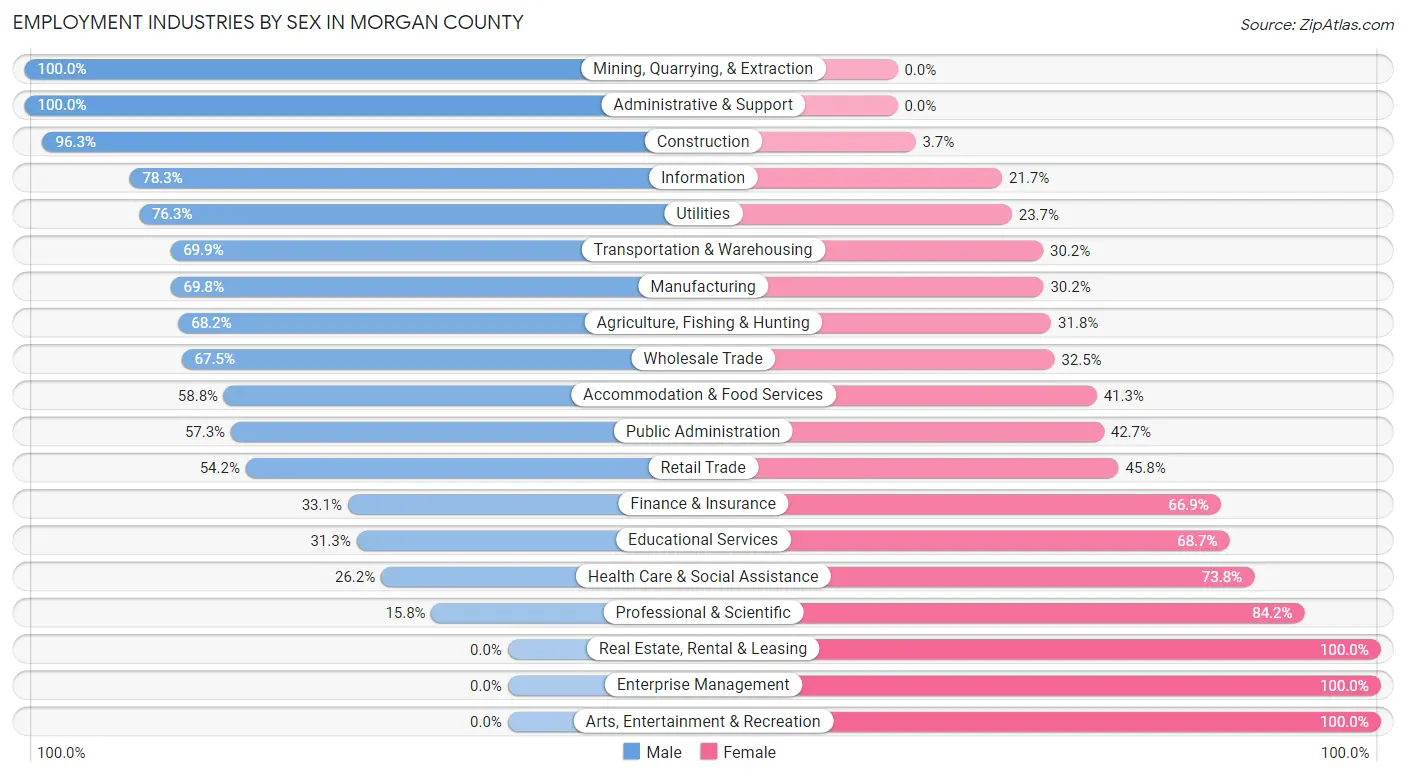
Employment Industries by Sex in Morgan County
The Morgan County industries that see more men than women are Mining, Quarrying, & Extraction (100.0%), Administrative & Support (100.0%), and Construction (96.3%), whereas the industries that tend to have a higher number of women are Real Estate, Rental & Leasing (100.0%), Enterprise Management (100.0%), and Arts, Entertainment & Recreation (100.0%).
| Industry | Male | Female |
| Agriculture, Fishing & Hunting | 15 (68.2%) | 7 (31.8%) |
| Mining, Quarrying, & Extraction | 33 (100.0%) | 0 (0.0%) |
| Construction | 438 (96.3%) | 17 (3.7%) |
| Manufacturing | 390 (69.8%) | 169 (30.2%) |
| Wholesale Trade | 27 (67.5%) | 13 (32.5%) |
| Retail Trade | 346 (54.2%) | 292 (45.8%) |
| Transportation & Warehousing | 95 (69.9%) | 41 (30.1%) |
| Utilities | 87 (76.3%) | 27 (23.7%) |
| Information | 94 (78.3%) | 26 (21.7%) |
| Finance & Insurance | 52 (33.1%) | 105 (66.9%) |
| Real Estate, Rental & Leasing | 0 (0.0%) | 2 (100.0%) |
| Professional & Scientific | 12 (15.8%) | 64 (84.2%) |
| Enterprise Management | 0 (0.0%) | 1 (100.0%) |
| Administrative & Support | 59 (100.0%) | 0 (0.0%) |
| Educational Services | 165 (31.3%) | 362 (68.7%) |
| Health Care & Social Assistance | 172 (26.2%) | 484 (73.8%) |
| Arts, Entertainment & Recreation | 0 (0.0%) | 13 (100.0%) |
| Accommodation & Food Services | 47 (58.8%) | 33 (41.2%) |
| Public Administration | 287 (57.3%) | 214 (42.7%) |
| Total | 2,435 (55.8%) | 1,932 (44.2%) |
Education in Morgan County
School Enrollment in Morgan County
The most common levels of schooling among the 2,350 students in Morgan County are middle school (661 | 28.1%), high school (548 | 23.3%), and elementary school (489 | 20.8%).
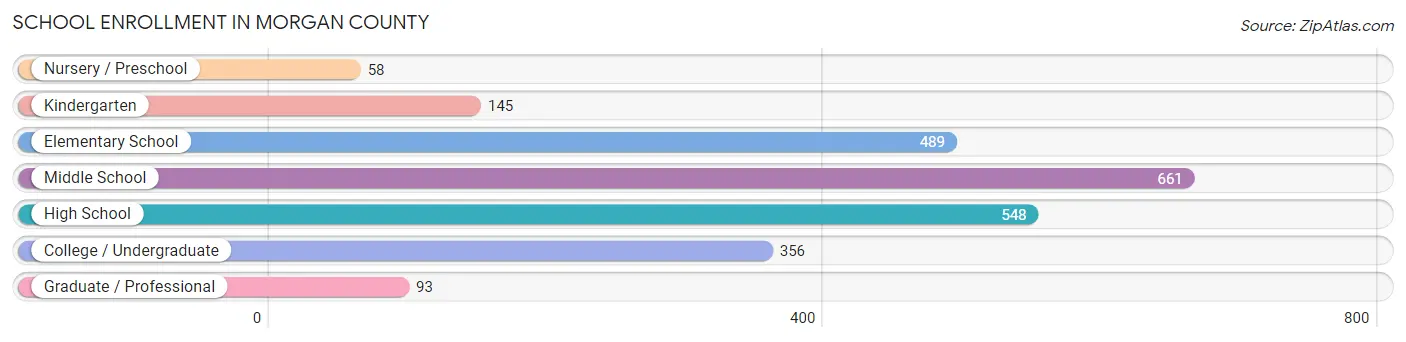
| School Level | # Students | % Students |
| Nursery / Preschool | 58 | 2.5% |
| Kindergarten | 145 | 6.2% |
| Elementary School | 489 | 20.8% |
| Middle School | 661 | 28.1% |
| High School | 548 | 23.3% |
| College / Undergraduate | 356 | 15.1% |
| Graduate / Professional | 93 | 4.0% |
| Total | 2,350 | 100.0% |
School Enrollment by Age by Funding Source in Morgan County
Out of a total of 2,350 students who are enrolled in schools in Morgan County, 223 (9.5%) attend a private institution, while the remaining 2,127 (90.5%) are enrolled in public schools. The age group of 25 to 34 year olds has the highest likelihood of being enrolled in private schools, with 60 (38.7% in the age bracket) enrolled. Conversely, the age group of 20 to 24 year olds has the lowest likelihood of being enrolled in a private school, with 97 (100.0% in the age bracket) attending a public institution.
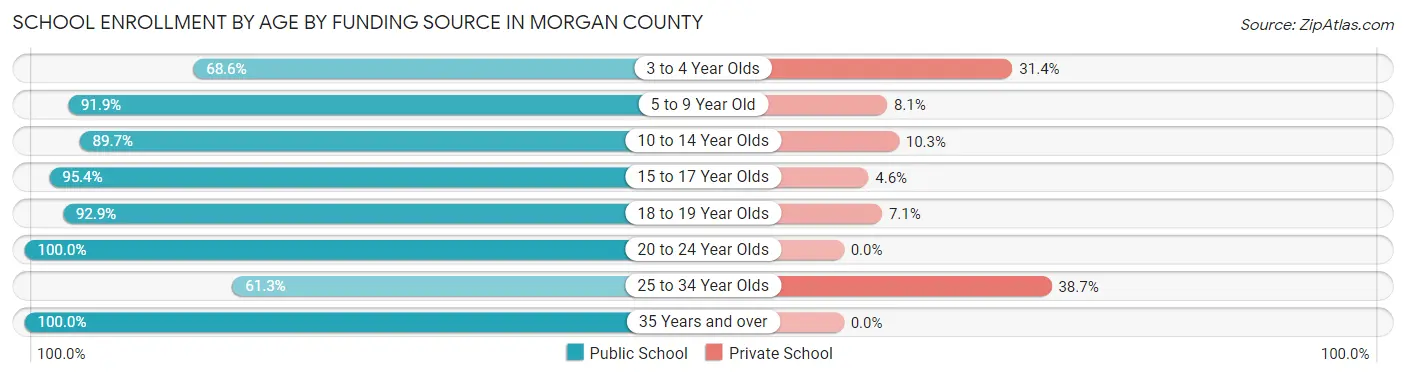
| Age Bracket | Public School | Private School |
| 3 to 4 Year Olds | 24 (68.6%) | 11 (31.4%) |
| 5 to 9 Year Old | 558 (91.9%) | 49 (8.1%) |
| 10 to 14 Year Olds | 656 (89.7%) | 75 (10.3%) |
| 15 to 17 Year Olds | 456 (95.4%) | 22 (4.6%) |
| 18 to 19 Year Olds | 91 (92.9%) | 7 (7.1%) |
| 20 to 24 Year Olds | 97 (100.0%) | 0 (0.0%) |
| 25 to 34 Year Olds | 95 (61.3%) | 60 (38.7%) |
| 35 Years and over | 149 (100.0%) | 0 (0.0%) |
| Total | 2,127 (90.5%) | 223 (9.5%) |
Educational Attainment by Field of Study in Morgan County
Education (496 | 25.9%), business (274 | 14.3%), arts & humanities (262 | 13.7%), science & technology (202 | 10.5%), and social sciences (129 | 6.7%) are the most common fields of study among 1,916 individuals in Morgan County who have obtained a bachelor's degree or higher.
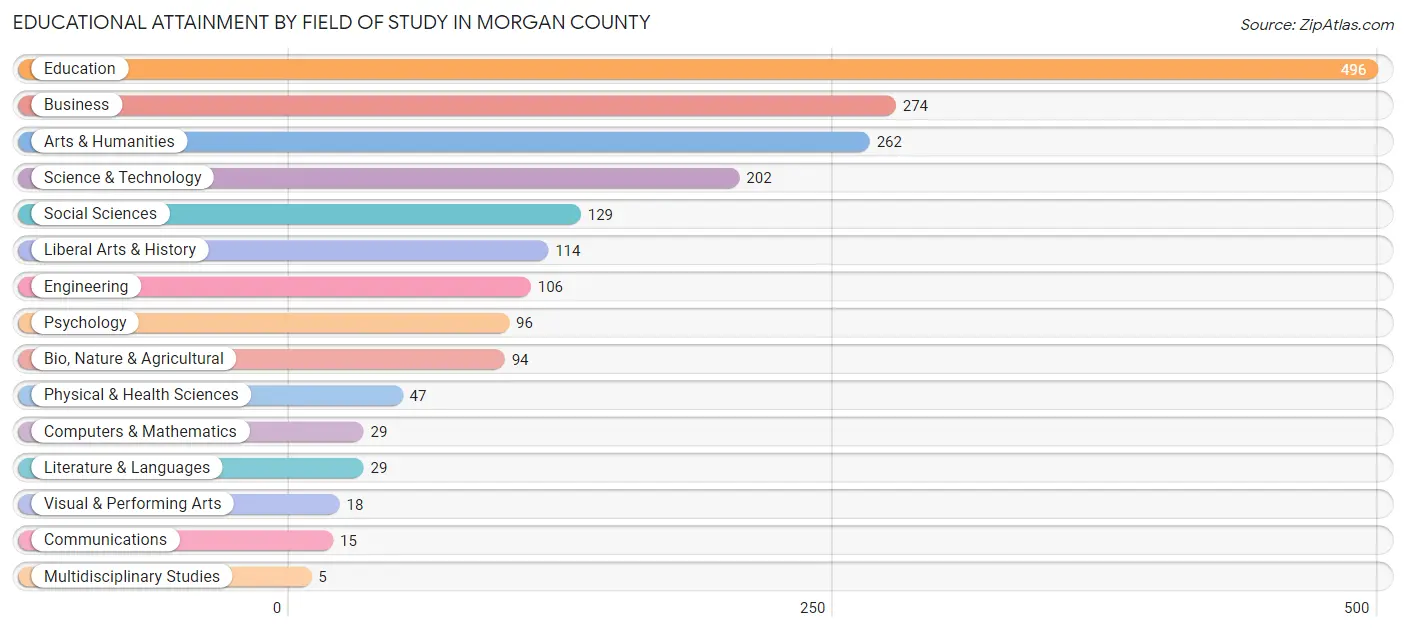
| Field of Study | # Graduates | % Graduates |
| Computers & Mathematics | 29 | 1.5% |
| Bio, Nature & Agricultural | 94 | 4.9% |
| Physical & Health Sciences | 47 | 2.5% |
| Psychology | 96 | 5.0% |
| Social Sciences | 129 | 6.7% |
| Engineering | 106 | 5.5% |
| Multidisciplinary Studies | 5 | 0.3% |
| Science & Technology | 202 | 10.5% |
| Business | 274 | 14.3% |
| Education | 496 | 25.9% |
| Literature & Languages | 29 | 1.5% |
| Liberal Arts & History | 114 | 5.9% |
| Visual & Performing Arts | 18 | 0.9% |
| Communications | 15 | 0.8% |
| Arts & Humanities | 262 | 13.7% |
| Total | 1,916 | 100.0% |
Transportation & Commute in Morgan County
Vehicle Availability by Sex in Morgan County
The most prevalent vehicle ownership categories in Morgan County are males with 3 vehicles (740, accounting for 30.3%) and females with 3 vehicles (571, making up 39.3%).
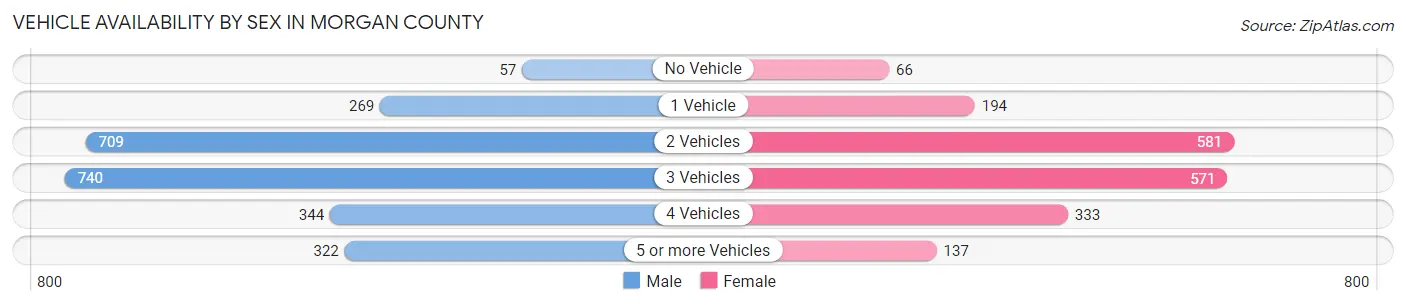
| Vehicles Available | Male | Female |
| No Vehicle | 57 (2.3%) | 66 (3.5%) |
| 1 Vehicle | 269 (11.0%) | 194 (10.3%) |
| 2 Vehicles | 709 (29.0%) | 581 (30.9%) |
| 3 Vehicles | 740 (30.3%) | 571 (30.3%) |
| 4 Vehicles | 344 (14.1%) | 333 (17.7%) |
| 5 or more Vehicles | 322 (13.2%) | 137 (7.3%) |
| Total | 2,441 (100.0%) | 1,882 (100.0%) |
Commute Time in Morgan County
The most frequently occuring commute durations in Morgan County are 5 to 9 minutes (575 commuters, 14.5%), 10 to 14 minutes (566 commuters, 14.3%), and 15 to 19 minutes (496 commuters, 12.5%).
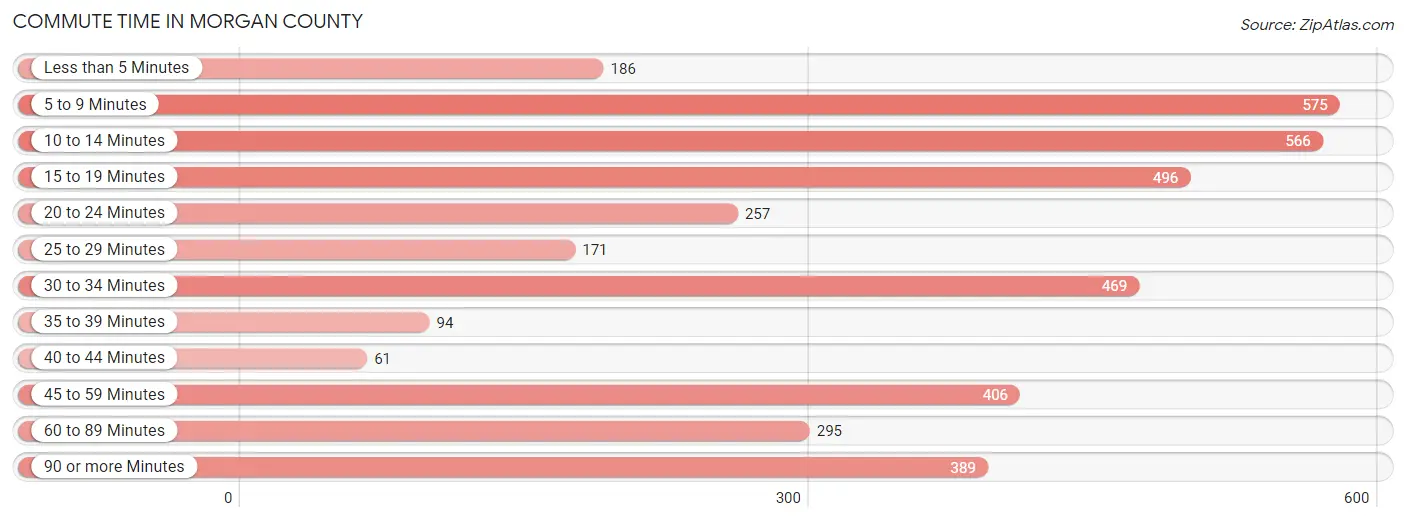
| Commute Time | # Commuters | % Commuters |
| Less than 5 Minutes | 186 | 4.7% |
| 5 to 9 Minutes | 575 | 14.5% |
| 10 to 14 Minutes | 566 | 14.3% |
| 15 to 19 Minutes | 496 | 12.5% |
| 20 to 24 Minutes | 257 | 6.5% |
| 25 to 29 Minutes | 171 | 4.3% |
| 30 to 34 Minutes | 469 | 11.8% |
| 35 to 39 Minutes | 94 | 2.4% |
| 40 to 44 Minutes | 61 | 1.5% |
| 45 to 59 Minutes | 406 | 10.2% |
| 60 to 89 Minutes | 295 | 7.4% |
| 90 or more Minutes | 389 | 9.8% |
Commute Time by Sex in Morgan County
The most common commute times in Morgan County are 5 to 9 minutes (323 commuters, 14.4%) for males and 10 to 14 minutes (256 commuters, 14.9%) for females.
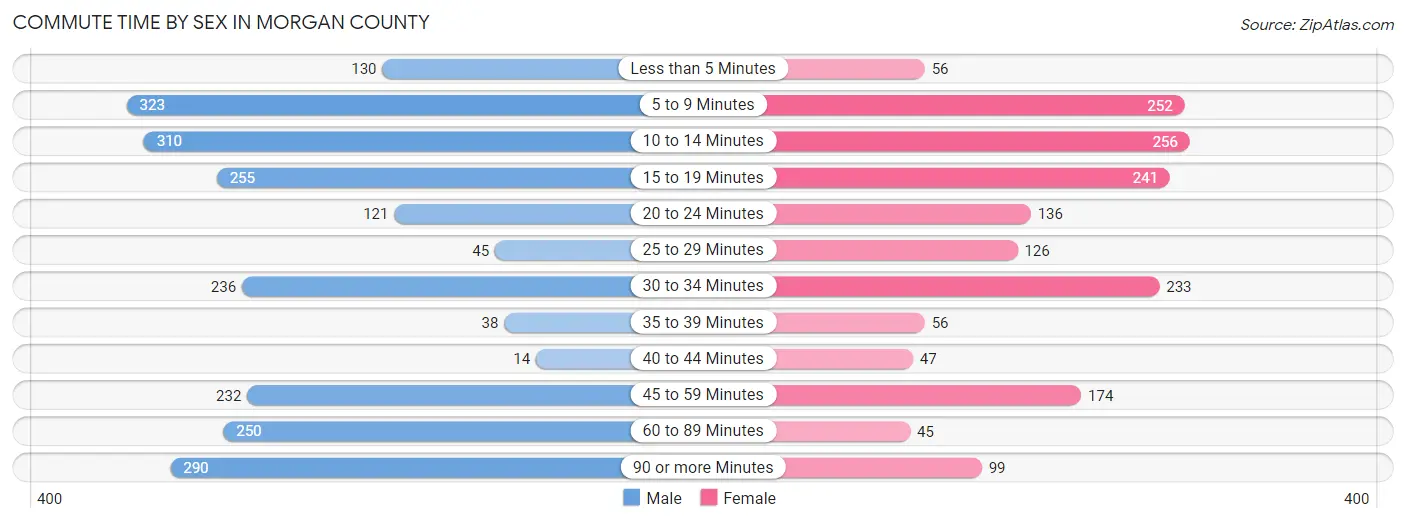
| Commute Time | Male | Female |
| Less than 5 Minutes | 130 (5.8%) | 56 (3.3%) |
| 5 to 9 Minutes | 323 (14.4%) | 252 (14.6%) |
| 10 to 14 Minutes | 310 (13.8%) | 256 (14.9%) |
| 15 to 19 Minutes | 255 (11.4%) | 241 (14.0%) |
| 20 to 24 Minutes | 121 (5.4%) | 136 (7.9%) |
| 25 to 29 Minutes | 45 (2.0%) | 126 (7.3%) |
| 30 to 34 Minutes | 236 (10.5%) | 233 (13.5%) |
| 35 to 39 Minutes | 38 (1.7%) | 56 (3.3%) |
| 40 to 44 Minutes | 14 (0.6%) | 47 (2.7%) |
| 45 to 59 Minutes | 232 (10.3%) | 174 (10.1%) |
| 60 to 89 Minutes | 250 (11.1%) | 45 (2.6%) |
| 90 or more Minutes | 290 (12.9%) | 99 (5.8%) |
Time of Departure to Work by Sex in Morgan County
The most frequent times of departure to work in Morgan County are 7:30 AM to 7:59 AM (450, 20.1%) for males and 7:00 AM to 7:29 AM (389, 22.6%) for females.
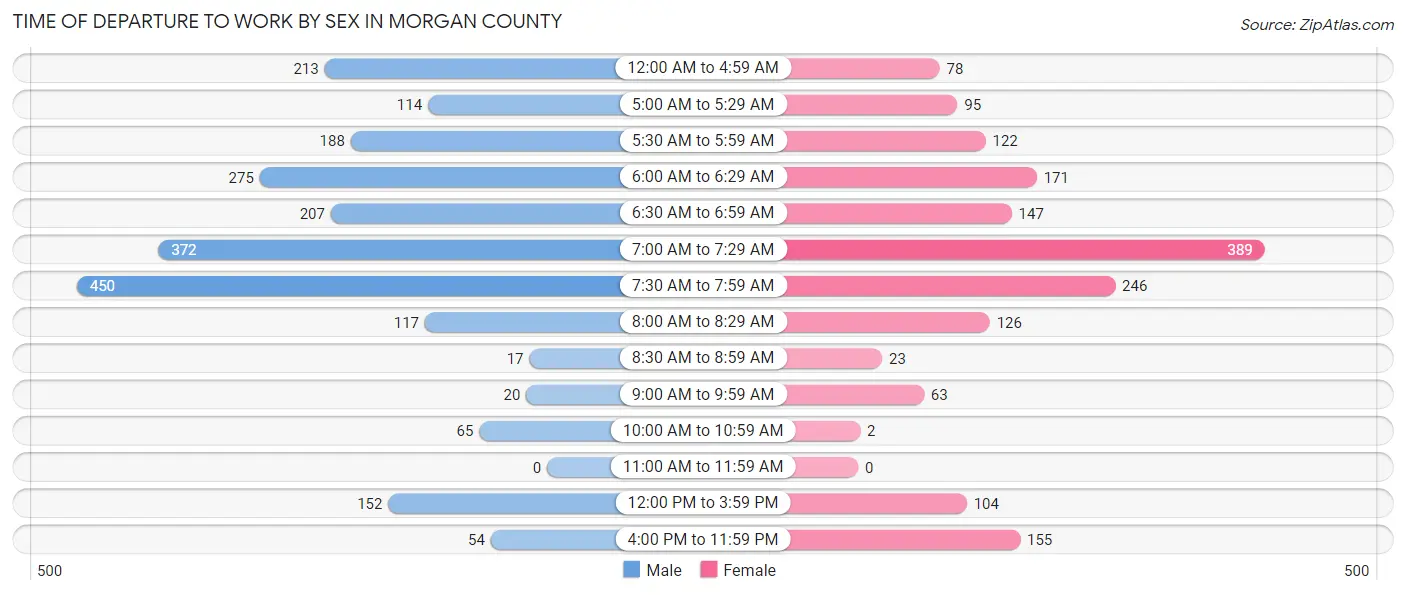
| Time of Departure | Male | Female |
| 12:00 AM to 4:59 AM | 213 (9.5%) | 78 (4.5%) |
| 5:00 AM to 5:29 AM | 114 (5.1%) | 95 (5.5%) |
| 5:30 AM to 5:59 AM | 188 (8.4%) | 122 (7.1%) |
| 6:00 AM to 6:29 AM | 275 (12.2%) | 171 (9.9%) |
| 6:30 AM to 6:59 AM | 207 (9.2%) | 147 (8.5%) |
| 7:00 AM to 7:29 AM | 372 (16.6%) | 389 (22.6%) |
| 7:30 AM to 7:59 AM | 450 (20.1%) | 246 (14.3%) |
| 8:00 AM to 8:29 AM | 117 (5.2%) | 126 (7.3%) |
| 8:30 AM to 8:59 AM | 17 (0.8%) | 23 (1.3%) |
| 9:00 AM to 9:59 AM | 20 (0.9%) | 63 (3.7%) |
| 10:00 AM to 10:59 AM | 65 (2.9%) | 2 (0.1%) |
| 11:00 AM to 11:59 AM | 0 (0.0%) | 0 (0.0%) |
| 12:00 PM to 3:59 PM | 152 (6.8%) | 104 (6.0%) |
| 4:00 PM to 11:59 PM | 54 (2.4%) | 155 (9.0%) |
| Total | 2,244 (100.0%) | 1,721 (100.0%) |
Housing Occupancy in Morgan County
Occupancy by Ownership in Morgan County
Of the total 4,665 dwellings in Morgan County, owner-occupied units account for 3,666 (78.6%), while renter-occupied units make up 999 (21.4%).
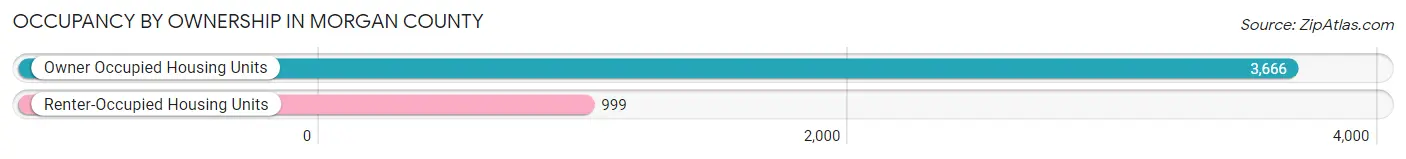
| Occupancy | # Housing Units | % Housing Units |
| Owner Occupied Housing Units | 3,666 | 78.6% |
| Renter-Occupied Housing Units | 999 | 21.4% |
| Total Occupied Housing Units | 4,665 | 100.0% |
Occupancy by Household Size in Morgan County
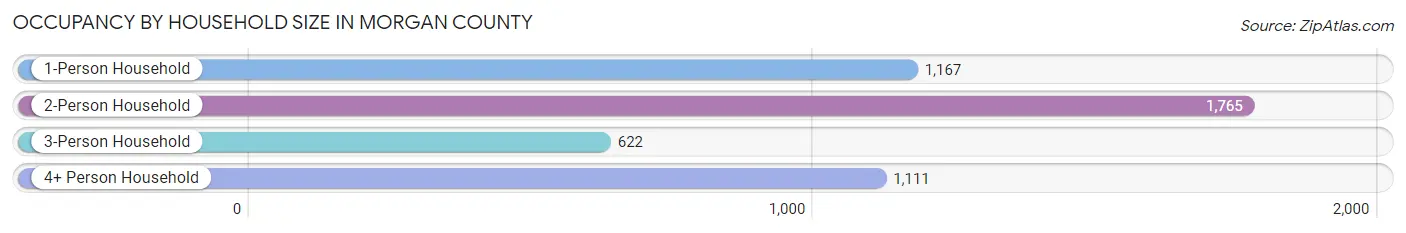
| Household Size | # Housing Units | % Housing Units |
| 1-Person Household | 1,167 | 25.0% |
| 2-Person Household | 1,765 | 37.8% |
| 3-Person Household | 622 | 13.3% |
| 4+ Person Household | 1,111 | 23.8% |
| Total Housing Units | 4,665 | 100.0% |
Occupancy by Ownership by Household Size in Morgan County
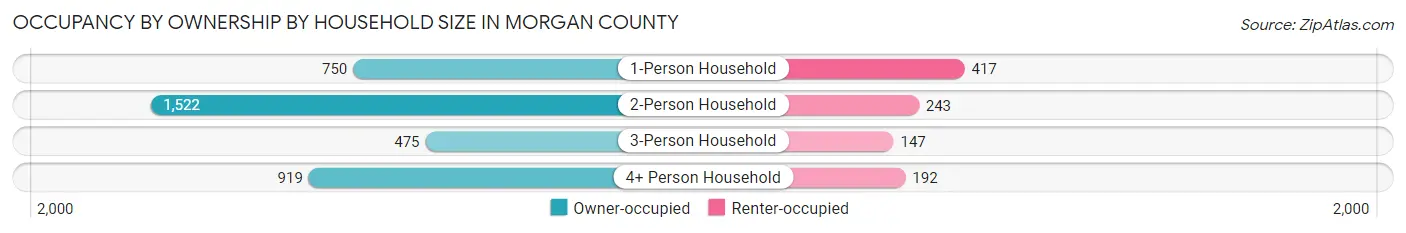
| Household Size | Owner-occupied | Renter-occupied |
| 1-Person Household | 750 (64.3%) | 417 (35.7%) |
| 2-Person Household | 1,522 (86.2%) | 243 (13.8%) |
| 3-Person Household | 475 (76.4%) | 147 (23.6%) |
| 4+ Person Household | 919 (82.7%) | 192 (17.3%) |
| Total Housing Units | 3,666 (78.6%) | 999 (21.4%) |
Occupancy by Educational Attainment in Morgan County
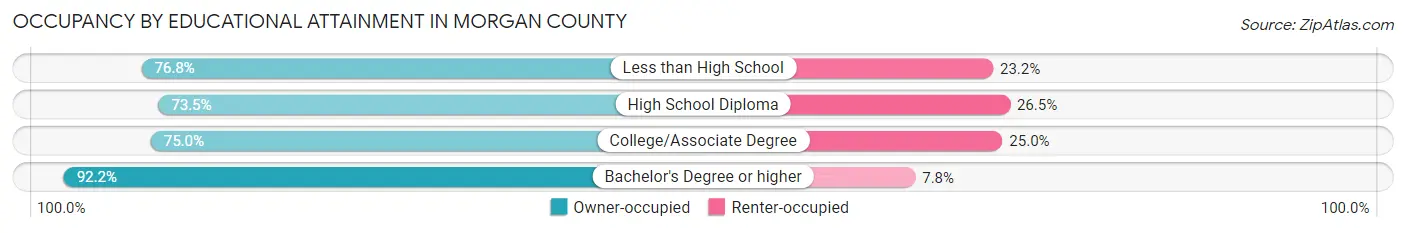
| Household Size | Owner-occupied | Renter-occupied |
| Less than High School | 746 (76.8%) | 225 (23.2%) |
| High School Diploma | 1,235 (73.5%) | 446 (26.5%) |
| College/Associate Degree | 746 (75.0%) | 249 (25.0%) |
| Bachelor's Degree or higher | 939 (92.2%) | 79 (7.8%) |
Occupancy by Age of Householder in Morgan County
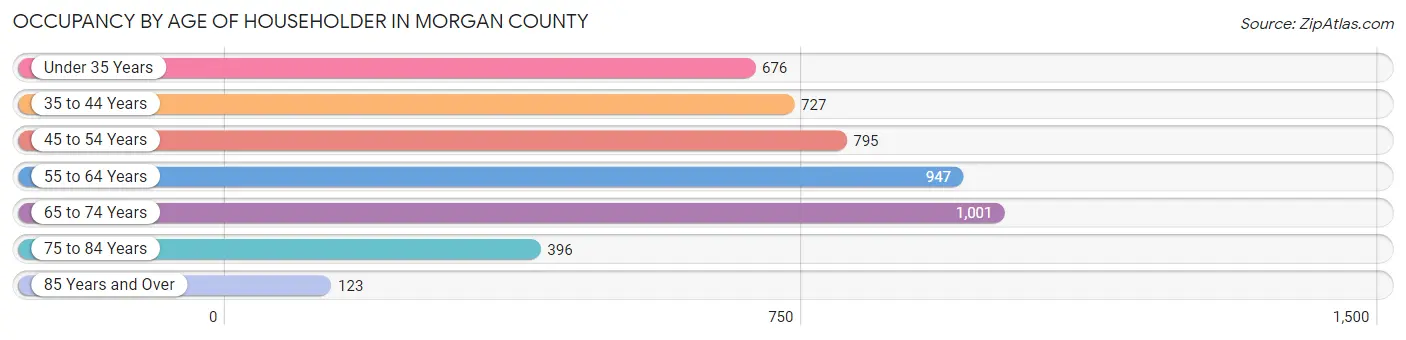
| Age Bracket | # Households | % Households |
| Under 35 Years | 676 | 14.5% |
| 35 to 44 Years | 727 | 15.6% |
| 45 to 54 Years | 795 | 17.0% |
| 55 to 64 Years | 947 | 20.3% |
| 65 to 74 Years | 1,001 | 21.5% |
| 75 to 84 Years | 396 | 8.5% |
| 85 Years and Over | 123 | 2.6% |
| Total | 4,665 | 100.0% |
Housing Finances in Morgan County
Median Income by Occupancy in Morgan County
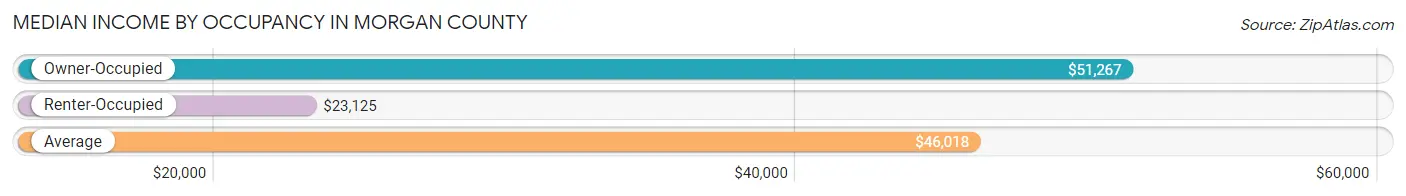
| Occupancy Type | # Households | Median Income |
| Owner-Occupied | 3,666 (78.6%) | $51,267 |
| Renter-Occupied | 999 (21.4%) | $23,125 |
| Average | 4,665 (100.0%) | $46,018 |
Occupancy by Householder Income Bracket in Morgan County
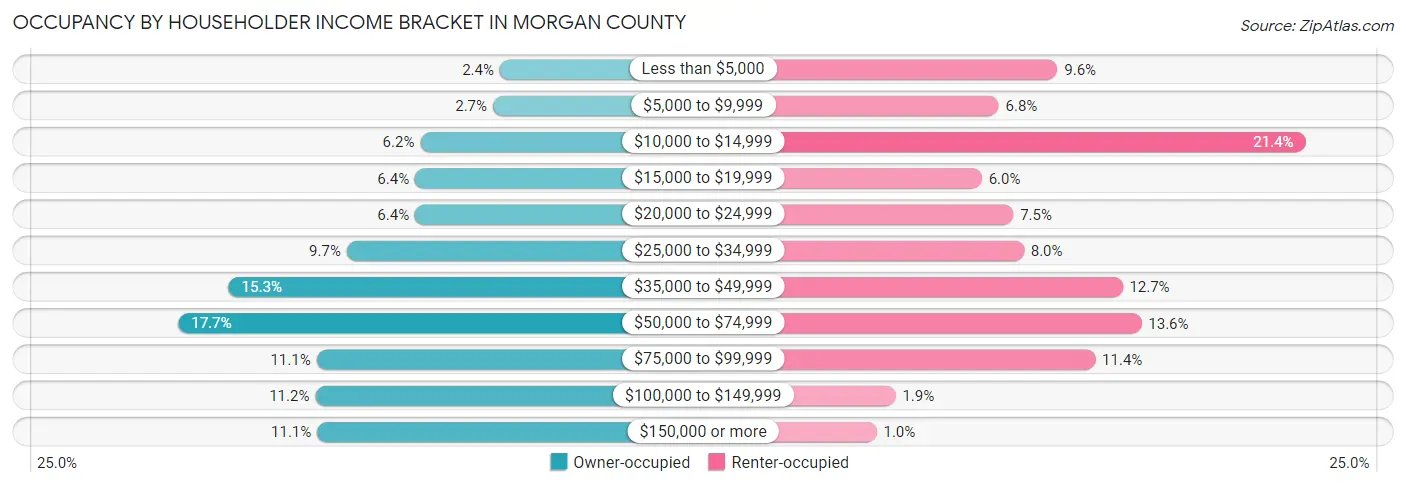
| Income Bracket | Owner-occupied | Renter-occupied |
| Less than $5,000 | 87 (2.4%) | 96 (9.6%) |
| $5,000 to $9,999 | 99 (2.7%) | 68 (6.8%) |
| $10,000 to $14,999 | 226 (6.2%) | 214 (21.4%) |
| $15,000 to $19,999 | 235 (6.4%) | 60 (6.0%) |
| $20,000 to $24,999 | 235 (6.4%) | 75 (7.5%) |
| $25,000 to $34,999 | 354 (9.7%) | 80 (8.0%) |
| $35,000 to $49,999 | 560 (15.3%) | 127 (12.7%) |
| $50,000 to $74,999 | 648 (17.7%) | 136 (13.6%) |
| $75,000 to $99,999 | 407 (11.1%) | 114 (11.4%) |
| $100,000 to $149,999 | 409 (11.2%) | 19 (1.9%) |
| $150,000 or more | 406 (11.1%) | 10 (1.0%) |
| Total | 3,666 (100.0%) | 999 (100.0%) |
Monthly Housing Cost Tiers in Morgan County
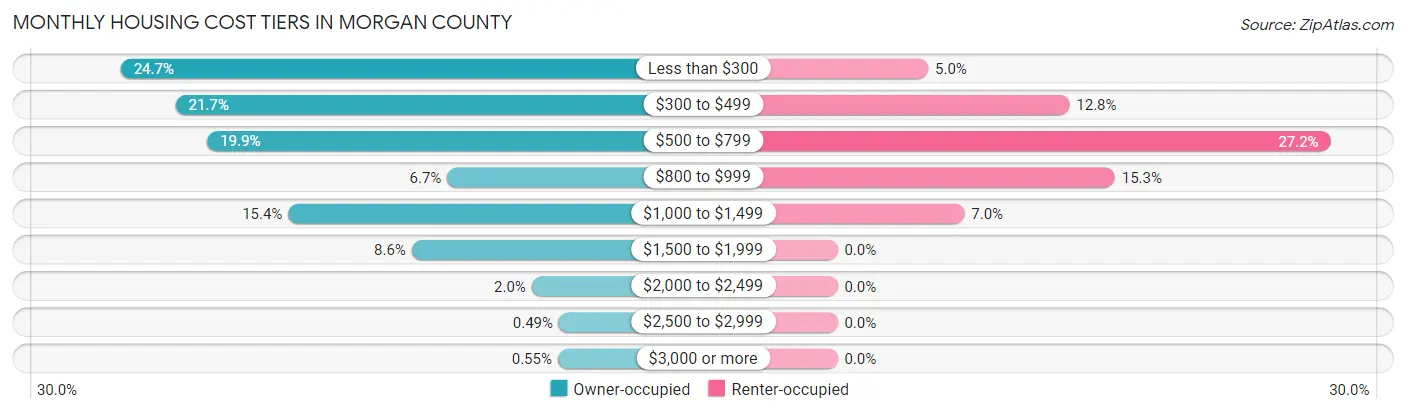
| Monthly Cost | Owner-occupied | Renter-occupied |
| Less than $300 | 905 (24.7%) | 50 (5.0%) |
| $300 to $499 | 794 (21.7%) | 128 (12.8%) |
| $500 to $799 | 730 (19.9%) | 272 (27.2%) |
| $800 to $999 | 244 (6.7%) | 153 (15.3%) |
| $1,000 to $1,499 | 566 (15.4%) | 70 (7.0%) |
| $1,500 to $1,999 | 316 (8.6%) | 0 (0.0%) |
| $2,000 to $2,499 | 73 (2.0%) | 0 (0.0%) |
| $2,500 to $2,999 | 18 (0.5%) | 0 (0.0%) |
| $3,000 or more | 20 (0.5%) | 0 (0.0%) |
| Total | 3,666 (100.0%) | 999 (100.0%) |
Physical Housing Characteristics in Morgan County
Housing Structures in Morgan County
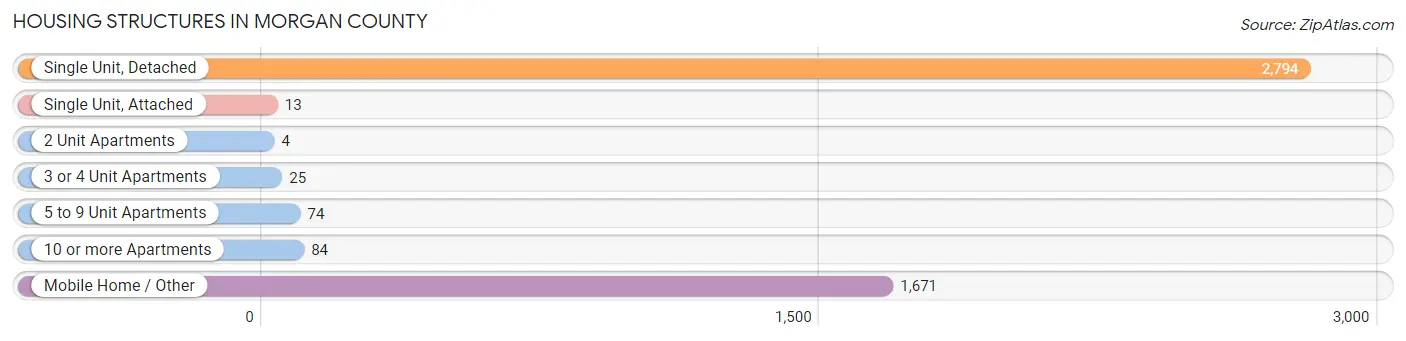
| Structure Type | # Housing Units | % Housing Units |
| Single Unit, Detached | 2,794 | 59.9% |
| Single Unit, Attached | 13 | 0.3% |
| 2 Unit Apartments | 4 | 0.1% |
| 3 or 4 Unit Apartments | 25 | 0.5% |
| 5 to 9 Unit Apartments | 74 | 1.6% |
| 10 or more Apartments | 84 | 1.8% |
| Mobile Home / Other | 1,671 | 35.8% |
| Total | 4,665 | 100.0% |
Housing Structures by Occupancy in Morgan County
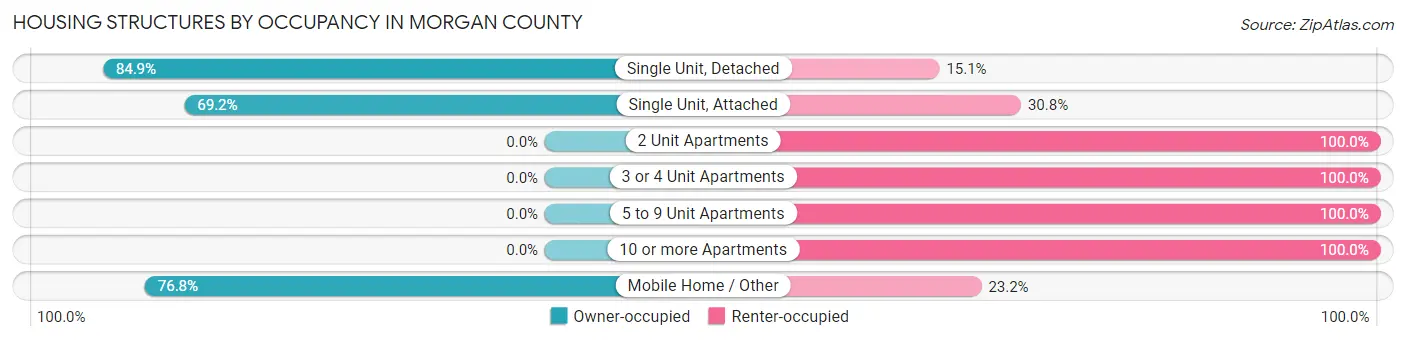
| Structure Type | Owner-occupied | Renter-occupied |
| Single Unit, Detached | 2,373 (84.9%) | 421 (15.1%) |
| Single Unit, Attached | 9 (69.2%) | 4 (30.8%) |
| 2 Unit Apartments | 0 (0.0%) | 4 (100.0%) |
| 3 or 4 Unit Apartments | 0 (0.0%) | 25 (100.0%) |
| 5 to 9 Unit Apartments | 0 (0.0%) | 74 (100.0%) |
| 10 or more Apartments | 0 (0.0%) | 84 (100.0%) |
| Mobile Home / Other | 1,284 (76.8%) | 387 (23.2%) |
| Total | 3,666 (78.6%) | 999 (21.4%) |
Housing Structures by Number of Rooms in Morgan County
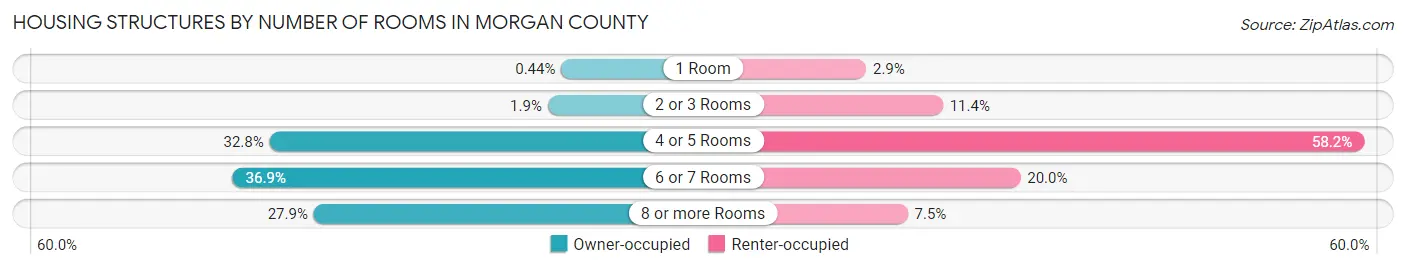
| Number of Rooms | Owner-occupied | Renter-occupied |
| 1 Room | 16 (0.4%) | 29 (2.9%) |
| 2 or 3 Rooms | 71 (1.9%) | 114 (11.4%) |
| 4 or 5 Rooms | 1,203 (32.8%) | 581 (58.2%) |
| 6 or 7 Rooms | 1,353 (36.9%) | 200 (20.0%) |
| 8 or more Rooms | 1,023 (27.9%) | 75 (7.5%) |
| Total | 3,666 (100.0%) | 999 (100.0%) |
Housing Structure by Heating Type in Morgan County
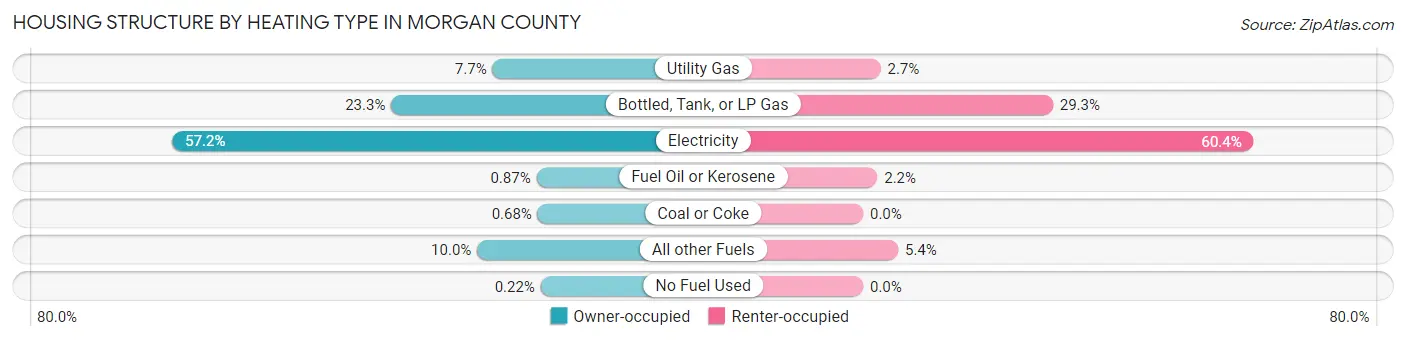
| Heating Type | Owner-occupied | Renter-occupied |
| Utility Gas | 281 (7.7%) | 27 (2.7%) |
| Bottled, Tank, or LP Gas | 855 (23.3%) | 293 (29.3%) |
| Electricity | 2,097 (57.2%) | 603 (60.4%) |
| Fuel Oil or Kerosene | 32 (0.9%) | 22 (2.2%) |
| Coal or Coke | 25 (0.7%) | 0 (0.0%) |
| All other Fuels | 368 (10.0%) | 54 (5.4%) |
| No Fuel Used | 8 (0.2%) | 0 (0.0%) |
| Total | 3,666 (100.0%) | 999 (100.0%) |
Household Vehicle Usage in Morgan County
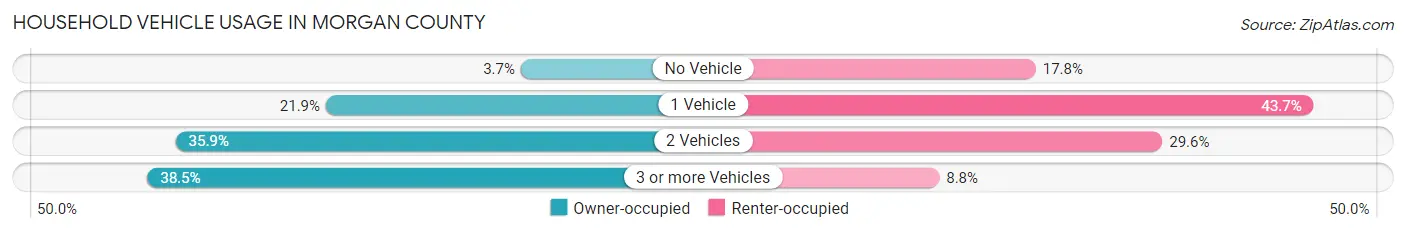
| Vehicles per Household | Owner-occupied | Renter-occupied |
| No Vehicle | 135 (3.7%) | 178 (17.8%) |
| 1 Vehicle | 802 (21.9%) | 437 (43.7%) |
| 2 Vehicles | 1,316 (35.9%) | 296 (29.6%) |
| 3 or more Vehicles | 1,413 (38.5%) | 88 (8.8%) |
| Total | 3,666 (100.0%) | 999 (100.0%) |
Real Estate & Mortgages in Morgan County
Real Estate and Mortgage Overview in Morgan County
| Characteristic | Without Mortgage | With Mortgage |
| Housing Units | 2,083 | 1,583 |
| Median Property Value | $68,500 | $136,100 |
| Median Household Income | $39,288 | $192 |
| Monthly Housing Costs | $324 | $11 |
| Real Estate Taxes | $550 | $118 |
Property Value by Mortgage Status in Morgan County
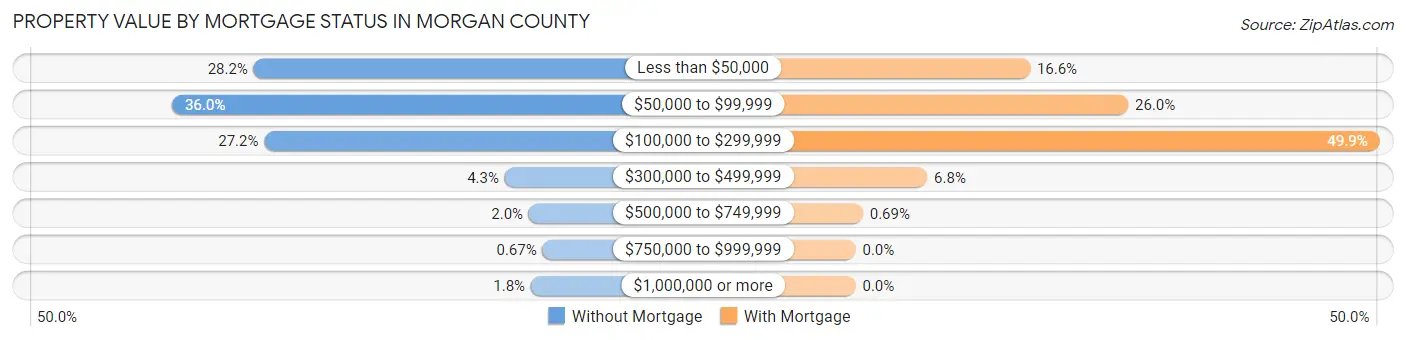
| Property Value | Without Mortgage | With Mortgage |
| Less than $50,000 | 587 (28.2%) | 263 (16.6%) |
| $50,000 to $99,999 | 749 (36.0%) | 411 (26.0%) |
| $100,000 to $299,999 | 566 (27.2%) | 790 (49.9%) |
| $300,000 to $499,999 | 89 (4.3%) | 108 (6.8%) |
| $500,000 to $749,999 | 41 (2.0%) | 11 (0.7%) |
| $750,000 to $999,999 | 14 (0.7%) | 0 (0.0%) |
| $1,000,000 or more | 37 (1.8%) | 0 (0.0%) |
| Total | 2,083 (100.0%) | 1,583 (100.0%) |
Household Income by Mortgage Status in Morgan County
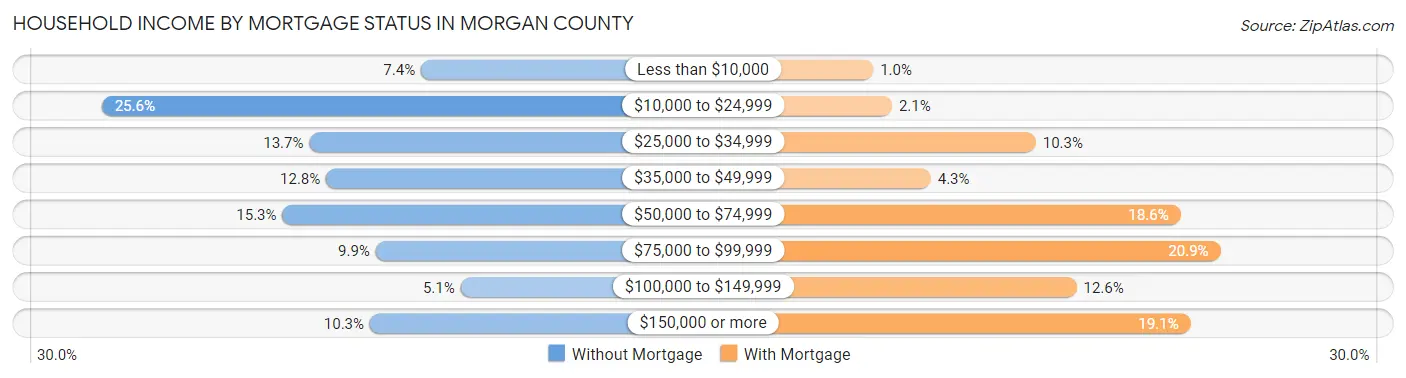
| Household Income | Without Mortgage | With Mortgage |
| Less than $10,000 | 153 (7.3%) | 16 (1.0%) |
| $10,000 to $24,999 | 533 (25.6%) | 33 (2.1%) |
| $25,000 to $34,999 | 286 (13.7%) | 163 (10.3%) |
| $35,000 to $49,999 | 266 (12.8%) | 68 (4.3%) |
| $50,000 to $74,999 | 318 (15.3%) | 294 (18.6%) |
| $75,000 to $99,999 | 207 (9.9%) | 330 (20.8%) |
| $100,000 to $149,999 | 106 (5.1%) | 200 (12.6%) |
| $150,000 or more | 214 (10.3%) | 303 (19.1%) |
| Total | 2,083 (100.0%) | 1,583 (100.0%) |
Property Value to Household Income Ratio in Morgan County
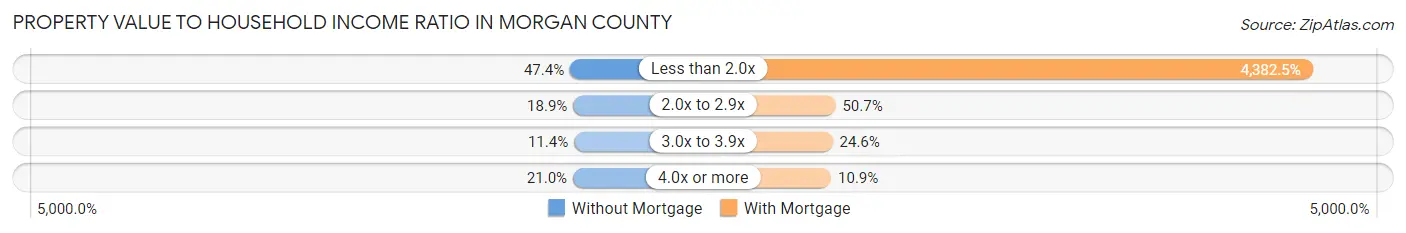
| Value-to-Income Ratio | Without Mortgage | With Mortgage |
| Less than 2.0x | 988 (47.4%) | 69,375 (4,382.5%) |
| 2.0x to 2.9x | 394 (18.9%) | 802 (50.7%) |
| 3.0x to 3.9x | 237 (11.4%) | 389 (24.6%) |
| 4.0x or more | 438 (21.0%) | 172 (10.9%) |
| Total | 2,083 (100.0%) | 1,583 (100.0%) |
Real Estate Taxes by Mortgage Status in Morgan County
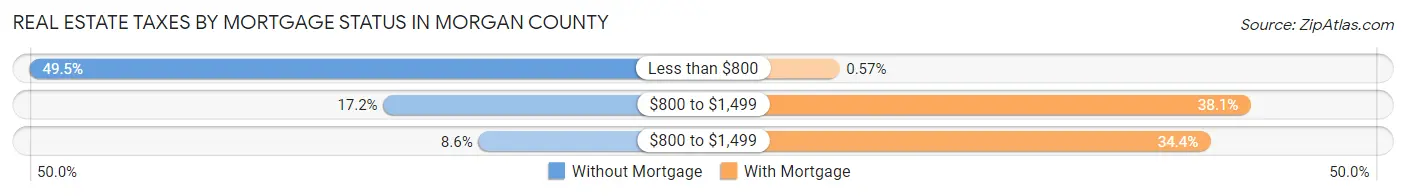
| Property Taxes | Without Mortgage | With Mortgage |
| Less than $800 | 1,032 (49.5%) | 9 (0.6%) |
| $800 to $1,499 | 359 (17.2%) | 603 (38.1%) |
| $800 to $1,499 | 178 (8.6%) | 545 (34.4%) |
| Total | 2,083 (100.0%) | 1,583 (100.0%) |
Health & Disability in Morgan County
Health Insurance Coverage by Age in Morgan County
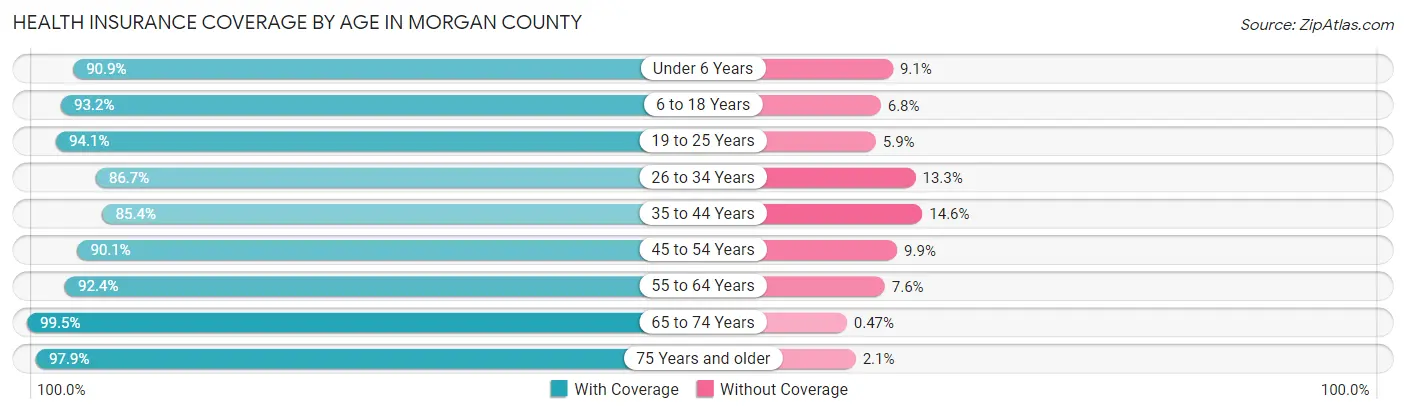
| Age Bracket | With Coverage | Without Coverage |
| Under 6 Years | 672 (90.9%) | 67 (9.1%) |
| 6 to 18 Years | 1,835 (93.2%) | 134 (6.8%) |
| 19 to 25 Years | 865 (94.1%) | 54 (5.9%) |
| 26 to 34 Years | 1,136 (86.7%) | 174 (13.3%) |
| 35 to 44 Years | 1,326 (85.4%) | 226 (14.6%) |
| 45 to 54 Years | 1,518 (90.1%) | 166 (9.9%) |
| 55 to 64 Years | 1,627 (92.4%) | 133 (7.6%) |
| 65 to 74 Years | 1,487 (99.5%) | 7 (0.5%) |
| 75 Years and older | 782 (97.9%) | 17 (2.1%) |
| Total | 11,248 (92.0%) | 978 (8.0%) |
Health Insurance Coverage by Citizenship Status in Morgan County
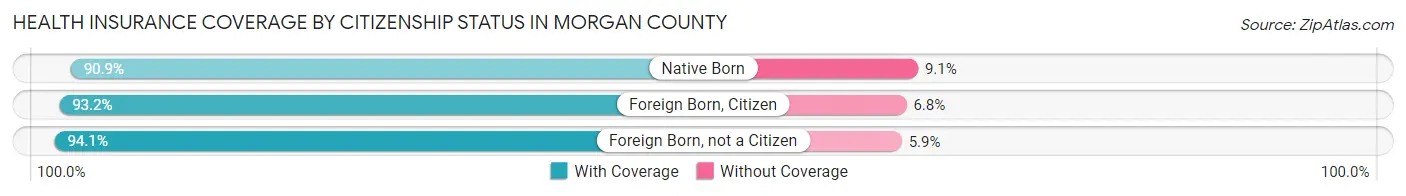
| Citizenship Status | With Coverage | Without Coverage |
| Native Born | 672 (90.9%) | 67 (9.1%) |
| Foreign Born, Citizen | 1,835 (93.2%) | 134 (6.8%) |
| Foreign Born, not a Citizen | 865 (94.1%) | 54 (5.9%) |
Health Insurance Coverage by Household Income in Morgan County
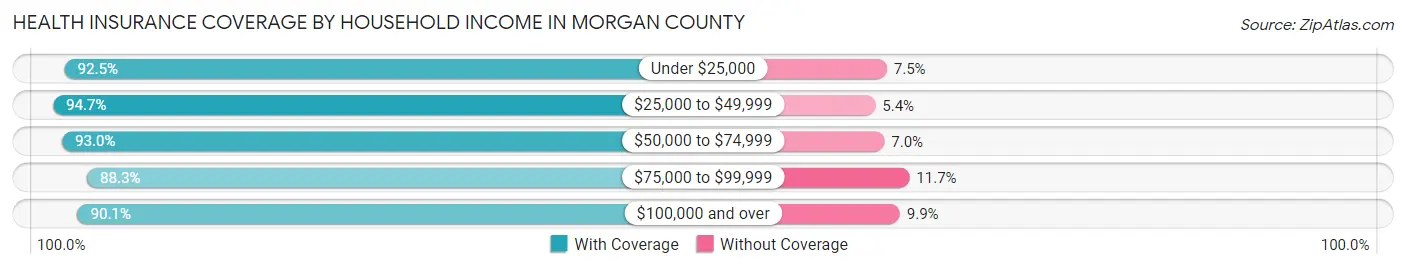
| Household Income | With Coverage | Without Coverage |
| Under $25,000 | 2,266 (92.5%) | 184 (7.5%) |
| $25,000 to $49,999 | 2,833 (94.7%) | 160 (5.3%) |
| $50,000 to $74,999 | 2,168 (93.0%) | 164 (7.0%) |
| $75,000 to $99,999 | 1,362 (88.3%) | 181 (11.7%) |
| $100,000 and over | 2,619 (90.1%) | 289 (9.9%) |
Public vs Private Health Insurance Coverage by Age in Morgan County
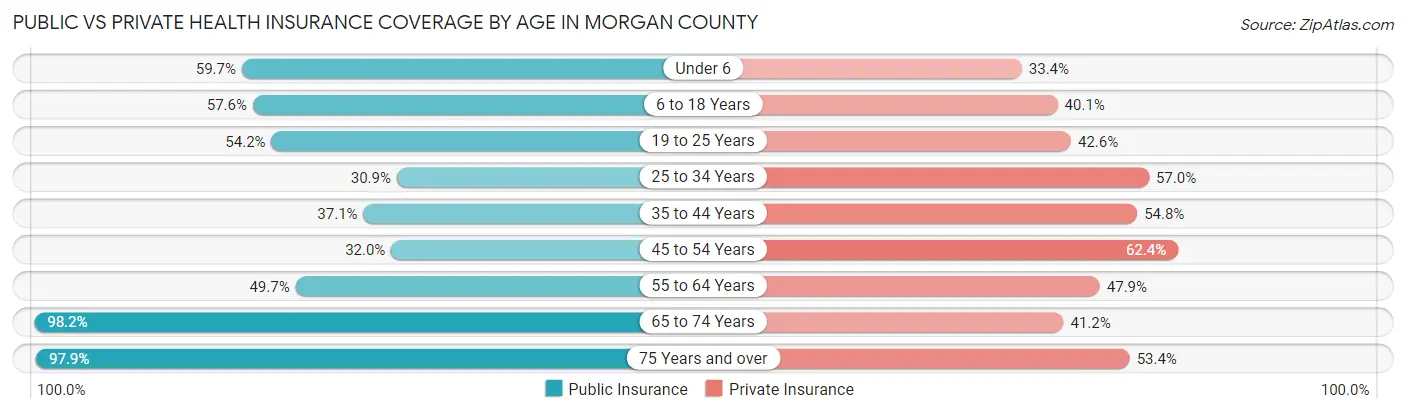
| Age Bracket | Public Insurance | Private Insurance |
| Under 6 | 441 (59.7%) | 247 (33.4%) |
| 6 to 18 Years | 1,135 (57.6%) | 789 (40.1%) |
| 19 to 25 Years | 498 (54.2%) | 391 (42.5%) |
| 25 to 34 Years | 405 (30.9%) | 747 (57.0%) |
| 35 to 44 Years | 576 (37.1%) | 851 (54.8%) |
| 45 to 54 Years | 538 (32.0%) | 1,051 (62.4%) |
| 55 to 64 Years | 875 (49.7%) | 843 (47.9%) |
| 65 to 74 Years | 1,467 (98.2%) | 615 (41.2%) |
| 75 Years and over | 782 (97.9%) | 427 (53.4%) |
| Total | 6,717 (54.9%) | 5,961 (48.8%) |
Disability Status by Sex by Age in Morgan County
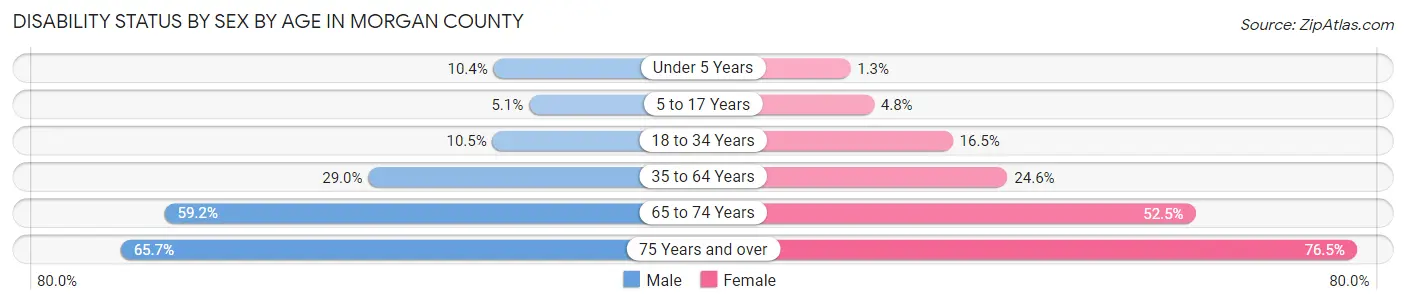
| Age Bracket | Male | Female |
| Under 5 Years | 35 (10.4%) | 4 (1.3%) |
| 5 to 17 Years | 55 (5.1%) | 40 (4.8%) |
| 18 to 34 Years | 140 (10.5%) | 169 (16.5%) |
| 35 to 64 Years | 738 (29.0%) | 602 (24.6%) |
| 65 to 74 Years | 447 (59.2%) | 388 (52.5%) |
| 75 Years and over | 232 (65.7%) | 341 (76.5%) |
Disability Class by Sex by Age in Morgan County
Disability Class: Hearing Difficulty
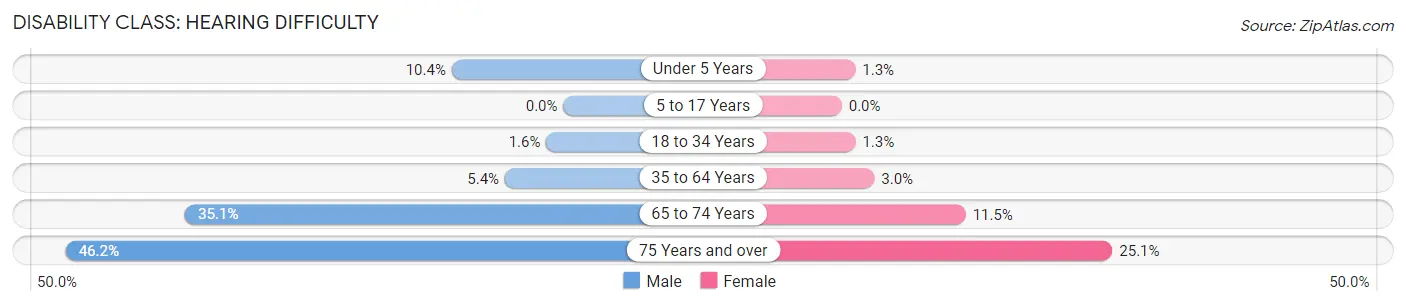
| Age Bracket | Male | Female |
| Under 5 Years | 35 (10.4%) | 4 (1.3%) |
| 5 to 17 Years | 0 (0.0%) | 0 (0.0%) |
| 18 to 34 Years | 21 (1.6%) | 13 (1.3%) |
| 35 to 64 Years | 138 (5.4%) | 74 (3.0%) |
| 65 to 74 Years | 265 (35.1%) | 85 (11.5%) |
| 75 Years and over | 163 (46.2%) | 112 (25.1%) |
Disability Class: Vision Difficulty
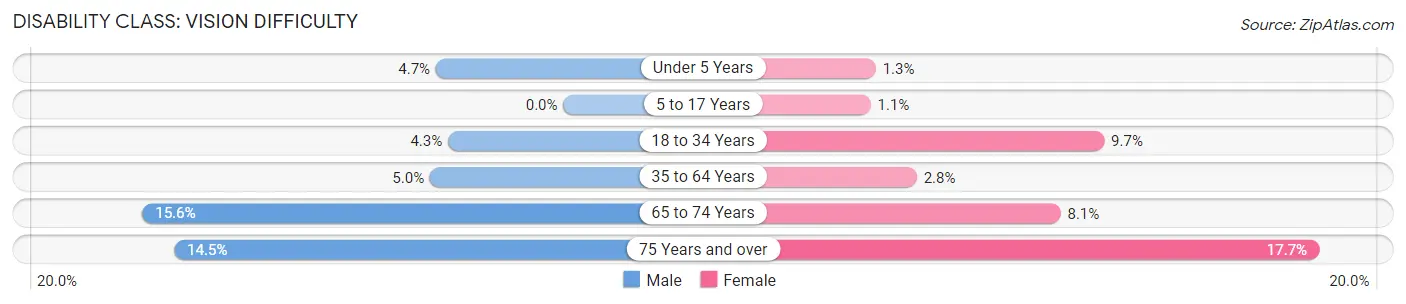
| Age Bracket | Male | Female |
| Under 5 Years | 16 (4.7%) | 4 (1.3%) |
| 5 to 17 Years | 0 (0.0%) | 9 (1.1%) |
| 18 to 34 Years | 57 (4.3%) | 100 (9.7%) |
| 35 to 64 Years | 126 (5.0%) | 68 (2.8%) |
| 65 to 74 Years | 118 (15.6%) | 60 (8.1%) |
| 75 Years and over | 51 (14.4%) | 79 (17.7%) |
Disability Class: Cognitive Difficulty
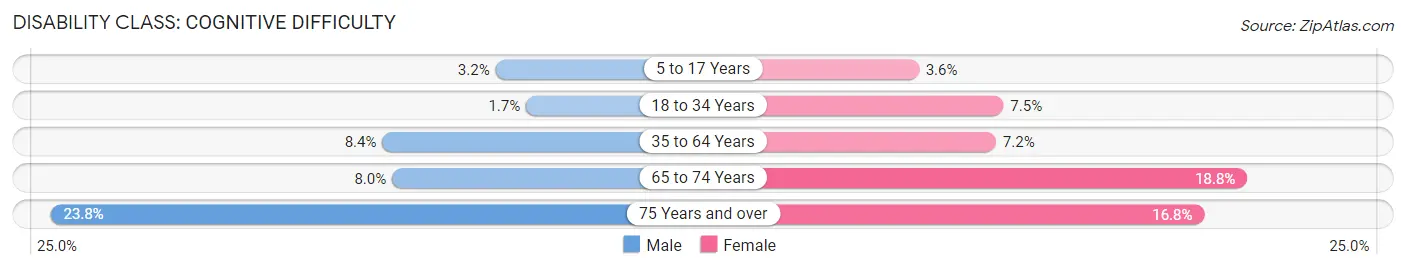
| Age Bracket | Male | Female |
| 5 to 17 Years | 34 (3.2%) | 30 (3.6%) |
| 18 to 34 Years | 23 (1.7%) | 77 (7.5%) |
| 35 to 64 Years | 214 (8.4%) | 175 (7.1%) |
| 65 to 74 Years | 60 (8.0%) | 139 (18.8%) |
| 75 Years and over | 84 (23.8%) | 75 (16.8%) |
Disability Class: Ambulatory Difficulty
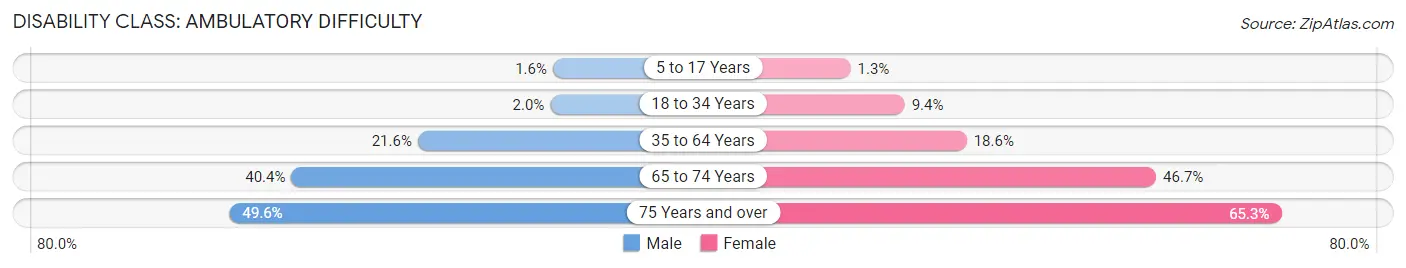
| Age Bracket | Male | Female |
| 5 to 17 Years | 17 (1.6%) | 11 (1.3%) |
| 18 to 34 Years | 26 (1.9%) | 96 (9.3%) |
| 35 to 64 Years | 551 (21.6%) | 454 (18.5%) |
| 65 to 74 Years | 305 (40.4%) | 345 (46.7%) |
| 75 Years and over | 175 (49.6%) | 291 (65.2%) |
Disability Class: Self-Care Difficulty
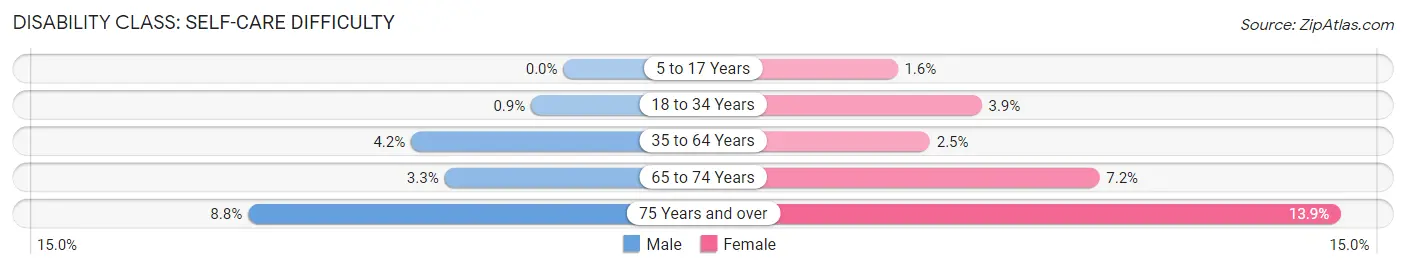
| Age Bracket | Male | Female |
| 5 to 17 Years | 0 (0.0%) | 13 (1.5%) |
| 18 to 34 Years | 12 (0.9%) | 40 (3.9%) |
| 35 to 64 Years | 108 (4.2%) | 60 (2.5%) |
| 65 to 74 Years | 25 (3.3%) | 53 (7.2%) |
| 75 Years and over | 31 (8.8%) | 62 (13.9%) |
Technology Access in Morgan County
Computing Device Access in Morgan County
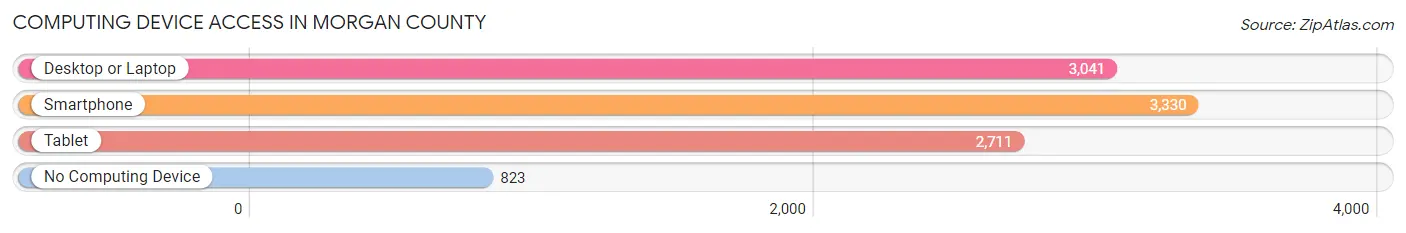
| Device Type | # Households | % Households |
| Desktop or Laptop | 3,041 | 65.2% |
| Smartphone | 3,330 | 71.4% |
| Tablet | 2,711 | 58.1% |
| No Computing Device | 823 | 17.6% |
| Total | 4,665 | 100.0% |
Internet Access in Morgan County
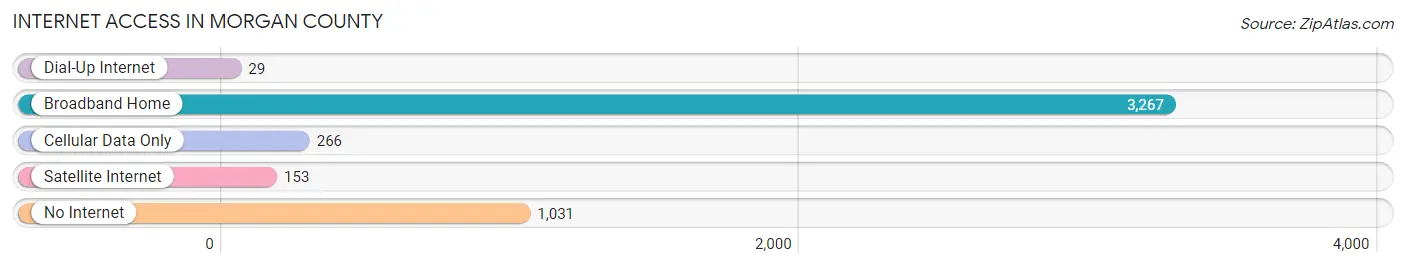
| Internet Type | # Households | % Households |
| Dial-Up Internet | 29 | 0.6% |
| Broadband Home | 3,267 | 70.0% |
| Cellular Data Only | 266 | 5.7% |
| Satellite Internet | 153 | 3.3% |
| No Internet | 1,031 | 22.1% |
| Total | 4,665 | 100.0% |
Morgan County Summary
Morgan County is located in the eastern part of Kentucky, in the Appalachian region of the United States. It is bordered by Wolfe County to the north, Menifee County to the east, Powell County to the south, and Breathitt County to the west. The county seat is West Liberty, and the county was formed in 1822 from parts of Floyd and Wolfe counties.
Geography
Morgan County covers an area of approximately 437 square miles, with elevations ranging from 860 feet to 2,400 feet above sea level. The terrain is mostly hilly, with some flat areas in the valleys. The county is drained by the Middle Fork of the Kentucky River, which flows through the county from north to south. The county is mostly forested, with some agricultural land in the valleys.
Climate
Morgan County has a humid continental climate, with hot, humid summers and cold, wet winters. The average annual temperature is around 54°F, with average highs in the summer reaching around 85°F and average lows in the winter dropping to around 25°F. The average annual precipitation is around 45 inches, with most of it falling in the spring and summer months.
Demographics
As of the 2010 census, Morgan County had a population of 13,923. The racial makeup of the county was 97.2% White, 0.9% Black or African American, 0.3% Native American, 0.2% Asian, 0.1% Pacific Islander, 0.3% from other races, and 0.9% from two or more races. 1.3% of the population were Hispanic or Latino of any race.
The median household income in Morgan County was $30,945, and the median family income was $37,917. The per capita income was $16,845. About 17.2% of the population was below the poverty line.
Economy
The economy of Morgan County is largely based on agriculture and forestry. The county is home to several large farms, and the timber industry is also an important part of the local economy. The county also has some manufacturing and service industries, as well as some tourism.
Education
Morgan County is served by the Morgan County Schools district, which operates seven elementary schools, two middle schools, and one high school. The county also has several private schools, as well as a branch of the University of Kentucky.
Conclusion
Morgan County is a rural county in eastern Kentucky, with a population of just under 14,000. The county is mostly forested, with some agricultural land in the valleys. The economy is largely based on agriculture and forestry, with some manufacturing and service industries, as well as some tourism. The county is served by the Morgan County Schools district, as well as several private schools and a branch of the University of Kentucky.
Common Questions
What is Per Capita Income in Morgan County?
Per Capita income in Morgan County is $23,257.
What is the Median Family Income in Morgan County?
Median Family Income in Morgan County is $58,773.
What is the Median Household income in Morgan County?
Median Household Income in Morgan County is $46,018.
What is Income or Wage Gap in Morgan County?
Income or Wage Gap in Morgan County is 25.6%.
Women in Morgan County earn 74.4 cents for every dollar earned by a man.
What is Family Income Deficit in Morgan County?
Family Income Deficit in Morgan County is $10,916.
Families that are below poverty line in Morgan County earn $10,916 less on average than the poverty threshold level.
What is Inequality or Gini Index in Morgan County?
Inequality or Gini Index in Morgan County is 0.49.
What is the Total Population of Morgan County?
Total Population of Morgan County is 13,840.
What is the Total Male Population of Morgan County?
Total Male Population of Morgan County is 8,000.
What is the Total Female Population of Morgan County?
Total Female Population of Morgan County is 5,840.
What is the Ratio of Males per 100 Females in Morgan County?
There are 136.99 Males per 100 Females in Morgan County.
What is the Ratio of Females per 100 Males in Morgan County?
There are 73.00 Females per 100 Males in Morgan County.
What is the Median Population Age in Morgan County?
Median Population Age in Morgan County is 42.3 Years.
What is the Average Family Size in Morgan County
Average Family Size in Morgan County is 3.2 People.
What is the Average Household Size in Morgan County
Average Household Size in Morgan County is 2.6 People.
How Large is the Labor Force in Morgan County?
There are 4,528 People in the Labor Forcein in Morgan County.
What is the Percentage of People in the Labor Force in Morgan County?
38.9% of People are in the Labor Force in Morgan County.
What is the Unemployment Rate in Morgan County?
Unemployment Rate in Morgan County is 3.1%.