Metcalfe County, KY Map & Demographics
Metcalfe County Overview
$23,380
PER CAPITA INCOME
$56,463
AVG FAMILY INCOME
$46,932
AVG HOUSEHOLD INCOME
18.0%
WAGE / INCOME GAP [ % ]
82.0¢/ $1
WAGE / INCOME GAP [ $ ]
$9,754
FAMILY INCOME DEFICIT
0.42
INEQUALITY / GINI INDEX
10,313
TOTAL POPULATION
5,128
MALE POPULATION
5,185
FEMALE POPULATION
98.90
MALES / 100 FEMALES
101.11
FEMALES / 100 MALES
42.6
MEDIAN AGE
2.9
AVG FAMILY SIZE
2.5
AVG HOUSEHOLD SIZE
4,559
LABOR FORCE [ PEOPLE ]
55.6%
PERCENT IN LABOR FORCE
4.8%
UNEMPLOYMENT RATE
Metcalfe County Area Codes
Income in Metcalfe County
Income Overview in Metcalfe County
Per Capita Income in Metcalfe County is $23,380, while median incomes of families and households are $56,463 and $46,932 respectively.
| Characteristic | Number | Measure |
| Per Capita Income | 10,313 | $23,380 |
| Median Family Income | 2,891 | $56,463 |
| Mean Family Income | 2,891 | $68,481 |
| Median Household Income | 4,160 | $46,932 |
| Mean Household Income | 4,160 | $58,208 |
| Income Deficit | 2,891 | $9,754 |
| Wage / Income Gap (%) | 10,313 | 18.02% |
| Wage / Income Gap ($) | 10,313 | 81.98¢ per $1 |
| Gini / Inequality Index | 10,313 | 0.42 |
Earnings by Sex in Metcalfe County
Average Earnings in Metcalfe County are $33,043, $34,663 for men and $28,418 for women, a difference of 18.0%.
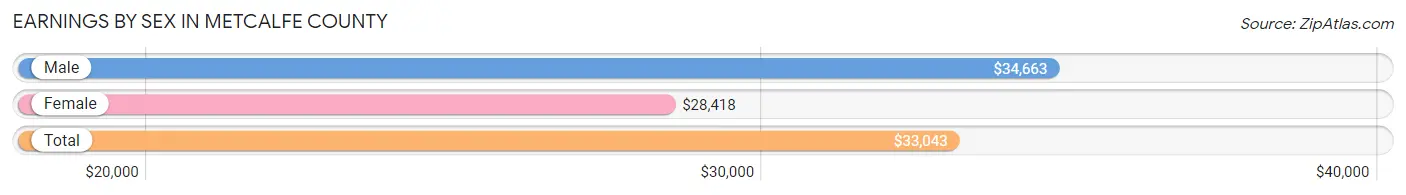
| Sex | Number | Average Earnings |
| Male | 2,472 (52.1%) | $34,663 |
| Female | 2,270 (47.9%) | $28,418 |
| Total | 4,742 (100.0%) | $33,043 |
Earnings by Sex by Income Bracket in Metcalfe County
The most common earnings brackets in Metcalfe County are $75,000 to $99,999 for men (271 | 11.0%) and $40,000 to $44,999 for women (250 | 11.0%).
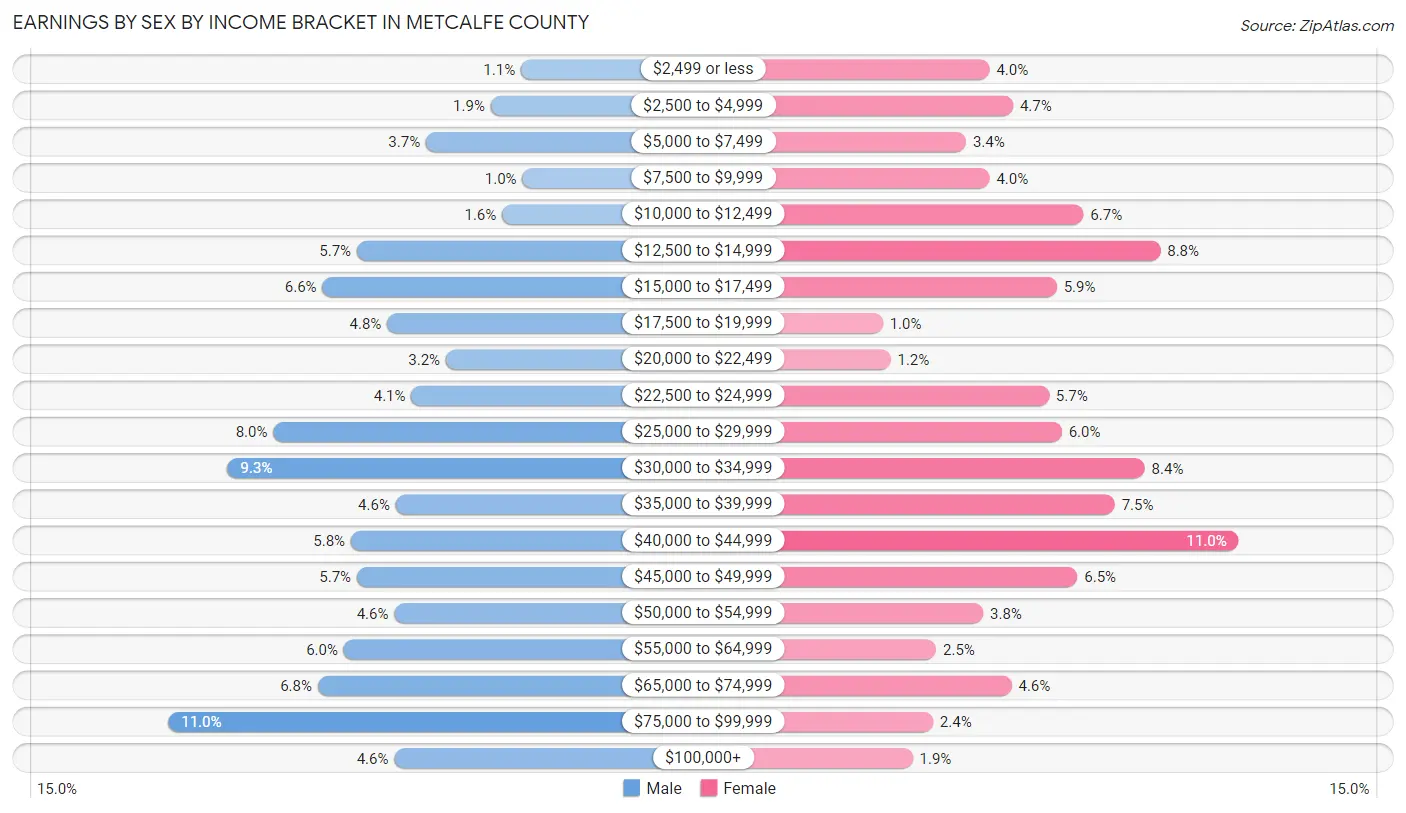
| Income | Male | Female |
| $2,499 or less | 26 (1.1%) | 91 (4.0%) |
| $2,500 to $4,999 | 47 (1.9%) | 106 (4.7%) |
| $5,000 to $7,499 | 92 (3.7%) | 76 (3.4%) |
| $7,500 to $9,999 | 25 (1.0%) | 91 (4.0%) |
| $10,000 to $12,499 | 39 (1.6%) | 151 (6.7%) |
| $12,500 to $14,999 | 140 (5.7%) | 200 (8.8%) |
| $15,000 to $17,499 | 164 (6.6%) | 134 (5.9%) |
| $17,500 to $19,999 | 119 (4.8%) | 23 (1.0%) |
| $20,000 to $22,499 | 78 (3.2%) | 28 (1.2%) |
| $22,500 to $24,999 | 102 (4.1%) | 129 (5.7%) |
| $25,000 to $29,999 | 198 (8.0%) | 137 (6.0%) |
| $30,000 to $34,999 | 230 (9.3%) | 190 (8.4%) |
| $35,000 to $39,999 | 113 (4.6%) | 171 (7.5%) |
| $40,000 to $44,999 | 144 (5.8%) | 250 (11.0%) |
| $45,000 to $49,999 | 140 (5.7%) | 147 (6.5%) |
| $50,000 to $54,999 | 114 (4.6%) | 87 (3.8%) |
| $55,000 to $64,999 | 149 (6.0%) | 57 (2.5%) |
| $65,000 to $74,999 | 167 (6.8%) | 105 (4.6%) |
| $75,000 to $99,999 | 271 (11.0%) | 55 (2.4%) |
| $100,000+ | 114 (4.6%) | 42 (1.8%) |
| Total | 2,472 (100.0%) | 2,270 (100.0%) |
Earnings by Sex by Educational Attainment in Metcalfe County
Average earnings in Metcalfe County are $40,873 for men and $32,139 for women, a difference of 21.4%. Men with an educational attainment of graduate degree enjoy the highest average annual earnings of $74,180, while those with high school diploma education earn the least with $34,498. Women with an educational attainment of graduate degree earn the most with the average annual earnings of $50,750, while those with less than high school education have the smallest earnings of $14,086.
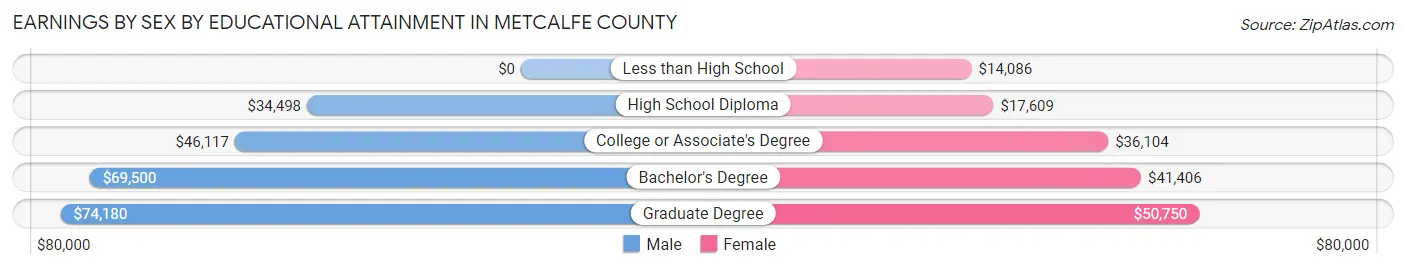
| Educational Attainment | Male Income | Female Income |
| Less than High School | - | - |
| High School Diploma | $34,498 | $17,609 |
| College or Associate's Degree | $46,117 | $36,104 |
| Bachelor's Degree | $69,500 | $41,406 |
| Graduate Degree | $74,180 | $50,750 |
| Total | $40,873 | $32,139 |
Family Income in Metcalfe County
Family Income Brackets in Metcalfe County
According to the Metcalfe County family income data, there are 601 families falling into the $50,000 to $74,999 income range, which is the most common income bracket and makes up 20.8% of all families. Conversely, the $200,000+ income bracket is the least frequent group with only 55 families (1.9%) belonging to this category.
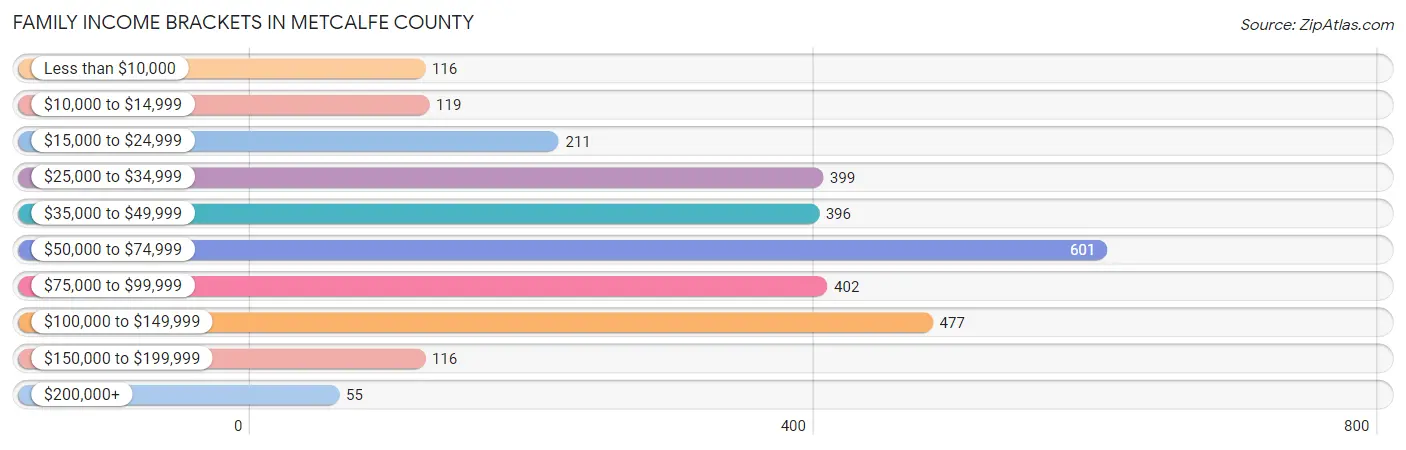
| Income Bracket | # Families | % Families |
| Less than $10,000 | 116 | 4.0% |
| $10,000 to $14,999 | 119 | 4.1% |
| $15,000 to $24,999 | 211 | 7.3% |
| $25,000 to $34,999 | 399 | 13.8% |
| $35,000 to $49,999 | 396 | 13.7% |
| $50,000 to $74,999 | 601 | 20.8% |
| $75,000 to $99,999 | 402 | 13.9% |
| $100,000 to $149,999 | 477 | 16.5% |
| $150,000 to $199,999 | 116 | 4.0% |
| $200,000+ | 55 | 1.9% |
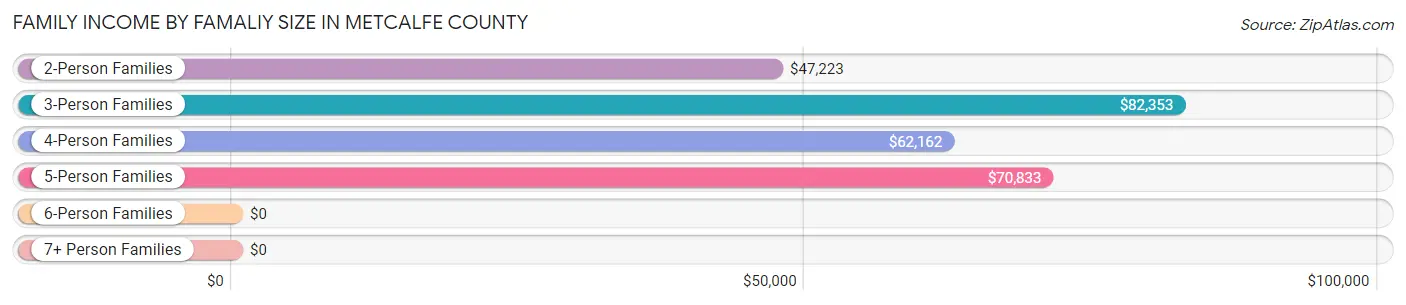
Family Income by Famaliy Size in Metcalfe County
3-person families (682 | 23.6%) account for the highest median family income in Metcalfe County with $82,353 per family, while 3-person families (682 | 23.6%) have the highest median income of $27,451 per family member.
| Income Bracket | # Families | Median Income |
| 2-Person Families | 1,425 (49.3%) | $47,223 |
| 3-Person Families | 682 (23.6%) | $82,353 |
| 4-Person Families | 430 (14.9%) | $62,162 |
| 5-Person Families | 148 (5.1%) | $70,833 |
| 6-Person Families | 202 (7.0%) | $0 |
| 7+ Person Families | 4 (0.1%) | $0 |
| Total | 2,891 (100.0%) | $56,463 |
Family Income by Number of Earners in Metcalfe County
The median family income in Metcalfe County is $56,463, with families comprising 3+ earners (267) having the highest median family income of $122,019, while families with no earners (540) have the lowest median family income of $27,974, accounting for 9.2% and 18.7% of families, respectively.
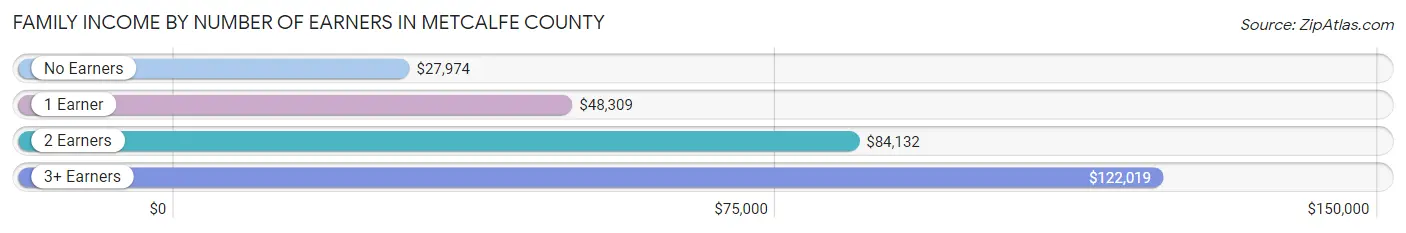
| Number of Earners | # Families | Median Income |
| No Earners | 540 (18.7%) | $27,974 |
| 1 Earner | 1,116 (38.6%) | $48,309 |
| 2 Earners | 968 (33.5%) | $84,132 |
| 3+ Earners | 267 (9.2%) | $122,019 |
| Total | 2,891 (100.0%) | $56,463 |
Household Income in Metcalfe County
Household Income Brackets in Metcalfe County
With 811 households falling in the category, the $50,000 to $74,999 income range is the most frequent in Metcalfe County, accounting for 19.5% of all households. In contrast, only 58 households (1.4%) fall into the $200,000+ income bracket, making it the least populous group.
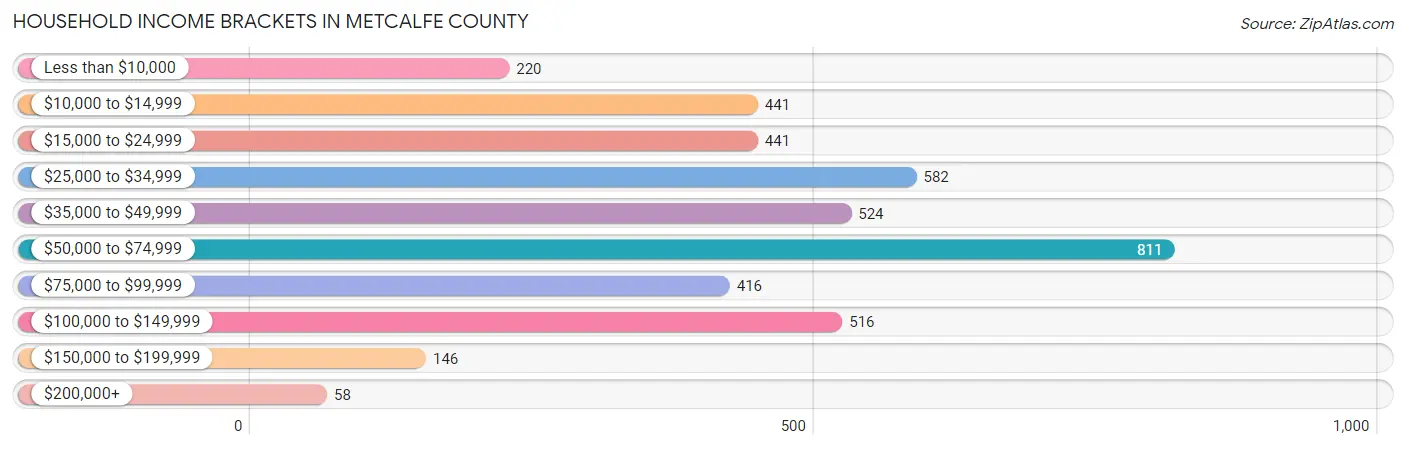
| Income Bracket | # Households | % Households |
| Less than $10,000 | 220 | 5.3% |
| $10,000 to $14,999 | 441 | 10.6% |
| $15,000 to $24,999 | 441 | 10.6% |
| $25,000 to $34,999 | 582 | 14.0% |
| $35,000 to $49,999 | 524 | 12.6% |
| $50,000 to $74,999 | 811 | 19.5% |
| $75,000 to $99,999 | 416 | 10.0% |
| $100,000 to $149,999 | 516 | 12.4% |
| $150,000 to $199,999 | 146 | 3.5% |
| $200,000+ | 58 | 1.4% |
Household Income by Householder Age in Metcalfe County
The median household income in Metcalfe County is $46,932, with the highest median household income of $58,708 found in the 15 to 24 years age bracket for the primary householder. A total of 145 households (3.5%) fall into this category. Meanwhile, the 65+ years age bracket for the primary householder has the lowest median household income of $42,054, with 1,139 households (27.4%) in this group.
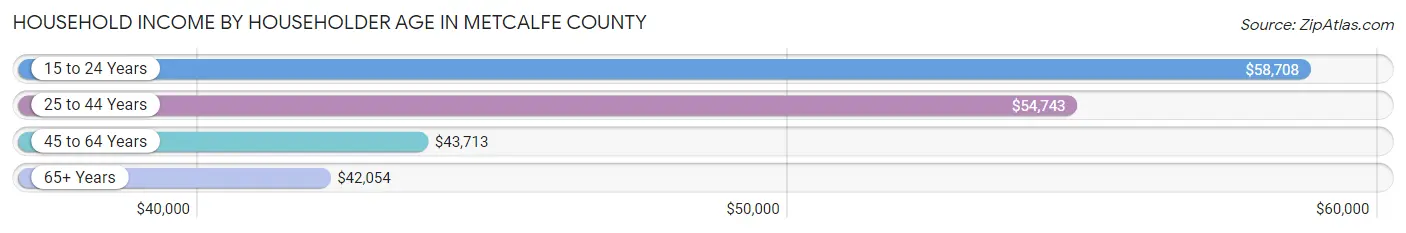
| Income Bracket | # Households | Median Income |
| 15 to 24 Years | 145 (3.5%) | $58,708 |
| 25 to 44 Years | 1,157 (27.8%) | $54,743 |
| 45 to 64 Years | 1,719 (41.3%) | $43,713 |
| 65+ Years | 1,139 (27.4%) | $42,054 |
| Total | 4,160 (100.0%) | $46,932 |
Poverty in Metcalfe County
Income Below Poverty by Sex and Age in Metcalfe County
With 21.0% poverty level for males and 27.0% for females among the residents of Metcalfe County, 5 year old males and 15 year old females are the most vulnerable to poverty, with 12 males (75.0%) and 41 females (91.1%) in their respective age groups living below the poverty level.
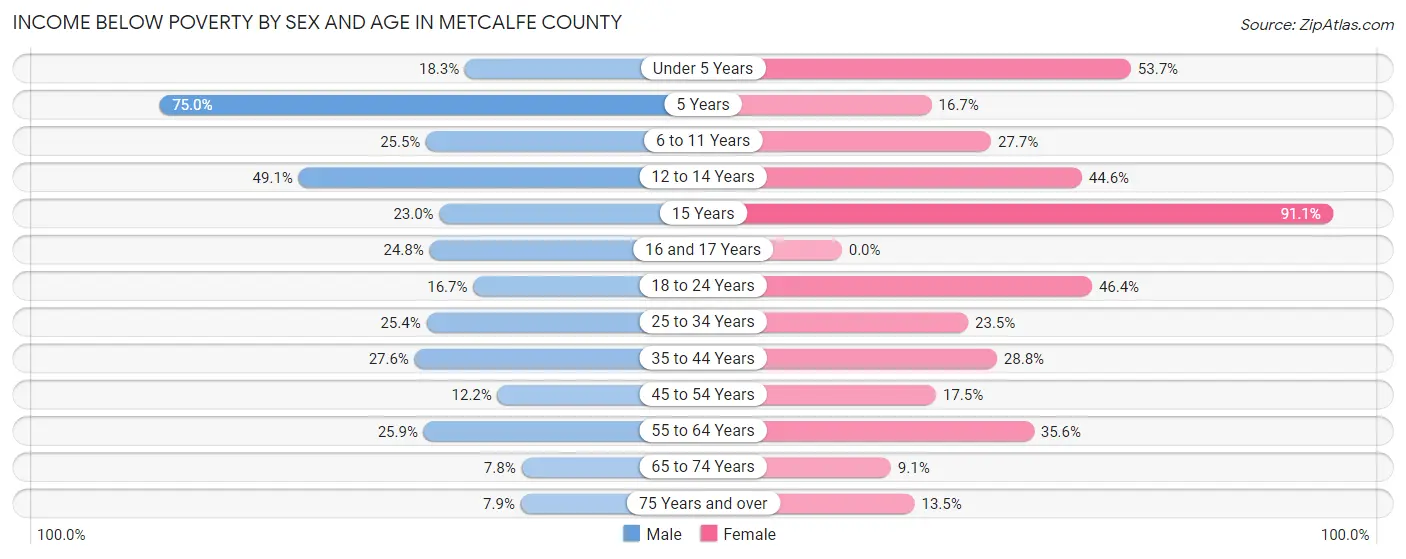
| Age Bracket | Male | Female |
| Under 5 Years | 50 (18.2%) | 154 (53.7%) |
| 5 Years | 12 (75.0%) | 7 (16.7%) |
| 6 to 11 Years | 110 (25.5%) | 128 (27.7%) |
| 12 to 14 Years | 113 (49.1%) | 82 (44.6%) |
| 15 Years | 23 (23.0%) | 41 (91.1%) |
| 16 and 17 Years | 36 (24.8%) | 0 (0.0%) |
| 18 to 24 Years | 69 (16.7%) | 156 (46.4%) |
| 25 to 34 Years | 144 (25.4%) | 125 (23.4%) |
| 35 to 44 Years | 165 (27.6%) | 186 (28.8%) |
| 45 to 54 Years | 87 (12.2%) | 121 (17.5%) |
| 55 to 64 Years | 192 (25.9%) | 269 (35.6%) |
| 65 to 74 Years | 41 (7.8%) | 54 (9.1%) |
| 75 Years and over | 25 (7.9%) | 57 (13.5%) |
| Total | 1,067 (21.0%) | 1,380 (27.0%) |
Income Above Poverty by Sex and Age in Metcalfe County
According to the poverty statistics in Metcalfe County, males aged 65 to 74 years and females aged 16 and 17 years are the age groups that are most secure financially, with 92.2% of males and 100.0% of females in these age groups living above the poverty line.
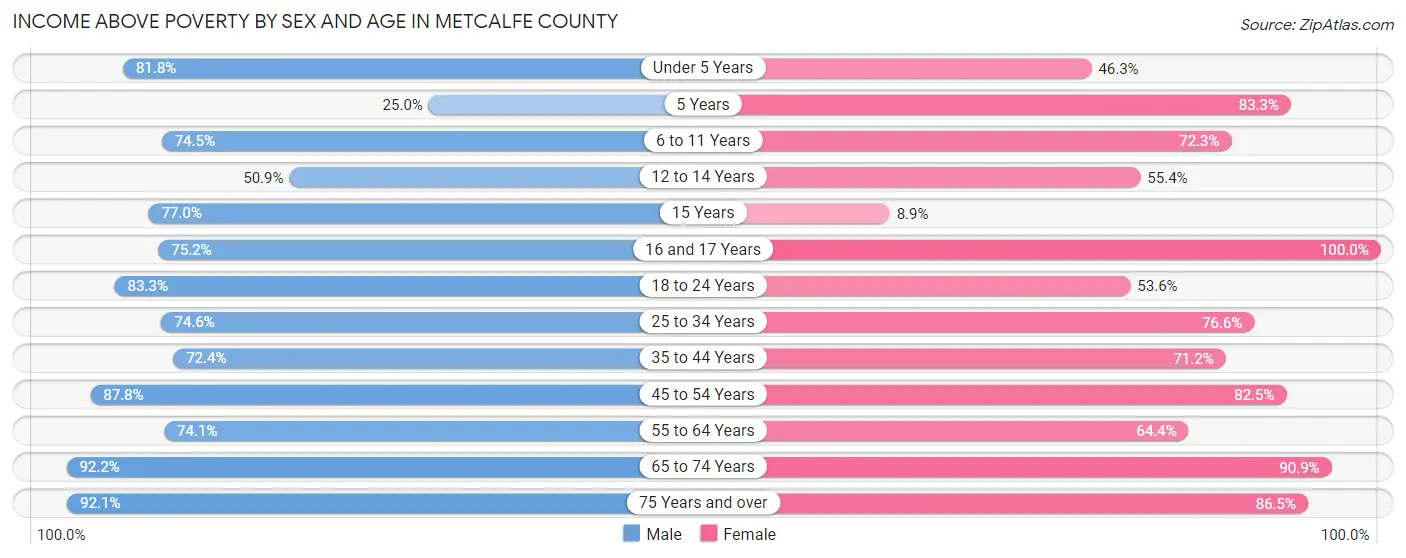
| Age Bracket | Male | Female |
| Under 5 Years | 224 (81.8%) | 133 (46.3%) |
| 5 Years | 4 (25.0%) | 35 (83.3%) |
| 6 to 11 Years | 322 (74.5%) | 334 (72.3%) |
| 12 to 14 Years | 117 (50.9%) | 102 (55.4%) |
| 15 Years | 77 (77.0%) | 4 (8.9%) |
| 16 and 17 Years | 109 (75.2%) | 125 (100.0%) |
| 18 to 24 Years | 344 (83.3%) | 180 (53.6%) |
| 25 to 34 Years | 423 (74.6%) | 408 (76.5%) |
| 35 to 44 Years | 433 (72.4%) | 460 (71.2%) |
| 45 to 54 Years | 626 (87.8%) | 571 (82.5%) |
| 55 to 64 Years | 549 (74.1%) | 486 (64.4%) |
| 65 to 74 Years | 487 (92.2%) | 538 (90.9%) |
| 75 Years and over | 291 (92.1%) | 365 (86.5%) |
| Total | 4,006 (79.0%) | 3,741 (73.1%) |
Income Below Poverty Among Married-Couple Families in Metcalfe County
The poverty statistics for married-couple families in Metcalfe County show that 14.5% or 337 of the total 2,317 families live below the poverty line. Families with 3 or 4 children have the highest poverty rate of 43.0%, comprising of 98 families. On the other hand, families with 5 or more children have the lowest poverty rate of 0.0%, which includes 0 families.
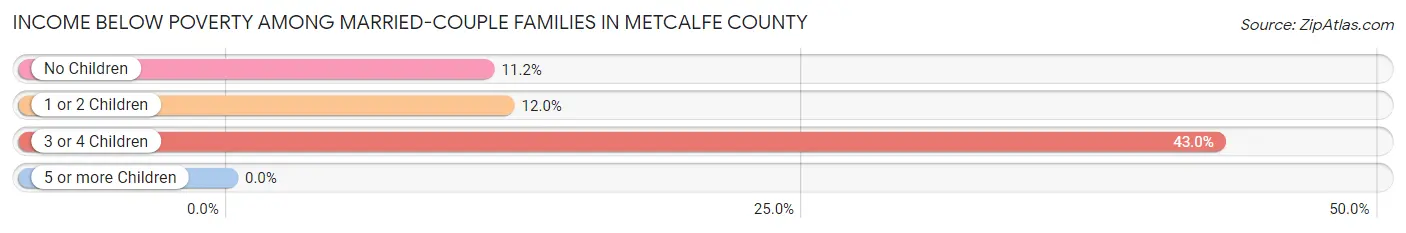
| Children | Above Poverty | Below Poverty |
| No Children | 1,225 (88.8%) | 154 (11.2%) |
| 1 or 2 Children | 621 (88.0%) | 85 (12.0%) |
| 3 or 4 Children | 130 (57.0%) | 98 (43.0%) |
| 5 or more Children | 4 (100.0%) | 0 (0.0%) |
| Total | 1,980 (85.5%) | 337 (14.5%) |
Income Below Poverty Among Single-Parent Households in Metcalfe County
According to the poverty data in Metcalfe County, 21.1% or 51 single-father households and 33.4% or 111 single-mother households are living below the poverty line. Among single-father households, those with 1 or 2 children have the highest poverty rate, with 50 households (36.5%) experiencing poverty. Likewise, among single-mother households, those with 3 or 4 children have the highest poverty rate, with 38 households (50.7%) falling below the poverty line.
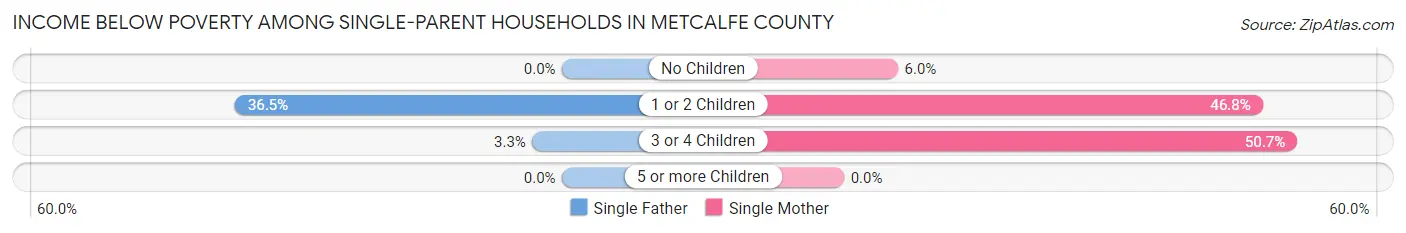
| Children | Single Father | Single Mother |
| No Children | 0 (0.0%) | 7 (6.0%) |
| 1 or 2 Children | 50 (36.5%) | 66 (46.8%) |
| 3 or 4 Children | 1 (3.3%) | 38 (50.7%) |
| 5 or more Children | 0 (0.0%) | 0 (0.0%) |
| Total | 51 (21.1%) | 111 (33.4%) |
Income Below Poverty Among Married-Couple vs Single-Parent Households in Metcalfe County
The poverty data for Metcalfe County shows that 337 of the married-couple family households (14.5%) and 162 of the single-parent households (28.2%) are living below the poverty level. Within the married-couple family households, those with 3 or 4 children have the highest poverty rate, with 98 households (43.0%) falling below the poverty line. Among the single-parent households, those with 1 or 2 children have the highest poverty rate, with 116 household (41.7%) living below poverty.
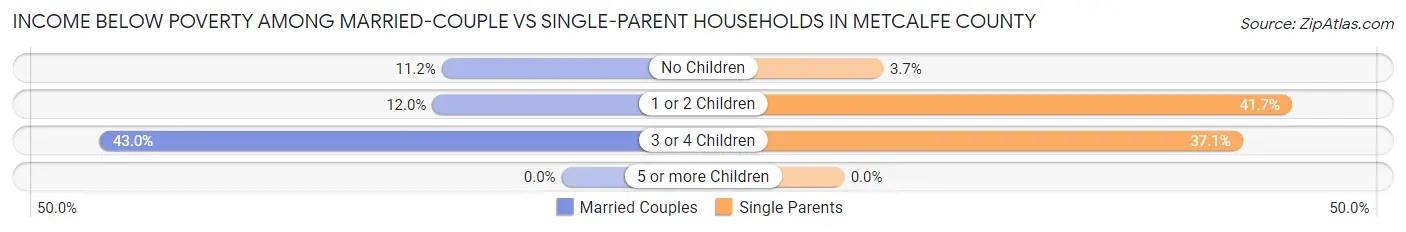
| Children | Married-Couple Families | Single-Parent Households |
| No Children | 154 (11.2%) | 7 (3.7%) |
| 1 or 2 Children | 85 (12.0%) | 116 (41.7%) |
| 3 or 4 Children | 98 (43.0%) | 39 (37.1%) |
| 5 or more Children | 0 (0.0%) | 0 (0.0%) |
| Total | 337 (14.5%) | 162 (28.2%) |
Race in Metcalfe County
The most populous races in Metcalfe County are White / Caucasian (9,800 | 95.0%), Hispanic or Latino (204 | 2.0%), and Black / African American (196 | 1.9%).
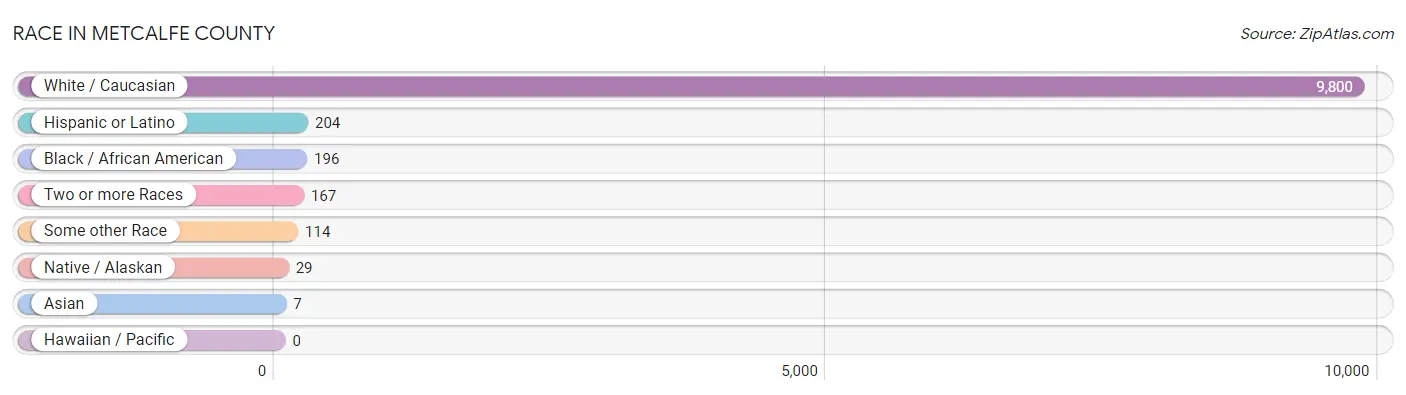
| Race | # Population | % Population |
| Asian | 7 | 0.1% |
| Black / African American | 196 | 1.9% |
| Hawaiian / Pacific | 0 | 0.0% |
| Hispanic or Latino | 204 | 2.0% |
| Native / Alaskan | 29 | 0.3% |
| White / Caucasian | 9,800 | 95.0% |
| Two or more Races | 167 | 1.6% |
| Some other Race | 114 | 1.1% |
| Total | 10,313 | 100.0% |
Ancestry in Metcalfe County
The most populous ancestries reported in Metcalfe County are American (1,681 | 16.3%), English (1,007 | 9.8%), Irish (790 | 7.7%), German (583 | 5.7%), and Italian (371 | 3.6%), together accounting for 43.0% of all Metcalfe County residents.
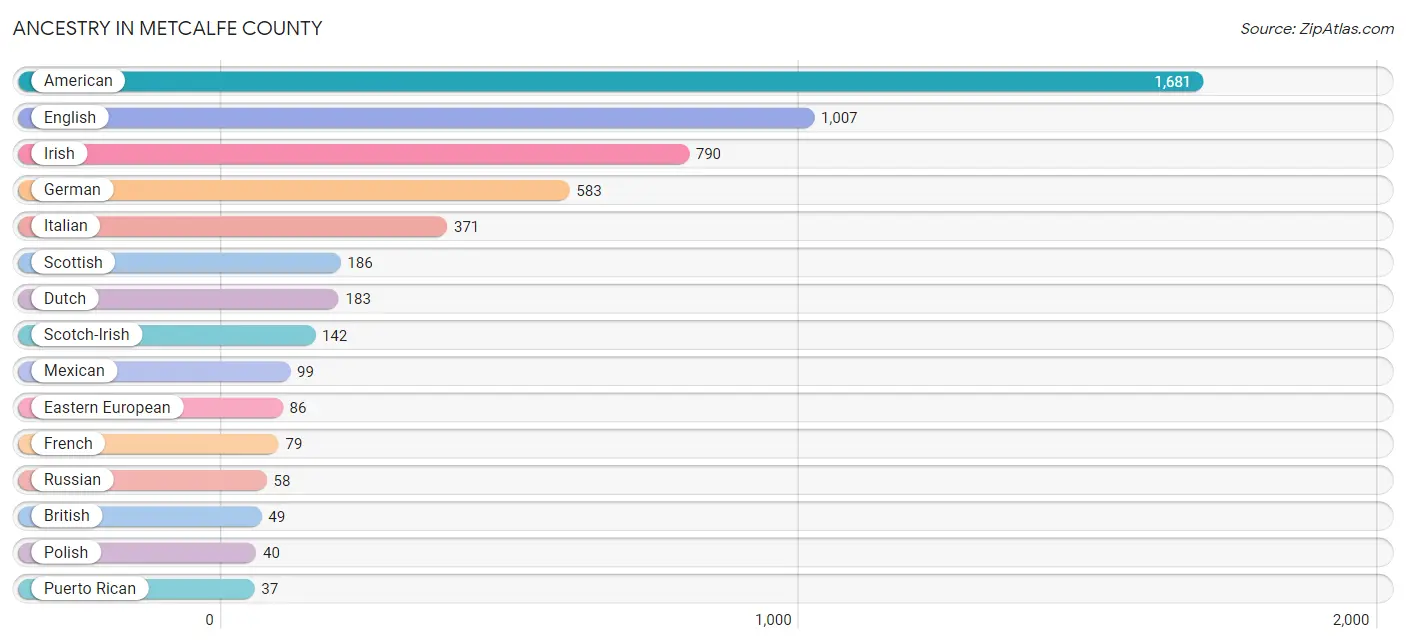
| Ancestry | # Population | % Population |
| American | 1,681 | 16.3% |
| Austrian | 4 | 0.0% |
| British | 49 | 0.5% |
| Cherokee | 21 | 0.2% |
| Colombian | 33 | 0.3% |
| Dutch | 183 | 1.8% |
| Eastern European | 86 | 0.8% |
| English | 1,007 | 9.8% |
| European | 10 | 0.1% |
| Finnish | 10 | 0.1% |
| French | 79 | 0.8% |
| French Canadian | 5 | 0.1% |
| German | 583 | 5.7% |
| Guamanian / Chamorro | 2 | 0.0% |
| Hopi | 2 | 0.0% |
| Irish | 790 | 7.7% |
| Italian | 371 | 3.6% |
| Korean | 7 | 0.1% |
| Mexican | 99 | 1.0% |
| Norwegian | 7 | 0.1% |
| Polish | 40 | 0.4% |
| Portuguese | 30 | 0.3% |
| Potawatomi | 6 | 0.1% |
| Puerto Rican | 37 | 0.4% |
| Romanian | 17 | 0.2% |
| Russian | 58 | 0.6% |
| Scandinavian | 11 | 0.1% |
| Scotch-Irish | 142 | 1.4% |
| Scottish | 186 | 1.8% |
| South American | 33 | 0.3% |
| Sri Lankan | 3 | 0.0% |
| Swedish | 23 | 0.2% |
| Vietnamese | 2 | 0.0% |
| Welsh | 13 | 0.1% |
| Yugoslavian | 18 | 0.2% | View All 35 Rows |
Immigrants in Metcalfe County
The most numerous immigrant groups reported in Metcalfe County came from Latin America (132 | 1.3%), Central America (99 | 1.0%), Mexico (99 | 1.0%), Colombia (33 | 0.3%), and South America (33 | 0.3%), together accounting for 3.8% of all Metcalfe County residents.
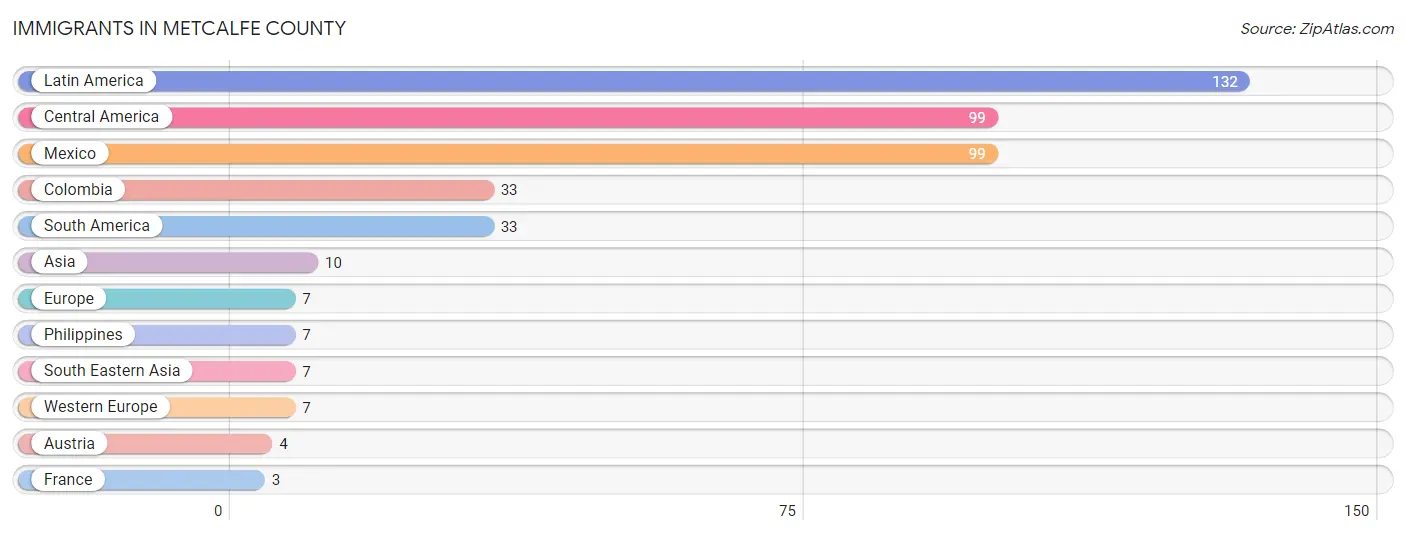
| Immigration Origin | # Population | % Population |
| Asia | 10 | 0.1% |
| Austria | 4 | 0.0% |
| Central America | 99 | 1.0% |
| Colombia | 33 | 0.3% |
| Europe | 7 | 0.1% |
| France | 3 | 0.0% |
| Latin America | 132 | 1.3% |
| Mexico | 99 | 1.0% |
| Philippines | 7 | 0.1% |
| South America | 33 | 0.3% |
| South Eastern Asia | 7 | 0.1% |
| Western Europe | 7 | 0.1% | View All 12 Rows |
Sex and Age in Metcalfe County
Sex and Age in Metcalfe County
The most populous age groups in Metcalfe County are 55 to 59 Years (506 | 9.9%) for men and 60 to 64 Years (410 | 7.9%) for women.
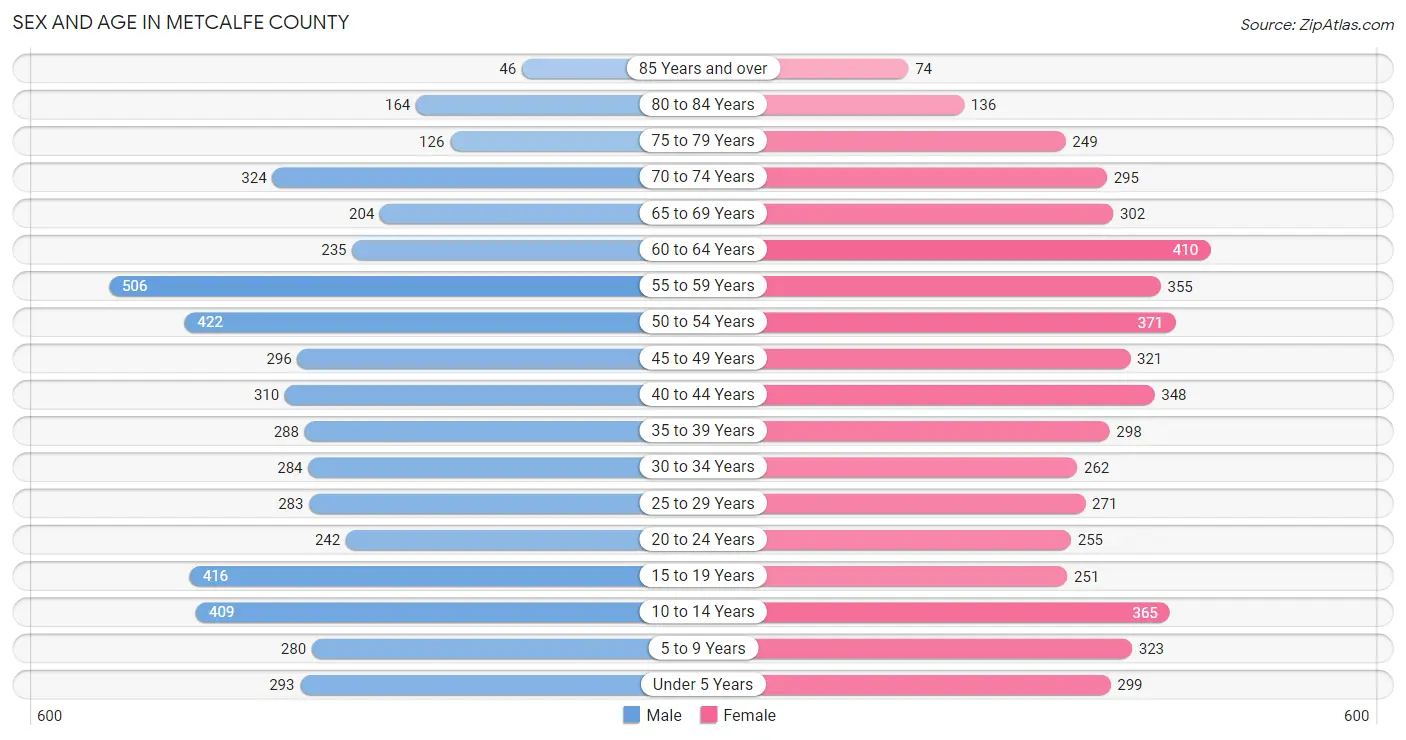
| Age Bracket | Male | Female |
| Under 5 Years | 293 (5.7%) | 299 (5.8%) |
| 5 to 9 Years | 280 (5.5%) | 323 (6.2%) |
| 10 to 14 Years | 409 (8.0%) | 365 (7.0%) |
| 15 to 19 Years | 416 (8.1%) | 251 (4.8%) |
| 20 to 24 Years | 242 (4.7%) | 255 (4.9%) |
| 25 to 29 Years | 283 (5.5%) | 271 (5.2%) |
| 30 to 34 Years | 284 (5.5%) | 262 (5.1%) |
| 35 to 39 Years | 288 (5.6%) | 298 (5.8%) |
| 40 to 44 Years | 310 (6.0%) | 348 (6.7%) |
| 45 to 49 Years | 296 (5.8%) | 321 (6.2%) |
| 50 to 54 Years | 422 (8.2%) | 371 (7.2%) |
| 55 to 59 Years | 506 (9.9%) | 355 (6.9%) |
| 60 to 64 Years | 235 (4.6%) | 410 (7.9%) |
| 65 to 69 Years | 204 (4.0%) | 302 (5.8%) |
| 70 to 74 Years | 324 (6.3%) | 295 (5.7%) |
| 75 to 79 Years | 126 (2.5%) | 249 (4.8%) |
| 80 to 84 Years | 164 (3.2%) | 136 (2.6%) |
| 85 Years and over | 46 (0.9%) | 74 (1.4%) |
| Total | 5,128 (100.0%) | 5,185 (100.0%) |
Families and Households in Metcalfe County
Median Family Size in Metcalfe County
The median family size in Metcalfe County is 2.91 persons per family, with married-couple families (2,317 | 80.1%) accounting for the largest median family size of 2.95 persons per family. On the other hand, single male/father families (242 | 8.4%) represent the smallest median family size with 2.74 persons per family.
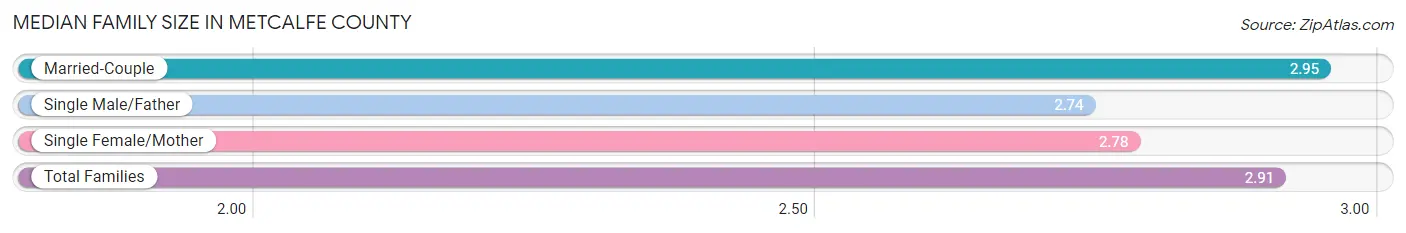
| Family Type | # Families | Family Size |
| Married-Couple | 2,317 (80.1%) | 2.95 |
| Single Male/Father | 242 (8.4%) | 2.74 |
| Single Female/Mother | 332 (11.5%) | 2.78 |
| Total Families | 2,891 (100.0%) | 2.91 |
Median Household Size in Metcalfe County
The median household size in Metcalfe County is 2.45 persons per household, with single male/father households (242 | 5.8%) accounting for the largest median household size of 3.19 persons per household. non-family households (1,269 | 30.5%) represent the smallest median household size with 1.26 persons per household.
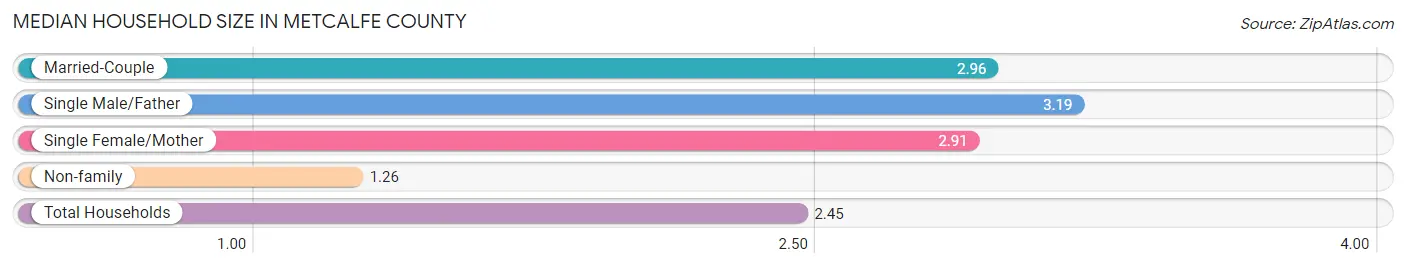
| Household Type | # Households | Household Size |
| Married-Couple | 2,317 (55.7%) | 2.96 |
| Single Male/Father | 242 (5.8%) | 3.19 |
| Single Female/Mother | 332 (8.0%) | 2.91 |
| Non-family | 1,269 (30.5%) | 1.26 |
| Total Households | 4,160 (100.0%) | 2.45 |
Household Size by Marriage Status in Metcalfe County
Out of a total of 4,160 households in Metcalfe County, 2,891 (69.5%) are family households, while 1,269 (30.5%) are nonfamily households. The most numerous type of family households are 2-person households, comprising 1,403, and the most common type of nonfamily households are 1-person households, comprising 1,069.
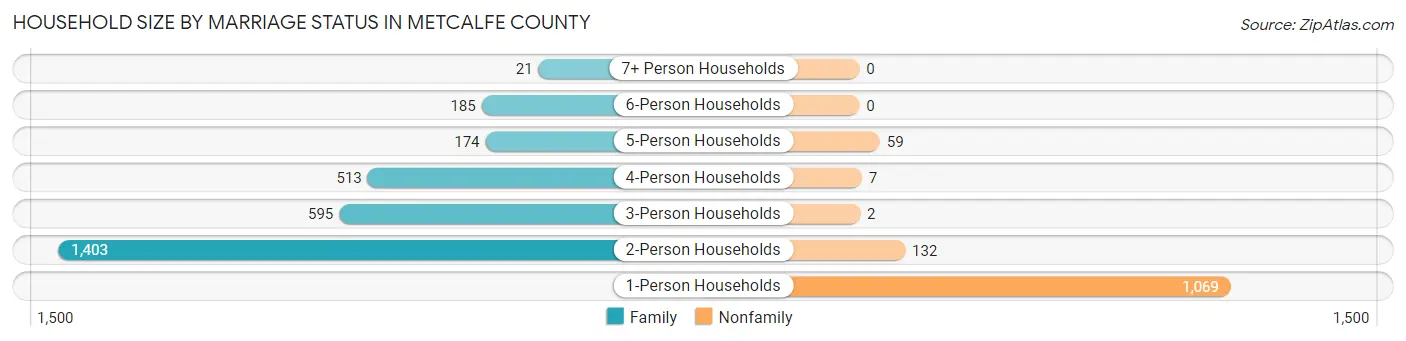
| Household Size | Family Households | Nonfamily Households |
| 1-Person Households | - | 1,069 (25.7%) |
| 2-Person Households | 1,403 (33.7%) | 132 (3.2%) |
| 3-Person Households | 595 (14.3%) | 2 (0.1%) |
| 4-Person Households | 513 (12.3%) | 7 (0.2%) |
| 5-Person Households | 174 (4.2%) | 59 (1.4%) |
| 6-Person Households | 185 (4.4%) | 0 (0.0%) |
| 7+ Person Households | 21 (0.5%) | 0 (0.0%) |
| Total | 2,891 (69.5%) | 1,269 (30.5%) |
Female Fertility in Metcalfe County
Fertility by Age in Metcalfe County
Average fertility rate in Metcalfe County is 29.0 births per 1,000 women. Women in the age bracket of 20 to 34 years have the highest fertility rate with 69.0 births per 1,000 women. Women in the age bracket of 20 to 34 years acount for 88.5% of all women with births.
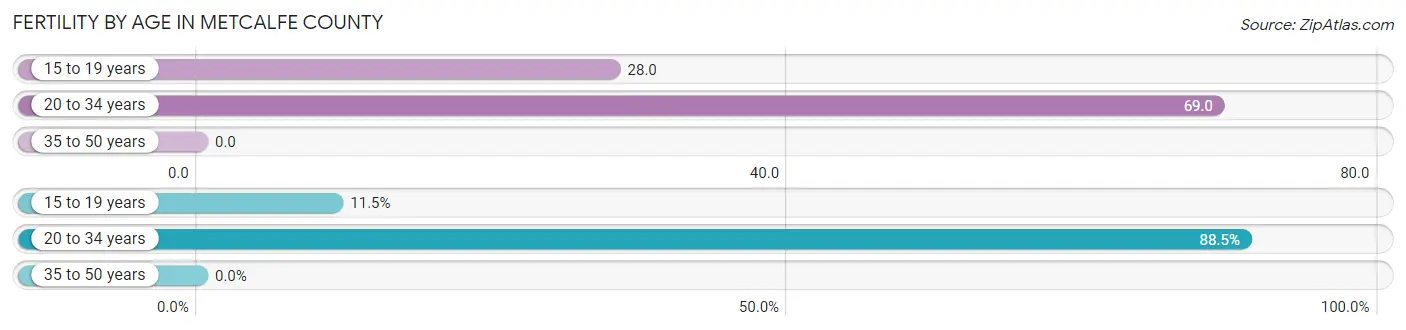
| Age Bracket | Women with Births | Births / 1,000 Women |
| 15 to 19 years | 7 (11.5%) | 28.0 |
| 20 to 34 years | 54 (88.5%) | 69.0 |
| 35 to 50 years | 0 (0.0%) | 0.0 |
| Total | 61 (100.0%) | 29.0 |
Fertility by Age by Marriage Status in Metcalfe County
68.9% of women with births (61) in Metcalfe County are married. The highest percentage of unmarried women with births falls into 15 to 19 years age bracket with 100.0% of them unmarried at the time of birth, while the lowest percentage of unmarried women with births belong to 20 to 34 years age bracket with 22.2% of them unmarried.
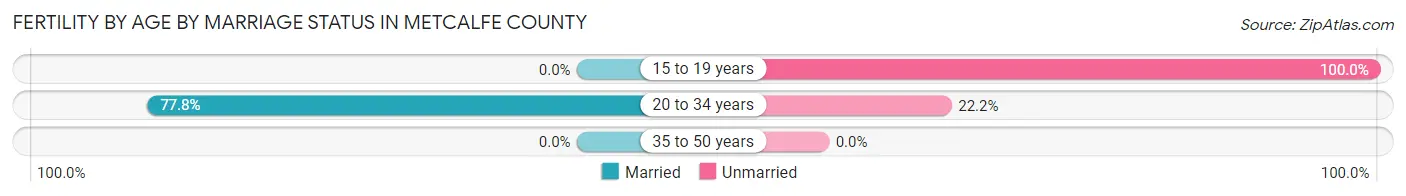
| Age Bracket | Married | Unmarried |
| 15 to 19 years | 0 (0.0%) | 7 (100.0%) |
| 20 to 34 years | 42 (77.8%) | 12 (22.2%) |
| 35 to 50 years | 0 (0.0%) | 0 (0.0%) |
| Total | 42 (68.9%) | 19 (31.1%) |
Fertility by Education in Metcalfe County
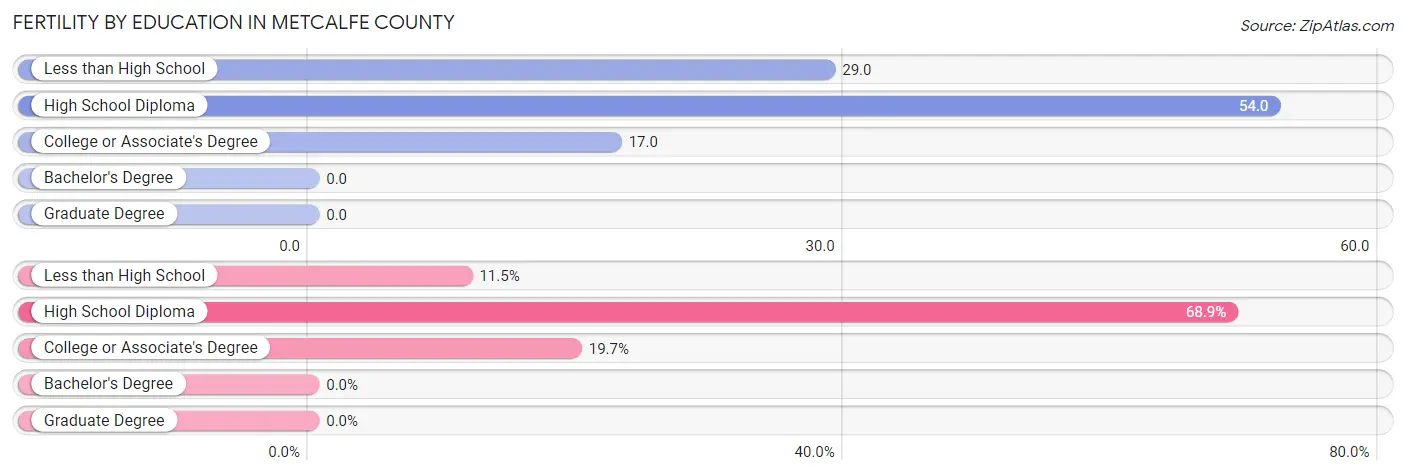
| Educational Attainment | Women with Births | Births / 1,000 Women |
| Less than High School | 7 (11.5%) | 29.0 |
| High School Diploma | 42 (68.9%) | 54.0 |
| College or Associate's Degree | 12 (19.7%) | 17.0 |
| Bachelor's Degree | 0 (0.0%) | 0.0 |
| Graduate Degree | 0 (0.0%) | 0.0 |
| Total | 61 (100.0%) | 29.0 |
Fertility by Education by Marriage Status in Metcalfe County
31.1% of women with births in Metcalfe County are unmarried. Women with the educational attainment of high school diploma are most likely to be married with 100.0% of them married at childbirth, while women with the educational attainment of less than high school are least likely to be married with 100.0% of them unmarried at childbirth.
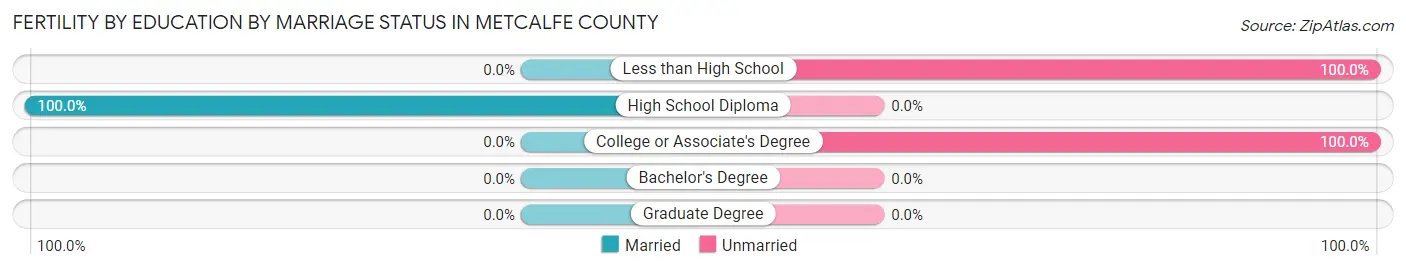
| Educational Attainment | Married | Unmarried |
| Less than High School | 0 (0.0%) | 7 (100.0%) |
| High School Diploma | 42 (100.0%) | 0 (0.0%) |
| College or Associate's Degree | 0 (0.0%) | 12 (100.0%) |
| Bachelor's Degree | 0 (0.0%) | 0 (0.0%) |
| Graduate Degree | 0 (0.0%) | 0 (0.0%) |
| Total | 42 (68.9%) | 19 (31.1%) |
Employment Characteristics in Metcalfe County
Employment by Class of Employer in Metcalfe County
Among the 4,206 employed individuals in Metcalfe County, private company employees (2,829 | 67.3%), local government employees (386 | 9.2%), and not-for-profit organizations (382 | 9.1%) make up the most common classes of employment.
| Employer Class | # Employees | % Employees |
| Private Company Employees | 2,829 | 67.3% |
| Self-Employed (Incorporated) | 79 | 1.9% |
| Self-Employed (Not Incorporated) | 332 | 7.9% |
| Not-for-profit Organizations | 382 | 9.1% |
| Local Government Employees | 386 | 9.2% |
| State Government Employees | 67 | 1.6% |
| Federal Government Employees | 90 | 2.1% |
| Unpaid Family Workers | 41 | 1.0% |
| Total | 4,206 | 100.0% |
Employment Status by Age in Metcalfe County
According to the labor force statistics for Metcalfe County, out of the total population over 16 years of age (8,199), 55.6% or 4,559 individuals are in the labor force, with 4.8% or 219 of them unemployed. The age group with the highest labor force participation rate is 20 to 24 years, with 83.9% or 417 individuals in the labor force. Within the labor force, the 16 to 19 years age range has the highest percentage of unemployed individuals, with 22.3% or 54 of them being unemployed.
| Age Bracket | In Labor Force | Unemployed |
| 16 to 19 Years | 242 (46.4%) | 54 (22.3%) |
| 20 to 24 Years | 417 (83.9%) | 39 (9.4%) |
| 25 to 29 Years | 409 (73.8%) | 20 (4.9%) |
| 30 to 34 Years | 422 (77.3%) | 13 (3.1%) |
| 35 to 44 Years | 1,014 (81.5%) | 31 (3.1%) |
| 45 to 54 Years | 957 (67.9%) | 12 (1.3%) |
| 55 to 59 Years | 502 (58.3%) | 9 (1.8%) |
| 60 to 64 Years | 285 (44.2%) | 4 (1.4%) |
| 65 to 74 Years | 280 (24.9%) | 37 (13.2%) |
| 75 Years and over | 34 (4.3%) | 0 (0.0%) |
| Total | 4,559 (55.6%) | 219 (4.8%) |
Employment Status by Educational Attainment in Metcalfe County
According to labor force statistics for Metcalfe County, 68.2% of individuals (3,587) out of the total population between 25 and 64 years of age (5,260) are in the labor force, with 2.5% or 90 of them being unemployed. The group with the highest labor force participation rate are those with the educational attainment of bachelor's degree or higher, with 85.2% or 713 individuals in the labor force. Within the labor force, individuals with high school diploma education have the highest percentage of unemployment, with 4.7% or 73 of them being unemployed.
| Educational Attainment | In Labor Force | Unemployed |
| Less than High School | 285 (41.4%) | 0 (0.0%) |
| High School Diploma | 1,545 (67.7%) | 107 (4.7%) |
| College / Associate Degree | 1,045 (72.0%) | 23 (1.6%) |
| Bachelor's Degree or higher | 713 (85.2%) | 0 (0.0%) |
| Total | 3,587 (68.2%) | 132 (2.5%) |
Employment Occupations by Sex in Metcalfe County
Management, Business, Science and Arts Occupations
The most common Management, Business, Science and Arts occupations in Metcalfe County are Community & Social Service (449 | 10.3%), Education Instruction & Library (337 | 7.8%), Management (291 | 6.7%), Health Diagnosing & Treating (275 | 6.3%), and Health Technologists (165 | 3.8%).
Management, Business, Science and Arts Occupations by Sex
Within the Management, Business, Science and Arts occupations in Metcalfe County, the most male-oriented occupations are Architecture & Engineering (100.0%), Arts, Media & Entertainment (93.8%), and Management (66.0%), while the most female-oriented occupations are Education Instruction & Library (90.5%), Computers & Mathematics (88.0%), and Business & Financial (85.4%).
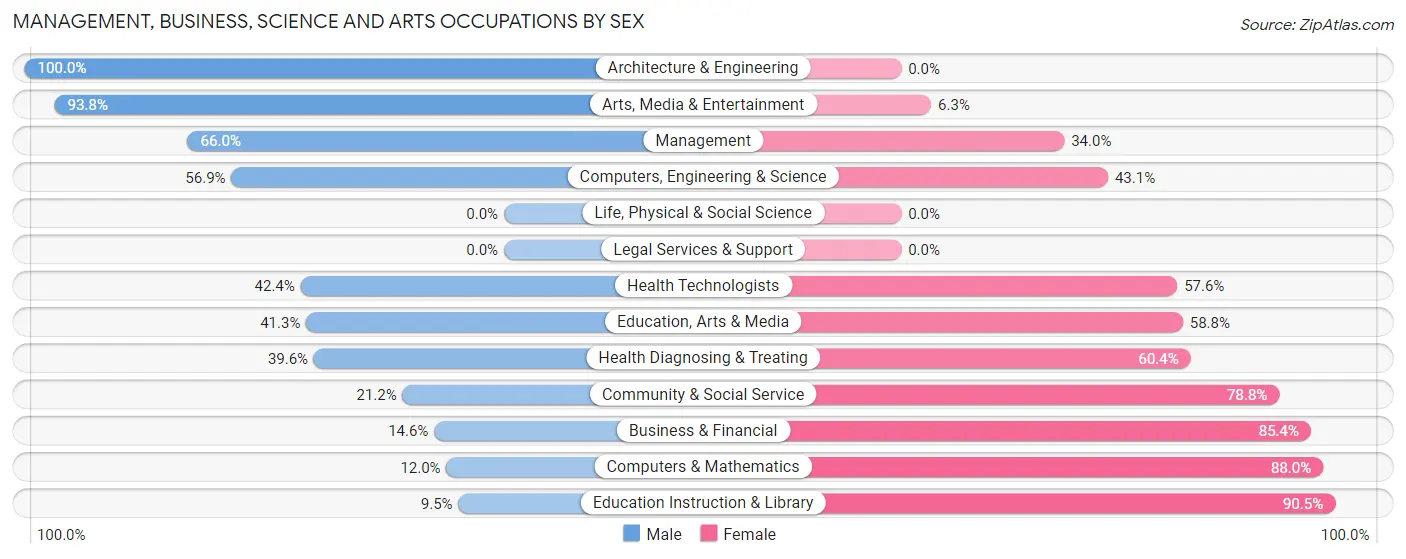
| Occupation | Male | Female |
| Management | 192 (66.0%) | 99 (34.0%) |
| Business & Financial | 23 (14.6%) | 135 (85.4%) |
| Computers, Engineering & Science | 29 (56.9%) | 22 (43.1%) |
| Computers & Mathematics | 3 (12.0%) | 22 (88.0%) |
| Architecture & Engineering | 26 (100.0%) | 0 (0.0%) |
| Life, Physical & Social Science | 0 (0.0%) | 0 (0.0%) |
| Community & Social Service | 95 (21.2%) | 354 (78.8%) |
| Education, Arts & Media | 33 (41.2%) | 47 (58.8%) |
| Legal Services & Support | 0 (0.0%) | 0 (0.0%) |
| Education Instruction & Library | 32 (9.5%) | 305 (90.5%) |
| Arts, Media & Entertainment | 30 (93.8%) | 2 (6.2%) |
| Health Diagnosing & Treating | 109 (39.6%) | 166 (60.4%) |
| Health Technologists | 70 (42.4%) | 95 (57.6%) |
| Total (Category) | 448 (36.6%) | 776 (63.4%) |
| Total (Overall) | 2,339 (53.9%) | 2,004 (46.1%) |
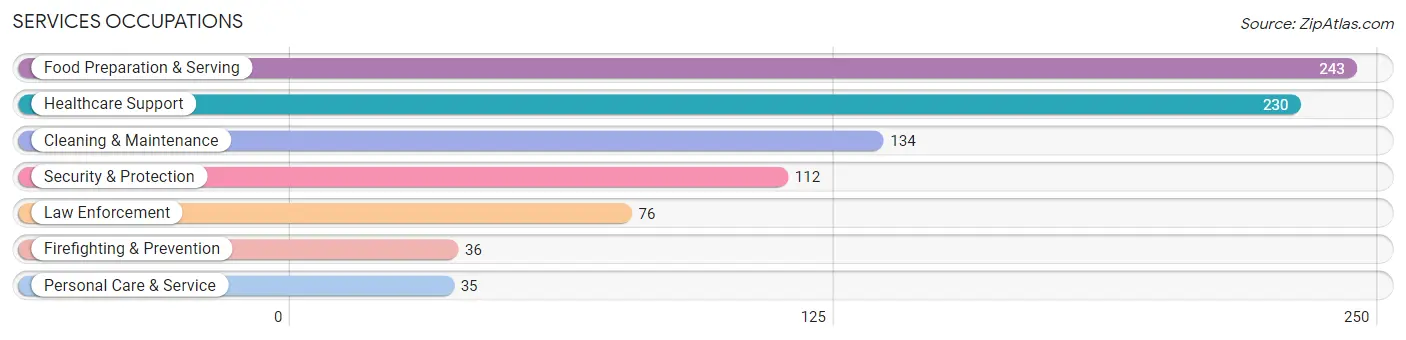
Services Occupations
The most common Services occupations in Metcalfe County are Food Preparation & Serving (243 | 5.6%), Healthcare Support (230 | 5.3%), Cleaning & Maintenance (134 | 3.1%), Security & Protection (112 | 2.6%), and Law Enforcement (76 | 1.8%).
Services Occupations by Sex
Within the Services occupations in Metcalfe County, the most male-oriented occupations are Cleaning & Maintenance (78.4%), Law Enforcement (77.6%), and Security & Protection (54.5%), while the most female-oriented occupations are Healthcare Support (100.0%), Firefighting & Prevention (94.4%), and Personal Care & Service (82.9%).
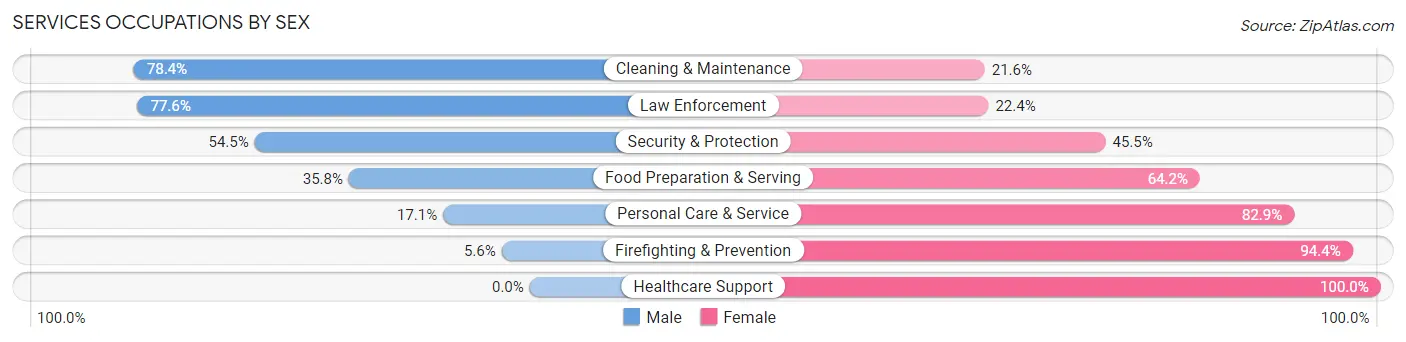
| Occupation | Male | Female |
| Healthcare Support | 0 (0.0%) | 230 (100.0%) |
| Security & Protection | 61 (54.5%) | 51 (45.5%) |
| Firefighting & Prevention | 2 (5.6%) | 34 (94.4%) |
| Law Enforcement | 59 (77.6%) | 17 (22.4%) |
| Food Preparation & Serving | 87 (35.8%) | 156 (64.2%) |
| Cleaning & Maintenance | 105 (78.4%) | 29 (21.6%) |
| Personal Care & Service | 6 (17.1%) | 29 (82.9%) |
| Total (Category) | 259 (34.4%) | 495 (65.6%) |
| Total (Overall) | 2,339 (53.9%) | 2,004 (46.1%) |
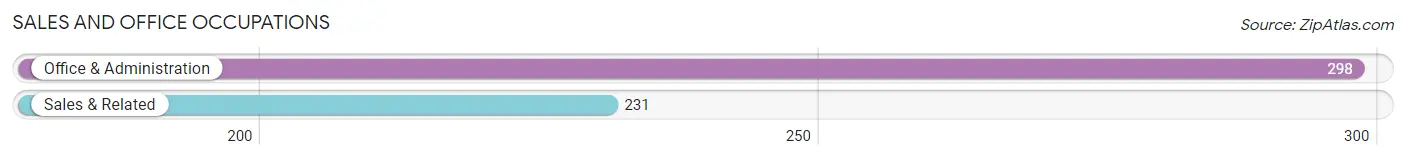
Sales and Office Occupations
The most common Sales and Office occupations in Metcalfe County are Office & Administration (298 | 6.9%), and Sales & Related (231 | 5.3%).
Sales and Office Occupations by Sex
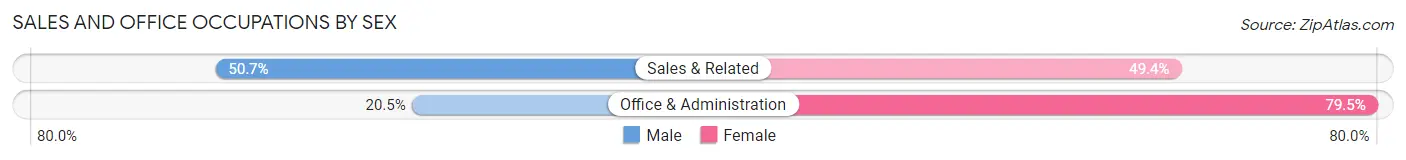
| Occupation | Male | Female |
| Sales & Related | 117 (50.6%) | 114 (49.3%) |
| Office & Administration | 61 (20.5%) | 237 (79.5%) |
| Total (Category) | 178 (33.7%) | 351 (66.3%) |
| Total (Overall) | 2,339 (53.9%) | 2,004 (46.1%) |
Natural Resources, Construction and Maintenance Occupations
The most common Natural Resources, Construction and Maintenance occupations in Metcalfe County are Installation, Maintenance & Repair (319 | 7.3%), Construction & Extraction (266 | 6.1%), and Farming, Fishing & Forestry (176 | 4.1%).
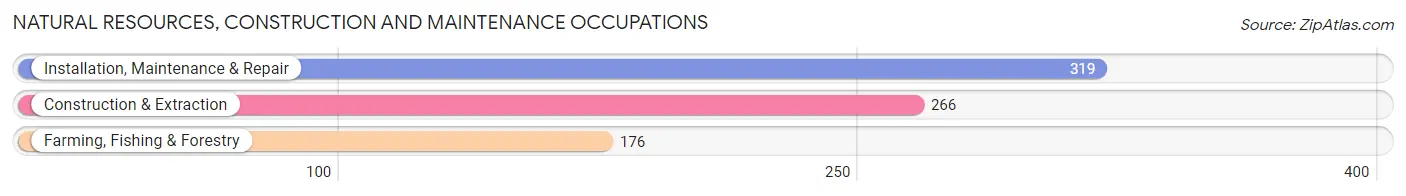
Natural Resources, Construction and Maintenance Occupations by Sex
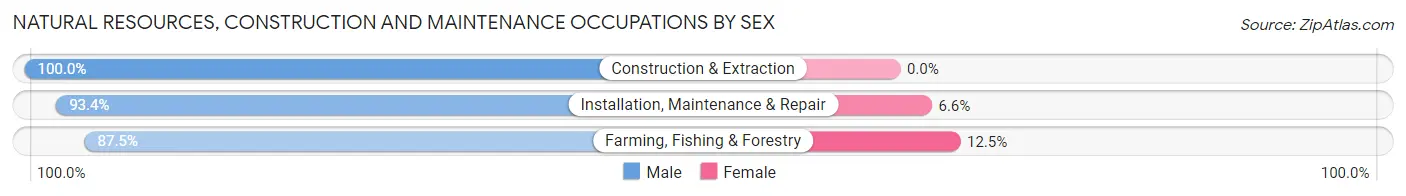
| Occupation | Male | Female |
| Farming, Fishing & Forestry | 154 (87.5%) | 22 (12.5%) |
| Construction & Extraction | 266 (100.0%) | 0 (0.0%) |
| Installation, Maintenance & Repair | 298 (93.4%) | 21 (6.6%) |
| Total (Category) | 718 (94.4%) | 43 (5.7%) |
| Total (Overall) | 2,339 (53.9%) | 2,004 (46.1%) |
Production, Transportation and Moving Occupations
The most common Production, Transportation and Moving occupations in Metcalfe County are Production (667 | 15.4%), Transportation (231 | 5.3%), and Material Moving (177 | 4.1%).
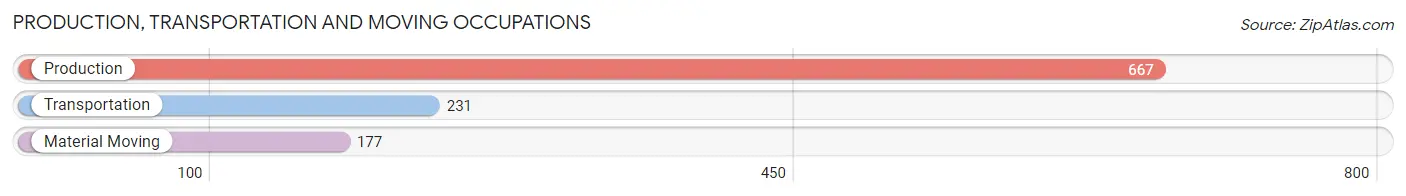
Production, Transportation and Moving Occupations by Sex
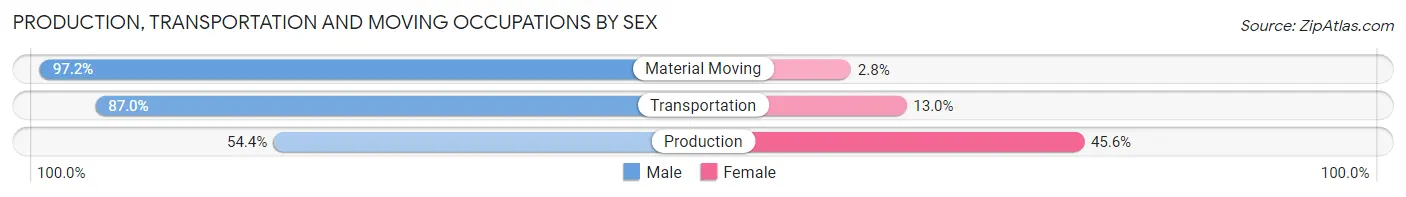
| Occupation | Male | Female |
| Production | 363 (54.4%) | 304 (45.6%) |
| Transportation | 201 (87.0%) | 30 (13.0%) |
| Material Moving | 172 (97.2%) | 5 (2.8%) |
| Total (Category) | 736 (68.5%) | 339 (31.5%) |
| Total (Overall) | 2,339 (53.9%) | 2,004 (46.1%) |
Employment Industries by Sex in Metcalfe County
Employment Industries in Metcalfe County
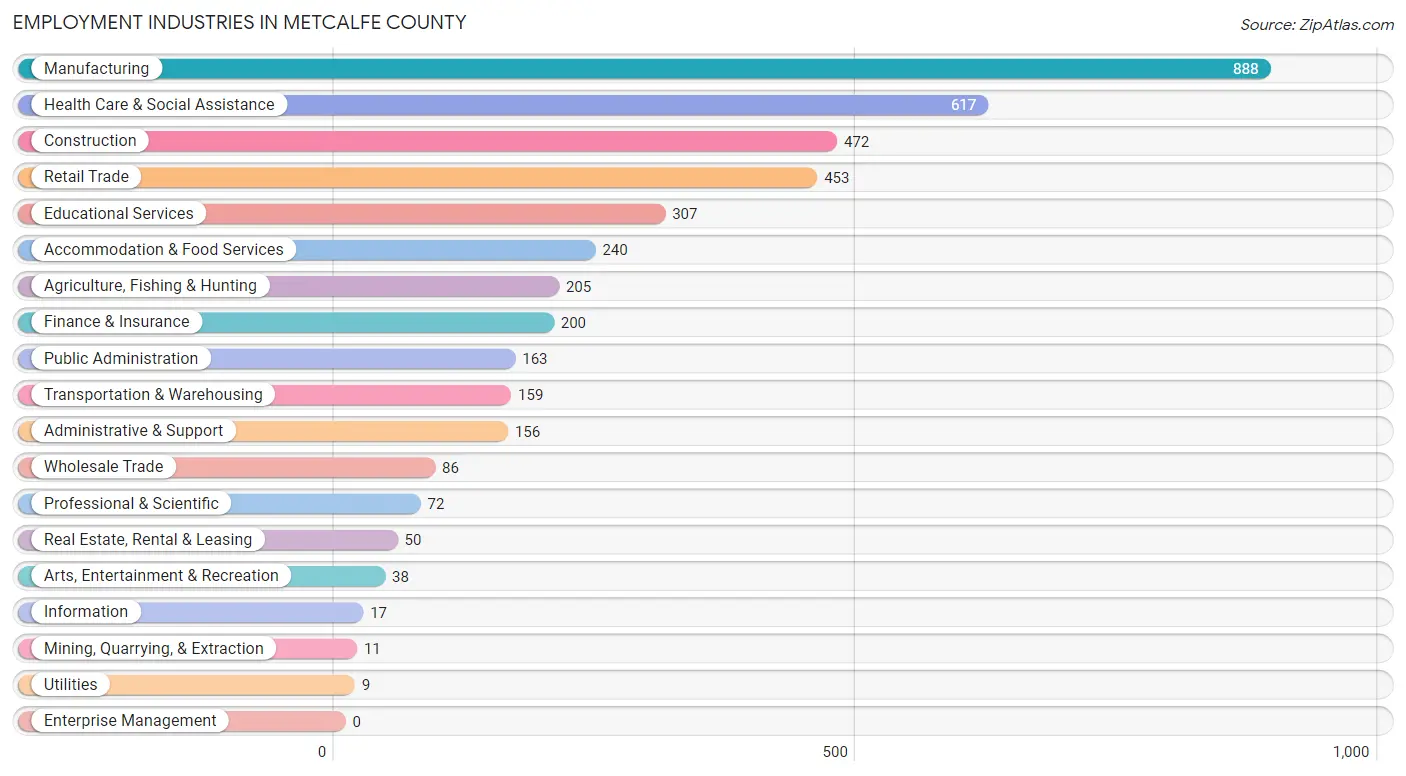
The major employment industries in Metcalfe County include Manufacturing (888 | 20.4%), Health Care & Social Assistance (617 | 14.2%), Construction (472 | 10.9%), Retail Trade (453 | 10.4%), and Educational Services (307 | 7.1%).
Employment Industries by Sex in Metcalfe County
The Metcalfe County industries that see more men than women are Mining, Quarrying, & Extraction (100.0%), Construction (100.0%), and Agriculture, Fishing & Hunting (89.3%), whereas the industries that tend to have a higher number of women are Utilities (100.0%), Finance & Insurance (91.5%), and Professional & Scientific (88.9%).
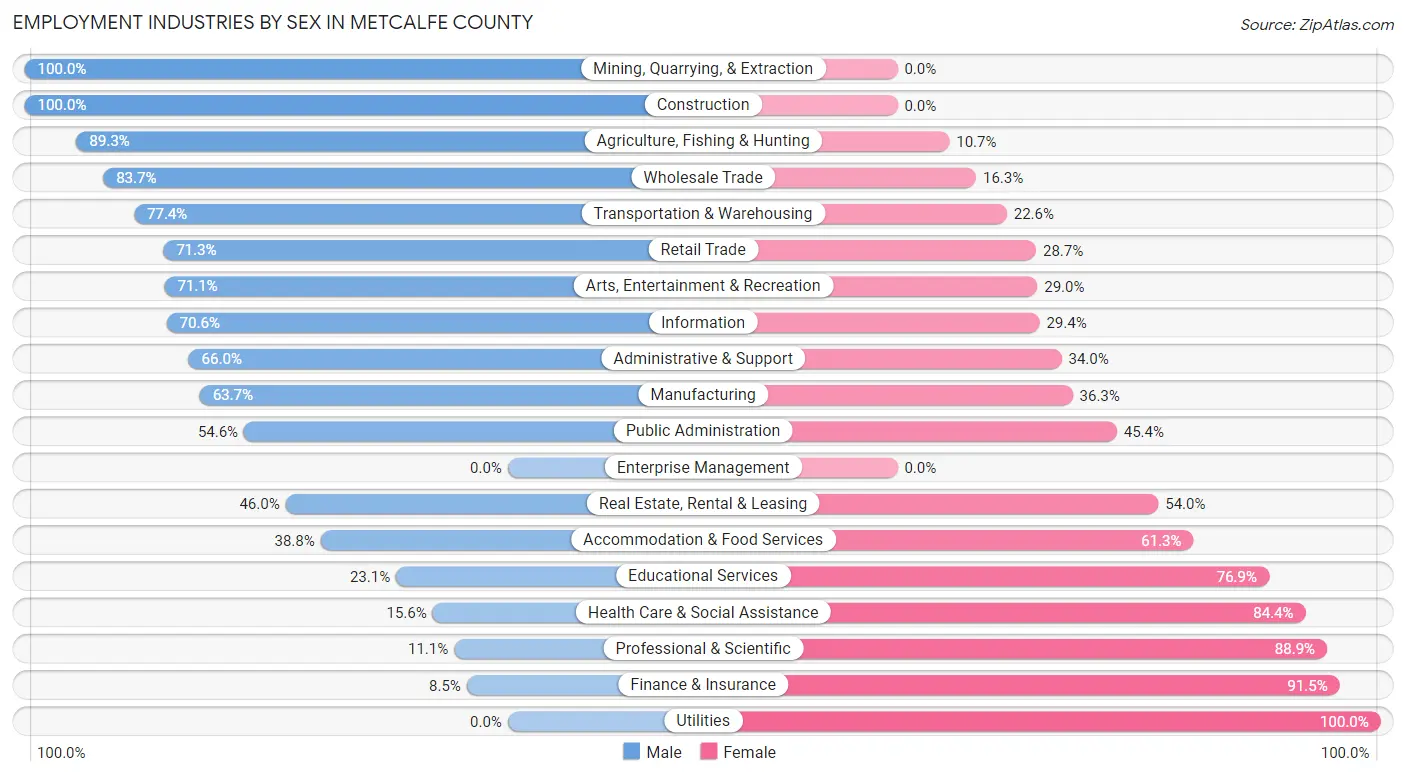
| Industry | Male | Female |
| Agriculture, Fishing & Hunting | 183 (89.3%) | 22 (10.7%) |
| Mining, Quarrying, & Extraction | 11 (100.0%) | 0 (0.0%) |
| Construction | 472 (100.0%) | 0 (0.0%) |
| Manufacturing | 566 (63.7%) | 322 (36.3%) |
| Wholesale Trade | 72 (83.7%) | 14 (16.3%) |
| Retail Trade | 323 (71.3%) | 130 (28.7%) |
| Transportation & Warehousing | 123 (77.4%) | 36 (22.6%) |
| Utilities | 0 (0.0%) | 9 (100.0%) |
| Information | 12 (70.6%) | 5 (29.4%) |
| Finance & Insurance | 17 (8.5%) | 183 (91.5%) |
| Real Estate, Rental & Leasing | 23 (46.0%) | 27 (54.0%) |
| Professional & Scientific | 8 (11.1%) | 64 (88.9%) |
| Enterprise Management | 0 (0.0%) | 0 (0.0%) |
| Administrative & Support | 103 (66.0%) | 53 (34.0%) |
| Educational Services | 71 (23.1%) | 236 (76.9%) |
| Health Care & Social Assistance | 96 (15.6%) | 521 (84.4%) |
| Arts, Entertainment & Recreation | 27 (71.1%) | 11 (28.9%) |
| Accommodation & Food Services | 93 (38.8%) | 147 (61.3%) |
| Public Administration | 89 (54.6%) | 74 (45.4%) |
| Total | 2,339 (53.9%) | 2,004 (46.1%) |
Education in Metcalfe County
School Enrollment in Metcalfe County
The most common levels of schooling among the 2,125 students in Metcalfe County are middle school (599 | 28.2%), elementary school (596 | 28.1%), and high school (565 | 26.6%).
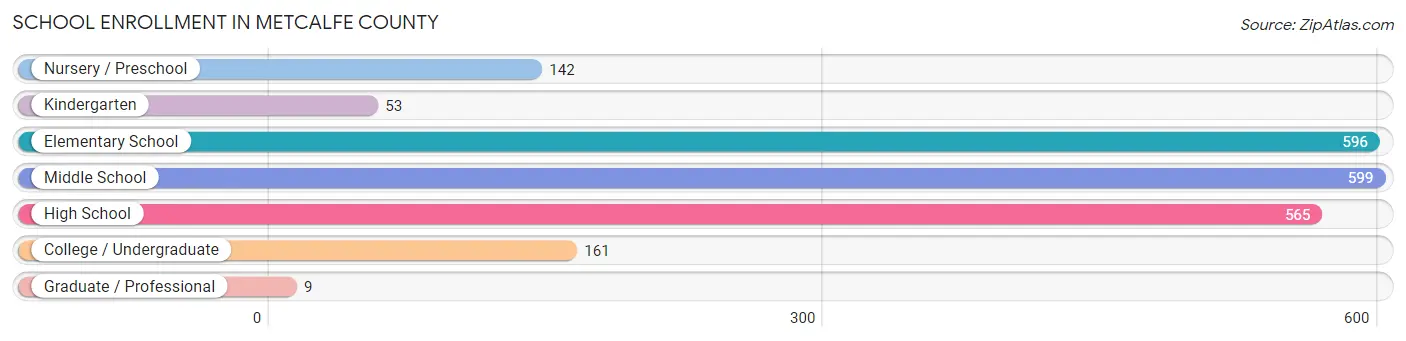
| School Level | # Students | % Students |
| Nursery / Preschool | 142 | 6.7% |
| Kindergarten | 53 | 2.5% |
| Elementary School | 596 | 28.1% |
| Middle School | 599 | 28.2% |
| High School | 565 | 26.6% |
| College / Undergraduate | 161 | 7.6% |
| Graduate / Professional | 9 | 0.4% |
| Total | 2,125 | 100.0% |
School Enrollment by Age by Funding Source in Metcalfe County
Out of a total of 2,125 students who are enrolled in schools in Metcalfe County, 223 (10.5%) attend a private institution, while the remaining 1,902 (89.5%) are enrolled in public schools. The age group of 18 to 19 year olds has the highest likelihood of being enrolled in private schools, with 25 (43.1% in the age bracket) enrolled. Conversely, the age group of 25 to 34 year olds has the lowest likelihood of being enrolled in a private school, with 29 (100.0% in the age bracket) attending a public institution.
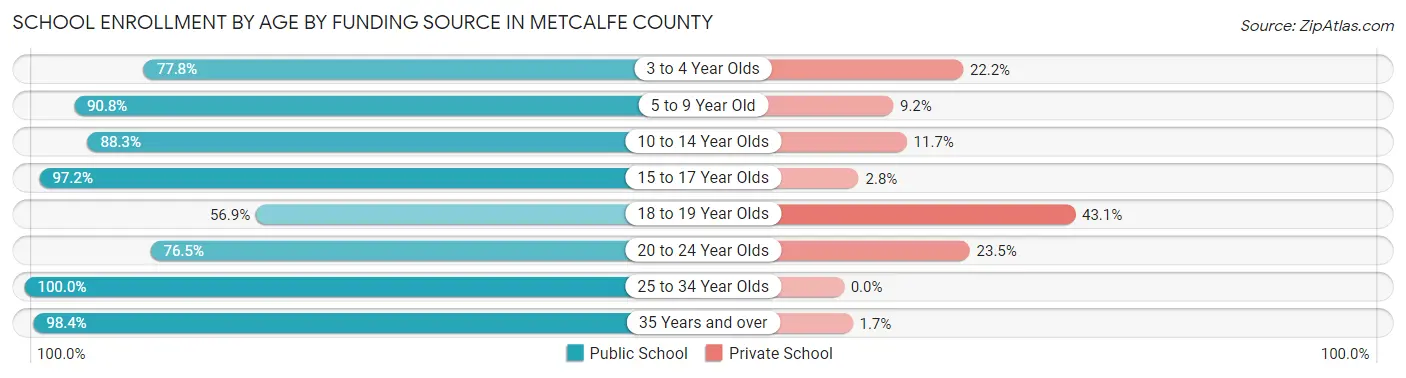
| Age Bracket | Public School | Private School |
| 3 to 4 Year Olds | 91 (77.8%) | 26 (22.2%) |
| 5 to 9 Year Old | 513 (90.8%) | 52 (9.2%) |
| 10 to 14 Year Olds | 670 (88.3%) | 89 (11.7%) |
| 15 to 17 Year Olds | 384 (97.2%) | 11 (2.8%) |
| 18 to 19 Year Olds | 33 (56.9%) | 25 (43.1%) |
| 20 to 24 Year Olds | 62 (76.5%) | 19 (23.5%) |
| 25 to 34 Year Olds | 29 (100.0%) | 0 (0.0%) |
| 35 Years and over | 119 (98.4%) | 2 (1.7%) |
| Total | 1,902 (89.5%) | 223 (10.5%) |
Educational Attainment by Field of Study in Metcalfe County
Education (261 | 24.5%), bio, nature & agricultural (158 | 14.8%), science & technology (142 | 13.3%), arts & humanities (103 | 9.7%), and business (87 | 8.2%) are the most common fields of study among 1,067 individuals in Metcalfe County who have obtained a bachelor's degree or higher.
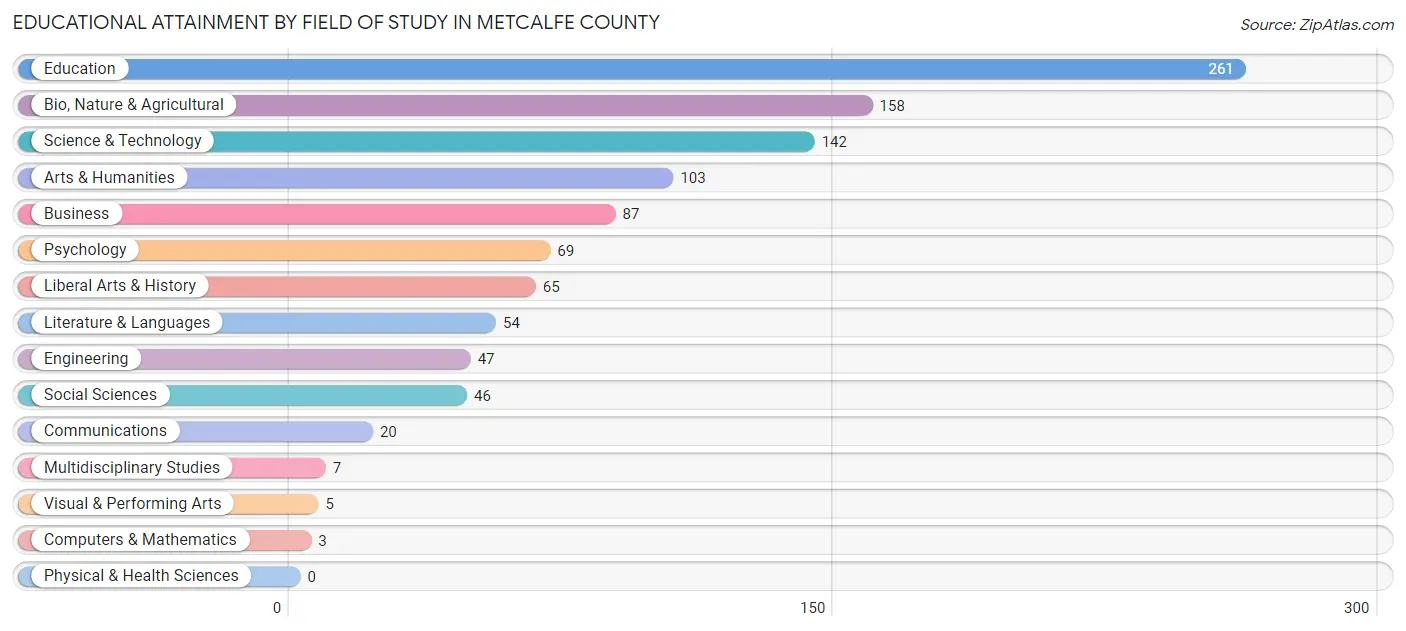
| Field of Study | # Graduates | % Graduates |
| Computers & Mathematics | 3 | 0.3% |
| Bio, Nature & Agricultural | 158 | 14.8% |
| Physical & Health Sciences | 0 | 0.0% |
| Psychology | 69 | 6.5% |
| Social Sciences | 46 | 4.3% |
| Engineering | 47 | 4.4% |
| Multidisciplinary Studies | 7 | 0.7% |
| Science & Technology | 142 | 13.3% |
| Business | 87 | 8.2% |
| Education | 261 | 24.5% |
| Literature & Languages | 54 | 5.1% |
| Liberal Arts & History | 65 | 6.1% |
| Visual & Performing Arts | 5 | 0.5% |
| Communications | 20 | 1.9% |
| Arts & Humanities | 103 | 9.7% |
| Total | 1,067 | 100.0% |
Transportation & Commute in Metcalfe County
Vehicle Availability by Sex in Metcalfe County
The most prevalent vehicle ownership categories in Metcalfe County are males with 3 vehicles (626, accounting for 27.9%) and females with 3 vehicles (541, making up 32.0%).
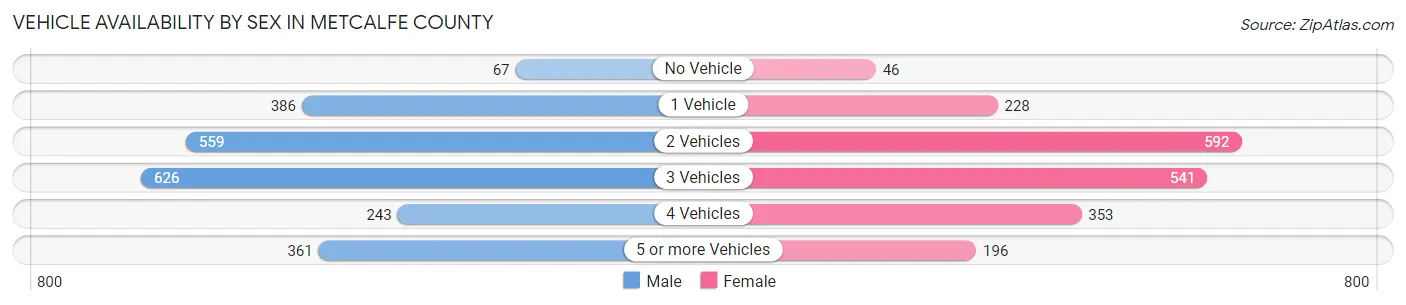
| Vehicles Available | Male | Female |
| No Vehicle | 67 (3.0%) | 46 (2.4%) |
| 1 Vehicle | 386 (17.2%) | 228 (11.7%) |
| 2 Vehicles | 559 (24.9%) | 592 (30.3%) |
| 3 Vehicles | 626 (27.9%) | 541 (27.7%) |
| 4 Vehicles | 243 (10.8%) | 353 (18.0%) |
| 5 or more Vehicles | 361 (16.1%) | 196 (10.0%) |
| Total | 2,242 (100.0%) | 1,956 (100.0%) |
Commute Time in Metcalfe County
The most frequently occuring commute durations in Metcalfe County are 20 to 24 minutes (833 commuters, 21.0%), 30 to 34 minutes (568 commuters, 14.3%), and 25 to 29 minutes (503 commuters, 12.7%).
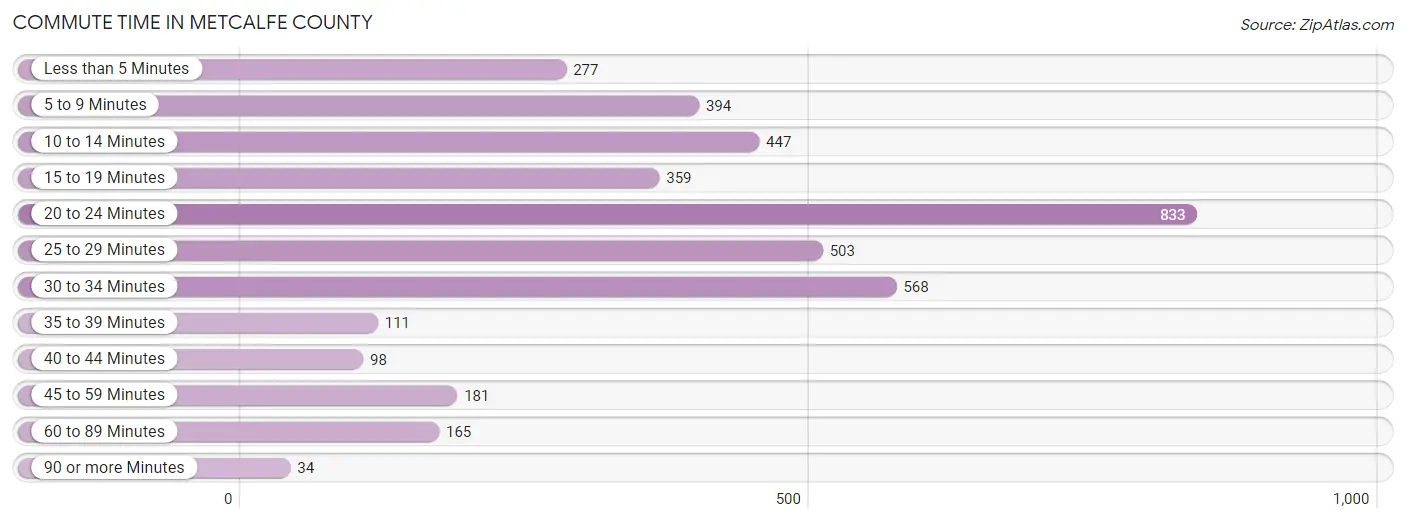
| Commute Time | # Commuters | % Commuters |
| Less than 5 Minutes | 277 | 7.0% |
| 5 to 9 Minutes | 394 | 9.9% |
| 10 to 14 Minutes | 447 | 11.3% |
| 15 to 19 Minutes | 359 | 9.0% |
| 20 to 24 Minutes | 833 | 21.0% |
| 25 to 29 Minutes | 503 | 12.7% |
| 30 to 34 Minutes | 568 | 14.3% |
| 35 to 39 Minutes | 111 | 2.8% |
| 40 to 44 Minutes | 98 | 2.5% |
| 45 to 59 Minutes | 181 | 4.6% |
| 60 to 89 Minutes | 165 | 4.2% |
| 90 or more Minutes | 34 | 0.9% |
Commute Time by Sex in Metcalfe County
The most common commute times in Metcalfe County are 20 to 24 minutes (429 commuters, 20.2%) for males and 20 to 24 minutes (404 commuters, 21.9%) for females.
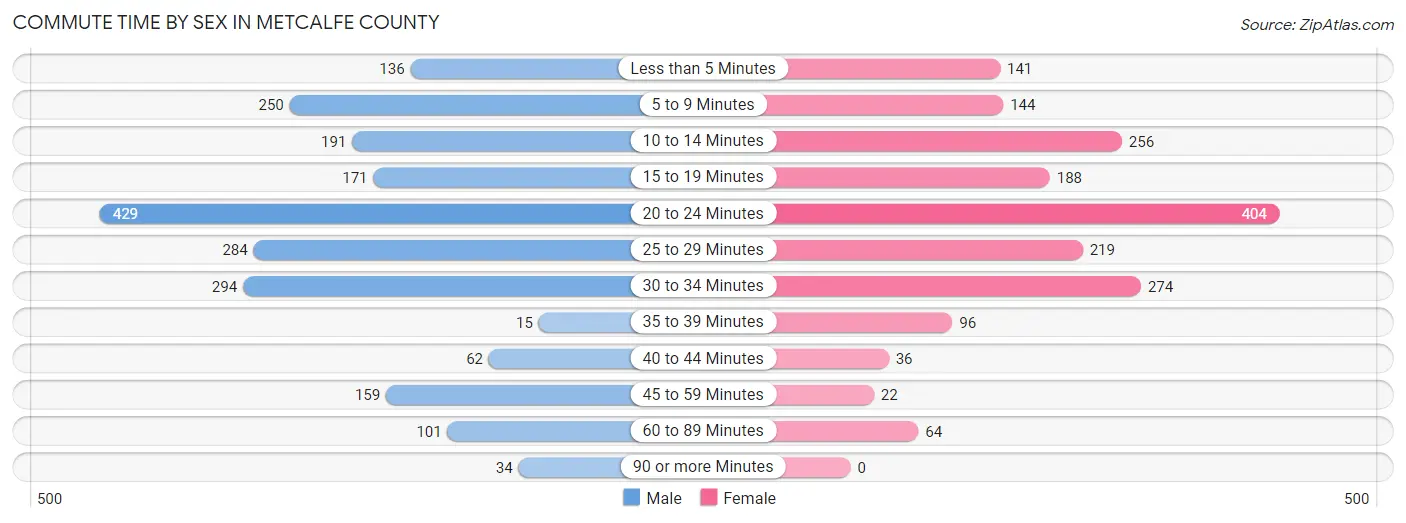
| Commute Time | Male | Female |
| Less than 5 Minutes | 136 (6.4%) | 141 (7.6%) |
| 5 to 9 Minutes | 250 (11.8%) | 144 (7.8%) |
| 10 to 14 Minutes | 191 (9.0%) | 256 (13.9%) |
| 15 to 19 Minutes | 171 (8.0%) | 188 (10.2%) |
| 20 to 24 Minutes | 429 (20.2%) | 404 (21.9%) |
| 25 to 29 Minutes | 284 (13.4%) | 219 (11.9%) |
| 30 to 34 Minutes | 294 (13.8%) | 274 (14.9%) |
| 35 to 39 Minutes | 15 (0.7%) | 96 (5.2%) |
| 40 to 44 Minutes | 62 (2.9%) | 36 (1.9%) |
| 45 to 59 Minutes | 159 (7.5%) | 22 (1.2%) |
| 60 to 89 Minutes | 101 (4.8%) | 64 (3.5%) |
| 90 or more Minutes | 34 (1.6%) | 0 (0.0%) |
Time of Departure to Work by Sex in Metcalfe County
The most frequent times of departure to work in Metcalfe County are 6:00 AM to 6:29 AM (417, 19.6%) for males and 7:00 AM to 7:29 AM (377, 20.4%) for females.
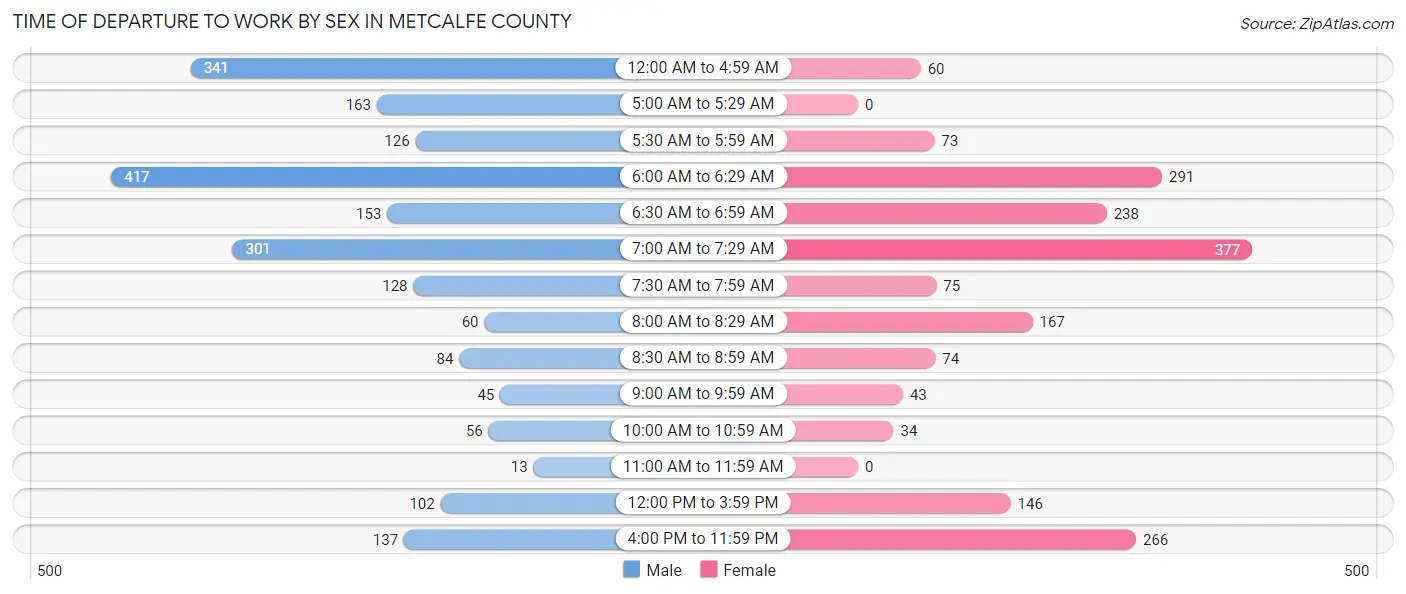
| Time of Departure | Male | Female |
| 12:00 AM to 4:59 AM | 341 (16.0%) | 60 (3.3%) |
| 5:00 AM to 5:29 AM | 163 (7.7%) | 0 (0.0%) |
| 5:30 AM to 5:59 AM | 126 (5.9%) | 73 (4.0%) |
| 6:00 AM to 6:29 AM | 417 (19.6%) | 291 (15.8%) |
| 6:30 AM to 6:59 AM | 153 (7.2%) | 238 (12.9%) |
| 7:00 AM to 7:29 AM | 301 (14.2%) | 377 (20.4%) |
| 7:30 AM to 7:59 AM | 128 (6.0%) | 75 (4.1%) |
| 8:00 AM to 8:29 AM | 60 (2.8%) | 167 (9.1%) |
| 8:30 AM to 8:59 AM | 84 (4.0%) | 74 (4.0%) |
| 9:00 AM to 9:59 AM | 45 (2.1%) | 43 (2.3%) |
| 10:00 AM to 10:59 AM | 56 (2.6%) | 34 (1.8%) |
| 11:00 AM to 11:59 AM | 13 (0.6%) | 0 (0.0%) |
| 12:00 PM to 3:59 PM | 102 (4.8%) | 146 (7.9%) |
| 4:00 PM to 11:59 PM | 137 (6.4%) | 266 (14.4%) |
| Total | 2,126 (100.0%) | 1,844 (100.0%) |
Housing Occupancy in Metcalfe County
Occupancy by Ownership in Metcalfe County
Of the total 4,160 dwellings in Metcalfe County, owner-occupied units account for 3,238 (77.8%), while renter-occupied units make up 922 (22.2%).
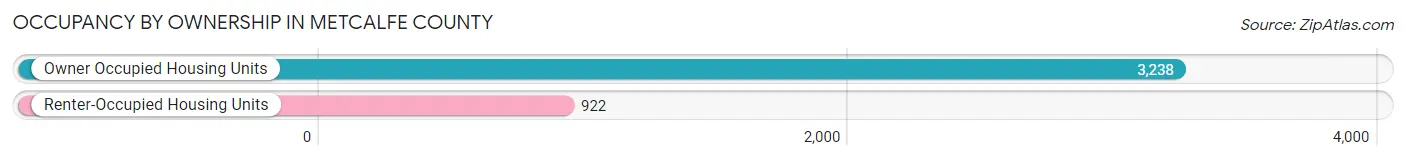
| Occupancy | # Housing Units | % Housing Units |
| Owner Occupied Housing Units | 3,238 | 77.8% |
| Renter-Occupied Housing Units | 922 | 22.2% |
| Total Occupied Housing Units | 4,160 | 100.0% |
Occupancy by Household Size in Metcalfe County
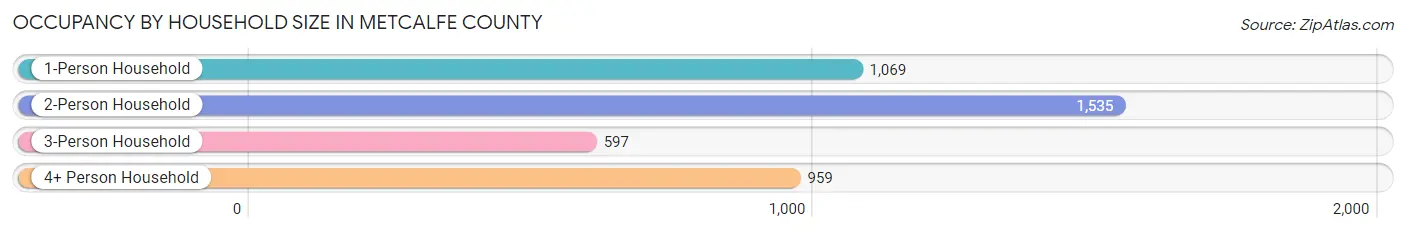
| Household Size | # Housing Units | % Housing Units |
| 1-Person Household | 1,069 | 25.7% |
| 2-Person Household | 1,535 | 36.9% |
| 3-Person Household | 597 | 14.3% |
| 4+ Person Household | 959 | 23.1% |
| Total Housing Units | 4,160 | 100.0% |
Occupancy by Ownership by Household Size in Metcalfe County
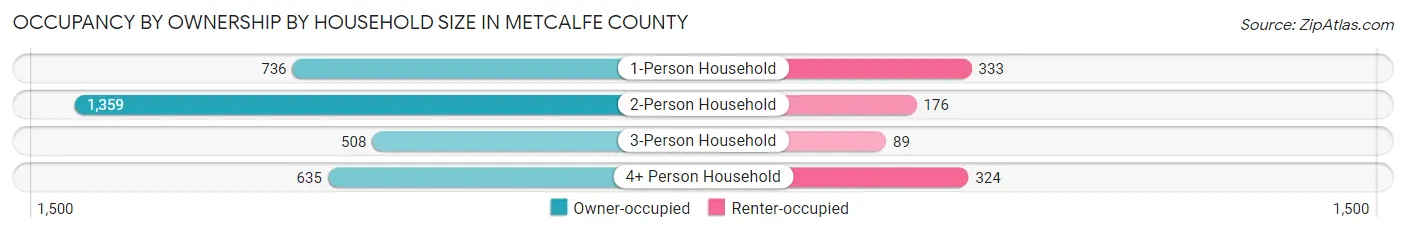
| Household Size | Owner-occupied | Renter-occupied |
| 1-Person Household | 736 (68.9%) | 333 (31.1%) |
| 2-Person Household | 1,359 (88.5%) | 176 (11.5%) |
| 3-Person Household | 508 (85.1%) | 89 (14.9%) |
| 4+ Person Household | 635 (66.2%) | 324 (33.8%) |
| Total Housing Units | 3,238 (77.8%) | 922 (22.2%) |
Occupancy by Educational Attainment in Metcalfe County
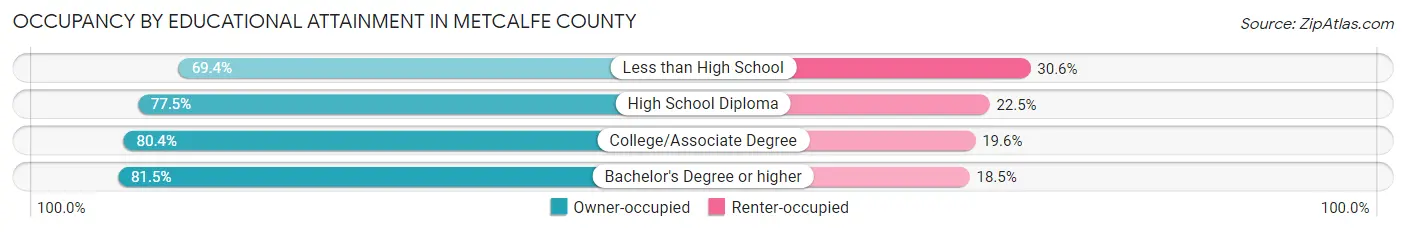
| Household Size | Owner-occupied | Renter-occupied |
| Less than High School | 402 (69.4%) | 177 (30.6%) |
| High School Diploma | 1,329 (77.5%) | 385 (22.5%) |
| College/Associate Degree | 1,023 (80.4%) | 250 (19.6%) |
| Bachelor's Degree or higher | 484 (81.5%) | 110 (18.5%) |
Occupancy by Age of Householder in Metcalfe County
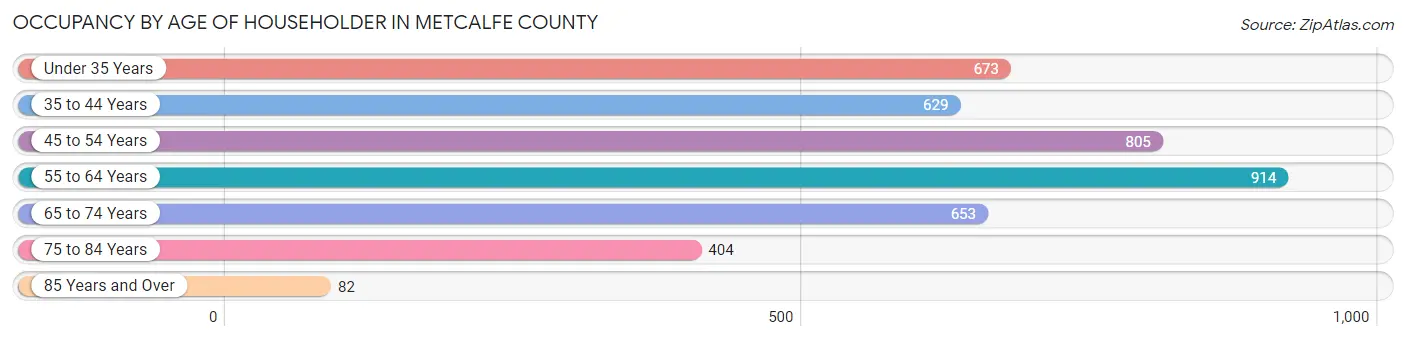
| Age Bracket | # Households | % Households |
| Under 35 Years | 673 | 16.2% |
| 35 to 44 Years | 629 | 15.1% |
| 45 to 54 Years | 805 | 19.4% |
| 55 to 64 Years | 914 | 22.0% |
| 65 to 74 Years | 653 | 15.7% |
| 75 to 84 Years | 404 | 9.7% |
| 85 Years and Over | 82 | 2.0% |
| Total | 4,160 | 100.0% |
Housing Finances in Metcalfe County
Median Income by Occupancy in Metcalfe County
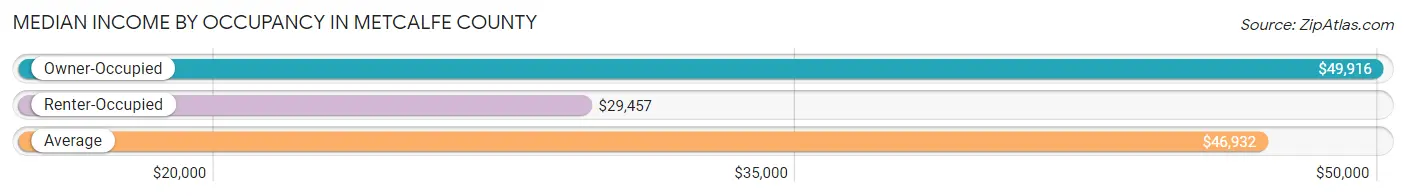
| Occupancy Type | # Households | Median Income |
| Owner-Occupied | 3,238 (77.8%) | $49,916 |
| Renter-Occupied | 922 (22.2%) | $29,457 |
| Average | 4,160 (100.0%) | $46,932 |
Occupancy by Householder Income Bracket in Metcalfe County
| Income Bracket | Owner-occupied | Renter-occupied |
| Less than $5,000 | 100 (3.1%) | 38 (4.1%) |
| $5,000 to $9,999 | 54 (1.7%) | 30 (3.3%) |
| $10,000 to $14,999 | 179 (5.5%) | 260 (28.2%) |
| $15,000 to $19,999 | 176 (5.4%) | 32 (3.5%) |
| $20,000 to $24,999 | 183 (5.7%) | 52 (5.6%) |
| $25,000 to $34,999 | 479 (14.8%) | 104 (11.3%) |
| $35,000 to $49,999 | 451 (13.9%) | 75 (8.1%) |
| $50,000 to $74,999 | 547 (16.9%) | 264 (28.6%) |
| $75,000 to $99,999 | 396 (12.2%) | 22 (2.4%) |
| $100,000 to $149,999 | 470 (14.5%) | 45 (4.9%) |
| $150,000 or more | 203 (6.3%) | 0 (0.0%) |
| Total | 3,238 (100.0%) | 922 (100.0%) |
Monthly Housing Cost Tiers in Metcalfe County
| Monthly Cost | Owner-occupied | Renter-occupied |
| Less than $300 | 769 (23.7%) | 89 (9.7%) |
| $300 to $499 | 711 (22.0%) | 230 (24.9%) |
| $500 to $799 | 794 (24.5%) | 357 (38.7%) |
| $800 to $999 | 321 (9.9%) | 15 (1.6%) |
| $1,000 to $1,499 | 454 (14.0%) | 65 (7.0%) |
| $1,500 to $1,999 | 67 (2.1%) | 0 (0.0%) |
| $2,000 to $2,499 | 87 (2.7%) | 0 (0.0%) |
| $2,500 to $2,999 | 19 (0.6%) | 0 (0.0%) |
| $3,000 or more | 16 (0.5%) | 0 (0.0%) |
| Total | 3,238 (100.0%) | 922 (100.0%) |
Physical Housing Characteristics in Metcalfe County
Housing Structures in Metcalfe County
| Structure Type | # Housing Units | % Housing Units |
| Single Unit, Detached | 2,763 | 66.4% |
| Single Unit, Attached | 48 | 1.1% |
| 2 Unit Apartments | 11 | 0.3% |
| 3 or 4 Unit Apartments | 79 | 1.9% |
| 5 to 9 Unit Apartments | 27 | 0.6% |
| 10 or more Apartments | 89 | 2.1% |
| Mobile Home / Other | 1,143 | 27.5% |
| Total | 4,160 | 100.0% |
Housing Structures by Occupancy in Metcalfe County
| Structure Type | Owner-occupied | Renter-occupied |
| Single Unit, Detached | 2,406 (87.1%) | 357 (12.9%) |
| Single Unit, Attached | 11 (22.9%) | 37 (77.1%) |
| 2 Unit Apartments | 0 (0.0%) | 11 (100.0%) |
| 3 or 4 Unit Apartments | 0 (0.0%) | 79 (100.0%) |
| 5 to 9 Unit Apartments | 0 (0.0%) | 27 (100.0%) |
| 10 or more Apartments | 8 (9.0%) | 81 (91.0%) |
| Mobile Home / Other | 813 (71.1%) | 330 (28.9%) |
| Total | 3,238 (77.8%) | 922 (22.2%) |
Housing Structures by Number of Rooms in Metcalfe County
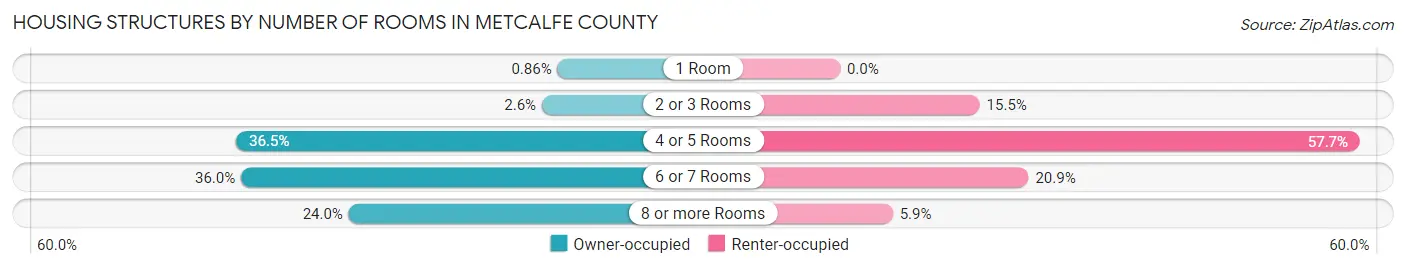
| Number of Rooms | Owner-occupied | Renter-occupied |
| 1 Room | 28 (0.9%) | 0 (0.0%) |
| 2 or 3 Rooms | 84 (2.6%) | 143 (15.5%) |
| 4 or 5 Rooms | 1,183 (36.5%) | 532 (57.7%) |
| 6 or 7 Rooms | 1,165 (36.0%) | 193 (20.9%) |
| 8 or more Rooms | 778 (24.0%) | 54 (5.9%) |
| Total | 3,238 (100.0%) | 922 (100.0%) |
Housing Structure by Heating Type in Metcalfe County
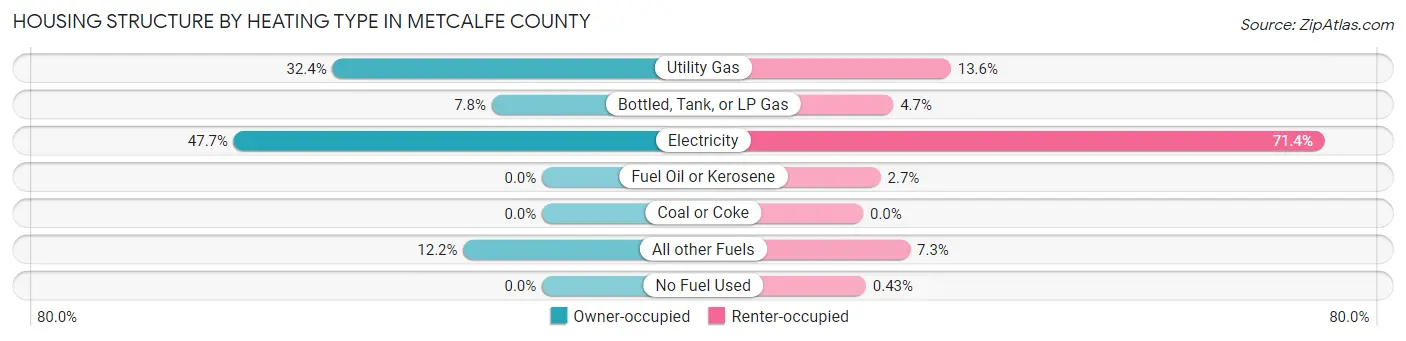
| Heating Type | Owner-occupied | Renter-occupied |
| Utility Gas | 1,049 (32.4%) | 125 (13.6%) |
| Bottled, Tank, or LP Gas | 252 (7.8%) | 43 (4.7%) |
| Electricity | 1,543 (47.6%) | 658 (71.4%) |
| Fuel Oil or Kerosene | 0 (0.0%) | 25 (2.7%) |
| Coal or Coke | 0 (0.0%) | 0 (0.0%) |
| All other Fuels | 394 (12.2%) | 67 (7.3%) |
| No Fuel Used | 0 (0.0%) | 4 (0.4%) |
| Total | 3,238 (100.0%) | 922 (100.0%) |
Household Vehicle Usage in Metcalfe County
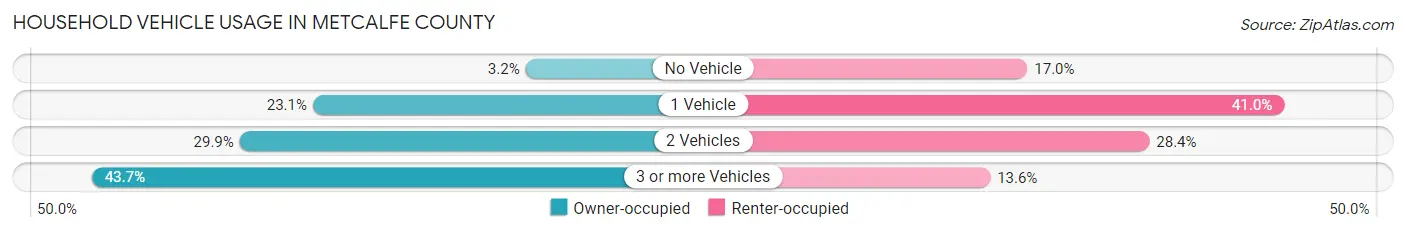
| Vehicles per Household | Owner-occupied | Renter-occupied |
| No Vehicle | 105 (3.2%) | 157 (17.0%) |
| 1 Vehicle | 748 (23.1%) | 378 (41.0%) |
| 2 Vehicles | 969 (29.9%) | 262 (28.4%) |
| 3 or more Vehicles | 1,416 (43.7%) | 125 (13.6%) |
| Total | 3,238 (100.0%) | 922 (100.0%) |
Real Estate & Mortgages in Metcalfe County
Real Estate and Mortgage Overview in Metcalfe County
| Characteristic | Without Mortgage | With Mortgage |
| Housing Units | 2,009 | 1,229 |
| Median Property Value | $85,700 | $117,100 |
| Median Household Income | $38,029 | $158 |
| Monthly Housing Costs | $344 | $0 |
| Real Estate Taxes | $538 | $101 |
Property Value by Mortgage Status in Metcalfe County
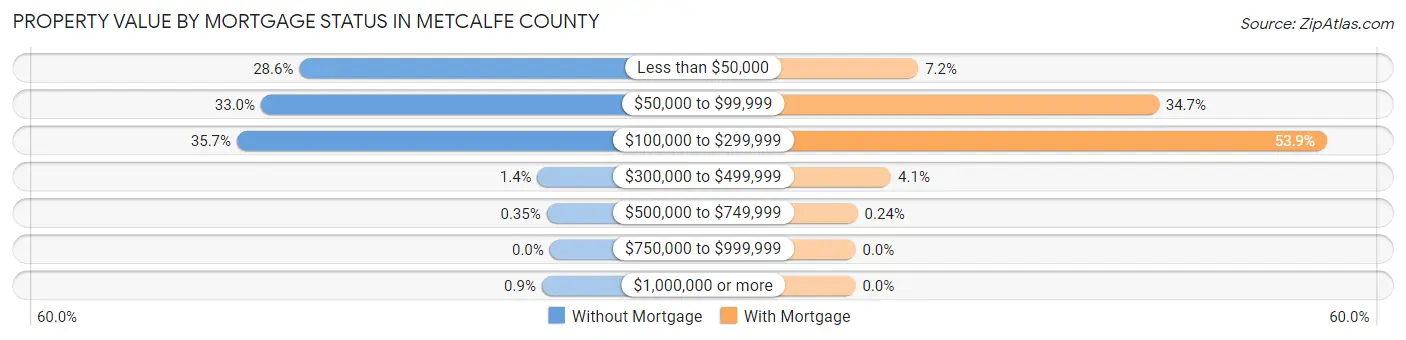
| Property Value | Without Mortgage | With Mortgage |
| Less than $50,000 | 575 (28.6%) | 88 (7.2%) |
| $50,000 to $99,999 | 663 (33.0%) | 426 (34.7%) |
| $100,000 to $299,999 | 718 (35.7%) | 662 (53.9%) |
| $300,000 to $499,999 | 28 (1.4%) | 50 (4.1%) |
| $500,000 to $749,999 | 7 (0.4%) | 3 (0.2%) |
| $750,000 to $999,999 | 0 (0.0%) | 0 (0.0%) |
| $1,000,000 or more | 18 (0.9%) | 0 (0.0%) |
| Total | 2,009 (100.0%) | 1,229 (100.0%) |
Household Income by Mortgage Status in Metcalfe County
| Household Income | Without Mortgage | With Mortgage |
| Less than $10,000 | 134 (6.7%) | 0 (0.0%) |
| $10,000 to $24,999 | 440 (21.9%) | 20 (1.6%) |
| $25,000 to $34,999 | 390 (19.4%) | 98 (8.0%) |
| $35,000 to $49,999 | 316 (15.7%) | 89 (7.2%) |
| $50,000 to $74,999 | 326 (16.2%) | 135 (11.0%) |
| $75,000 to $99,999 | 127 (6.3%) | 221 (18.0%) |
| $100,000 to $149,999 | 231 (11.5%) | 269 (21.9%) |
| $150,000 or more | 45 (2.2%) | 239 (19.5%) |
| Total | 2,009 (100.0%) | 1,229 (100.0%) |
Property Value to Household Income Ratio in Metcalfe County
| Value-to-Income Ratio | Without Mortgage | With Mortgage |
| Less than 2.0x | 1,018 (50.7%) | 79,519 (6,470.2%) |
| 2.0x to 2.9x | 330 (16.4%) | 684 (55.7%) |
| 3.0x to 3.9x | 155 (7.7%) | 253 (20.6%) |
| 4.0x or more | 494 (24.6%) | 112 (9.1%) |
| Total | 2,009 (100.0%) | 1,229 (100.0%) |
Real Estate Taxes by Mortgage Status in Metcalfe County
| Property Taxes | Without Mortgage | With Mortgage |
| Less than $800 | 1,124 (55.9%) | 11 (0.9%) |
| $800 to $1,499 | 438 (21.8%) | 423 (34.4%) |
| $800 to $1,499 | 49 (2.4%) | 504 (41.0%) |
| Total | 2,009 (100.0%) | 1,229 (100.0%) |
Health & Disability in Metcalfe County
Health Insurance Coverage by Age in Metcalfe County
| Age Bracket | With Coverage | Without Coverage |
| Under 6 Years | 631 (97.1%) | 19 (2.9%) |
| 6 to 18 Years | 1,660 (87.4%) | 239 (12.6%) |
| 19 to 25 Years | 572 (81.6%) | 129 (18.4%) |
| 26 to 34 Years | 859 (87.4%) | 124 (12.6%) |
| 35 to 44 Years | 1,154 (92.8%) | 90 (7.2%) |
| 45 to 54 Years | 1,312 (93.4%) | 93 (6.6%) |
| 55 to 64 Years | 1,391 (93.0%) | 105 (7.0%) |
| 65 to 74 Years | 1,120 (100.0%) | 0 (0.0%) |
| 75 Years and older | 738 (100.0%) | 0 (0.0%) |
| Total | 9,437 (92.2%) | 799 (7.8%) |
Health Insurance Coverage by Citizenship Status in Metcalfe County
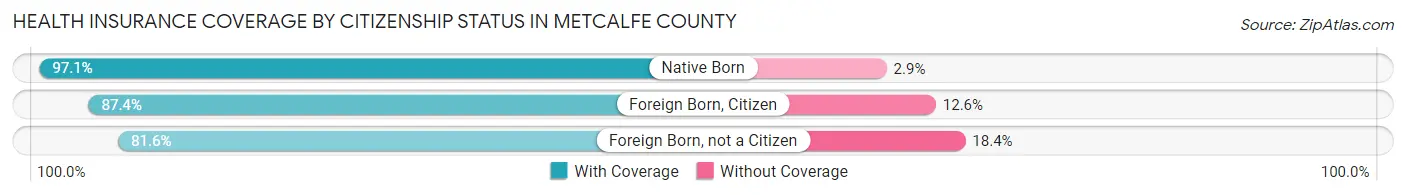
| Citizenship Status | With Coverage | Without Coverage |
| Native Born | 631 (97.1%) | 19 (2.9%) |
| Foreign Born, Citizen | 1,660 (87.4%) | 239 (12.6%) |
| Foreign Born, not a Citizen | 572 (81.6%) | 129 (18.4%) |
Health Insurance Coverage by Household Income in Metcalfe County
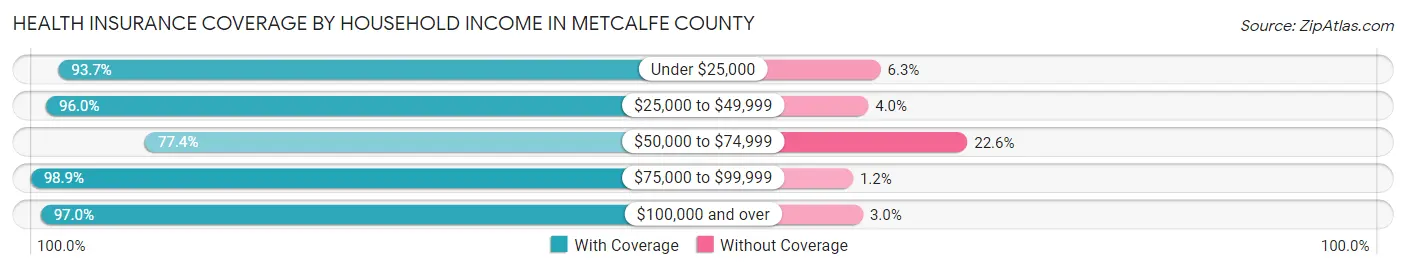
| Household Income | With Coverage | Without Coverage |
| Under $25,000 | 1,744 (93.7%) | 118 (6.3%) |
| $25,000 to $49,999 | 2,478 (96.0%) | 104 (4.0%) |
| $50,000 to $74,999 | 1,670 (77.4%) | 487 (22.6%) |
| $75,000 to $99,999 | 1,207 (98.9%) | 14 (1.1%) |
| $100,000 and over | 2,302 (97.0%) | 72 (3.0%) |
Public vs Private Health Insurance Coverage by Age in Metcalfe County
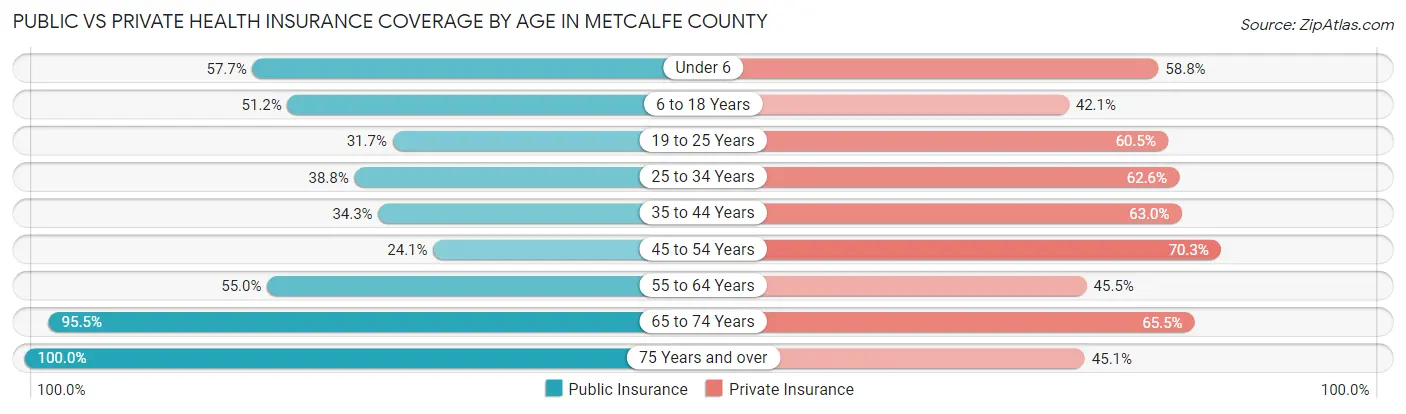
| Age Bracket | Public Insurance | Private Insurance |
| Under 6 | 375 (57.7%) | 382 (58.8%) |
| 6 to 18 Years | 972 (51.2%) | 800 (42.1%) |
| 19 to 25 Years | 222 (31.7%) | 424 (60.5%) |
| 25 to 34 Years | 381 (38.8%) | 615 (62.6%) |
| 35 to 44 Years | 427 (34.3%) | 784 (63.0%) |
| 45 to 54 Years | 339 (24.1%) | 988 (70.3%) |
| 55 to 64 Years | 822 (54.9%) | 680 (45.5%) |
| 65 to 74 Years | 1,070 (95.5%) | 733 (65.4%) |
| 75 Years and over | 738 (100.0%) | 333 (45.1%) |
| Total | 5,346 (52.2%) | 5,739 (56.1%) |
Disability Status by Sex by Age in Metcalfe County
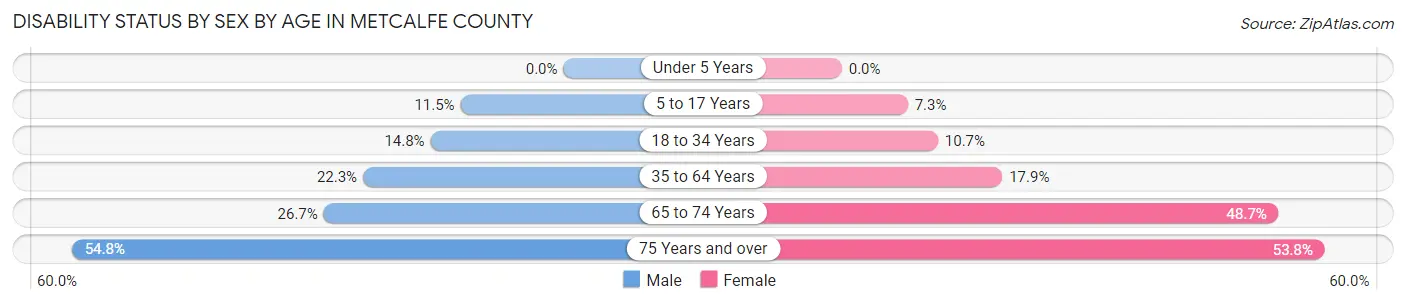
| Age Bracket | Male | Female |
| Under 5 Years | 0 (0.0%) | 0 (0.0%) |
| 5 to 17 Years | 107 (11.5%) | 63 (7.3%) |
| 18 to 34 Years | 145 (14.8%) | 93 (10.7%) |
| 35 to 64 Years | 458 (22.3%) | 374 (17.9%) |
| 65 to 74 Years | 141 (26.7%) | 288 (48.6%) |
| 75 Years and over | 173 (54.7%) | 227 (53.8%) |
Disability Class by Sex by Age in Metcalfe County
Disability Class: Hearing Difficulty
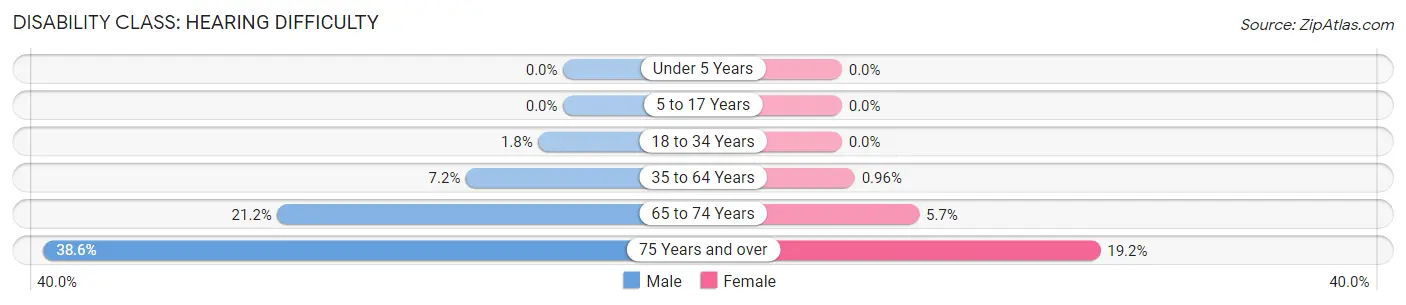
| Age Bracket | Male | Female |
| Under 5 Years | 0 (0.0%) | 0 (0.0%) |
| 5 to 17 Years | 0 (0.0%) | 0 (0.0%) |
| 18 to 34 Years | 18 (1.8%) | 0 (0.0%) |
| 35 to 64 Years | 148 (7.2%) | 20 (1.0%) |
| 65 to 74 Years | 112 (21.2%) | 34 (5.7%) |
| 75 Years and over | 122 (38.6%) | 81 (19.2%) |
Disability Class: Vision Difficulty
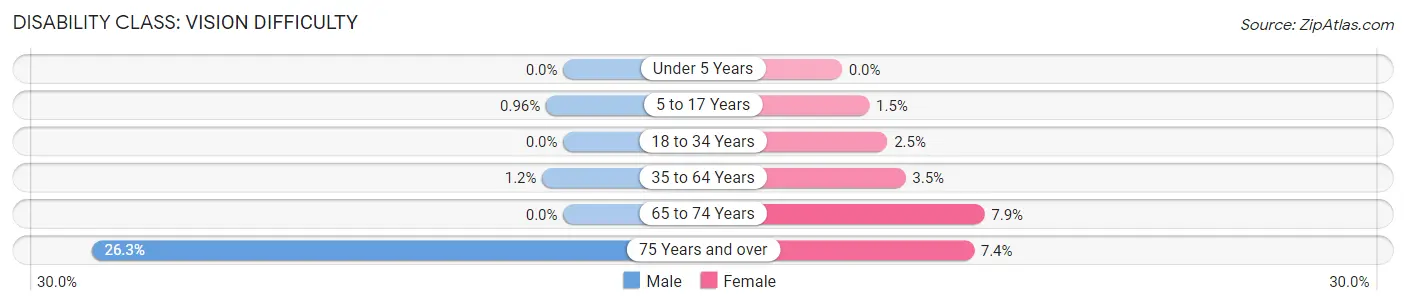
| Age Bracket | Male | Female |
| Under 5 Years | 0 (0.0%) | 0 (0.0%) |
| 5 to 17 Years | 9 (1.0%) | 13 (1.5%) |
| 18 to 34 Years | 0 (0.0%) | 22 (2.5%) |
| 35 to 64 Years | 24 (1.2%) | 74 (3.5%) |
| 65 to 74 Years | 0 (0.0%) | 47 (7.9%) |
| 75 Years and over | 83 (26.3%) | 31 (7.3%) |
Disability Class: Cognitive Difficulty
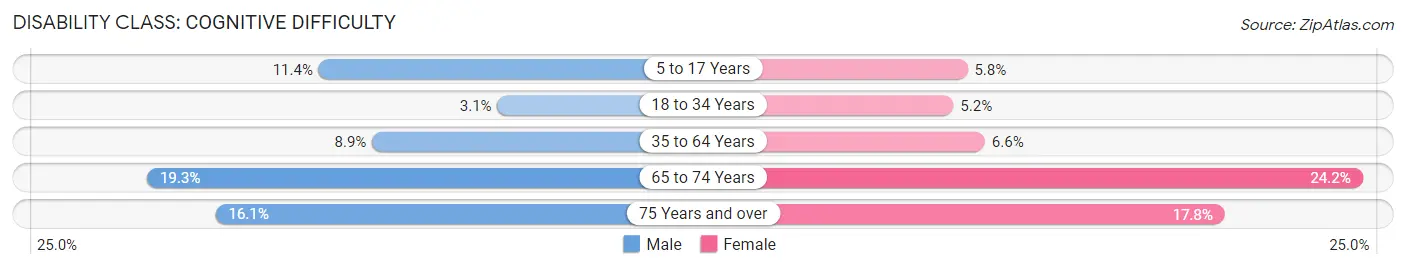
| Age Bracket | Male | Female |
| 5 to 17 Years | 106 (11.4%) | 50 (5.8%) |
| 18 to 34 Years | 30 (3.1%) | 45 (5.2%) |
| 35 to 64 Years | 182 (8.9%) | 139 (6.6%) |
| 65 to 74 Years | 102 (19.3%) | 143 (24.2%) |
| 75 Years and over | 51 (16.1%) | 75 (17.8%) |
Disability Class: Ambulatory Difficulty
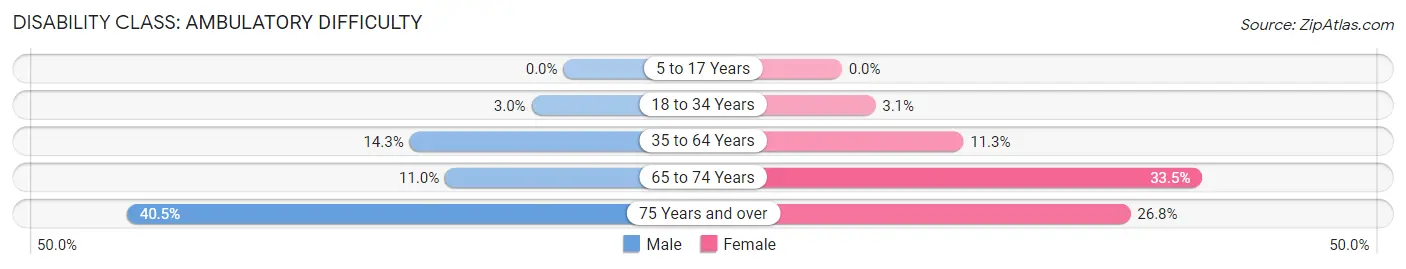
| Age Bracket | Male | Female |
| 5 to 17 Years | 0 (0.0%) | 0 (0.0%) |
| 18 to 34 Years | 29 (3.0%) | 27 (3.1%) |
| 35 to 64 Years | 293 (14.3%) | 236 (11.3%) |
| 65 to 74 Years | 58 (11.0%) | 198 (33.5%) |
| 75 Years and over | 128 (40.5%) | 113 (26.8%) |
Disability Class: Self-Care Difficulty
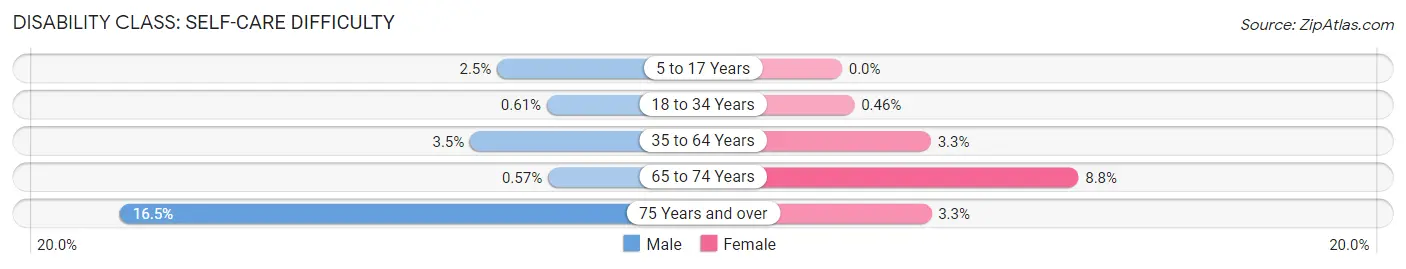
| Age Bracket | Male | Female |
| 5 to 17 Years | 23 (2.5%) | 0 (0.0%) |
| 18 to 34 Years | 6 (0.6%) | 4 (0.5%) |
| 35 to 64 Years | 71 (3.5%) | 69 (3.3%) |
| 65 to 74 Years | 3 (0.6%) | 52 (8.8%) |
| 75 Years and over | 52 (16.5%) | 14 (3.3%) |
Technology Access in Metcalfe County
Computing Device Access in Metcalfe County
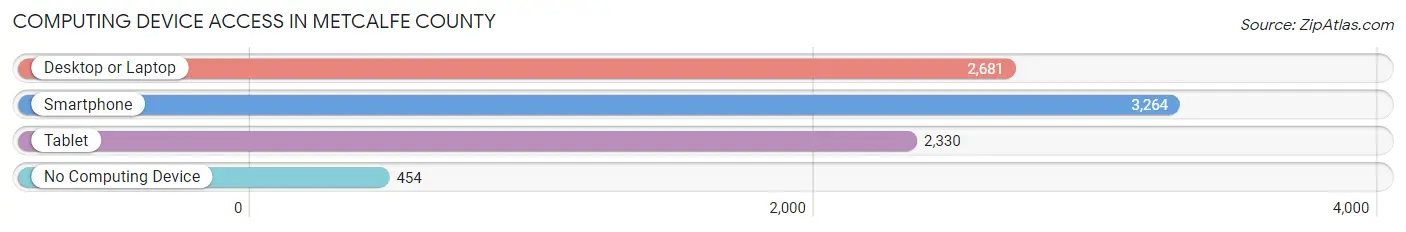
| Device Type | # Households | % Households |
| Desktop or Laptop | 2,681 | 64.4% |
| Smartphone | 3,264 | 78.5% |
| Tablet | 2,330 | 56.0% |
| No Computing Device | 454 | 10.9% |
| Total | 4,160 | 100.0% |
Internet Access in Metcalfe County
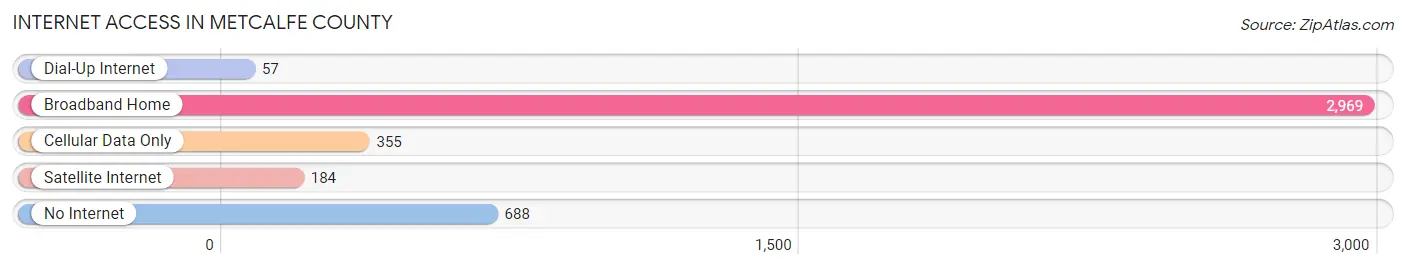
| Internet Type | # Households | % Households |
| Dial-Up Internet | 57 | 1.4% |
| Broadband Home | 2,969 | 71.4% |
| Cellular Data Only | 355 | 8.5% |
| Satellite Internet | 184 | 4.4% |
| No Internet | 688 | 16.5% |
| Total | 4,160 | 100.0% |
Metcalfe County Summary
Metcalfe County is located in south-central Kentucky, in the heart of the state’s Pennyrile region. It is bordered by Barren, Monroe, Adair, Cumberland, and Allen counties. The county seat is Edmonton, and the county was formed in 1860 from parts of Barren and Monroe counties. The county is named for Thomas Metcalfe, the tenth governor of Kentucky.
History
The area that is now Metcalfe County was first settled in the late 1700s by pioneers from Virginia and North Carolina. The first county seat was established in 1861 in the town of Summer Shade, but it was moved to Edmonton in 1864. The county was largely agricultural, with tobacco, corn, and wheat being the main crops.
In the late 1800s, the county began to develop a manufacturing industry, with several factories being established in the area. The most notable of these was the Metcalfe Manufacturing Company, which produced furniture and other wood products. The company was founded in 1891 and operated until the early 1900s.
The county also had a thriving coal mining industry in the early 1900s. The coal mines provided jobs for many of the county’s residents, and the coal was used to fuel the factories in the area.
Geography
Metcalfe County is located in south-central Kentucky, in the heart of the state’s Pennyrile region. It is bordered by Barren, Monroe, Adair, Cumberland, and Allen counties. The county has a total area of 246 square miles, of which 245 square miles is land and 1 square mile is water.
The terrain of the county is mostly rolling hills, with some flat areas in the northern part of the county. The highest point in the county is located in the northern part of the county, at an elevation of 890 feet. The county is drained by the Green River, which flows through the western part of the county.
Economy
The economy of Metcalfe County is largely based on agriculture and manufacturing. The county’s main agricultural products are tobacco, corn, and wheat. The county also has a thriving manufacturing industry, with several factories producing furniture, wood products, and other goods.
The county also has a growing tourism industry, with several attractions in the area, including the Metcalfe County Historical Museum, the Metcalfe County Fairgrounds, and the Metcalfe County Golf Course.
Demographics
As of the 2010 census, the population of Metcalfe County was 10,039. The population density was 41.2 people per square mile. The racial makeup of the county was 95.3% White, 2.7% African American, 0.3% Native American, 0.2% Asian, 0.1% Pacific Islander, 0.5% from other races, and 0.9% from two or more races. Hispanic or Latino of any race were 1.3% of the population.
The median income for a household in the county was $31,945, and the median income for a family was $38,945. The per capita income for the county was $16,845. About 17.2% of the population was below the poverty line.
Common Questions
What is Per Capita Income in Metcalfe County?
Per Capita income in Metcalfe County is $23,380.
What is the Median Family Income in Metcalfe County?
Median Family Income in Metcalfe County is $56,463.
What is the Median Household income in Metcalfe County?
Median Household Income in Metcalfe County is $46,932.
What is Income or Wage Gap in Metcalfe County?
Income or Wage Gap in Metcalfe County is 18.0%.
Women in Metcalfe County earn 82.0 cents for every dollar earned by a man.
What is Family Income Deficit in Metcalfe County?
Family Income Deficit in Metcalfe County is $9,754.
Families that are below poverty line in Metcalfe County earn $9,754 less on average than the poverty threshold level.
What is Inequality or Gini Index in Metcalfe County?
Inequality or Gini Index in Metcalfe County is 0.42.
What is the Total Population of Metcalfe County?
Total Population of Metcalfe County is 10,313.
What is the Total Male Population of Metcalfe County?
Total Male Population of Metcalfe County is 5,128.
What is the Total Female Population of Metcalfe County?
Total Female Population of Metcalfe County is 5,185.
What is the Ratio of Males per 100 Females in Metcalfe County?
There are 98.90 Males per 100 Females in Metcalfe County.
What is the Ratio of Females per 100 Males in Metcalfe County?
There are 101.11 Females per 100 Males in Metcalfe County.
What is the Median Population Age in Metcalfe County?
Median Population Age in Metcalfe County is 42.6 Years.
What is the Average Family Size in Metcalfe County
Average Family Size in Metcalfe County is 2.9 People.
What is the Average Household Size in Metcalfe County
Average Household Size in Metcalfe County is 2.5 People.
How Large is the Labor Force in Metcalfe County?
There are 4,559 People in the Labor Forcein in Metcalfe County.
What is the Percentage of People in the Labor Force in Metcalfe County?
55.6% of People are in the Labor Force in Metcalfe County.
What is the Unemployment Rate in Metcalfe County?
Unemployment Rate in Metcalfe County is 4.8%.