Mercer County, KY Map & Demographics
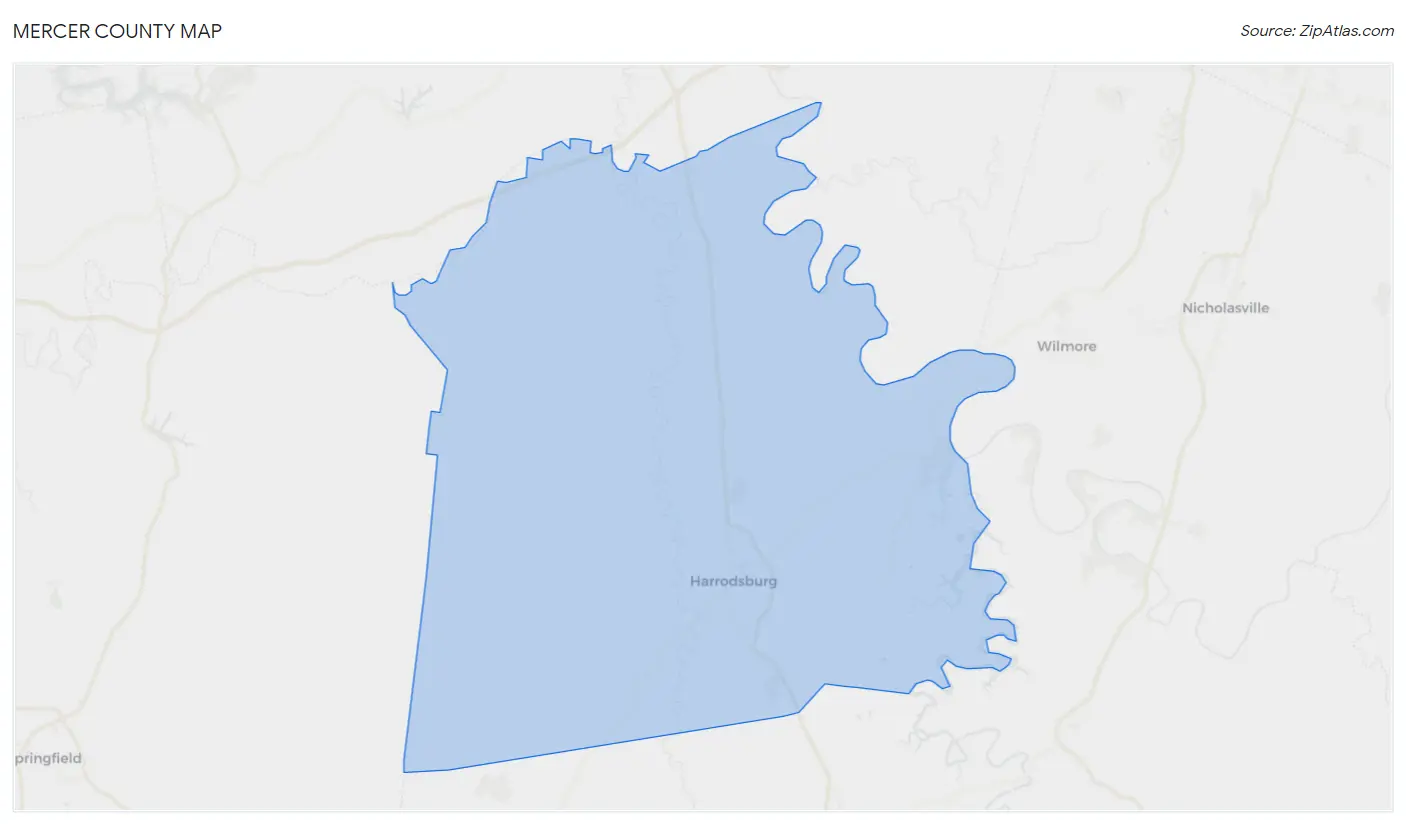
Mercer County Map
Mercer County Overview
$30,424
PER CAPITA INCOME
$78,846
AVG FAMILY INCOME
$60,728
AVG HOUSEHOLD INCOME
17.9%
WAGE / INCOME GAP [ % ]
82.1¢/ $1
WAGE / INCOME GAP [ $ ]
0.40
INEQUALITY / GINI INDEX
22,662
TOTAL POPULATION
11,343
MALE POPULATION
11,319
FEMALE POPULATION
100.21
MALES / 100 FEMALES
99.79
FEMALES / 100 MALES
43.1
MEDIAN AGE
3.2
AVG FAMILY SIZE
2.5
AVG HOUSEHOLD SIZE
10,548
LABOR FORCE [ PEOPLE ]
57.6%
PERCENT IN LABOR FORCE
4.5%
UNEMPLOYMENT RATE
Mercer County Area Codes
Income in Mercer County
Income Overview in Mercer County
Per Capita Income in Mercer County is $30,424, while median incomes of families and households are $78,846 and $60,728 respectively.
| Characteristic | Number | Measure |
| Per Capita Income | 22,662 | $30,424 |
| Median Family Income | 5,682 | $78,846 |
| Mean Family Income | 5,682 | $88,137 |
| Median Household Income | 9,079 | $60,728 |
| Mean Household Income | 9,079 | $71,935 |
| Income Deficit | 5,682 | $0 |
| Wage / Income Gap (%) | 22,662 | 17.93% |
| Wage / Income Gap ($) | 22,662 | 82.07¢ per $1 |
| Gini / Inequality Index | 22,662 | 0.40 |
Earnings by Sex in Mercer County
Average Earnings in Mercer County are $36,549, $40,280 for men and $33,057 for women, a difference of 17.9%.
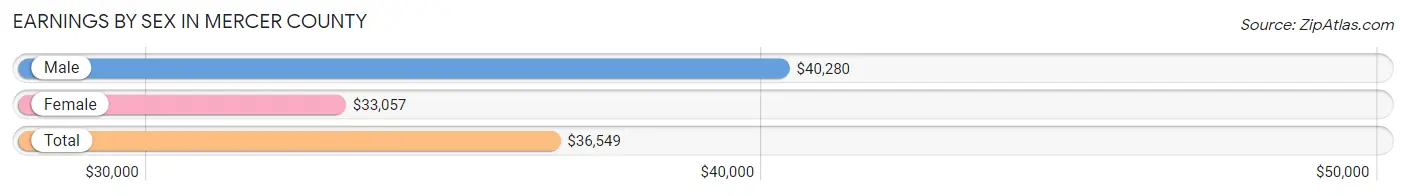
| Sex | Number | Average Earnings |
| Male | 6,016 (53.8%) | $40,280 |
| Female | 5,172 (46.2%) | $33,057 |
| Total | 11,188 (100.0%) | $36,549 |
Earnings by Sex by Income Bracket in Mercer County
The most common earnings brackets in Mercer County are $30,000 to $34,999 for men (686 | 11.4%) and $55,000 to $64,999 for women (472 | 9.1%).
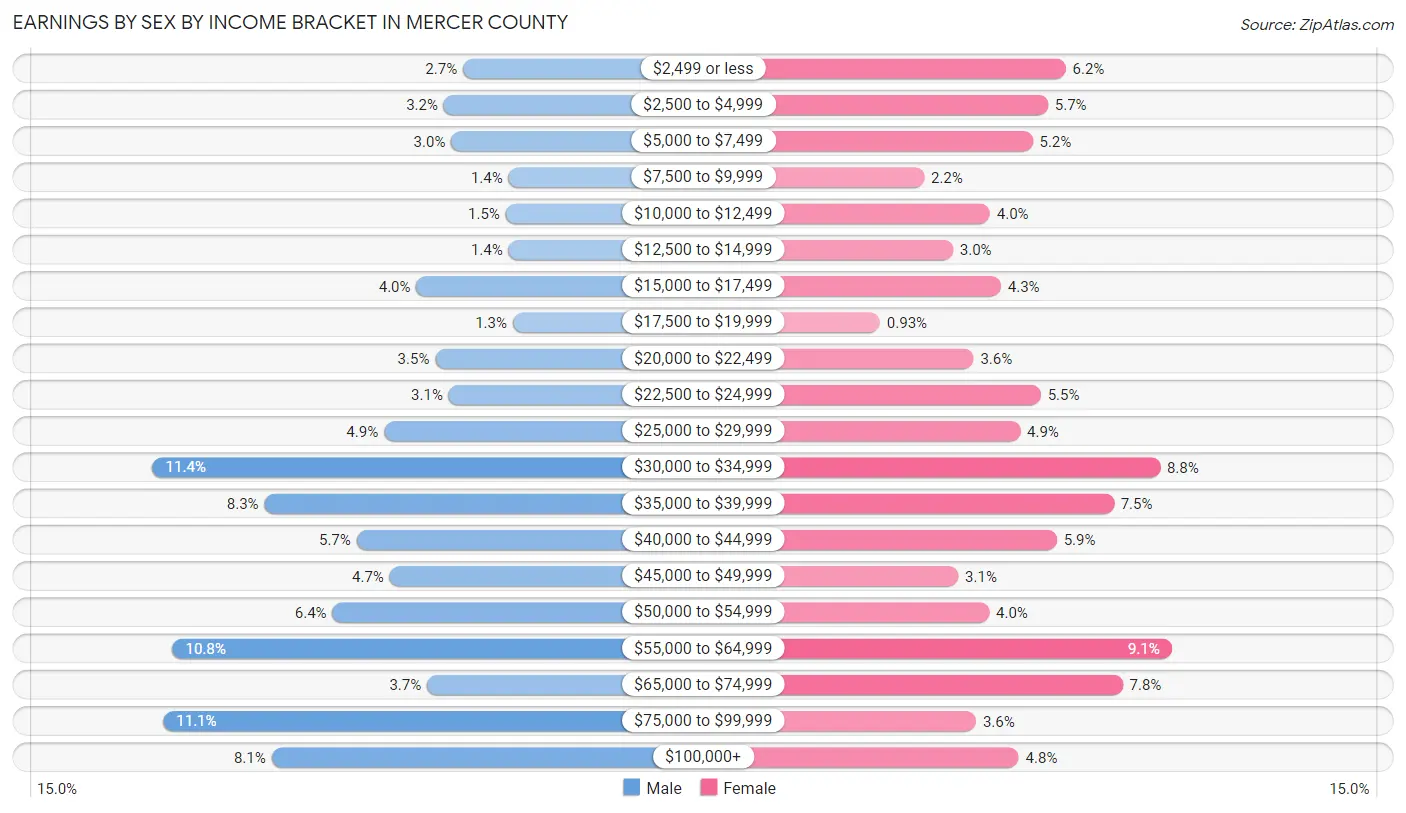
| Income | Male | Female |
| $2,499 or less | 161 (2.7%) | 318 (6.1%) |
| $2,500 to $4,999 | 194 (3.2%) | 292 (5.7%) |
| $5,000 to $7,499 | 181 (3.0%) | 270 (5.2%) |
| $7,500 to $9,999 | 84 (1.4%) | 112 (2.2%) |
| $10,000 to $12,499 | 89 (1.5%) | 208 (4.0%) |
| $12,500 to $14,999 | 84 (1.4%) | 154 (3.0%) |
| $15,000 to $17,499 | 240 (4.0%) | 224 (4.3%) |
| $17,500 to $19,999 | 77 (1.3%) | 48 (0.9%) |
| $20,000 to $22,499 | 208 (3.5%) | 184 (3.6%) |
| $22,500 to $24,999 | 185 (3.1%) | 282 (5.4%) |
| $25,000 to $29,999 | 295 (4.9%) | 252 (4.9%) |
| $30,000 to $34,999 | 686 (11.4%) | 455 (8.8%) |
| $35,000 to $39,999 | 497 (8.3%) | 388 (7.5%) |
| $40,000 to $44,999 | 341 (5.7%) | 305 (5.9%) |
| $45,000 to $49,999 | 285 (4.7%) | 162 (3.1%) |
| $50,000 to $54,999 | 382 (6.4%) | 207 (4.0%) |
| $55,000 to $64,999 | 652 (10.8%) | 472 (9.1%) |
| $65,000 to $74,999 | 222 (3.7%) | 401 (7.7%) |
| $75,000 to $99,999 | 668 (11.1%) | 188 (3.6%) |
| $100,000+ | 485 (8.1%) | 250 (4.8%) |
| Total | 6,016 (100.0%) | 5,172 (100.0%) |
Earnings by Sex by Educational Attainment in Mercer County
Average earnings in Mercer County are $46,002 for men and $35,474 for women, a difference of 22.9%. Men with an educational attainment of graduate degree enjoy the highest average annual earnings of $65,139, while those with less than high school education earn the least with $24,088. Women with an educational attainment of graduate degree earn the most with the average annual earnings of $57,763, while those with less than high school education have the smallest earnings of $23,063.
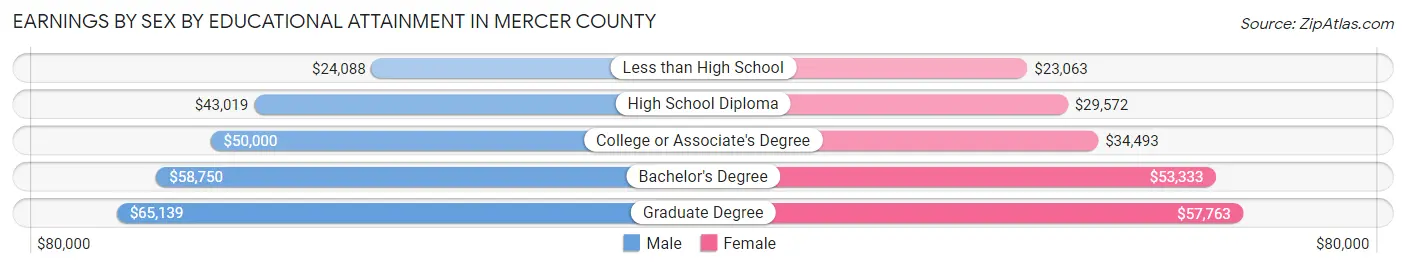
| Educational Attainment | Male Income | Female Income |
| Less than High School | $24,088 | $23,063 |
| High School Diploma | $43,019 | $29,572 |
| College or Associate's Degree | $50,000 | $34,493 |
| Bachelor's Degree | $58,750 | $53,333 |
| Graduate Degree | $65,139 | $57,763 |
| Total | $46,002 | $35,474 |
Family Income in Mercer County
Family Income Brackets in Mercer County
According to the Mercer County family income data, there are 1,256 families falling into the $100,000 to $149,999 income range, which is the most common income bracket and makes up 22.1% of all families. Conversely, the $10,000 to $14,999 income bracket is the least frequent group with only 45 families (0.8%) belonging to this category.
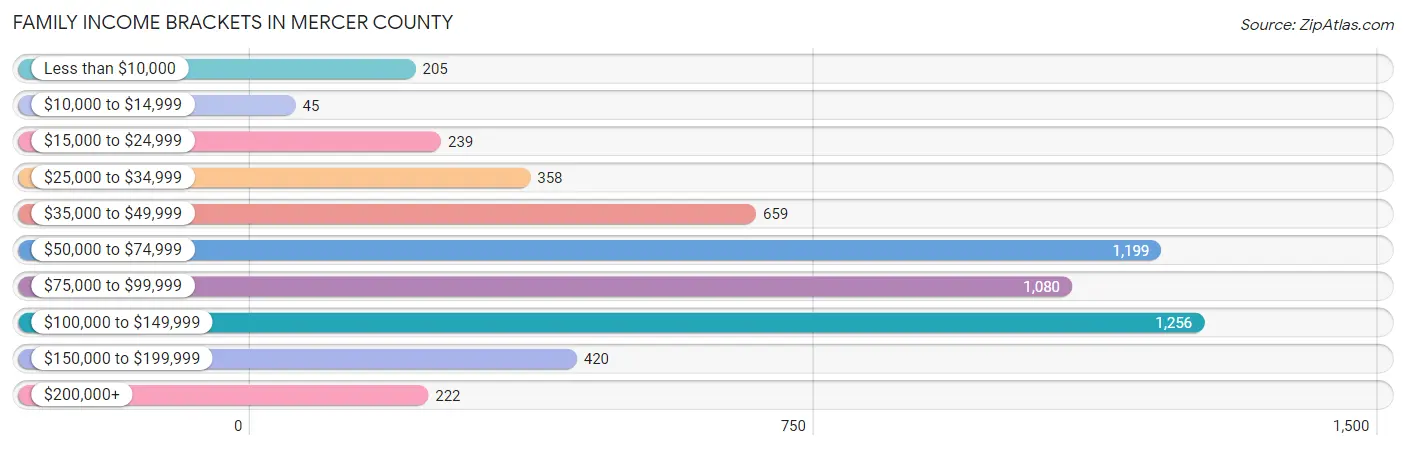
| Income Bracket | # Families | % Families |
| Less than $10,000 | 205 | 3.6% |
| $10,000 to $14,999 | 45 | 0.8% |
| $15,000 to $24,999 | 239 | 4.2% |
| $25,000 to $34,999 | 358 | 6.3% |
| $35,000 to $49,999 | 659 | 11.6% |
| $50,000 to $74,999 | 1,199 | 21.1% |
| $75,000 to $99,999 | 1,080 | 19.0% |
| $100,000 to $149,999 | 1,256 | 22.1% |
| $150,000 to $199,999 | 420 | 7.4% |
| $200,000+ | 222 | 3.9% |
Family Income by Famaliy Size in Mercer County
6-person families (105 | 1.8%) account for the highest median family income in Mercer County with $98,750 per family, while 2-person families (2,900 | 51.0%) have the highest median income of $34,074 per family member.
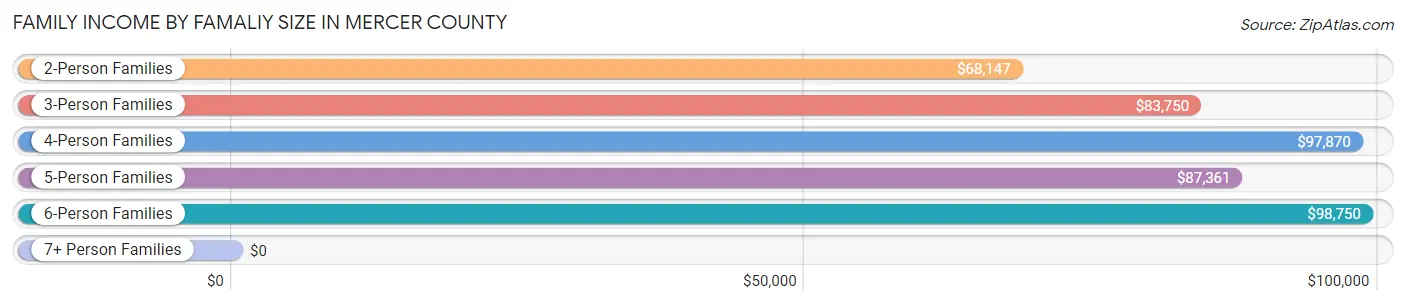
| Income Bracket | # Families | Median Income |
| 2-Person Families | 2,900 (51.0%) | $68,147 |
| 3-Person Families | 1,149 (20.2%) | $83,750 |
| 4-Person Families | 1,016 (17.9%) | $97,870 |
| 5-Person Families | 392 (6.9%) | $87,361 |
| 6-Person Families | 105 (1.8%) | $98,750 |
| 7+ Person Families | 120 (2.1%) | $0 |
| Total | 5,682 (100.0%) | $78,846 |
Family Income by Number of Earners in Mercer County
The median family income in Mercer County is $78,846, with families comprising 3+ earners (404) having the highest median family income of $107,500, while families with no earners (1,063) have the lowest median family income of $45,946, accounting for 7.1% and 18.7% of families, respectively.
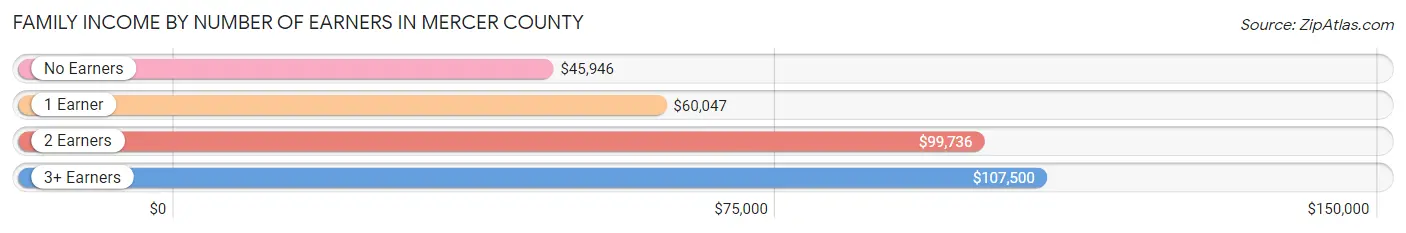
| Number of Earners | # Families | Median Income |
| No Earners | 1,063 (18.7%) | $45,946 |
| 1 Earner | 1,798 (31.6%) | $60,047 |
| 2 Earners | 2,417 (42.5%) | $99,736 |
| 3+ Earners | 404 (7.1%) | $107,500 |
| Total | 5,682 (100.0%) | $78,846 |
Household Income in Mercer County
Household Income Brackets in Mercer County
With 2,006 households falling in the category, the $50,000 to $74,999 income range is the most frequent in Mercer County, accounting for 22.1% of all households. In contrast, only 245 households (2.7%) fall into the $200,000+ income bracket, making it the least populous group.
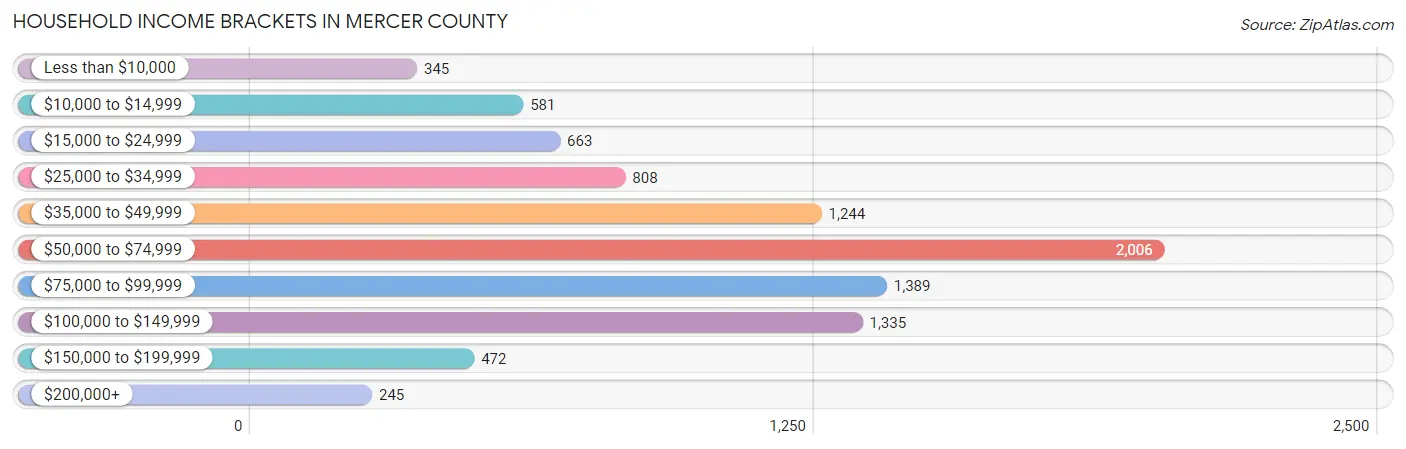
| Income Bracket | # Households | % Households |
| Less than $10,000 | 345 | 3.8% |
| $10,000 to $14,999 | 581 | 6.4% |
| $15,000 to $24,999 | 663 | 7.3% |
| $25,000 to $34,999 | 808 | 8.9% |
| $35,000 to $49,999 | 1,244 | 13.7% |
| $50,000 to $74,999 | 2,006 | 22.1% |
| $75,000 to $99,999 | 1,389 | 15.3% |
| $100,000 to $149,999 | 1,335 | 14.7% |
| $150,000 to $199,999 | 472 | 5.2% |
| $200,000+ | 245 | 2.7% |
Household Income by Householder Age in Mercer County
The median household income in Mercer County is $60,728, with the highest median household income of $71,530 found in the 45 to 64 years age bracket for the primary householder. A total of 3,513 households (38.7%) fall into this category. Meanwhile, the 65+ years age bracket for the primary householder has the lowest median household income of $38,877, with 2,641 households (29.1%) in this group.
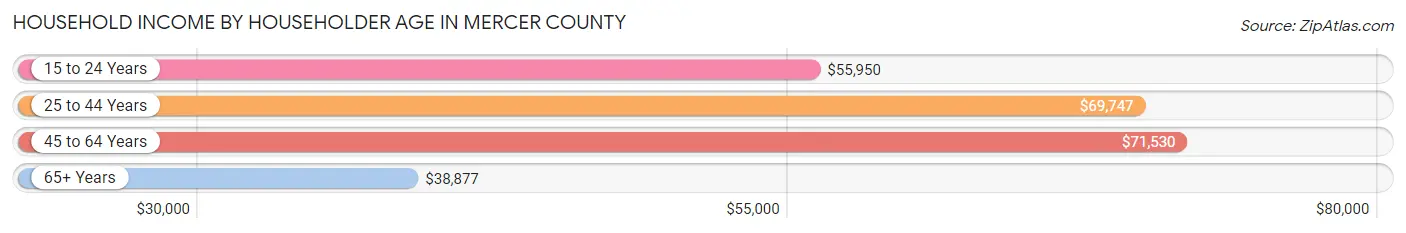
| Income Bracket | # Households | Median Income |
| 15 to 24 Years | 496 (5.5%) | $55,950 |
| 25 to 44 Years | 2,429 (26.8%) | $69,747 |
| 45 to 64 Years | 3,513 (38.7%) | $71,530 |
| 65+ Years | 2,641 (29.1%) | $38,877 |
| Total | 9,079 (100.0%) | $60,728 |
Poverty in Mercer County
Income Below Poverty by Sex and Age in Mercer County
With 9.9% poverty level for males and 12.5% for females among the residents of Mercer County, 5 year old males and 5 year old females are the most vulnerable to poverty, with 67 males (29.8%) and 35 females (25.4%) in their respective age groups living below the poverty level.
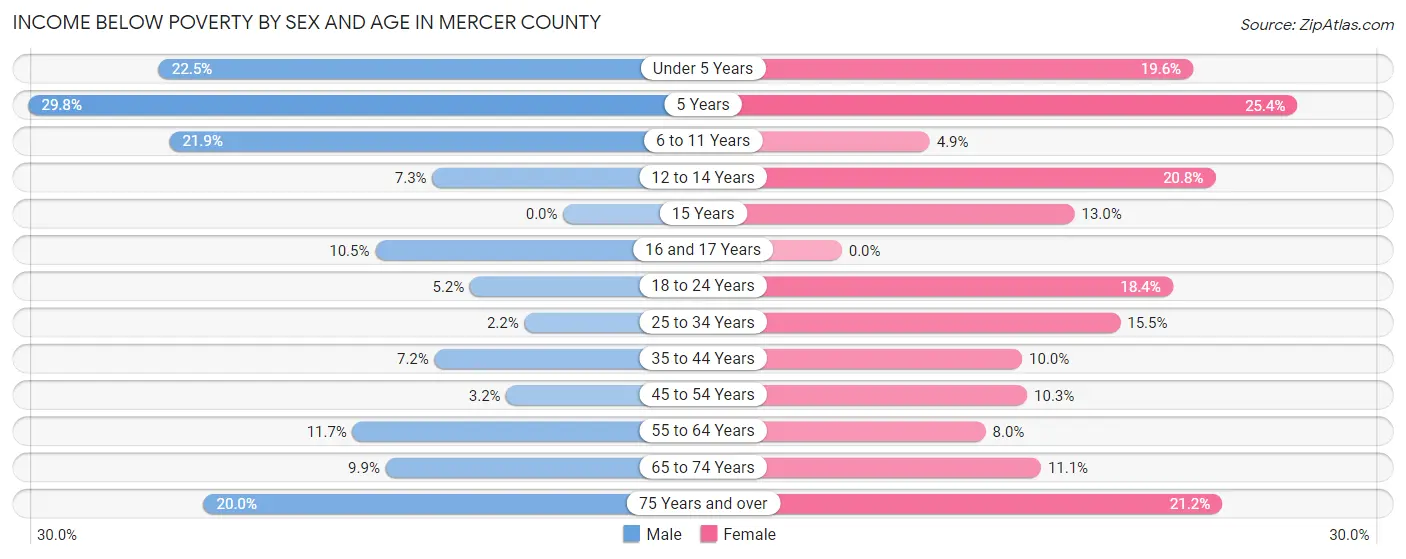
| Age Bracket | Male | Female |
| Under 5 Years | 145 (22.5%) | 114 (19.6%) |
| 5 Years | 67 (29.8%) | 35 (25.4%) |
| 6 to 11 Years | 157 (21.9%) | 47 (4.9%) |
| 12 to 14 Years | 32 (7.3%) | 58 (20.8%) |
| 15 Years | 0 (0.0%) | 21 (13.0%) |
| 16 and 17 Years | 36 (10.5%) | 0 (0.0%) |
| 18 to 24 Years | 50 (5.2%) | 170 (18.4%) |
| 25 to 34 Years | 31 (2.2%) | 195 (15.5%) |
| 35 to 44 Years | 94 (7.2%) | 123 (10.0%) |
| 45 to 54 Years | 45 (3.2%) | 151 (10.3%) |
| 55 to 64 Years | 205 (11.7%) | 137 (8.0%) |
| 65 to 74 Years | 114 (9.9%) | 148 (11.1%) |
| 75 Years and over | 133 (20.0%) | 207 (21.2%) |
| Total | 1,109 (9.9%) | 1,406 (12.5%) |
Income Above Poverty by Sex and Age in Mercer County
According to the poverty statistics in Mercer County, males aged 15 years and females aged 16 and 17 years are the age groups that are most secure financially, with 100.0% of males and 100.0% of females in these age groups living above the poverty line.
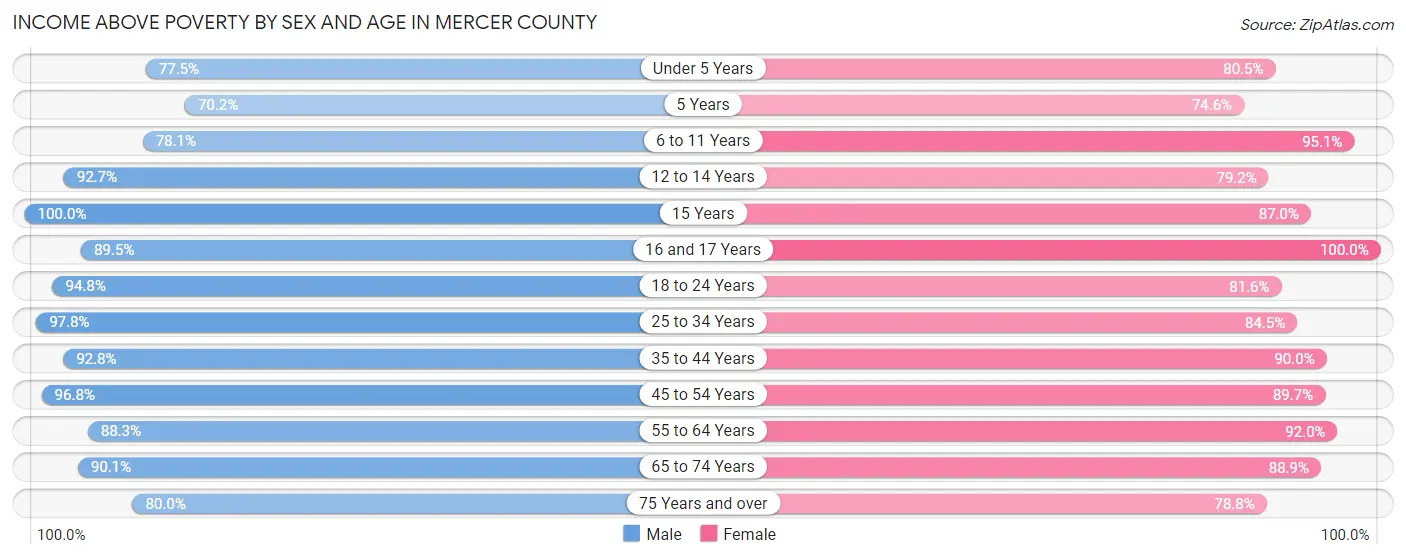
| Age Bracket | Male | Female |
| Under 5 Years | 499 (77.5%) | 469 (80.4%) |
| 5 Years | 158 (70.2%) | 103 (74.6%) |
| 6 to 11 Years | 559 (78.1%) | 913 (95.1%) |
| 12 to 14 Years | 407 (92.7%) | 221 (79.2%) |
| 15 Years | 151 (100.0%) | 141 (87.0%) |
| 16 and 17 Years | 308 (89.5%) | 218 (100.0%) |
| 18 to 24 Years | 913 (94.8%) | 753 (81.6%) |
| 25 to 34 Years | 1,402 (97.8%) | 1,062 (84.5%) |
| 35 to 44 Years | 1,217 (92.8%) | 1,102 (90.0%) |
| 45 to 54 Years | 1,375 (96.8%) | 1,312 (89.7%) |
| 55 to 64 Years | 1,543 (88.3%) | 1,574 (92.0%) |
| 65 to 74 Years | 1,039 (90.1%) | 1,186 (88.9%) |
| 75 Years and over | 531 (80.0%) | 771 (78.8%) |
| Total | 10,102 (90.1%) | 9,825 (87.5%) |
Income Below Poverty Among Married-Couple Families in Mercer County
The poverty statistics for married-couple families in Mercer County show that 4.4% or 202 of the total 4,592 families live below the poverty line. Families with 5 or more children have the highest poverty rate of 100.0%, comprising of 33 families. On the other hand, families with 1 or 2 children have the lowest poverty rate of 3.5%, which includes 49 families.
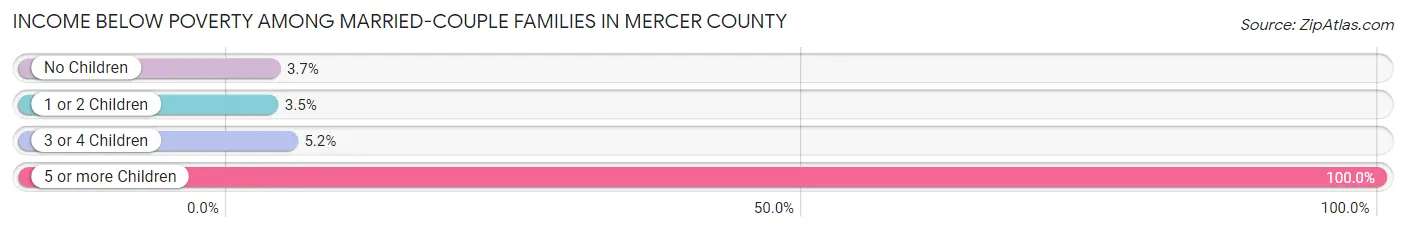
| Children | Above Poverty | Below Poverty |
| No Children | 2,695 (96.4%) | 102 (3.6%) |
| 1 or 2 Children | 1,365 (96.5%) | 49 (3.5%) |
| 3 or 4 Children | 330 (94.8%) | 18 (5.2%) |
| 5 or more Children | 0 (0.0%) | 33 (100.0%) |
| Total | 4,390 (95.6%) | 202 (4.4%) |
Income Below Poverty Among Single-Parent Households in Mercer County
According to the poverty data in Mercer County, 2.1% or 10 single-father households and 28.3% or 174 single-mother households are living below the poverty line. Among single-father households, those with no children have the highest poverty rate, with 10 households (3.5%) experiencing poverty. Likewise, among single-mother households, those with 3 or 4 children have the highest poverty rate, with 25 households (46.3%) falling below the poverty line.
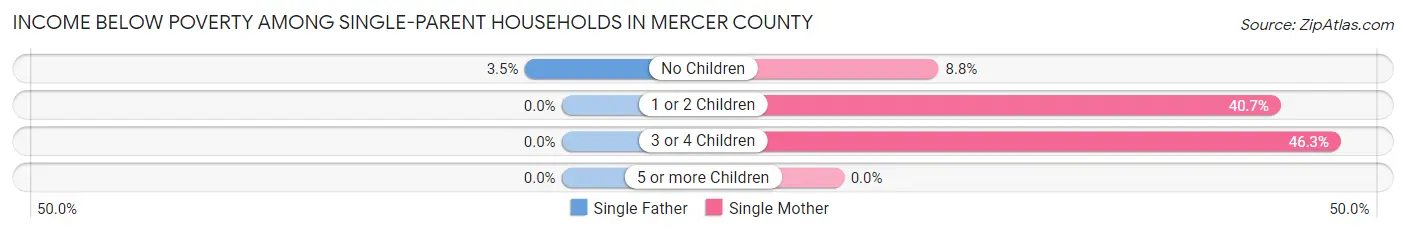
| Children | Single Father | Single Mother |
| No Children | 10 (3.5%) | 22 (8.8%) |
| 1 or 2 Children | 0 (0.0%) | 127 (40.7%) |
| 3 or 4 Children | 0 (0.0%) | 25 (46.3%) |
| 5 or more Children | 0 (0.0%) | 0 (0.0%) |
| Total | 10 (2.1%) | 174 (28.3%) |
Income Below Poverty Among Married-Couple vs Single-Parent Households in Mercer County
The poverty data for Mercer County shows that 202 of the married-couple family households (4.4%) and 184 of the single-parent households (16.9%) are living below the poverty level. Within the married-couple family households, those with 5 or more children have the highest poverty rate, with 33 households (100.0%) falling below the poverty line. Among the single-parent households, those with 3 or 4 children have the highest poverty rate, with 25 household (37.9%) living below poverty.
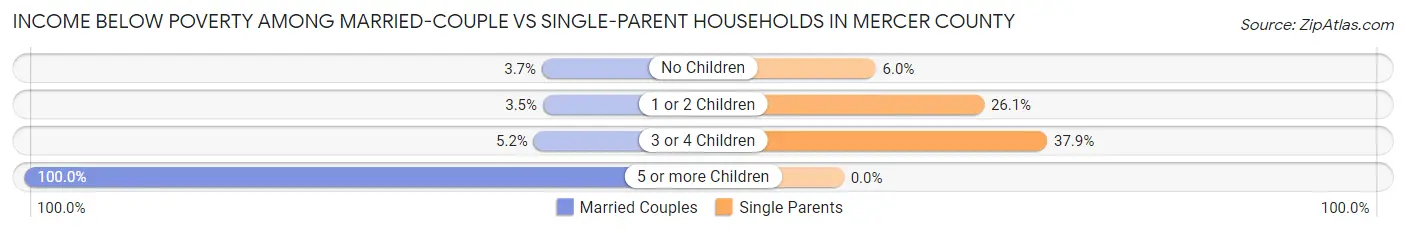
| Children | Married-Couple Families | Single-Parent Households |
| No Children | 102 (3.6%) | 32 (5.9%) |
| 1 or 2 Children | 49 (3.5%) | 127 (26.1%) |
| 3 or 4 Children | 18 (5.2%) | 25 (37.9%) |
| 5 or more Children | 33 (100.0%) | 0 (0.0%) |
| Total | 202 (4.4%) | 184 (16.9%) |
Race in Mercer County
The most populous races in Mercer County are White / Caucasian (20,811 | 91.8%), Two or more Races (816 | 3.6%), and Black / African American (790 | 3.5%).
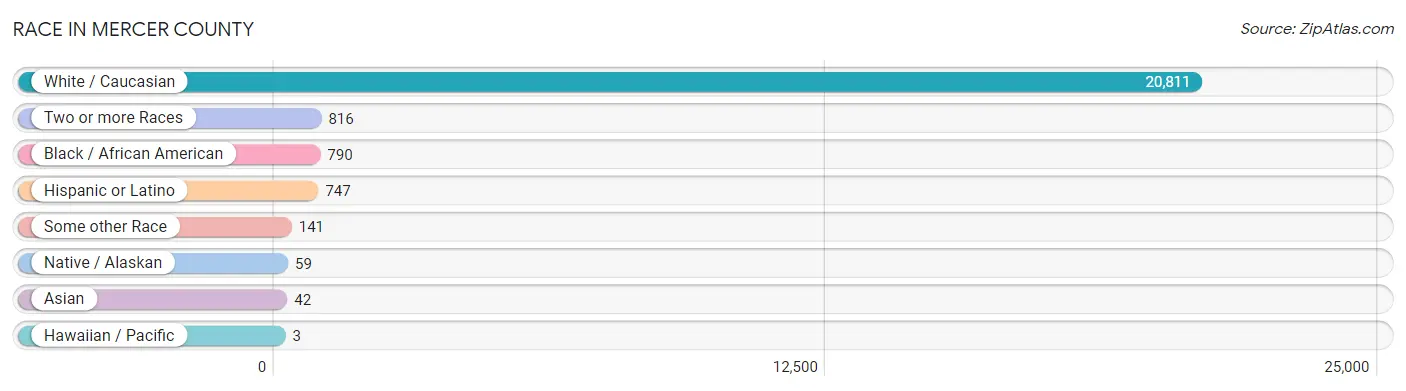
| Race | # Population | % Population |
| Asian | 42 | 0.2% |
| Black / African American | 790 | 3.5% |
| Hawaiian / Pacific | 3 | 0.0% |
| Hispanic or Latino | 747 | 3.3% |
| Native / Alaskan | 59 | 0.3% |
| White / Caucasian | 20,811 | 91.8% |
| Two or more Races | 816 | 3.6% |
| Some other Race | 141 | 0.6% |
| Total | 22,662 | 100.0% |
Ancestry in Mercer County
The most populous ancestries reported in Mercer County are American (4,415 | 19.5%), English (3,132 | 13.8%), German (1,816 | 8.0%), Irish (1,787 | 7.9%), and Mexican (661 | 2.9%), together accounting for 52.1% of all Mercer County residents.
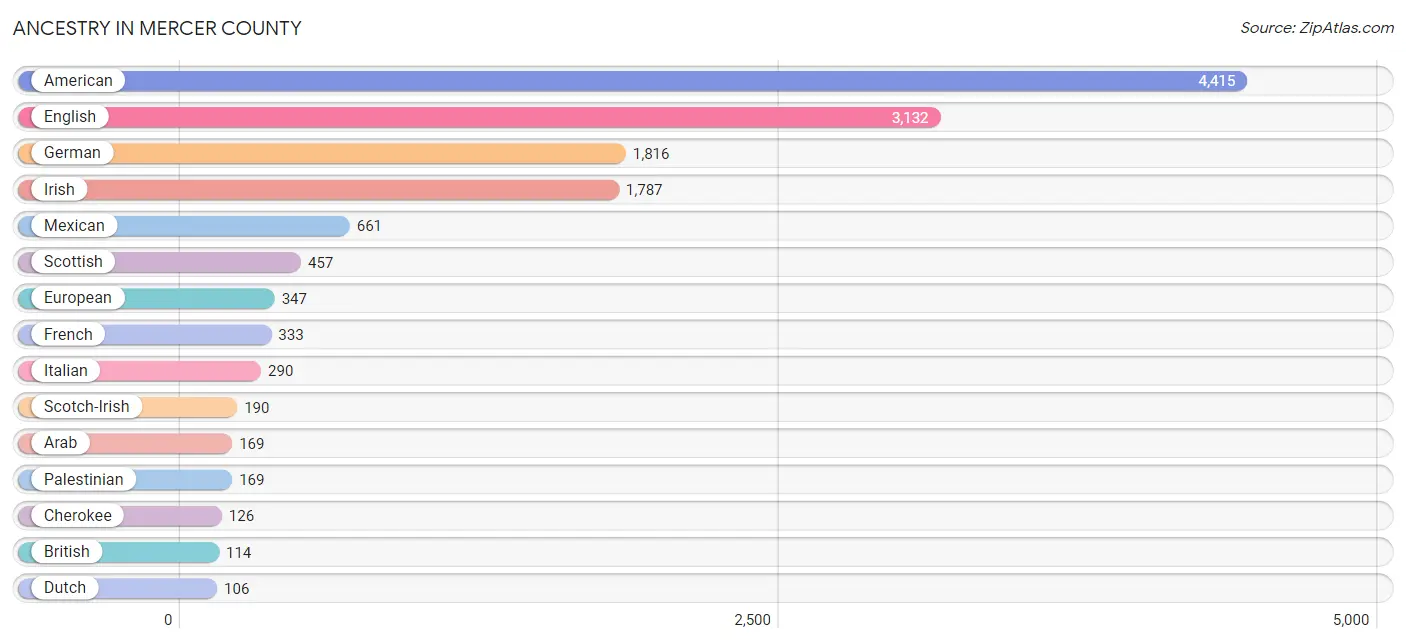
| Ancestry | # Population | % Population |
| American | 4,415 | 19.5% |
| Apache | 47 | 0.2% |
| Arab | 169 | 0.7% |
| Belgian | 6 | 0.0% |
| Bhutanese | 20 | 0.1% |
| British | 114 | 0.5% |
| Burmese | 30 | 0.1% |
| Canadian | 72 | 0.3% |
| Cherokee | 126 | 0.6% |
| Cuban | 50 | 0.2% |
| Czech | 42 | 0.2% |
| Danish | 12 | 0.1% |
| Dutch | 106 | 0.5% |
| Eastern European | 8 | 0.0% |
| English | 3,132 | 13.8% |
| European | 347 | 1.5% |
| French | 333 | 1.5% |
| French Canadian | 13 | 0.1% |
| German | 1,816 | 8.0% |
| Greek | 12 | 0.1% |
| Indian (Asian) | 13 | 0.1% |
| Irish | 1,787 | 7.9% |
| Italian | 290 | 1.3% |
| Korean | 10 | 0.0% |
| Maltese | 9 | 0.0% |
| Mexican | 661 | 2.9% |
| Mexican American Indian | 48 | 0.2% |
| Norwegian | 51 | 0.2% |
| Palestinian | 169 | 0.7% |
| Polish | 82 | 0.4% |
| Portuguese | 4 | 0.0% |
| Scotch-Irish | 190 | 0.8% |
| Scottish | 457 | 2.0% |
| Slovak | 23 | 0.1% |
| Swedish | 27 | 0.1% |
| Ukrainian | 58 | 0.3% |
| Welsh | 99 | 0.4% | View All 37 Rows |
Immigrants in Mercer County
The most numerous immigrant groups reported in Mercer County came from Central America (252 | 1.1%), Latin America (252 | 1.1%), Mexico (252 | 1.1%), Asia (134 | 0.6%), and Canada (72 | 0.3%), together accounting for 4.2% of all Mercer County residents.
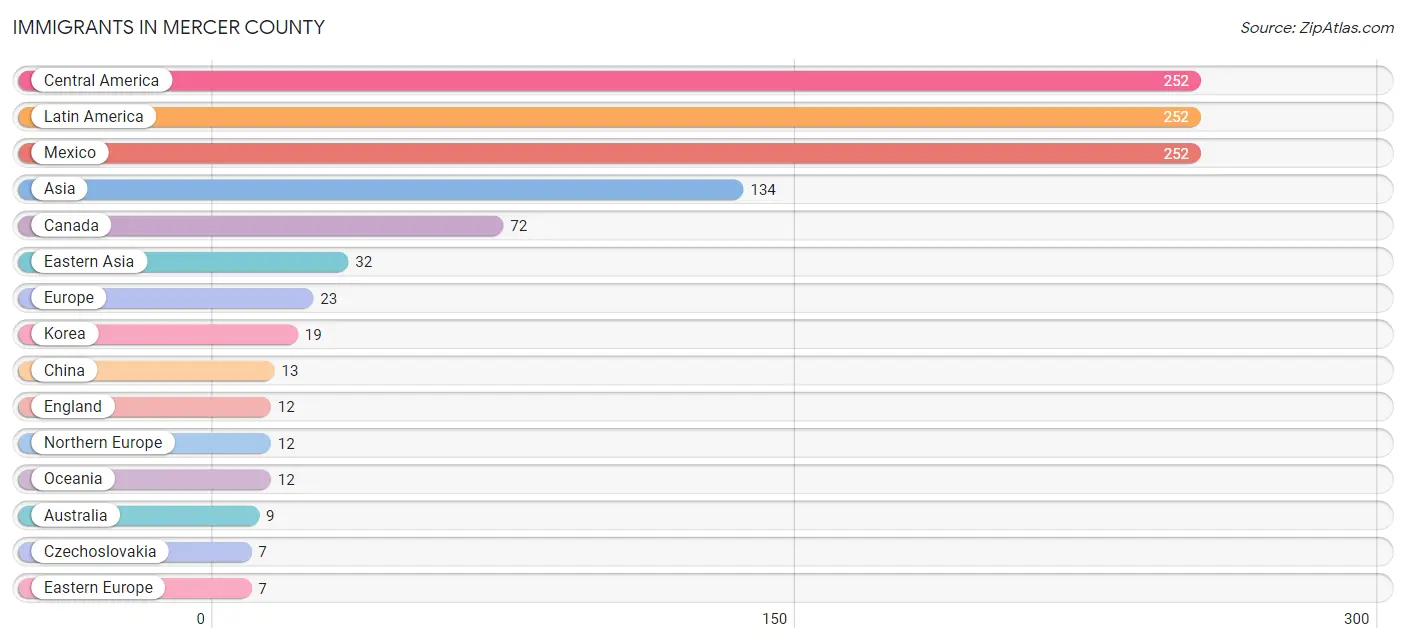
| Immigration Origin | # Population | % Population |
| Asia | 134 | 0.6% |
| Australia | 9 | 0.0% |
| Canada | 72 | 0.3% |
| Central America | 252 | 1.1% |
| China | 13 | 0.1% |
| Czechoslovakia | 7 | 0.0% |
| Eastern Asia | 32 | 0.1% |
| Eastern Europe | 7 | 0.0% |
| England | 12 | 0.1% |
| Europe | 23 | 0.1% |
| Germany | 4 | 0.0% |
| Korea | 19 | 0.1% |
| Latin America | 252 | 1.1% |
| Mexico | 252 | 1.1% |
| Micronesia | 3 | 0.0% |
| Northern Europe | 12 | 0.1% |
| Oceania | 12 | 0.1% |
| Western Europe | 4 | 0.0% | View All 18 Rows |
Sex and Age in Mercer County
Sex and Age in Mercer County
The most populous age groups in Mercer County are 55 to 59 Years (923 | 8.1%) for men and 60 to 64 Years (864 | 7.6%) for women.
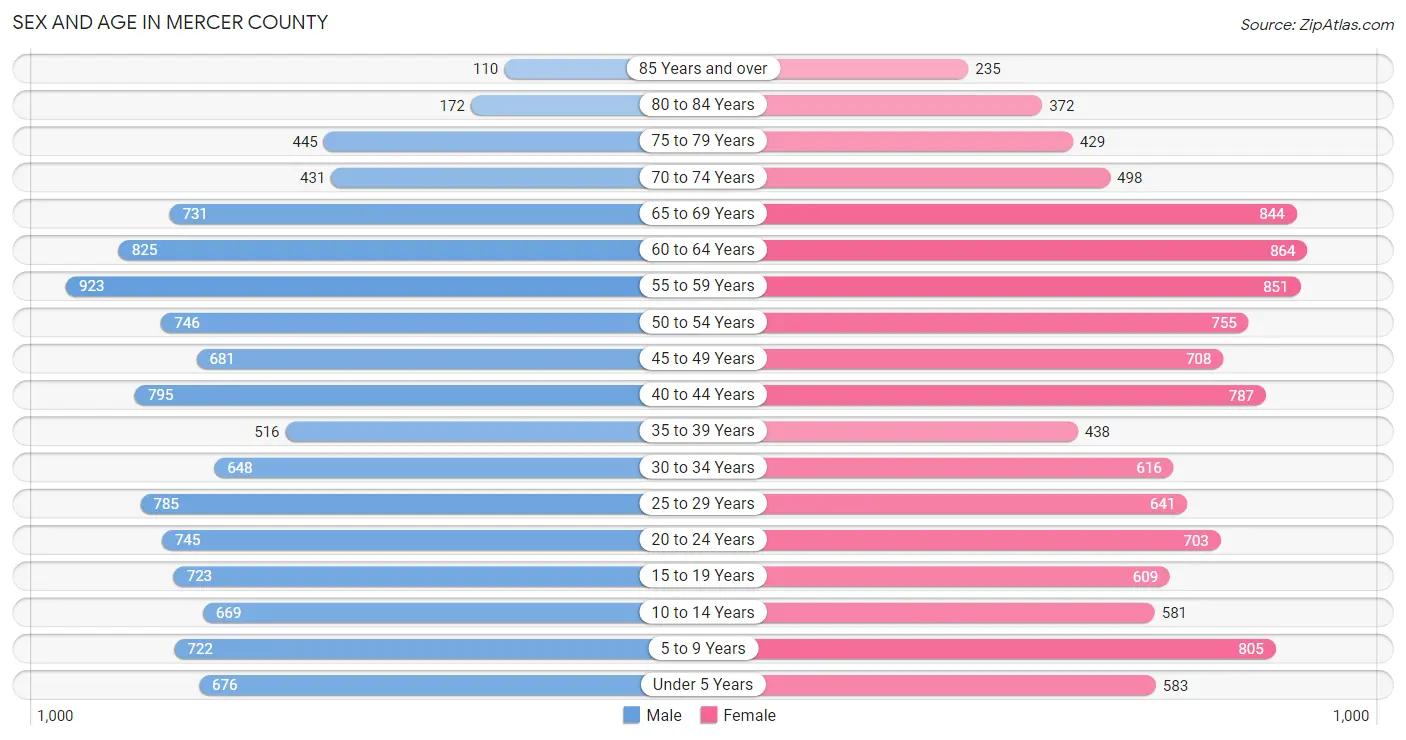
| Age Bracket | Male | Female |
| Under 5 Years | 676 (6.0%) | 583 (5.1%) |
| 5 to 9 Years | 722 (6.4%) | 805 (7.1%) |
| 10 to 14 Years | 669 (5.9%) | 581 (5.1%) |
| 15 to 19 Years | 723 (6.4%) | 609 (5.4%) |
| 20 to 24 Years | 745 (6.6%) | 703 (6.2%) |
| 25 to 29 Years | 785 (6.9%) | 641 (5.7%) |
| 30 to 34 Years | 648 (5.7%) | 616 (5.4%) |
| 35 to 39 Years | 516 (4.5%) | 438 (3.9%) |
| 40 to 44 Years | 795 (7.0%) | 787 (7.0%) |
| 45 to 49 Years | 681 (6.0%) | 708 (6.2%) |
| 50 to 54 Years | 746 (6.6%) | 755 (6.7%) |
| 55 to 59 Years | 923 (8.1%) | 851 (7.5%) |
| 60 to 64 Years | 825 (7.3%) | 864 (7.6%) |
| 65 to 69 Years | 731 (6.4%) | 844 (7.5%) |
| 70 to 74 Years | 431 (3.8%) | 498 (4.4%) |
| 75 to 79 Years | 445 (3.9%) | 429 (3.8%) |
| 80 to 84 Years | 172 (1.5%) | 372 (3.3%) |
| 85 Years and over | 110 (1.0%) | 235 (2.1%) |
| Total | 11,343 (100.0%) | 11,319 (100.0%) |
Families and Households in Mercer County
Median Family Size in Mercer County
The median family size in Mercer County is 3.21 persons per family, with single female/mother families (615 | 10.8%) accounting for the largest median family size of 3.32 persons per family. On the other hand, single male/father families (475 | 8.4%) represent the smallest median family size with 2.59 persons per family.
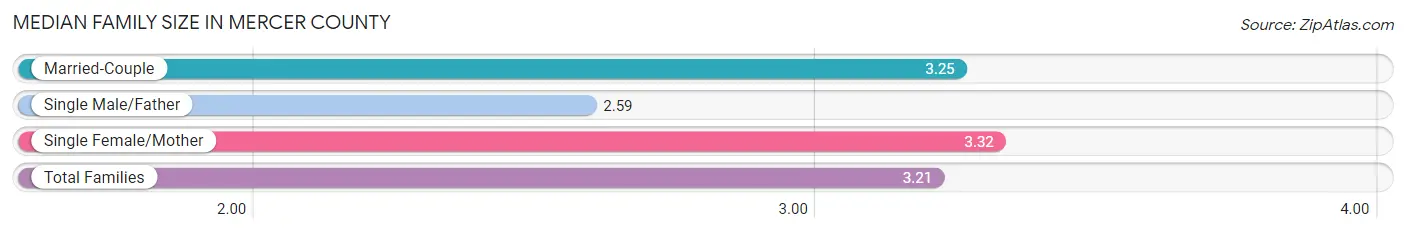
| Family Type | # Families | Family Size |
| Married-Couple | 4,592 (80.8%) | 3.25 |
| Single Male/Father | 475 (8.4%) | 2.59 |
| Single Female/Mother | 615 (10.8%) | 3.32 |
| Total Families | 5,682 (100.0%) | 3.21 |
Median Household Size in Mercer County
The median household size in Mercer County is 2.48 persons per household, with single female/mother households (615 | 6.8%) accounting for the largest median household size of 3.64 persons per household. non-family households (3,397 | 37.4%) represent the smallest median household size with 1.15 persons per household.
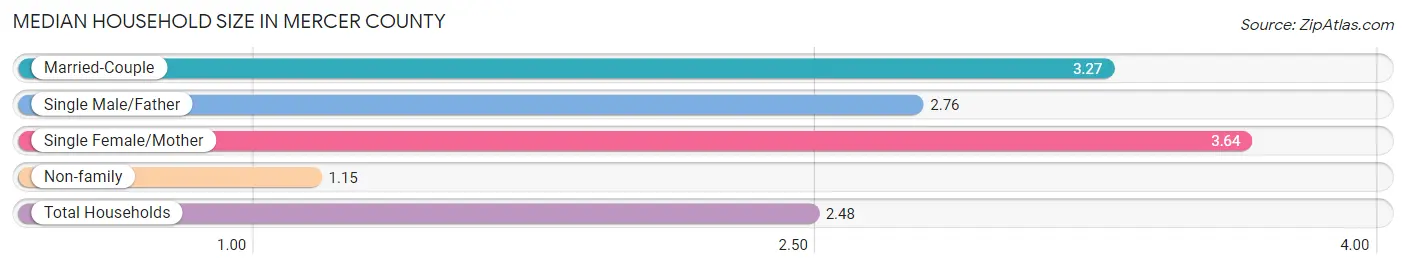
| Household Type | # Households | Household Size |
| Married-Couple | 4,592 (50.6%) | 3.27 |
| Single Male/Father | 475 (5.2%) | 2.76 |
| Single Female/Mother | 615 (6.8%) | 3.64 |
| Non-family | 3,397 (37.4%) | 1.15 |
| Total Households | 9,079 (100.0%) | 2.48 |
Household Size by Marriage Status in Mercer County
Out of a total of 9,079 households in Mercer County, 5,682 (62.6%) are family households, while 3,397 (37.4%) are nonfamily households. The most numerous type of family households are 2-person households, comprising 2,788, and the most common type of nonfamily households are 1-person households, comprising 3,073.
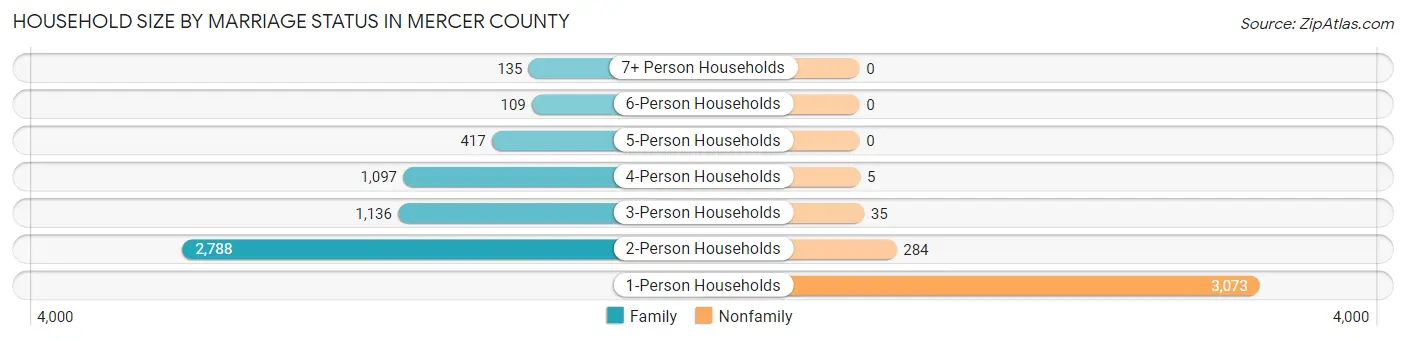
| Household Size | Family Households | Nonfamily Households |
| 1-Person Households | - | 3,073 (33.9%) |
| 2-Person Households | 2,788 (30.7%) | 284 (3.1%) |
| 3-Person Households | 1,136 (12.5%) | 35 (0.4%) |
| 4-Person Households | 1,097 (12.1%) | 5 (0.1%) |
| 5-Person Households | 417 (4.6%) | 0 (0.0%) |
| 6-Person Households | 109 (1.2%) | 0 (0.0%) |
| 7+ Person Households | 135 (1.5%) | 0 (0.0%) |
| Total | 5,682 (62.6%) | 3,397 (37.4%) |
Female Fertility in Mercer County
Fertility by Age in Mercer County
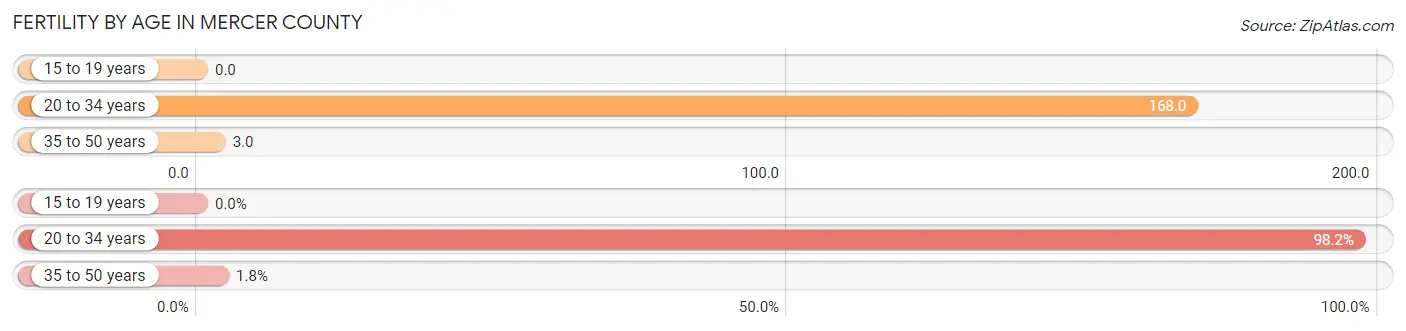
Average fertility rate in Mercer County is 73.0 births per 1,000 women. Women in the age bracket of 20 to 34 years have the highest fertility rate with 168.0 births per 1,000 women. Women in the age bracket of 20 to 34 years acount for 98.2% of all women with births.
| Age Bracket | Women with Births | Births / 1,000 Women |
| 15 to 19 years | 0 (0.0%) | 0.0 |
| 20 to 34 years | 330 (98.2%) | 168.0 |
| 35 to 50 years | 6 (1.8%) | 3.0 |
| Total | 336 (100.0%) | 73.0 |
Fertility by Age by Marriage Status in Mercer County
63.4% of women with births (336) in Mercer County are married. The highest percentage of unmarried women with births falls into 20 to 34 years age bracket with 37.3% of them unmarried at the time of birth, while the lowest percentage of unmarried women with births belong to 35 to 50 years age bracket with 0.0% of them unmarried.
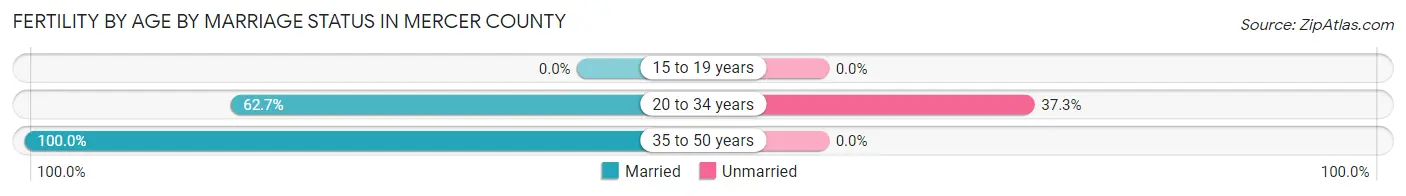
| Age Bracket | Married | Unmarried |
| 15 to 19 years | 0 (0.0%) | 0 (0.0%) |
| 20 to 34 years | 207 (62.7%) | 123 (37.3%) |
| 35 to 50 years | 6 (100.0%) | 0 (0.0%) |
| Total | 213 (63.4%) | 123 (36.6%) |
Fertility by Education in Mercer County
Average fertility rate in Mercer County is 73.0 births per 1,000 women. Women with the education attainment of high school diploma have the highest fertility rate of 144.0 births per 1,000 women, while women with the education attainment of less than high school have the lowest fertility at 17.0 births per 1,000 women. Women with the education attainment of high school diploma represent 44.9% of all women with births.
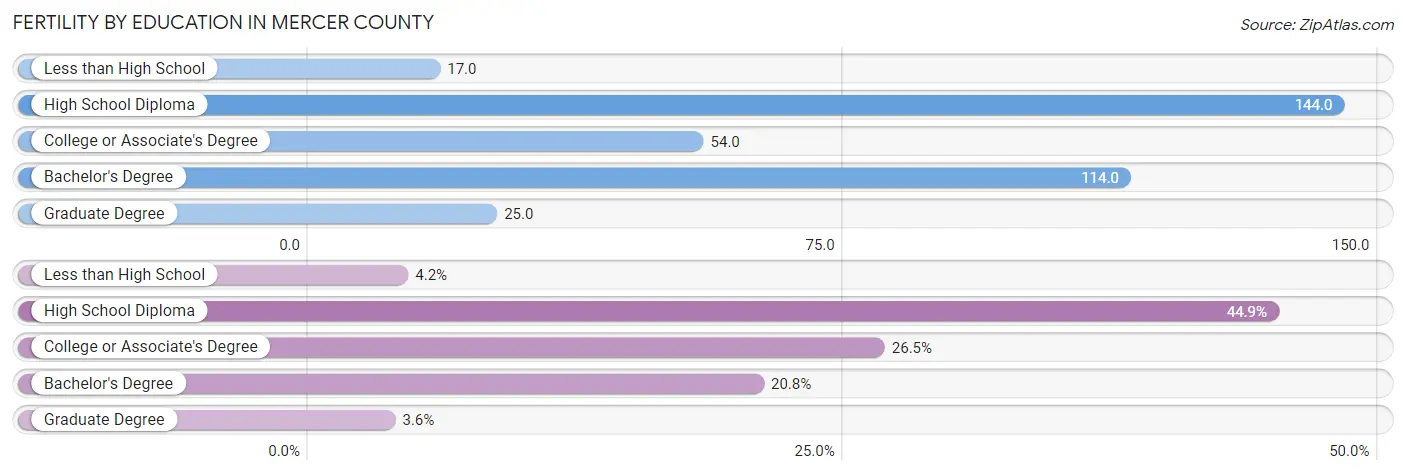
| Educational Attainment | Women with Births | Births / 1,000 Women |
| Less than High School | 14 (4.2%) | 17.0 |
| High School Diploma | 151 (44.9%) | 144.0 |
| College or Associate's Degree | 89 (26.5%) | 54.0 |
| Bachelor's Degree | 70 (20.8%) | 114.0 |
| Graduate Degree | 12 (3.6%) | 25.0 |
| Total | 336 (100.0%) | 73.0 |
Fertility by Education by Marriage Status in Mercer County
36.6% of women with births in Mercer County are unmarried. Women with the educational attainment of less than high school are most likely to be married with 100.0% of them married at childbirth, while women with the educational attainment of high school diploma are least likely to be married with 51.7% of them unmarried at childbirth.
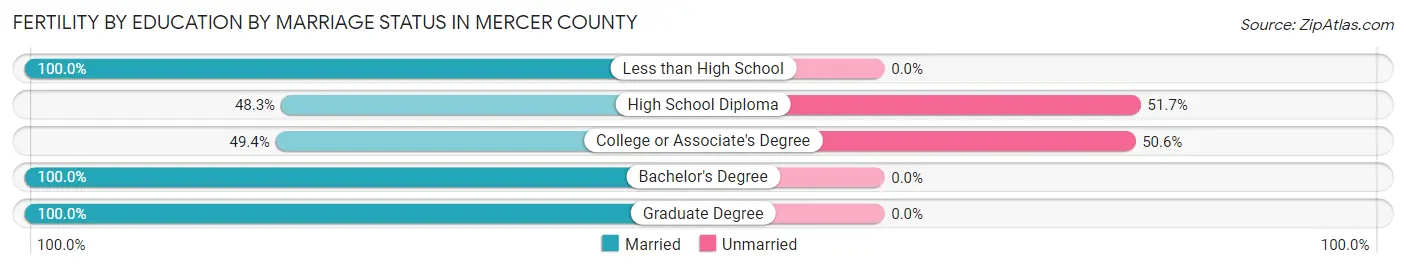
| Educational Attainment | Married | Unmarried |
| Less than High School | 14 (100.0%) | 0 (0.0%) |
| High School Diploma | 73 (48.3%) | 78 (51.7%) |
| College or Associate's Degree | 44 (49.4%) | 45 (50.6%) |
| Bachelor's Degree | 70 (100.0%) | 0 (0.0%) |
| Graduate Degree | 12 (100.0%) | 0 (0.0%) |
| Total | 213 (63.4%) | 123 (36.6%) |
Employment Characteristics in Mercer County
Employment by Class of Employer in Mercer County
Among the 9,949 employed individuals in Mercer County, private company employees (7,123 | 71.6%), state government employees (671 | 6.7%), and not-for-profit organizations (655 | 6.6%) make up the most common classes of employment.
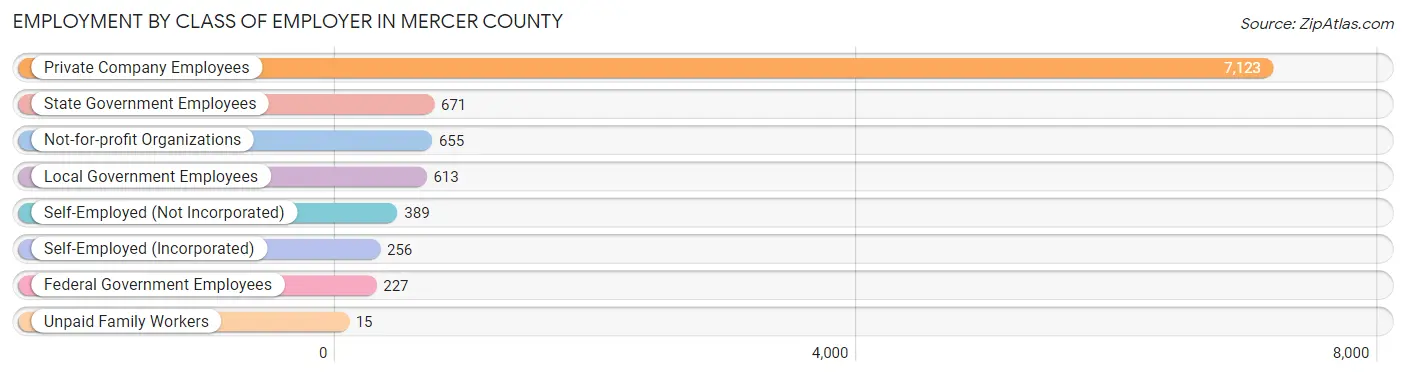
| Employer Class | # Employees | % Employees |
| Private Company Employees | 7,123 | 71.6% |
| Self-Employed (Incorporated) | 256 | 2.6% |
| Self-Employed (Not Incorporated) | 389 | 3.9% |
| Not-for-profit Organizations | 655 | 6.6% |
| Local Government Employees | 613 | 6.2% |
| State Government Employees | 671 | 6.7% |
| Federal Government Employees | 227 | 2.3% |
| Unpaid Family Workers | 15 | 0.2% |
| Total | 9,949 | 100.0% |
Employment Status by Age in Mercer County
According to the labor force statistics for Mercer County, out of the total population over 16 years of age (18,313), 57.6% or 10,548 individuals are in the labor force, with 4.5% or 475 of them unemployed. The age group with the highest labor force participation rate is 35 to 44 years, with 89.1% or 2,260 individuals in the labor force. Within the labor force, the 35 to 44 years age range has the highest percentage of unemployed individuals, with 10.3% or 233 of them being unemployed.
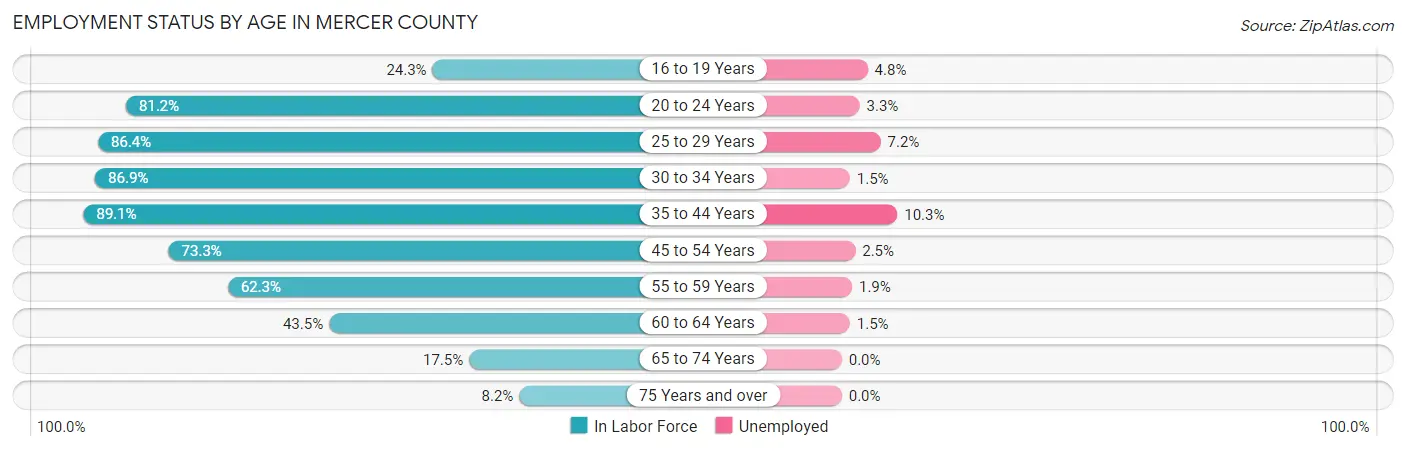
| Age Bracket | In Labor Force | Unemployed |
| 16 to 19 Years | 248 (24.3%) | 12 (4.8%) |
| 20 to 24 Years | 1,176 (81.2%) | 39 (3.3%) |
| 25 to 29 Years | 1,232 (86.4%) | 89 (7.2%) |
| 30 to 34 Years | 1,098 (86.9%) | 16 (1.5%) |
| 35 to 44 Years | 2,260 (89.1%) | 233 (10.3%) |
| 45 to 54 Years | 2,118 (73.3%) | 53 (2.5%) |
| 55 to 59 Years | 1,105 (62.3%) | 21 (1.9%) |
| 60 to 64 Years | 735 (43.5%) | 11 (1.5%) |
| 65 to 74 Years | 438 (17.5%) | 0 (0.0%) |
| 75 Years and over | 145 (8.2%) | 0 (0.0%) |
| Total | 10,548 (57.6%) | 475 (4.5%) |
Employment Status by Educational Attainment in Mercer County
According to labor force statistics for Mercer County, 73.8% of individuals (8,545) out of the total population between 25 and 64 years of age (11,579) are in the labor force, with 4.9% or 419 of them being unemployed. The group with the highest labor force participation rate are those with the educational attainment of bachelor's degree or higher, with 88.8% or 2,232 individuals in the labor force. Within the labor force, individuals with less than high school education have the highest percentage of unemployment, with 9.7% or 45 of them being unemployed.
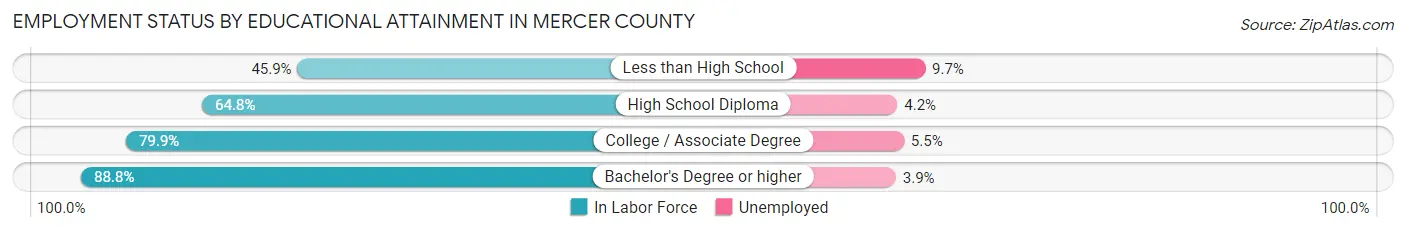
| Educational Attainment | In Labor Force | Unemployed |
| Less than High School | 465 (45.9%) | 98 (9.7%) |
| High School Diploma | 2,496 (64.8%) | 162 (4.2%) |
| College / Associate Degree | 3,357 (79.9%) | 231 (5.5%) |
| Bachelor's Degree or higher | 2,232 (88.8%) | 98 (3.9%) |
| Total | 8,545 (73.8%) | 567 (4.9%) |
Employment Occupations by Sex in Mercer County
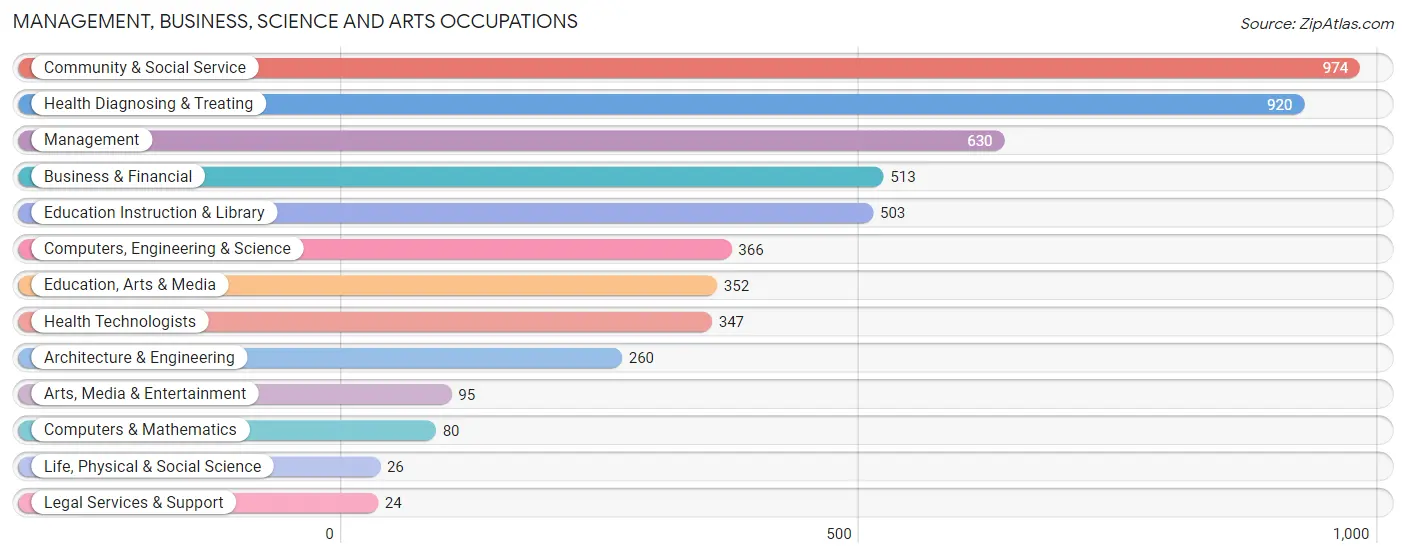
Management, Business, Science and Arts Occupations
The most common Management, Business, Science and Arts occupations in Mercer County are Community & Social Service (974 | 9.7%), Health Diagnosing & Treating (920 | 9.2%), Management (630 | 6.3%), Business & Financial (513 | 5.1%), and Education Instruction & Library (503 | 5.0%).
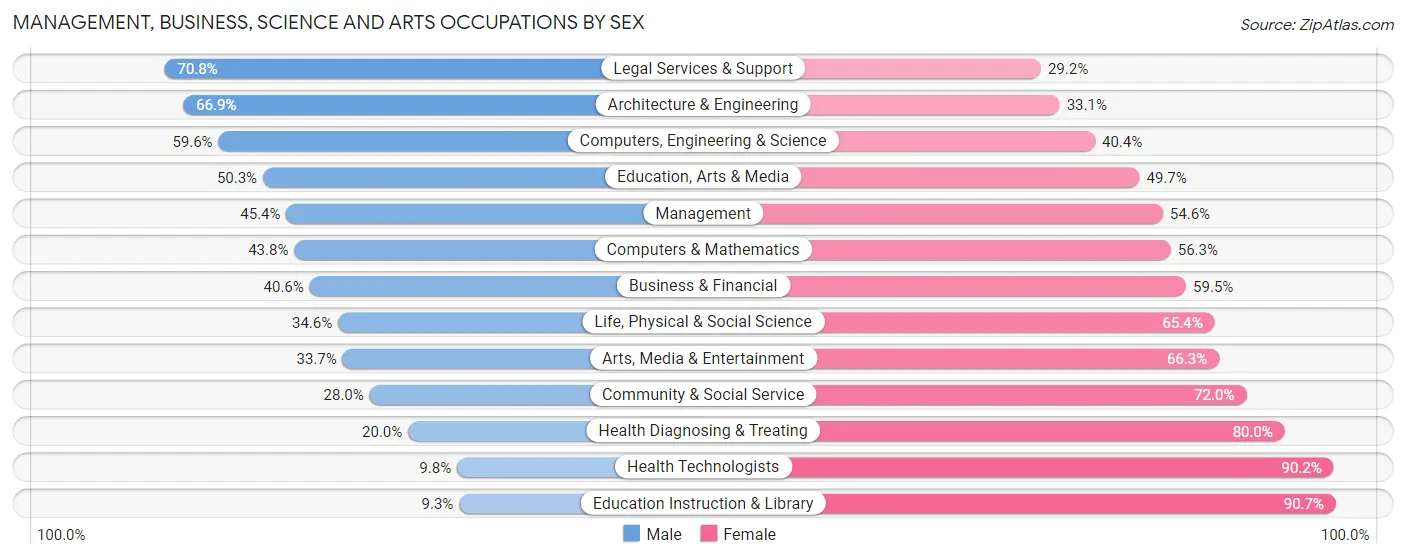
Management, Business, Science and Arts Occupations by Sex
Within the Management, Business, Science and Arts occupations in Mercer County, the most male-oriented occupations are Legal Services & Support (70.8%), Architecture & Engineering (66.9%), and Computers, Engineering & Science (59.6%), while the most female-oriented occupations are Education Instruction & Library (90.7%), Health Technologists (90.2%), and Health Diagnosing & Treating (80.0%).
| Occupation | Male | Female |
| Management | 286 (45.4%) | 344 (54.6%) |
| Business & Financial | 208 (40.6%) | 305 (59.5%) |
| Computers, Engineering & Science | 218 (59.6%) | 148 (40.4%) |
| Computers & Mathematics | 35 (43.8%) | 45 (56.2%) |
| Architecture & Engineering | 174 (66.9%) | 86 (33.1%) |
| Life, Physical & Social Science | 9 (34.6%) | 17 (65.4%) |
| Community & Social Service | 273 (28.0%) | 701 (72.0%) |
| Education, Arts & Media | 177 (50.3%) | 175 (49.7%) |
| Legal Services & Support | 17 (70.8%) | 7 (29.2%) |
| Education Instruction & Library | 47 (9.3%) | 456 (90.7%) |
| Arts, Media & Entertainment | 32 (33.7%) | 63 (66.3%) |
| Health Diagnosing & Treating | 184 (20.0%) | 736 (80.0%) |
| Health Technologists | 34 (9.8%) | 313 (90.2%) |
| Total (Category) | 1,169 (34.4%) | 2,234 (65.6%) |
| Total (Overall) | 5,365 (53.5%) | 4,664 (46.5%) |
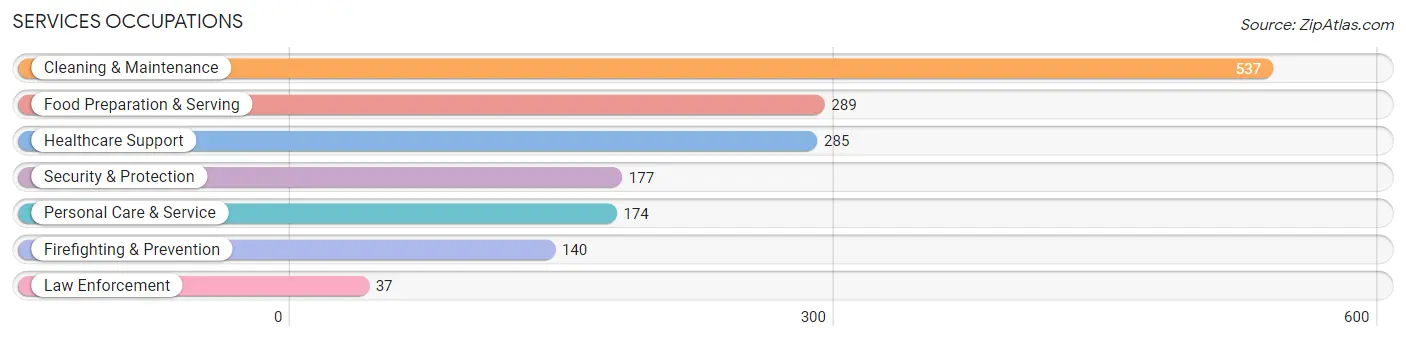
Services Occupations
The most common Services occupations in Mercer County are Cleaning & Maintenance (537 | 5.3%), Food Preparation & Serving (289 | 2.9%), Healthcare Support (285 | 2.8%), Security & Protection (177 | 1.8%), and Personal Care & Service (174 | 1.7%).
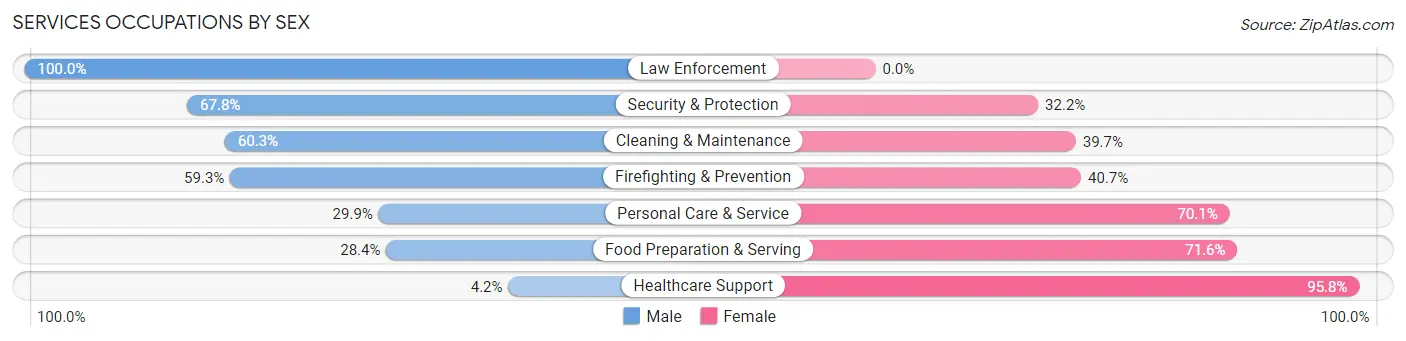
Services Occupations by Sex
Within the Services occupations in Mercer County, the most male-oriented occupations are Law Enforcement (100.0%), Security & Protection (67.8%), and Cleaning & Maintenance (60.3%), while the most female-oriented occupations are Healthcare Support (95.8%), Food Preparation & Serving (71.6%), and Personal Care & Service (70.1%).
| Occupation | Male | Female |
| Healthcare Support | 12 (4.2%) | 273 (95.8%) |
| Security & Protection | 120 (67.8%) | 57 (32.2%) |
| Firefighting & Prevention | 83 (59.3%) | 57 (40.7%) |
| Law Enforcement | 37 (100.0%) | 0 (0.0%) |
| Food Preparation & Serving | 82 (28.4%) | 207 (71.6%) |
| Cleaning & Maintenance | 324 (60.3%) | 213 (39.7%) |
| Personal Care & Service | 52 (29.9%) | 122 (70.1%) |
| Total (Category) | 590 (40.4%) | 872 (59.6%) |
| Total (Overall) | 5,365 (53.5%) | 4,664 (46.5%) |
Sales and Office Occupations
The most common Sales and Office occupations in Mercer County are Office & Administration (1,107 | 11.0%), and Sales & Related (634 | 6.3%).
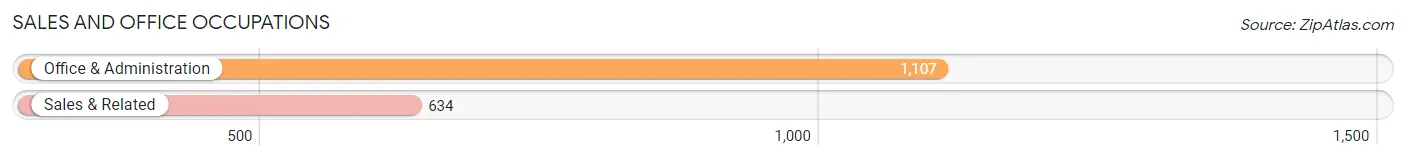
Sales and Office Occupations by Sex

| Occupation | Male | Female |
| Sales & Related | 380 (59.9%) | 254 (40.1%) |
| Office & Administration | 422 (38.1%) | 685 (61.9%) |
| Total (Category) | 802 (46.1%) | 939 (53.9%) |
| Total (Overall) | 5,365 (53.5%) | 4,664 (46.5%) |
Natural Resources, Construction and Maintenance Occupations
The most common Natural Resources, Construction and Maintenance occupations in Mercer County are Installation, Maintenance & Repair (429 | 4.3%), Construction & Extraction (422 | 4.2%), and Farming, Fishing & Forestry (166 | 1.7%).

Natural Resources, Construction and Maintenance Occupations by Sex
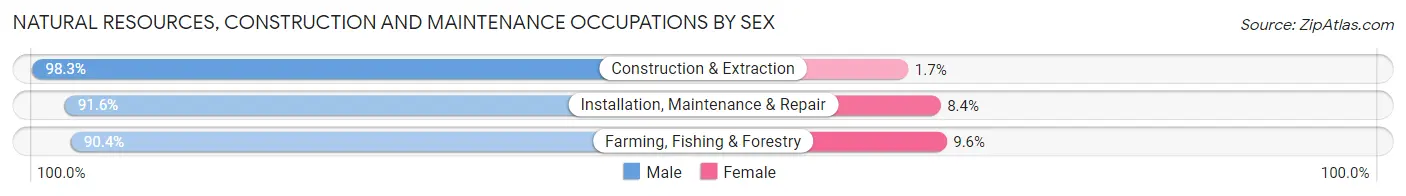
| Occupation | Male | Female |
| Farming, Fishing & Forestry | 150 (90.4%) | 16 (9.6%) |
| Construction & Extraction | 415 (98.3%) | 7 (1.7%) |
| Installation, Maintenance & Repair | 393 (91.6%) | 36 (8.4%) |
| Total (Category) | 958 (94.2%) | 59 (5.8%) |
| Total (Overall) | 5,365 (53.5%) | 4,664 (46.5%) |
Production, Transportation and Moving Occupations
The most common Production, Transportation and Moving occupations in Mercer County are Production (1,412 | 14.1%), Transportation (580 | 5.8%), and Material Moving (414 | 4.1%).
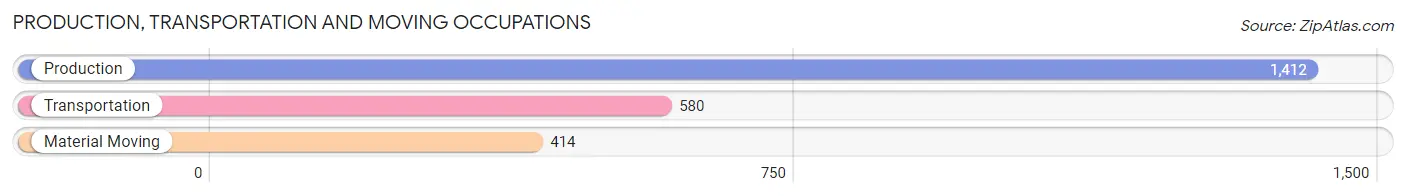
Production, Transportation and Moving Occupations by Sex
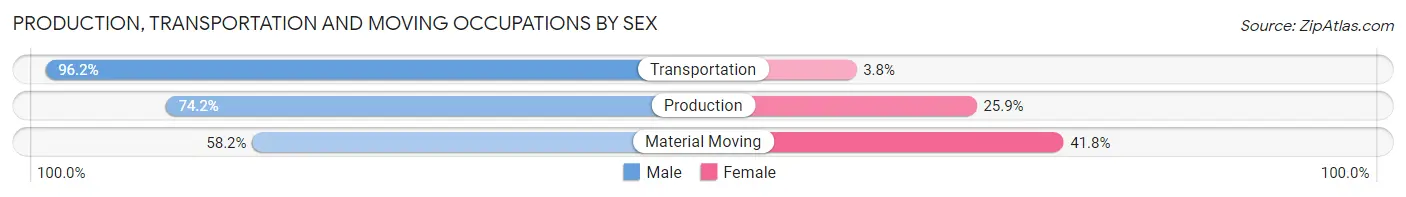
| Occupation | Male | Female |
| Production | 1,047 (74.2%) | 365 (25.9%) |
| Transportation | 558 (96.2%) | 22 (3.8%) |
| Material Moving | 241 (58.2%) | 173 (41.8%) |
| Total (Category) | 1,846 (76.7%) | 560 (23.3%) |
| Total (Overall) | 5,365 (53.5%) | 4,664 (46.5%) |
Employment Industries by Sex in Mercer County
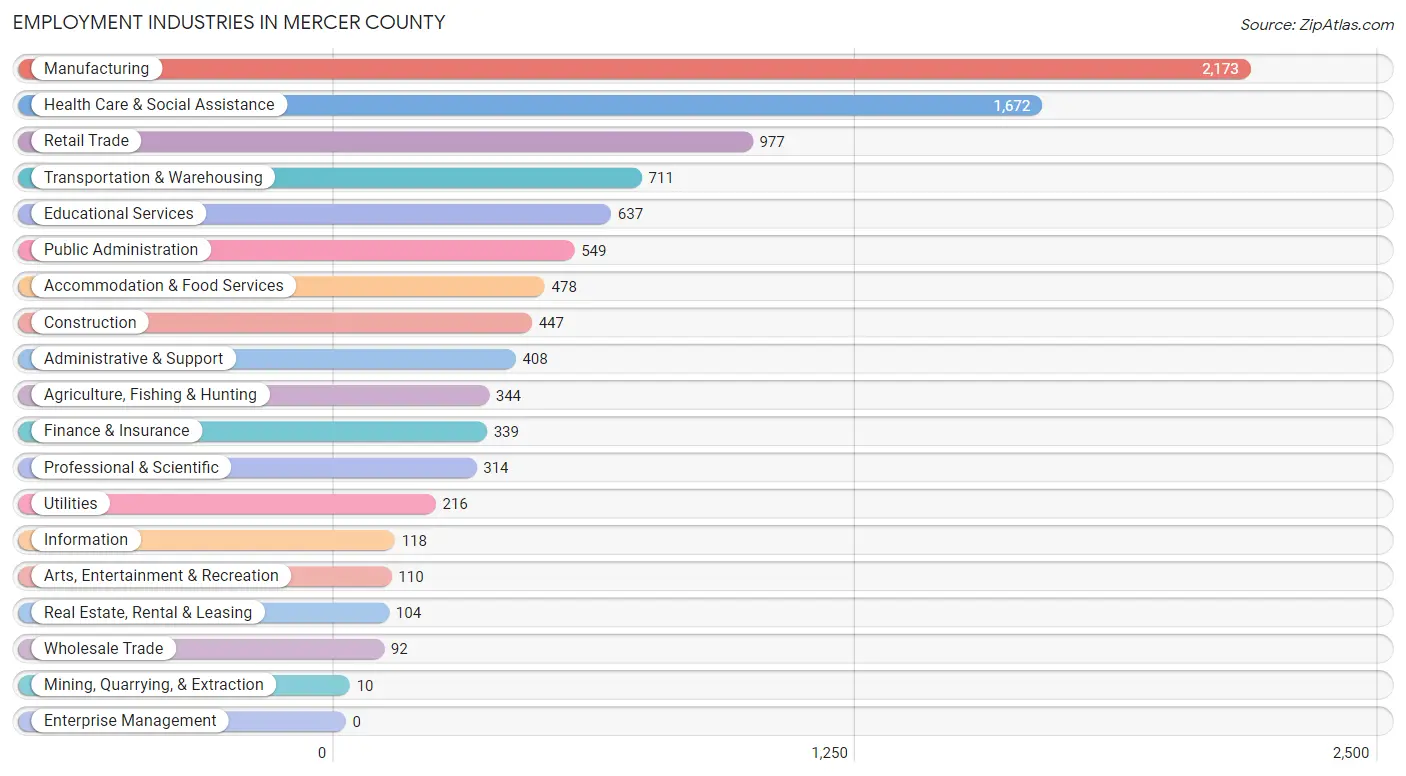
Employment Industries in Mercer County
The major employment industries in Mercer County include Manufacturing (2,173 | 21.7%), Health Care & Social Assistance (1,672 | 16.7%), Retail Trade (977 | 9.7%), Transportation & Warehousing (711 | 7.1%), and Educational Services (637 | 6.4%).
Employment Industries by Sex in Mercer County
The Mercer County industries that see more men than women are Mining, Quarrying, & Extraction (100.0%), Construction (92.4%), and Transportation & Warehousing (88.6%), whereas the industries that tend to have a higher number of women are Health Care & Social Assistance (83.0%), Educational Services (81.0%), and Real Estate, Rental & Leasing (75.0%).
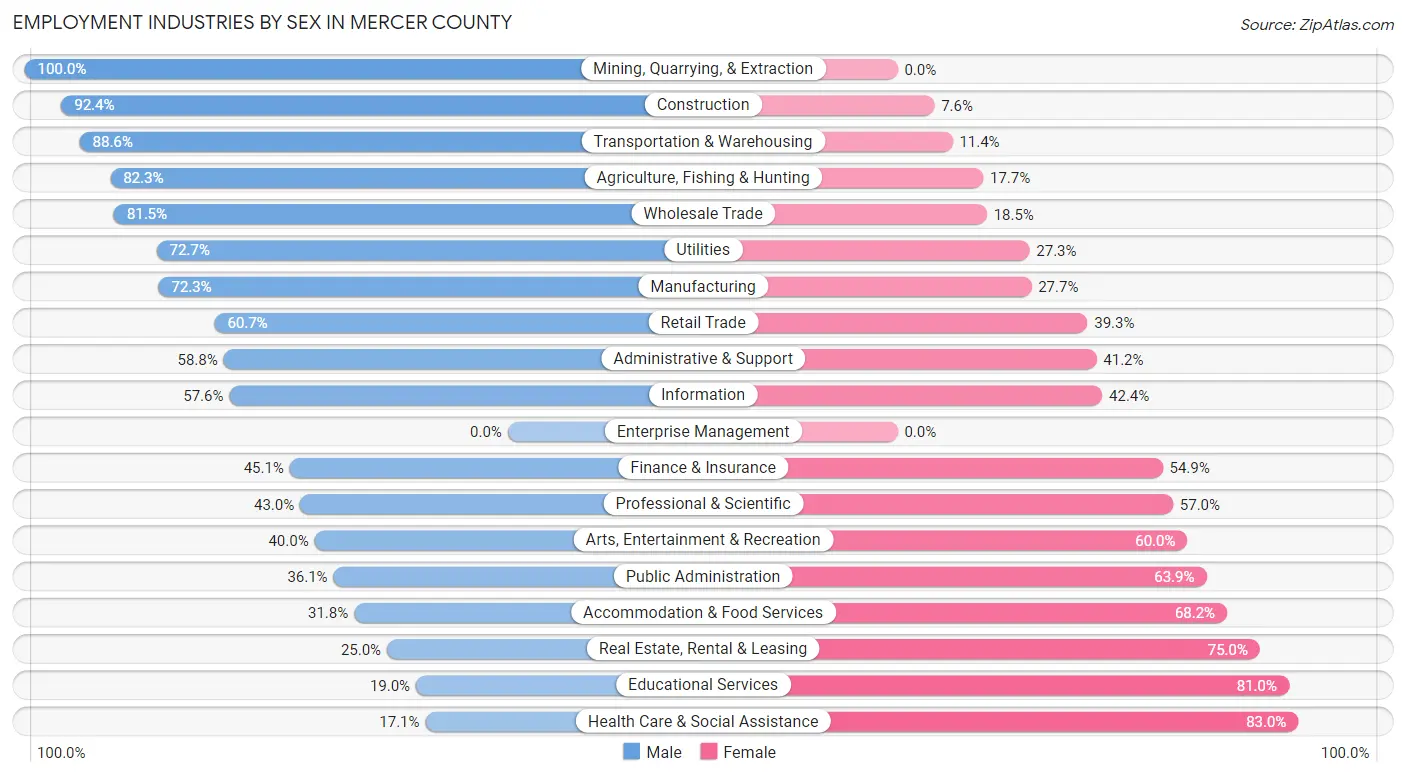
| Industry | Male | Female |
| Agriculture, Fishing & Hunting | 283 (82.3%) | 61 (17.7%) |
| Mining, Quarrying, & Extraction | 10 (100.0%) | 0 (0.0%) |
| Construction | 413 (92.4%) | 34 (7.6%) |
| Manufacturing | 1,571 (72.3%) | 602 (27.7%) |
| Wholesale Trade | 75 (81.5%) | 17 (18.5%) |
| Retail Trade | 593 (60.7%) | 384 (39.3%) |
| Transportation & Warehousing | 630 (88.6%) | 81 (11.4%) |
| Utilities | 157 (72.7%) | 59 (27.3%) |
| Information | 68 (57.6%) | 50 (42.4%) |
| Finance & Insurance | 153 (45.1%) | 186 (54.9%) |
| Real Estate, Rental & Leasing | 26 (25.0%) | 78 (75.0%) |
| Professional & Scientific | 135 (43.0%) | 179 (57.0%) |
| Enterprise Management | 0 (0.0%) | 0 (0.0%) |
| Administrative & Support | 240 (58.8%) | 168 (41.2%) |
| Educational Services | 121 (19.0%) | 516 (81.0%) |
| Health Care & Social Assistance | 285 (17.1%) | 1,387 (83.0%) |
| Arts, Entertainment & Recreation | 44 (40.0%) | 66 (60.0%) |
| Accommodation & Food Services | 152 (31.8%) | 326 (68.2%) |
| Public Administration | 198 (36.1%) | 351 (63.9%) |
| Total | 5,365 (53.5%) | 4,664 (46.5%) |
Education in Mercer County
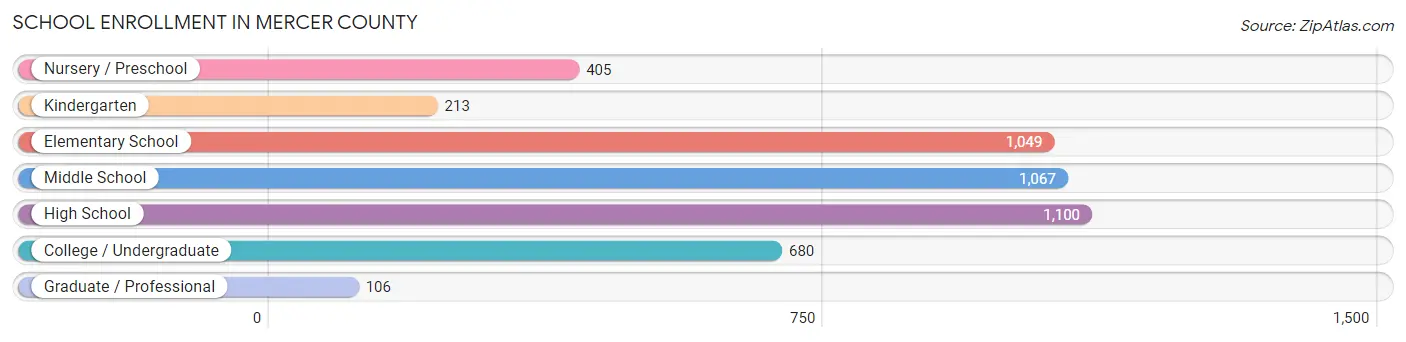
School Enrollment in Mercer County
The most common levels of schooling among the 4,620 students in Mercer County are high school (1,100 | 23.8%), middle school (1,067 | 23.1%), and elementary school (1,049 | 22.7%).
| School Level | # Students | % Students |
| Nursery / Preschool | 405 | 8.8% |
| Kindergarten | 213 | 4.6% |
| Elementary School | 1,049 | 22.7% |
| Middle School | 1,067 | 23.1% |
| High School | 1,100 | 23.8% |
| College / Undergraduate | 680 | 14.7% |
| Graduate / Professional | 106 | 2.3% |
| Total | 4,620 | 100.0% |
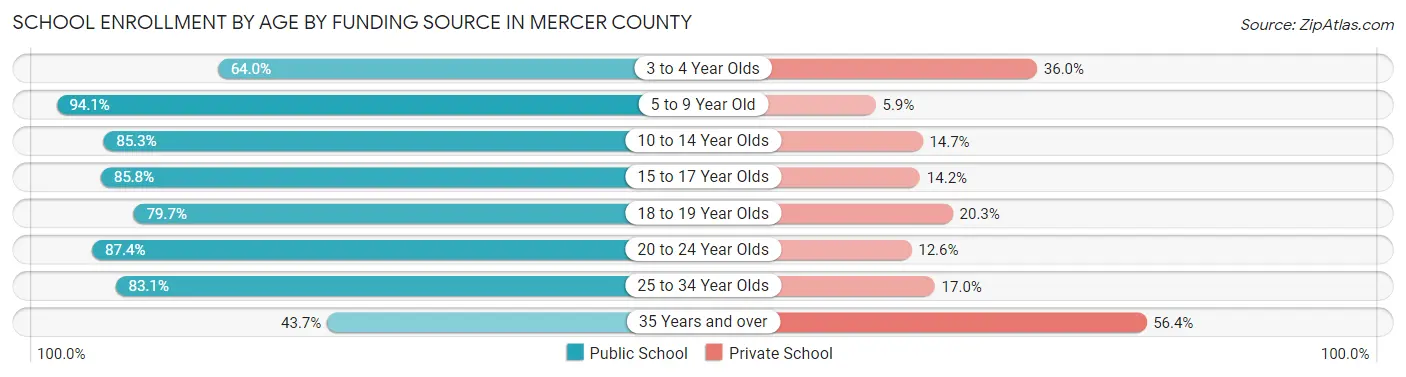
School Enrollment by Age by Funding Source in Mercer County
Out of a total of 4,620 students who are enrolled in schools in Mercer County, 679 (14.7%) attend a private institution, while the remaining 3,941 (85.3%) are enrolled in public schools. The age group of 35 years and over has the highest likelihood of being enrolled in private schools, with 102 (56.4% in the age bracket) enrolled. Conversely, the age group of 5 to 9 year old has the lowest likelihood of being enrolled in a private school, with 1,331 (94.1% in the age bracket) attending a public institution.
| Age Bracket | Public School | Private School |
| 3 to 4 Year Olds | 105 (64.0%) | 59 (36.0%) |
| 5 to 9 Year Old | 1,331 (94.1%) | 84 (5.9%) |
| 10 to 14 Year Olds | 1,024 (85.3%) | 176 (14.7%) |
| 15 to 17 Year Olds | 683 (85.8%) | 113 (14.2%) |
| 18 to 19 Year Olds | 279 (79.7%) | 71 (20.3%) |
| 20 to 24 Year Olds | 243 (87.4%) | 35 (12.6%) |
| 25 to 34 Year Olds | 196 (83.1%) | 40 (17.0%) |
| 35 Years and over | 79 (43.6%) | 102 (56.4%) |
| Total | 3,941 (85.3%) | 679 (14.7%) |
Educational Attainment by Field of Study in Mercer County
Education (767 | 21.0%), business (611 | 16.7%), science & technology (465 | 12.7%), arts & humanities (394 | 10.8%), and engineering (366 | 10.0%) are the most common fields of study among 3,659 individuals in Mercer County who have obtained a bachelor's degree or higher.
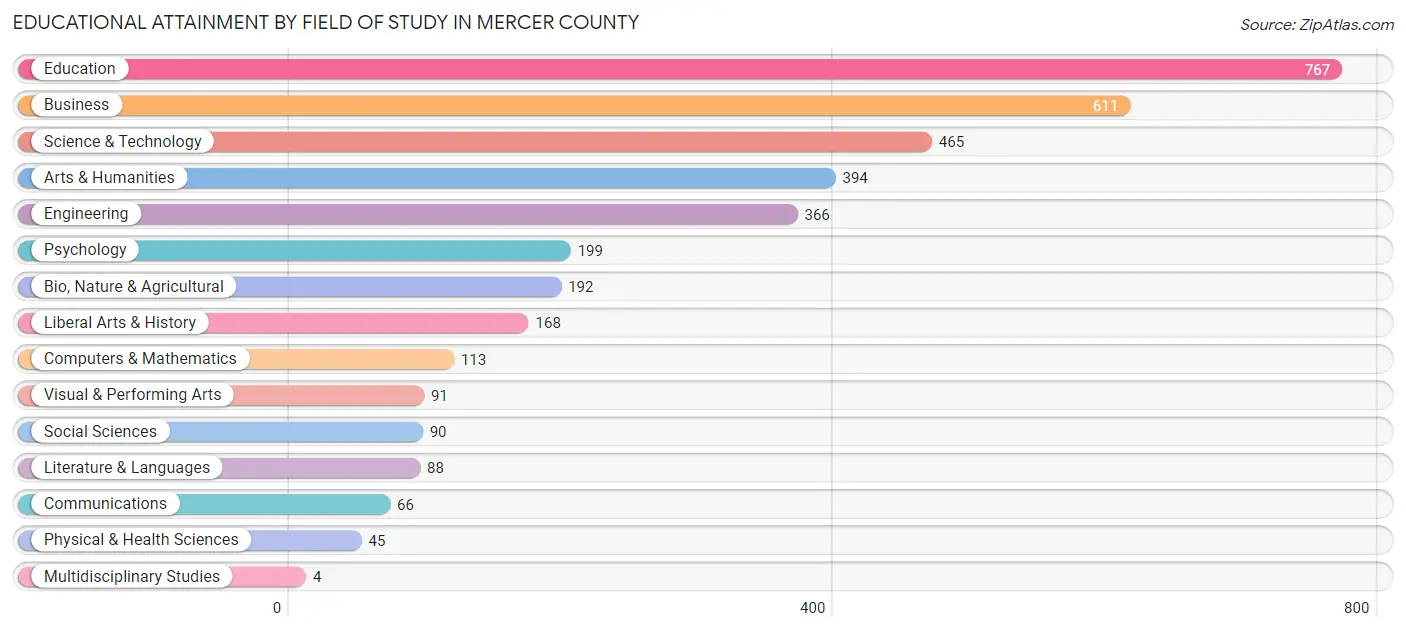
| Field of Study | # Graduates | % Graduates |
| Computers & Mathematics | 113 | 3.1% |
| Bio, Nature & Agricultural | 192 | 5.2% |
| Physical & Health Sciences | 45 | 1.2% |
| Psychology | 199 | 5.4% |
| Social Sciences | 90 | 2.5% |
| Engineering | 366 | 10.0% |
| Multidisciplinary Studies | 4 | 0.1% |
| Science & Technology | 465 | 12.7% |
| Business | 611 | 16.7% |
| Education | 767 | 21.0% |
| Literature & Languages | 88 | 2.4% |
| Liberal Arts & History | 168 | 4.6% |
| Visual & Performing Arts | 91 | 2.5% |
| Communications | 66 | 1.8% |
| Arts & Humanities | 394 | 10.8% |
| Total | 3,659 | 100.0% |
Transportation & Commute in Mercer County
Vehicle Availability by Sex in Mercer County
The most prevalent vehicle ownership categories in Mercer County are males with 2 vehicles (1,880, accounting for 35.2%) and females with 2 vehicles (1,666, making up 40.8%).
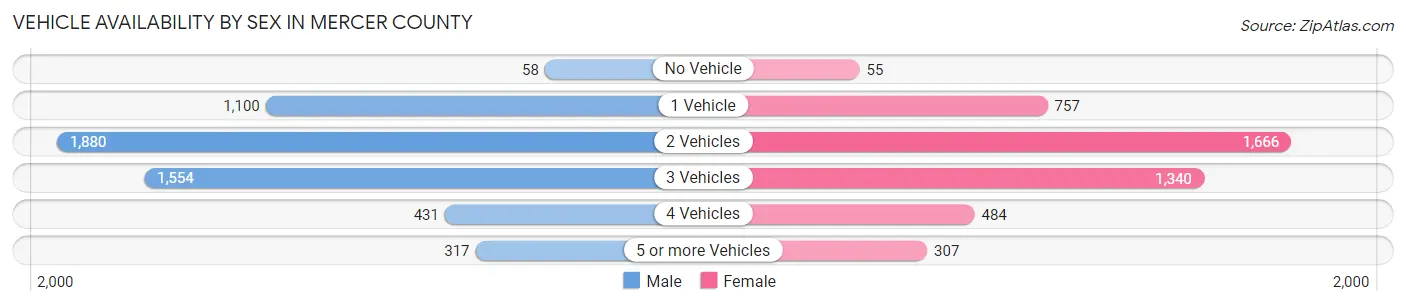
| Vehicles Available | Male | Female |
| No Vehicle | 58 (1.1%) | 55 (1.2%) |
| 1 Vehicle | 1,100 (20.6%) | 757 (16.4%) |
| 2 Vehicles | 1,880 (35.2%) | 1,666 (36.1%) |
| 3 Vehicles | 1,554 (29.1%) | 1,340 (29.1%) |
| 4 Vehicles | 431 (8.1%) | 484 (10.5%) |
| 5 or more Vehicles | 317 (5.9%) | 307 (6.7%) |
| Total | 5,340 (100.0%) | 4,609 (100.0%) |
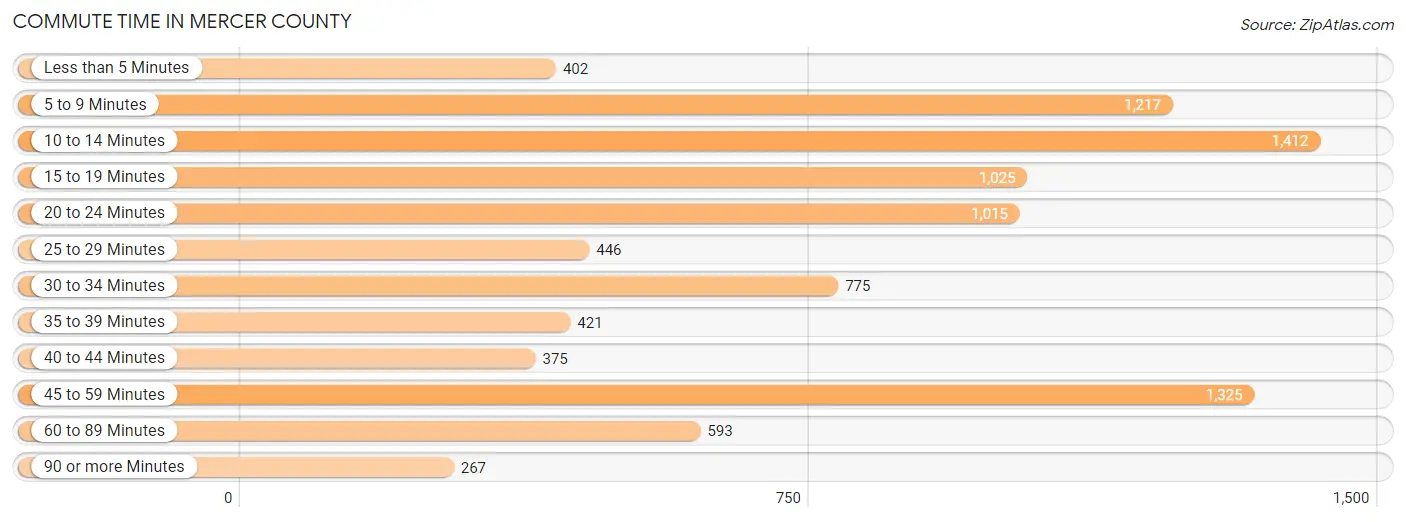
Commute Time in Mercer County
The most frequently occuring commute durations in Mercer County are 10 to 14 minutes (1,412 commuters, 15.2%), 45 to 59 minutes (1,325 commuters, 14.3%), and 5 to 9 minutes (1,217 commuters, 13.1%).
| Commute Time | # Commuters | % Commuters |
| Less than 5 Minutes | 402 | 4.3% |
| 5 to 9 Minutes | 1,217 | 13.1% |
| 10 to 14 Minutes | 1,412 | 15.2% |
| 15 to 19 Minutes | 1,025 | 11.1% |
| 20 to 24 Minutes | 1,015 | 11.0% |
| 25 to 29 Minutes | 446 | 4.8% |
| 30 to 34 Minutes | 775 | 8.4% |
| 35 to 39 Minutes | 421 | 4.5% |
| 40 to 44 Minutes | 375 | 4.0% |
| 45 to 59 Minutes | 1,325 | 14.3% |
| 60 to 89 Minutes | 593 | 6.4% |
| 90 or more Minutes | 267 | 2.9% |
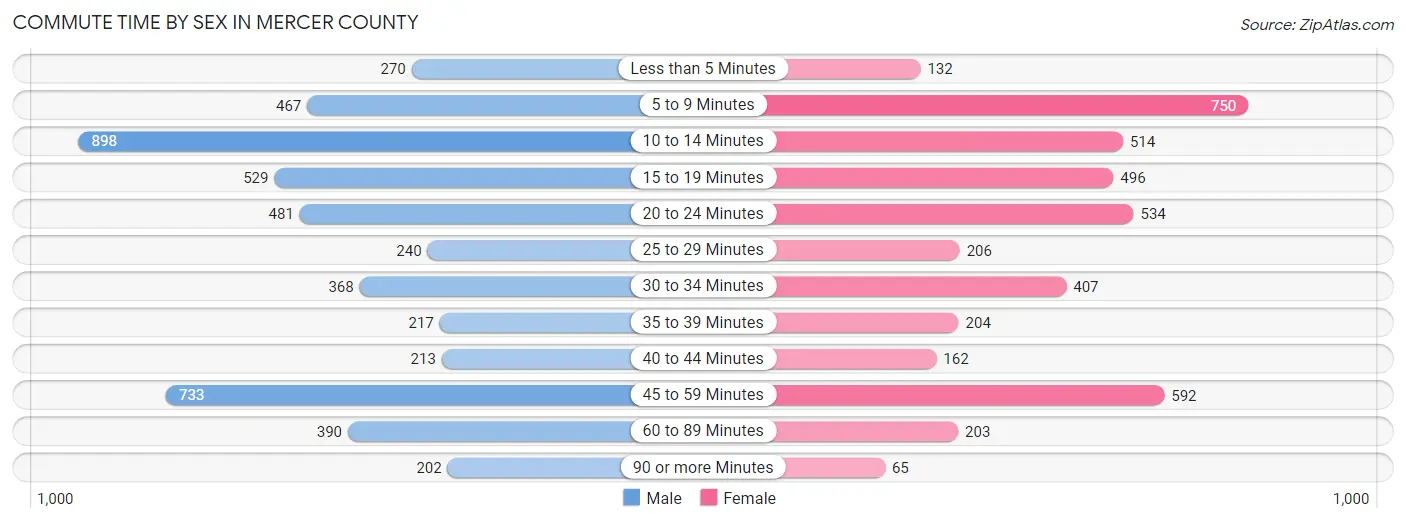
Commute Time by Sex in Mercer County
The most common commute times in Mercer County are 10 to 14 minutes (898 commuters, 17.9%) for males and 5 to 9 minutes (750 commuters, 17.6%) for females.
| Commute Time | Male | Female |
| Less than 5 Minutes | 270 (5.4%) | 132 (3.1%) |
| 5 to 9 Minutes | 467 (9.3%) | 750 (17.6%) |
| 10 to 14 Minutes | 898 (17.9%) | 514 (12.0%) |
| 15 to 19 Minutes | 529 (10.6%) | 496 (11.6%) |
| 20 to 24 Minutes | 481 (9.6%) | 534 (12.5%) |
| 25 to 29 Minutes | 240 (4.8%) | 206 (4.8%) |
| 30 to 34 Minutes | 368 (7.3%) | 407 (9.5%) |
| 35 to 39 Minutes | 217 (4.3%) | 204 (4.8%) |
| 40 to 44 Minutes | 213 (4.3%) | 162 (3.8%) |
| 45 to 59 Minutes | 733 (14.6%) | 592 (13.9%) |
| 60 to 89 Minutes | 390 (7.8%) | 203 (4.8%) |
| 90 or more Minutes | 202 (4.0%) | 65 (1.5%) |
Time of Departure to Work by Sex in Mercer County
The most frequent times of departure to work in Mercer County are 7:00 AM to 7:29 AM (975, 19.5%) for males and 7:00 AM to 7:29 AM (648, 15.2%) for females.
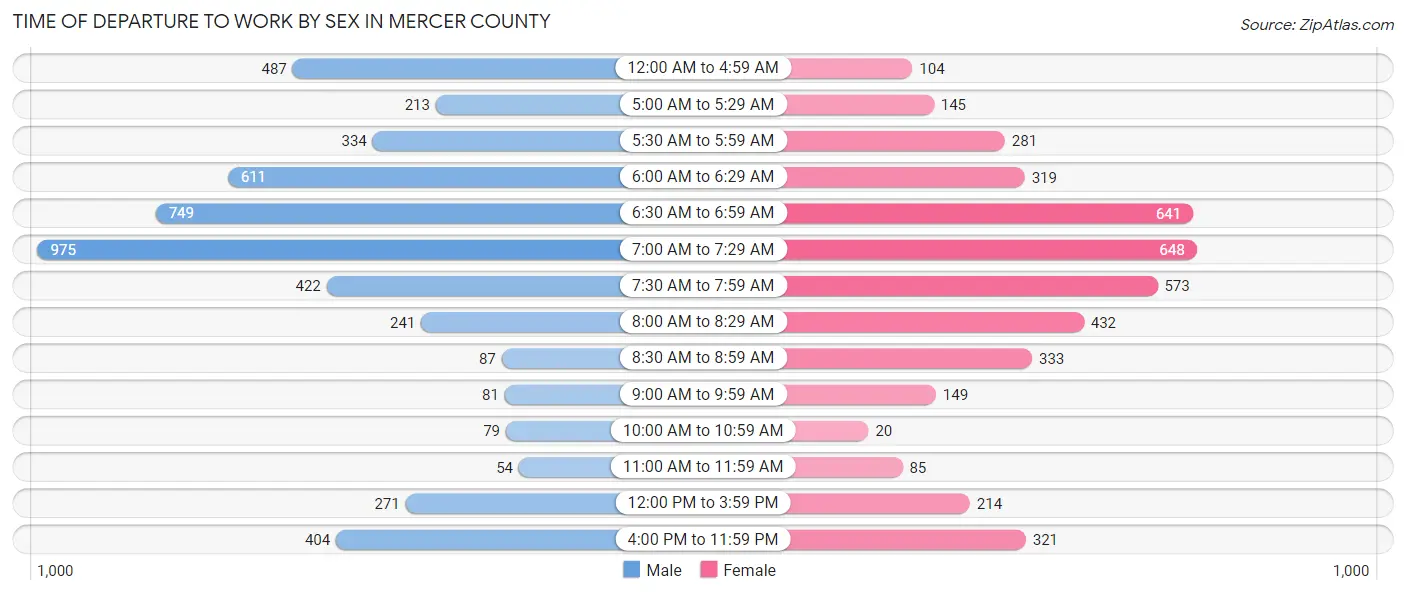
| Time of Departure | Male | Female |
| 12:00 AM to 4:59 AM | 487 (9.7%) | 104 (2.4%) |
| 5:00 AM to 5:29 AM | 213 (4.3%) | 145 (3.4%) |
| 5:30 AM to 5:59 AM | 334 (6.7%) | 281 (6.6%) |
| 6:00 AM to 6:29 AM | 611 (12.2%) | 319 (7.5%) |
| 6:30 AM to 6:59 AM | 749 (15.0%) | 641 (15.0%) |
| 7:00 AM to 7:29 AM | 975 (19.5%) | 648 (15.2%) |
| 7:30 AM to 7:59 AM | 422 (8.4%) | 573 (13.4%) |
| 8:00 AM to 8:29 AM | 241 (4.8%) | 432 (10.1%) |
| 8:30 AM to 8:59 AM | 87 (1.7%) | 333 (7.8%) |
| 9:00 AM to 9:59 AM | 81 (1.6%) | 149 (3.5%) |
| 10:00 AM to 10:59 AM | 79 (1.6%) | 20 (0.5%) |
| 11:00 AM to 11:59 AM | 54 (1.1%) | 85 (2.0%) |
| 12:00 PM to 3:59 PM | 271 (5.4%) | 214 (5.0%) |
| 4:00 PM to 11:59 PM | 404 (8.1%) | 321 (7.5%) |
| Total | 5,008 (100.0%) | 4,265 (100.0%) |
Housing Occupancy in Mercer County
Occupancy by Ownership in Mercer County
Of the total 9,079 dwellings in Mercer County, owner-occupied units account for 6,756 (74.4%), while renter-occupied units make up 2,323 (25.6%).
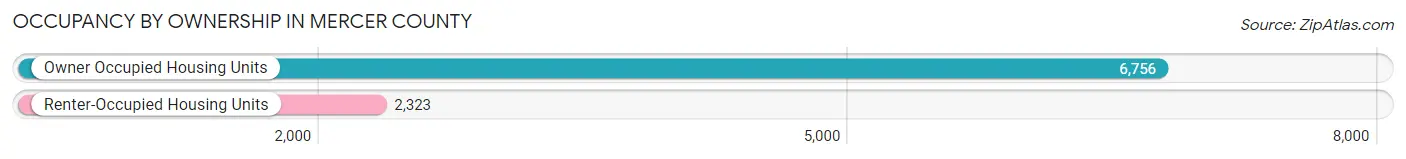
| Occupancy | # Housing Units | % Housing Units |
| Owner Occupied Housing Units | 6,756 | 74.4% |
| Renter-Occupied Housing Units | 2,323 | 25.6% |
| Total Occupied Housing Units | 9,079 | 100.0% |
Occupancy by Household Size in Mercer County
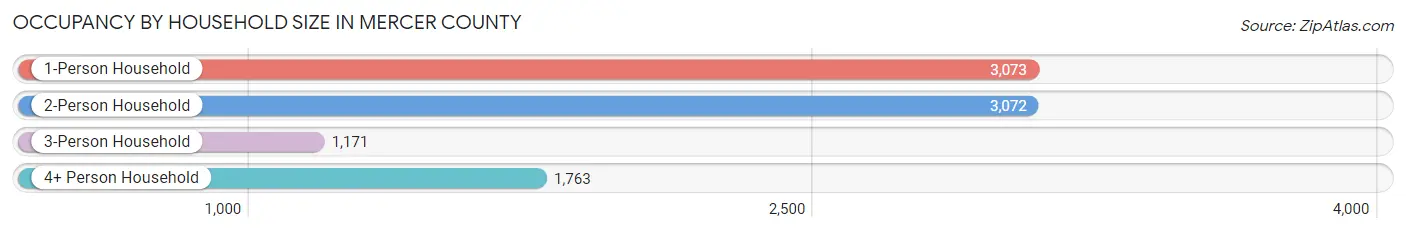
| Household Size | # Housing Units | % Housing Units |
| 1-Person Household | 3,073 | 33.9% |
| 2-Person Household | 3,072 | 33.8% |
| 3-Person Household | 1,171 | 12.9% |
| 4+ Person Household | 1,763 | 19.4% |
| Total Housing Units | 9,079 | 100.0% |
Occupancy by Ownership by Household Size in Mercer County
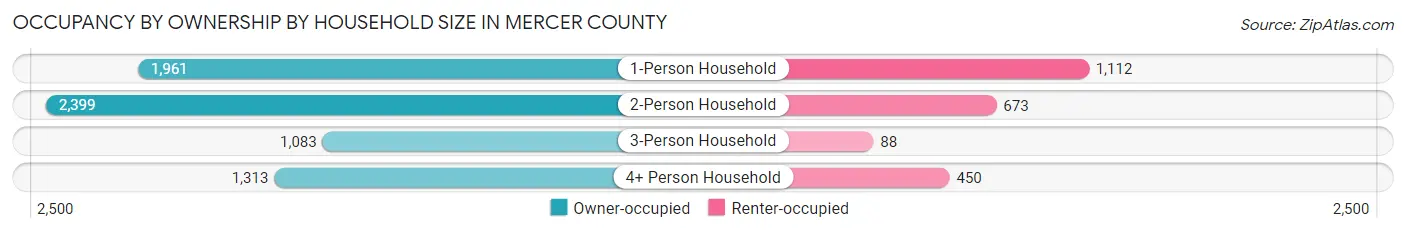
| Household Size | Owner-occupied | Renter-occupied |
| 1-Person Household | 1,961 (63.8%) | 1,112 (36.2%) |
| 2-Person Household | 2,399 (78.1%) | 673 (21.9%) |
| 3-Person Household | 1,083 (92.5%) | 88 (7.5%) |
| 4+ Person Household | 1,313 (74.5%) | 450 (25.5%) |
| Total Housing Units | 6,756 (74.4%) | 2,323 (25.6%) |
Occupancy by Educational Attainment in Mercer County
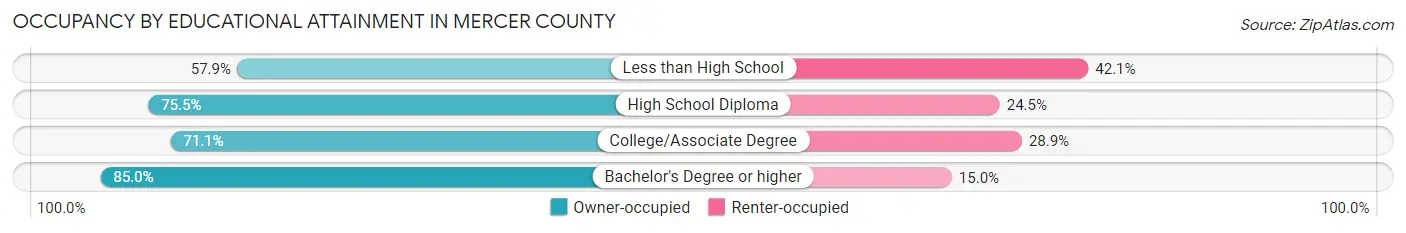
| Household Size | Owner-occupied | Renter-occupied |
| Less than High School | 442 (57.9%) | 321 (42.1%) |
| High School Diploma | 2,230 (75.5%) | 724 (24.5%) |
| College/Associate Degree | 2,421 (71.1%) | 984 (28.9%) |
| Bachelor's Degree or higher | 1,663 (85.0%) | 294 (15.0%) |
Occupancy by Age of Householder in Mercer County
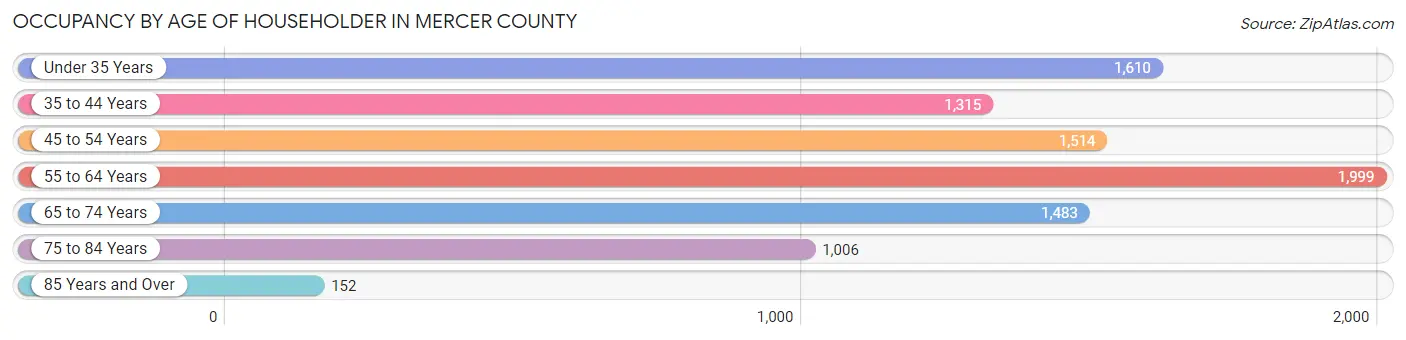
| Age Bracket | # Households | % Households |
| Under 35 Years | 1,610 | 17.7% |
| 35 to 44 Years | 1,315 | 14.5% |
| 45 to 54 Years | 1,514 | 16.7% |
| 55 to 64 Years | 1,999 | 22.0% |
| 65 to 74 Years | 1,483 | 16.3% |
| 75 to 84 Years | 1,006 | 11.1% |
| 85 Years and Over | 152 | 1.7% |
| Total | 9,079 | 100.0% |
Housing Finances in Mercer County
Median Income by Occupancy in Mercer County
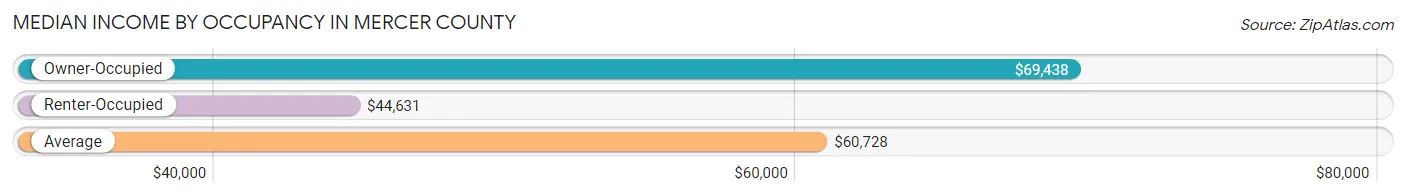
| Occupancy Type | # Households | Median Income |
| Owner-Occupied | 6,756 (74.4%) | $69,438 |
| Renter-Occupied | 2,323 (25.6%) | $44,631 |
| Average | 9,079 (100.0%) | $60,728 |
Occupancy by Householder Income Bracket in Mercer County
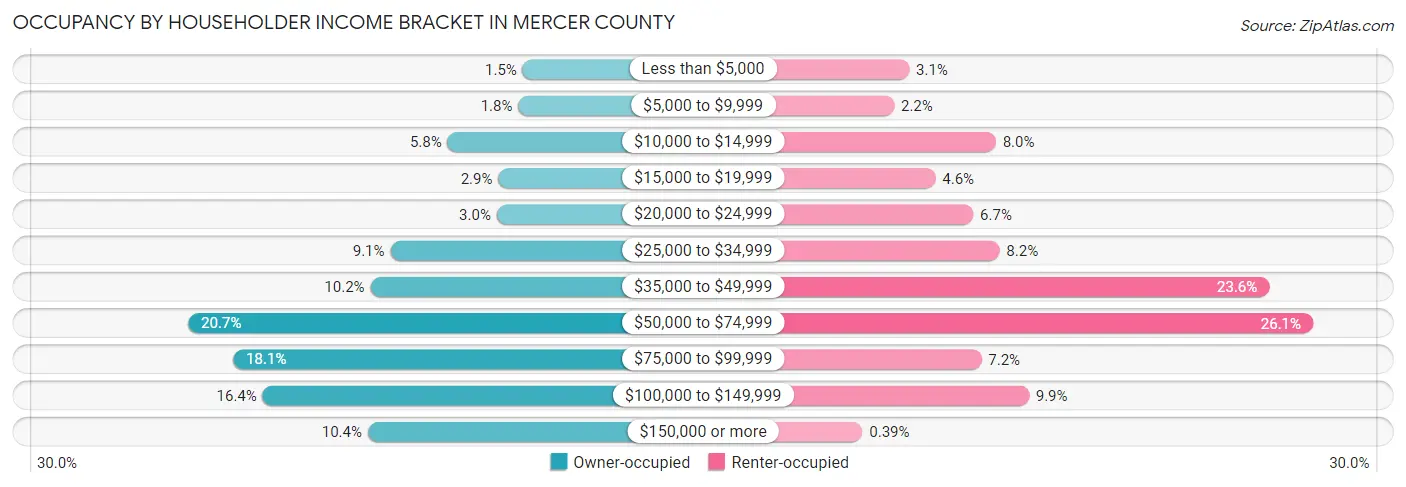
| Income Bracket | Owner-occupied | Renter-occupied |
| Less than $5,000 | 104 (1.5%) | 71 (3.1%) |
| $5,000 to $9,999 | 121 (1.8%) | 51 (2.2%) |
| $10,000 to $14,999 | 394 (5.8%) | 186 (8.0%) |
| $15,000 to $19,999 | 198 (2.9%) | 106 (4.6%) |
| $20,000 to $24,999 | 204 (3.0%) | 156 (6.7%) |
| $25,000 to $34,999 | 615 (9.1%) | 191 (8.2%) |
| $35,000 to $49,999 | 692 (10.2%) | 549 (23.6%) |
| $50,000 to $74,999 | 1,396 (20.7%) | 607 (26.1%) |
| $75,000 to $99,999 | 1,222 (18.1%) | 167 (7.2%) |
| $100,000 to $149,999 | 1,108 (16.4%) | 230 (9.9%) |
| $150,000 or more | 702 (10.4%) | 9 (0.4%) |
| Total | 6,756 (100.0%) | 2,323 (100.0%) |
Monthly Housing Cost Tiers in Mercer County
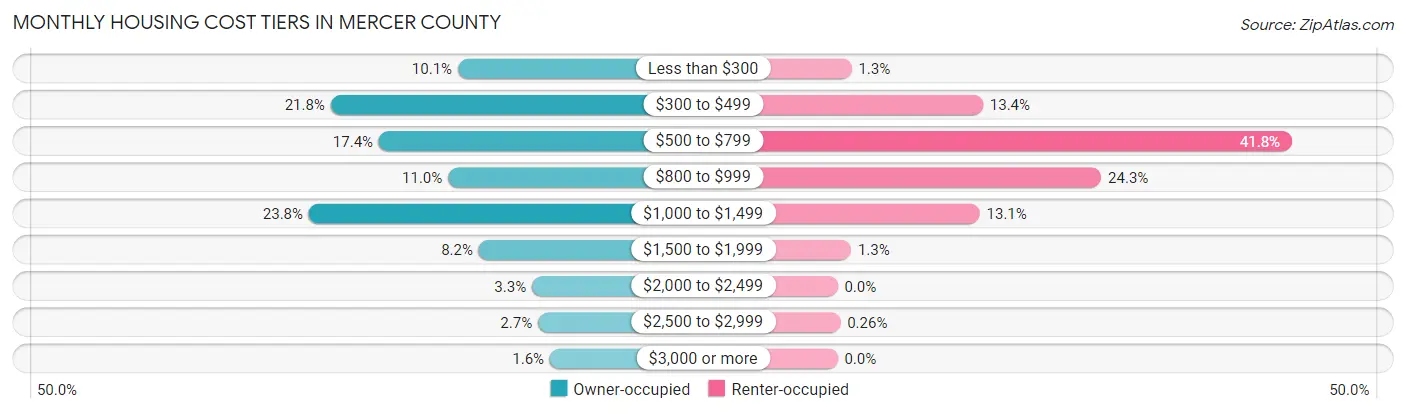
| Monthly Cost | Owner-occupied | Renter-occupied |
| Less than $300 | 683 (10.1%) | 30 (1.3%) |
| $300 to $499 | 1,474 (21.8%) | 311 (13.4%) |
| $500 to $799 | 1,174 (17.4%) | 972 (41.8%) |
| $800 to $999 | 744 (11.0%) | 564 (24.3%) |
| $1,000 to $1,499 | 1,610 (23.8%) | 304 (13.1%) |
| $1,500 to $1,999 | 553 (8.2%) | 29 (1.3%) |
| $2,000 to $2,499 | 222 (3.3%) | 0 (0.0%) |
| $2,500 to $2,999 | 185 (2.7%) | 6 (0.3%) |
| $3,000 or more | 111 (1.6%) | 0 (0.0%) |
| Total | 6,756 (100.0%) | 2,323 (100.0%) |
Physical Housing Characteristics in Mercer County
Housing Structures in Mercer County
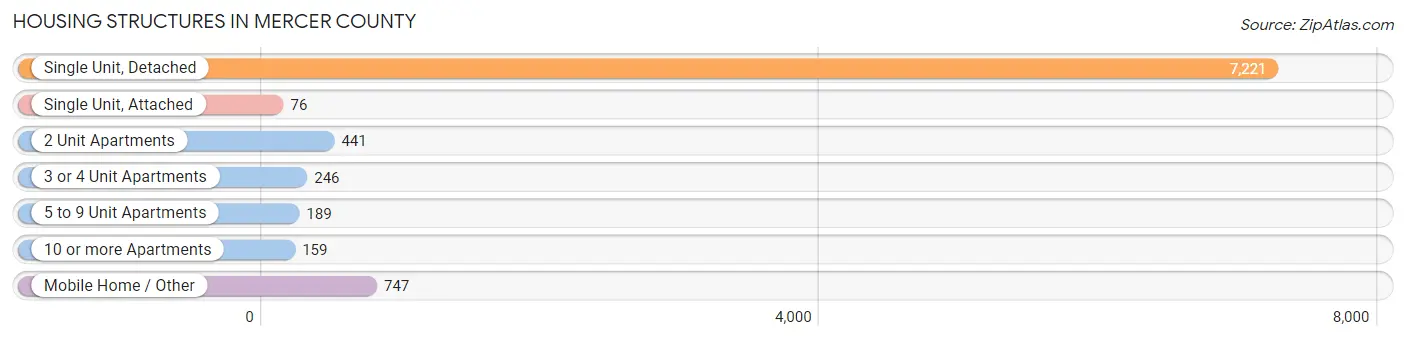
| Structure Type | # Housing Units | % Housing Units |
| Single Unit, Detached | 7,221 | 79.5% |
| Single Unit, Attached | 76 | 0.8% |
| 2 Unit Apartments | 441 | 4.9% |
| 3 or 4 Unit Apartments | 246 | 2.7% |
| 5 to 9 Unit Apartments | 189 | 2.1% |
| 10 or more Apartments | 159 | 1.8% |
| Mobile Home / Other | 747 | 8.2% |
| Total | 9,079 | 100.0% |
Housing Structures by Occupancy in Mercer County
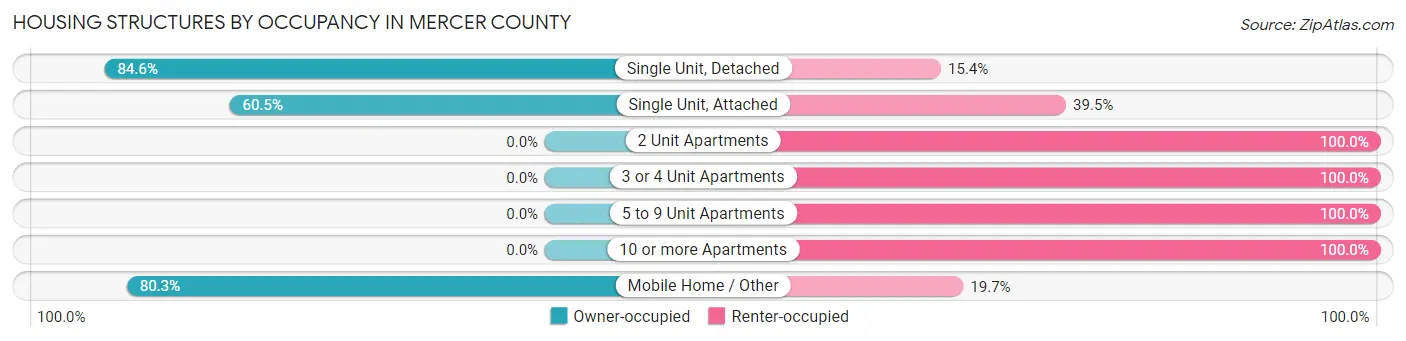
| Structure Type | Owner-occupied | Renter-occupied |
| Single Unit, Detached | 6,110 (84.6%) | 1,111 (15.4%) |
| Single Unit, Attached | 46 (60.5%) | 30 (39.5%) |
| 2 Unit Apartments | 0 (0.0%) | 441 (100.0%) |
| 3 or 4 Unit Apartments | 0 (0.0%) | 246 (100.0%) |
| 5 to 9 Unit Apartments | 0 (0.0%) | 189 (100.0%) |
| 10 or more Apartments | 0 (0.0%) | 159 (100.0%) |
| Mobile Home / Other | 600 (80.3%) | 147 (19.7%) |
| Total | 6,756 (74.4%) | 2,323 (25.6%) |
Housing Structures by Number of Rooms in Mercer County
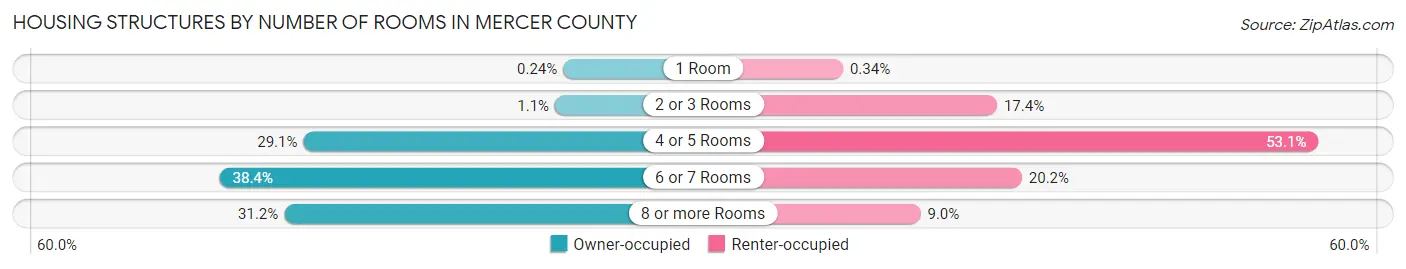
| Number of Rooms | Owner-occupied | Renter-occupied |
| 1 Room | 16 (0.2%) | 8 (0.3%) |
| 2 or 3 Rooms | 77 (1.1%) | 405 (17.4%) |
| 4 or 5 Rooms | 1,964 (29.1%) | 1,233 (53.1%) |
| 6 or 7 Rooms | 2,591 (38.4%) | 469 (20.2%) |
| 8 or more Rooms | 2,108 (31.2%) | 208 (8.9%) |
| Total | 6,756 (100.0%) | 2,323 (100.0%) |
Housing Structure by Heating Type in Mercer County
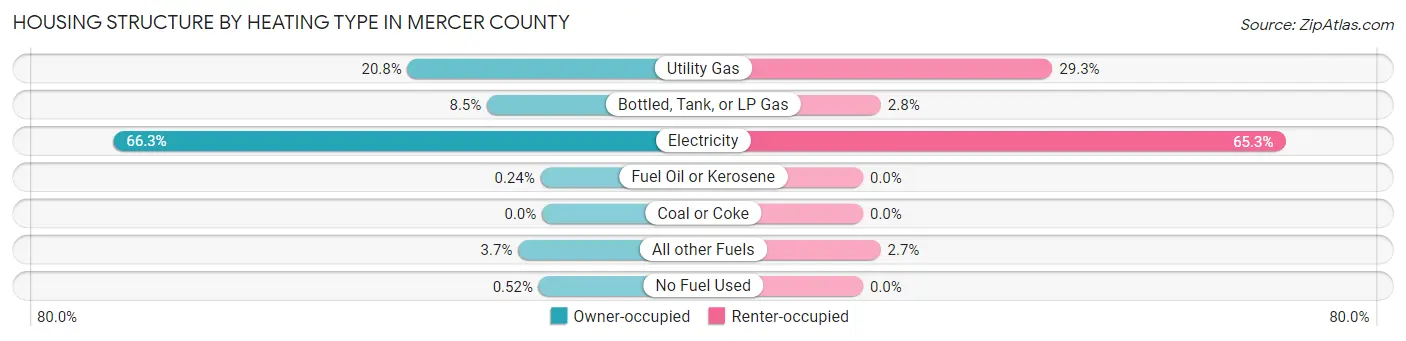
| Heating Type | Owner-occupied | Renter-occupied |
| Utility Gas | 1,405 (20.8%) | 680 (29.3%) |
| Bottled, Tank, or LP Gas | 574 (8.5%) | 64 (2.8%) |
| Electricity | 4,477 (66.3%) | 1,516 (65.3%) |
| Fuel Oil or Kerosene | 16 (0.2%) | 0 (0.0%) |
| Coal or Coke | 0 (0.0%) | 0 (0.0%) |
| All other Fuels | 249 (3.7%) | 63 (2.7%) |
| No Fuel Used | 35 (0.5%) | 0 (0.0%) |
| Total | 6,756 (100.0%) | 2,323 (100.0%) |
Household Vehicle Usage in Mercer County
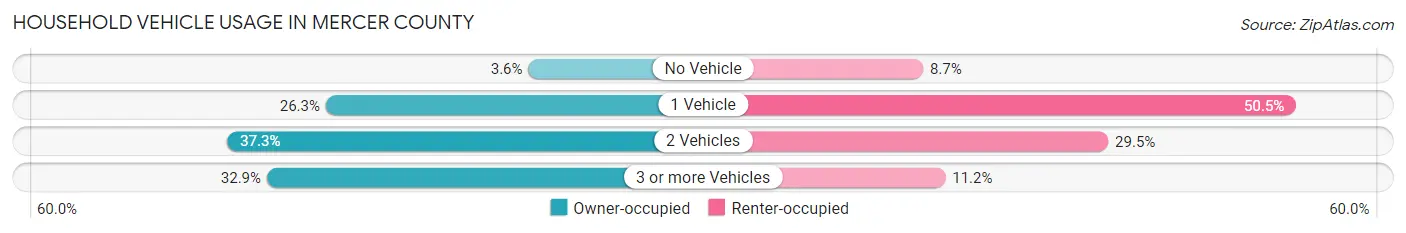
| Vehicles per Household | Owner-occupied | Renter-occupied |
| No Vehicle | 241 (3.6%) | 203 (8.7%) |
| 1 Vehicle | 1,774 (26.3%) | 1,174 (50.5%) |
| 2 Vehicles | 2,521 (37.3%) | 685 (29.5%) |
| 3 or more Vehicles | 2,220 (32.9%) | 261 (11.2%) |
| Total | 6,756 (100.0%) | 2,323 (100.0%) |
Real Estate & Mortgages in Mercer County
Real Estate and Mortgage Overview in Mercer County
| Characteristic | Without Mortgage | With Mortgage |
| Housing Units | 3,001 | 3,755 |
| Median Property Value | $172,800 | $186,300 |
| Median Household Income | $55,846 | $463 |
| Monthly Housing Costs | $424 | $111 |
| Real Estate Taxes | $1,341 | $160 |
Property Value by Mortgage Status in Mercer County
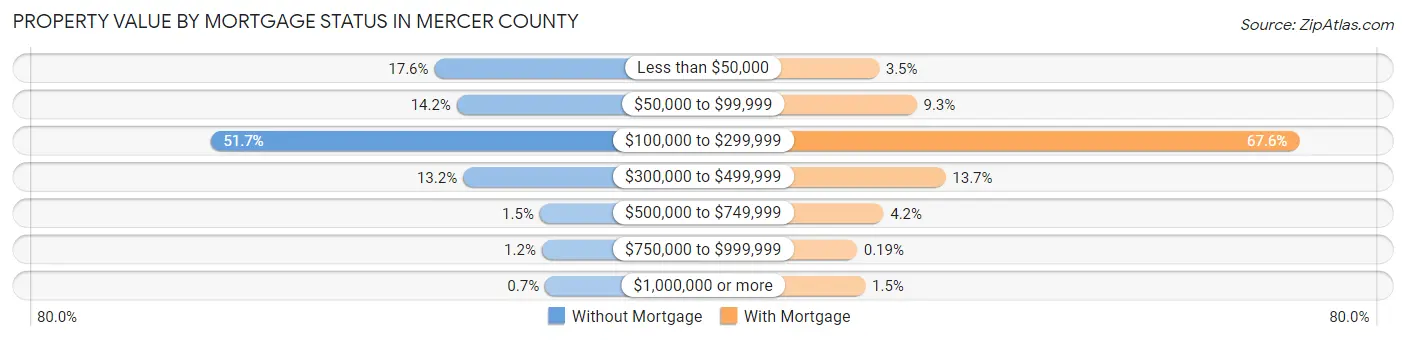
| Property Value | Without Mortgage | With Mortgage |
| Less than $50,000 | 527 (17.6%) | 133 (3.5%) |
| $50,000 to $99,999 | 425 (14.2%) | 349 (9.3%) |
| $100,000 to $299,999 | 1,551 (51.7%) | 2,538 (67.6%) |
| $300,000 to $499,999 | 396 (13.2%) | 514 (13.7%) |
| $500,000 to $749,999 | 45 (1.5%) | 159 (4.2%) |
| $750,000 to $999,999 | 36 (1.2%) | 7 (0.2%) |
| $1,000,000 or more | 21 (0.7%) | 55 (1.5%) |
| Total | 3,001 (100.0%) | 3,755 (100.0%) |
Household Income by Mortgage Status in Mercer County
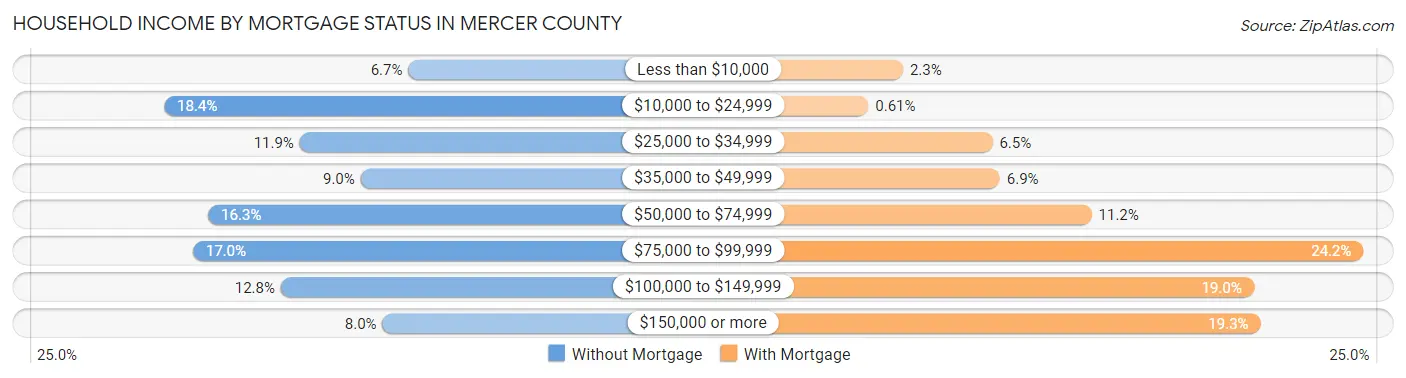
| Household Income | Without Mortgage | With Mortgage |
| Less than $10,000 | 202 (6.7%) | 85 (2.3%) |
| $10,000 to $24,999 | 551 (18.4%) | 23 (0.6%) |
| $25,000 to $34,999 | 357 (11.9%) | 245 (6.5%) |
| $35,000 to $49,999 | 270 (9.0%) | 258 (6.9%) |
| $50,000 to $74,999 | 488 (16.3%) | 422 (11.2%) |
| $75,000 to $99,999 | 510 (17.0%) | 908 (24.2%) |
| $100,000 to $149,999 | 384 (12.8%) | 712 (19.0%) |
| $150,000 or more | 239 (8.0%) | 724 (19.3%) |
| Total | 3,001 (100.0%) | 3,755 (100.0%) |
Property Value to Household Income Ratio in Mercer County
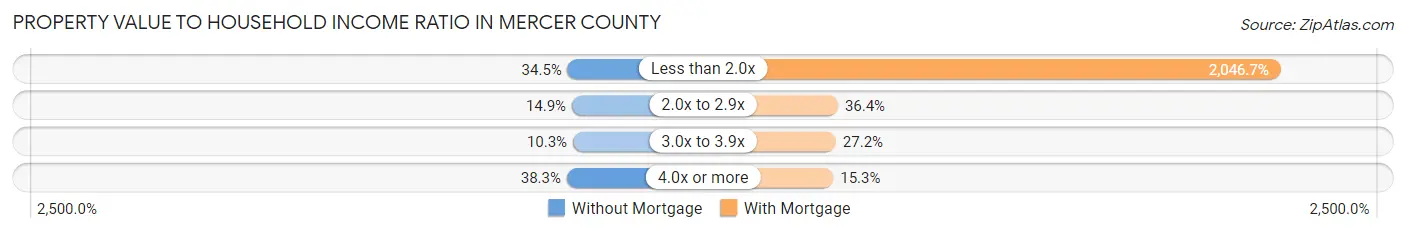
| Value-to-Income Ratio | Without Mortgage | With Mortgage |
| Less than 2.0x | 1,035 (34.5%) | 76,853 (2,046.7%) |
| 2.0x to 2.9x | 446 (14.9%) | 1,367 (36.4%) |
| 3.0x to 3.9x | 310 (10.3%) | 1,023 (27.2%) |
| 4.0x or more | 1,148 (38.3%) | 574 (15.3%) |
| Total | 3,001 (100.0%) | 3,755 (100.0%) |
Real Estate Taxes by Mortgage Status in Mercer County
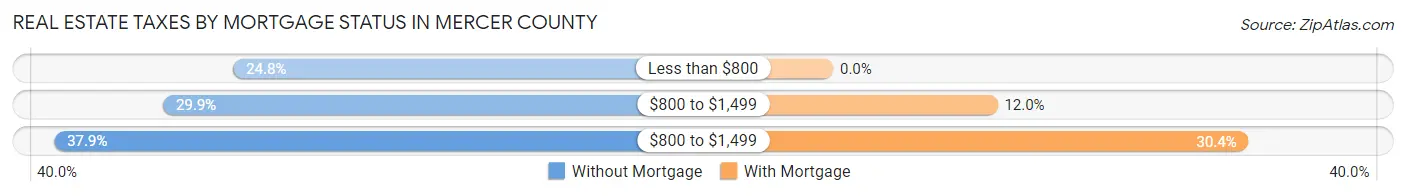
| Property Taxes | Without Mortgage | With Mortgage |
| Less than $800 | 743 (24.8%) | 0 (0.0%) |
| $800 to $1,499 | 897 (29.9%) | 451 (12.0%) |
| $800 to $1,499 | 1,136 (37.9%) | 1,140 (30.4%) |
| Total | 3,001 (100.0%) | 3,755 (100.0%) |
Health & Disability in Mercer County
Health Insurance Coverage by Age in Mercer County
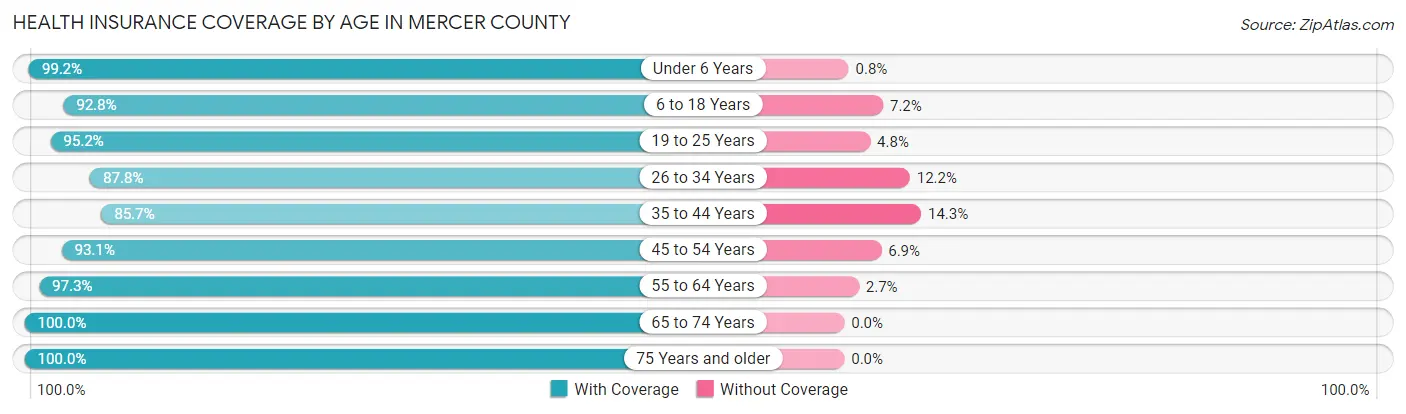
| Age Bracket | With Coverage | Without Coverage |
| Under 6 Years | 1,609 (99.2%) | 13 (0.8%) |
| 6 to 18 Years | 3,278 (92.8%) | 255 (7.2%) |
| 19 to 25 Years | 1,759 (95.2%) | 89 (4.8%) |
| 26 to 34 Years | 2,150 (87.8%) | 299 (12.2%) |
| 35 to 44 Years | 2,173 (85.7%) | 363 (14.3%) |
| 45 to 54 Years | 2,684 (93.1%) | 199 (6.9%) |
| 55 to 64 Years | 3,365 (97.3%) | 94 (2.7%) |
| 65 to 74 Years | 2,487 (100.0%) | 0 (0.0%) |
| 75 Years and older | 1,642 (100.0%) | 0 (0.0%) |
| Total | 21,147 (94.2%) | 1,312 (5.8%) |
Health Insurance Coverage by Citizenship Status in Mercer County
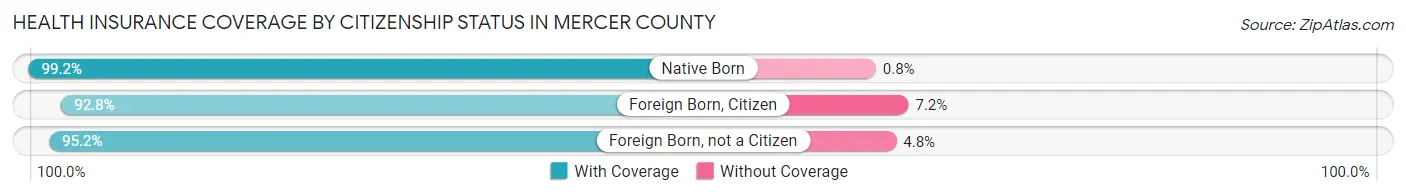
| Citizenship Status | With Coverage | Without Coverage |
| Native Born | 1,609 (99.2%) | 13 (0.8%) |
| Foreign Born, Citizen | 3,278 (92.8%) | 255 (7.2%) |
| Foreign Born, not a Citizen | 1,759 (95.2%) | 89 (4.8%) |
Health Insurance Coverage by Household Income in Mercer County
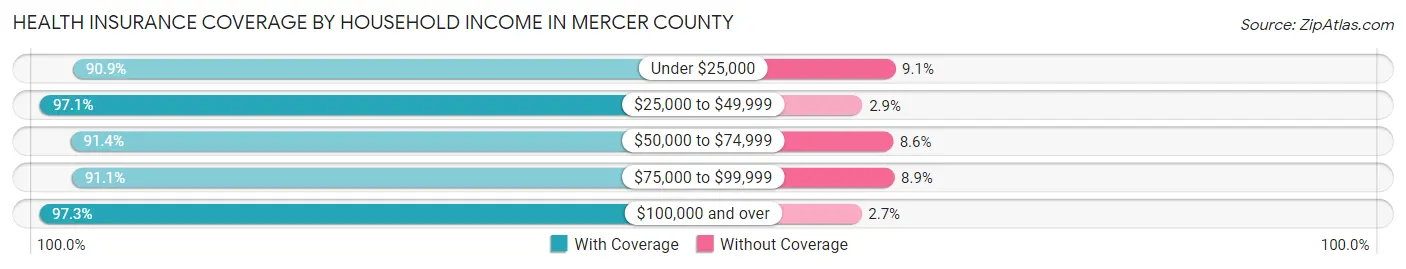
| Household Income | With Coverage | Without Coverage |
| Under $25,000 | 2,268 (90.9%) | 226 (9.1%) |
| $25,000 to $49,999 | 3,769 (97.1%) | 112 (2.9%) |
| $50,000 to $74,999 | 4,509 (91.4%) | 425 (8.6%) |
| $75,000 to $99,999 | 3,662 (91.1%) | 356 (8.9%) |
| $100,000 and over | 6,915 (97.3%) | 193 (2.7%) |
Public vs Private Health Insurance Coverage by Age in Mercer County
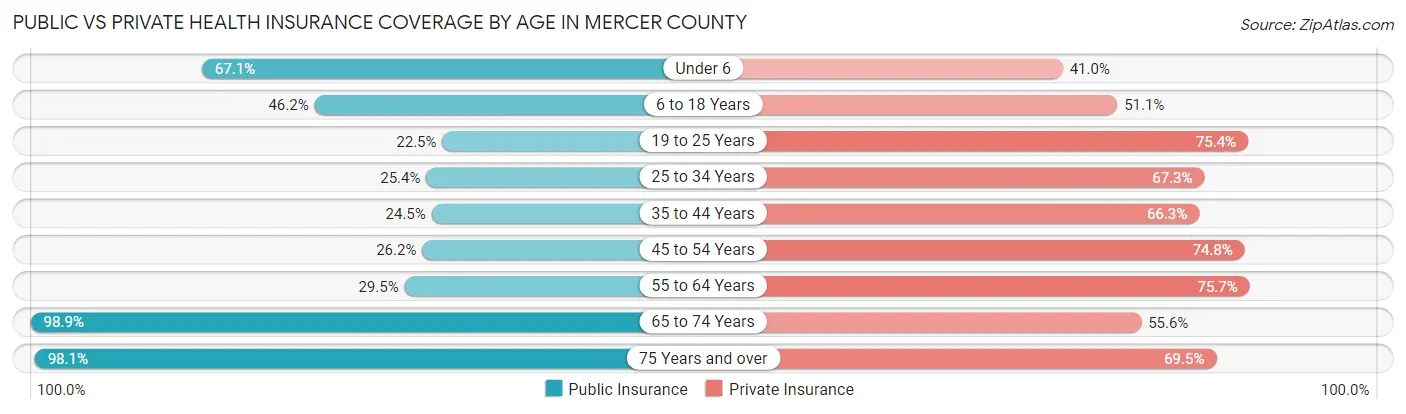
| Age Bracket | Public Insurance | Private Insurance |
| Under 6 | 1,088 (67.1%) | 665 (41.0%) |
| 6 to 18 Years | 1,632 (46.2%) | 1,806 (51.1%) |
| 19 to 25 Years | 415 (22.5%) | 1,393 (75.4%) |
| 25 to 34 Years | 623 (25.4%) | 1,648 (67.3%) |
| 35 to 44 Years | 620 (24.4%) | 1,682 (66.3%) |
| 45 to 54 Years | 755 (26.2%) | 2,156 (74.8%) |
| 55 to 64 Years | 1,020 (29.5%) | 2,618 (75.7%) |
| 65 to 74 Years | 2,459 (98.9%) | 1,382 (55.6%) |
| 75 Years and over | 1,611 (98.1%) | 1,141 (69.5%) |
| Total | 10,223 (45.5%) | 14,491 (64.5%) |
Disability Status by Sex by Age in Mercer County
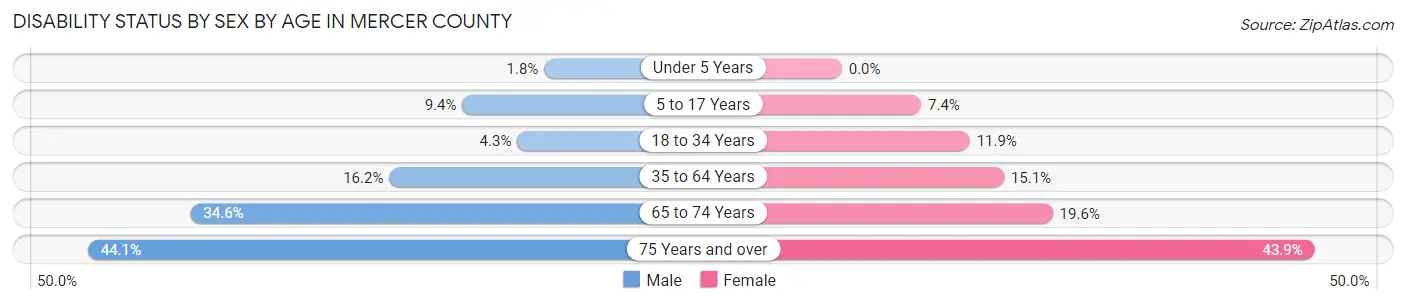
| Age Bracket | Male | Female |
| Under 5 Years | 12 (1.8%) | 0 (0.0%) |
| 5 to 17 Years | 177 (9.4%) | 130 (7.4%) |
| 18 to 34 Years | 101 (4.3%) | 259 (11.9%) |
| 35 to 64 Years | 724 (16.2%) | 662 (15.0%) |
| 65 to 74 Years | 399 (34.6%) | 261 (19.6%) |
| 75 Years and over | 293 (44.1%) | 429 (43.9%) |
Disability Class by Sex by Age in Mercer County
Disability Class: Hearing Difficulty
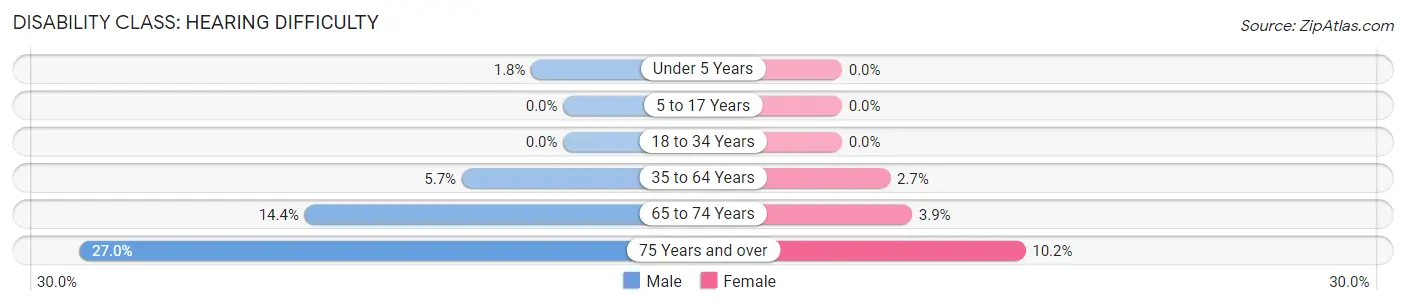
| Age Bracket | Male | Female |
| Under 5 Years | 12 (1.8%) | 0 (0.0%) |
| 5 to 17 Years | 0 (0.0%) | 0 (0.0%) |
| 18 to 34 Years | 0 (0.0%) | 0 (0.0%) |
| 35 to 64 Years | 253 (5.7%) | 118 (2.7%) |
| 65 to 74 Years | 166 (14.4%) | 52 (3.9%) |
| 75 Years and over | 179 (27.0%) | 100 (10.2%) |
Disability Class: Vision Difficulty
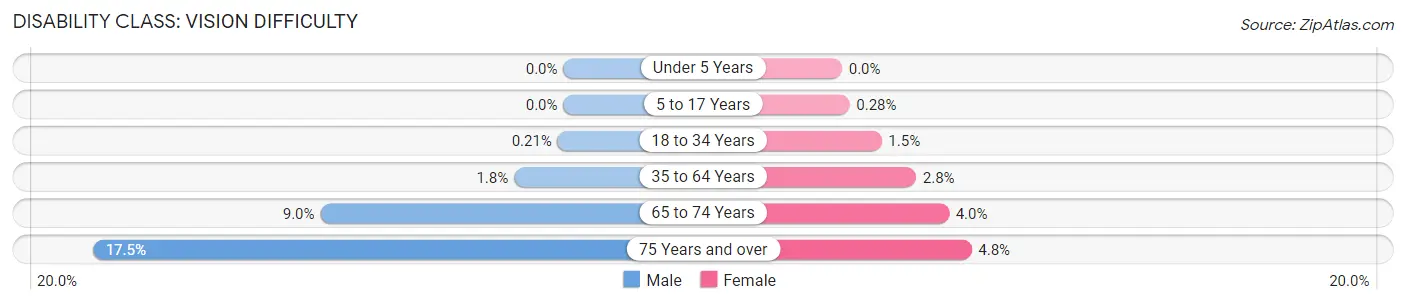
| Age Bracket | Male | Female |
| Under 5 Years | 0 (0.0%) | 0 (0.0%) |
| 5 to 17 Years | 0 (0.0%) | 5 (0.3%) |
| 18 to 34 Years | 5 (0.2%) | 32 (1.5%) |
| 35 to 64 Years | 82 (1.8%) | 121 (2.8%) |
| 65 to 74 Years | 104 (9.0%) | 53 (4.0%) |
| 75 Years and over | 116 (17.5%) | 47 (4.8%) |
Disability Class: Cognitive Difficulty
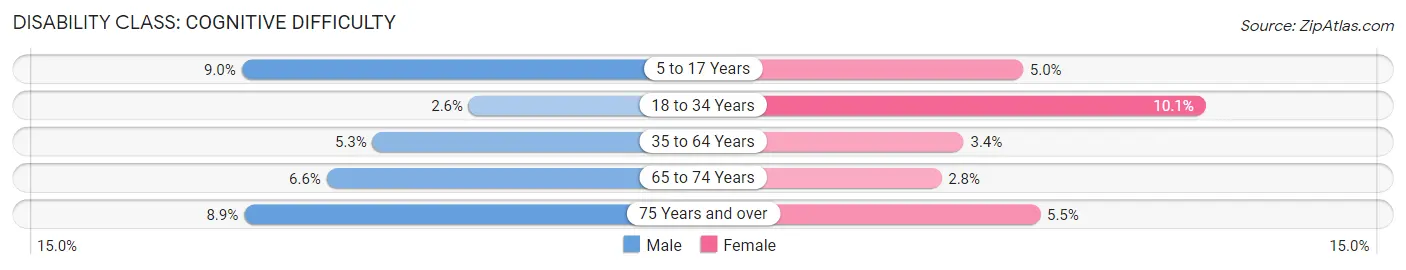
| Age Bracket | Male | Female |
| 5 to 17 Years | 169 (9.0%) | 89 (5.0%) |
| 18 to 34 Years | 62 (2.6%) | 221 (10.1%) |
| 35 to 64 Years | 238 (5.3%) | 149 (3.4%) |
| 65 to 74 Years | 76 (6.6%) | 37 (2.8%) |
| 75 Years and over | 59 (8.9%) | 54 (5.5%) |
Disability Class: Ambulatory Difficulty
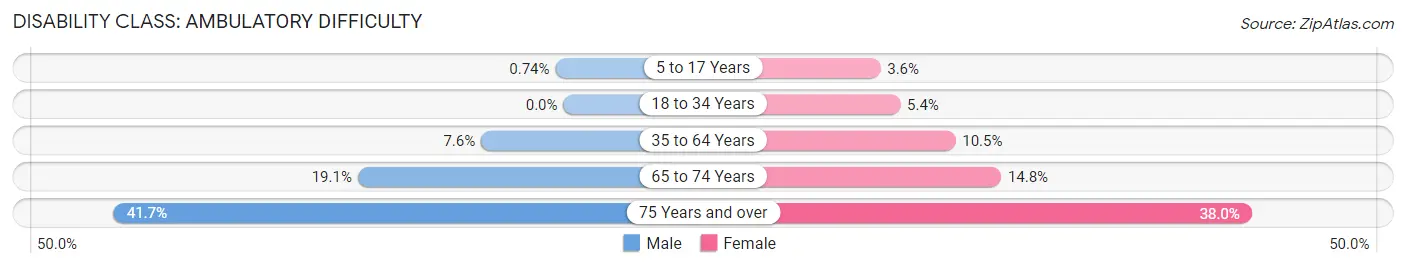
| Age Bracket | Male | Female |
| 5 to 17 Years | 14 (0.7%) | 63 (3.6%) |
| 18 to 34 Years | 0 (0.0%) | 118 (5.4%) |
| 35 to 64 Years | 342 (7.6%) | 463 (10.5%) |
| 65 to 74 Years | 220 (19.1%) | 197 (14.8%) |
| 75 Years and over | 277 (41.7%) | 372 (38.0%) |
Disability Class: Self-Care Difficulty
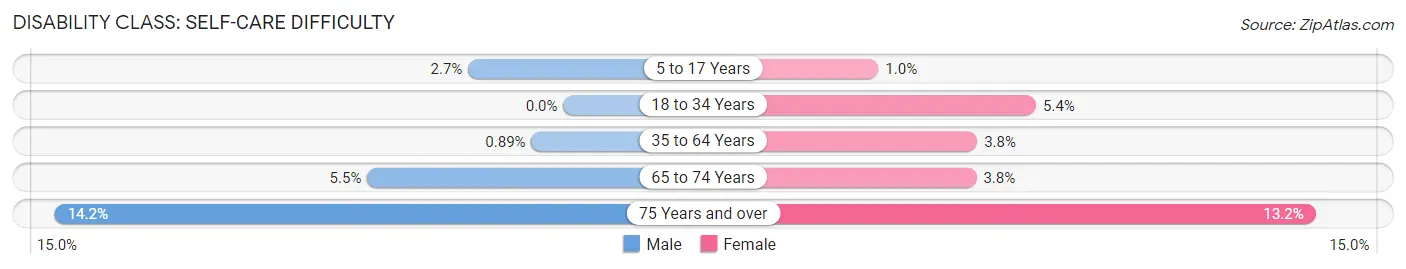
| Age Bracket | Male | Female |
| 5 to 17 Years | 50 (2.6%) | 18 (1.0%) |
| 18 to 34 Years | 0 (0.0%) | 118 (5.4%) |
| 35 to 64 Years | 40 (0.9%) | 166 (3.8%) |
| 65 to 74 Years | 63 (5.5%) | 50 (3.7%) |
| 75 Years and over | 94 (14.2%) | 129 (13.2%) |
Technology Access in Mercer County
Computing Device Access in Mercer County
| Device Type | # Households | % Households |
| Desktop or Laptop | 6,360 | 70.1% |
| Smartphone | 7,534 | 83.0% |
| Tablet | 5,479 | 60.4% |
| No Computing Device | 1,028 | 11.3% |
| Total | 9,079 | 100.0% |
Internet Access in Mercer County
| Internet Type | # Households | % Households |
| Dial-Up Internet | 8 | 0.1% |
| Broadband Home | 5,318 | 58.6% |
| Cellular Data Only | 1,251 | 13.8% |
| Satellite Internet | 1,237 | 13.6% |
| No Internet | 1,484 | 16.4% |
| Total | 9,079 | 100.0% |
Mercer County Summary
Mercer County, Kentucky is located in the heart of the Bluegrass Region of the state. It is bordered by Boyle, Garrard, Lincoln, and Washington counties. The county seat is Harrodsburg, and the county was formed in 1785. The county was named after General Hugh Mercer, a Revolutionary War hero.
Geography
Mercer County is located in the central part of Kentucky, and is part of the Bluegrass Region. The county is mostly flat, with rolling hills in the northern and western parts. The county is drained by the Kentucky River and its tributaries, including the Salt River, the Rolling Fork, and the Dix River. The county is also home to several small lakes, including Herrington Lake, which is the largest. The county has a total area of 441 square miles, of which 437 square miles is land and 4 square miles is water.
Economy
The economy of Mercer County is largely based on agriculture. The county is home to several large farms, and the main crops grown are corn, wheat, soybeans, and tobacco. The county also has a thriving livestock industry, with cattle, horses, and hogs being the main animals raised.
In addition to agriculture, Mercer County is home to several manufacturing companies. The largest employer in the county is the Toyota Motor Manufacturing plant, which produces the Camry and Avalon models. Other major employers include the Harrodsburg Industrial Park, which is home to several small businesses, and the Mercer County Airport, which is a hub for air cargo.
Demographics
As of the 2010 census, Mercer County had a population of 21,331. The population was spread out, with 48.3% male and 51.7% female. The median age was 40.2 years. The racial makeup of the county was 94.2% White, 3.2% African American, 0.3% Native American, 0.5% Asian, 0.1% Pacific Islander, 0.7% from other races, and 1.0% from two or more races. Hispanic or Latino of any race were 1.7% of the population.
The median household income in Mercer County was $41,945, and the median family income was $50,945. The per capita income was $20,945. About 11.2% of families and 14.2% of the population were below the poverty line, including 19.2% of those under age 18 and 11.2% of those age 65 or over.
Mercer County is home to several small towns and communities, including Harrodsburg, Burgin, and Salvisa. The county is served by the Mercer County Public Schools system, which includes seven elementary schools, two middle schools, and one high school. The county is also home to several private schools, including the Harrodsburg Christian Academy and the Burgin Independent School.
Common Questions
What is Per Capita Income in Mercer County?
Per Capita income in Mercer County is $30,424.
What is the Median Family Income in Mercer County?
Median Family Income in Mercer County is $78,846.
What is the Median Household income in Mercer County?
Median Household Income in Mercer County is $60,728.
What is Income or Wage Gap in Mercer County?
Income or Wage Gap in Mercer County is 17.9%.
Women in Mercer County earn 82.1 cents for every dollar earned by a man.
What is Inequality or Gini Index in Mercer County?
Inequality or Gini Index in Mercer County is 0.40.
What is the Total Population of Mercer County?
Total Population of Mercer County is 22,662.
What is the Total Male Population of Mercer County?
Total Male Population of Mercer County is 11,343.
What is the Total Female Population of Mercer County?
Total Female Population of Mercer County is 11,319.
What is the Ratio of Males per 100 Females in Mercer County?
There are 100.21 Males per 100 Females in Mercer County.
What is the Ratio of Females per 100 Males in Mercer County?
There are 99.79 Females per 100 Males in Mercer County.
What is the Median Population Age in Mercer County?
Median Population Age in Mercer County is 43.1 Years.
What is the Average Family Size in Mercer County
Average Family Size in Mercer County is 3.2 People.
What is the Average Household Size in Mercer County
Average Household Size in Mercer County is 2.5 People.
How Large is the Labor Force in Mercer County?
There are 10,548 People in the Labor Forcein in Mercer County.
What is the Percentage of People in the Labor Force in Mercer County?
57.6% of People are in the Labor Force in Mercer County.
What is the Unemployment Rate in Mercer County?
Unemployment Rate in Mercer County is 4.5%.