Menifee County, KY Map & Demographics
Menifee County Map
Menifee County Overview
$22,682
PER CAPITA INCOME
$56,176
AVG FAMILY INCOME
$43,797
AVG HOUSEHOLD INCOME
27.4%
WAGE / INCOME GAP [ % ]
72.6¢/ $1
WAGE / INCOME GAP [ $ ]
0.45
INEQUALITY / GINI INDEX
6,174
TOTAL POPULATION
3,284
MALE POPULATION
2,890
FEMALE POPULATION
113.63
MALES / 100 FEMALES
88.00
FEMALES / 100 MALES
43.4
MEDIAN AGE
3.4
AVG FAMILY SIZE
2.7
AVG HOUSEHOLD SIZE
2,103
LABOR FORCE [ PEOPLE ]
43.0%
PERCENT IN LABOR FORCE
4.7%
UNEMPLOYMENT RATE
Menifee County Area Codes
Income in Menifee County
Income Overview in Menifee County
Per Capita Income in Menifee County is $22,682, while median incomes of families and households are $56,176 and $43,797 respectively.
| Characteristic | Number | Measure |
| Per Capita Income | 6,174 | $22,682 |
| Median Family Income | 1,526 | $56,176 |
| Mean Family Income | 1,526 | $67,740 |
| Median Household Income | 2,262 | $43,797 |
| Mean Household Income | 2,262 | $57,311 |
| Income Deficit | 1,526 | $0 |
| Wage / Income Gap (%) | 6,174 | 27.43% |
| Wage / Income Gap ($) | 6,174 | 72.57¢ per $1 |
| Gini / Inequality Index | 6,174 | 0.45 |
Earnings by Sex in Menifee County
Average Earnings in Menifee County are $28,915, $34,271 for men and $24,870 for women, a difference of 27.4%.
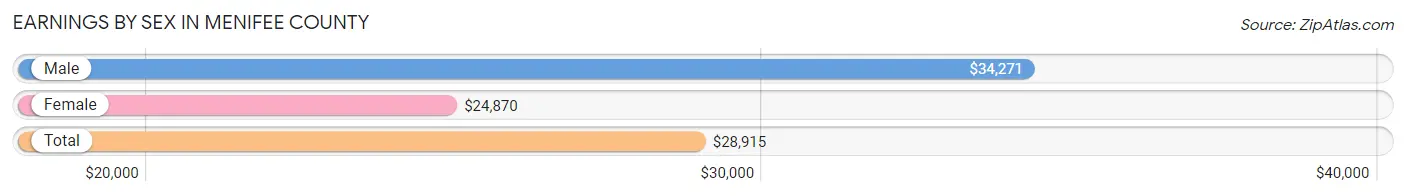
| Sex | Number | Average Earnings |
| Male | 1,422 (56.6%) | $34,271 |
| Female | 1,090 (43.4%) | $24,870 |
| Total | 2,512 (100.0%) | $28,915 |
Earnings by Sex by Income Bracket in Menifee County
The most common earnings brackets in Menifee County are $22,500 to $24,999 for men (176 | 12.4%) and $30,000 to $34,999 for women (209 | 19.2%).
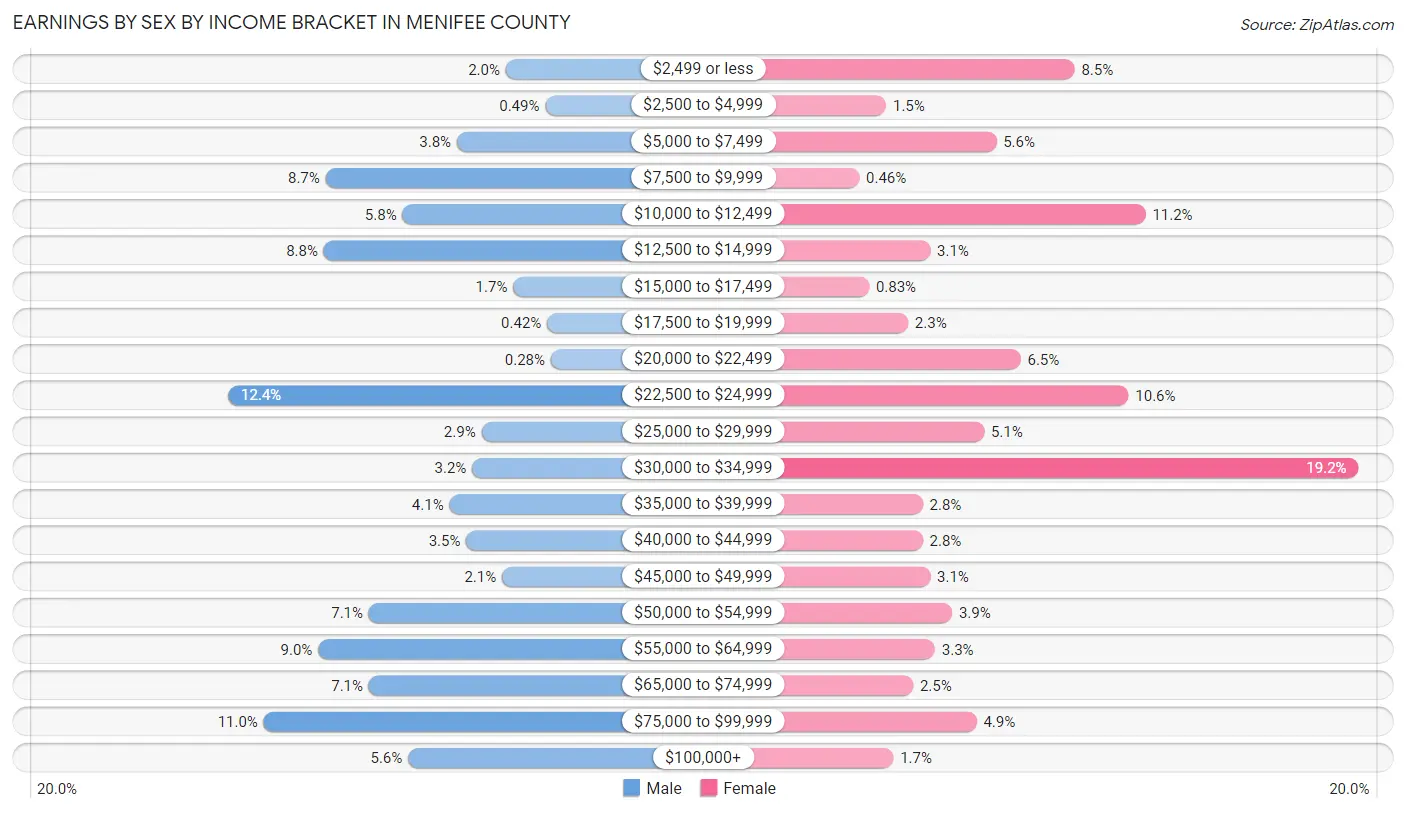
| Income | Male | Female |
| $2,499 or less | 28 (2.0%) | 93 (8.5%) |
| $2,500 to $4,999 | 7 (0.5%) | 16 (1.5%) |
| $5,000 to $7,499 | 54 (3.8%) | 61 (5.6%) |
| $7,500 to $9,999 | 124 (8.7%) | 5 (0.5%) |
| $10,000 to $12,499 | 83 (5.8%) | 122 (11.2%) |
| $12,500 to $14,999 | 125 (8.8%) | 34 (3.1%) |
| $15,000 to $17,499 | 24 (1.7%) | 9 (0.8%) |
| $17,500 to $19,999 | 6 (0.4%) | 25 (2.3%) |
| $20,000 to $22,499 | 4 (0.3%) | 71 (6.5%) |
| $22,500 to $24,999 | 176 (12.4%) | 115 (10.5%) |
| $25,000 to $29,999 | 41 (2.9%) | 56 (5.1%) |
| $30,000 to $34,999 | 46 (3.2%) | 209 (19.2%) |
| $35,000 to $39,999 | 58 (4.1%) | 31 (2.8%) |
| $40,000 to $44,999 | 49 (3.5%) | 31 (2.8%) |
| $45,000 to $49,999 | 30 (2.1%) | 34 (3.1%) |
| $50,000 to $54,999 | 101 (7.1%) | 43 (3.9%) |
| $55,000 to $64,999 | 128 (9.0%) | 36 (3.3%) |
| $65,000 to $74,999 | 101 (7.1%) | 27 (2.5%) |
| $75,000 to $99,999 | 157 (11.0%) | 53 (4.9%) |
| $100,000+ | 80 (5.6%) | 19 (1.7%) |
| Total | 1,422 (100.0%) | 1,090 (100.0%) |
Earnings by Sex by Educational Attainment in Menifee County
Average earnings in Menifee County are $30,625 for men and $29,792 for women, a difference of 2.7%. Men with an educational attainment of graduate degree enjoy the highest average annual earnings of $83,875, while those with high school diploma education earn the least with $24,415. Women with an educational attainment of graduate degree earn the most with the average annual earnings of $52,778, while those with college or associate's degree education have the smallest earnings of $21,447.
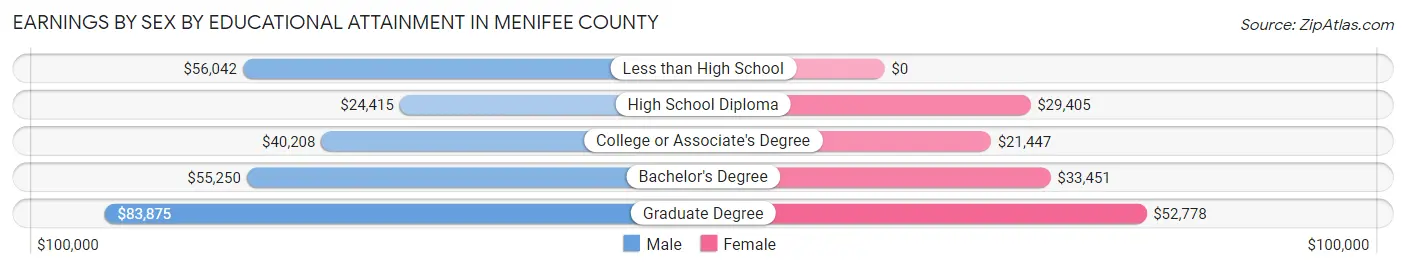
| Educational Attainment | Male Income | Female Income |
| Less than High School | $56,042 | $0 |
| High School Diploma | $24,415 | $29,405 |
| College or Associate's Degree | $40,208 | $21,447 |
| Bachelor's Degree | $55,250 | $33,451 |
| Graduate Degree | $83,875 | $52,778 |
| Total | $30,625 | $29,792 |
Family Income in Menifee County
Family Income Brackets in Menifee County
According to the Menifee County family income data, there are 272 families falling into the $35,000 to $49,999 income range, which is the most common income bracket and makes up 17.8% of all families. Conversely, the $200,000+ income bracket is the least frequent group with only 8 families (0.5%) belonging to this category.
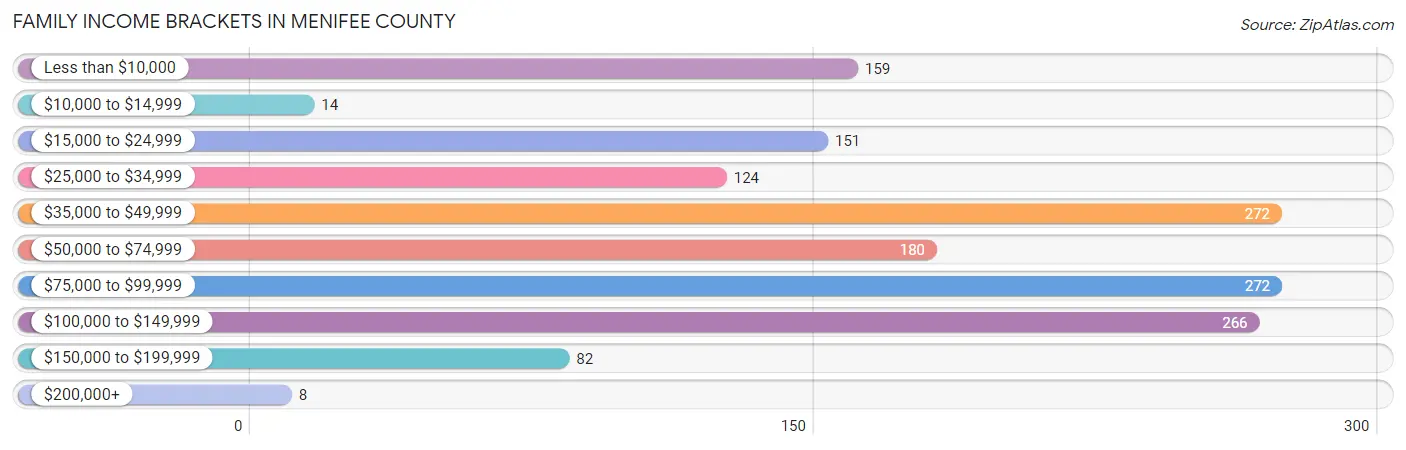
| Income Bracket | # Families | % Families |
| Less than $10,000 | 159 | 10.4% |
| $10,000 to $14,999 | 14 | 0.9% |
| $15,000 to $24,999 | 151 | 9.9% |
| $25,000 to $34,999 | 124 | 8.1% |
| $35,000 to $49,999 | 272 | 17.8% |
| $50,000 to $74,999 | 180 | 11.8% |
| $75,000 to $99,999 | 272 | 17.8% |
| $100,000 to $149,999 | 266 | 17.4% |
| $150,000 to $199,999 | 82 | 5.4% |
| $200,000+ | 8 | 0.5% |
Family Income by Famaliy Size in Menifee County
3-person families (371 | 24.3%) account for the highest median family income in Menifee County with $83,329 per family, while 3-person families (371 | 24.3%) have the highest median income of $27,776 per family member.
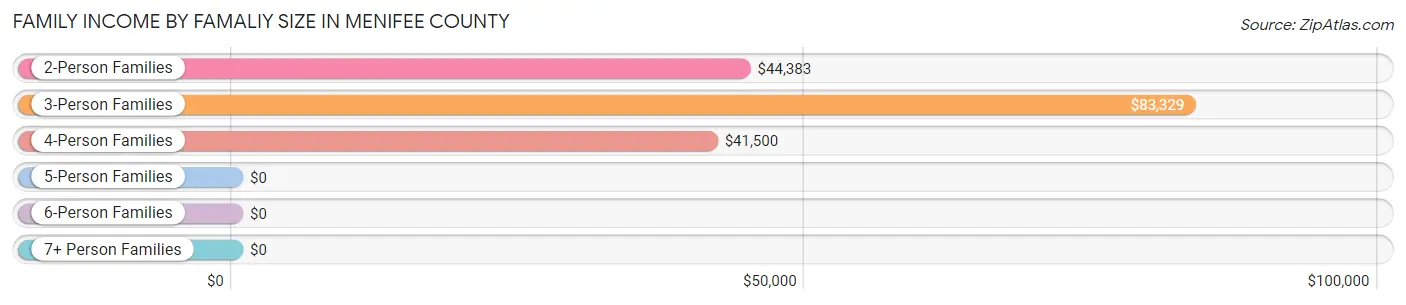
| Income Bracket | # Families | Median Income |
| 2-Person Families | 789 (51.7%) | $44,383 |
| 3-Person Families | 371 (24.3%) | $83,329 |
| 4-Person Families | 220 (14.4%) | $41,500 |
| 5-Person Families | 111 (7.3%) | $0 |
| 6-Person Families | 15 (1.0%) | $0 |
| 7+ Person Families | 20 (1.3%) | $0 |
| Total | 1,526 (100.0%) | $56,176 |
Family Income by Number of Earners in Menifee County
The median family income in Menifee County is $56,176, with families comprising 2 earners (485) having the highest median family income of $90,855, while families with no earners (460) have the lowest median family income of $26,833, accounting for 31.8% and 30.1% of families, respectively.
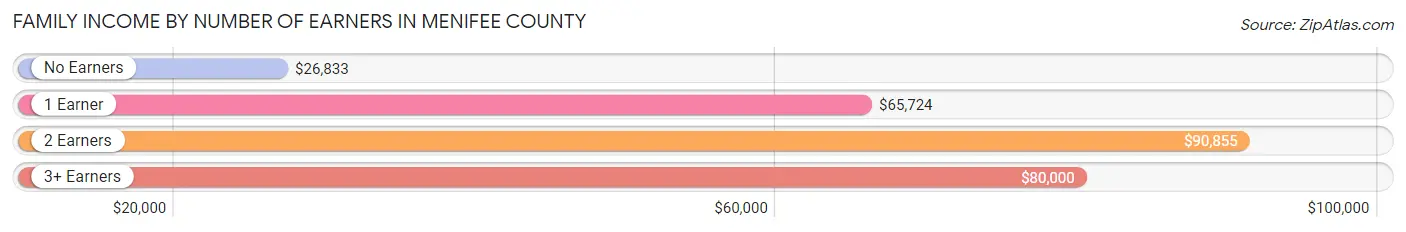
| Number of Earners | # Families | Median Income |
| No Earners | 460 (30.1%) | $26,833 |
| 1 Earner | 491 (32.2%) | $65,724 |
| 2 Earners | 485 (31.8%) | $90,855 |
| 3+ Earners | 90 (5.9%) | $80,000 |
| Total | 1,526 (100.0%) | $56,176 |
Household Income in Menifee County
Household Income Brackets in Menifee County
With 339 households falling in the category, the $75,000 to $99,999 income range is the most frequent in Menifee County, accounting for 15.0% of all households. In contrast, only 7 households (0.3%) fall into the $200,000+ income bracket, making it the least populous group.
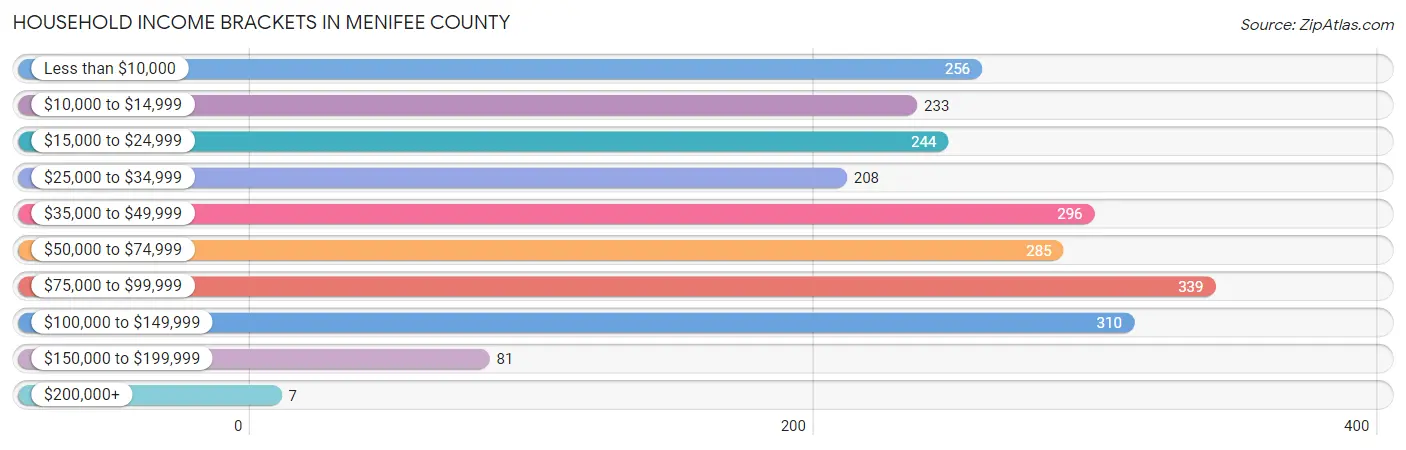
| Income Bracket | # Households | % Households |
| Less than $10,000 | 256 | 11.3% |
| $10,000 to $14,999 | 233 | 10.3% |
| $15,000 to $24,999 | 244 | 10.8% |
| $25,000 to $34,999 | 208 | 9.2% |
| $35,000 to $49,999 | 296 | 13.1% |
| $50,000 to $74,999 | 285 | 12.6% |
| $75,000 to $99,999 | 339 | 15.0% |
| $100,000 to $149,999 | 310 | 13.7% |
| $150,000 to $199,999 | 81 | 3.6% |
| $200,000+ | 7 | 0.3% |
Household Income by Householder Age in Menifee County
The median household income in Menifee County is $43,797, with the highest median household income of $76,274 found in the 15 to 24 years age bracket for the primary householder. A total of 76 households (3.4%) fall into this category. Meanwhile, the 65+ years age bracket for the primary householder has the lowest median household income of $26,292, with 687 households (30.4%) in this group.
| Income Bracket | # Households | Median Income |
| 15 to 24 Years | 76 (3.4%) | $76,274 |
| 25 to 44 Years | 457 (20.2%) | $42,083 |
| 45 to 64 Years | 1,042 (46.1%) | $71,458 |
| 65+ Years | 687 (30.4%) | $26,292 |
| Total | 2,262 (100.0%) | $43,797 |
Poverty in Menifee County
Income Below Poverty by Sex and Age in Menifee County
With 26.2% poverty level for males and 27.6% for females among the residents of Menifee County, 12 to 14 year old males and 5 year old females are the most vulnerable to poverty, with 106 males (73.1%) and 9 females (100.0%) in their respective age groups living below the poverty level.
| Age Bracket | Male | Female |
| Under 5 Years | 109 (36.3%) | 118 (68.2%) |
| 5 Years | 0 (0.0%) | 9 (100.0%) |
| 6 to 11 Years | 103 (45.2%) | 64 (33.3%) |
| 12 to 14 Years | 106 (73.1%) | 48 (39.3%) |
| 15 Years | 0 (0.0%) | 12 (27.9%) |
| 16 and 17 Years | 17 (53.1%) | 9 (18.8%) |
| 18 to 24 Years | 41 (21.1%) | 67 (29.6%) |
| 25 to 34 Years | 138 (35.2%) | 151 (48.9%) |
| 35 to 44 Years | 50 (13.8%) | 72 (23.1%) |
| 45 to 54 Years | 75 (17.4%) | 84 (25.1%) |
| 55 to 64 Years | 86 (16.9%) | 70 (15.3%) |
| 65 to 74 Years | 82 (22.0%) | 26 (9.2%) |
| 75 Years and over | 49 (21.5%) | 57 (16.8%) |
| Total | 856 (26.2%) | 787 (27.6%) |
Income Above Poverty by Sex and Age in Menifee County
According to the poverty statistics in Menifee County, males aged 5 years and females aged 65 to 74 years are the age groups that are most secure financially, with 100.0% of males and 90.7% of females in these age groups living above the poverty line.
| Age Bracket | Male | Female |
| Under 5 Years | 191 (63.7%) | 55 (31.8%) |
| 5 Years | 34 (100.0%) | 0 (0.0%) |
| 6 to 11 Years | 125 (54.8%) | 128 (66.7%) |
| 12 to 14 Years | 39 (26.9%) | 74 (60.7%) |
| 15 Years | 37 (100.0%) | 31 (72.1%) |
| 16 and 17 Years | 15 (46.9%) | 39 (81.2%) |
| 18 to 24 Years | 153 (78.9%) | 159 (70.4%) |
| 25 to 34 Years | 254 (64.8%) | 158 (51.1%) |
| 35 to 44 Years | 313 (86.2%) | 240 (76.9%) |
| 45 to 54 Years | 355 (82.6%) | 251 (74.9%) |
| 55 to 64 Years | 423 (83.1%) | 388 (84.7%) |
| 65 to 74 Years | 290 (78.0%) | 255 (90.7%) |
| 75 Years and over | 179 (78.5%) | 282 (83.2%) |
| Total | 2,408 (73.8%) | 2,060 (72.4%) |
Income Below Poverty Among Married-Couple Families in Menifee County
The poverty statistics for married-couple families in Menifee County show that 13.4% or 156 of the total 1,161 families live below the poverty line. Families with 5 or more children have the highest poverty rate of 100.0%, comprising of 20 families. On the other hand, families with no children have the lowest poverty rate of 8.6%, which includes 70 families.
| Children | Above Poverty | Below Poverty |
| No Children | 742 (91.4%) | 70 (8.6%) |
| 1 or 2 Children | 192 (88.9%) | 24 (11.1%) |
| 3 or 4 Children | 71 (62.8%) | 42 (37.2%) |
| 5 or more Children | 0 (0.0%) | 20 (100.0%) |
| Total | 1,005 (86.6%) | 156 (13.4%) |
Income Below Poverty Among Single-Parent Households in Menifee County
According to the poverty data in Menifee County, 6.5% or 12 single-father households and 69.1% or 125 single-mother households are living below the poverty line. Among single-father households, those with 1 or 2 children have the highest poverty rate, with 12 households (18.2%) experiencing poverty. Likewise, among single-mother households, those with 3 or 4 children have the highest poverty rate, with 43 households (97.7%) falling below the poverty line.
| Children | Single Father | Single Mother |
| No Children | 0 (0.0%) | 4 (9.3%) |
| 1 or 2 Children | 12 (18.2%) | 78 (83.0%) |
| 3 or 4 Children | 0 (0.0%) | 43 (97.7%) |
| 5 or more Children | 0 (0.0%) | 0 (0.0%) |
| Total | 12 (6.5%) | 125 (69.1%) |
Income Below Poverty Among Married-Couple vs Single-Parent Households in Menifee County
The poverty data for Menifee County shows that 156 of the married-couple family households (13.4%) and 137 of the single-parent households (37.5%) are living below the poverty level. Within the married-couple family households, those with 5 or more children have the highest poverty rate, with 20 households (100.0%) falling below the poverty line. Among the single-parent households, those with 3 or 4 children have the highest poverty rate, with 43 household (97.7%) living below poverty.
| Children | Married-Couple Families | Single-Parent Households |
| No Children | 70 (8.6%) | 4 (2.5%) |
| 1 or 2 Children | 24 (11.1%) | 90 (56.2%) |
| 3 or 4 Children | 42 (37.2%) | 43 (97.7%) |
| 5 or more Children | 20 (100.0%) | 0 (0.0%) |
| Total | 156 (13.4%) | 137 (37.5%) |
Race in Menifee County
The most populous races in Menifee County are White / Caucasian (6,076 | 98.4%), Hispanic or Latino (149 | 2.4%), and Two or more Races (86 | 1.4%).
| Race | # Population | % Population |
| Asian | 0 | 0.0% |
| Black / African American | 12 | 0.2% |
| Hawaiian / Pacific | 0 | 0.0% |
| Hispanic or Latino | 149 | 2.4% |
| Native / Alaskan | 0 | 0.0% |
| White / Caucasian | 6,076 | 98.4% |
| Two or more Races | 86 | 1.4% |
| Some other Race | 0 | 0.0% |
| Total | 6,174 | 100.0% |
Ancestry in Menifee County
The most populous ancestries reported in Menifee County are American (2,864 | 46.4%), Irish (440 | 7.1%), English (394 | 6.4%), German (379 | 6.1%), and Cherokee (84 | 1.4%), together accounting for 67.4% of all Menifee County residents.
| Ancestry | # Population | % Population |
| American | 2,864 | 46.4% |
| Apache | 79 | 1.3% |
| Arab | 12 | 0.2% |
| Blackfeet | 3 | 0.1% |
| British | 5 | 0.1% |
| Cherokee | 84 | 1.4% |
| Cuban | 64 | 1.0% |
| Dutch | 21 | 0.3% |
| Egyptian | 1 | 0.0% |
| English | 394 | 6.4% |
| European | 23 | 0.4% |
| French | 66 | 1.1% |
| French Canadian | 13 | 0.2% |
| German | 379 | 6.1% |
| Irish | 440 | 7.1% |
| Iroquois | 79 | 1.3% |
| Italian | 54 | 0.9% |
| Mexican | 36 | 0.6% |
| Peruvian | 49 | 0.8% |
| Polish | 14 | 0.2% |
| Russian | 37 | 0.6% |
| Scandinavian | 30 | 0.5% |
| Scotch-Irish | 70 | 1.1% |
| Scottish | 77 | 1.3% |
| Sioux | 78 | 1.3% |
| South American | 49 | 0.8% |
| Swedish | 8 | 0.1% |
| Welsh | 8 | 0.1% | View All 28 Rows |
Immigrants in Menifee County
The most numerous immigrant groups reported in Menifee County came from Latin America (14 | 0.2%), Peru (14 | 0.2%), South America (14 | 0.2%), Eastern Europe (11 | 0.2%), and Europe (11 | 0.2%), together accounting for 1.0% of all Menifee County residents.
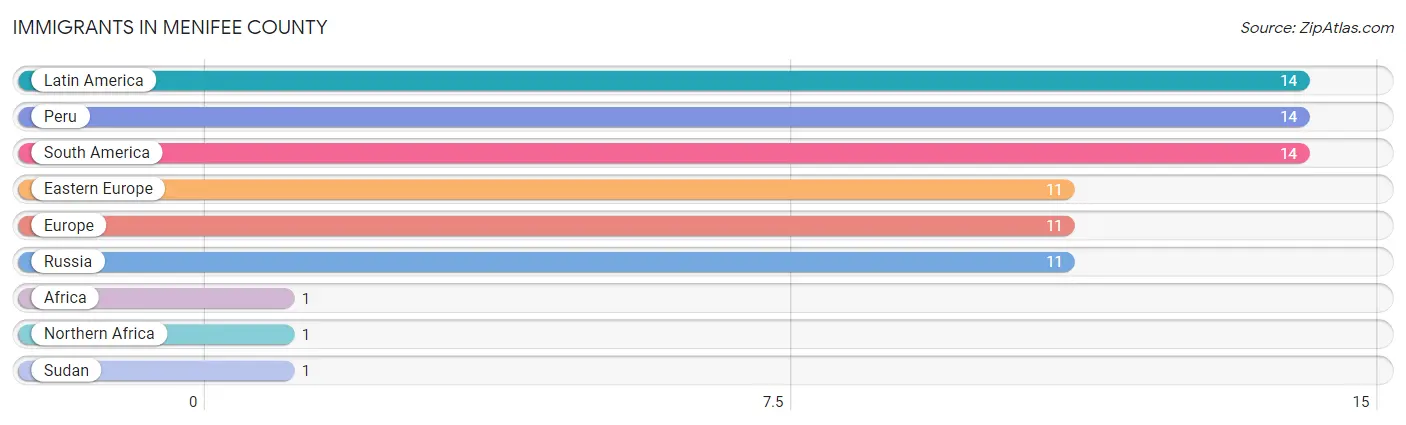
| Immigration Origin | # Population | % Population |
| Africa | 1 | 0.0% |
| Eastern Europe | 11 | 0.2% |
| Europe | 11 | 0.2% |
| Latin America | 14 | 0.2% |
| Northern Africa | 1 | 0.0% |
| Peru | 14 | 0.2% |
| Russia | 11 | 0.2% |
| South America | 14 | 0.2% |
| Sudan | 1 | 0.0% | View All 9 Rows |
Sex and Age in Menifee County
Sex and Age in Menifee County
The most populous age groups in Menifee County are 60 to 64 Years (302 | 9.2%) for men and 55 to 59 Years (248 | 8.6%) for women.
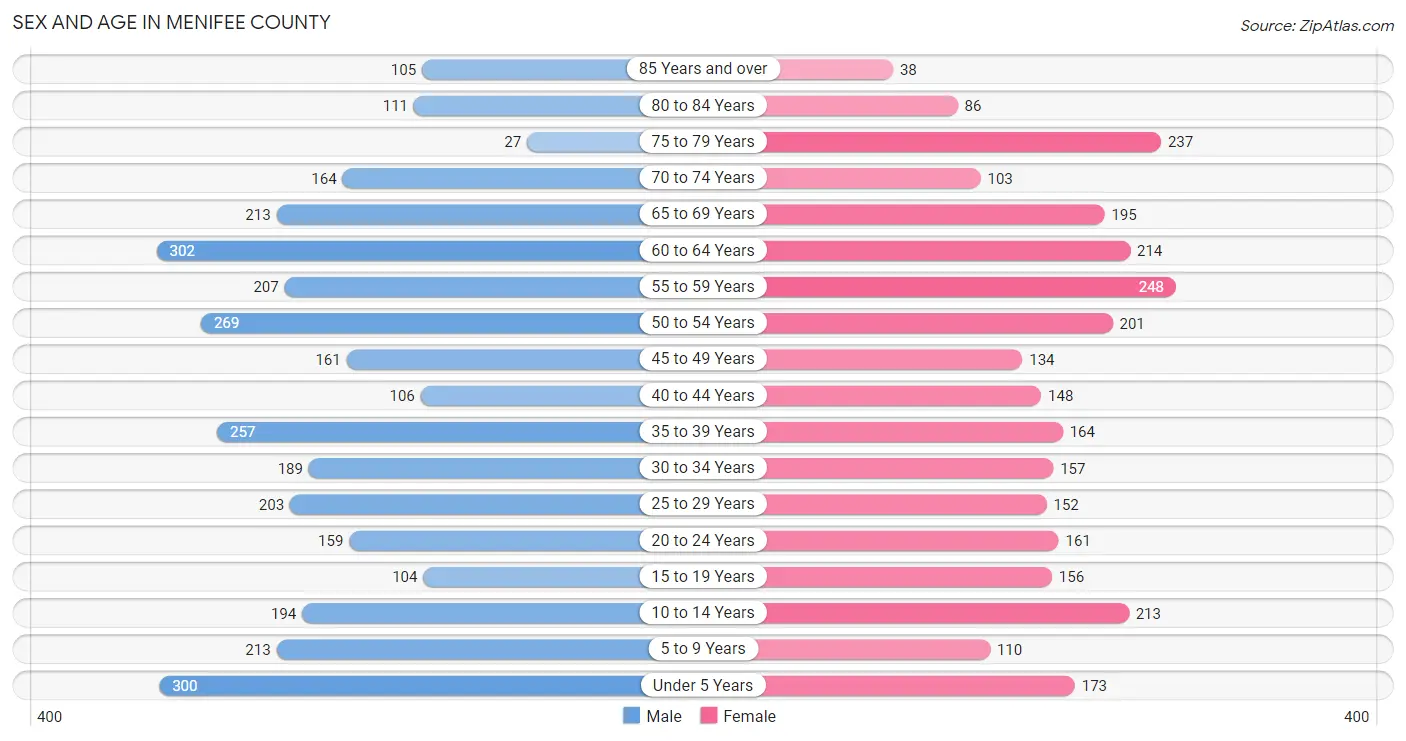
| Age Bracket | Male | Female |
| Under 5 Years | 300 (9.1%) | 173 (6.0%) |
| 5 to 9 Years | 213 (6.5%) | 110 (3.8%) |
| 10 to 14 Years | 194 (5.9%) | 213 (7.4%) |
| 15 to 19 Years | 104 (3.2%) | 156 (5.4%) |
| 20 to 24 Years | 159 (4.8%) | 161 (5.6%) |
| 25 to 29 Years | 203 (6.2%) | 152 (5.3%) |
| 30 to 34 Years | 189 (5.8%) | 157 (5.4%) |
| 35 to 39 Years | 257 (7.8%) | 164 (5.7%) |
| 40 to 44 Years | 106 (3.2%) | 148 (5.1%) |
| 45 to 49 Years | 161 (4.9%) | 134 (4.6%) |
| 50 to 54 Years | 269 (8.2%) | 201 (7.0%) |
| 55 to 59 Years | 207 (6.3%) | 248 (8.6%) |
| 60 to 64 Years | 302 (9.2%) | 214 (7.4%) |
| 65 to 69 Years | 213 (6.5%) | 195 (6.8%) |
| 70 to 74 Years | 164 (5.0%) | 103 (3.6%) |
| 75 to 79 Years | 27 (0.8%) | 237 (8.2%) |
| 80 to 84 Years | 111 (3.4%) | 86 (3.0%) |
| 85 Years and over | 105 (3.2%) | 38 (1.3%) |
| Total | 3,284 (100.0%) | 2,890 (100.0%) |
Families and Households in Menifee County
Median Family Size in Menifee County
The median family size in Menifee County is 3.35 persons per family, with single female/mother families (181 | 11.9%) accounting for the largest median family size of 3.71 persons per family. On the other hand, married-couple families (1,161 | 76.1%) represent the smallest median family size with 3.29 persons per family.
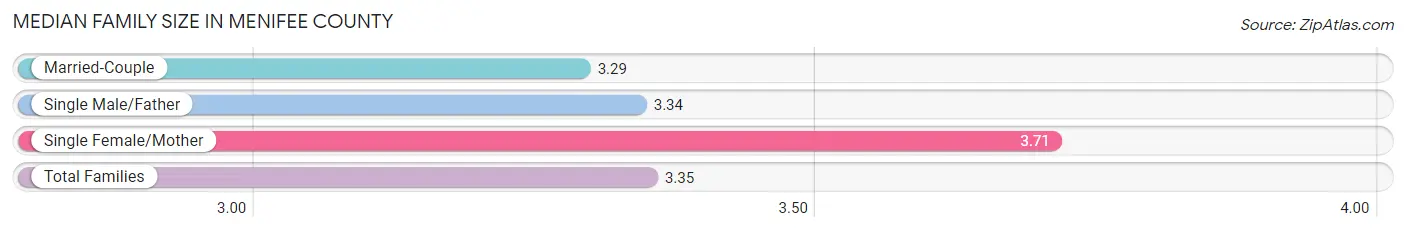
| Family Type | # Families | Family Size |
| Married-Couple | 1,161 (76.1%) | 3.29 |
| Single Male/Father | 184 (12.1%) | 3.34 |
| Single Female/Mother | 181 (11.9%) | 3.71 |
| Total Families | 1,526 (100.0%) | 3.35 |
Median Household Size in Menifee County
The median household size in Menifee County is 2.68 persons per household, with single female/mother households (181 | 8.0%) accounting for the largest median household size of 3.92 persons per household. non-family households (736 | 32.5%) represent the smallest median household size with 1.22 persons per household.
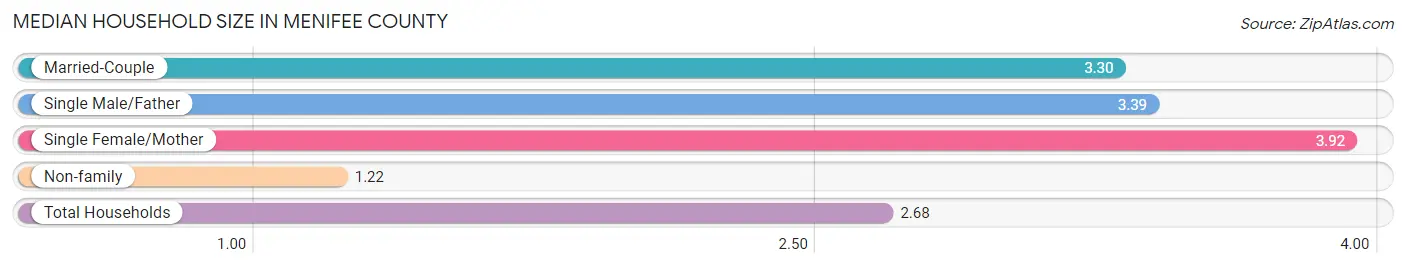
| Household Type | # Households | Household Size |
| Married-Couple | 1,161 (51.3%) | 3.30 |
| Single Male/Father | 184 (8.1%) | 3.39 |
| Single Female/Mother | 181 (8.0%) | 3.92 |
| Non-family | 736 (32.5%) | 1.22 |
| Total Households | 2,262 (100.0%) | 2.68 |
Household Size by Marriage Status in Menifee County
Out of a total of 2,262 households in Menifee County, 1,526 (67.5%) are family households, while 736 (32.5%) are nonfamily households. The most numerous type of family households are 2-person households, comprising 781, and the most common type of nonfamily households are 1-person households, comprising 612.
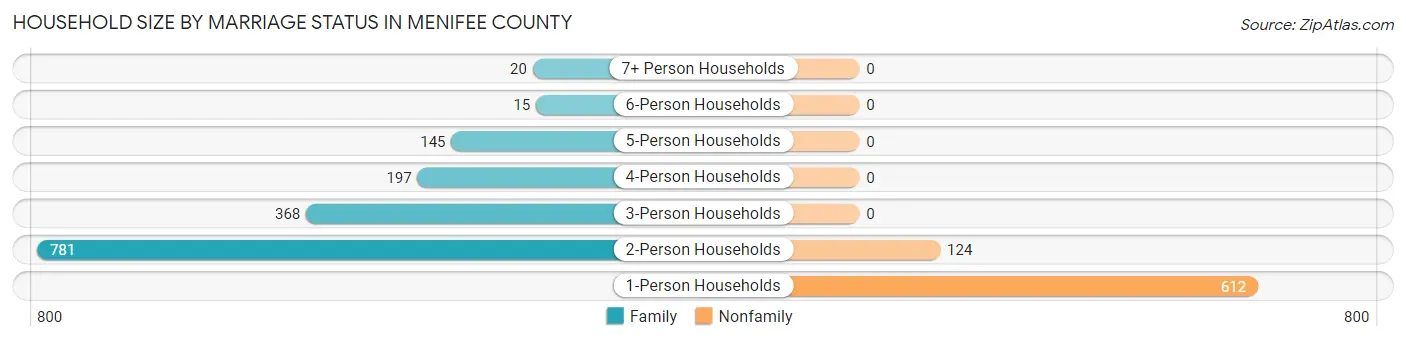
| Household Size | Family Households | Nonfamily Households |
| 1-Person Households | - | 612 (27.1%) |
| 2-Person Households | 781 (34.5%) | 124 (5.5%) |
| 3-Person Households | 368 (16.3%) | 0 (0.0%) |
| 4-Person Households | 197 (8.7%) | 0 (0.0%) |
| 5-Person Households | 145 (6.4%) | 0 (0.0%) |
| 6-Person Households | 15 (0.7%) | 0 (0.0%) |
| 7+ Person Households | 20 (0.9%) | 0 (0.0%) |
| Total | 1,526 (67.5%) | 736 (32.5%) |
Female Fertility in Menifee County
Fertility by Age in Menifee County
Average fertility rate in Menifee County is 57.0 births per 1,000 women. Women in the age bracket of 20 to 34 years have the highest fertility rate with 136.0 births per 1,000 women. Women in the age bracket of 20 to 34 years acount for 100.0% of all women with births.
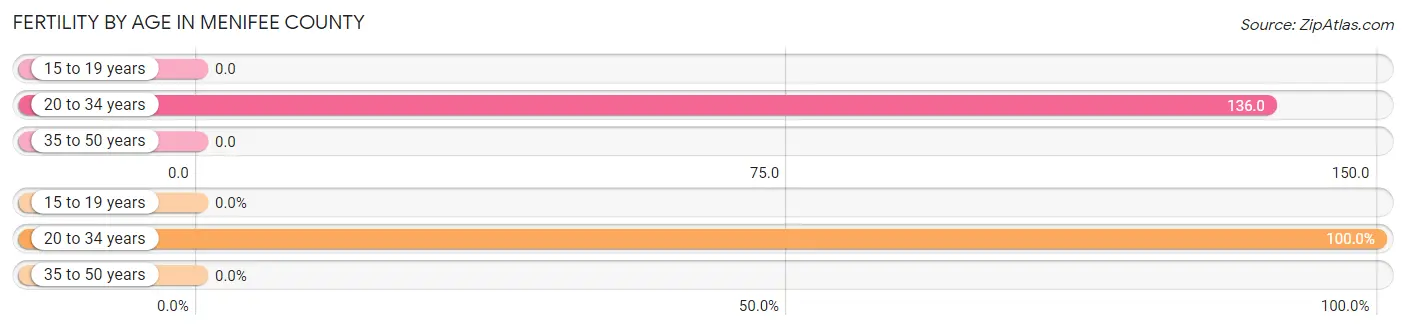
| Age Bracket | Women with Births | Births / 1,000 Women |
| 15 to 19 years | 0 (0.0%) | 0.0 |
| 20 to 34 years | 64 (100.0%) | 136.0 |
| 35 to 50 years | 0 (0.0%) | 0.0 |
| Total | 64 (100.0%) | 57.0 |
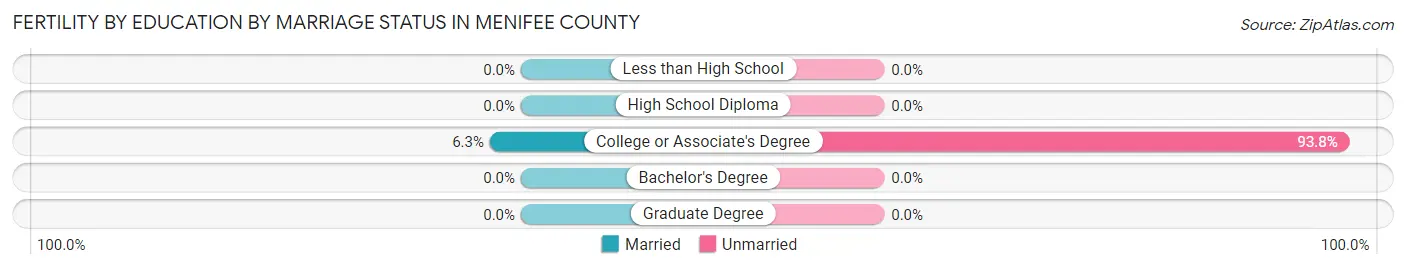
Fertility by Age by Marriage Status in Menifee County
6.2% of women with births (64) in Menifee County are married. The highest percentage of unmarried women with births falls into 20 to 34 years age bracket with 93.8% of them unmarried at the time of birth, while the lowest percentage of unmarried women with births belong to 20 to 34 years age bracket with 93.8% of them unmarried.
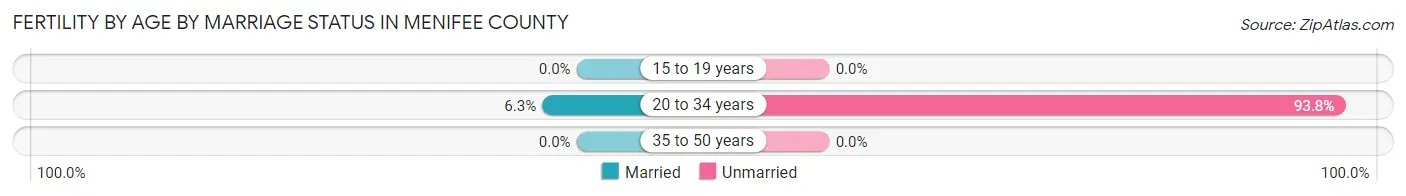
| Age Bracket | Married | Unmarried |
| 15 to 19 years | 0 (0.0%) | 0 (0.0%) |
| 20 to 34 years | 4 (6.2%) | 60 (93.8%) |
| 35 to 50 years | 0 (0.0%) | 0 (0.0%) |
| Total | 4 (6.2%) | 60 (93.8%) |
Fertility by Education in Menifee County
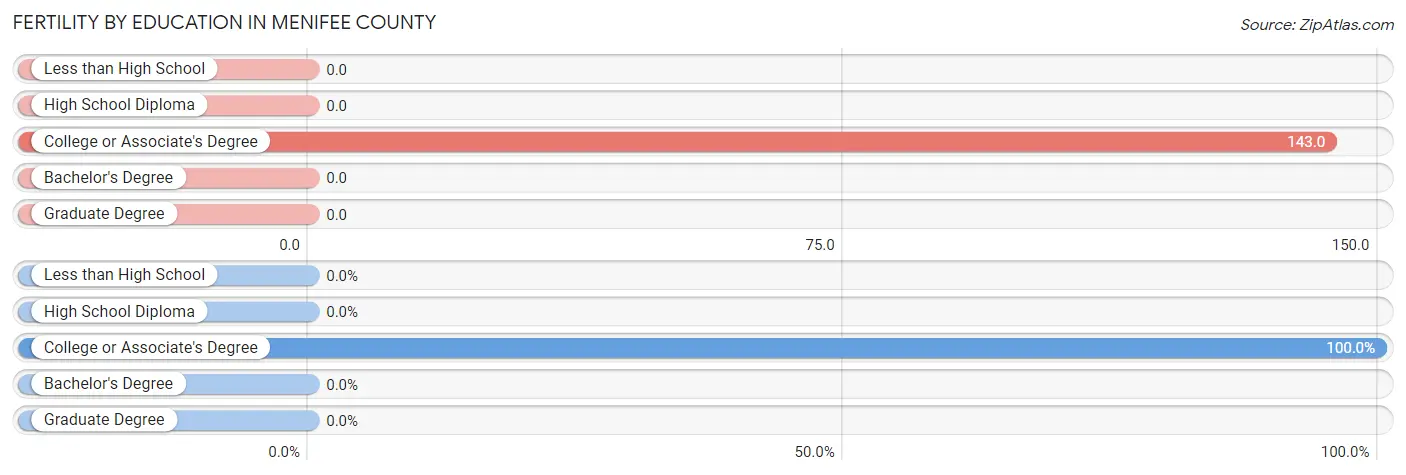
| Educational Attainment | Women with Births | Births / 1,000 Women |
| Less than High School | 0 (0.0%) | 0.0 |
| High School Diploma | 0 (0.0%) | 0.0 |
| College or Associate's Degree | 64 (100.0%) | 143.0 |
| Bachelor's Degree | 0 (0.0%) | 0.0 |
| Graduate Degree | 0 (0.0%) | 0.0 |
| Total | 64 (100.0%) | 57.0 |
Fertility by Education by Marriage Status in Menifee County
93.8% of women with births in Menifee County are unmarried. Women with the educational attainment of college or associate's degree are most likely to be married with 6.2% of them married at childbirth, while women with the educational attainment of college or associate's degree are least likely to be married with 93.8% of them unmarried at childbirth.
| Educational Attainment | Married | Unmarried |
| Less than High School | 0 (0.0%) | 0 (0.0%) |
| High School Diploma | 0 (0.0%) | 0 (0.0%) |
| College or Associate's Degree | 4 (6.2%) | 60 (93.8%) |
| Bachelor's Degree | 0 (0.0%) | 0 (0.0%) |
| Graduate Degree | 0 (0.0%) | 0 (0.0%) |
| Total | 4 (6.2%) | 60 (93.8%) |
Employment Characteristics in Menifee County
Employment by Class of Employer in Menifee County
Among the 1,989 employed individuals in Menifee County, private company employees (1,376 | 69.2%), self-employed (not incorporated) (169 | 8.5%), and not-for-profit organizations (116 | 5.8%) make up the most common classes of employment.
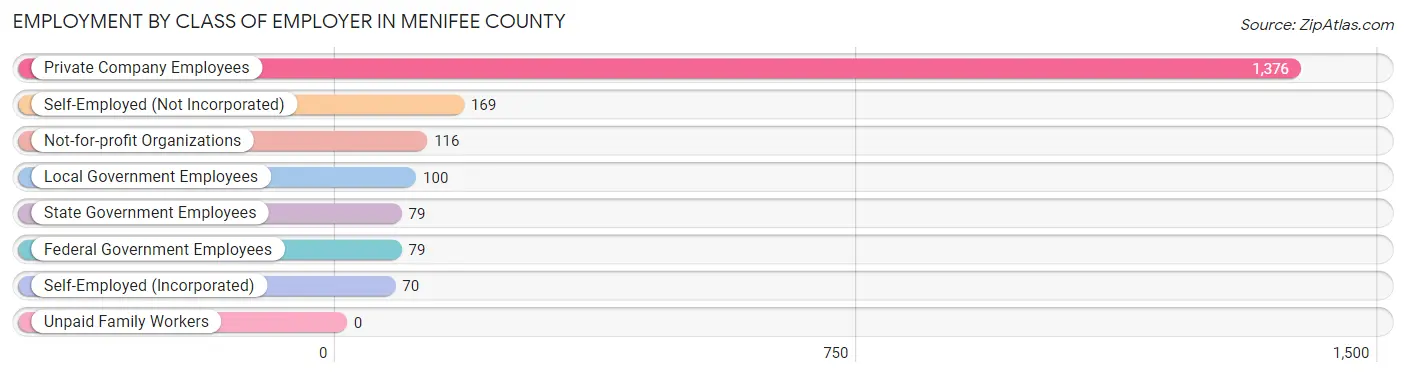
| Employer Class | # Employees | % Employees |
| Private Company Employees | 1,376 | 69.2% |
| Self-Employed (Incorporated) | 70 | 3.5% |
| Self-Employed (Not Incorporated) | 169 | 8.5% |
| Not-for-profit Organizations | 116 | 5.8% |
| Local Government Employees | 100 | 5.0% |
| State Government Employees | 79 | 4.0% |
| Federal Government Employees | 79 | 4.0% |
| Unpaid Family Workers | 0 | 0.0% |
| Total | 1,989 | 100.0% |
Employment Status by Age in Menifee County
According to the labor force statistics for Menifee County, out of the total population over 16 years of age (4,891), 43.0% or 2,103 individuals are in the labor force, with 4.7% or 99 of them unemployed. The age group with the highest labor force participation rate is 20 to 24 years, with 74.1% or 237 individuals in the labor force. Within the labor force, the 20 to 24 years age range has the highest percentage of unemployed individuals, with 25.7% or 61 of them being unemployed.
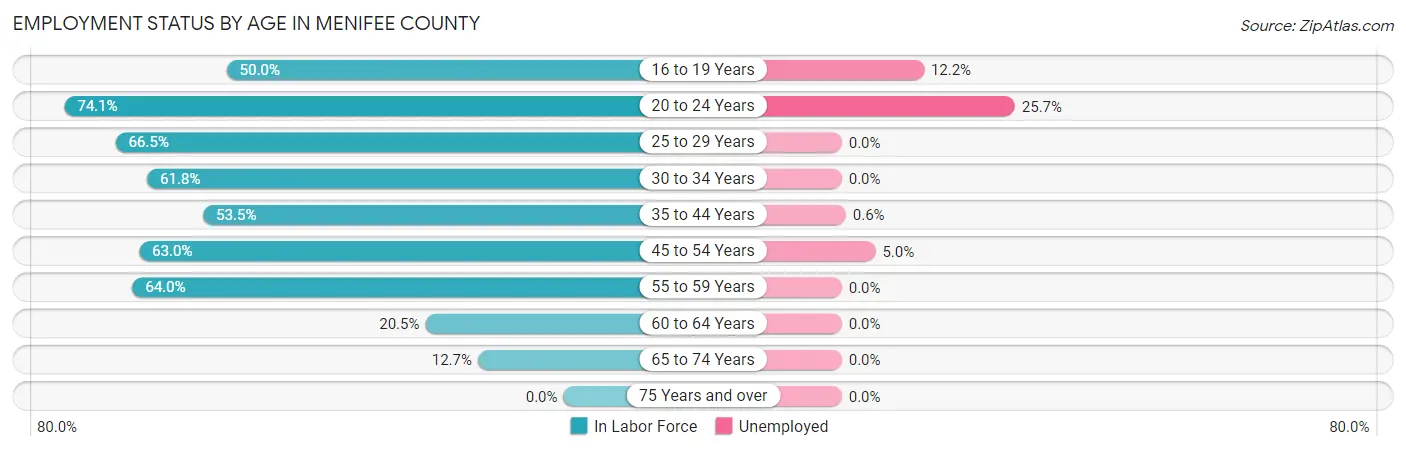
| Age Bracket | In Labor Force | Unemployed |
| 16 to 19 Years | 90 (50.0%) | 11 (12.2%) |
| 20 to 24 Years | 237 (74.1%) | 61 (25.7%) |
| 25 to 29 Years | 236 (66.5%) | 0 (0.0%) |
| 30 to 34 Years | 214 (61.8%) | 0 (0.0%) |
| 35 to 44 Years | 361 (53.5%) | 2 (0.6%) |
| 45 to 54 Years | 482 (63.0%) | 24 (5.0%) |
| 55 to 59 Years | 291 (64.0%) | 0 (0.0%) |
| 60 to 64 Years | 106 (20.5%) | 0 (0.0%) |
| 65 to 74 Years | 86 (12.7%) | 0 (0.0%) |
| 75 Years and over | 0 (0.0%) | 0 (0.0%) |
| Total | 2,103 (43.0%) | 99 (4.7%) |
Employment Status by Educational Attainment in Menifee County
According to labor force statistics for Menifee County, 54.3% of individuals (1,690) out of the total population between 25 and 64 years of age (3,112) are in the labor force, with 1.5% or 25 of them being unemployed. The group with the highest labor force participation rate are those with the educational attainment of bachelor's degree or higher, with 90.8% or 327 individuals in the labor force. Within the labor force, individuals with high school diploma education have the highest percentage of unemployment, with 3.5% or 24 of them being unemployed.
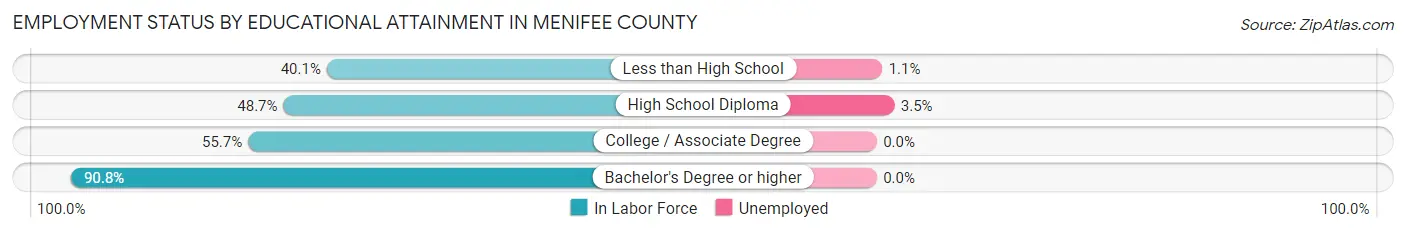
| Educational Attainment | In Labor Force | Unemployed |
| Less than High School | 184 (40.1%) | 5 (1.1%) |
| High School Diploma | 689 (48.7%) | 49 (3.5%) |
| College / Associate Degree | 490 (55.7%) | 0 (0.0%) |
| Bachelor's Degree or higher | 327 (90.8%) | 0 (0.0%) |
| Total | 1,690 (54.3%) | 47 (1.5%) |
Employment Occupations by Sex in Menifee County
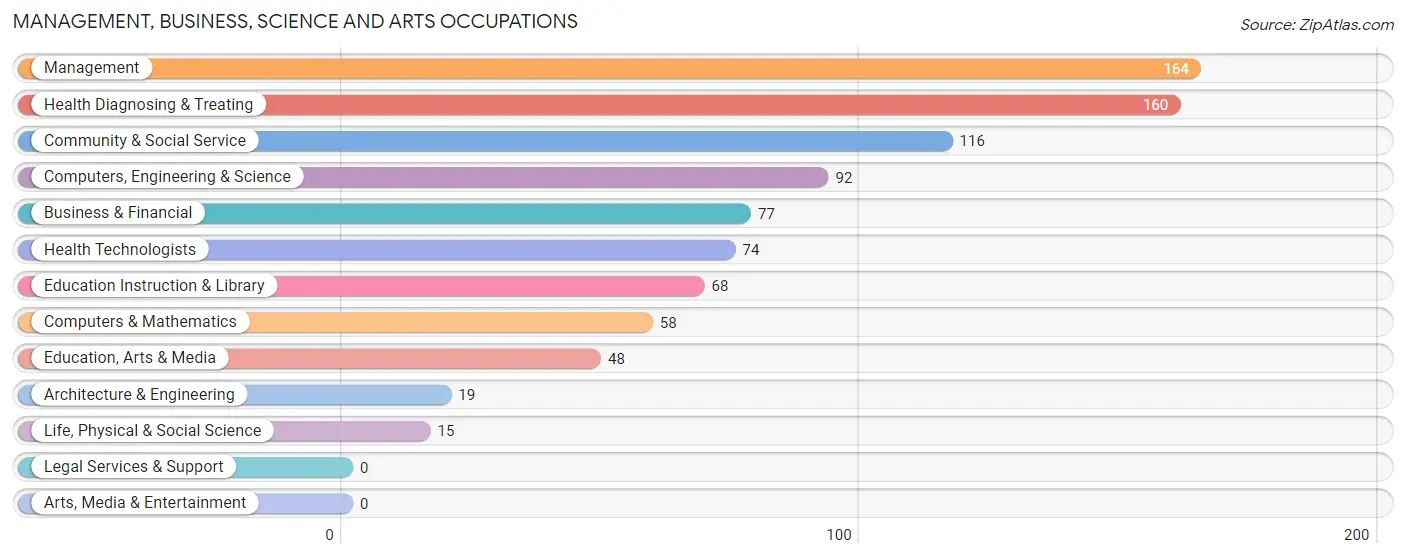
Management, Business, Science and Arts Occupations
The most common Management, Business, Science and Arts occupations in Menifee County are Management (164 | 8.2%), Health Diagnosing & Treating (160 | 8.0%), Community & Social Service (116 | 5.8%), Computers, Engineering & Science (92 | 4.6%), and Business & Financial (77 | 3.8%).
Management, Business, Science and Arts Occupations by Sex
Within the Management, Business, Science and Arts occupations in Menifee County, the most male-oriented occupations are Computers, Engineering & Science (100.0%), Computers & Mathematics (100.0%), and Architecture & Engineering (100.0%), while the most female-oriented occupations are Health Diagnosing & Treating (83.1%), Education Instruction & Library (76.5%), and Health Technologists (75.7%).
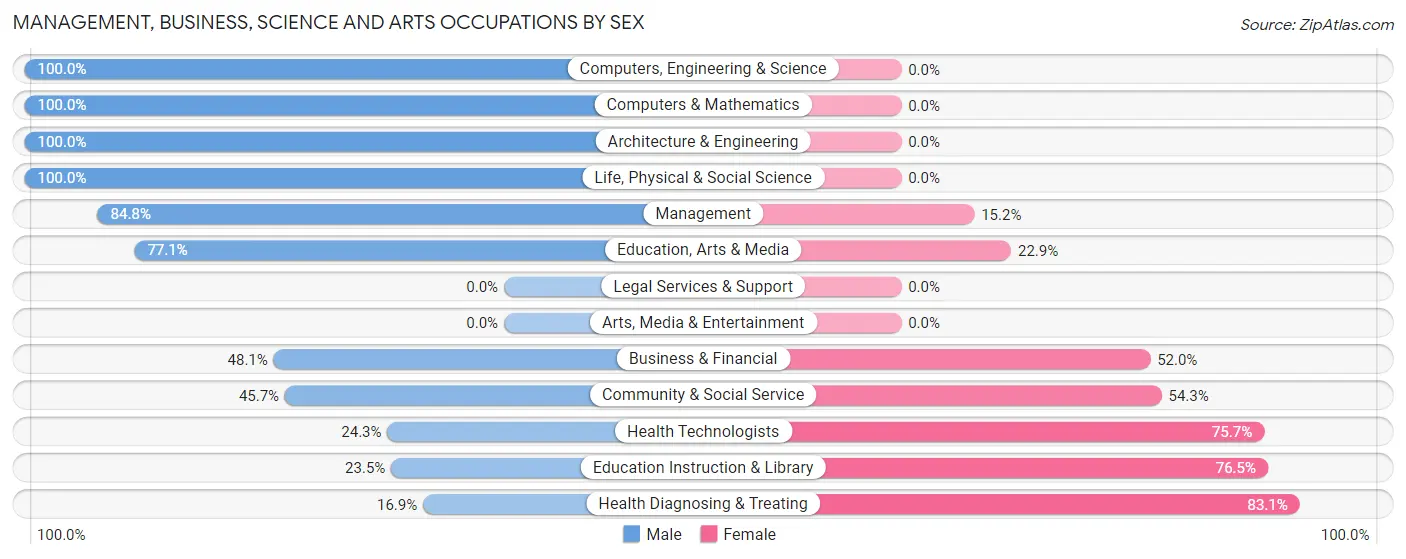
| Occupation | Male | Female |
| Management | 139 (84.8%) | 25 (15.2%) |
| Business & Financial | 37 (48.0%) | 40 (51.9%) |
| Computers, Engineering & Science | 92 (100.0%) | 0 (0.0%) |
| Computers & Mathematics | 58 (100.0%) | 0 (0.0%) |
| Architecture & Engineering | 19 (100.0%) | 0 (0.0%) |
| Life, Physical & Social Science | 15 (100.0%) | 0 (0.0%) |
| Community & Social Service | 53 (45.7%) | 63 (54.3%) |
| Education, Arts & Media | 37 (77.1%) | 11 (22.9%) |
| Legal Services & Support | 0 (0.0%) | 0 (0.0%) |
| Education Instruction & Library | 16 (23.5%) | 52 (76.5%) |
| Arts, Media & Entertainment | 0 (0.0%) | 0 (0.0%) |
| Health Diagnosing & Treating | 27 (16.9%) | 133 (83.1%) |
| Health Technologists | 18 (24.3%) | 56 (75.7%) |
| Total (Category) | 348 (57.1%) | 261 (42.9%) |
| Total (Overall) | 1,065 (53.1%) | 940 (46.9%) |
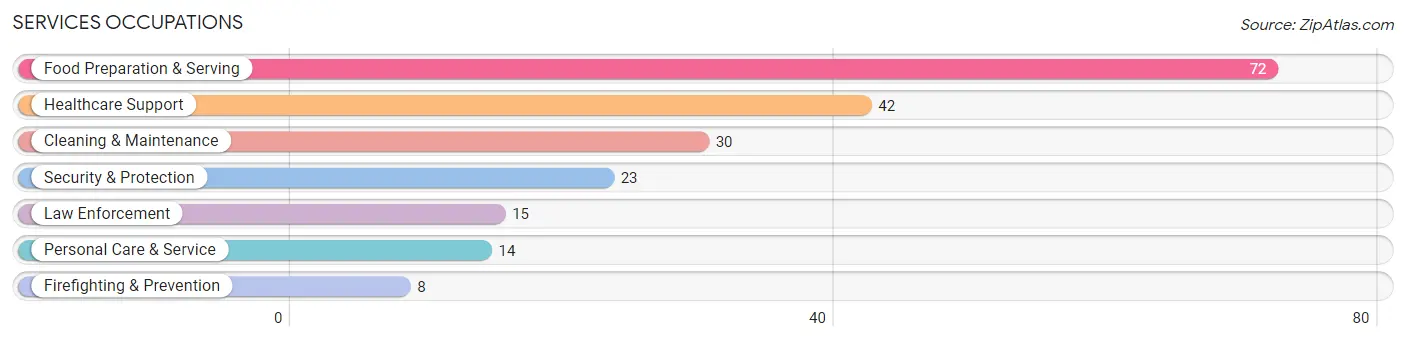
Services Occupations
The most common Services occupations in Menifee County are Food Preparation & Serving (72 | 3.6%), Healthcare Support (42 | 2.1%), Cleaning & Maintenance (30 | 1.5%), Security & Protection (23 | 1.1%), and Law Enforcement (15 | 0.7%).
Services Occupations by Sex
Within the Services occupations in Menifee County, the most male-oriented occupations are Cleaning & Maintenance (50.0%), Food Preparation & Serving (47.2%), and Personal Care & Service (42.9%), while the most female-oriented occupations are Healthcare Support (100.0%), Firefighting & Prevention (100.0%), and Security & Protection (73.9%).
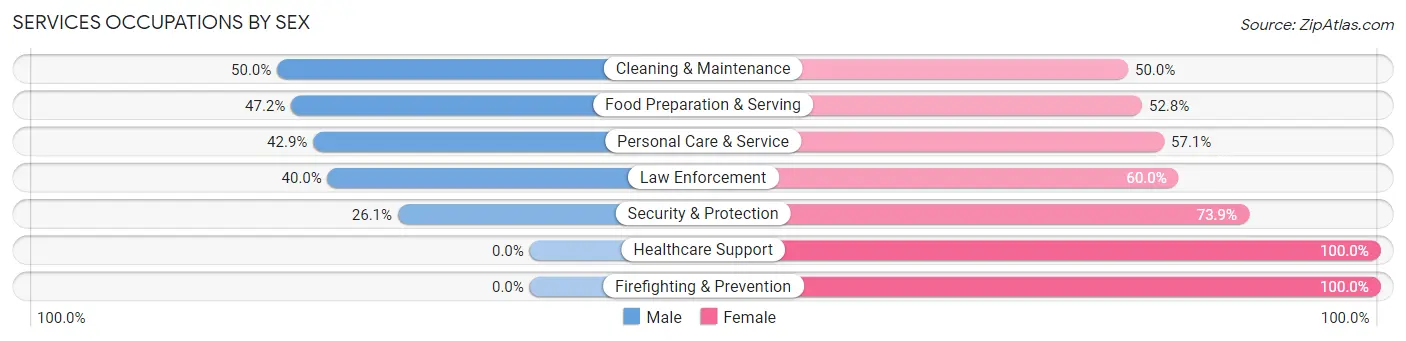
| Occupation | Male | Female |
| Healthcare Support | 0 (0.0%) | 42 (100.0%) |
| Security & Protection | 6 (26.1%) | 17 (73.9%) |
| Firefighting & Prevention | 0 (0.0%) | 8 (100.0%) |
| Law Enforcement | 6 (40.0%) | 9 (60.0%) |
| Food Preparation & Serving | 34 (47.2%) | 38 (52.8%) |
| Cleaning & Maintenance | 15 (50.0%) | 15 (50.0%) |
| Personal Care & Service | 6 (42.9%) | 8 (57.1%) |
| Total (Category) | 61 (33.7%) | 120 (66.3%) |
| Total (Overall) | 1,065 (53.1%) | 940 (46.9%) |
Sales and Office Occupations
The most common Sales and Office occupations in Menifee County are Sales & Related (297 | 14.8%), and Office & Administration (256 | 12.8%).

Sales and Office Occupations by Sex

| Occupation | Male | Female |
| Sales & Related | 124 (41.7%) | 173 (58.3%) |
| Office & Administration | 8 (3.1%) | 248 (96.9%) |
| Total (Category) | 132 (23.9%) | 421 (76.1%) |
| Total (Overall) | 1,065 (53.1%) | 940 (46.9%) |
Natural Resources, Construction and Maintenance Occupations
The most common Natural Resources, Construction and Maintenance occupations in Menifee County are Construction & Extraction (214 | 10.7%), Installation, Maintenance & Repair (75 | 3.7%), and Farming, Fishing & Forestry (3 | 0.2%).
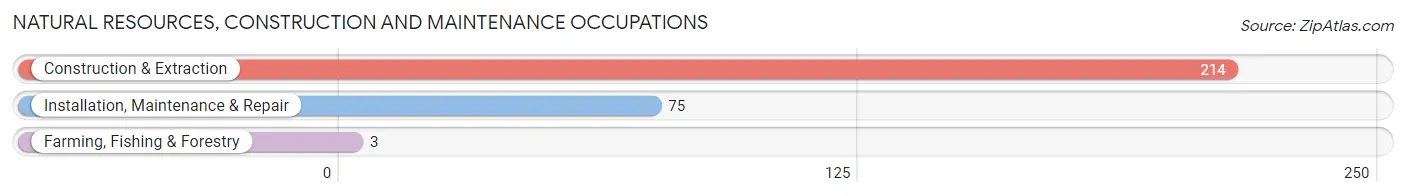
Natural Resources, Construction and Maintenance Occupations by Sex

| Occupation | Male | Female |
| Farming, Fishing & Forestry | 3 (100.0%) | 0 (0.0%) |
| Construction & Extraction | 214 (100.0%) | 0 (0.0%) |
| Installation, Maintenance & Repair | 75 (100.0%) | 0 (0.0%) |
| Total (Category) | 292 (100.0%) | 0 (0.0%) |
| Total (Overall) | 1,065 (53.1%) | 940 (46.9%) |
Production, Transportation and Moving Occupations
The most common Production, Transportation and Moving occupations in Menifee County are Production (217 | 10.8%), Material Moving (82 | 4.1%), and Transportation (71 | 3.5%).
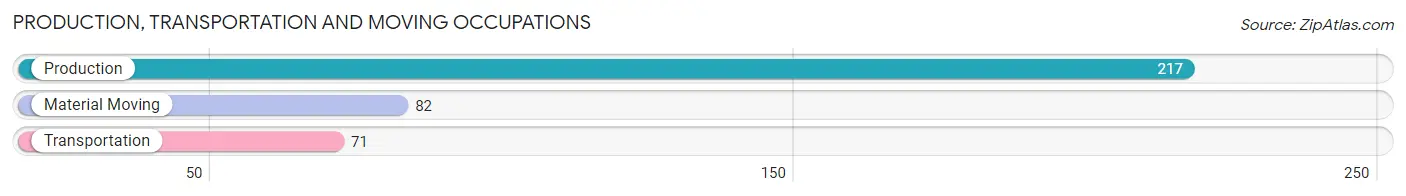
Production, Transportation and Moving Occupations by Sex
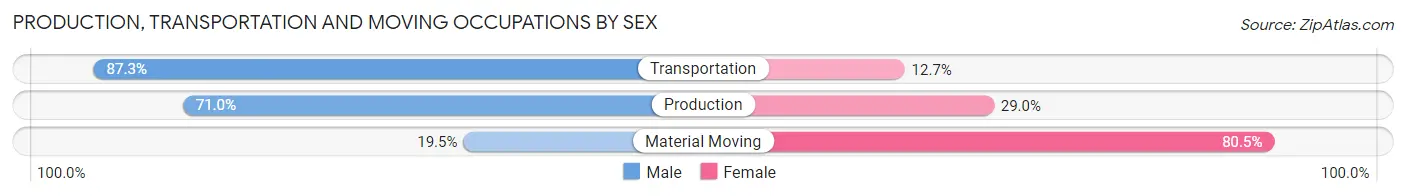
| Occupation | Male | Female |
| Production | 154 (71.0%) | 63 (29.0%) |
| Transportation | 62 (87.3%) | 9 (12.7%) |
| Material Moving | 16 (19.5%) | 66 (80.5%) |
| Total (Category) | 232 (62.7%) | 138 (37.3%) |
| Total (Overall) | 1,065 (53.1%) | 940 (46.9%) |
Employment Industries by Sex in Menifee County
Employment Industries in Menifee County
The major employment industries in Menifee County include Manufacturing (404 | 20.2%), Health Care & Social Assistance (384 | 19.2%), Retail Trade (232 | 11.6%), Construction (222 | 11.1%), and Public Administration (126 | 6.3%).
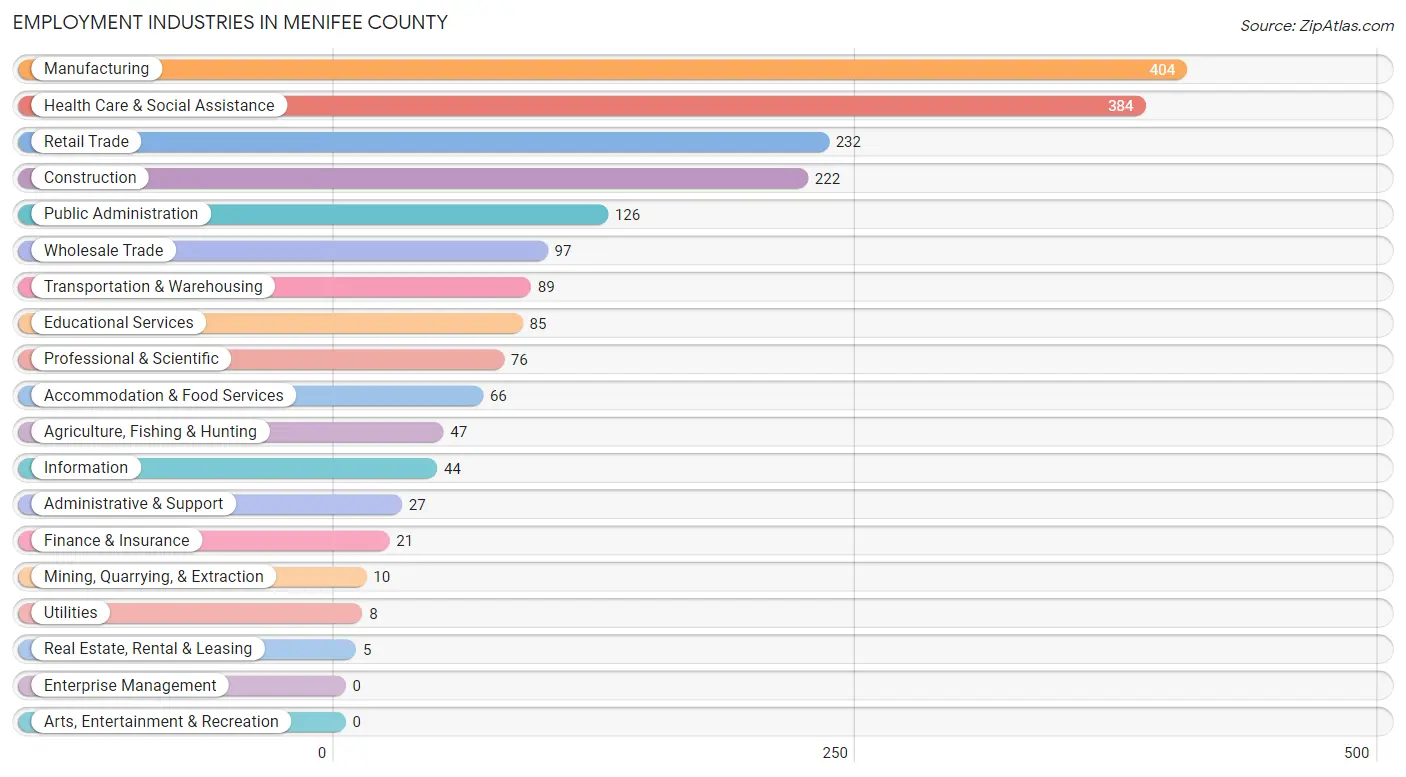
Employment Industries by Sex in Menifee County
The Menifee County industries that see more men than women are Agriculture, Fishing & Hunting (100.0%), Mining, Quarrying, & Extraction (100.0%), and Utilities (100.0%), whereas the industries that tend to have a higher number of women are Educational Services (81.2%), Information (75.0%), and Wholesale Trade (74.2%).
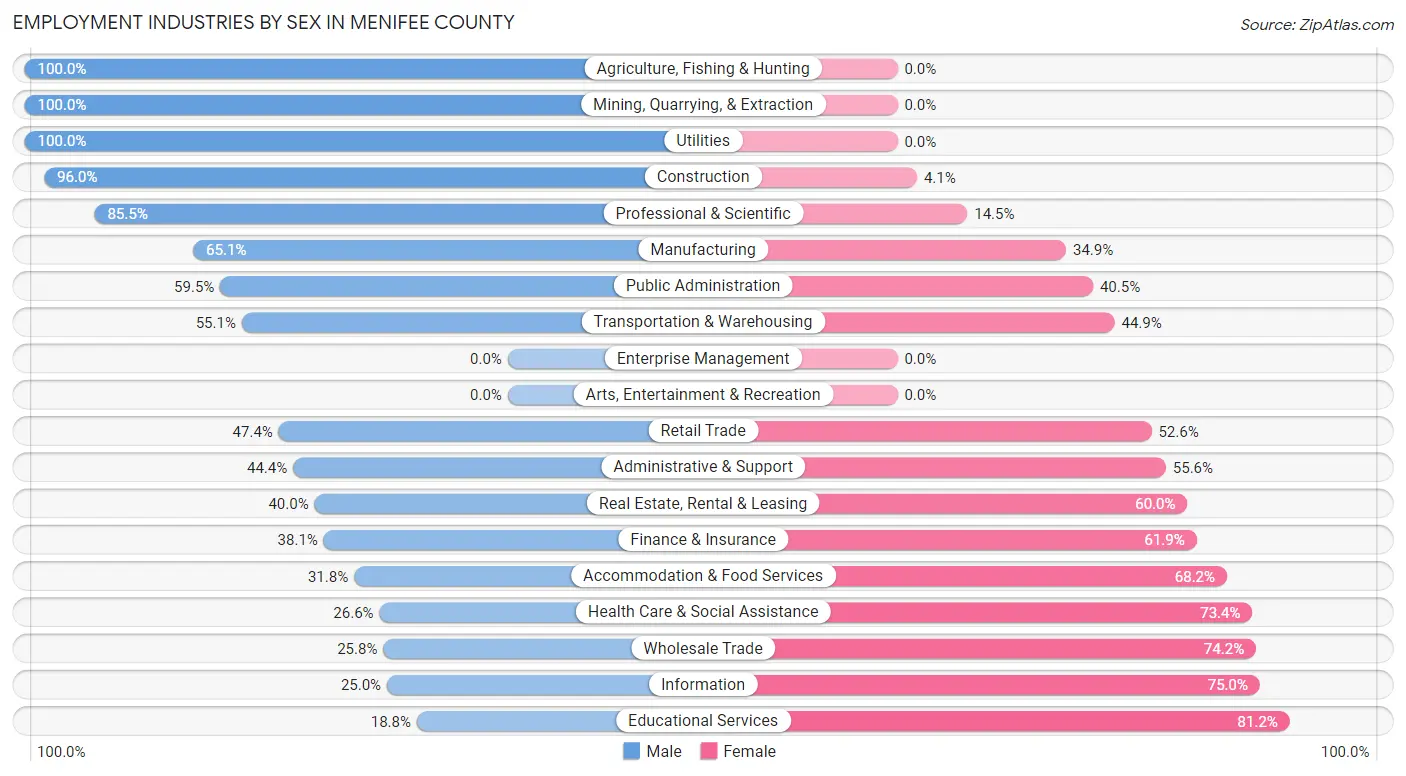
| Industry | Male | Female |
| Agriculture, Fishing & Hunting | 47 (100.0%) | 0 (0.0%) |
| Mining, Quarrying, & Extraction | 10 (100.0%) | 0 (0.0%) |
| Construction | 213 (96.0%) | 9 (4.1%) |
| Manufacturing | 263 (65.1%) | 141 (34.9%) |
| Wholesale Trade | 25 (25.8%) | 72 (74.2%) |
| Retail Trade | 110 (47.4%) | 122 (52.6%) |
| Transportation & Warehousing | 49 (55.1%) | 40 (44.9%) |
| Utilities | 8 (100.0%) | 0 (0.0%) |
| Information | 11 (25.0%) | 33 (75.0%) |
| Finance & Insurance | 8 (38.1%) | 13 (61.9%) |
| Real Estate, Rental & Leasing | 2 (40.0%) | 3 (60.0%) |
| Professional & Scientific | 65 (85.5%) | 11 (14.5%) |
| Enterprise Management | 0 (0.0%) | 0 (0.0%) |
| Administrative & Support | 12 (44.4%) | 15 (55.6%) |
| Educational Services | 16 (18.8%) | 69 (81.2%) |
| Health Care & Social Assistance | 102 (26.6%) | 282 (73.4%) |
| Arts, Entertainment & Recreation | 0 (0.0%) | 0 (0.0%) |
| Accommodation & Food Services | 21 (31.8%) | 45 (68.2%) |
| Public Administration | 75 (59.5%) | 51 (40.5%) |
| Total | 1,065 (53.1%) | 940 (46.9%) |
Education in Menifee County
School Enrollment in Menifee County
The most common levels of schooling among the 1,095 students in Menifee County are middle school (312 | 28.5%), elementary school (287 | 26.2%), and high school (218 | 19.9%).
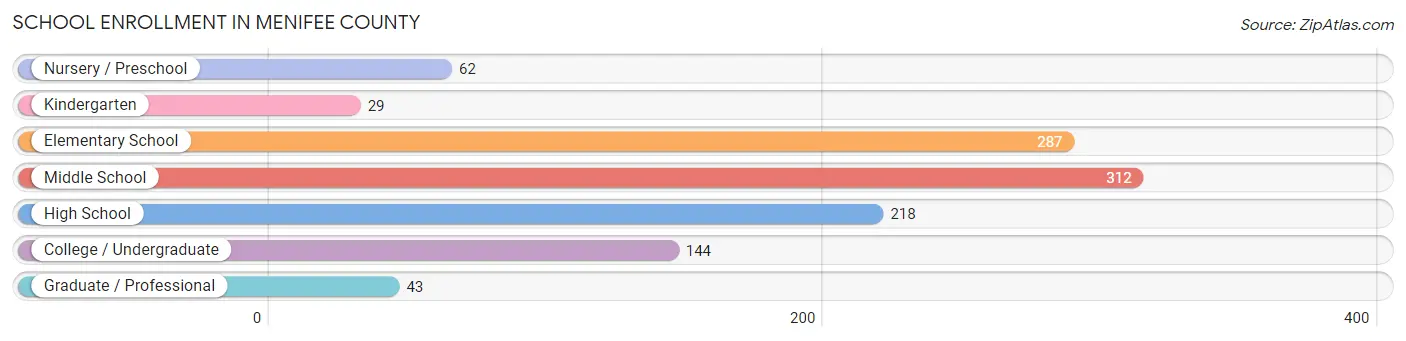
| School Level | # Students | % Students |
| Nursery / Preschool | 62 | 5.7% |
| Kindergarten | 29 | 2.6% |
| Elementary School | 287 | 26.2% |
| Middle School | 312 | 28.5% |
| High School | 218 | 19.9% |
| College / Undergraduate | 144 | 13.2% |
| Graduate / Professional | 43 | 3.9% |
| Total | 1,095 | 100.0% |
School Enrollment by Age by Funding Source in Menifee County
Out of a total of 1,095 students who are enrolled in schools in Menifee County, 105 (9.6%) attend a private institution, while the remaining 990 (90.4%) are enrolled in public schools. The age group of 20 to 24 year olds has the highest likelihood of being enrolled in private schools, with 16 (43.2% in the age bracket) enrolled. Conversely, the age group of 3 to 4 year olds has the lowest likelihood of being enrolled in a private school, with 28 (100.0% in the age bracket) attending a public institution.
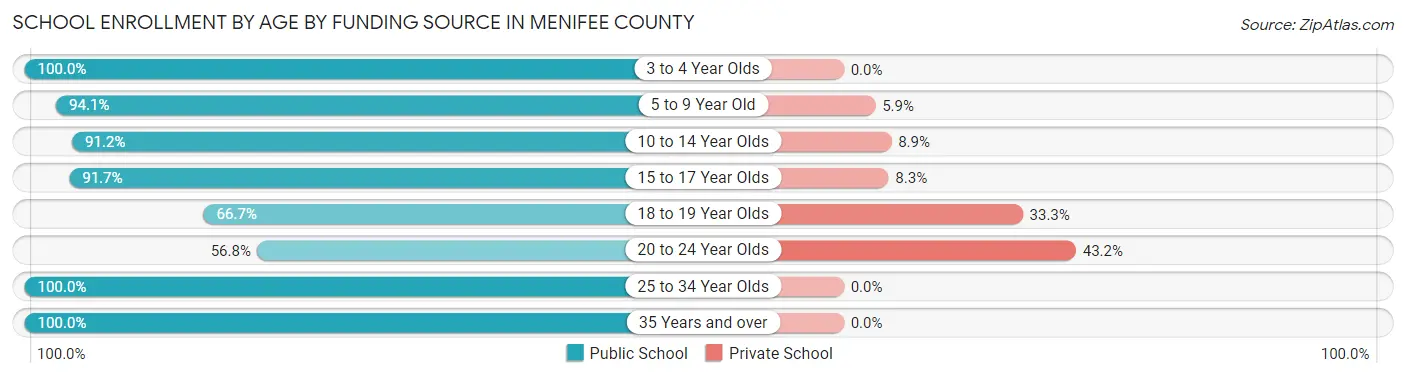
| Age Bracket | Public School | Private School |
| 3 to 4 Year Olds | 28 (100.0%) | 0 (0.0%) |
| 5 to 9 Year Old | 272 (94.1%) | 17 (5.9%) |
| 10 to 14 Year Olds | 371 (91.1%) | 36 (8.8%) |
| 15 to 17 Year Olds | 143 (91.7%) | 13 (8.3%) |
| 18 to 19 Year Olds | 46 (66.7%) | 23 (33.3%) |
| 20 to 24 Year Olds | 21 (56.8%) | 16 (43.2%) |
| 25 to 34 Year Olds | 27 (100.0%) | 0 (0.0%) |
| 35 Years and over | 82 (100.0%) | 0 (0.0%) |
| Total | 990 (90.4%) | 105 (9.6%) |
Educational Attainment by Field of Study in Menifee County
Science & technology (84 | 15.8%), bio, nature & agricultural (71 | 13.4%), business (67 | 12.6%), psychology (64 | 12.0%), and social sciences (64 | 12.0%) are the most common fields of study among 531 individuals in Menifee County who have obtained a bachelor's degree or higher.
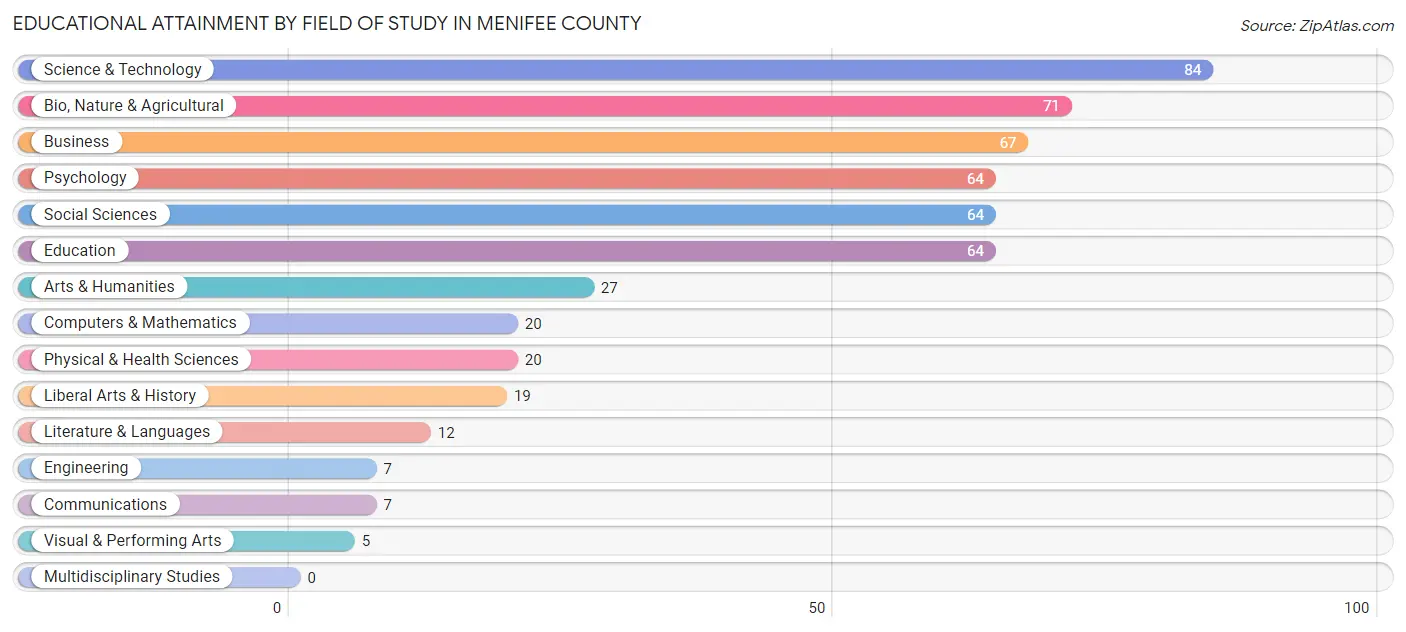
| Field of Study | # Graduates | % Graduates |
| Computers & Mathematics | 20 | 3.8% |
| Bio, Nature & Agricultural | 71 | 13.4% |
| Physical & Health Sciences | 20 | 3.8% |
| Psychology | 64 | 12.0% |
| Social Sciences | 64 | 12.0% |
| Engineering | 7 | 1.3% |
| Multidisciplinary Studies | 0 | 0.0% |
| Science & Technology | 84 | 15.8% |
| Business | 67 | 12.6% |
| Education | 64 | 12.0% |
| Literature & Languages | 12 | 2.3% |
| Liberal Arts & History | 19 | 3.6% |
| Visual & Performing Arts | 5 | 0.9% |
| Communications | 7 | 1.3% |
| Arts & Humanities | 27 | 5.1% |
| Total | 531 | 100.0% |
Transportation & Commute in Menifee County
Vehicle Availability by Sex in Menifee County
The most prevalent vehicle ownership categories in Menifee County are males with 2 vehicles (524, accounting for 49.3%) and females with 2 vehicles (457, making up 56.8%).
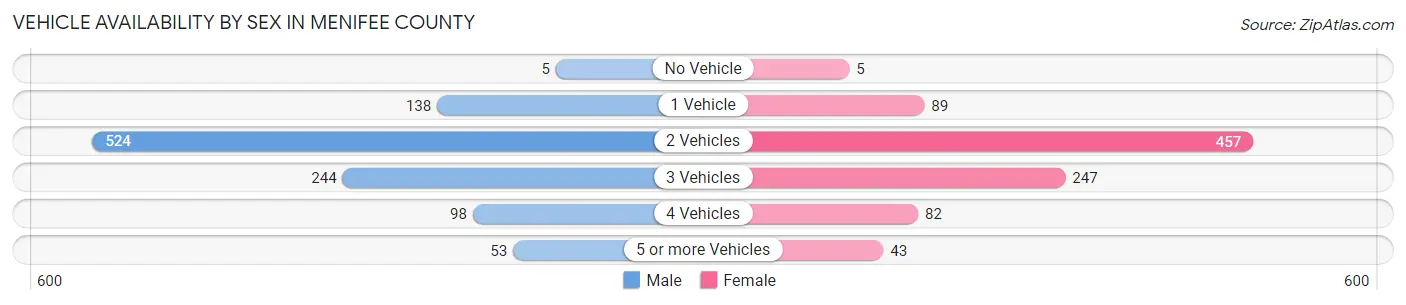
| Vehicles Available | Male | Female |
| No Vehicle | 5 (0.5%) | 5 (0.5%) |
| 1 Vehicle | 138 (13.0%) | 89 (9.6%) |
| 2 Vehicles | 524 (49.3%) | 457 (49.5%) |
| 3 Vehicles | 244 (23.0%) | 247 (26.8%) |
| 4 Vehicles | 98 (9.2%) | 82 (8.9%) |
| 5 or more Vehicles | 53 (5.0%) | 43 (4.7%) |
| Total | 1,062 (100.0%) | 923 (100.0%) |
Commute Time in Menifee County
The most frequently occuring commute durations in Menifee County are 45 to 59 minutes (355 commuters, 20.3%), 30 to 34 minutes (292 commuters, 16.7%), and 90 or more minutes (240 commuters, 13.7%).
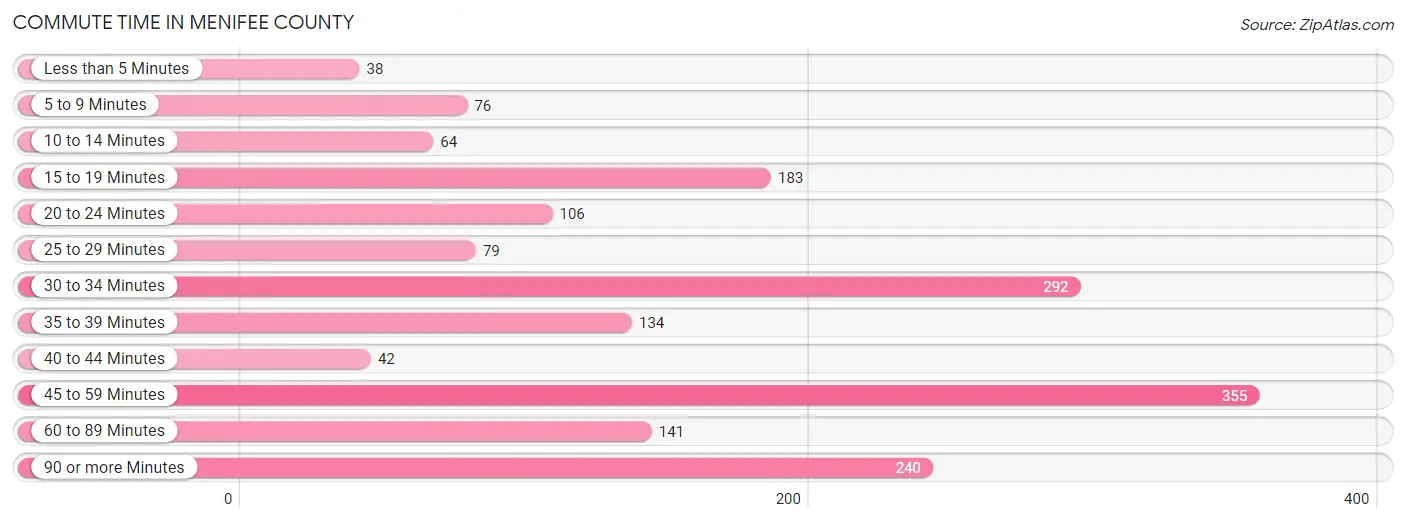
| Commute Time | # Commuters | % Commuters |
| Less than 5 Minutes | 38 | 2.2% |
| 5 to 9 Minutes | 76 | 4.3% |
| 10 to 14 Minutes | 64 | 3.7% |
| 15 to 19 Minutes | 183 | 10.5% |
| 20 to 24 Minutes | 106 | 6.1% |
| 25 to 29 Minutes | 79 | 4.5% |
| 30 to 34 Minutes | 292 | 16.7% |
| 35 to 39 Minutes | 134 | 7.7% |
| 40 to 44 Minutes | 42 | 2.4% |
| 45 to 59 Minutes | 355 | 20.3% |
| 60 to 89 Minutes | 141 | 8.1% |
| 90 or more Minutes | 240 | 13.7% |
Commute Time by Sex in Menifee County
The most common commute times in Menifee County are 45 to 59 minutes (199 commuters, 20.9%) for males and 15 to 19 minutes (173 commuters, 21.7%) for females.
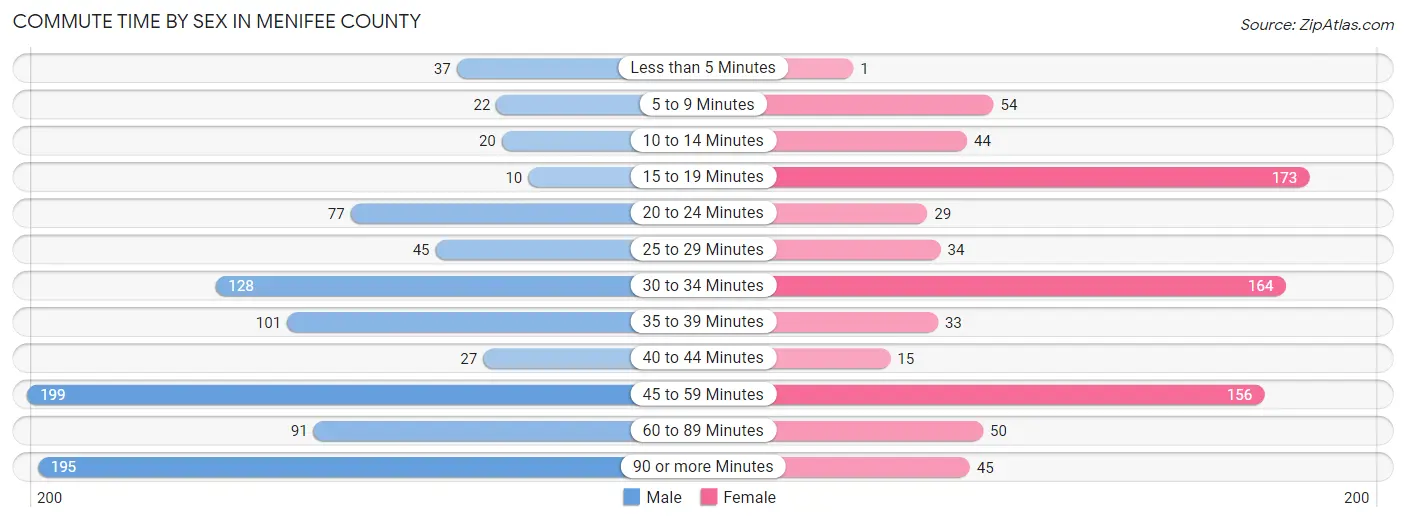
| Commute Time | Male | Female |
| Less than 5 Minutes | 37 (3.9%) | 1 (0.1%) |
| 5 to 9 Minutes | 22 (2.3%) | 54 (6.8%) |
| 10 to 14 Minutes | 20 (2.1%) | 44 (5.5%) |
| 15 to 19 Minutes | 10 (1.1%) | 173 (21.7%) |
| 20 to 24 Minutes | 77 (8.1%) | 29 (3.6%) |
| 25 to 29 Minutes | 45 (4.7%) | 34 (4.3%) |
| 30 to 34 Minutes | 128 (13.5%) | 164 (20.5%) |
| 35 to 39 Minutes | 101 (10.6%) | 33 (4.1%) |
| 40 to 44 Minutes | 27 (2.8%) | 15 (1.9%) |
| 45 to 59 Minutes | 199 (20.9%) | 156 (19.6%) |
| 60 to 89 Minutes | 91 (9.6%) | 50 (6.3%) |
| 90 or more Minutes | 195 (20.5%) | 45 (5.6%) |
Time of Departure to Work by Sex in Menifee County
The most frequent times of departure to work in Menifee County are 7:00 AM to 7:29 AM (206, 21.6%) for males and 6:00 AM to 6:29 AM (275, 34.5%) for females.
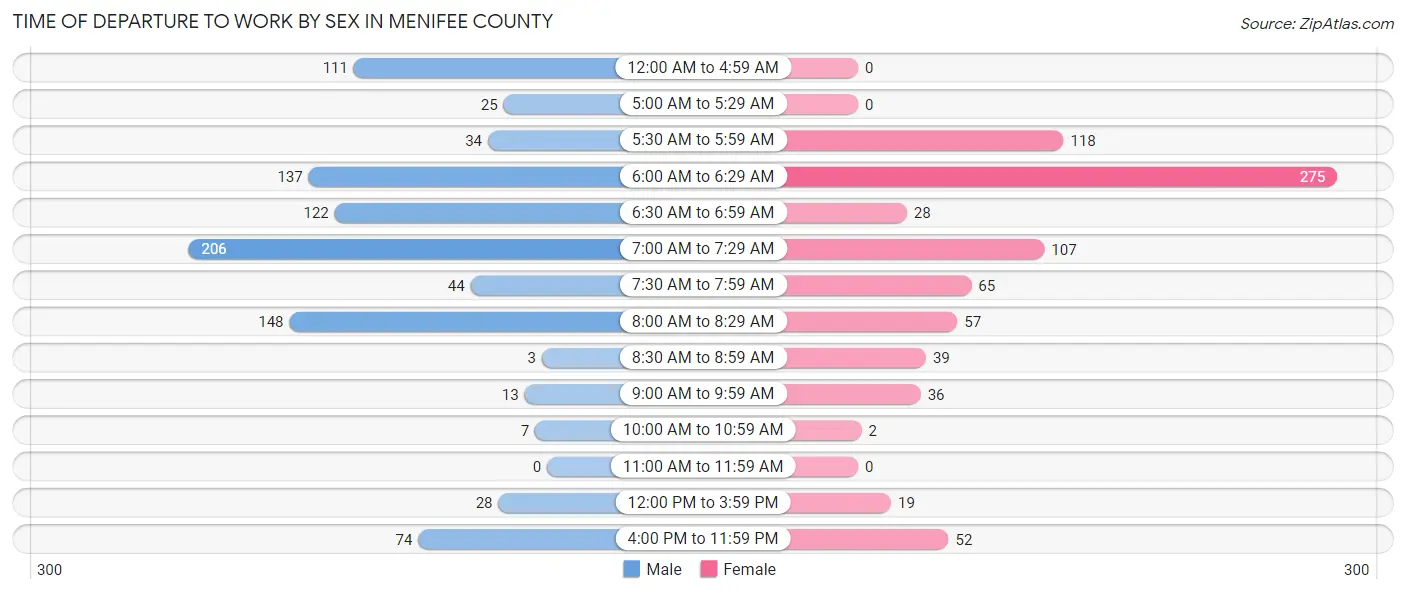
| Time of Departure | Male | Female |
| 12:00 AM to 4:59 AM | 111 (11.7%) | 0 (0.0%) |
| 5:00 AM to 5:29 AM | 25 (2.6%) | 0 (0.0%) |
| 5:30 AM to 5:59 AM | 34 (3.6%) | 118 (14.8%) |
| 6:00 AM to 6:29 AM | 137 (14.4%) | 275 (34.5%) |
| 6:30 AM to 6:59 AM | 122 (12.8%) | 28 (3.5%) |
| 7:00 AM to 7:29 AM | 206 (21.6%) | 107 (13.4%) |
| 7:30 AM to 7:59 AM | 44 (4.6%) | 65 (8.2%) |
| 8:00 AM to 8:29 AM | 148 (15.5%) | 57 (7.1%) |
| 8:30 AM to 8:59 AM | 3 (0.3%) | 39 (4.9%) |
| 9:00 AM to 9:59 AM | 13 (1.4%) | 36 (4.5%) |
| 10:00 AM to 10:59 AM | 7 (0.7%) | 2 (0.3%) |
| 11:00 AM to 11:59 AM | 0 (0.0%) | 0 (0.0%) |
| 12:00 PM to 3:59 PM | 28 (2.9%) | 19 (2.4%) |
| 4:00 PM to 11:59 PM | 74 (7.8%) | 52 (6.5%) |
| Total | 952 (100.0%) | 798 (100.0%) |
Housing Occupancy in Menifee County
Occupancy by Ownership in Menifee County
Of the total 2,262 dwellings in Menifee County, owner-occupied units account for 1,675 (74.1%), while renter-occupied units make up 587 (26.0%).
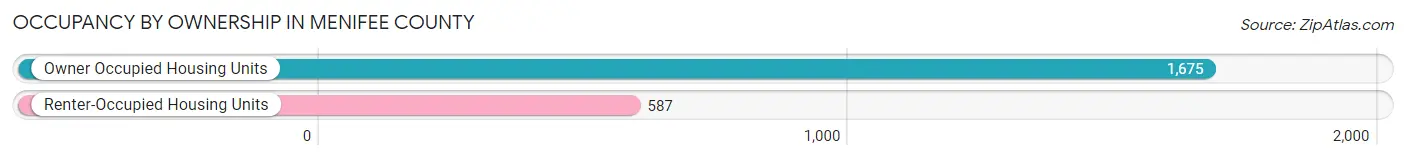
| Occupancy | # Housing Units | % Housing Units |
| Owner Occupied Housing Units | 1,675 | 74.1% |
| Renter-Occupied Housing Units | 587 | 26.0% |
| Total Occupied Housing Units | 2,262 | 100.0% |
Occupancy by Household Size in Menifee County
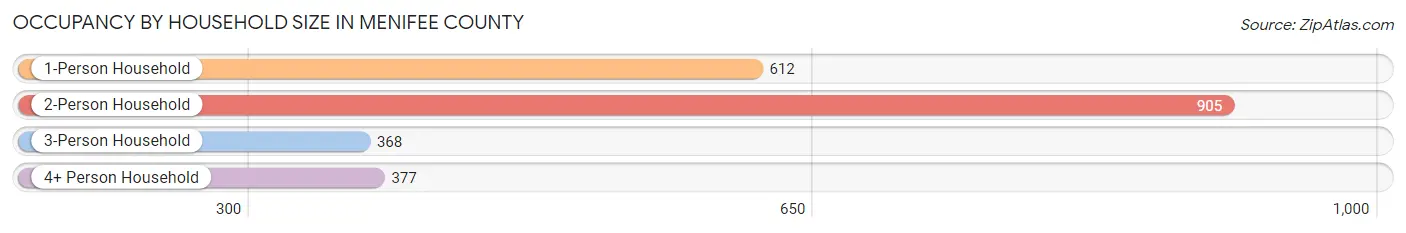
| Household Size | # Housing Units | % Housing Units |
| 1-Person Household | 612 | 27.1% |
| 2-Person Household | 905 | 40.0% |
| 3-Person Household | 368 | 16.3% |
| 4+ Person Household | 377 | 16.7% |
| Total Housing Units | 2,262 | 100.0% |
Occupancy by Ownership by Household Size in Menifee County
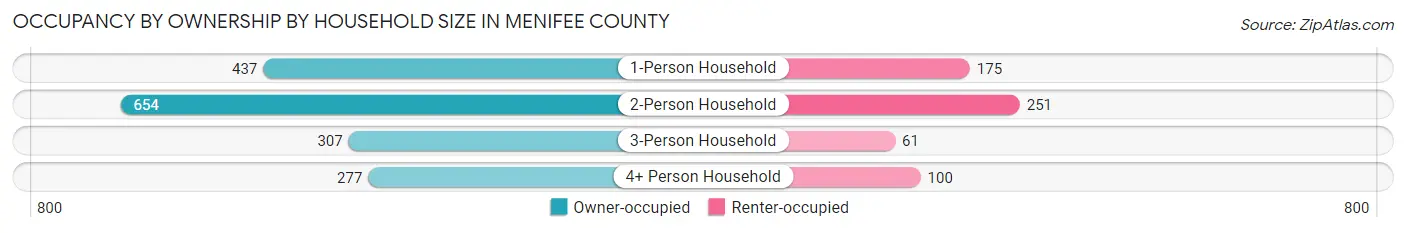
| Household Size | Owner-occupied | Renter-occupied |
| 1-Person Household | 437 (71.4%) | 175 (28.6%) |
| 2-Person Household | 654 (72.3%) | 251 (27.7%) |
| 3-Person Household | 307 (83.4%) | 61 (16.6%) |
| 4+ Person Household | 277 (73.5%) | 100 (26.5%) |
| Total Housing Units | 1,675 (74.1%) | 587 (26.0%) |
Occupancy by Educational Attainment in Menifee County
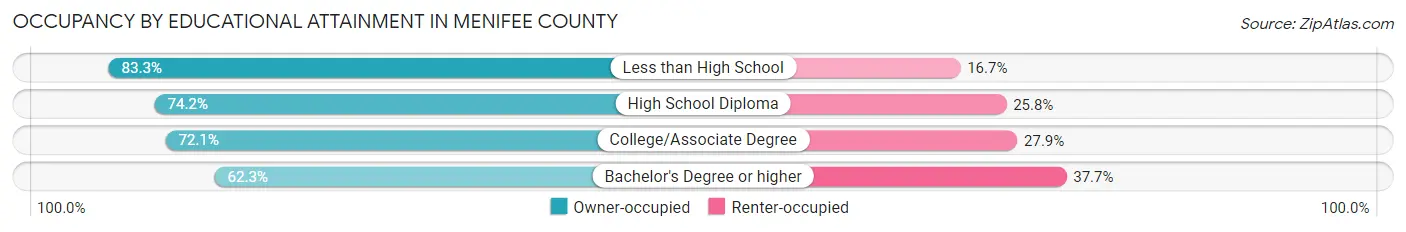
| Household Size | Owner-occupied | Renter-occupied |
| Less than High School | 430 (83.3%) | 86 (16.7%) |
| High School Diploma | 622 (74.2%) | 216 (25.8%) |
| College/Associate Degree | 423 (72.1%) | 164 (27.9%) |
| Bachelor's Degree or higher | 200 (62.3%) | 121 (37.7%) |
Occupancy by Age of Householder in Menifee County
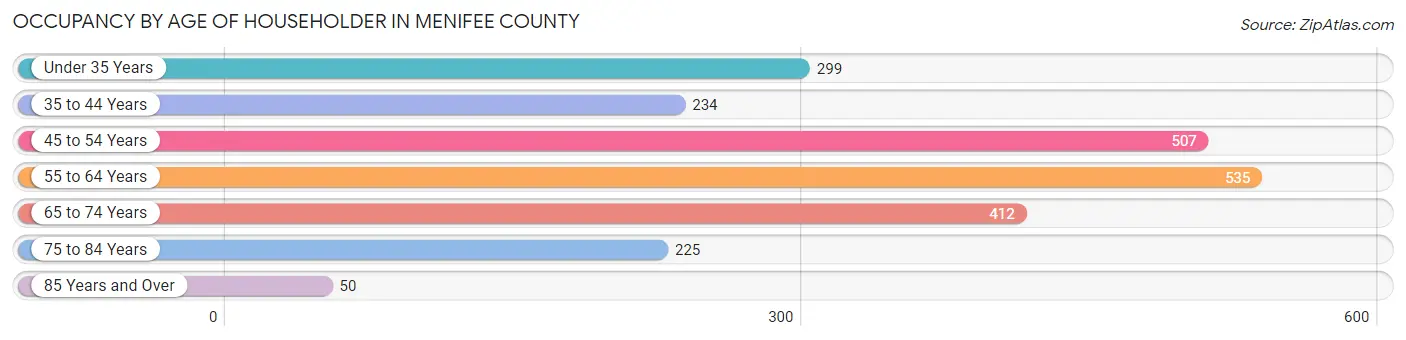
| Age Bracket | # Households | % Households |
| Under 35 Years | 299 | 13.2% |
| 35 to 44 Years | 234 | 10.3% |
| 45 to 54 Years | 507 | 22.4% |
| 55 to 64 Years | 535 | 23.6% |
| 65 to 74 Years | 412 | 18.2% |
| 75 to 84 Years | 225 | 10.0% |
| 85 Years and Over | 50 | 2.2% |
| Total | 2,262 | 100.0% |
Housing Finances in Menifee County
Median Income by Occupancy in Menifee County
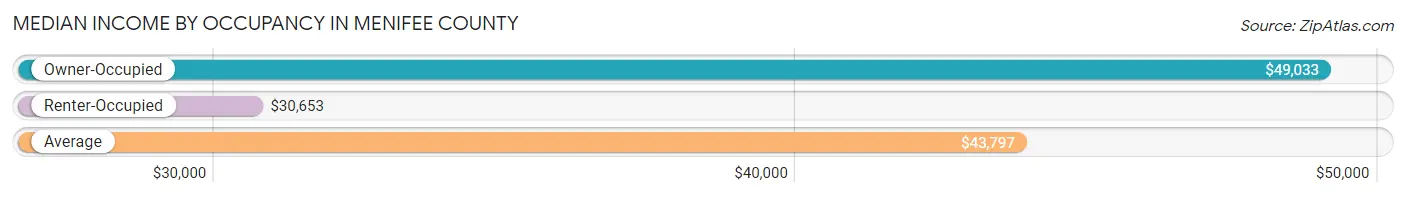
| Occupancy Type | # Households | Median Income |
| Owner-Occupied | 1,675 (74.1%) | $49,033 |
| Renter-Occupied | 587 (26.0%) | $30,653 |
| Average | 2,262 (100.0%) | $43,797 |
Occupancy by Householder Income Bracket in Menifee County
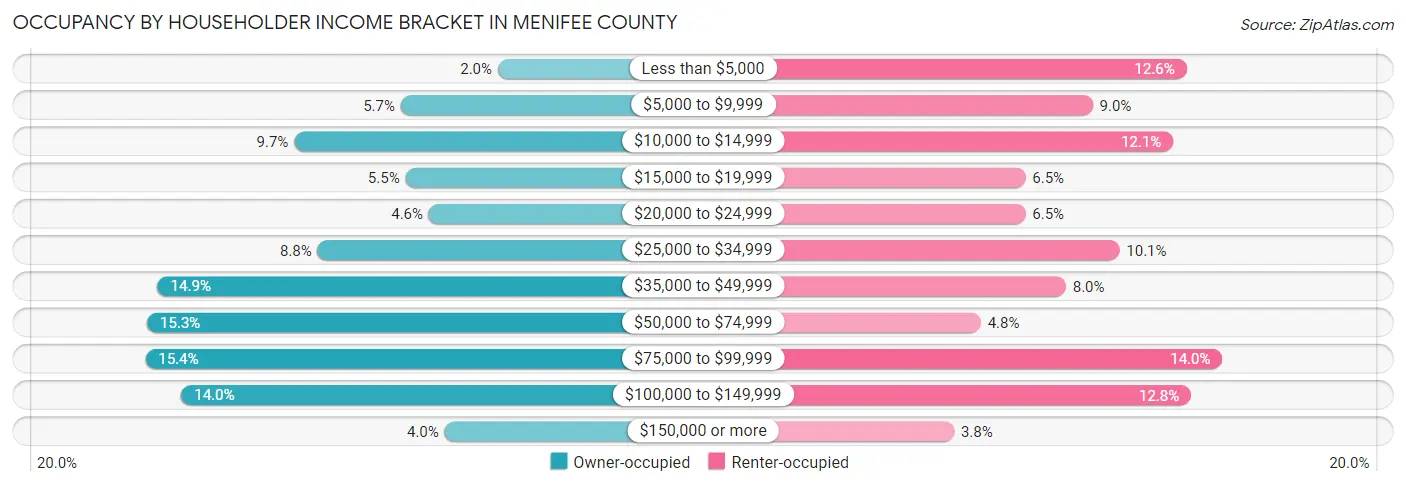
| Income Bracket | Owner-occupied | Renter-occupied |
| Less than $5,000 | 33 (2.0%) | 74 (12.6%) |
| $5,000 to $9,999 | 95 (5.7%) | 53 (9.0%) |
| $10,000 to $14,999 | 163 (9.7%) | 71 (12.1%) |
| $15,000 to $19,999 | 92 (5.5%) | 38 (6.5%) |
| $20,000 to $24,999 | 77 (4.6%) | 38 (6.5%) |
| $25,000 to $34,999 | 148 (8.8%) | 59 (10.1%) |
| $35,000 to $49,999 | 250 (14.9%) | 47 (8.0%) |
| $50,000 to $74,999 | 257 (15.3%) | 28 (4.8%) |
| $75,000 to $99,999 | 258 (15.4%) | 82 (14.0%) |
| $100,000 to $149,999 | 235 (14.0%) | 75 (12.8%) |
| $150,000 or more | 67 (4.0%) | 22 (3.7%) |
| Total | 1,675 (100.0%) | 587 (100.0%) |
Monthly Housing Cost Tiers in Menifee County
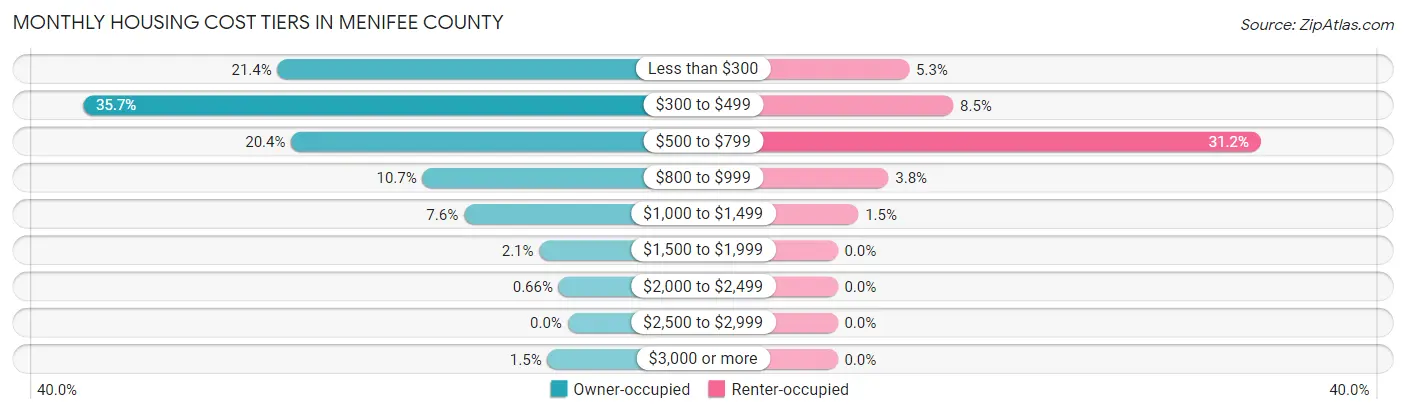
| Monthly Cost | Owner-occupied | Renter-occupied |
| Less than $300 | 358 (21.4%) | 31 (5.3%) |
| $300 to $499 | 598 (35.7%) | 50 (8.5%) |
| $500 to $799 | 341 (20.4%) | 183 (31.2%) |
| $800 to $999 | 179 (10.7%) | 22 (3.7%) |
| $1,000 to $1,499 | 128 (7.6%) | 9 (1.5%) |
| $1,500 to $1,999 | 35 (2.1%) | 0 (0.0%) |
| $2,000 to $2,499 | 11 (0.7%) | 0 (0.0%) |
| $2,500 to $2,999 | 0 (0.0%) | 0 (0.0%) |
| $3,000 or more | 25 (1.5%) | 0 (0.0%) |
| Total | 1,675 (100.0%) | 587 (100.0%) |
Physical Housing Characteristics in Menifee County
Housing Structures in Menifee County
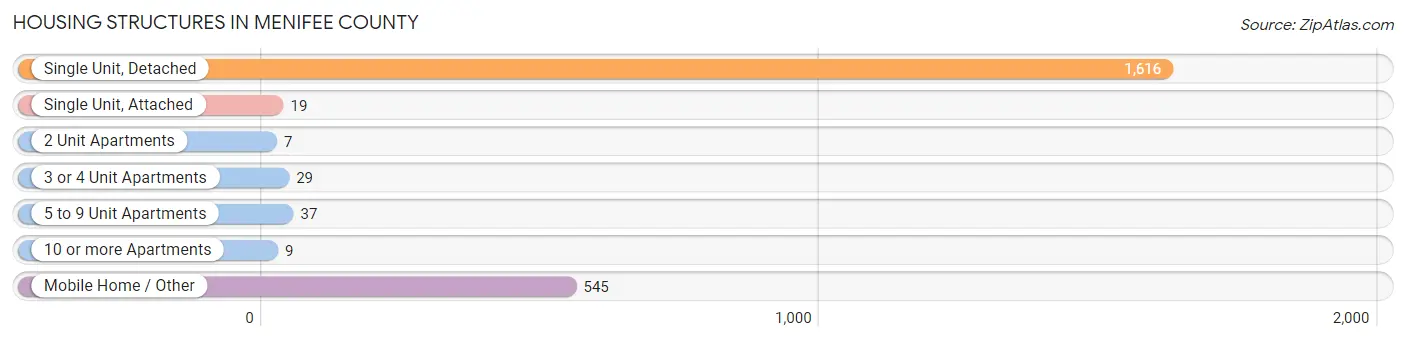
| Structure Type | # Housing Units | % Housing Units |
| Single Unit, Detached | 1,616 | 71.4% |
| Single Unit, Attached | 19 | 0.8% |
| 2 Unit Apartments | 7 | 0.3% |
| 3 or 4 Unit Apartments | 29 | 1.3% |
| 5 to 9 Unit Apartments | 37 | 1.6% |
| 10 or more Apartments | 9 | 0.4% |
| Mobile Home / Other | 545 | 24.1% |
| Total | 2,262 | 100.0% |
Housing Structures by Occupancy in Menifee County
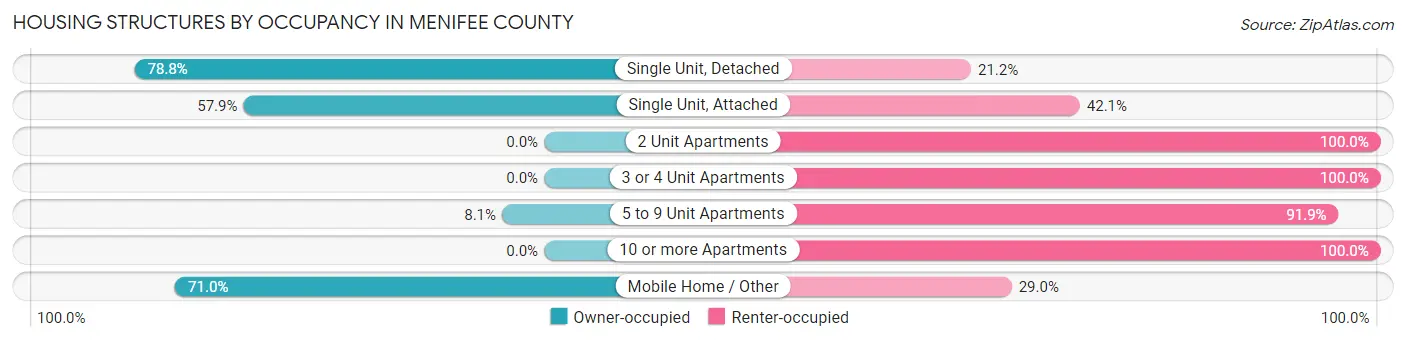
| Structure Type | Owner-occupied | Renter-occupied |
| Single Unit, Detached | 1,274 (78.8%) | 342 (21.2%) |
| Single Unit, Attached | 11 (57.9%) | 8 (42.1%) |
| 2 Unit Apartments | 0 (0.0%) | 7 (100.0%) |
| 3 or 4 Unit Apartments | 0 (0.0%) | 29 (100.0%) |
| 5 to 9 Unit Apartments | 3 (8.1%) | 34 (91.9%) |
| 10 or more Apartments | 0 (0.0%) | 9 (100.0%) |
| Mobile Home / Other | 387 (71.0%) | 158 (29.0%) |
| Total | 1,675 (74.1%) | 587 (26.0%) |
Housing Structures by Number of Rooms in Menifee County
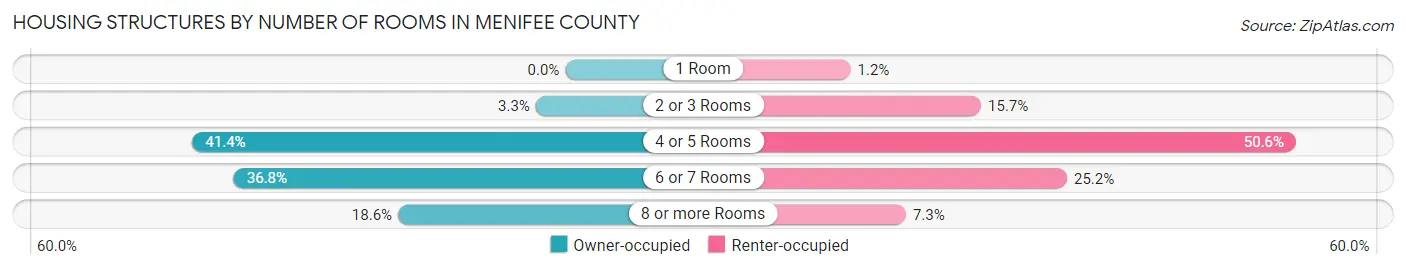
| Number of Rooms | Owner-occupied | Renter-occupied |
| 1 Room | 0 (0.0%) | 7 (1.2%) |
| 2 or 3 Rooms | 55 (3.3%) | 92 (15.7%) |
| 4 or 5 Rooms | 693 (41.4%) | 297 (50.6%) |
| 6 or 7 Rooms | 616 (36.8%) | 148 (25.2%) |
| 8 or more Rooms | 311 (18.6%) | 43 (7.3%) |
| Total | 1,675 (100.0%) | 587 (100.0%) |
Housing Structure by Heating Type in Menifee County
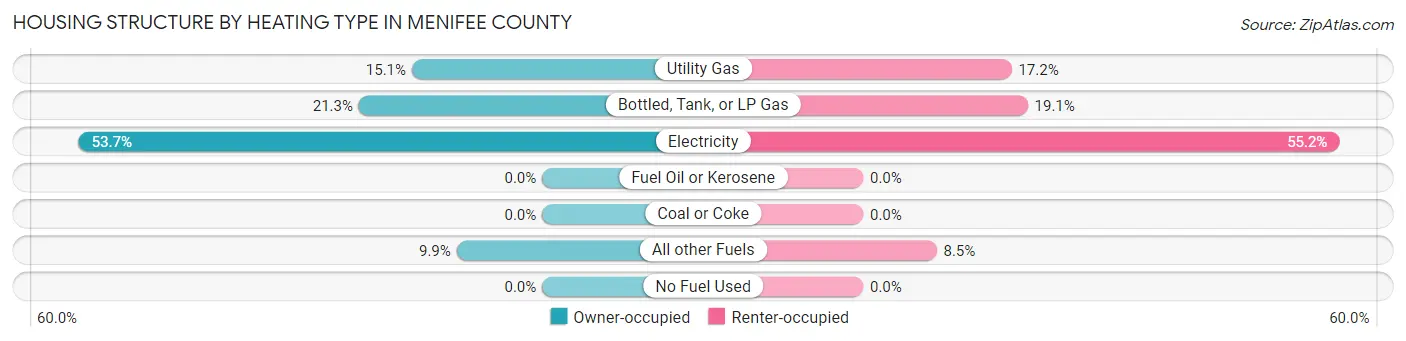
| Heating Type | Owner-occupied | Renter-occupied |
| Utility Gas | 253 (15.1%) | 101 (17.2%) |
| Bottled, Tank, or LP Gas | 356 (21.2%) | 112 (19.1%) |
| Electricity | 900 (53.7%) | 324 (55.2%) |
| Fuel Oil or Kerosene | 0 (0.0%) | 0 (0.0%) |
| Coal or Coke | 0 (0.0%) | 0 (0.0%) |
| All other Fuels | 166 (9.9%) | 50 (8.5%) |
| No Fuel Used | 0 (0.0%) | 0 (0.0%) |
| Total | 1,675 (100.0%) | 587 (100.0%) |
Household Vehicle Usage in Menifee County
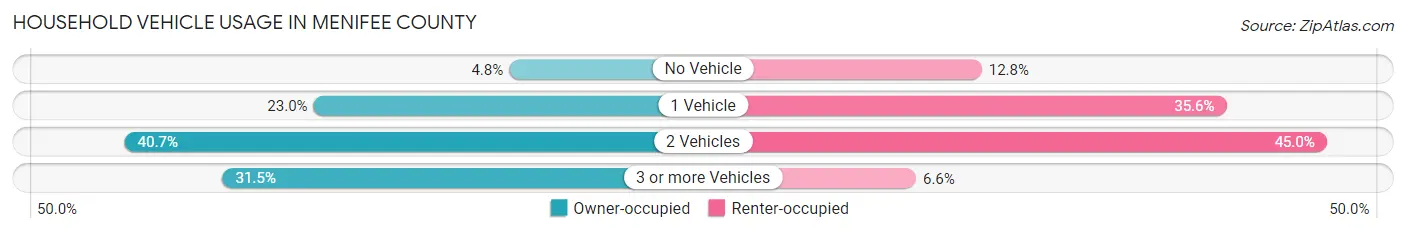
| Vehicles per Household | Owner-occupied | Renter-occupied |
| No Vehicle | 80 (4.8%) | 75 (12.8%) |
| 1 Vehicle | 386 (23.0%) | 209 (35.6%) |
| 2 Vehicles | 681 (40.7%) | 264 (45.0%) |
| 3 or more Vehicles | 528 (31.5%) | 39 (6.6%) |
| Total | 1,675 (100.0%) | 587 (100.0%) |
Real Estate & Mortgages in Menifee County
Real Estate and Mortgage Overview in Menifee County
| Characteristic | Without Mortgage | With Mortgage |
| Housing Units | 1,052 | 623 |
| Median Property Value | $114,500 | $95,600 |
| Median Household Income | $44,067 | $37 |
| Monthly Housing Costs | $334 | $25 |
| Real Estate Taxes | $480 | $73 |
Property Value by Mortgage Status in Menifee County
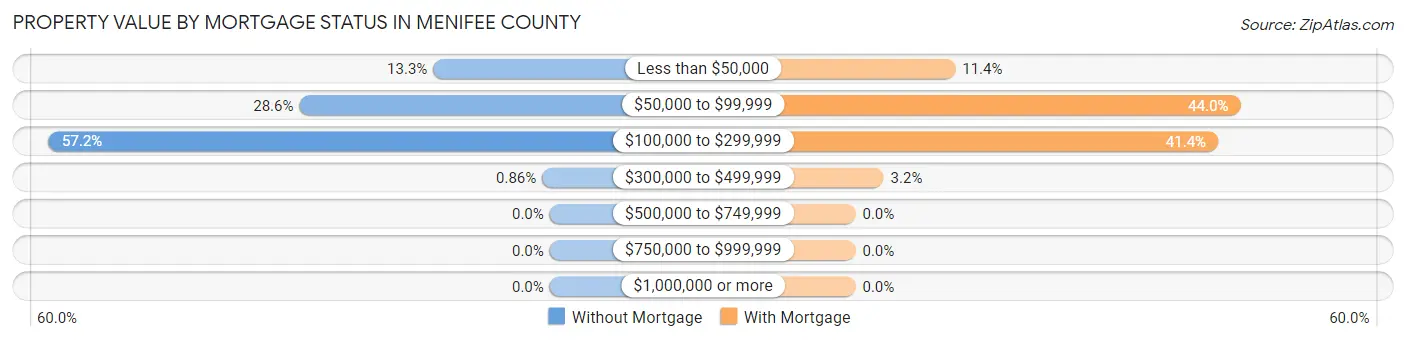
| Property Value | Without Mortgage | With Mortgage |
| Less than $50,000 | 140 (13.3%) | 71 (11.4%) |
| $50,000 to $99,999 | 301 (28.6%) | 274 (44.0%) |
| $100,000 to $299,999 | 602 (57.2%) | 258 (41.4%) |
| $300,000 to $499,999 | 9 (0.9%) | 20 (3.2%) |
| $500,000 to $749,999 | 0 (0.0%) | 0 (0.0%) |
| $750,000 to $999,999 | 0 (0.0%) | 0 (0.0%) |
| $1,000,000 or more | 0 (0.0%) | 0 (0.0%) |
| Total | 1,052 (100.0%) | 623 (100.0%) |
Household Income by Mortgage Status in Menifee County
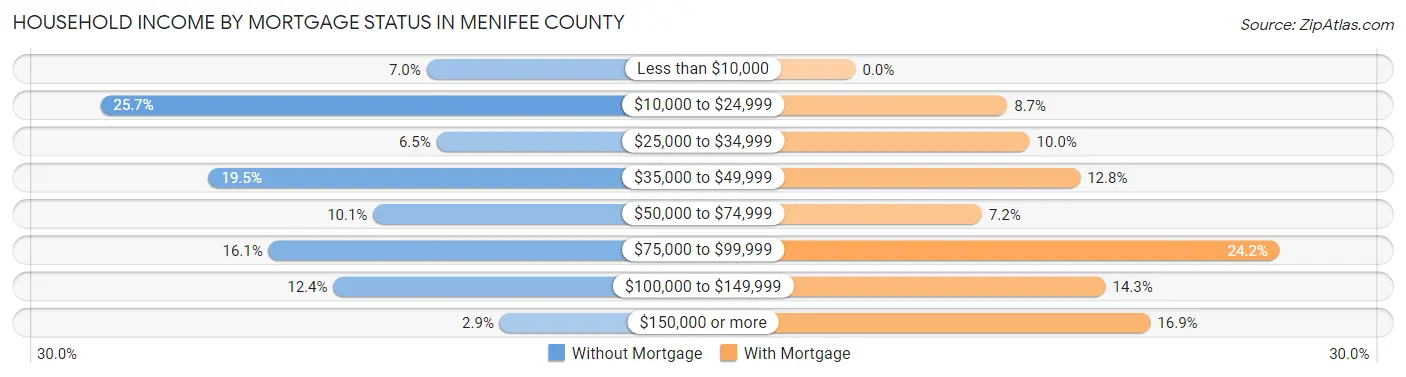
| Household Income | Without Mortgage | With Mortgage |
| Less than $10,000 | 74 (7.0%) | 0 (0.0%) |
| $10,000 to $24,999 | 270 (25.7%) | 54 (8.7%) |
| $25,000 to $34,999 | 68 (6.5%) | 62 (10.0%) |
| $35,000 to $49,999 | 205 (19.5%) | 80 (12.8%) |
| $50,000 to $74,999 | 106 (10.1%) | 45 (7.2%) |
| $75,000 to $99,999 | 169 (16.1%) | 151 (24.2%) |
| $100,000 to $149,999 | 130 (12.4%) | 89 (14.3%) |
| $150,000 or more | 30 (2.9%) | 105 (16.9%) |
| Total | 1,052 (100.0%) | 623 (100.0%) |
Property Value to Household Income Ratio in Menifee County
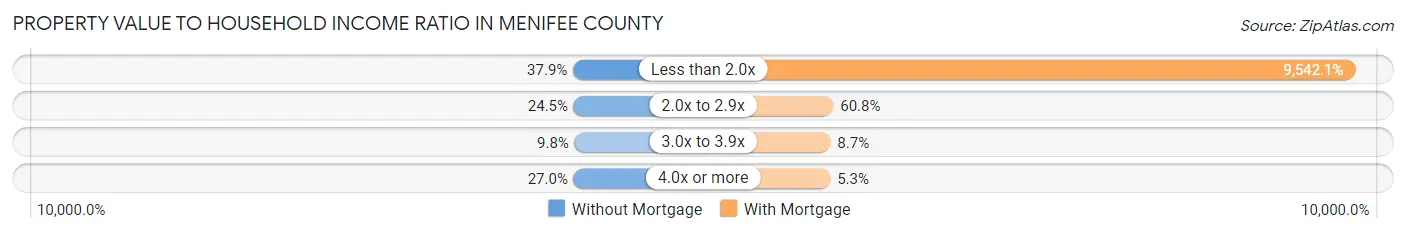
| Value-to-Income Ratio | Without Mortgage | With Mortgage |
| Less than 2.0x | 399 (37.9%) | 59,447 (9,542.1%) |
| 2.0x to 2.9x | 258 (24.5%) | 379 (60.8%) |
| 3.0x to 3.9x | 103 (9.8%) | 54 (8.7%) |
| 4.0x or more | 284 (27.0%) | 33 (5.3%) |
| Total | 1,052 (100.0%) | 623 (100.0%) |
Real Estate Taxes by Mortgage Status in Menifee County
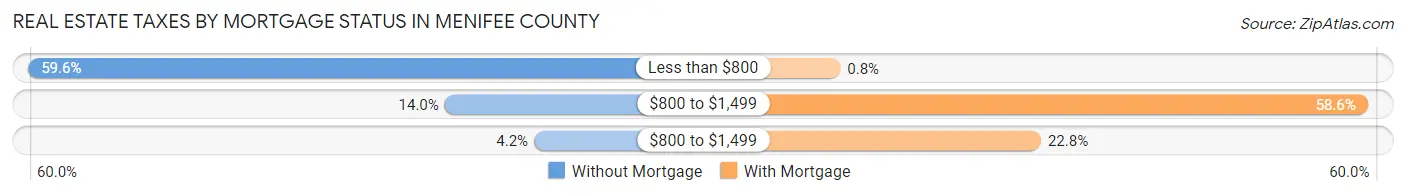
| Property Taxes | Without Mortgage | With Mortgage |
| Less than $800 | 627 (59.6%) | 5 (0.8%) |
| $800 to $1,499 | 147 (14.0%) | 365 (58.6%) |
| $800 to $1,499 | 44 (4.2%) | 142 (22.8%) |
| Total | 1,052 (100.0%) | 623 (100.0%) |
Health & Disability in Menifee County
Health Insurance Coverage by Age in Menifee County
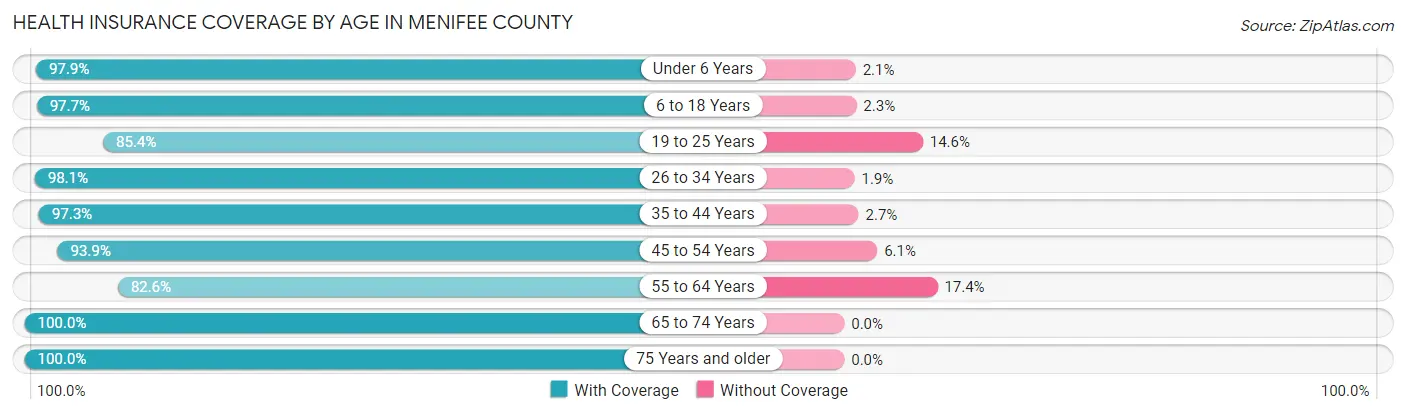
| Age Bracket | With Coverage | Without Coverage |
| Under 6 Years | 505 (97.9%) | 11 (2.1%) |
| 6 to 18 Years | 865 (97.7%) | 20 (2.3%) |
| 19 to 25 Years | 344 (85.4%) | 59 (14.6%) |
| 26 to 34 Years | 667 (98.1%) | 13 (1.9%) |
| 35 to 44 Years | 657 (97.3%) | 18 (2.7%) |
| 45 to 54 Years | 718 (93.9%) | 47 (6.1%) |
| 55 to 64 Years | 799 (82.6%) | 168 (17.4%) |
| 65 to 74 Years | 653 (100.0%) | 0 (0.0%) |
| 75 Years and older | 567 (100.0%) | 0 (0.0%) |
| Total | 5,775 (94.5%) | 336 (5.5%) |
Health Insurance Coverage by Citizenship Status in Menifee County
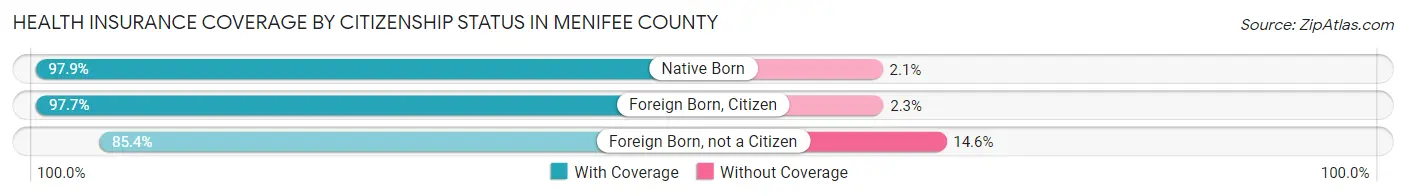
| Citizenship Status | With Coverage | Without Coverage |
| Native Born | 505 (97.9%) | 11 (2.1%) |
| Foreign Born, Citizen | 865 (97.7%) | 20 (2.3%) |
| Foreign Born, not a Citizen | 344 (85.4%) | 59 (14.6%) |
Health Insurance Coverage by Household Income in Menifee County
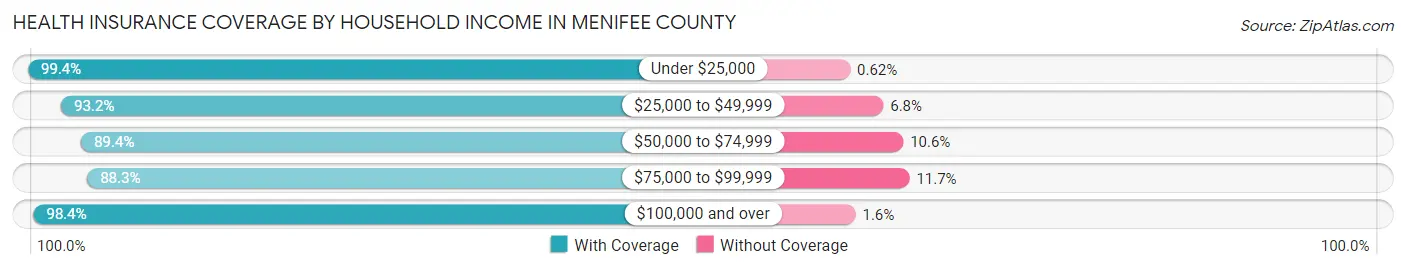
| Household Income | With Coverage | Without Coverage |
| Under $25,000 | 1,447 (99.4%) | 9 (0.6%) |
| $25,000 to $49,999 | 1,458 (93.2%) | 107 (6.8%) |
| $50,000 to $74,999 | 711 (89.4%) | 84 (10.6%) |
| $75,000 to $99,999 | 857 (88.3%) | 114 (11.7%) |
| $100,000 and over | 1,259 (98.4%) | 21 (1.6%) |
Public vs Private Health Insurance Coverage by Age in Menifee County
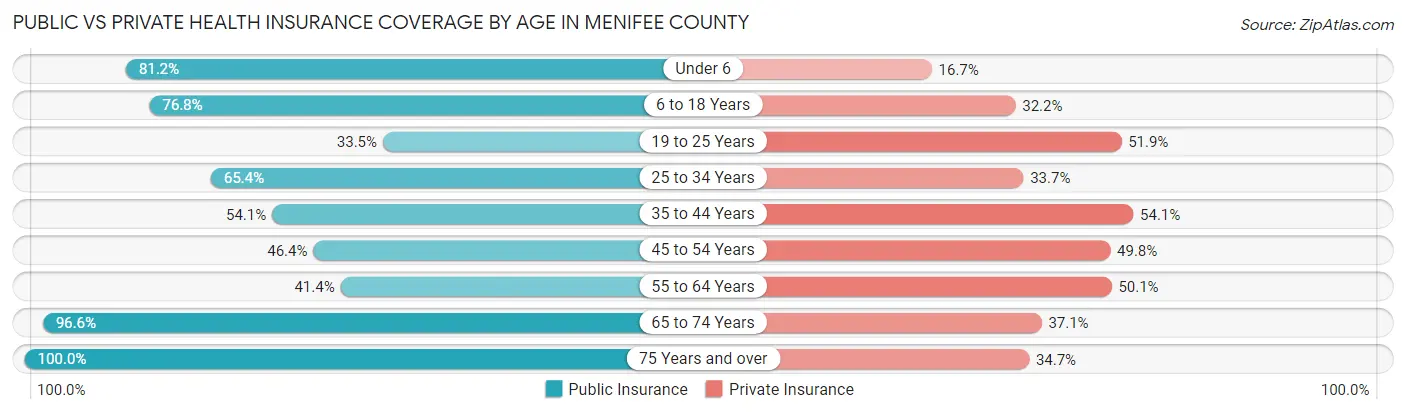
| Age Bracket | Public Insurance | Private Insurance |
| Under 6 | 419 (81.2%) | 86 (16.7%) |
| 6 to 18 Years | 680 (76.8%) | 285 (32.2%) |
| 19 to 25 Years | 135 (33.5%) | 209 (51.9%) |
| 25 to 34 Years | 445 (65.4%) | 229 (33.7%) |
| 35 to 44 Years | 365 (54.1%) | 365 (54.1%) |
| 45 to 54 Years | 355 (46.4%) | 381 (49.8%) |
| 55 to 64 Years | 400 (41.4%) | 484 (50.0%) |
| 65 to 74 Years | 631 (96.6%) | 242 (37.1%) |
| 75 Years and over | 567 (100.0%) | 197 (34.7%) |
| Total | 3,997 (65.4%) | 2,478 (40.6%) |
Disability Status by Sex by Age in Menifee County
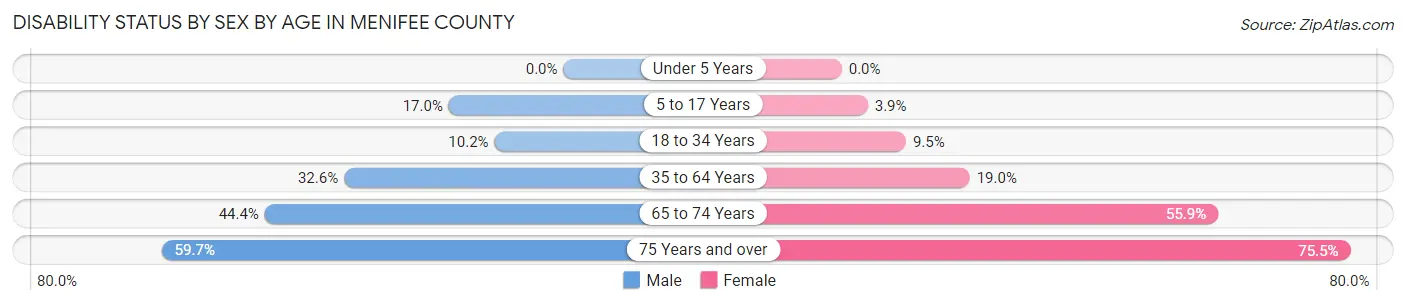
| Age Bracket | Male | Female |
| Under 5 Years | 0 (0.0%) | 0 (0.0%) |
| 5 to 17 Years | 81 (17.0%) | 16 (3.9%) |
| 18 to 34 Years | 60 (10.2%) | 51 (9.5%) |
| 35 to 64 Years | 424 (32.6%) | 210 (19.0%) |
| 65 to 74 Years | 165 (44.4%) | 157 (55.9%) |
| 75 Years and over | 136 (59.7%) | 256 (75.5%) |
Disability Class by Sex by Age in Menifee County
Disability Class: Hearing Difficulty
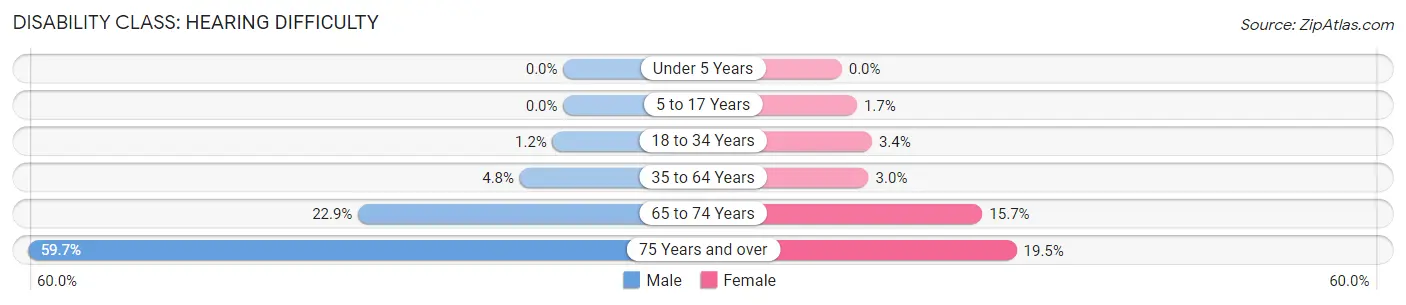
| Age Bracket | Male | Female |
| Under 5 Years | 0 (0.0%) | 0 (0.0%) |
| 5 to 17 Years | 0 (0.0%) | 7 (1.7%) |
| 18 to 34 Years | 7 (1.2%) | 18 (3.4%) |
| 35 to 64 Years | 63 (4.8%) | 33 (3.0%) |
| 65 to 74 Years | 85 (22.9%) | 44 (15.7%) |
| 75 Years and over | 136 (59.7%) | 66 (19.5%) |
Disability Class: Vision Difficulty
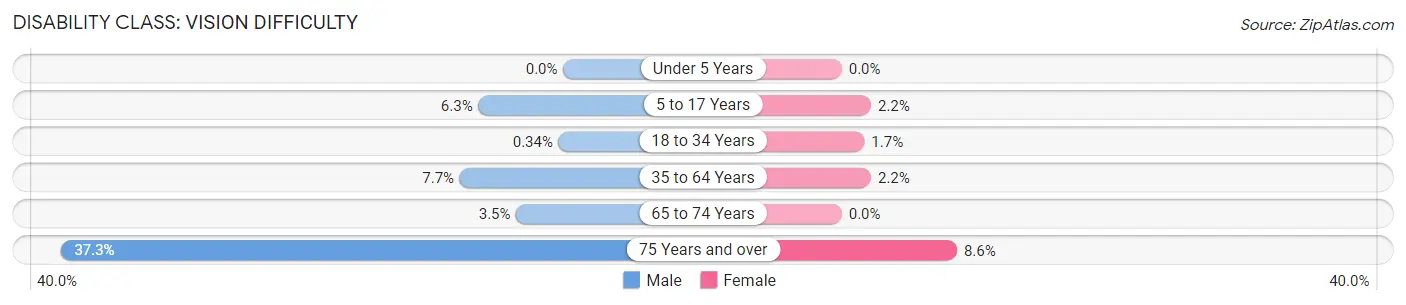
| Age Bracket | Male | Female |
| Under 5 Years | 0 (0.0%) | 0 (0.0%) |
| 5 to 17 Years | 30 (6.3%) | 9 (2.2%) |
| 18 to 34 Years | 2 (0.3%) | 9 (1.7%) |
| 35 to 64 Years | 100 (7.7%) | 24 (2.2%) |
| 65 to 74 Years | 13 (3.5%) | 0 (0.0%) |
| 75 Years and over | 85 (37.3%) | 29 (8.6%) |
Disability Class: Cognitive Difficulty
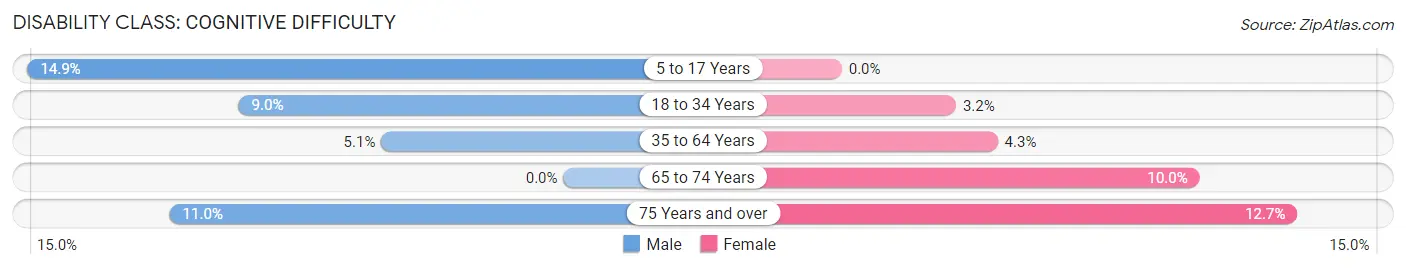
| Age Bracket | Male | Female |
| 5 to 17 Years | 71 (14.9%) | 0 (0.0%) |
| 18 to 34 Years | 53 (9.0%) | 17 (3.2%) |
| 35 to 64 Years | 66 (5.1%) | 48 (4.3%) |
| 65 to 74 Years | 0 (0.0%) | 28 (10.0%) |
| 75 Years and over | 25 (11.0%) | 43 (12.7%) |
Disability Class: Ambulatory Difficulty
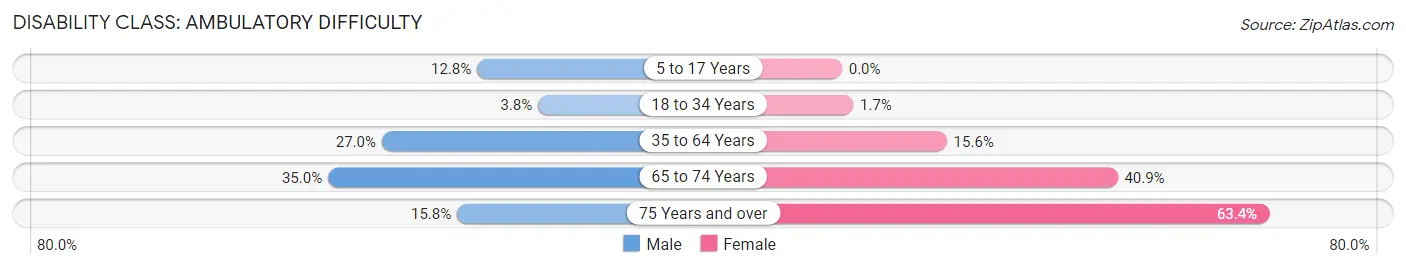
| Age Bracket | Male | Female |
| 5 to 17 Years | 61 (12.8%) | 0 (0.0%) |
| 18 to 34 Years | 22 (3.7%) | 9 (1.7%) |
| 35 to 64 Years | 351 (27.0%) | 172 (15.6%) |
| 65 to 74 Years | 130 (34.9%) | 115 (40.9%) |
| 75 Years and over | 36 (15.8%) | 215 (63.4%) |
Disability Class: Self-Care Difficulty
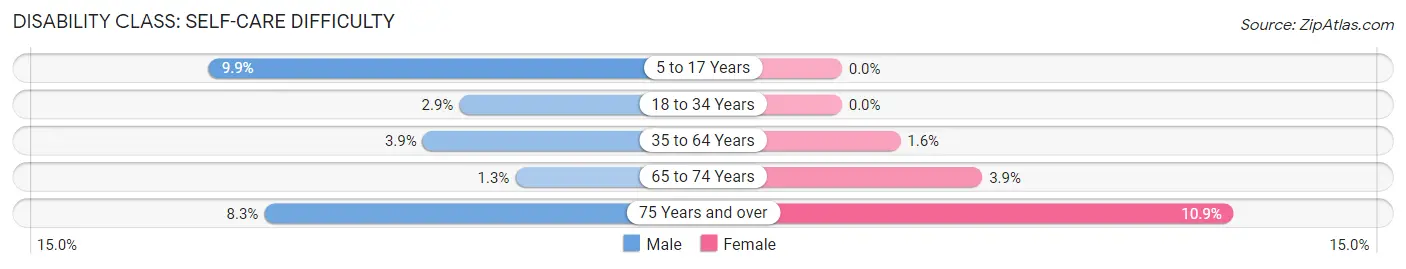
| Age Bracket | Male | Female |
| 5 to 17 Years | 47 (9.9%) | 0 (0.0%) |
| 18 to 34 Years | 17 (2.9%) | 0 (0.0%) |
| 35 to 64 Years | 51 (3.9%) | 18 (1.6%) |
| 65 to 74 Years | 5 (1.3%) | 11 (3.9%) |
| 75 Years and over | 19 (8.3%) | 37 (10.9%) |
Technology Access in Menifee County
Computing Device Access in Menifee County
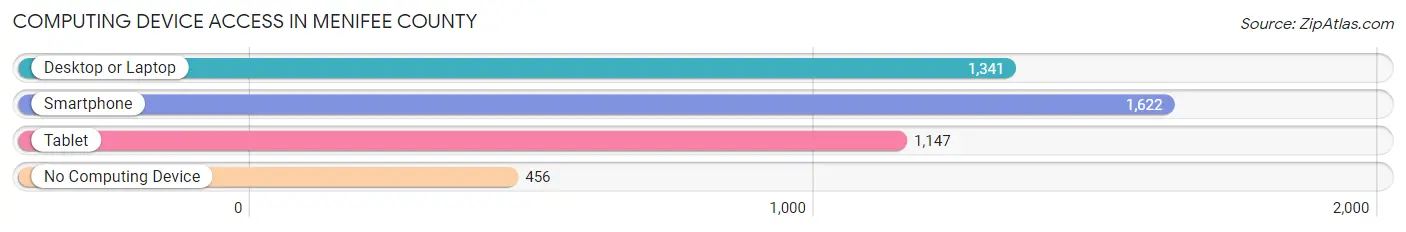
| Device Type | # Households | % Households |
| Desktop or Laptop | 1,341 | 59.3% |
| Smartphone | 1,622 | 71.7% |
| Tablet | 1,147 | 50.7% |
| No Computing Device | 456 | 20.2% |
| Total | 2,262 | 100.0% |
Internet Access in Menifee County
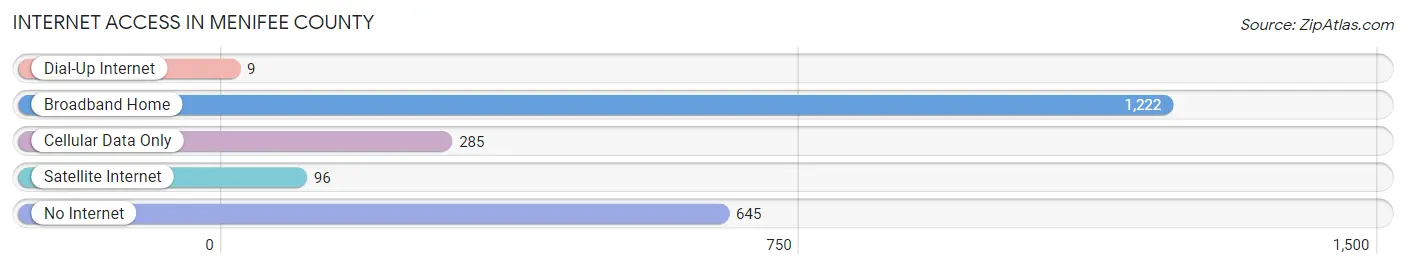
| Internet Type | # Households | % Households |
| Dial-Up Internet | 9 | 0.4% |
| Broadband Home | 1,222 | 54.0% |
| Cellular Data Only | 285 | 12.6% |
| Satellite Internet | 96 | 4.2% |
| No Internet | 645 | 28.5% |
| Total | 2,262 | 100.0% |
Menifee County Summary
Menifee County is a county located in the eastern part of the U.S. state of Kentucky. As of the 2010 census, the population was 6,306, making it the second-least populous county in Kentucky. Its county seat is Frenchburg. The county was formed in 1869 from parts of Bath, Montgomery, Morgan, and Wolfe counties. It is named for Richard Menefee, a soldier in the American Revolutionary War.
Geography
Menifee County is located in the eastern part of Kentucky, in the Appalachian Mountains. It is bordered by Bath County to the north, Montgomery County to the east, Morgan County to the south, and Wolfe County to the west. The county has a total area of 246 square miles, of which 246 square miles is land and 0.2 square miles (0.1%) is water.
The county is located in the Red River Gorge Geological Area, a region of steep forested hills and narrow valleys. The highest point in the county is Pilot Knob, with an elevation of 2,039 feet. The county is drained by the Red River, which flows through the county from north to south.
Demographics
As of the 2010 census, there were 6,306 people, 2,541 households, and 1,743 families residing in the county. The population density was 25.6 people per square mile. There were 2,945 housing units at an average density of 11.9 per square mile. The racial makeup of the county was 97.7% White, 0.3% Black or African American, 0.2% Native American, 0.2% Asian, 0.2% from other races, and 1.4% from two or more races. 1.2% of the population were Hispanic or Latino of any race.
There were 2,541 households, out of which 28.2% had children under the age of 18 living with them, 53.2% were married couples living together, 11.2% had a female householder with no husband present, and 30.7% were non-families. 26.7% of all households were made up of individuals, and 11.7% had someone living alone who was 65 years of age or older. The average household size was 2.44 and the average family size was 2.94.
The age distribution of the population was 22.7% under the age of 18, 8.2% from 18 to 24, 28.2% from 25 to 44, 25.7% from 45 to 64, and 15.2% who were 65 years of age or older. The median age was 39 years. For every 100 females, there were 97.2 males. For every 100 females age 18 and over, there were 94.2 males.
The median income for a household in the county was $25,945, and the median income for a family was $31,944. Males had a median income of $27,813 versus $20,917 for females. The per capita income for the county was $14,845. About 17.2% of families and 21.2% of the population were below the poverty line, including 28.2% of those under age 18 and 19.2% of those age 65 or over.
Economy
The economy of Menifee County is largely based on agriculture and forestry. The county is home to several large farms, as well as several small family farms. The county is also home to several timber companies, which harvest timber from the county's forests.
The county is also home to several small businesses, including restaurants, convenience stores, and gas stations. The county also has several small manufacturing companies, which produce a variety of products, including furniture, clothing, and automotive parts.
The county is served by two major highways, US 460 and KY 7. US 460 runs east-west through the county, connecting it to the larger cities of Lexington and Winchester. KY 7 runs north-south through the county, connecting it to the larger cities of Mount Sterling and Morehead.
Conclusion
Menifee County is a rural county located in the eastern part of Kentucky. It is home to a population of 6,306 people, as of the 2010 census. The county is largely agricultural, with several large farms and timber companies operating in the area. The county is also home to several small businesses, as well as several small manufacturing companies. The county is served by two major highways, US 460 and KY 7, which connect it to the larger cities of Lexington and Winchester.
Common Questions
What is Per Capita Income in Menifee County?
Per Capita income in Menifee County is $22,682.
What is the Median Family Income in Menifee County?
Median Family Income in Menifee County is $56,176.
What is the Median Household income in Menifee County?
Median Household Income in Menifee County is $43,797.
What is Income or Wage Gap in Menifee County?
Income or Wage Gap in Menifee County is 27.4%.
Women in Menifee County earn 72.6 cents for every dollar earned by a man.
What is Inequality or Gini Index in Menifee County?
Inequality or Gini Index in Menifee County is 0.45.
What is the Total Population of Menifee County?
Total Population of Menifee County is 6,174.
What is the Total Male Population of Menifee County?
Total Male Population of Menifee County is 3,284.
What is the Total Female Population of Menifee County?
Total Female Population of Menifee County is 2,890.
What is the Ratio of Males per 100 Females in Menifee County?
There are 113.63 Males per 100 Females in Menifee County.
What is the Ratio of Females per 100 Males in Menifee County?
There are 88.00 Females per 100 Males in Menifee County.
What is the Median Population Age in Menifee County?
Median Population Age in Menifee County is 43.4 Years.
What is the Average Family Size in Menifee County
Average Family Size in Menifee County is 3.4 People.
What is the Average Household Size in Menifee County
Average Household Size in Menifee County is 2.7 People.
How Large is the Labor Force in Menifee County?
There are 2,103 People in the Labor Forcein in Menifee County.
What is the Percentage of People in the Labor Force in Menifee County?
43.0% of People are in the Labor Force in Menifee County.
What is the Unemployment Rate in Menifee County?
Unemployment Rate in Menifee County is 4.7%.