McLean County, KY Map & Demographics
McLean County Map
McLean County Overview
$32,382
PER CAPITA INCOME
$85,669
AVG FAMILY INCOME
$64,020
AVG HOUSEHOLD INCOME
35.8%
WAGE / INCOME GAP [ % ]
64.2¢/ $1
WAGE / INCOME GAP [ $ ]
$14,909
FAMILY INCOME DEFICIT
0.43
INEQUALITY / GINI INDEX
9,173
TOTAL POPULATION
4,604
MALE POPULATION
4,569
FEMALE POPULATION
100.77
MALES / 100 FEMALES
99.24
FEMALES / 100 MALES
43.2
MEDIAN AGE
3.0
AVG FAMILY SIZE
2.5
AVG HOUSEHOLD SIZE
4,053
LABOR FORCE [ PEOPLE ]
55.3%
PERCENT IN LABOR FORCE
6.7%
UNEMPLOYMENT RATE
McLean County Area Codes
Income in McLean County
Income Overview in McLean County
Per Capita Income in McLean County is $32,382, while median incomes of families and households are $85,669 and $64,020 respectively.
| Characteristic | Number | Measure |
| Per Capita Income | 9,173 | $32,382 |
| Median Family Income | 2,584 | $85,669 |
| Mean Family Income | 2,584 | $96,705 |
| Median Household Income | 3,609 | $64,020 |
| Mean Household Income | 3,609 | $81,719 |
| Income Deficit | 2,584 | $14,909 |
| Wage / Income Gap (%) | 9,173 | 35.84% |
| Wage / Income Gap ($) | 9,173 | 64.16¢ per $1 |
| Gini / Inequality Index | 9,173 | 0.43 |
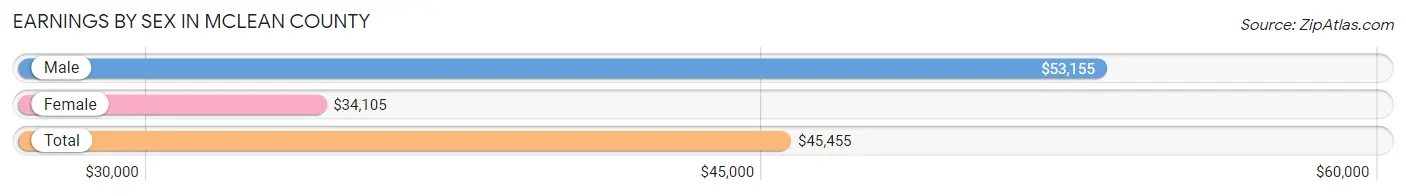
Earnings by Sex in McLean County
Average Earnings in McLean County are $45,455, $53,155 for men and $34,105 for women, a difference of 35.8%.
| Sex | Number | Average Earnings |
| Male | 2,376 (55.4%) | $53,155 |
| Female | 1,913 (44.6%) | $34,105 |
| Total | 4,289 (100.0%) | $45,455 |
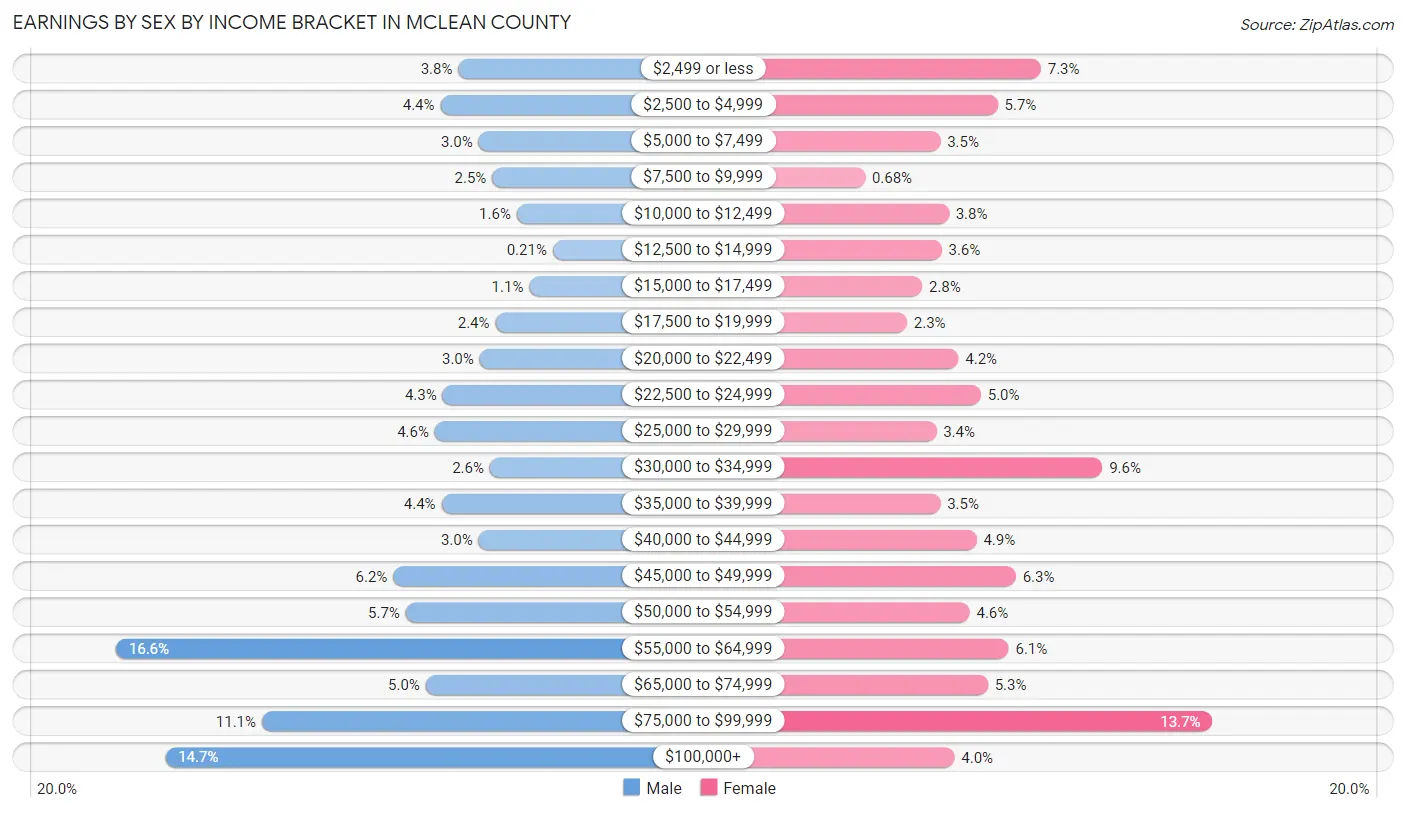
Earnings by Sex by Income Bracket in McLean County
The most common earnings brackets in McLean County are $55,000 to $64,999 for men (394 | 16.6%) and $75,000 to $99,999 for women (262 | 13.7%).
| Income | Male | Female |
| $2,499 or less | 89 (3.7%) | 139 (7.3%) |
| $2,500 to $4,999 | 105 (4.4%) | 108 (5.7%) |
| $5,000 to $7,499 | 71 (3.0%) | 67 (3.5%) |
| $7,500 to $9,999 | 59 (2.5%) | 13 (0.7%) |
| $10,000 to $12,499 | 37 (1.6%) | 73 (3.8%) |
| $12,500 to $14,999 | 5 (0.2%) | 68 (3.5%) |
| $15,000 to $17,499 | 26 (1.1%) | 54 (2.8%) |
| $17,500 to $19,999 | 56 (2.4%) | 43 (2.2%) |
| $20,000 to $22,499 | 70 (2.9%) | 80 (4.2%) |
| $22,500 to $24,999 | 103 (4.3%) | 96 (5.0%) |
| $25,000 to $29,999 | 110 (4.6%) | 64 (3.4%) |
| $30,000 to $34,999 | 61 (2.6%) | 183 (9.6%) |
| $35,000 to $39,999 | 104 (4.4%) | 67 (3.5%) |
| $40,000 to $44,999 | 71 (3.0%) | 93 (4.9%) |
| $45,000 to $49,999 | 147 (6.2%) | 121 (6.3%) |
| $50,000 to $54,999 | 136 (5.7%) | 88 (4.6%) |
| $55,000 to $64,999 | 394 (16.6%) | 116 (6.1%) |
| $65,000 to $74,999 | 118 (5.0%) | 101 (5.3%) |
| $75,000 to $99,999 | 264 (11.1%) | 262 (13.7%) |
| $100,000+ | 350 (14.7%) | 77 (4.0%) |
| Total | 2,376 (100.0%) | 1,913 (100.0%) |
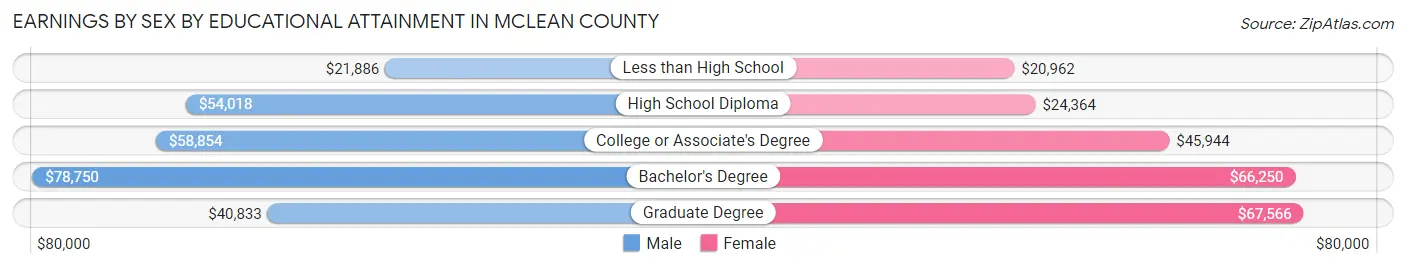
Earnings by Sex by Educational Attainment in McLean County
Average earnings in McLean County are $57,926 for men and $38,500 for women, a difference of 33.5%. Men with an educational attainment of bachelor's degree enjoy the highest average annual earnings of $78,750, while those with less than high school education earn the least with $21,886. Women with an educational attainment of graduate degree earn the most with the average annual earnings of $67,566, while those with less than high school education have the smallest earnings of $20,962.
| Educational Attainment | Male Income | Female Income |
| Less than High School | $21,886 | $20,962 |
| High School Diploma | $54,018 | $24,364 |
| College or Associate's Degree | $58,854 | $45,944 |
| Bachelor's Degree | $78,750 | $66,250 |
| Graduate Degree | $40,833 | $67,566 |
| Total | $57,926 | $38,500 |
Family Income in McLean County
Family Income Brackets in McLean County
According to the McLean County family income data, there are 708 families falling into the $100,000 to $149,999 income range, which is the most common income bracket and makes up 27.4% of all families. Conversely, the $10,000 to $14,999 income bracket is the least frequent group with only 23 families (0.9%) belonging to this category.
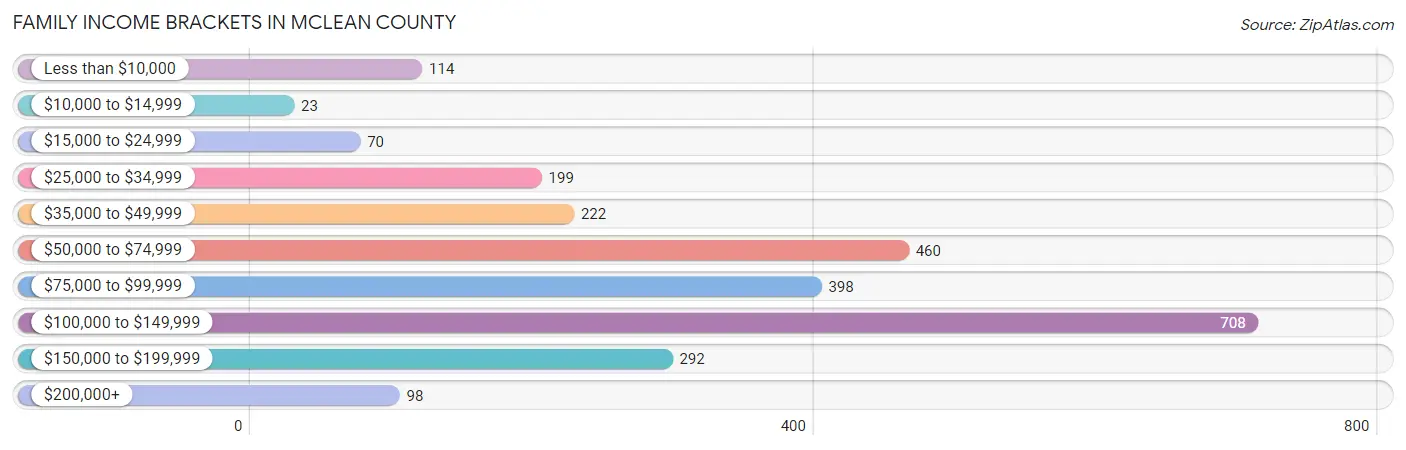
| Income Bracket | # Families | % Families |
| Less than $10,000 | 114 | 4.4% |
| $10,000 to $14,999 | 23 | 0.9% |
| $15,000 to $24,999 | 70 | 2.7% |
| $25,000 to $34,999 | 199 | 7.7% |
| $35,000 to $49,999 | 222 | 8.6% |
| $50,000 to $74,999 | 460 | 17.8% |
| $75,000 to $99,999 | 398 | 15.4% |
| $100,000 to $149,999 | 708 | 27.4% |
| $150,000 to $199,999 | 292 | 11.3% |
| $200,000+ | 98 | 3.8% |
Family Income by Famaliy Size in McLean County
5-person families (194 | 7.5%) account for the highest median family income in McLean County with $122,838 per family, while 2-person families (1,180 | 45.7%) have the highest median income of $33,789 per family member.
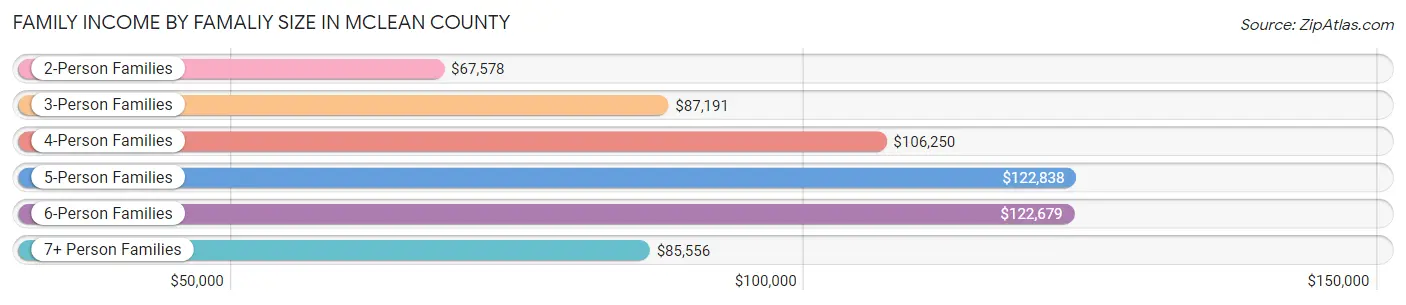
| Income Bracket | # Families | Median Income |
| 2-Person Families | 1,180 (45.7%) | $67,578 |
| 3-Person Families | 640 (24.8%) | $87,191 |
| 4-Person Families | 501 (19.4%) | $106,250 |
| 5-Person Families | 194 (7.5%) | $122,838 |
| 6-Person Families | 39 (1.5%) | $122,679 |
| 7+ Person Families | 30 (1.2%) | $85,556 |
| Total | 2,584 (100.0%) | $85,669 |
Family Income by Number of Earners in McLean County
The median family income in McLean County is $85,669, with families comprising 3+ earners (213) having the highest median family income of $154,327, while families with no earners (564) have the lowest median family income of $45,652, accounting for 8.2% and 21.8% of families, respectively.
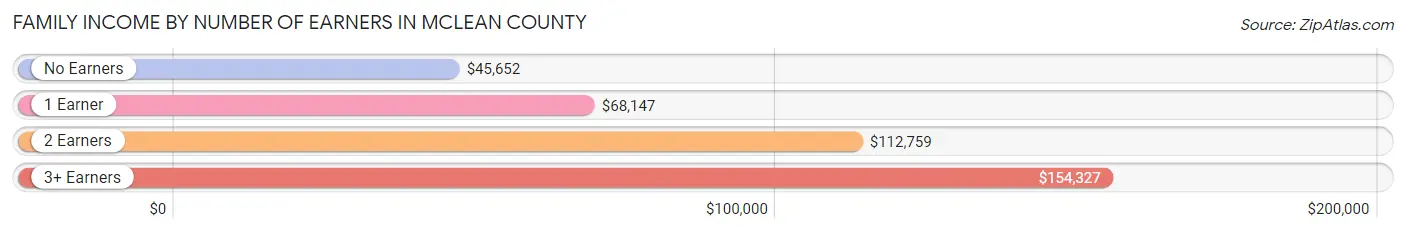
| Number of Earners | # Families | Median Income |
| No Earners | 564 (21.8%) | $45,652 |
| 1 Earner | 801 (31.0%) | $68,147 |
| 2 Earners | 1,006 (38.9%) | $112,759 |
| 3+ Earners | 213 (8.2%) | $154,327 |
| Total | 2,584 (100.0%) | $85,669 |
Household Income in McLean County
Household Income Brackets in McLean County
With 693 households falling in the category, the $100,000 to $149,999 income range is the most frequent in McLean County, accounting for 19.2% of all households. In contrast, only 97 households (2.7%) fall into the $10,000 to $14,999 income bracket, making it the least populous group.
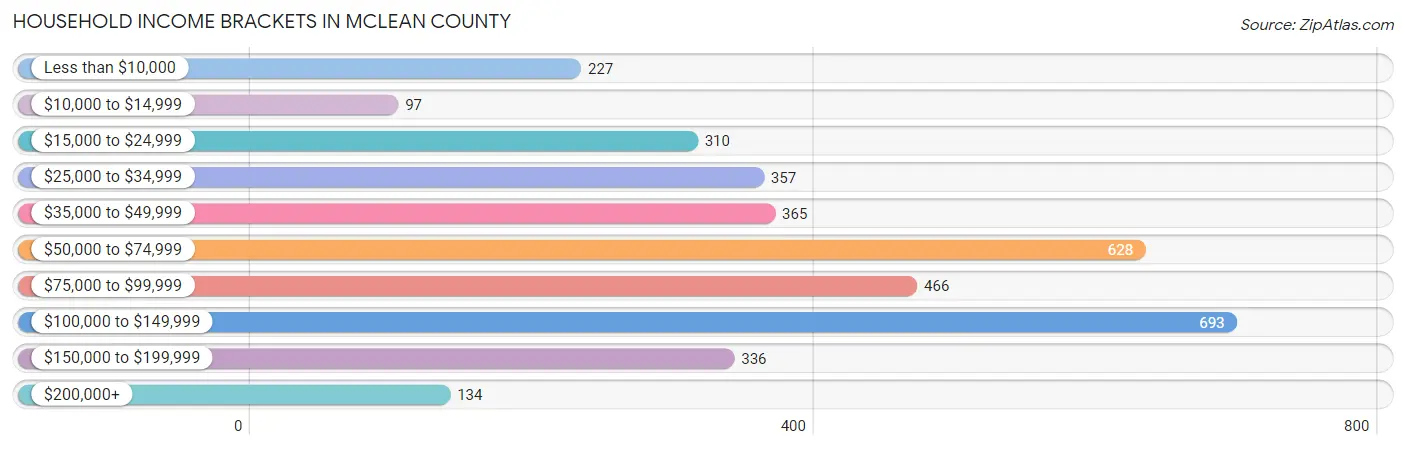
| Income Bracket | # Households | % Households |
| Less than $10,000 | 227 | 6.3% |
| $10,000 to $14,999 | 97 | 2.7% |
| $15,000 to $24,999 | 310 | 8.6% |
| $25,000 to $34,999 | 357 | 9.9% |
| $35,000 to $49,999 | 365 | 10.1% |
| $50,000 to $74,999 | 628 | 17.4% |
| $75,000 to $99,999 | 466 | 12.9% |
| $100,000 to $149,999 | 693 | 19.2% |
| $150,000 to $199,999 | 336 | 9.3% |
| $200,000+ | 134 | 3.7% |
Household Income by Householder Age in McLean County
The median household income in McLean County is $64,020, with the highest median household income of $80,685 found in the 25 to 44 years age bracket for the primary householder. A total of 1,005 households (27.9%) fall into this category. Meanwhile, the 15 to 24 years age bracket for the primary householder has the lowest median household income of $33,352, with 93 households (2.6%) in this group.
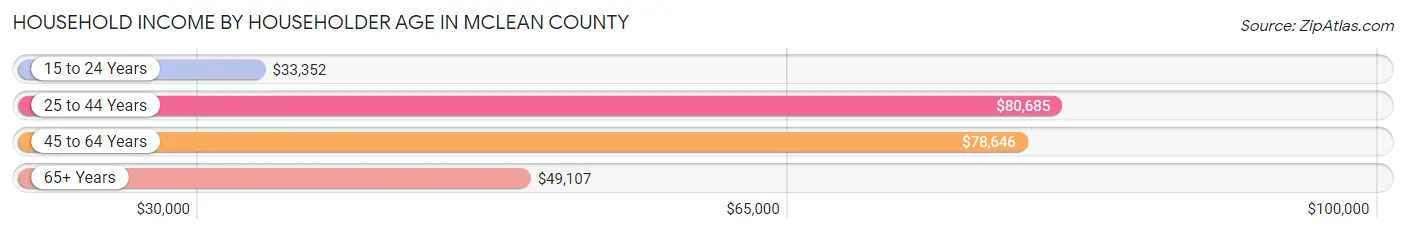
| Income Bracket | # Households | Median Income |
| 15 to 24 Years | 93 (2.6%) | $33,352 |
| 25 to 44 Years | 1,005 (27.9%) | $80,685 |
| 45 to 64 Years | 1,372 (38.0%) | $78,646 |
| 65+ Years | 1,139 (31.6%) | $49,107 |
| Total | 3,609 (100.0%) | $64,020 |
Poverty in McLean County
Income Below Poverty by Sex and Age in McLean County
With 7.3% poverty level for males and 8.6% for females among the residents of McLean County, under 5 year old males and 18 to 24 year old females are the most vulnerable to poverty, with 64 males (26.6%) and 65 females (21.3%) in their respective age groups living below the poverty level.
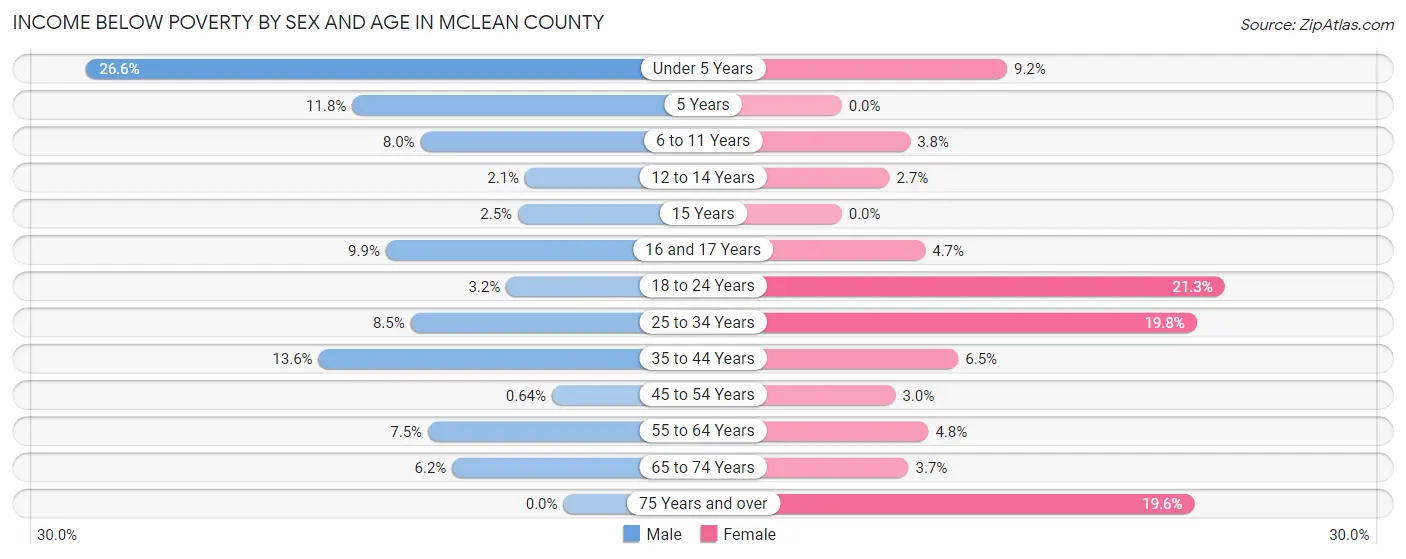
| Age Bracket | Male | Female |
| Under 5 Years | 64 (26.6%) | 23 (9.2%) |
| 5 Years | 10 (11.8%) | 0 (0.0%) |
| 6 to 11 Years | 27 (8.0%) | 12 (3.8%) |
| 12 to 14 Years | 4 (2.1%) | 7 (2.7%) |
| 15 Years | 2 (2.5%) | 0 (0.0%) |
| 16 and 17 Years | 18 (9.9%) | 6 (4.6%) |
| 18 to 24 Years | 11 (3.2%) | 65 (21.3%) |
| 25 to 34 Years | 40 (8.5%) | 97 (19.8%) |
| 35 to 44 Years | 73 (13.6%) | 35 (6.5%) |
| 45 to 54 Years | 4 (0.6%) | 17 (3.0%) |
| 55 to 64 Years | 50 (7.5%) | 32 (4.8%) |
| 65 to 74 Years | 30 (6.2%) | 20 (3.7%) |
| 75 Years and over | 0 (0.0%) | 74 (19.6%) |
| Total | 333 (7.3%) | 388 (8.6%) |
Income Above Poverty by Sex and Age in McLean County
According to the poverty statistics in McLean County, males aged 75 years and over and females aged 5 years are the age groups that are most secure financially, with 100.0% of males and 100.0% of females in these age groups living above the poverty line.
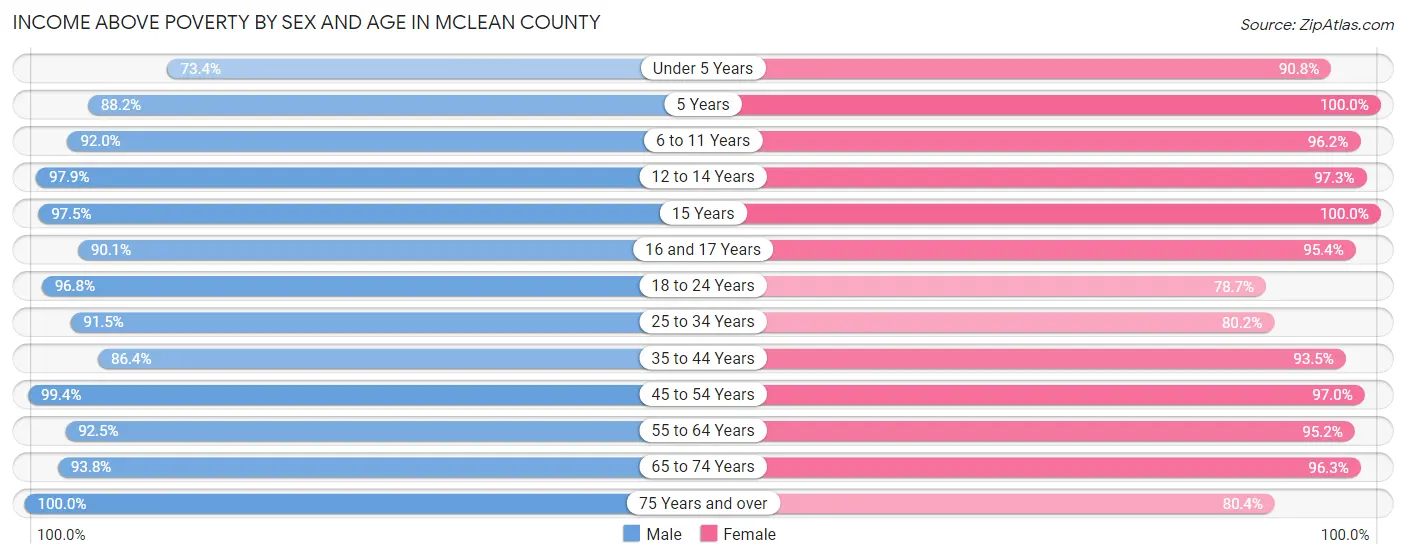
| Age Bracket | Male | Female |
| Under 5 Years | 177 (73.4%) | 227 (90.8%) |
| 5 Years | 75 (88.2%) | 17 (100.0%) |
| 6 to 11 Years | 312 (92.0%) | 303 (96.2%) |
| 12 to 14 Years | 183 (97.9%) | 256 (97.3%) |
| 15 Years | 77 (97.5%) | 61 (100.0%) |
| 16 and 17 Years | 164 (90.1%) | 123 (95.4%) |
| 18 to 24 Years | 334 (96.8%) | 240 (78.7%) |
| 25 to 34 Years | 430 (91.5%) | 394 (80.2%) |
| 35 to 44 Years | 462 (86.4%) | 504 (93.5%) |
| 45 to 54 Years | 624 (99.4%) | 551 (97.0%) |
| 55 to 64 Years | 613 (92.5%) | 630 (95.2%) |
| 65 to 74 Years | 455 (93.8%) | 517 (96.3%) |
| 75 Years and over | 341 (100.0%) | 303 (80.4%) |
| Total | 4,247 (92.7%) | 4,126 (91.4%) |
Income Below Poverty Among Married-Couple Families in McLean County
The poverty statistics for married-couple families in McLean County show that 3.5% or 78 of the total 2,259 families live below the poverty line. Families with no children have the highest poverty rate of 3.6%, comprising of 47 families. On the other hand, families with 5 or more children have the lowest poverty rate of 0.0%, which includes 0 families.
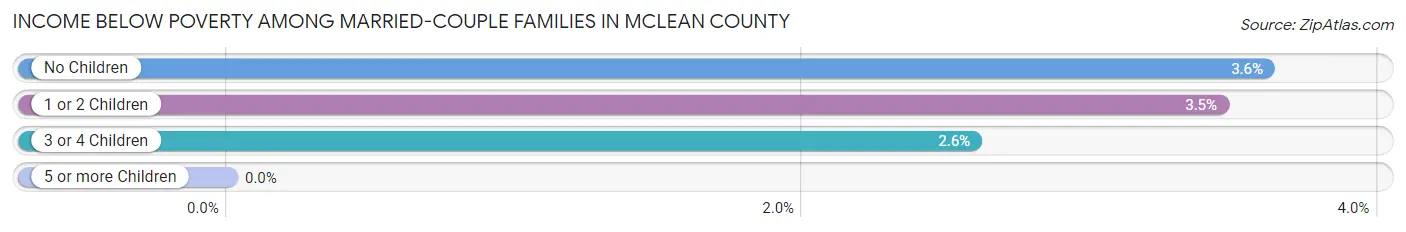
| Children | Above Poverty | Below Poverty |
| No Children | 1,254 (96.4%) | 47 (3.6%) |
| 1 or 2 Children | 728 (96.6%) | 26 (3.5%) |
| 3 or 4 Children | 188 (97.4%) | 5 (2.6%) |
| 5 or more Children | 11 (100.0%) | 0 (0.0%) |
| Total | 2,181 (96.6%) | 78 (3.5%) |
Income Below Poverty Among Single-Parent Households in McLean County
According to the poverty data in McLean County, 11.6% or 13 single-father households and 31.0% or 66 single-mother households are living below the poverty line. Among single-father households, those with 1 or 2 children have the highest poverty rate, with 12 households (20.7%) experiencing poverty. Likewise, among single-mother households, those with 1 or 2 children have the highest poverty rate, with 57 households (43.5%) falling below the poverty line.
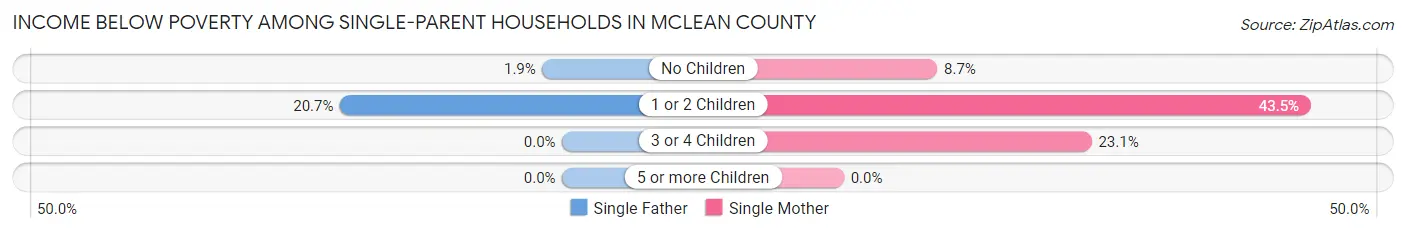
| Children | Single Father | Single Mother |
| No Children | 1 (1.8%) | 6 (8.7%) |
| 1 or 2 Children | 12 (20.7%) | 57 (43.5%) |
| 3 or 4 Children | 0 (0.0%) | 3 (23.1%) |
| 5 or more Children | 0 (0.0%) | 0 (0.0%) |
| Total | 13 (11.6%) | 66 (31.0%) |
Income Below Poverty Among Married-Couple vs Single-Parent Households in McLean County
The poverty data for McLean County shows that 78 of the married-couple family households (3.5%) and 79 of the single-parent households (24.3%) are living below the poverty level. Within the married-couple family households, those with no children have the highest poverty rate, with 47 households (3.6%) falling below the poverty line. Among the single-parent households, those with 1 or 2 children have the highest poverty rate, with 69 household (36.5%) living below poverty.
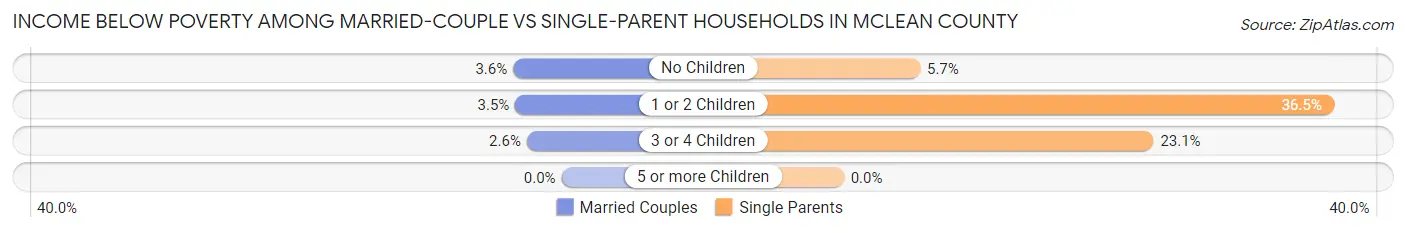
| Children | Married-Couple Families | Single-Parent Households |
| No Children | 47 (3.6%) | 7 (5.7%) |
| 1 or 2 Children | 26 (3.5%) | 69 (36.5%) |
| 3 or 4 Children | 5 (2.6%) | 3 (23.1%) |
| 5 or more Children | 0 (0.0%) | 0 (0.0%) |
| Total | 78 (3.5%) | 79 (24.3%) |
Race in McLean County
The most populous races in McLean County are White / Caucasian (8,802 | 96.0%), Hispanic or Latino (188 | 2.1%), and Two or more Races (181 | 2.0%).
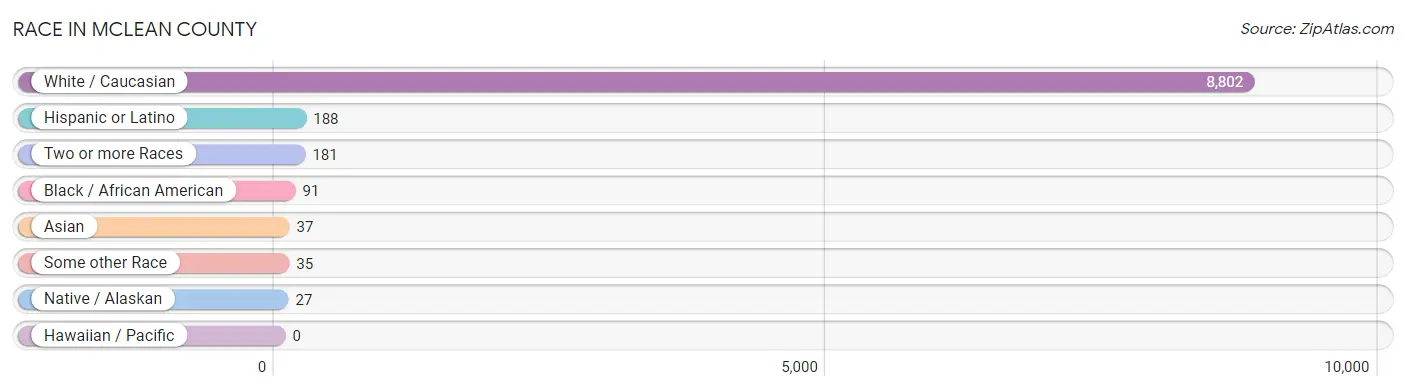
| Race | # Population | % Population |
| Asian | 37 | 0.4% |
| Black / African American | 91 | 1.0% |
| Hawaiian / Pacific | 0 | 0.0% |
| Hispanic or Latino | 188 | 2.1% |
| Native / Alaskan | 27 | 0.3% |
| White / Caucasian | 8,802 | 96.0% |
| Two or more Races | 181 | 2.0% |
| Some other Race | 35 | 0.4% |
| Total | 9,173 | 100.0% |
Ancestry in McLean County
The most populous ancestries reported in McLean County are American (2,493 | 27.2%), English (1,457 | 15.9%), German (770 | 8.4%), Irish (728 | 7.9%), and Mexican (155 | 1.7%), together accounting for 61.1% of all McLean County residents.
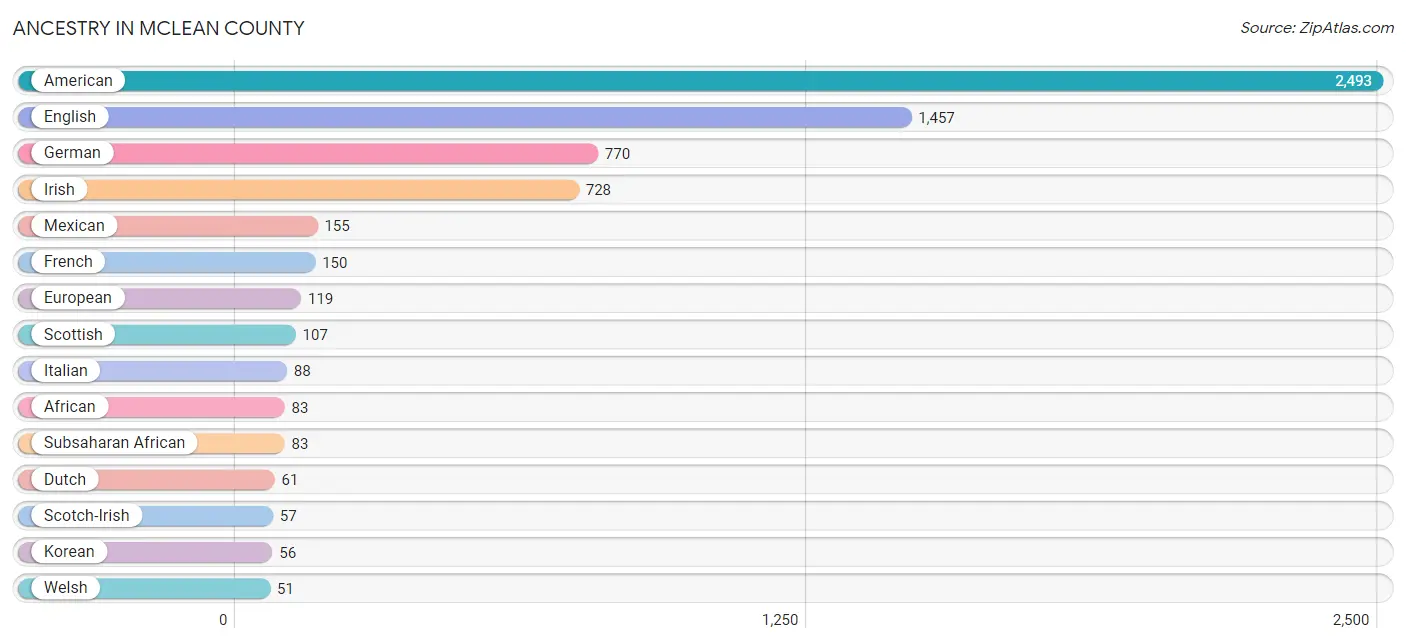
| Ancestry | # Population | % Population |
| African | 83 | 0.9% |
| Alaskan Athabascan | 19 | 0.2% |
| American | 2,493 | 27.2% |
| Austrian | 2 | 0.0% |
| British | 19 | 0.2% |
| Bulgarian | 2 | 0.0% |
| Burmese | 11 | 0.1% |
| Central American | 7 | 0.1% |
| Cherokee | 26 | 0.3% |
| Costa Rican | 4 | 0.0% |
| Czech | 15 | 0.2% |
| Dutch | 61 | 0.7% |
| English | 1,457 | 15.9% |
| European | 119 | 1.3% |
| French | 150 | 1.6% |
| French Canadian | 31 | 0.3% |
| German | 770 | 8.4% |
| Irish | 728 | 7.9% |
| Italian | 88 | 1.0% |
| Korean | 56 | 0.6% |
| Mexican | 155 | 1.7% |
| Northern European | 23 | 0.3% |
| Norwegian | 16 | 0.2% |
| Polish | 41 | 0.4% |
| Puerto Rican | 18 | 0.2% |
| Romanian | 5 | 0.1% |
| Salvadoran | 3 | 0.0% |
| Scandinavian | 27 | 0.3% |
| Scotch-Irish | 57 | 0.6% |
| Scottish | 107 | 1.2% |
| Sioux | 8 | 0.1% |
| Spaniard | 8 | 0.1% |
| Subsaharan African | 83 | 0.9% |
| Swedish | 21 | 0.2% |
| Ukrainian | 12 | 0.1% |
| Welsh | 51 | 0.6% | View All 36 Rows |
Immigrants in McLean County
The most numerous immigrant groups reported in McLean County came from Latin America (40 | 0.4%), Central America (39 | 0.4%), Mexico (32 | 0.4%), Europe (10 | 0.1%), and England (8 | 0.1%), together accounting for 1.4% of all McLean County residents.
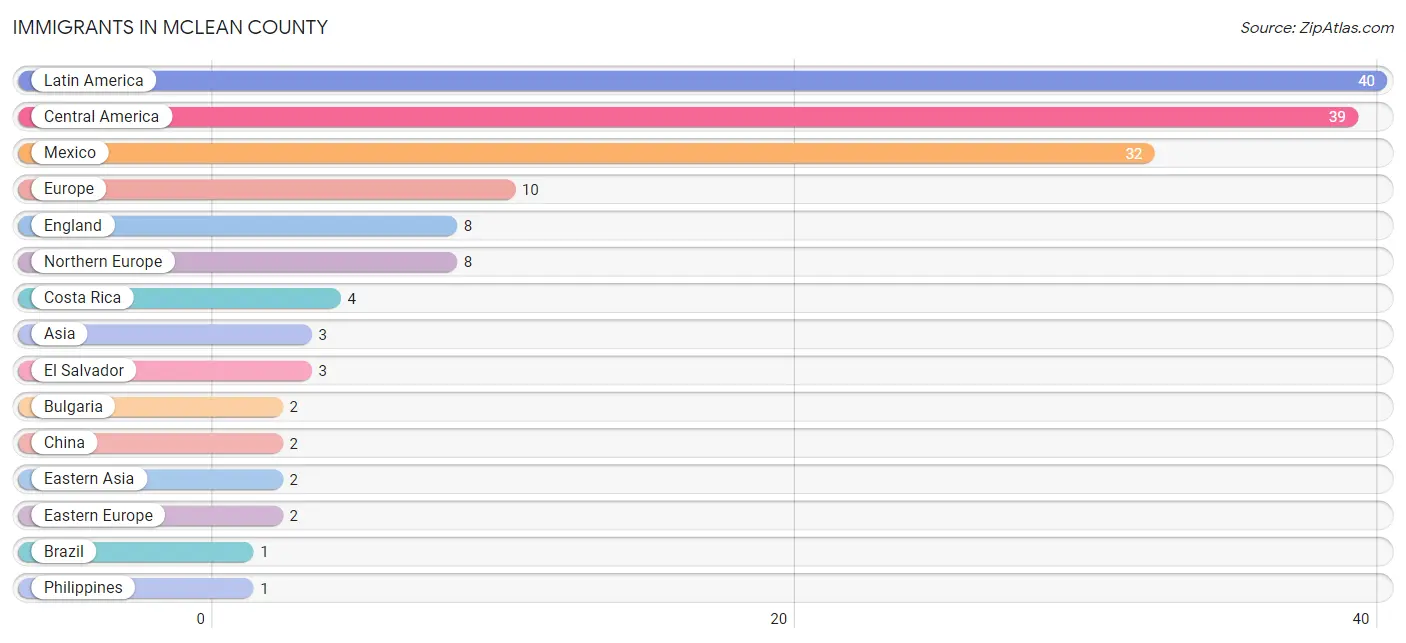
| Immigration Origin | # Population | % Population |
| Asia | 3 | 0.0% |
| Brazil | 1 | 0.0% |
| Bulgaria | 2 | 0.0% |
| Central America | 39 | 0.4% |
| China | 2 | 0.0% |
| Costa Rica | 4 | 0.0% |
| Eastern Asia | 2 | 0.0% |
| Eastern Europe | 2 | 0.0% |
| El Salvador | 3 | 0.0% |
| England | 8 | 0.1% |
| Europe | 10 | 0.1% |
| Latin America | 40 | 0.4% |
| Mexico | 32 | 0.4% |
| Northern Europe | 8 | 0.1% |
| Philippines | 1 | 0.0% |
| South America | 1 | 0.0% |
| South Eastern Asia | 1 | 0.0% | View All 17 Rows |
Sex and Age in McLean County
Sex and Age in McLean County
The most populous age groups in McLean County are 15 to 19 Years (377 | 8.2%) for men and 60 to 64 Years (427 | 9.3%) for women.
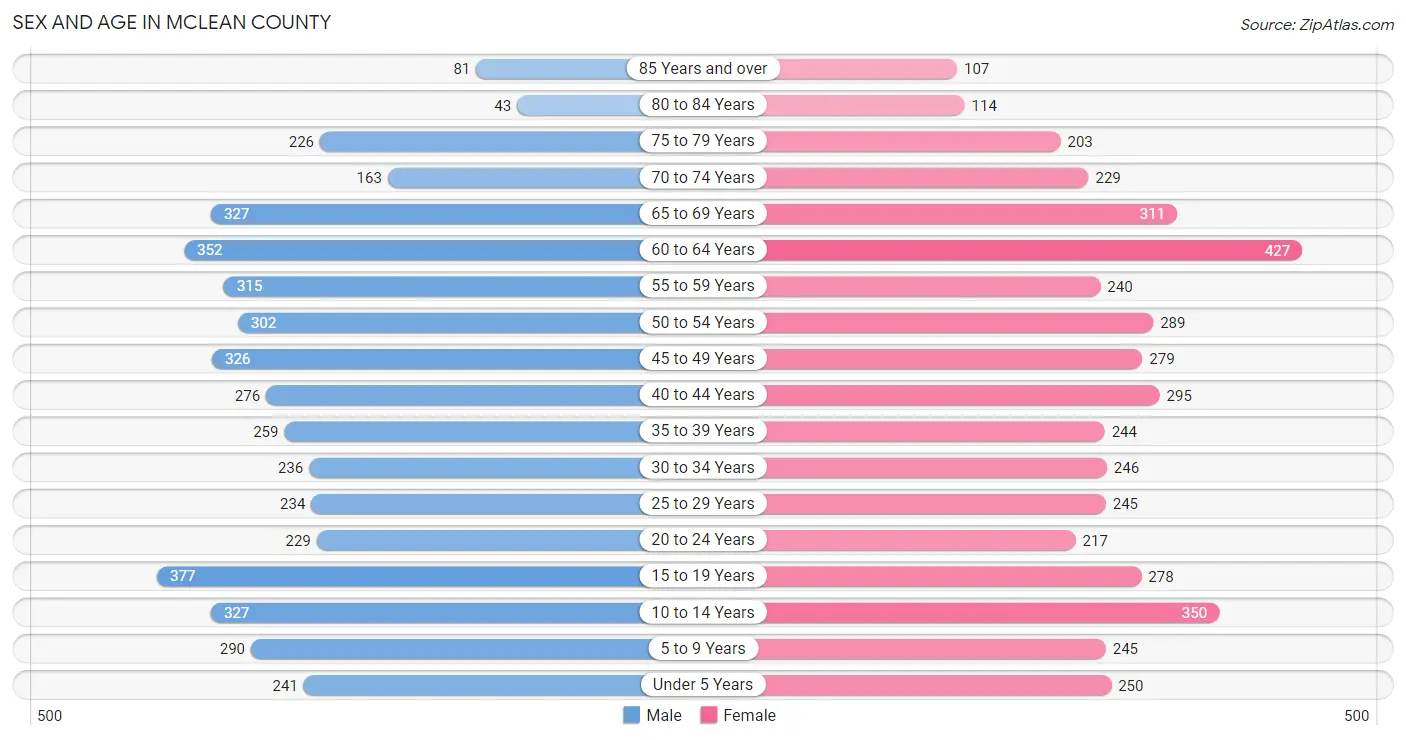
| Age Bracket | Male | Female |
| Under 5 Years | 241 (5.2%) | 250 (5.5%) |
| 5 to 9 Years | 290 (6.3%) | 245 (5.4%) |
| 10 to 14 Years | 327 (7.1%) | 350 (7.7%) |
| 15 to 19 Years | 377 (8.2%) | 278 (6.1%) |
| 20 to 24 Years | 229 (5.0%) | 217 (4.8%) |
| 25 to 29 Years | 234 (5.1%) | 245 (5.4%) |
| 30 to 34 Years | 236 (5.1%) | 246 (5.4%) |
| 35 to 39 Years | 259 (5.6%) | 244 (5.3%) |
| 40 to 44 Years | 276 (6.0%) | 295 (6.5%) |
| 45 to 49 Years | 326 (7.1%) | 279 (6.1%) |
| 50 to 54 Years | 302 (6.6%) | 289 (6.3%) |
| 55 to 59 Years | 315 (6.8%) | 240 (5.2%) |
| 60 to 64 Years | 352 (7.6%) | 427 (9.3%) |
| 65 to 69 Years | 327 (7.1%) | 311 (6.8%) |
| 70 to 74 Years | 163 (3.5%) | 229 (5.0%) |
| 75 to 79 Years | 226 (4.9%) | 203 (4.4%) |
| 80 to 84 Years | 43 (0.9%) | 114 (2.5%) |
| 85 Years and over | 81 (1.8%) | 107 (2.3%) |
| Total | 4,604 (100.0%) | 4,569 (100.0%) |
Families and Households in McLean County
Median Family Size in McLean County
The median family size in McLean County is 3.02 persons per family, with married-couple families (2,259 | 87.4%) accounting for the largest median family size of 3.1 persons per family. On the other hand, single male/father families (112 | 4.3%) represent the smallest median family size with 2.25 persons per family.
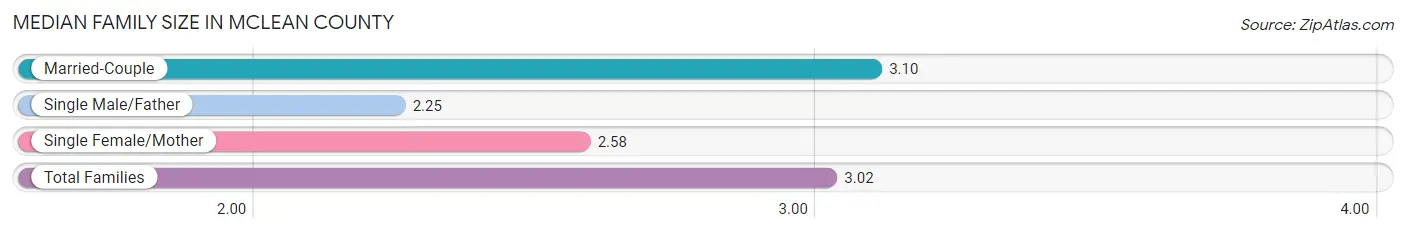
| Family Type | # Families | Family Size |
| Married-Couple | 2,259 (87.4%) | 3.10 |
| Single Male/Father | 112 (4.3%) | 2.25 |
| Single Female/Mother | 213 (8.2%) | 2.58 |
| Total Families | 2,584 (100.0%) | 3.02 |
Median Household Size in McLean County
The median household size in McLean County is 2.52 persons per household, with married-couple households (2,259 | 62.6%) accounting for the largest median household size of 3.12 persons per household. non-family households (1,025 | 28.4%) represent the smallest median household size with 1.10 persons per household.
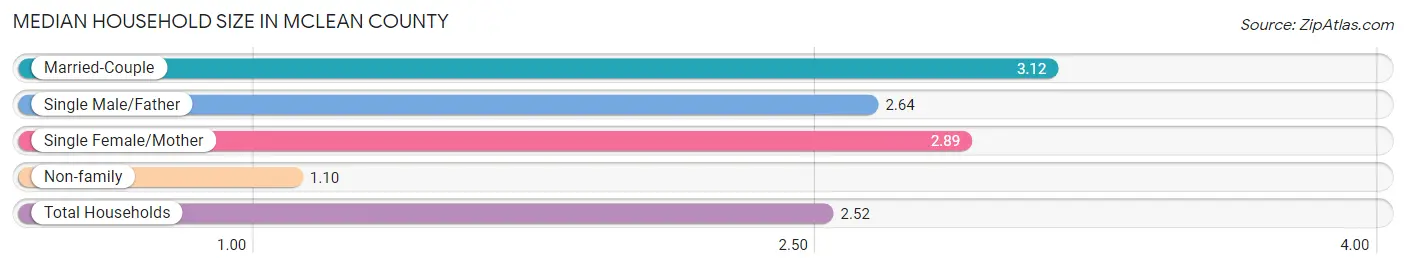
| Household Type | # Households | Household Size |
| Married-Couple | 2,259 (62.6%) | 3.12 |
| Single Male/Father | 112 (3.1%) | 2.64 |
| Single Female/Mother | 213 (5.9%) | 2.89 |
| Non-family | 1,025 (28.4%) | 1.10 |
| Total Households | 3,609 (100.0%) | 2.52 |
Household Size by Marriage Status in McLean County
Out of a total of 3,609 households in McLean County, 2,584 (71.6%) are family households, while 1,025 (28.4%) are nonfamily households. The most numerous type of family households are 2-person households, comprising 1,154, and the most common type of nonfamily households are 1-person households, comprising 915.
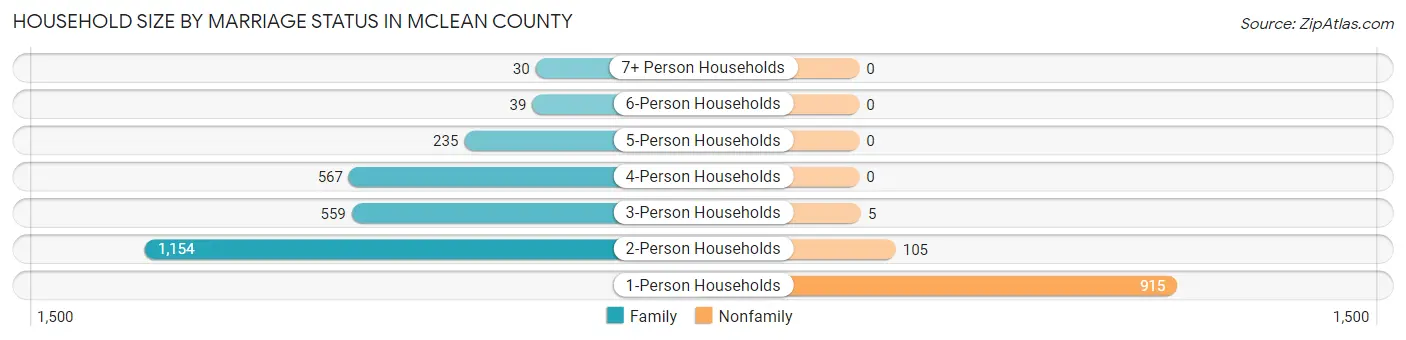
| Household Size | Family Households | Nonfamily Households |
| 1-Person Households | - | 915 (25.4%) |
| 2-Person Households | 1,154 (32.0%) | 105 (2.9%) |
| 3-Person Households | 559 (15.5%) | 5 (0.1%) |
| 4-Person Households | 567 (15.7%) | 0 (0.0%) |
| 5-Person Households | 235 (6.5%) | 0 (0.0%) |
| 6-Person Households | 39 (1.1%) | 0 (0.0%) |
| 7+ Person Households | 30 (0.8%) | 0 (0.0%) |
| Total | 2,584 (71.6%) | 1,025 (28.4%) |
Female Fertility in McLean County
Fertility by Age in McLean County
Average fertility rate in McLean County is 60.0 births per 1,000 women. Women in the age bracket of 20 to 34 years have the highest fertility rate with 106.0 births per 1,000 women. Women in the age bracket of 20 to 34 years acount for 67.6% of all women with births.
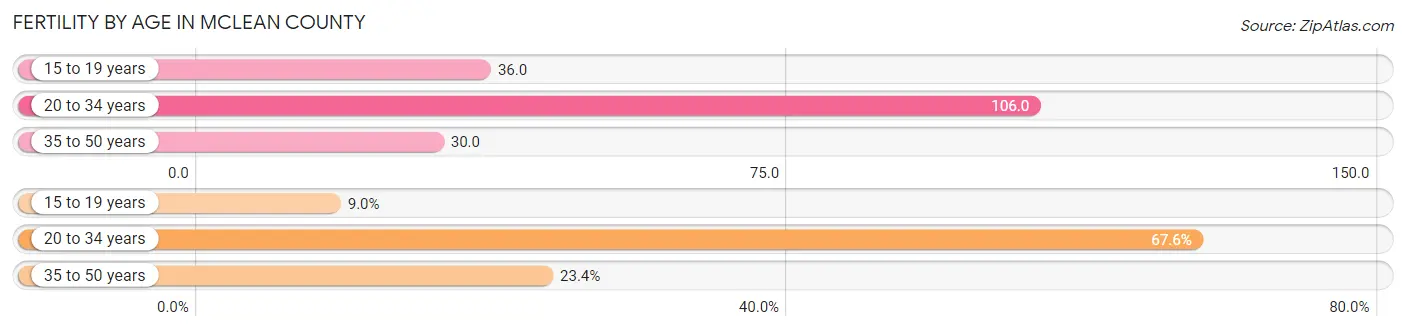
| Age Bracket | Women with Births | Births / 1,000 Women |
| 15 to 19 years | 10 (9.0%) | 36.0 |
| 20 to 34 years | 75 (67.6%) | 106.0 |
| 35 to 50 years | 26 (23.4%) | 30.0 |
| Total | 111 (100.0%) | 60.0 |
Fertility by Age by Marriage Status in McLean County
61.3% of women with births (111) in McLean County are married. The highest percentage of unmarried women with births falls into 15 to 19 years age bracket with 100.0% of them unmarried at the time of birth, while the lowest percentage of unmarried women with births belong to 35 to 50 years age bracket with 23.1% of them unmarried.
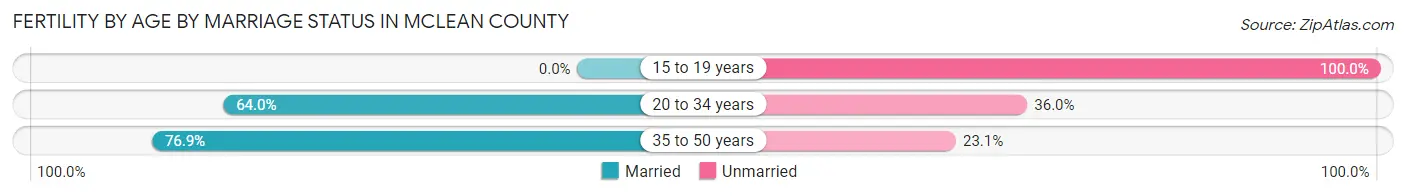
| Age Bracket | Married | Unmarried |
| 15 to 19 years | 0 (0.0%) | 10 (100.0%) |
| 20 to 34 years | 48 (64.0%) | 27 (36.0%) |
| 35 to 50 years | 20 (76.9%) | 6 (23.1%) |
| Total | 68 (61.3%) | 43 (38.7%) |
Fertility by Education in McLean County
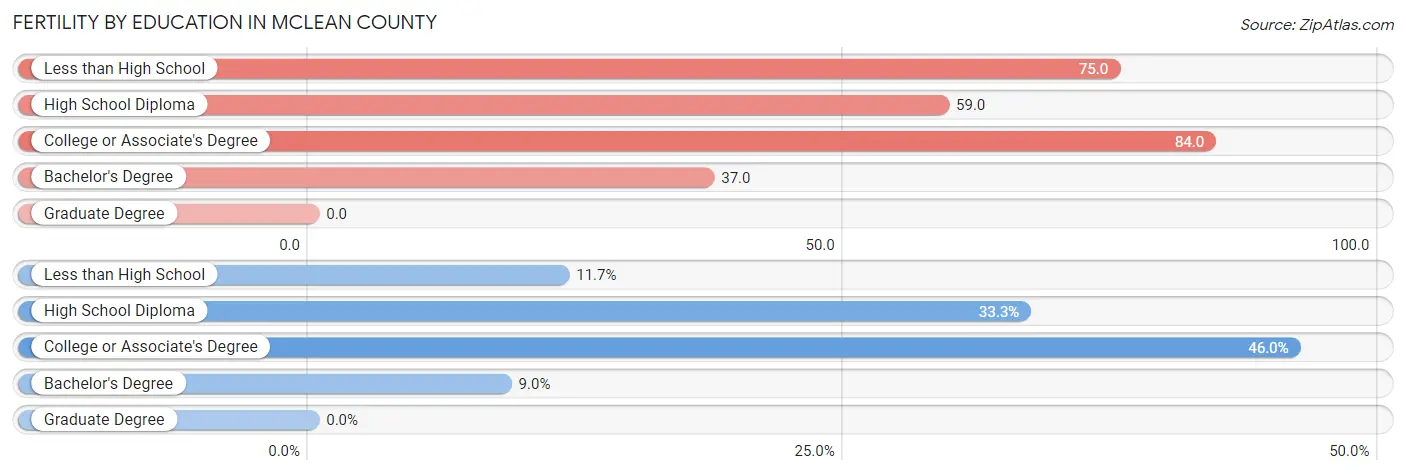
| Educational Attainment | Women with Births | Births / 1,000 Women |
| Less than High School | 13 (11.7%) | 75.0 |
| High School Diploma | 37 (33.3%) | 59.0 |
| College or Associate's Degree | 51 (46.0%) | 84.0 |
| Bachelor's Degree | 10 (9.0%) | 37.0 |
| Graduate Degree | 0 (0.0%) | 0.0 |
| Total | 111 (100.0%) | 60.0 |
Fertility by Education by Marriage Status in McLean County
38.7% of women with births in McLean County are unmarried. Women with the educational attainment of bachelor's degree are most likely to be married with 100.0% of them married at childbirth, while women with the educational attainment of less than high school are least likely to be married with 100.0% of them unmarried at childbirth.
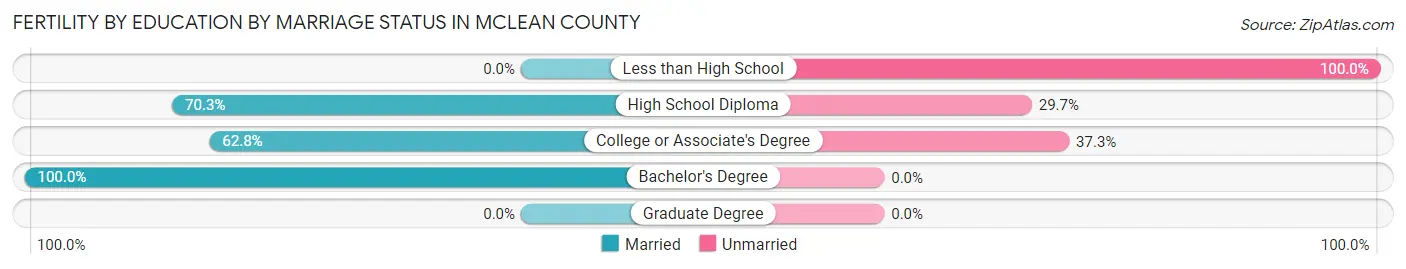
| Educational Attainment | Married | Unmarried |
| Less than High School | 0 (0.0%) | 13 (100.0%) |
| High School Diploma | 26 (70.3%) | 11 (29.7%) |
| College or Associate's Degree | 32 (62.7%) | 19 (37.2%) |
| Bachelor's Degree | 10 (100.0%) | 0 (0.0%) |
| Graduate Degree | 0 (0.0%) | 0 (0.0%) |
| Total | 68 (61.3%) | 43 (38.7%) |
Employment Characteristics in McLean County
Employment by Class of Employer in McLean County
Among the 3,687 employed individuals in McLean County, private company employees (2,406 | 65.3%), local government employees (314 | 8.5%), and self-employed (not incorporated) (271 | 7.3%) make up the most common classes of employment.
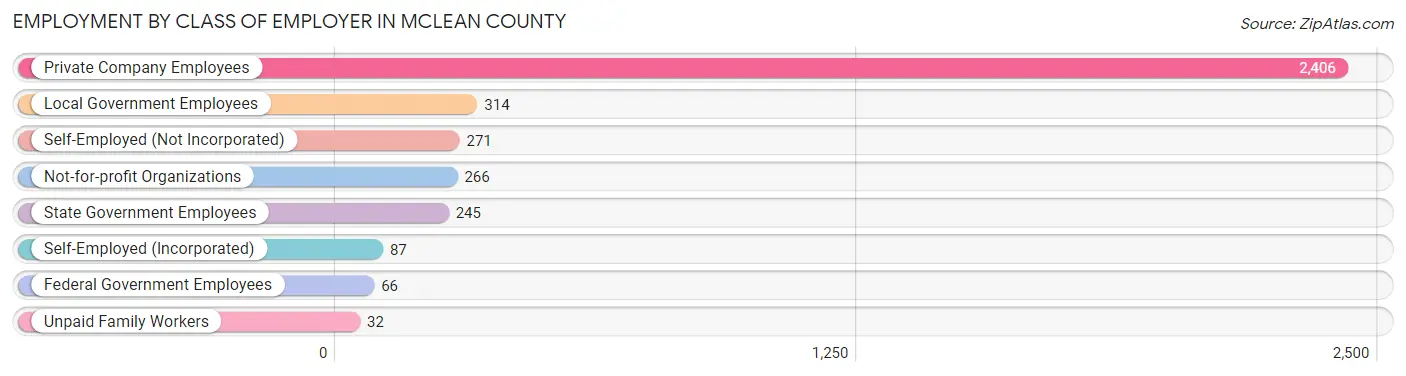
| Employer Class | # Employees | % Employees |
| Private Company Employees | 2,406 | 65.3% |
| Self-Employed (Incorporated) | 87 | 2.4% |
| Self-Employed (Not Incorporated) | 271 | 7.3% |
| Not-for-profit Organizations | 266 | 7.2% |
| Local Government Employees | 314 | 8.5% |
| State Government Employees | 245 | 6.6% |
| Federal Government Employees | 66 | 1.8% |
| Unpaid Family Workers | 32 | 0.9% |
| Total | 3,687 | 100.0% |
Employment Status by Age in McLean County
According to the labor force statistics for McLean County, out of the total population over 16 years of age (7,330), 55.3% or 4,053 individuals are in the labor force, with 6.7% or 272 of them unemployed. The age group with the highest labor force participation rate is 45 to 54 years, with 89.0% or 1,064 individuals in the labor force. Within the labor force, the 20 to 24 years age range has the highest percentage of unemployed individuals, with 20.3% or 60 of them being unemployed.
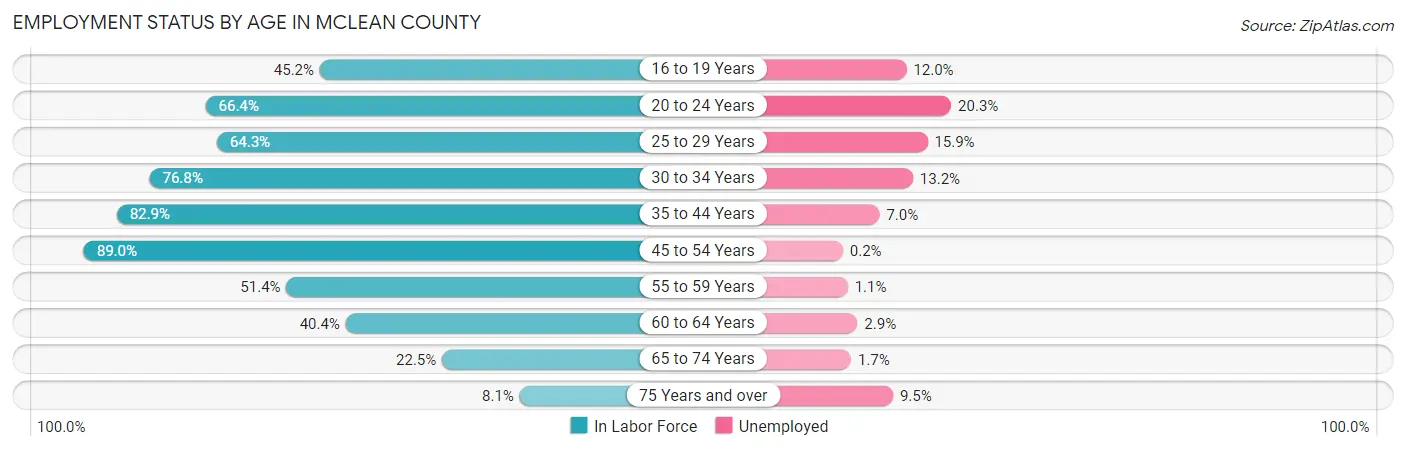
| Age Bracket | In Labor Force | Unemployed |
| 16 to 19 Years | 233 (45.2%) | 28 (12.0%) |
| 20 to 24 Years | 296 (66.4%) | 60 (20.3%) |
| 25 to 29 Years | 308 (64.3%) | 49 (15.9%) |
| 30 to 34 Years | 370 (76.8%) | 49 (13.2%) |
| 35 to 44 Years | 890 (82.9%) | 62 (7.0%) |
| 45 to 54 Years | 1,064 (89.0%) | 2 (0.2%) |
| 55 to 59 Years | 285 (51.4%) | 3 (1.1%) |
| 60 to 64 Years | 315 (40.4%) | 9 (2.9%) |
| 65 to 74 Years | 232 (22.5%) | 4 (1.7%) |
| 75 Years and over | 63 (8.1%) | 6 (9.5%) |
| Total | 4,053 (55.3%) | 272 (6.7%) |
Employment Status by Educational Attainment in McLean County
According to labor force statistics for McLean County, 70.8% of individuals (3,232) out of the total population between 25 and 64 years of age (4,565) are in the labor force, with 5.4% or 175 of them being unemployed. The group with the highest labor force participation rate are those with the educational attainment of bachelor's degree or higher, with 93.2% or 795 individuals in the labor force. Within the labor force, individuals with high school diploma education have the highest percentage of unemployment, with 11.2% or 121 of them being unemployed.
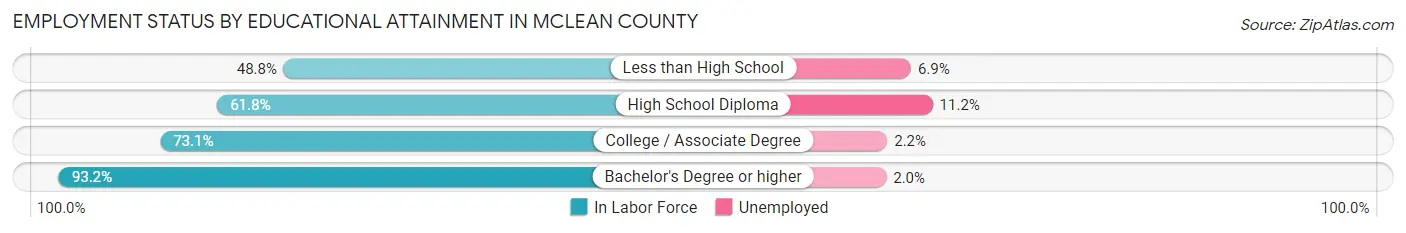
| Educational Attainment | In Labor Force | Unemployed |
| Less than High School | 160 (48.8%) | 23 (6.9%) |
| High School Diploma | 1,076 (61.8%) | 195 (11.2%) |
| College / Associate Degree | 1,201 (73.1%) | 36 (2.2%) |
| Bachelor's Degree or higher | 795 (93.2%) | 17 (2.0%) |
| Total | 3,232 (70.8%) | 247 (5.4%) |
Employment Occupations by Sex in McLean County
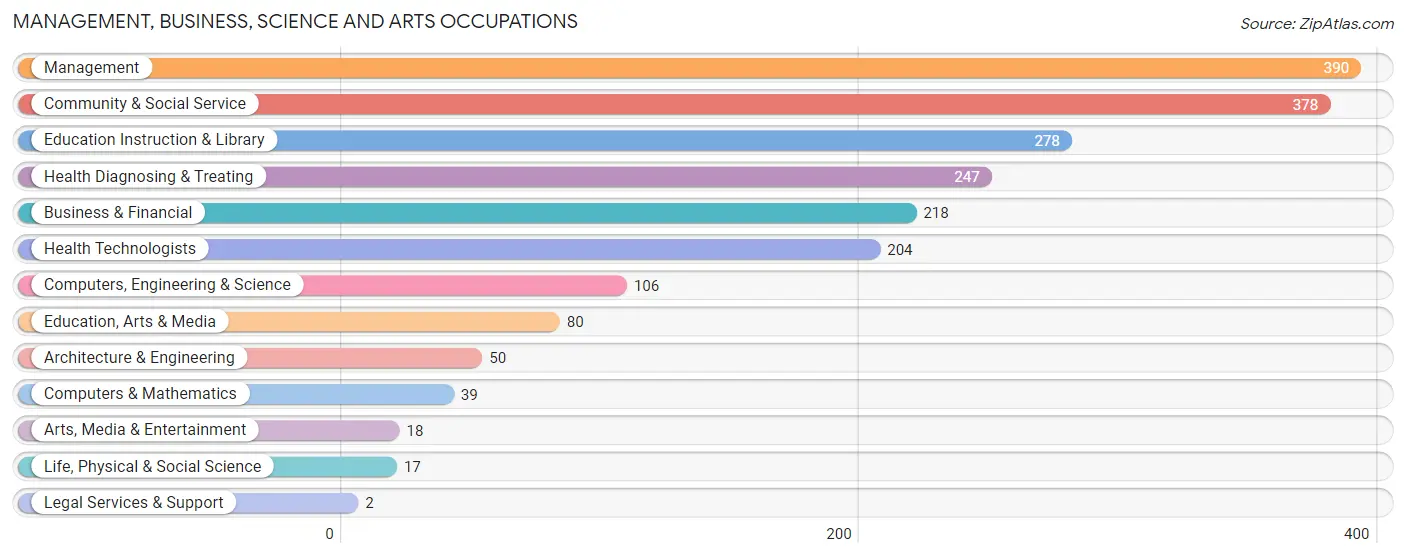
Management, Business, Science and Arts Occupations
The most common Management, Business, Science and Arts occupations in McLean County are Management (390 | 10.3%), Community & Social Service (378 | 10.0%), Education Instruction & Library (278 | 7.3%), Health Diagnosing & Treating (247 | 6.5%), and Business & Financial (218 | 5.8%).
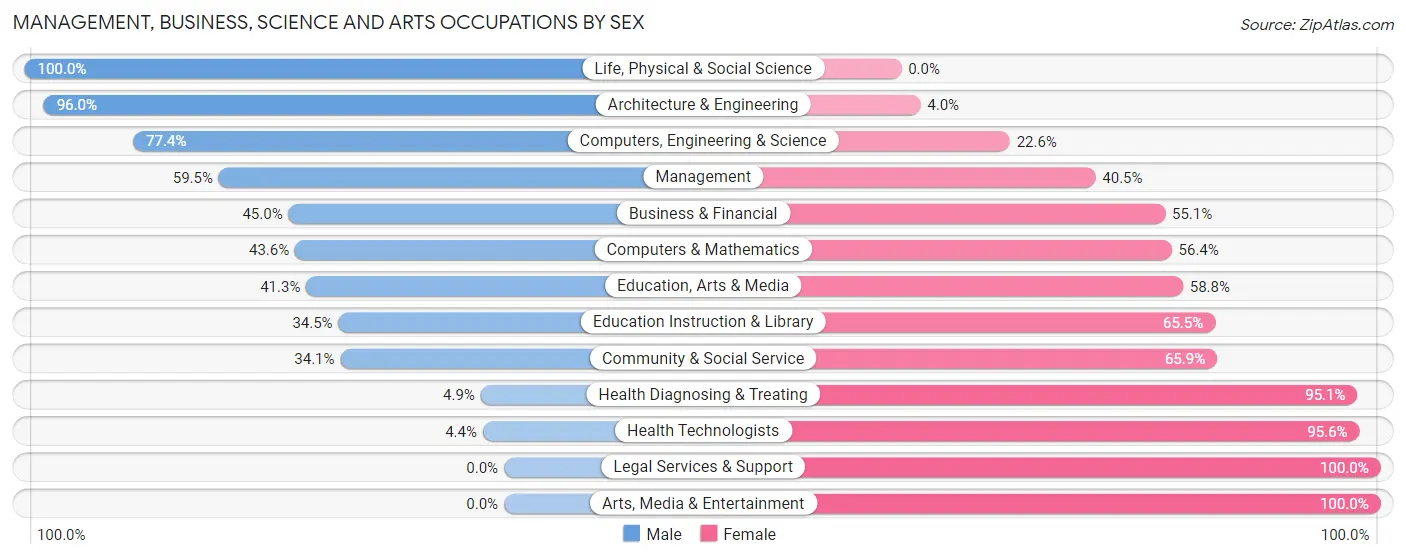
Management, Business, Science and Arts Occupations by Sex
Within the Management, Business, Science and Arts occupations in McLean County, the most male-oriented occupations are Life, Physical & Social Science (100.0%), Architecture & Engineering (96.0%), and Computers, Engineering & Science (77.4%), while the most female-oriented occupations are Legal Services & Support (100.0%), Arts, Media & Entertainment (100.0%), and Health Technologists (95.6%).
| Occupation | Male | Female |
| Management | 232 (59.5%) | 158 (40.5%) |
| Business & Financial | 98 (45.0%) | 120 (55.0%) |
| Computers, Engineering & Science | 82 (77.4%) | 24 (22.6%) |
| Computers & Mathematics | 17 (43.6%) | 22 (56.4%) |
| Architecture & Engineering | 48 (96.0%) | 2 (4.0%) |
| Life, Physical & Social Science | 17 (100.0%) | 0 (0.0%) |
| Community & Social Service | 129 (34.1%) | 249 (65.9%) |
| Education, Arts & Media | 33 (41.2%) | 47 (58.8%) |
| Legal Services & Support | 0 (0.0%) | 2 (100.0%) |
| Education Instruction & Library | 96 (34.5%) | 182 (65.5%) |
| Arts, Media & Entertainment | 0 (0.0%) | 18 (100.0%) |
| Health Diagnosing & Treating | 12 (4.9%) | 235 (95.1%) |
| Health Technologists | 9 (4.4%) | 195 (95.6%) |
| Total (Category) | 553 (41.3%) | 786 (58.7%) |
| Total (Overall) | 2,183 (57.7%) | 1,601 (42.3%) |
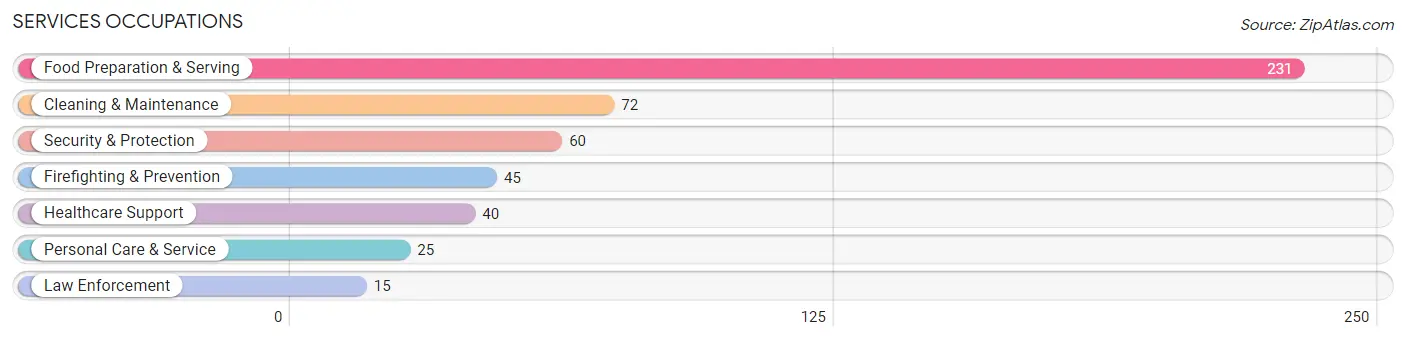
Services Occupations
The most common Services occupations in McLean County are Food Preparation & Serving (231 | 6.1%), Cleaning & Maintenance (72 | 1.9%), Security & Protection (60 | 1.6%), Firefighting & Prevention (45 | 1.2%), and Healthcare Support (40 | 1.1%).
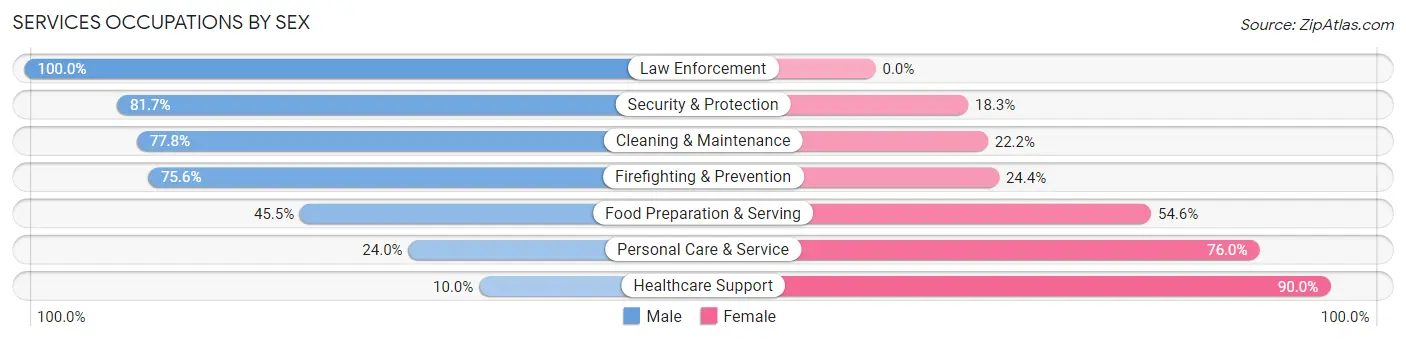
Services Occupations by Sex
Within the Services occupations in McLean County, the most male-oriented occupations are Law Enforcement (100.0%), Security & Protection (81.7%), and Cleaning & Maintenance (77.8%), while the most female-oriented occupations are Healthcare Support (90.0%), Personal Care & Service (76.0%), and Food Preparation & Serving (54.5%).
| Occupation | Male | Female |
| Healthcare Support | 4 (10.0%) | 36 (90.0%) |
| Security & Protection | 49 (81.7%) | 11 (18.3%) |
| Firefighting & Prevention | 34 (75.6%) | 11 (24.4%) |
| Law Enforcement | 15 (100.0%) | 0 (0.0%) |
| Food Preparation & Serving | 105 (45.5%) | 126 (54.5%) |
| Cleaning & Maintenance | 56 (77.8%) | 16 (22.2%) |
| Personal Care & Service | 6 (24.0%) | 19 (76.0%) |
| Total (Category) | 220 (51.4%) | 208 (48.6%) |
| Total (Overall) | 2,183 (57.7%) | 1,601 (42.3%) |
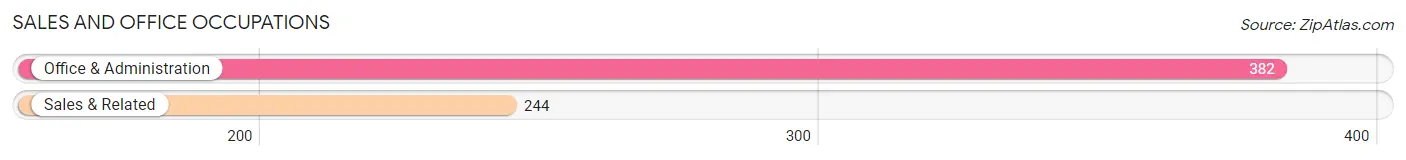
Sales and Office Occupations
The most common Sales and Office occupations in McLean County are Office & Administration (382 | 10.1%), and Sales & Related (244 | 6.5%).
Sales and Office Occupations by Sex
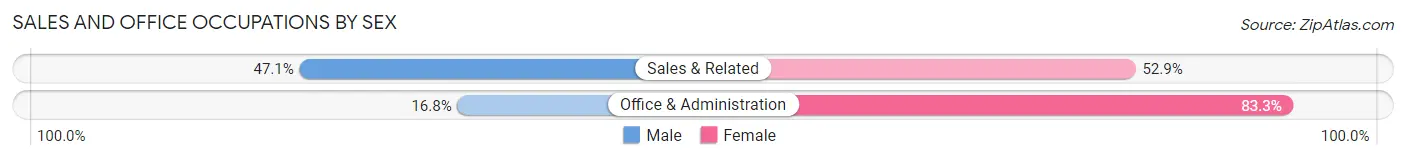
| Occupation | Male | Female |
| Sales & Related | 115 (47.1%) | 129 (52.9%) |
| Office & Administration | 64 (16.8%) | 318 (83.3%) |
| Total (Category) | 179 (28.6%) | 447 (71.4%) |
| Total (Overall) | 2,183 (57.7%) | 1,601 (42.3%) |
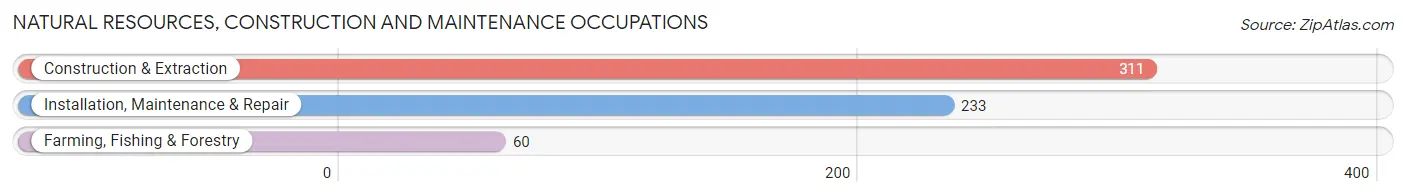
Natural Resources, Construction and Maintenance Occupations
The most common Natural Resources, Construction and Maintenance occupations in McLean County are Construction & Extraction (311 | 8.2%), Installation, Maintenance & Repair (233 | 6.2%), and Farming, Fishing & Forestry (60 | 1.6%).
Natural Resources, Construction and Maintenance Occupations by Sex
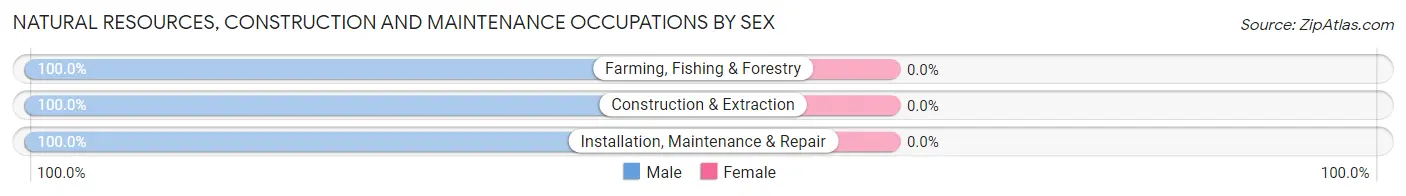
| Occupation | Male | Female |
| Farming, Fishing & Forestry | 60 (100.0%) | 0 (0.0%) |
| Construction & Extraction | 311 (100.0%) | 0 (0.0%) |
| Installation, Maintenance & Repair | 233 (100.0%) | 0 (0.0%) |
| Total (Category) | 604 (100.0%) | 0 (0.0%) |
| Total (Overall) | 2,183 (57.7%) | 1,601 (42.3%) |
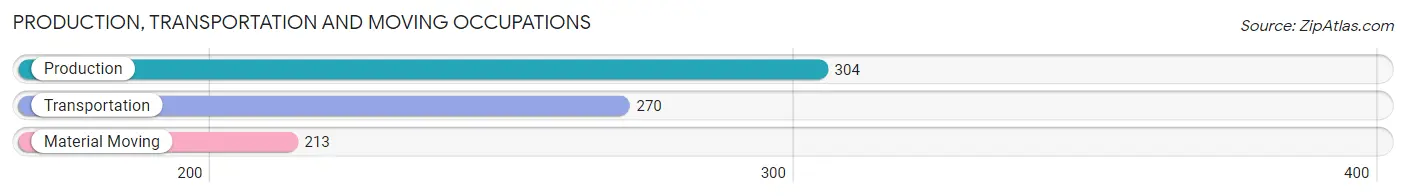
Production, Transportation and Moving Occupations
The most common Production, Transportation and Moving occupations in McLean County are Production (304 | 8.0%), Transportation (270 | 7.1%), and Material Moving (213 | 5.6%).
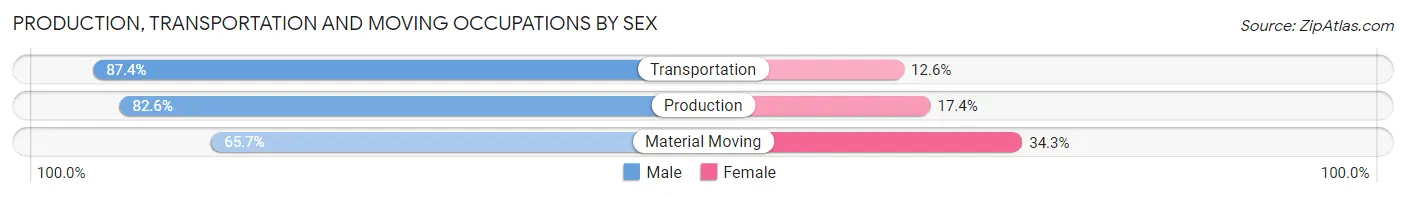
Production, Transportation and Moving Occupations by Sex
| Occupation | Male | Female |
| Production | 251 (82.6%) | 53 (17.4%) |
| Transportation | 236 (87.4%) | 34 (12.6%) |
| Material Moving | 140 (65.7%) | 73 (34.3%) |
| Total (Category) | 627 (79.7%) | 160 (20.3%) |
| Total (Overall) | 2,183 (57.7%) | 1,601 (42.3%) |
Employment Industries by Sex in McLean County
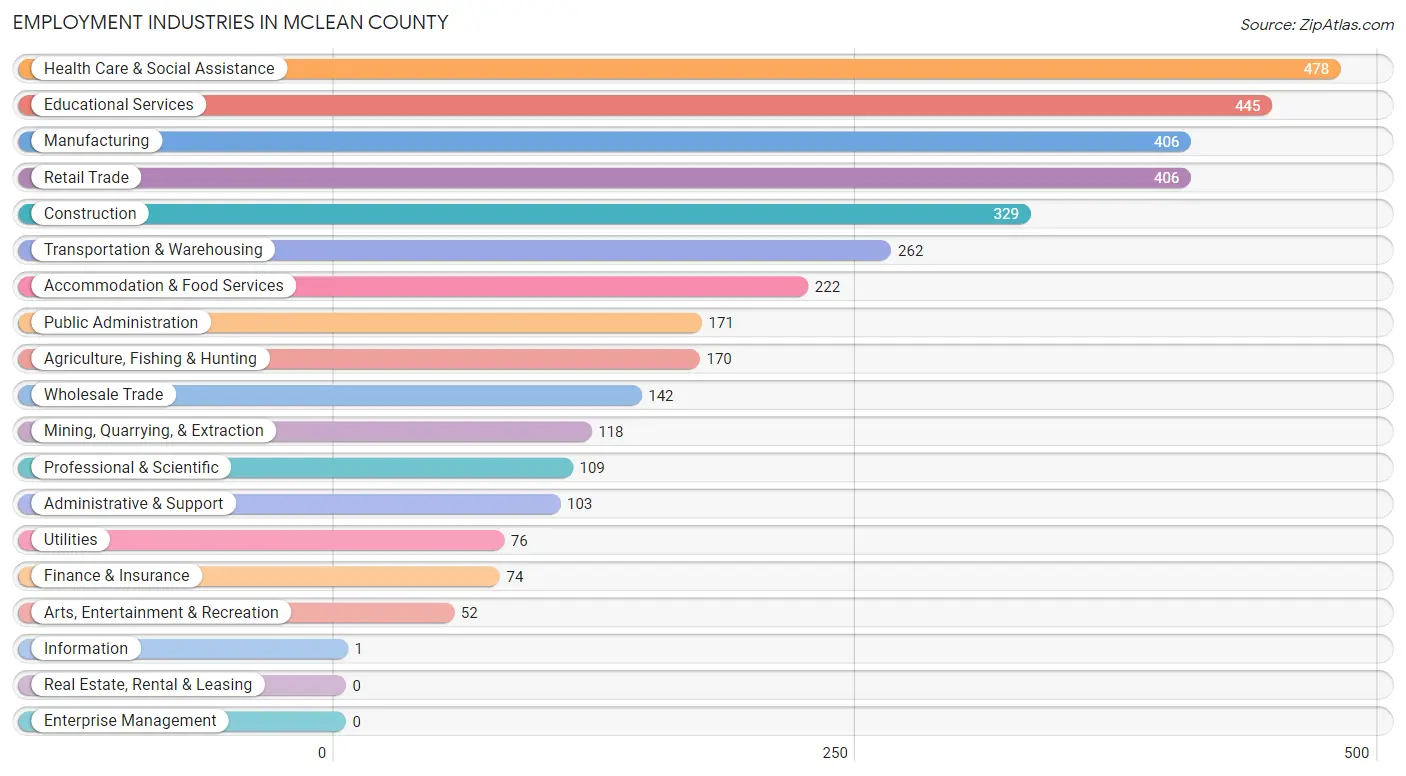
Employment Industries in McLean County
The major employment industries in McLean County include Health Care & Social Assistance (478 | 12.6%), Educational Services (445 | 11.8%), Manufacturing (406 | 10.7%), Retail Trade (406 | 10.7%), and Construction (329 | 8.7%).
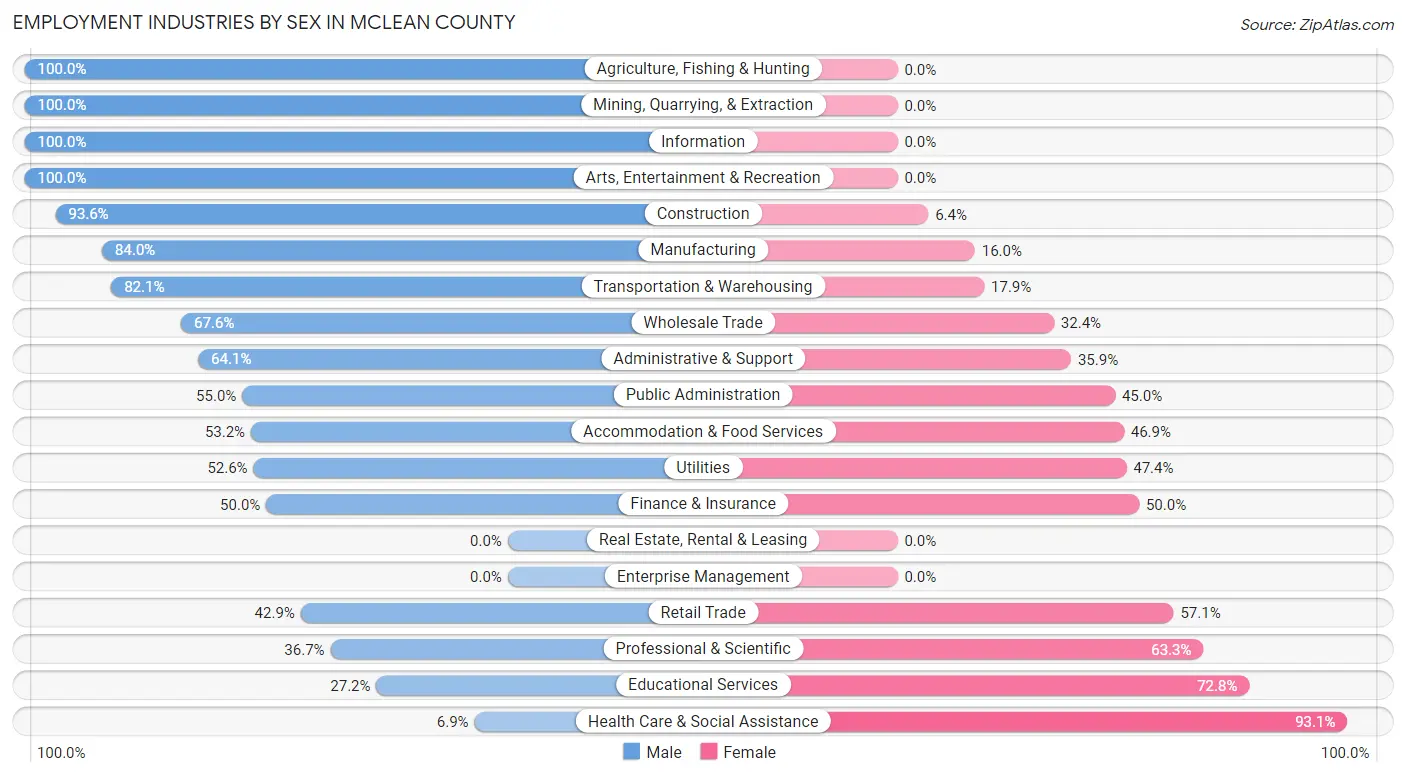
Employment Industries by Sex in McLean County
The McLean County industries that see more men than women are Agriculture, Fishing & Hunting (100.0%), Mining, Quarrying, & Extraction (100.0%), and Information (100.0%), whereas the industries that tend to have a higher number of women are Health Care & Social Assistance (93.1%), Educational Services (72.8%), and Professional & Scientific (63.3%).
| Industry | Male | Female |
| Agriculture, Fishing & Hunting | 170 (100.0%) | 0 (0.0%) |
| Mining, Quarrying, & Extraction | 118 (100.0%) | 0 (0.0%) |
| Construction | 308 (93.6%) | 21 (6.4%) |
| Manufacturing | 341 (84.0%) | 65 (16.0%) |
| Wholesale Trade | 96 (67.6%) | 46 (32.4%) |
| Retail Trade | 174 (42.9%) | 232 (57.1%) |
| Transportation & Warehousing | 215 (82.1%) | 47 (17.9%) |
| Utilities | 40 (52.6%) | 36 (47.4%) |
| Information | 1 (100.0%) | 0 (0.0%) |
| Finance & Insurance | 37 (50.0%) | 37 (50.0%) |
| Real Estate, Rental & Leasing | 0 (0.0%) | 0 (0.0%) |
| Professional & Scientific | 40 (36.7%) | 69 (63.3%) |
| Enterprise Management | 0 (0.0%) | 0 (0.0%) |
| Administrative & Support | 66 (64.1%) | 37 (35.9%) |
| Educational Services | 121 (27.2%) | 324 (72.8%) |
| Health Care & Social Assistance | 33 (6.9%) | 445 (93.1%) |
| Arts, Entertainment & Recreation | 52 (100.0%) | 0 (0.0%) |
| Accommodation & Food Services | 118 (53.1%) | 104 (46.9%) |
| Public Administration | 94 (55.0%) | 77 (45.0%) |
| Total | 2,183 (57.7%) | 1,601 (42.3%) |
Education in McLean County
School Enrollment in McLean County
The most common levels of schooling among the 2,158 students in McLean County are middle school (505 | 23.4%), high school (481 | 22.3%), and elementary school (474 | 22.0%).
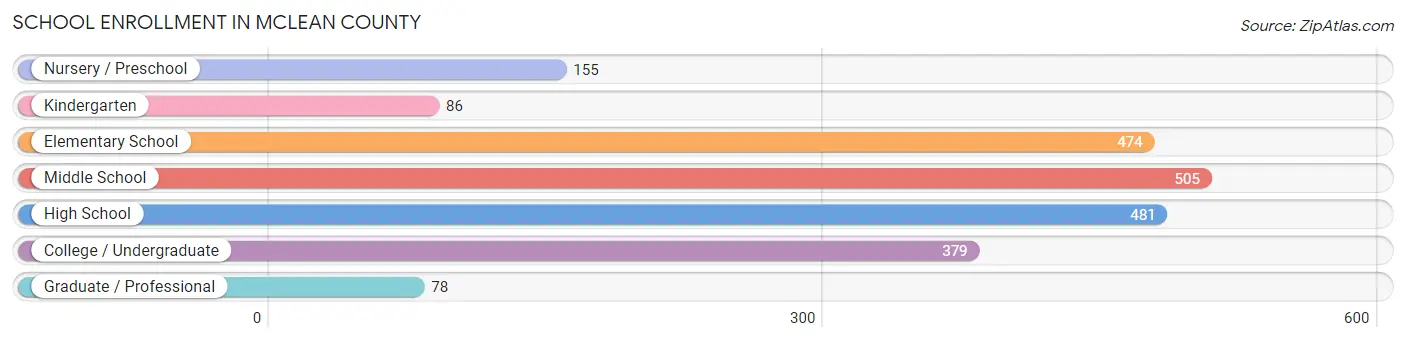
| School Level | # Students | % Students |
| Nursery / Preschool | 155 | 7.2% |
| Kindergarten | 86 | 4.0% |
| Elementary School | 474 | 22.0% |
| Middle School | 505 | 23.4% |
| High School | 481 | 22.3% |
| College / Undergraduate | 379 | 17.6% |
| Graduate / Professional | 78 | 3.6% |
| Total | 2,158 | 100.0% |
School Enrollment by Age by Funding Source in McLean County
Out of a total of 2,158 students who are enrolled in schools in McLean County, 233 (10.8%) attend a private institution, while the remaining 1,925 (89.2%) are enrolled in public schools. The age group of 18 to 19 year olds has the highest likelihood of being enrolled in private schools, with 27 (18.1% in the age bracket) enrolled. Conversely, the age group of 20 to 24 year olds has the lowest likelihood of being enrolled in a private school, with 106 (98.2% in the age bracket) attending a public institution.
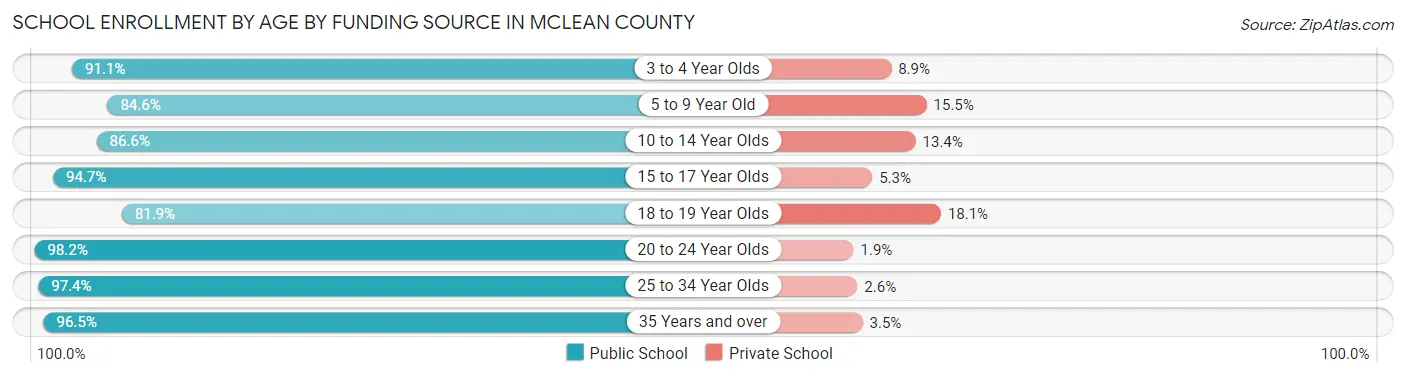
| Age Bracket | Public School | Private School |
| 3 to 4 Year Olds | 72 (91.1%) | 7 (8.9%) |
| 5 to 9 Year Old | 427 (84.6%) | 78 (15.4%) |
| 10 to 14 Year Olds | 575 (86.6%) | 89 (13.4%) |
| 15 to 17 Year Olds | 427 (94.7%) | 24 (5.3%) |
| 18 to 19 Year Olds | 122 (81.9%) | 27 (18.1%) |
| 20 to 24 Year Olds | 106 (98.2%) | 2 (1.8%) |
| 25 to 34 Year Olds | 114 (97.4%) | 3 (2.6%) |
| 35 Years and over | 82 (96.5%) | 3 (3.5%) |
| Total | 1,925 (89.2%) | 233 (10.8%) |
Educational Attainment by Field of Study in McLean County
Education (466 | 39.4%), business (245 | 20.7%), science & technology (164 | 13.9%), bio, nature & agricultural (92 | 7.8%), and engineering (53 | 4.5%) are the most common fields of study among 1,182 individuals in McLean County who have obtained a bachelor's degree or higher.
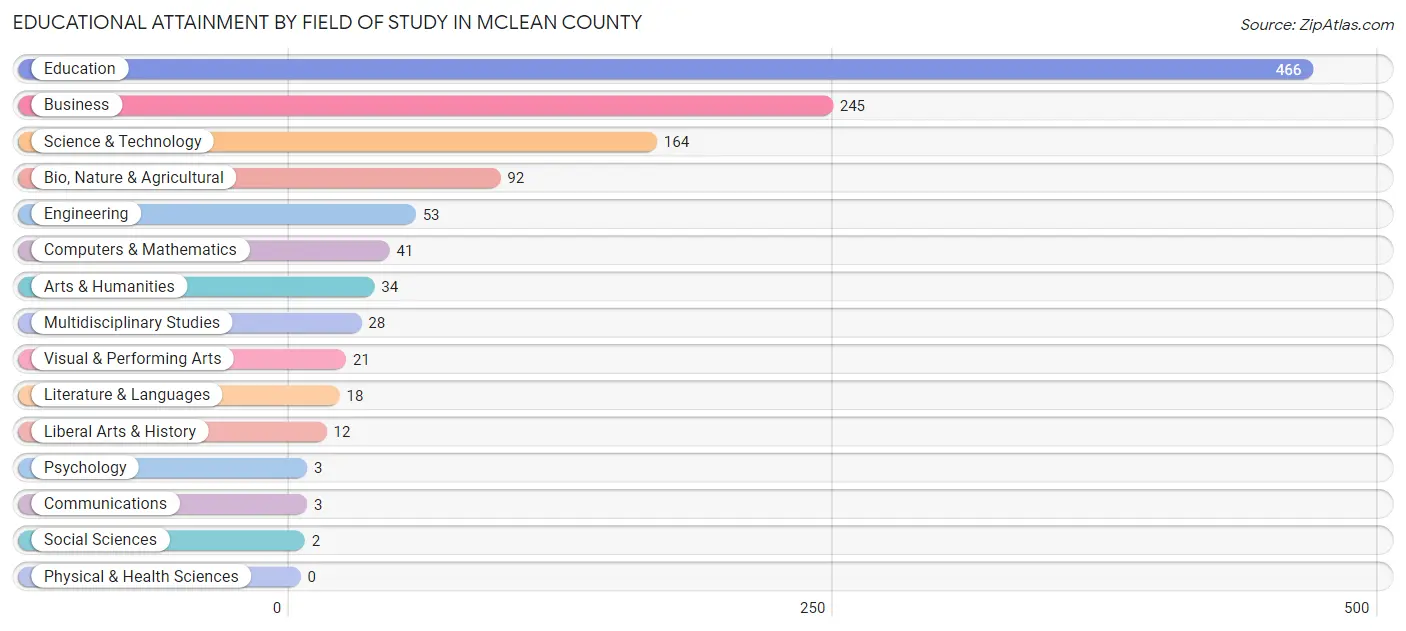
| Field of Study | # Graduates | % Graduates |
| Computers & Mathematics | 41 | 3.5% |
| Bio, Nature & Agricultural | 92 | 7.8% |
| Physical & Health Sciences | 0 | 0.0% |
| Psychology | 3 | 0.3% |
| Social Sciences | 2 | 0.2% |
| Engineering | 53 | 4.5% |
| Multidisciplinary Studies | 28 | 2.4% |
| Science & Technology | 164 | 13.9% |
| Business | 245 | 20.7% |
| Education | 466 | 39.4% |
| Literature & Languages | 18 | 1.5% |
| Liberal Arts & History | 12 | 1.0% |
| Visual & Performing Arts | 21 | 1.8% |
| Communications | 3 | 0.3% |
| Arts & Humanities | 34 | 2.9% |
| Total | 1,182 | 100.0% |
Transportation & Commute in McLean County
Vehicle Availability by Sex in McLean County
The most prevalent vehicle ownership categories in McLean County are males with 2 vehicles (781, accounting for 36.7%) and females with 2 vehicles (527, making up 50.1%).
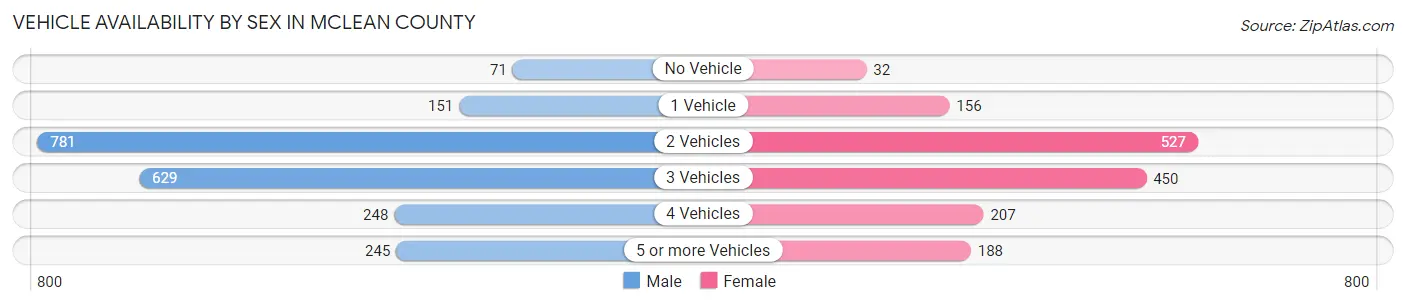
| Vehicles Available | Male | Female |
| No Vehicle | 71 (3.3%) | 32 (2.1%) |
| 1 Vehicle | 151 (7.1%) | 156 (10.0%) |
| 2 Vehicles | 781 (36.7%) | 527 (33.8%) |
| 3 Vehicles | 629 (29.6%) | 450 (28.8%) |
| 4 Vehicles | 248 (11.7%) | 207 (13.3%) |
| 5 or more Vehicles | 245 (11.5%) | 188 (12.0%) |
| Total | 2,125 (100.0%) | 1,560 (100.0%) |
Commute Time in McLean County
The most frequently occuring commute durations in McLean County are 30 to 34 minutes (563 commuters, 15.9%), 15 to 19 minutes (411 commuters, 11.6%), and 5 to 9 minutes (365 commuters, 10.3%).
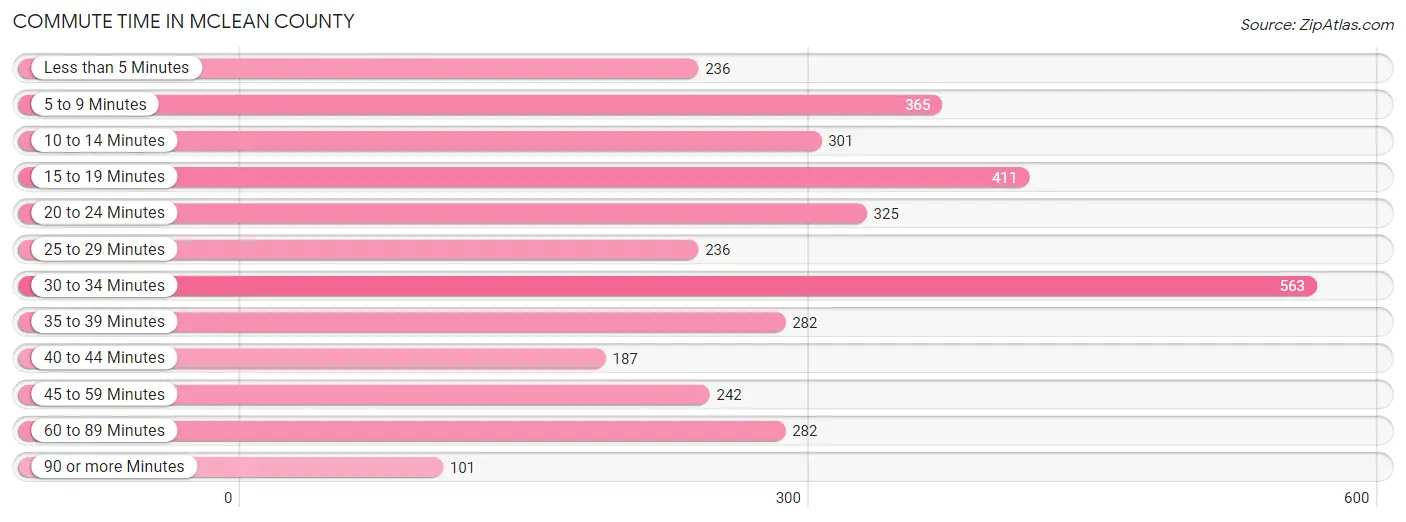
| Commute Time | # Commuters | % Commuters |
| Less than 5 Minutes | 236 | 6.7% |
| 5 to 9 Minutes | 365 | 10.3% |
| 10 to 14 Minutes | 301 | 8.5% |
| 15 to 19 Minutes | 411 | 11.6% |
| 20 to 24 Minutes | 325 | 9.2% |
| 25 to 29 Minutes | 236 | 6.7% |
| 30 to 34 Minutes | 563 | 15.9% |
| 35 to 39 Minutes | 282 | 8.0% |
| 40 to 44 Minutes | 187 | 5.3% |
| 45 to 59 Minutes | 242 | 6.9% |
| 60 to 89 Minutes | 282 | 8.0% |
| 90 or more Minutes | 101 | 2.9% |
Commute Time by Sex in McLean County
The most common commute times in McLean County are 30 to 34 minutes (299 commuters, 14.6%) for males and 30 to 34 minutes (264 commuters, 17.7%) for females.
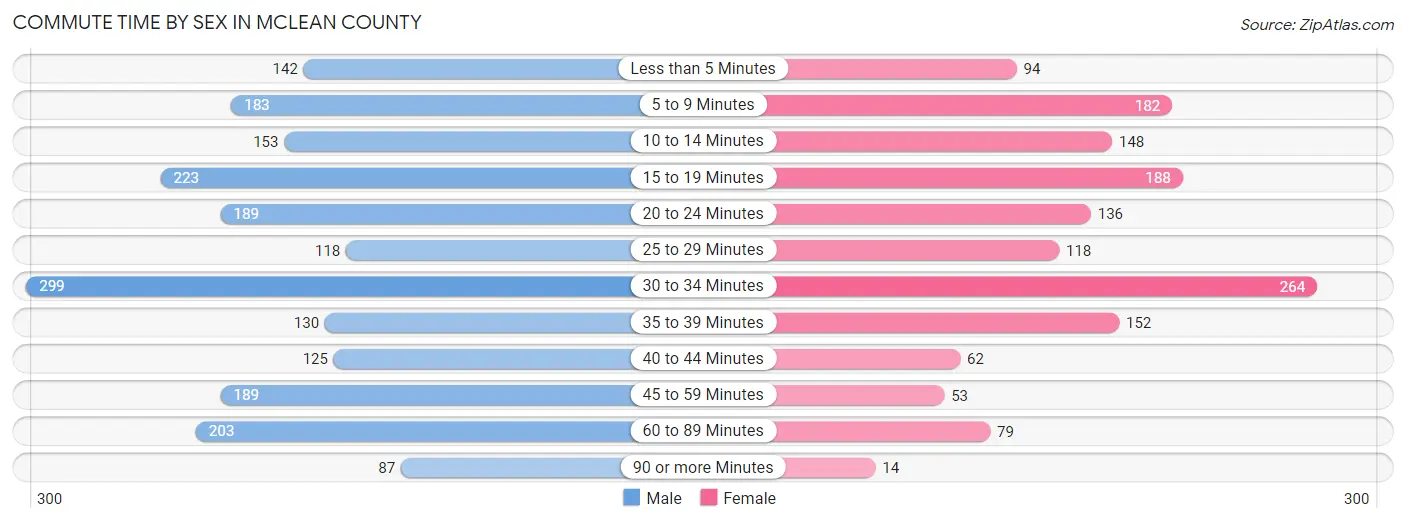
| Commute Time | Male | Female |
| Less than 5 Minutes | 142 (7.0%) | 94 (6.3%) |
| 5 to 9 Minutes | 183 (9.0%) | 182 (12.2%) |
| 10 to 14 Minutes | 153 (7.5%) | 148 (9.9%) |
| 15 to 19 Minutes | 223 (10.9%) | 188 (12.6%) |
| 20 to 24 Minutes | 189 (9.3%) | 136 (9.1%) |
| 25 to 29 Minutes | 118 (5.8%) | 118 (7.9%) |
| 30 to 34 Minutes | 299 (14.6%) | 264 (17.7%) |
| 35 to 39 Minutes | 130 (6.4%) | 152 (10.2%) |
| 40 to 44 Minutes | 125 (6.1%) | 62 (4.2%) |
| 45 to 59 Minutes | 189 (9.3%) | 53 (3.6%) |
| 60 to 89 Minutes | 203 (10.0%) | 79 (5.3%) |
| 90 or more Minutes | 87 (4.3%) | 14 (0.9%) |
Time of Departure to Work by Sex in McLean County
The most frequent times of departure to work in McLean County are 7:00 AM to 7:29 AM (290, 14.2%) for males and 7:30 AM to 7:59 AM (371, 24.9%) for females.
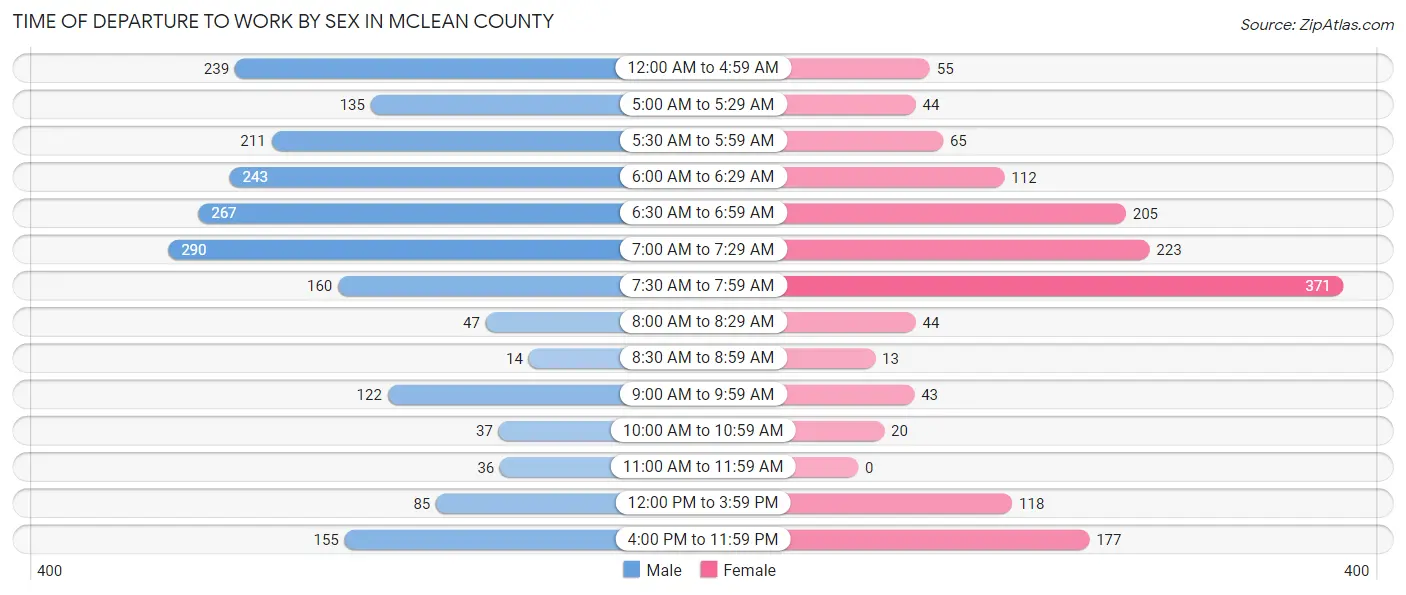
| Time of Departure | Male | Female |
| 12:00 AM to 4:59 AM | 239 (11.7%) | 55 (3.7%) |
| 5:00 AM to 5:29 AM | 135 (6.6%) | 44 (2.9%) |
| 5:30 AM to 5:59 AM | 211 (10.3%) | 65 (4.4%) |
| 6:00 AM to 6:29 AM | 243 (11.9%) | 112 (7.5%) |
| 6:30 AM to 6:59 AM | 267 (13.1%) | 205 (13.8%) |
| 7:00 AM to 7:29 AM | 290 (14.2%) | 223 (15.0%) |
| 7:30 AM to 7:59 AM | 160 (7.8%) | 371 (24.9%) |
| 8:00 AM to 8:29 AM | 47 (2.3%) | 44 (2.9%) |
| 8:30 AM to 8:59 AM | 14 (0.7%) | 13 (0.9%) |
| 9:00 AM to 9:59 AM | 122 (6.0%) | 43 (2.9%) |
| 10:00 AM to 10:59 AM | 37 (1.8%) | 20 (1.3%) |
| 11:00 AM to 11:59 AM | 36 (1.8%) | 0 (0.0%) |
| 12:00 PM to 3:59 PM | 85 (4.2%) | 118 (7.9%) |
| 4:00 PM to 11:59 PM | 155 (7.6%) | 177 (11.9%) |
| Total | 2,041 (100.0%) | 1,490 (100.0%) |
Housing Occupancy in McLean County
Occupancy by Ownership in McLean County
Of the total 3,609 dwellings in McLean County, owner-occupied units account for 2,902 (80.4%), while renter-occupied units make up 707 (19.6%).
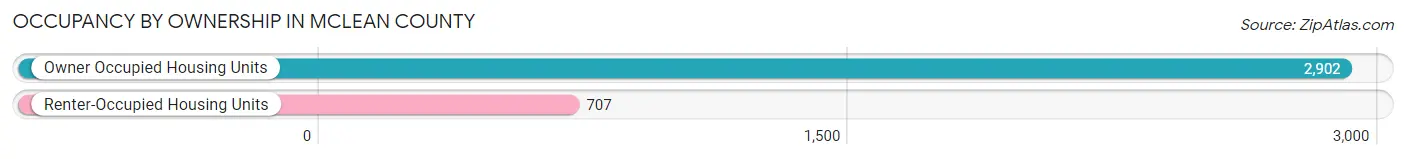
| Occupancy | # Housing Units | % Housing Units |
| Owner Occupied Housing Units | 2,902 | 80.4% |
| Renter-Occupied Housing Units | 707 | 19.6% |
| Total Occupied Housing Units | 3,609 | 100.0% |
Occupancy by Household Size in McLean County
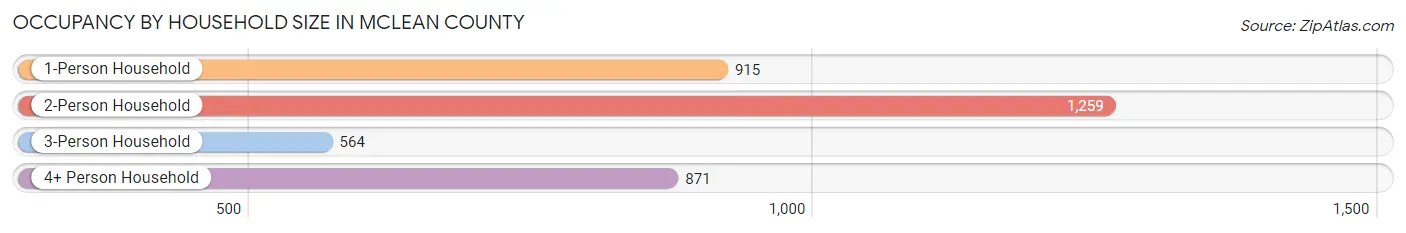
| Household Size | # Housing Units | % Housing Units |
| 1-Person Household | 915 | 25.4% |
| 2-Person Household | 1,259 | 34.9% |
| 3-Person Household | 564 | 15.6% |
| 4+ Person Household | 871 | 24.1% |
| Total Housing Units | 3,609 | 100.0% |
Occupancy by Ownership by Household Size in McLean County
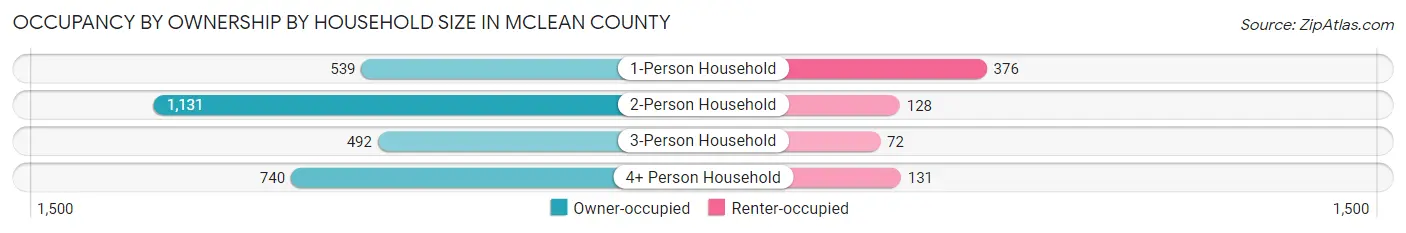
| Household Size | Owner-occupied | Renter-occupied |
| 1-Person Household | 539 (58.9%) | 376 (41.1%) |
| 2-Person Household | 1,131 (89.8%) | 128 (10.2%) |
| 3-Person Household | 492 (87.2%) | 72 (12.8%) |
| 4+ Person Household | 740 (85.0%) | 131 (15.0%) |
| Total Housing Units | 2,902 (80.4%) | 707 (19.6%) |
Occupancy by Educational Attainment in McLean County
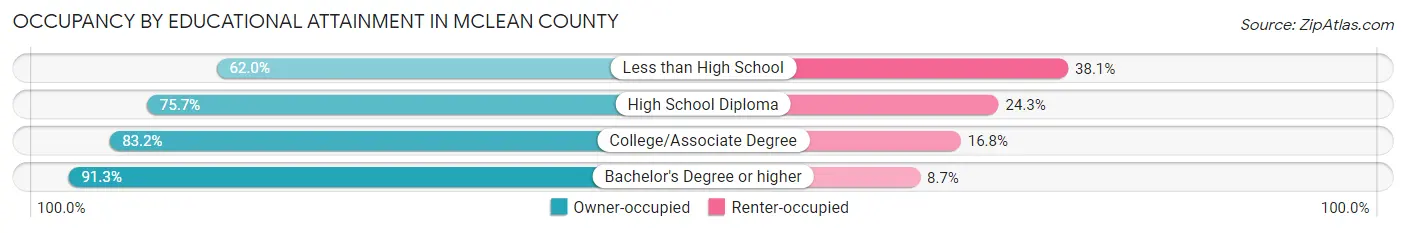
| Household Size | Owner-occupied | Renter-occupied |
| Less than High School | 197 (62.0%) | 121 (38.1%) |
| High School Diploma | 999 (75.7%) | 320 (24.3%) |
| College/Associate Degree | 972 (83.2%) | 196 (16.8%) |
| Bachelor's Degree or higher | 734 (91.3%) | 70 (8.7%) |
Occupancy by Age of Householder in McLean County
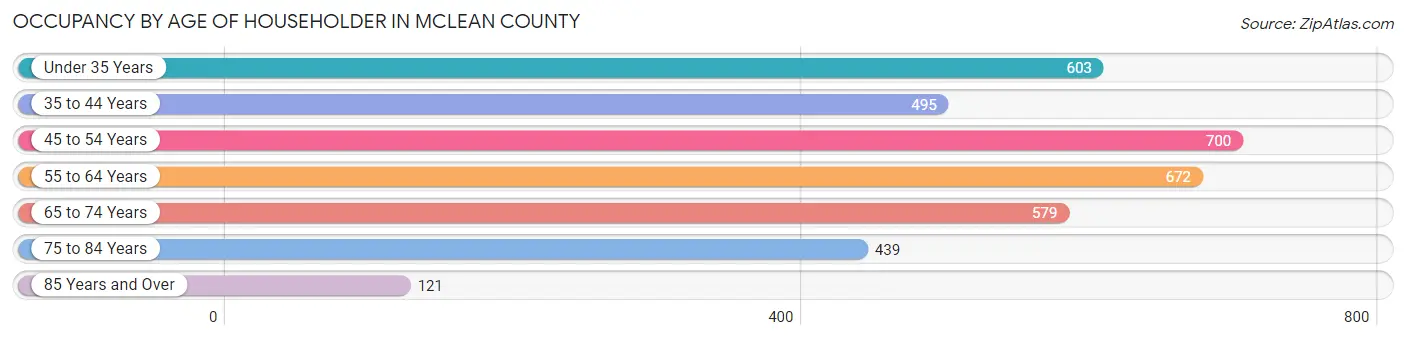
| Age Bracket | # Households | % Households |
| Under 35 Years | 603 | 16.7% |
| 35 to 44 Years | 495 | 13.7% |
| 45 to 54 Years | 700 | 19.4% |
| 55 to 64 Years | 672 | 18.6% |
| 65 to 74 Years | 579 | 16.0% |
| 75 to 84 Years | 439 | 12.2% |
| 85 Years and Over | 121 | 3.4% |
| Total | 3,609 | 100.0% |
Housing Finances in McLean County
Median Income by Occupancy in McLean County
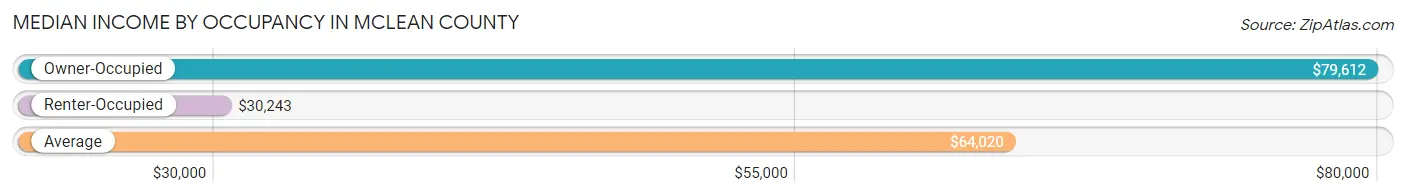
| Occupancy Type | # Households | Median Income |
| Owner-Occupied | 2,902 (80.4%) | $79,612 |
| Renter-Occupied | 707 (19.6%) | $30,243 |
| Average | 3,609 (100.0%) | $64,020 |
Occupancy by Householder Income Bracket in McLean County
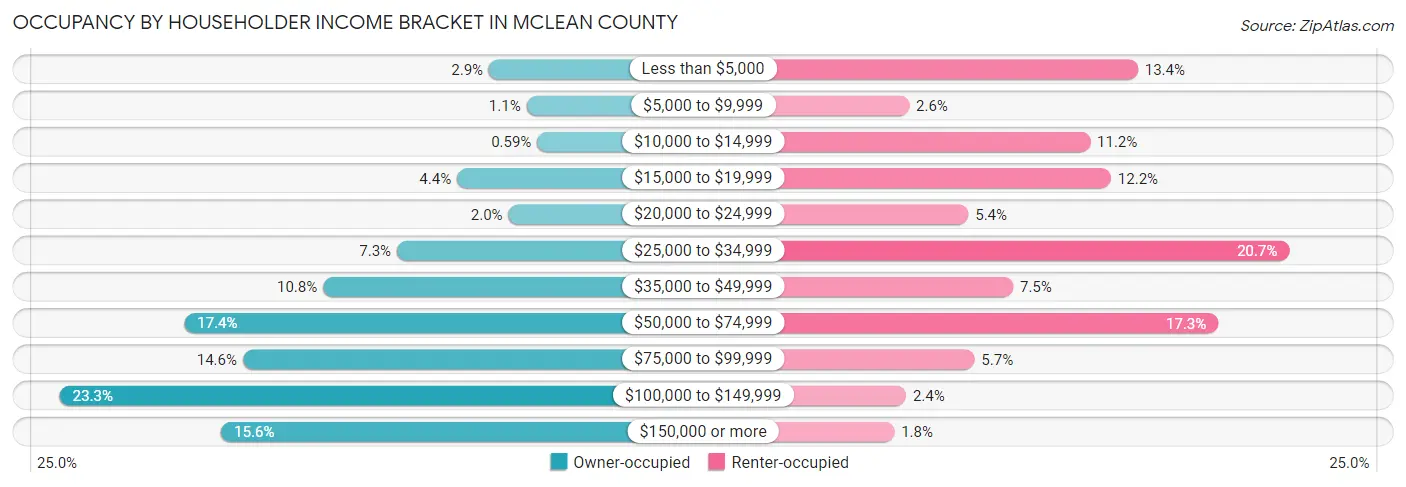
| Income Bracket | Owner-occupied | Renter-occupied |
| Less than $5,000 | 84 (2.9%) | 95 (13.4%) |
| $5,000 to $9,999 | 32 (1.1%) | 18 (2.5%) |
| $10,000 to $14,999 | 17 (0.6%) | 79 (11.2%) |
| $15,000 to $19,999 | 128 (4.4%) | 86 (12.2%) |
| $20,000 to $24,999 | 57 (2.0%) | 38 (5.4%) |
| $25,000 to $34,999 | 211 (7.3%) | 146 (20.6%) |
| $35,000 to $49,999 | 313 (10.8%) | 53 (7.5%) |
| $50,000 to $74,999 | 505 (17.4%) | 122 (17.3%) |
| $75,000 to $99,999 | 424 (14.6%) | 40 (5.7%) |
| $100,000 to $149,999 | 677 (23.3%) | 17 (2.4%) |
| $150,000 or more | 454 (15.6%) | 13 (1.8%) |
| Total | 2,902 (100.0%) | 707 (100.0%) |
Monthly Housing Cost Tiers in McLean County
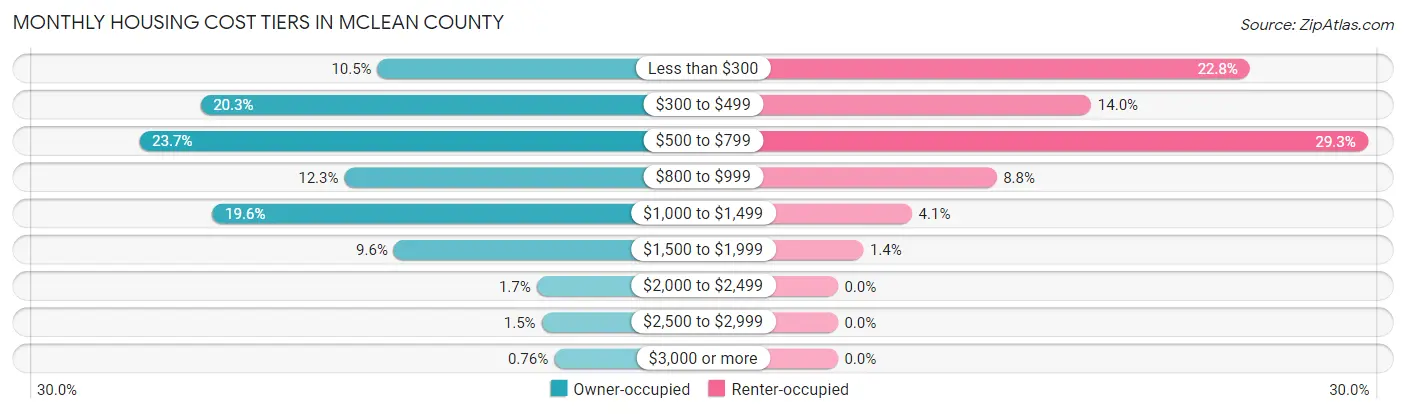
| Monthly Cost | Owner-occupied | Renter-occupied |
| Less than $300 | 305 (10.5%) | 161 (22.8%) |
| $300 to $499 | 589 (20.3%) | 99 (14.0%) |
| $500 to $799 | 687 (23.7%) | 207 (29.3%) |
| $800 to $999 | 358 (12.3%) | 62 (8.8%) |
| $1,000 to $1,499 | 570 (19.6%) | 29 (4.1%) |
| $1,500 to $1,999 | 279 (9.6%) | 10 (1.4%) |
| $2,000 to $2,499 | 50 (1.7%) | 0 (0.0%) |
| $2,500 to $2,999 | 42 (1.5%) | 0 (0.0%) |
| $3,000 or more | 22 (0.8%) | 0 (0.0%) |
| Total | 2,902 (100.0%) | 707 (100.0%) |
Physical Housing Characteristics in McLean County
Housing Structures in McLean County
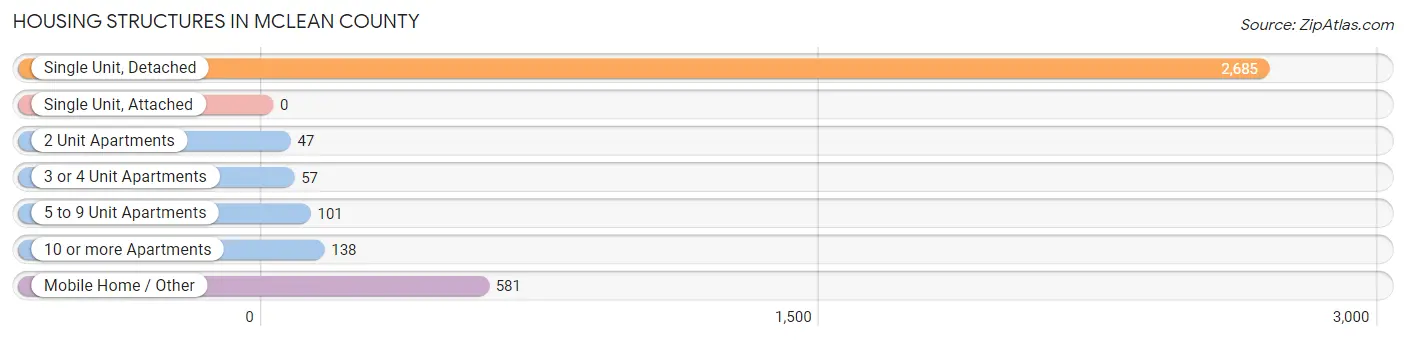
| Structure Type | # Housing Units | % Housing Units |
| Single Unit, Detached | 2,685 | 74.4% |
| Single Unit, Attached | 0 | 0.0% |
| 2 Unit Apartments | 47 | 1.3% |
| 3 or 4 Unit Apartments | 57 | 1.6% |
| 5 to 9 Unit Apartments | 101 | 2.8% |
| 10 or more Apartments | 138 | 3.8% |
| Mobile Home / Other | 581 | 16.1% |
| Total | 3,609 | 100.0% |
Housing Structures by Occupancy in McLean County
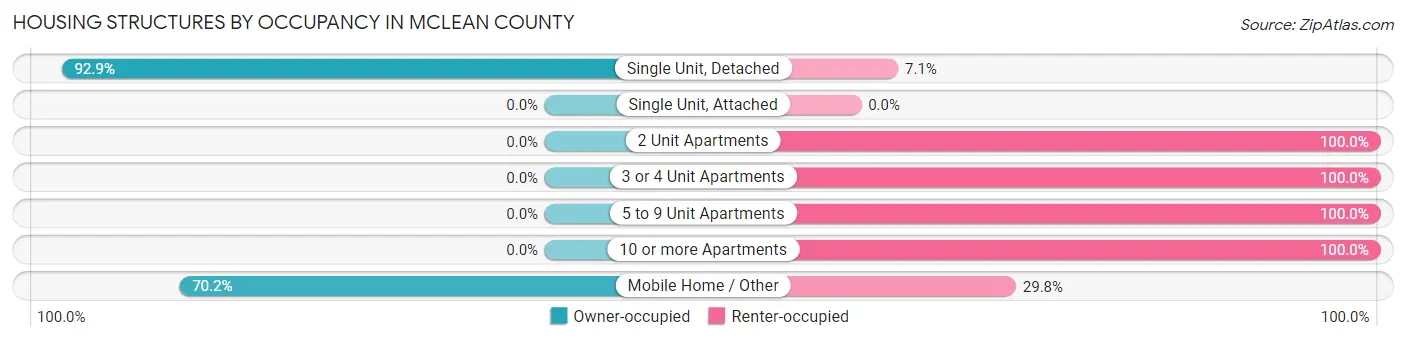
| Structure Type | Owner-occupied | Renter-occupied |
| Single Unit, Detached | 2,494 (92.9%) | 191 (7.1%) |
| Single Unit, Attached | 0 (0.0%) | 0 (0.0%) |
| 2 Unit Apartments | 0 (0.0%) | 47 (100.0%) |
| 3 or 4 Unit Apartments | 0 (0.0%) | 57 (100.0%) |
| 5 to 9 Unit Apartments | 0 (0.0%) | 101 (100.0%) |
| 10 or more Apartments | 0 (0.0%) | 138 (100.0%) |
| Mobile Home / Other | 408 (70.2%) | 173 (29.8%) |
| Total | 2,902 (80.4%) | 707 (19.6%) |
Housing Structures by Number of Rooms in McLean County
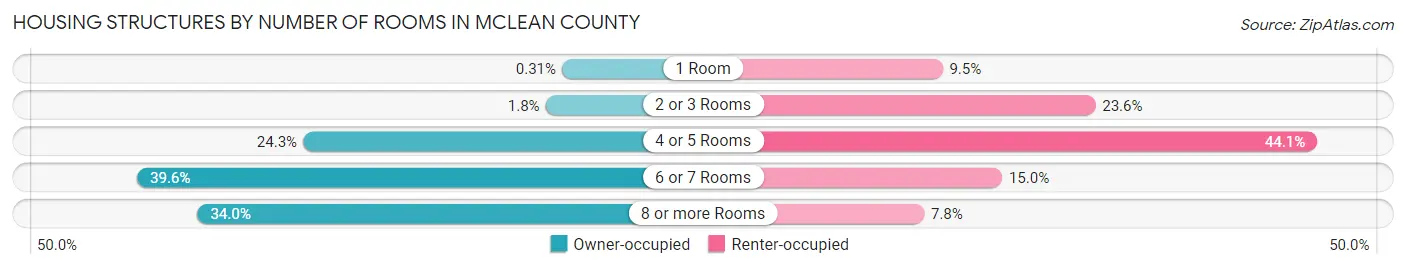
| Number of Rooms | Owner-occupied | Renter-occupied |
| 1 Room | 9 (0.3%) | 67 (9.5%) |
| 2 or 3 Rooms | 53 (1.8%) | 167 (23.6%) |
| 4 or 5 Rooms | 704 (24.3%) | 312 (44.1%) |
| 6 or 7 Rooms | 1,149 (39.6%) | 106 (15.0%) |
| 8 or more Rooms | 987 (34.0%) | 55 (7.8%) |
| Total | 2,902 (100.0%) | 707 (100.0%) |
Housing Structure by Heating Type in McLean County
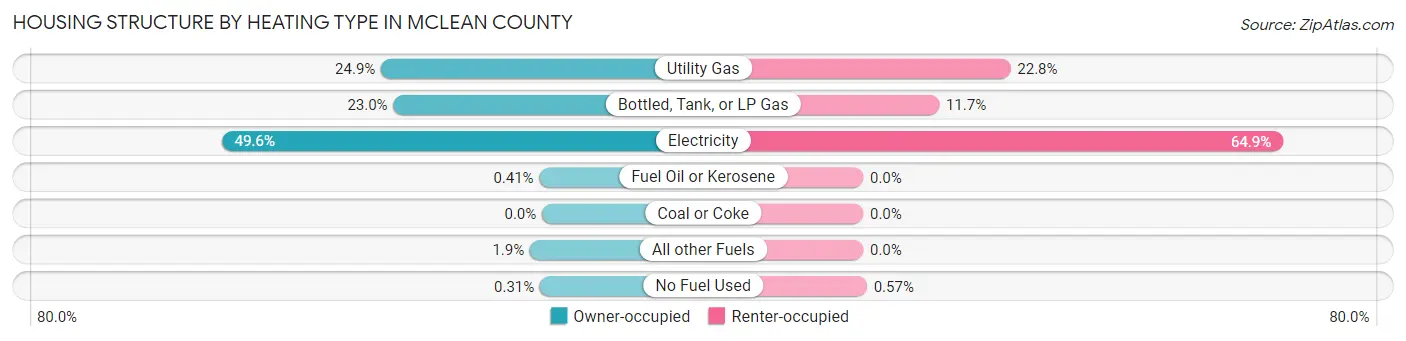
| Heating Type | Owner-occupied | Renter-occupied |
| Utility Gas | 722 (24.9%) | 161 (22.8%) |
| Bottled, Tank, or LP Gas | 667 (23.0%) | 83 (11.7%) |
| Electricity | 1,438 (49.5%) | 459 (64.9%) |
| Fuel Oil or Kerosene | 12 (0.4%) | 0 (0.0%) |
| Coal or Coke | 0 (0.0%) | 0 (0.0%) |
| All other Fuels | 54 (1.9%) | 0 (0.0%) |
| No Fuel Used | 9 (0.3%) | 4 (0.6%) |
| Total | 2,902 (100.0%) | 707 (100.0%) |
Household Vehicle Usage in McLean County
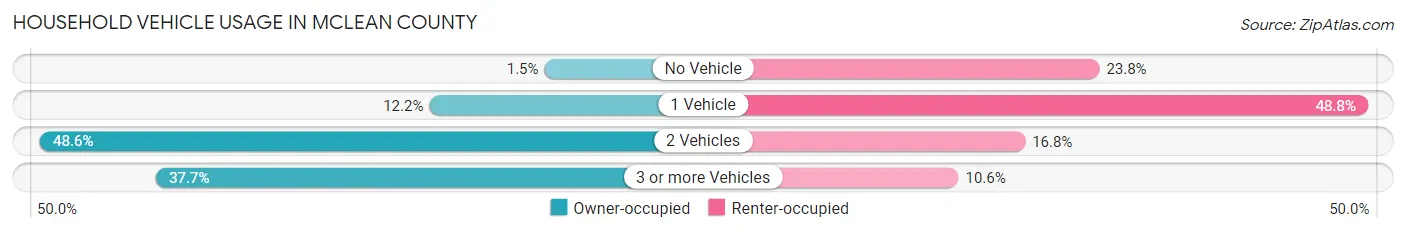
| Vehicles per Household | Owner-occupied | Renter-occupied |
| No Vehicle | 43 (1.5%) | 168 (23.8%) |
| 1 Vehicle | 355 (12.2%) | 345 (48.8%) |
| 2 Vehicles | 1,409 (48.5%) | 119 (16.8%) |
| 3 or more Vehicles | 1,095 (37.7%) | 75 (10.6%) |
| Total | 2,902 (100.0%) | 707 (100.0%) |
Real Estate & Mortgages in McLean County
Real Estate and Mortgage Overview in McLean County
| Characteristic | Without Mortgage | With Mortgage |
| Housing Units | 1,444 | 1,458 |
| Median Property Value | $125,700 | $150,900 |
| Median Household Income | $59,167 | $229 |
| Monthly Housing Costs | $437 | $22 |
| Real Estate Taxes | $745 | $66 |
Property Value by Mortgage Status in McLean County
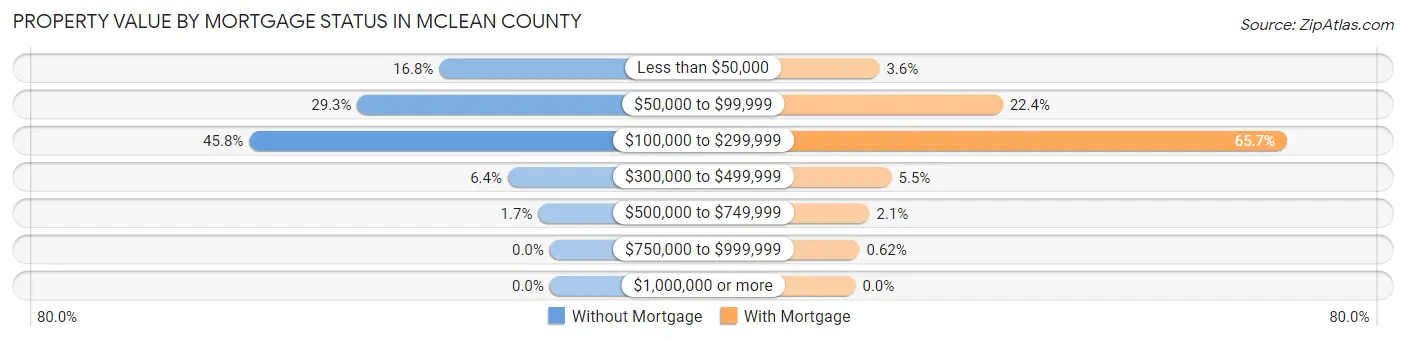
| Property Value | Without Mortgage | With Mortgage |
| Less than $50,000 | 243 (16.8%) | 53 (3.6%) |
| $50,000 to $99,999 | 423 (29.3%) | 327 (22.4%) |
| $100,000 to $299,999 | 661 (45.8%) | 958 (65.7%) |
| $300,000 to $499,999 | 92 (6.4%) | 80 (5.5%) |
| $500,000 to $749,999 | 25 (1.7%) | 31 (2.1%) |
| $750,000 to $999,999 | 0 (0.0%) | 9 (0.6%) |
| $1,000,000 or more | 0 (0.0%) | 0 (0.0%) |
| Total | 1,444 (100.0%) | 1,458 (100.0%) |
Household Income by Mortgage Status in McLean County
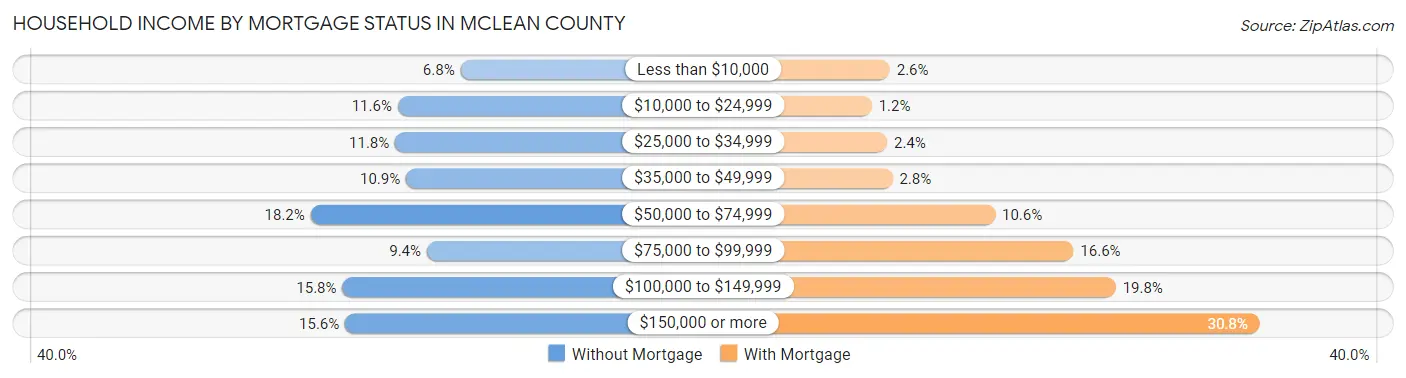
| Household Income | Without Mortgage | With Mortgage |
| Less than $10,000 | 98 (6.8%) | 38 (2.6%) |
| $10,000 to $24,999 | 167 (11.6%) | 18 (1.2%) |
| $25,000 to $34,999 | 170 (11.8%) | 35 (2.4%) |
| $35,000 to $49,999 | 158 (10.9%) | 41 (2.8%) |
| $50,000 to $74,999 | 263 (18.2%) | 155 (10.6%) |
| $75,000 to $99,999 | 135 (9.3%) | 242 (16.6%) |
| $100,000 to $149,999 | 228 (15.8%) | 289 (19.8%) |
| $150,000 or more | 225 (15.6%) | 449 (30.8%) |
| Total | 1,444 (100.0%) | 1,458 (100.0%) |
Property Value to Household Income Ratio in McLean County
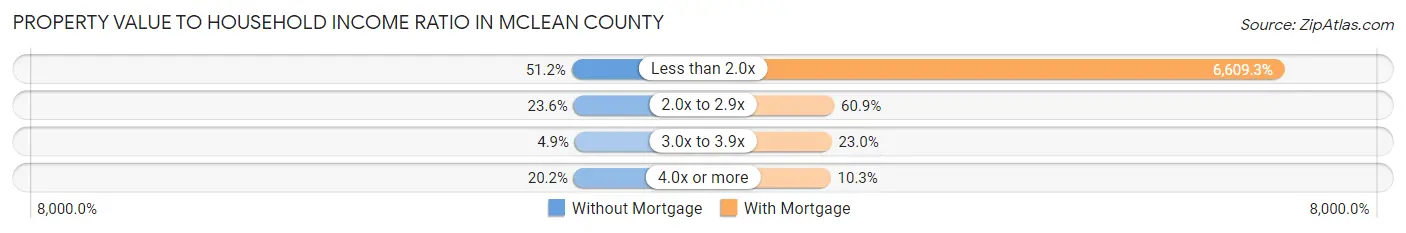
| Value-to-Income Ratio | Without Mortgage | With Mortgage |
| Less than 2.0x | 739 (51.2%) | 96,364 (6,609.3%) |
| 2.0x to 2.9x | 341 (23.6%) | 888 (60.9%) |
| 3.0x to 3.9x | 70 (4.9%) | 335 (23.0%) |
| 4.0x or more | 292 (20.2%) | 150 (10.3%) |
| Total | 1,444 (100.0%) | 1,458 (100.0%) |
Real Estate Taxes by Mortgage Status in McLean County
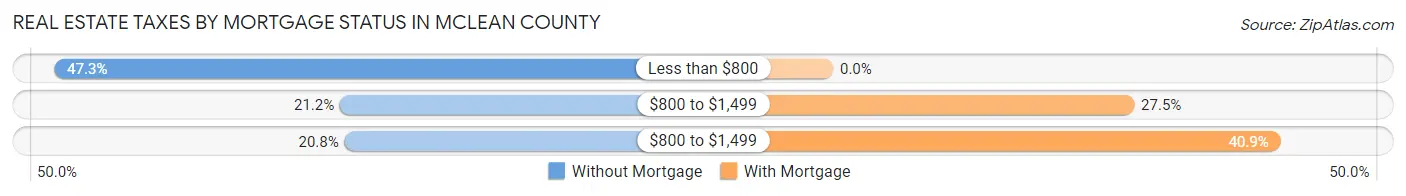
| Property Taxes | Without Mortgage | With Mortgage |
| Less than $800 | 683 (47.3%) | 0 (0.0%) |
| $800 to $1,499 | 306 (21.2%) | 401 (27.5%) |
| $800 to $1,499 | 300 (20.8%) | 596 (40.9%) |
| Total | 1,444 (100.0%) | 1,458 (100.0%) |
Health & Disability in McLean County
Health Insurance Coverage by Age in McLean County
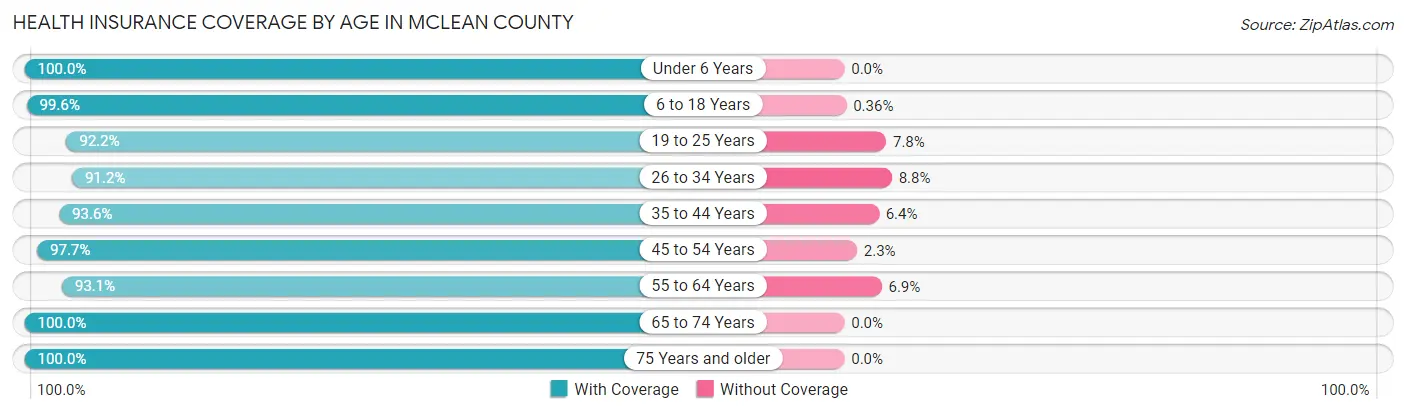
| Age Bracket | With Coverage | Without Coverage |
| Under 6 Years | 593 (100.0%) | 0 (0.0%) |
| 6 to 18 Years | 1,674 (99.6%) | 6 (0.4%) |
| 19 to 25 Years | 510 (92.2%) | 43 (7.8%) |
| 26 to 34 Years | 856 (91.2%) | 83 (8.8%) |
| 35 to 44 Years | 1,005 (93.6%) | 69 (6.4%) |
| 45 to 54 Years | 1,168 (97.7%) | 28 (2.3%) |
| 55 to 64 Years | 1,233 (93.1%) | 92 (6.9%) |
| 65 to 74 Years | 1,022 (100.0%) | 0 (0.0%) |
| 75 Years and older | 718 (100.0%) | 0 (0.0%) |
| Total | 8,779 (96.5%) | 321 (3.5%) |
Health Insurance Coverage by Citizenship Status in McLean County
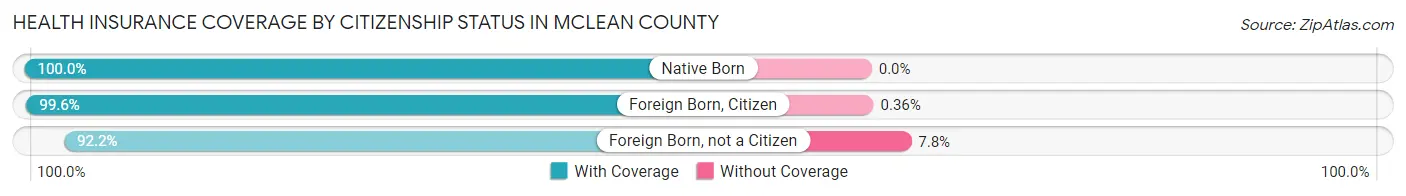
| Citizenship Status | With Coverage | Without Coverage |
| Native Born | 593 (100.0%) | 0 (0.0%) |
| Foreign Born, Citizen | 1,674 (99.6%) | 6 (0.4%) |
| Foreign Born, not a Citizen | 510 (92.2%) | 43 (7.8%) |
Health Insurance Coverage by Household Income in McLean County
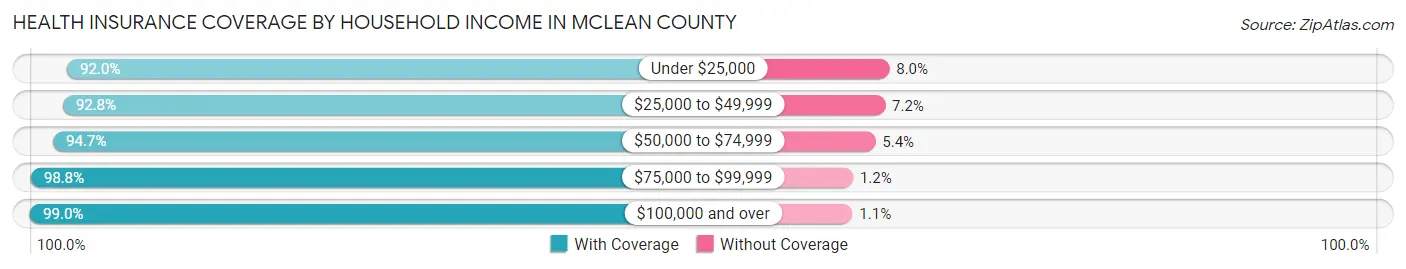
| Household Income | With Coverage | Without Coverage |
| Under $25,000 | 832 (92.0%) | 72 (8.0%) |
| $25,000 to $49,999 | 1,437 (92.8%) | 111 (7.2%) |
| $50,000 to $74,999 | 1,468 (94.7%) | 83 (5.3%) |
| $75,000 to $99,999 | 1,361 (98.8%) | 16 (1.2%) |
| $100,000 and over | 3,663 (99.0%) | 39 (1.1%) |
Public vs Private Health Insurance Coverage by Age in McLean County
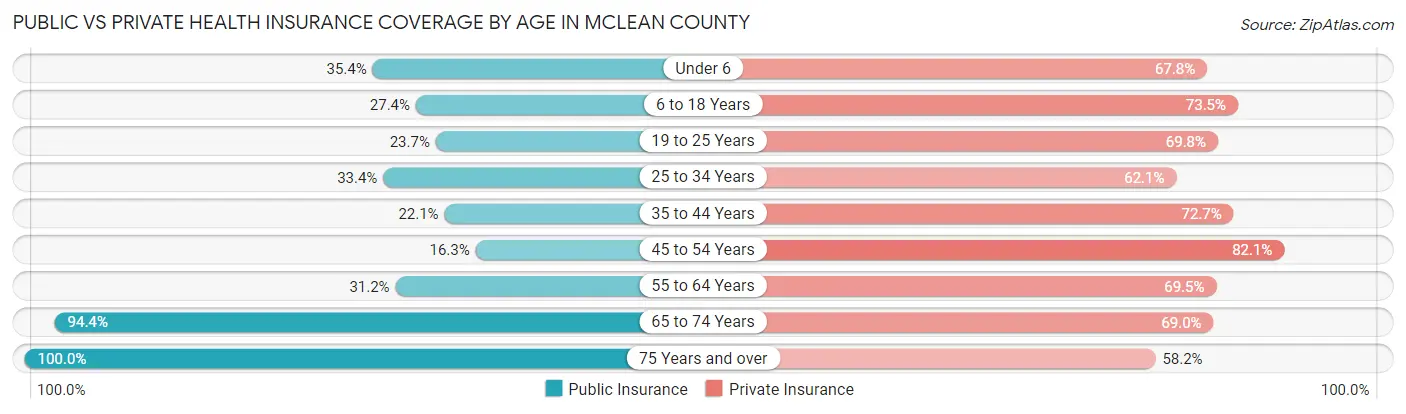
| Age Bracket | Public Insurance | Private Insurance |
| Under 6 | 210 (35.4%) | 402 (67.8%) |
| 6 to 18 Years | 460 (27.4%) | 1,235 (73.5%) |
| 19 to 25 Years | 131 (23.7%) | 386 (69.8%) |
| 25 to 34 Years | 314 (33.4%) | 583 (62.1%) |
| 35 to 44 Years | 237 (22.1%) | 781 (72.7%) |
| 45 to 54 Years | 195 (16.3%) | 982 (82.1%) |
| 55 to 64 Years | 413 (31.2%) | 921 (69.5%) |
| 65 to 74 Years | 965 (94.4%) | 705 (69.0%) |
| 75 Years and over | 718 (100.0%) | 418 (58.2%) |
| Total | 3,643 (40.0%) | 6,413 (70.5%) |
Disability Status by Sex by Age in McLean County
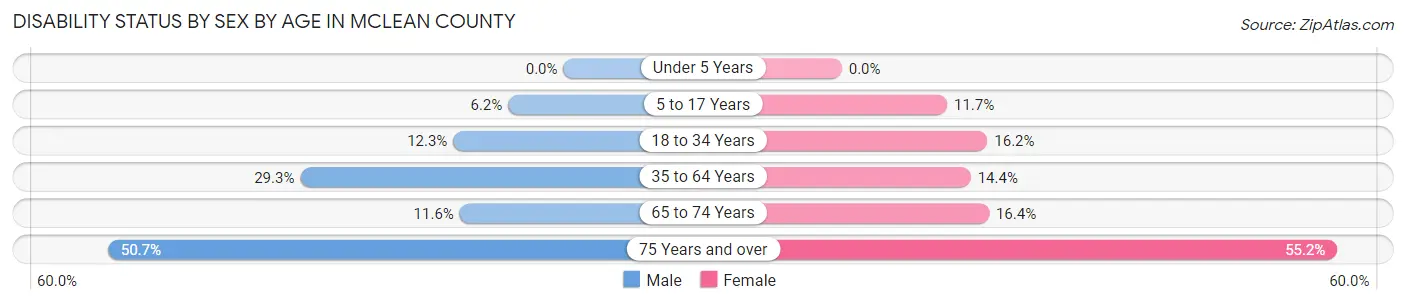
| Age Bracket | Male | Female |
| Under 5 Years | 0 (0.0%) | 0 (0.0%) |
| 5 to 17 Years | 54 (6.1%) | 92 (11.7%) |
| 18 to 34 Years | 100 (12.3%) | 129 (16.2%) |
| 35 to 64 Years | 535 (29.3%) | 254 (14.4%) |
| 65 to 74 Years | 56 (11.6%) | 88 (16.4%) |
| 75 Years and over | 173 (50.7%) | 208 (55.2%) |
Disability Class by Sex by Age in McLean County
Disability Class: Hearing Difficulty
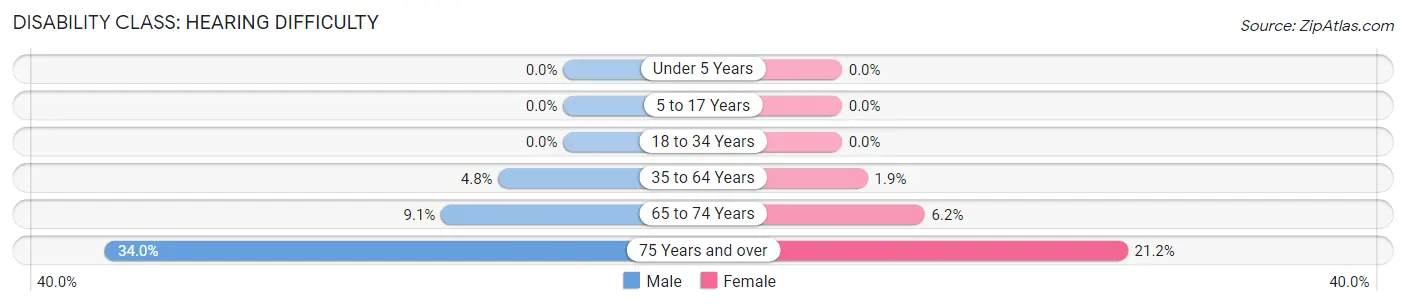
| Age Bracket | Male | Female |
| Under 5 Years | 0 (0.0%) | 0 (0.0%) |
| 5 to 17 Years | 0 (0.0%) | 0 (0.0%) |
| 18 to 34 Years | 0 (0.0%) | 0 (0.0%) |
| 35 to 64 Years | 88 (4.8%) | 34 (1.9%) |
| 65 to 74 Years | 44 (9.1%) | 33 (6.1%) |
| 75 Years and over | 116 (34.0%) | 80 (21.2%) |
Disability Class: Vision Difficulty
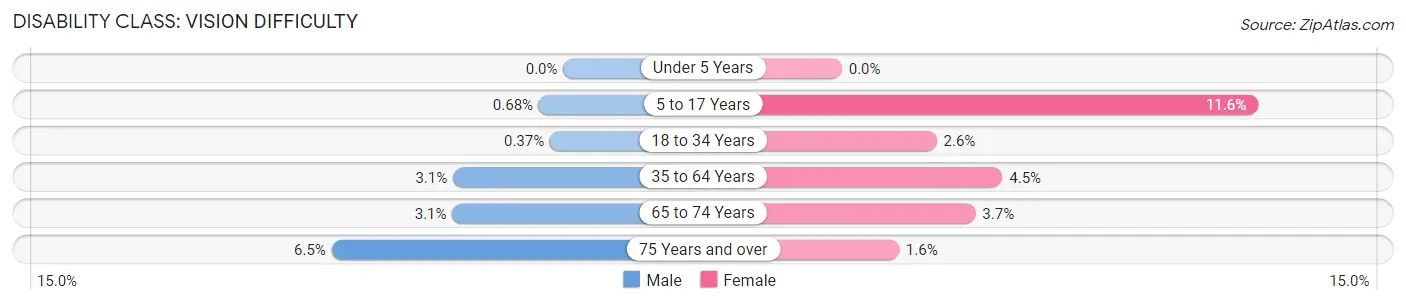
| Age Bracket | Male | Female |
| Under 5 Years | 0 (0.0%) | 0 (0.0%) |
| 5 to 17 Years | 6 (0.7%) | 91 (11.6%) |
| 18 to 34 Years | 3 (0.4%) | 21 (2.6%) |
| 35 to 64 Years | 56 (3.1%) | 79 (4.5%) |
| 65 to 74 Years | 15 (3.1%) | 20 (3.7%) |
| 75 Years and over | 22 (6.5%) | 6 (1.6%) |
Disability Class: Cognitive Difficulty
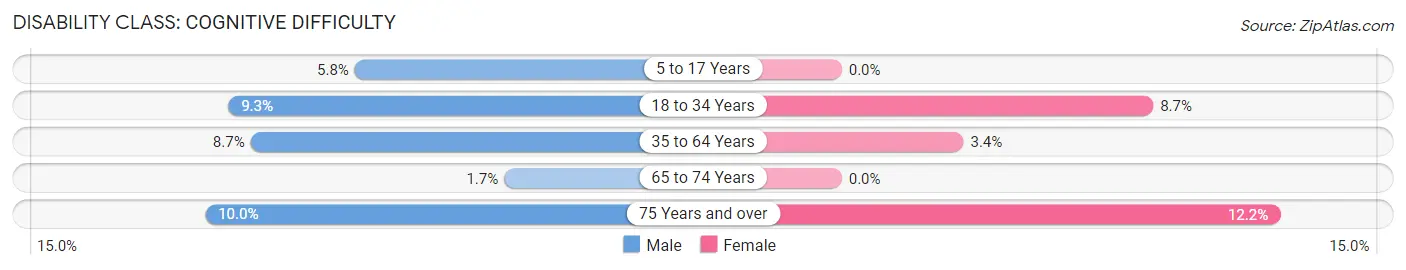
| Age Bracket | Male | Female |
| 5 to 17 Years | 51 (5.8%) | 0 (0.0%) |
| 18 to 34 Years | 76 (9.3%) | 69 (8.7%) |
| 35 to 64 Years | 159 (8.7%) | 60 (3.4%) |
| 65 to 74 Years | 8 (1.7%) | 0 (0.0%) |
| 75 Years and over | 34 (10.0%) | 46 (12.2%) |
Disability Class: Ambulatory Difficulty
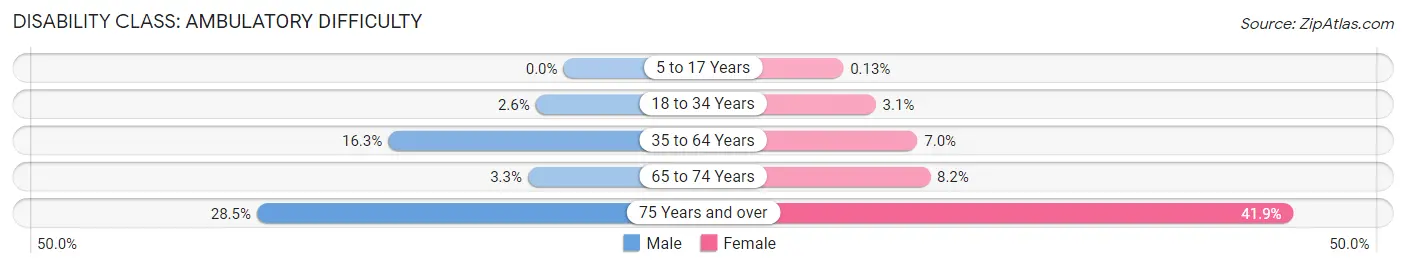
| Age Bracket | Male | Female |
| 5 to 17 Years | 0 (0.0%) | 1 (0.1%) |
| 18 to 34 Years | 21 (2.6%) | 25 (3.1%) |
| 35 to 64 Years | 297 (16.3%) | 124 (7.0%) |
| 65 to 74 Years | 16 (3.3%) | 44 (8.2%) |
| 75 Years and over | 97 (28.4%) | 158 (41.9%) |
Disability Class: Self-Care Difficulty
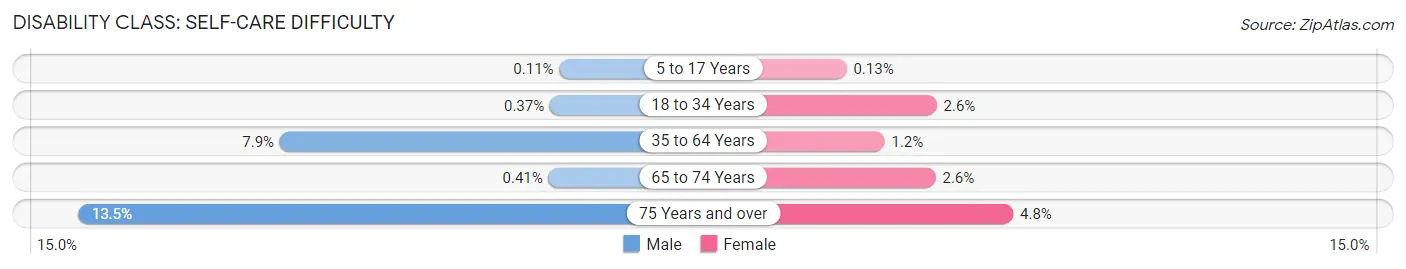
| Age Bracket | Male | Female |
| 5 to 17 Years | 1 (0.1%) | 1 (0.1%) |
| 18 to 34 Years | 3 (0.4%) | 21 (2.6%) |
| 35 to 64 Years | 144 (7.9%) | 21 (1.2%) |
| 65 to 74 Years | 2 (0.4%) | 14 (2.6%) |
| 75 Years and over | 46 (13.5%) | 18 (4.8%) |
Technology Access in McLean County
Computing Device Access in McLean County
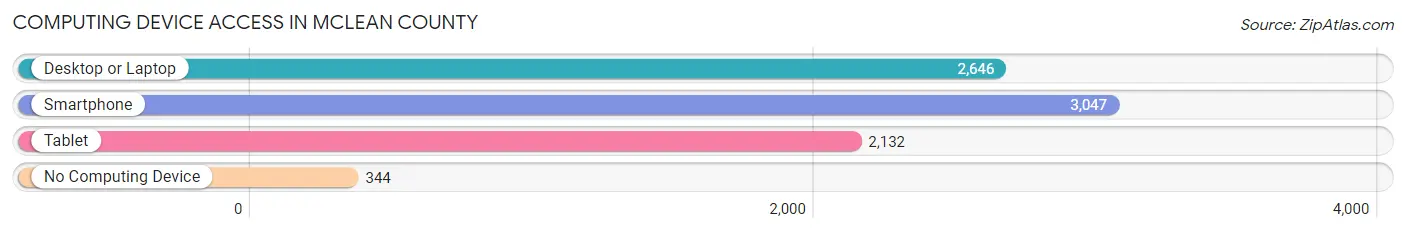
| Device Type | # Households | % Households |
| Desktop or Laptop | 2,646 | 73.3% |
| Smartphone | 3,047 | 84.4% |
| Tablet | 2,132 | 59.1% |
| No Computing Device | 344 | 9.5% |
| Total | 3,609 | 100.0% |
Internet Access in McLean County
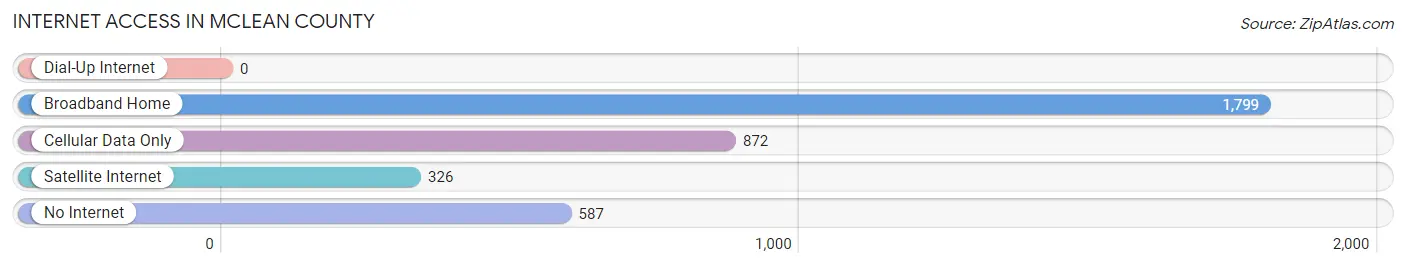
| Internet Type | # Households | % Households |
| Dial-Up Internet | 0 | 0.0% |
| Broadband Home | 1,799 | 49.8% |
| Cellular Data Only | 872 | 24.2% |
| Satellite Internet | 326 | 9.0% |
| No Internet | 587 | 16.3% |
| Total | 3,609 | 100.0% |
McLean County Summary
Mclean County is located in the western part of Kentucky, in the Jackson Purchase region. It is bordered by the Ohio River to the north, the Green River to the east, and the Tennessee River to the west. The county seat is Calhoun, and the county was formed in 1854 from parts of Daviess and Ohio counties.
Geography
Mclean County covers an area of 441 square miles, of which 437 square miles is land and 4 square miles is water. The terrain is mostly flat, with some rolling hills in the northern part of the county. The highest point in the county is located in the northern part, at an elevation of 590 feet. The county is drained by the Green River, which forms its eastern boundary.
The county is home to several state parks, including the Green River Lake State Park, which offers camping, fishing, and boating. Other attractions in the county include the Mclean County Museum of History, the Mclean County Arts Center, and the Mclean County Historical Society.
Demographics
As of the 2010 census, there were 9,521 people, 3,845 households, and 2,717 families living in the county. The population density was 21.6 people per square mile. The racial makeup of the county was 95.3% White, 2.2% African American, 0.3% Native American, 0.2% Asian, 0.1% Pacific Islander, 0.7% from other races, and 1.3% from two or more races. Hispanic or Latino of any race were 1.7% of the population.
The median income for a household in the county was $35,945, and the median income for a family was $44,945. The per capita income for the county was $17,945. About 15.2% of families and 19.2% of the population were below the poverty line, including 25.2% of those under age 18 and 16.2% of those age 65 or over.
Economy
The economy of Mclean County is largely based on agriculture. The county is home to several large farms, and the main crops grown are corn, soybeans, wheat, and hay. The county also has a large livestock industry, with cattle, hogs, and poultry being the main animals raised.
The county is also home to several manufacturing companies, including a paper mill, a furniture factory, and a plastics plant. The county also has a large tourism industry, with several state parks and other attractions drawing visitors from around the region.
Conclusion
Mclean County is a rural county located in western Kentucky. It is home to several state parks and other attractions, and its economy is largely based on agriculture and manufacturing. The county has a diverse population, with a median income of $35,945 and a poverty rate of 15.2%.
Common Questions
What is Per Capita Income in McLean County?
Per Capita income in McLean County is $32,382.
What is the Median Family Income in McLean County?
Median Family Income in McLean County is $85,669.
What is the Median Household income in McLean County?
Median Household Income in McLean County is $64,020.
What is Income or Wage Gap in McLean County?
Income or Wage Gap in McLean County is 35.8%.
Women in McLean County earn 64.2 cents for every dollar earned by a man.
What is Family Income Deficit in McLean County?
Family Income Deficit in McLean County is $14,909.
Families that are below poverty line in McLean County earn $14,909 less on average than the poverty threshold level.
What is Inequality or Gini Index in McLean County?
Inequality or Gini Index in McLean County is 0.43.
What is the Total Population of McLean County?
Total Population of McLean County is 9,173.
What is the Total Male Population of McLean County?
Total Male Population of McLean County is 4,604.
What is the Total Female Population of McLean County?
Total Female Population of McLean County is 4,569.
What is the Ratio of Males per 100 Females in McLean County?
There are 100.77 Males per 100 Females in McLean County.
What is the Ratio of Females per 100 Males in McLean County?
There are 99.24 Females per 100 Males in McLean County.
What is the Median Population Age in McLean County?
Median Population Age in McLean County is 43.2 Years.
What is the Average Family Size in McLean County
Average Family Size in McLean County is 3.0 People.
What is the Average Household Size in McLean County
Average Household Size in McLean County is 2.5 People.
How Large is the Labor Force in McLean County?
There are 4,053 People in the Labor Forcein in McLean County.
What is the Percentage of People in the Labor Force in McLean County?
55.3% of People are in the Labor Force in McLean County.
What is the Unemployment Rate in McLean County?
Unemployment Rate in McLean County is 6.7%.