Mason County, KY Map & Demographics
Mason County Map
Mason County Overview
$33,842
PER CAPITA INCOME
$64,817
AVG FAMILY INCOME
$48,460
AVG HOUSEHOLD INCOME
25.1%
WAGE / INCOME GAP [ % ]
74.9¢/ $1
WAGE / INCOME GAP [ $ ]
$10,352
FAMILY INCOME DEFICIT
0.54
INEQUALITY / GINI INDEX
17,068
TOTAL POPULATION
8,367
MALE POPULATION
8,701
FEMALE POPULATION
96.16
MALES / 100 FEMALES
103.99
FEMALES / 100 MALES
42.1
MEDIAN AGE
3.1
AVG FAMILY SIZE
2.5
AVG HOUSEHOLD SIZE
7,646
LABOR FORCE [ PEOPLE ]
56.5%
PERCENT IN LABOR FORCE
4.7%
UNEMPLOYMENT RATE
Mason County Area Codes
Income in Mason County
Income Overview in Mason County
Per Capita Income in Mason County is $33,842, while median incomes of families and households are $64,817 and $48,460 respectively.
| Characteristic | Number | Measure |
| Per Capita Income | 17,068 | $33,842 |
| Median Family Income | 4,400 | $64,817 |
| Mean Family Income | 4,400 | $98,729 |
| Median Household Income | 6,695 | $48,460 |
| Mean Household Income | 6,695 | $81,916 |
| Income Deficit | 4,400 | $10,352 |
| Wage / Income Gap (%) | 17,068 | 25.05% |
| Wage / Income Gap ($) | 17,068 | 74.95¢ per $1 |
| Gini / Inequality Index | 17,068 | 0.54 |
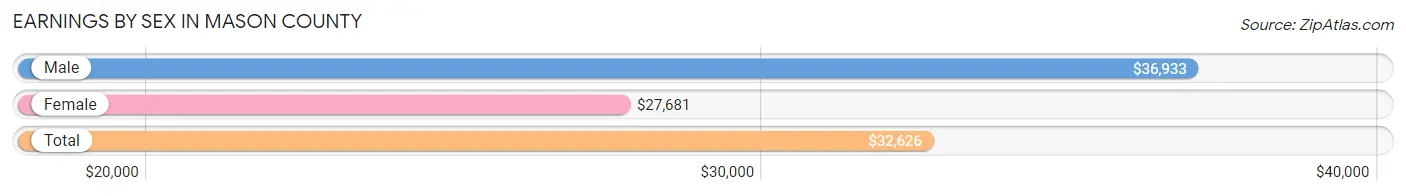
Earnings by Sex in Mason County
Average Earnings in Mason County are $32,626, $36,933 for men and $27,681 for women, a difference of 25.1%.
| Sex | Number | Average Earnings |
| Male | 4,312 (53.8%) | $36,933 |
| Female | 3,699 (46.2%) | $27,681 |
| Total | 8,011 (100.0%) | $32,626 |
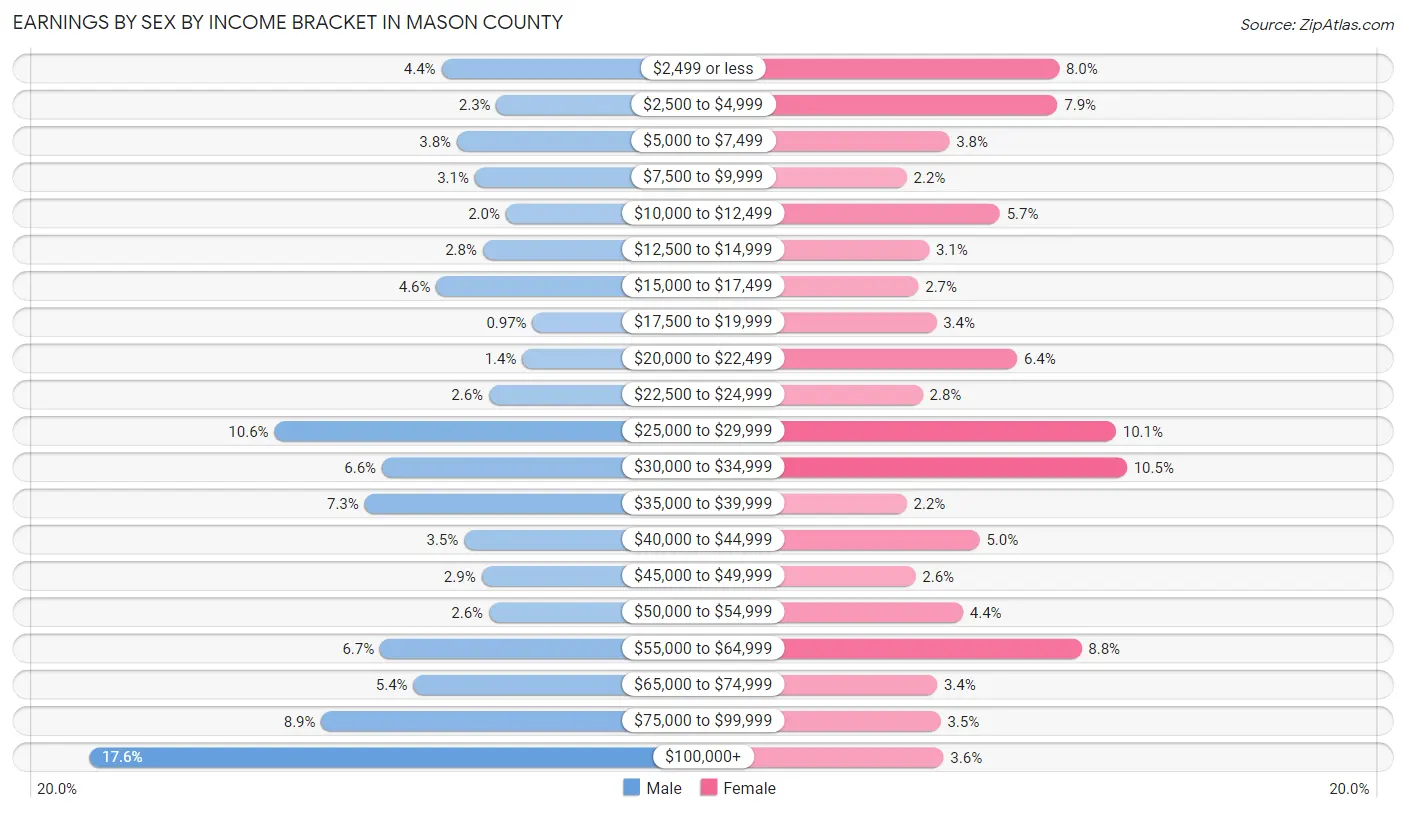
Earnings by Sex by Income Bracket in Mason County
The most common earnings brackets in Mason County are $100,000+ for men (758 | 17.6%) and $30,000 to $34,999 for women (388 | 10.5%).
| Income | Male | Female |
| $2,499 or less | 189 (4.4%) | 294 (8.0%) |
| $2,500 to $4,999 | 100 (2.3%) | 292 (7.9%) |
| $5,000 to $7,499 | 164 (3.8%) | 142 (3.8%) |
| $7,500 to $9,999 | 135 (3.1%) | 83 (2.2%) |
| $10,000 to $12,499 | 85 (2.0%) | 212 (5.7%) |
| $12,500 to $14,999 | 122 (2.8%) | 114 (3.1%) |
| $15,000 to $17,499 | 197 (4.6%) | 99 (2.7%) |
| $17,500 to $19,999 | 42 (1.0%) | 124 (3.4%) |
| $20,000 to $22,499 | 58 (1.3%) | 236 (6.4%) |
| $22,500 to $24,999 | 112 (2.6%) | 105 (2.8%) |
| $25,000 to $29,999 | 459 (10.6%) | 373 (10.1%) |
| $30,000 to $34,999 | 285 (6.6%) | 388 (10.5%) |
| $35,000 to $39,999 | 313 (7.3%) | 83 (2.2%) |
| $40,000 to $44,999 | 152 (3.5%) | 184 (5.0%) |
| $45,000 to $49,999 | 124 (2.9%) | 95 (2.6%) |
| $50,000 to $54,999 | 112 (2.6%) | 161 (4.3%) |
| $55,000 to $64,999 | 288 (6.7%) | 325 (8.8%) |
| $65,000 to $74,999 | 234 (5.4%) | 125 (3.4%) |
| $75,000 to $99,999 | 383 (8.9%) | 130 (3.5%) |
| $100,000+ | 758 (17.6%) | 134 (3.6%) |
| Total | 4,312 (100.0%) | 3,699 (100.0%) |
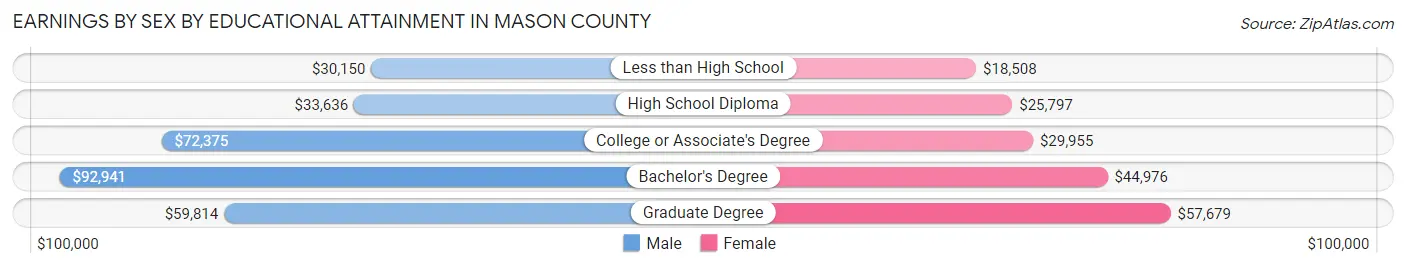
Earnings by Sex by Educational Attainment in Mason County
Average earnings in Mason County are $46,813 for men and $30,537 for women, a difference of 34.8%. Men with an educational attainment of bachelor's degree enjoy the highest average annual earnings of $92,941, while those with less than high school education earn the least with $30,150. Women with an educational attainment of graduate degree earn the most with the average annual earnings of $57,679, while those with less than high school education have the smallest earnings of $18,508.
| Educational Attainment | Male Income | Female Income |
| Less than High School | $30,150 | $18,508 |
| High School Diploma | $33,636 | $25,797 |
| College or Associate's Degree | $72,375 | $29,955 |
| Bachelor's Degree | $92,941 | $44,976 |
| Graduate Degree | $59,814 | $57,679 |
| Total | $46,813 | $30,537 |
Family Income in Mason County
Family Income Brackets in Mason County
According to the Mason County family income data, there are 832 families falling into the $100,000 to $149,999 income range, which is the most common income bracket and makes up 18.9% of all families. Conversely, the $10,000 to $14,999 income bracket is the least frequent group with only 163 families (3.7%) belonging to this category.
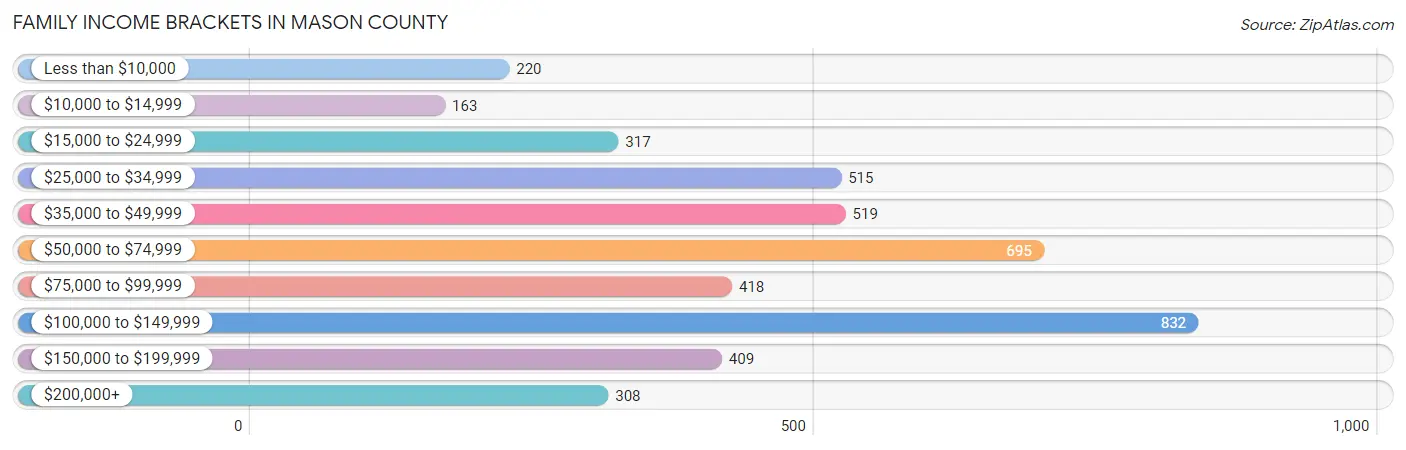
| Income Bracket | # Families | % Families |
| Less than $10,000 | 220 | 5.0% |
| $10,000 to $14,999 | 163 | 3.7% |
| $15,000 to $24,999 | 317 | 7.2% |
| $25,000 to $34,999 | 515 | 11.7% |
| $35,000 to $49,999 | 519 | 11.8% |
| $50,000 to $74,999 | 695 | 15.8% |
| $75,000 to $99,999 | 418 | 9.5% |
| $100,000 to $149,999 | 832 | 18.9% |
| $150,000 to $199,999 | 409 | 9.3% |
| $200,000+ | 308 | 7.0% |
Family Income by Famaliy Size in Mason County
7+ person families (127 | 2.9%) account for the highest median family income in Mason County with $163,281 per family, while 2-person families (2,516 | 57.2%) have the highest median income of $30,390 per family member.
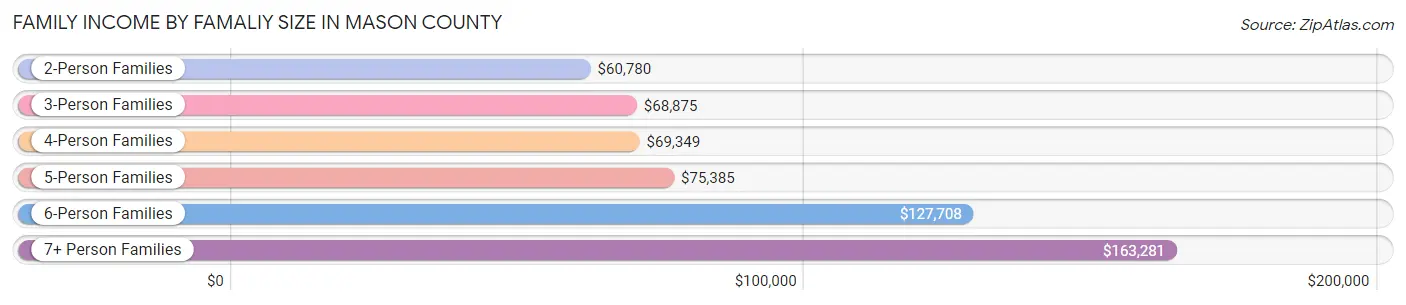
| Income Bracket | # Families | Median Income |
| 2-Person Families | 2,516 (57.2%) | $60,780 |
| 3-Person Families | 869 (19.8%) | $68,875 |
| 4-Person Families | 583 (13.3%) | $69,349 |
| 5-Person Families | 254 (5.8%) | $75,385 |
| 6-Person Families | 51 (1.2%) | $127,708 |
| 7+ Person Families | 127 (2.9%) | $163,281 |
| Total | 4,400 (100.0%) | $64,817 |
Family Income by Number of Earners in Mason County
The median family income in Mason County is $64,817, with families comprising 3+ earners (433) having the highest median family income of $136,406, while families with no earners (877) have the lowest median family income of $30,766, accounting for 9.8% and 19.9% of families, respectively.
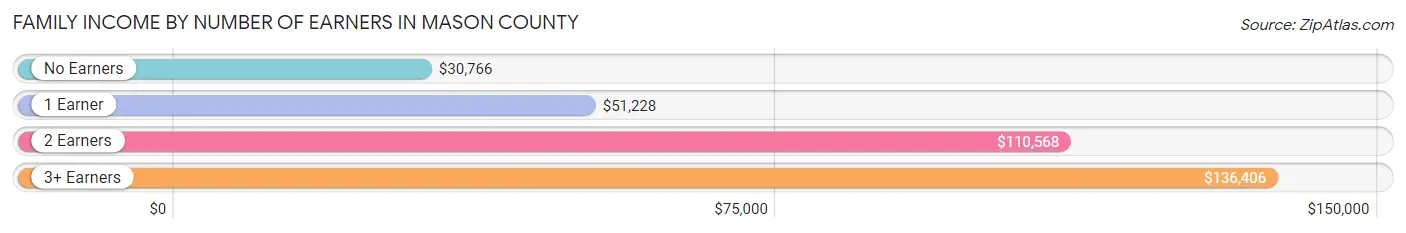
| Number of Earners | # Families | Median Income |
| No Earners | 877 (19.9%) | $30,766 |
| 1 Earner | 1,699 (38.6%) | $51,228 |
| 2 Earners | 1,391 (31.6%) | $110,568 |
| 3+ Earners | 433 (9.8%) | $136,406 |
| Total | 4,400 (100.0%) | $64,817 |
Household Income in Mason County
Household Income Brackets in Mason County
With 977 households falling in the category, the $35,000 to $49,999 income range is the most frequent in Mason County, accounting for 14.6% of all households. In contrast, only 341 households (5.1%) fall into the $200,000+ income bracket, making it the least populous group.
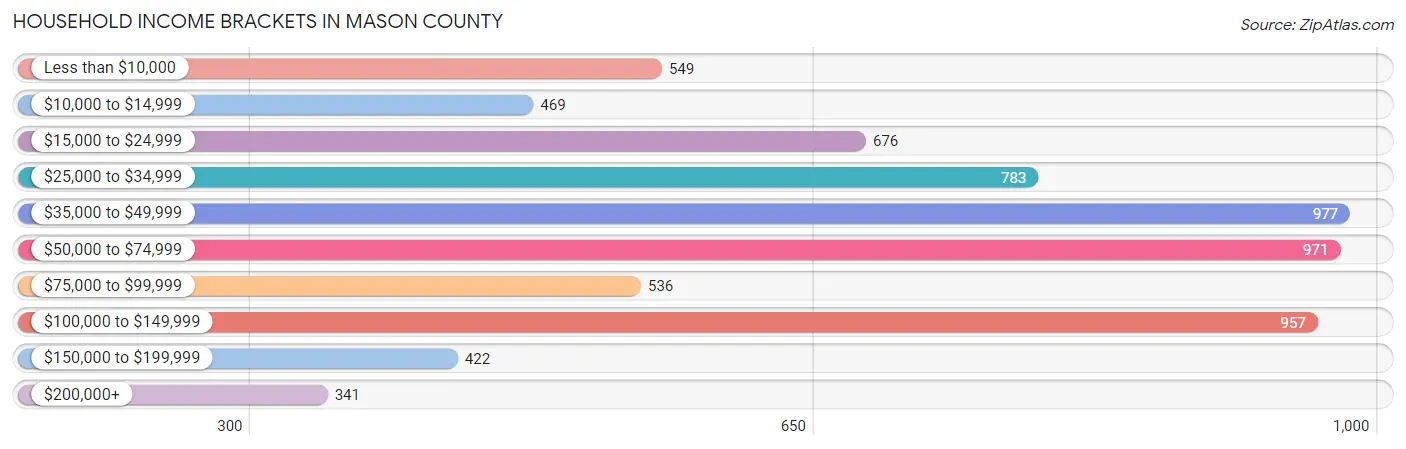
| Income Bracket | # Households | % Households |
| Less than $10,000 | 549 | 8.2% |
| $10,000 to $14,999 | 469 | 7.0% |
| $15,000 to $24,999 | 676 | 10.1% |
| $25,000 to $34,999 | 783 | 11.7% |
| $35,000 to $49,999 | 977 | 14.6% |
| $50,000 to $74,999 | 971 | 14.5% |
| $75,000 to $99,999 | 536 | 8.0% |
| $100,000 to $149,999 | 957 | 14.3% |
| $150,000 to $199,999 | 422 | 6.3% |
| $200,000+ | 341 | 5.1% |
Household Income by Householder Age in Mason County
The median household income in Mason County is $48,460, with the highest median household income of $63,598 found in the 45 to 64 years age bracket for the primary householder. A total of 2,547 households (38.0%) fall into this category. Meanwhile, the 15 to 24 years age bracket for the primary householder has the lowest median household income of $25,357, with 230 households (3.4%) in this group.
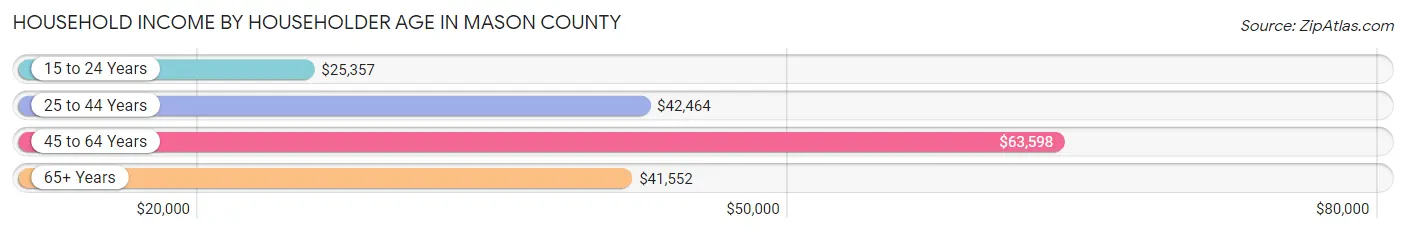
| Income Bracket | # Households | Median Income |
| 15 to 24 Years | 230 (3.4%) | $25,357 |
| 25 to 44 Years | 1,804 (27.0%) | $42,464 |
| 45 to 64 Years | 2,547 (38.0%) | $63,598 |
| 65+ Years | 2,114 (31.6%) | $41,552 |
| Total | 6,695 (100.0%) | $48,460 |
Poverty in Mason County
Income Below Poverty by Sex and Age in Mason County
With 14.2% poverty level for males and 23.1% for females among the residents of Mason County, 6 to 11 year old males and under 5 year old females are the most vulnerable to poverty, with 233 males (31.9%) and 280 females (50.1%) in their respective age groups living below the poverty level.
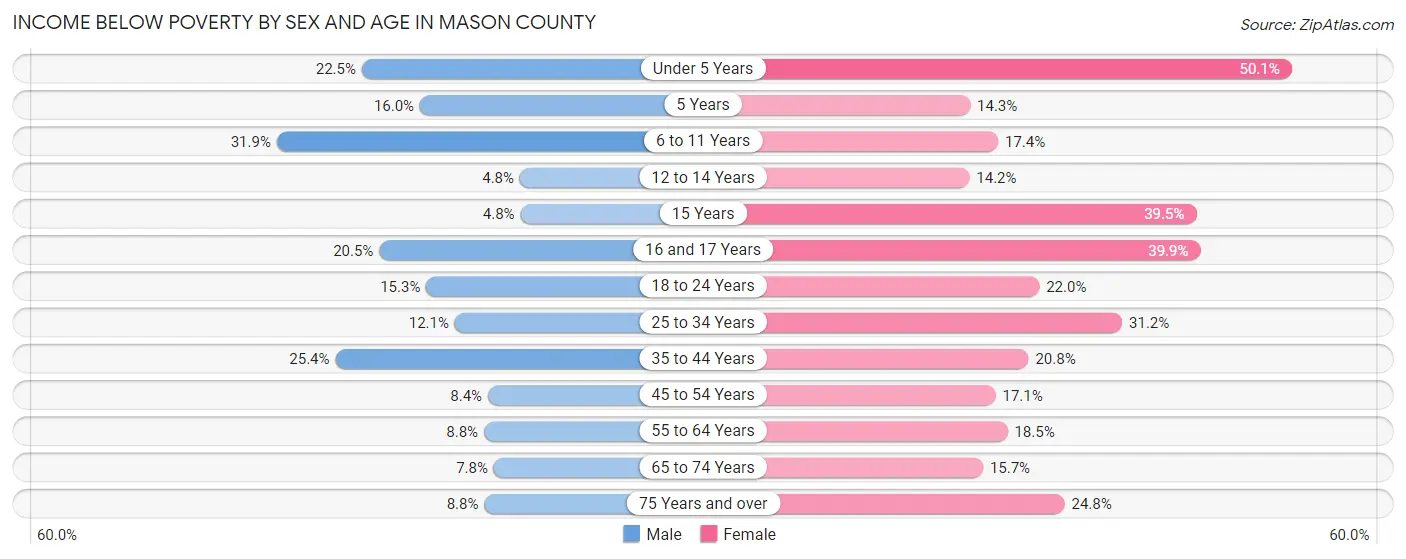
| Age Bracket | Male | Female |
| Under 5 Years | 97 (22.5%) | 280 (50.1%) |
| 5 Years | 23 (16.0%) | 6 (14.3%) |
| 6 to 11 Years | 233 (31.9%) | 107 (17.4%) |
| 12 to 14 Years | 14 (4.8%) | 52 (14.2%) |
| 15 Years | 10 (4.8%) | 45 (39.5%) |
| 16 and 17 Years | 24 (20.5%) | 97 (39.9%) |
| 18 to 24 Years | 109 (15.3%) | 124 (22.0%) |
| 25 to 34 Years | 110 (12.1%) | 295 (31.2%) |
| 35 to 44 Years | 230 (25.4%) | 233 (20.8%) |
| 45 to 54 Years | 93 (8.4%) | 187 (17.1%) |
| 55 to 64 Years | 103 (8.8%) | 231 (18.4%) |
| 65 to 74 Years | 80 (7.7%) | 160 (15.7%) |
| 75 Years and over | 38 (8.8%) | 161 (24.8%) |
| Total | 1,164 (14.2%) | 1,978 (23.1%) |
Income Above Poverty by Sex and Age in Mason County
According to the poverty statistics in Mason County, males aged 15 years and females aged 12 to 14 years are the age groups that are most secure financially, with 95.2% of males and 85.8% of females in these age groups living above the poverty line.
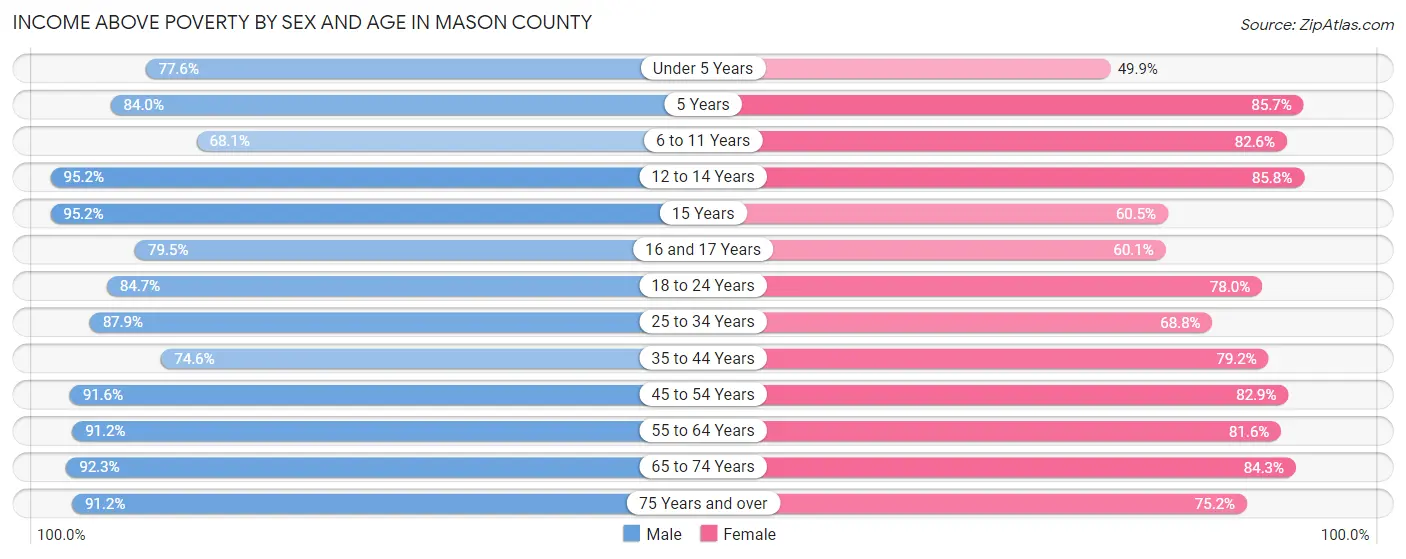
| Age Bracket | Male | Female |
| Under 5 Years | 335 (77.5%) | 279 (49.9%) |
| 5 Years | 121 (84.0%) | 36 (85.7%) |
| 6 to 11 Years | 497 (68.1%) | 508 (82.6%) |
| 12 to 14 Years | 275 (95.2%) | 314 (85.8%) |
| 15 Years | 199 (95.2%) | 69 (60.5%) |
| 16 and 17 Years | 93 (79.5%) | 146 (60.1%) |
| 18 to 24 Years | 605 (84.7%) | 440 (78.0%) |
| 25 to 34 Years | 800 (87.9%) | 650 (68.8%) |
| 35 to 44 Years | 676 (74.6%) | 888 (79.2%) |
| 45 to 54 Years | 1,014 (91.6%) | 905 (82.9%) |
| 55 to 64 Years | 1,062 (91.2%) | 1,021 (81.6%) |
| 65 to 74 Years | 952 (92.2%) | 858 (84.3%) |
| 75 Years and over | 394 (91.2%) | 488 (75.2%) |
| Total | 7,023 (85.8%) | 6,602 (76.9%) |
Income Below Poverty Among Married-Couple Families in Mason County
The poverty statistics for married-couple families in Mason County show that 7.9% or 247 of the total 3,120 families live below the poverty line. Families with 5 or more children have the highest poverty rate of 42.9%, comprising of 12 families. On the other hand, families with no children have the lowest poverty rate of 6.2%, which includes 129 families.
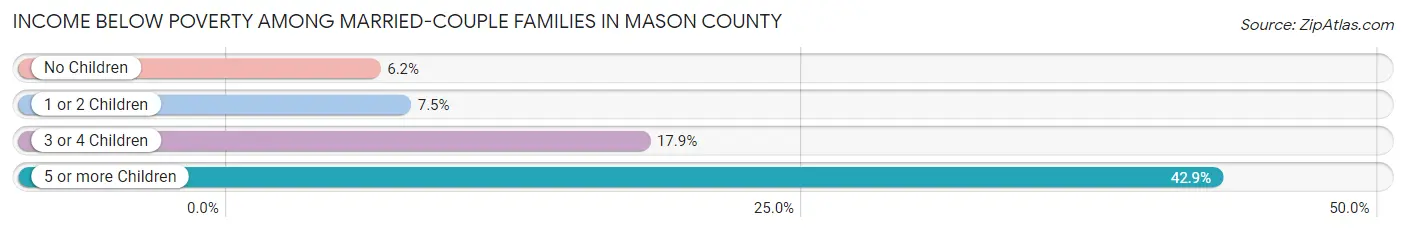
| Children | Above Poverty | Below Poverty |
| No Children | 1,955 (93.8%) | 129 (6.2%) |
| 1 or 2 Children | 664 (92.5%) | 54 (7.5%) |
| 3 or 4 Children | 238 (82.1%) | 52 (17.9%) |
| 5 or more Children | 16 (57.1%) | 12 (42.9%) |
| Total | 2,873 (92.1%) | 247 (7.9%) |
Income Below Poverty Among Single-Parent Households in Mason County
According to the poverty data in Mason County, 13.4% or 43 single-father households and 37.1% or 356 single-mother households are living below the poverty line. Among single-father households, those with 1 or 2 children have the highest poverty rate, with 28 households (18.3%) experiencing poverty. Likewise, among single-mother households, those with 5 or more children have the highest poverty rate, with 23 households (100.0%) falling below the poverty line.
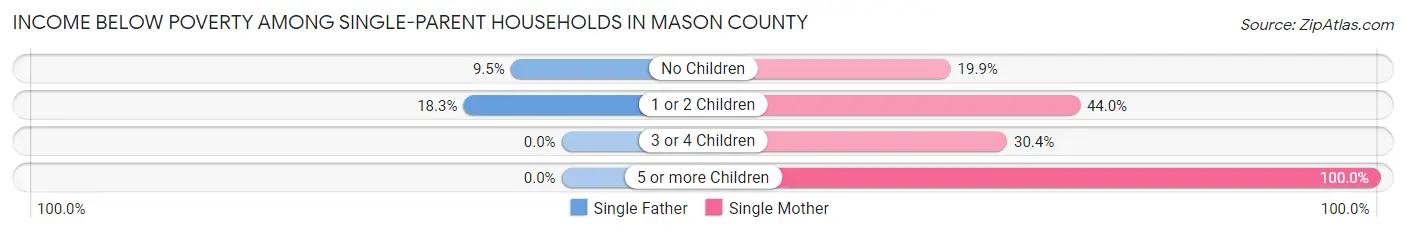
| Children | Single Father | Single Mother |
| No Children | 15 (9.5%) | 55 (19.9%) |
| 1 or 2 Children | 28 (18.3%) | 250 (44.0%) |
| 3 or 4 Children | 0 (0.0%) | 28 (30.4%) |
| 5 or more Children | 0 (0.0%) | 23 (100.0%) |
| Total | 43 (13.4%) | 356 (37.1%) |
Income Below Poverty Among Married-Couple vs Single-Parent Households in Mason County
The poverty data for Mason County shows that 247 of the married-couple family households (7.9%) and 399 of the single-parent households (31.2%) are living below the poverty level. Within the married-couple family households, those with 5 or more children have the highest poverty rate, with 12 households (42.9%) falling below the poverty line. Among the single-parent households, those with 5 or more children have the highest poverty rate, with 23 household (100.0%) living below poverty.
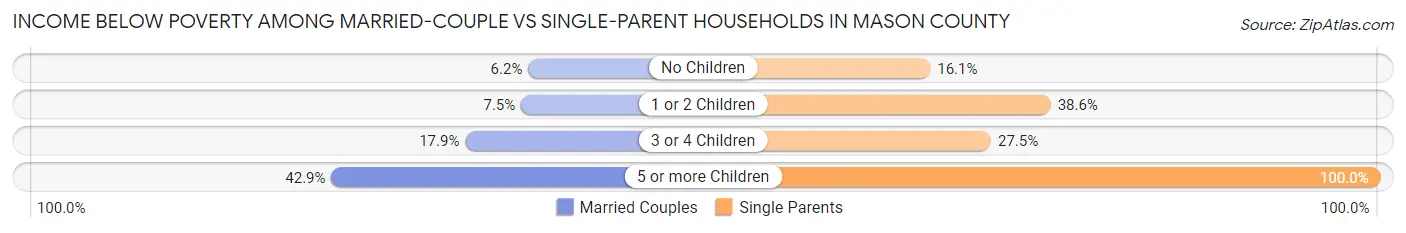
| Children | Married-Couple Families | Single-Parent Households |
| No Children | 129 (6.2%) | 70 (16.1%) |
| 1 or 2 Children | 54 (7.5%) | 278 (38.6%) |
| 3 or 4 Children | 52 (17.9%) | 28 (27.5%) |
| 5 or more Children | 12 (42.9%) | 23 (100.0%) |
| Total | 247 (7.9%) | 399 (31.2%) |
Race in Mason County
The most populous races in Mason County are White / Caucasian (15,028 | 88.0%), Black / African American (1,156 | 6.8%), and Two or more Races (591 | 3.5%).
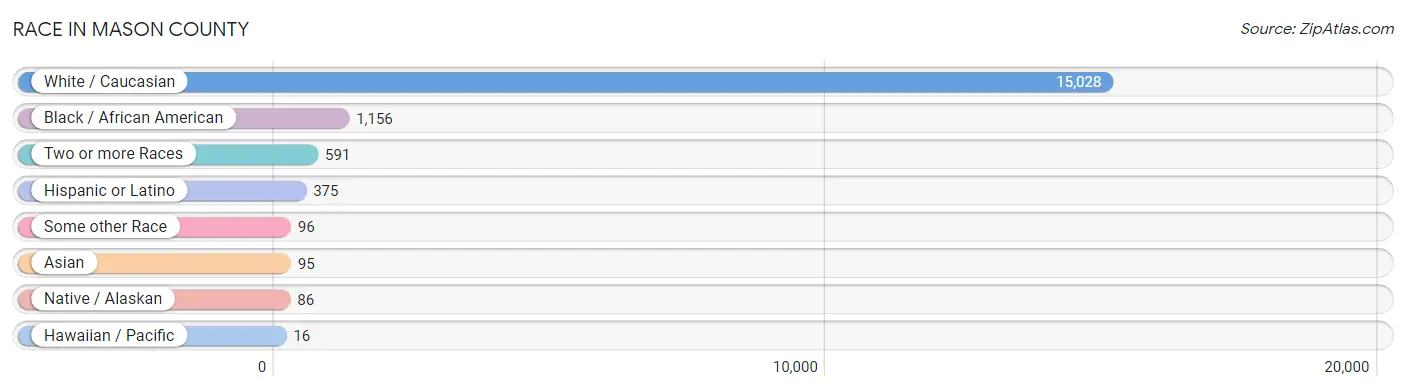
| Race | # Population | % Population |
| Asian | 95 | 0.6% |
| Black / African American | 1,156 | 6.8% |
| Hawaiian / Pacific | 16 | 0.1% |
| Hispanic or Latino | 375 | 2.2% |
| Native / Alaskan | 86 | 0.5% |
| White / Caucasian | 15,028 | 88.0% |
| Two or more Races | 591 | 3.5% |
| Some other Race | 96 | 0.6% |
| Total | 17,068 | 100.0% |
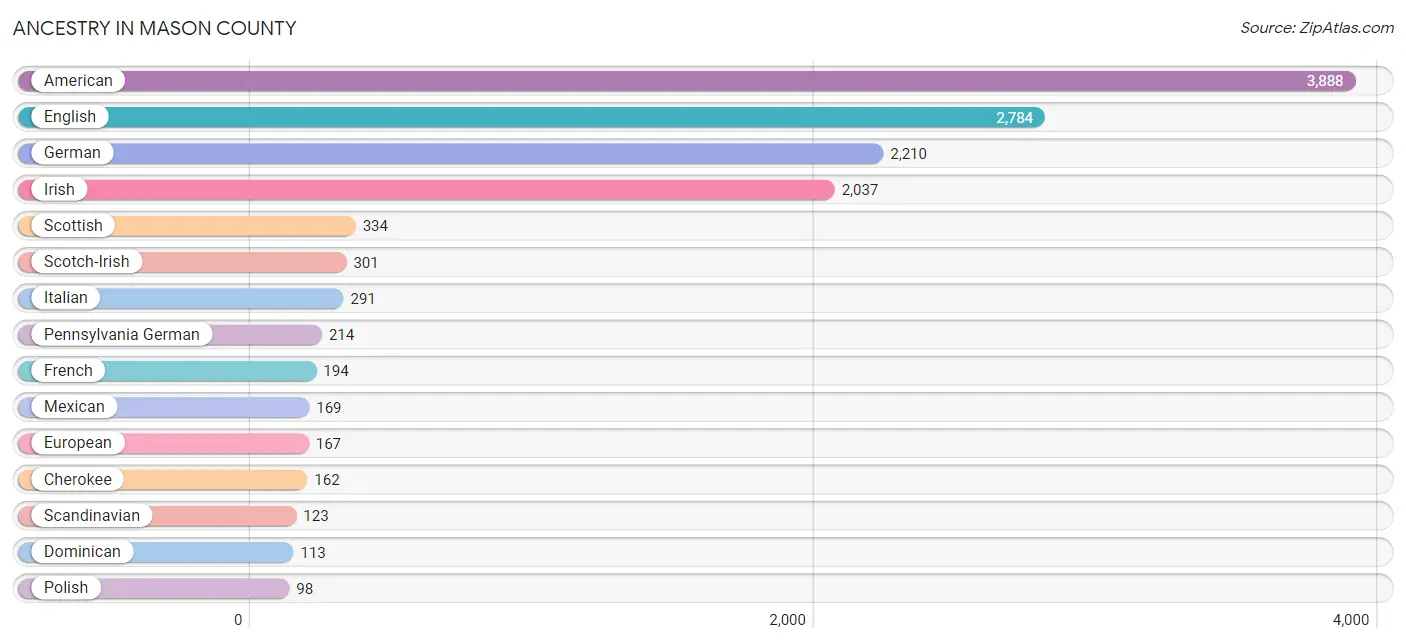
Ancestry in Mason County
The most populous ancestries reported in Mason County are American (3,888 | 22.8%), English (2,784 | 16.3%), German (2,210 | 13.0%), Irish (2,037 | 11.9%), and Scottish (334 | 2.0%), together accounting for 65.9% of all Mason County residents.
| Ancestry | # Population | % Population |
| American | 3,888 | 22.8% |
| Austrian | 3 | 0.0% |
| Bhutanese | 65 | 0.4% |
| Blackfeet | 42 | 0.3% |
| British | 22 | 0.1% |
| Burmese | 5 | 0.0% |
| Canadian | 11 | 0.1% |
| Central American | 24 | 0.1% |
| Cherokee | 162 | 0.9% |
| Choctaw | 35 | 0.2% |
| Czech | 9 | 0.1% |
| Dominican | 113 | 0.7% |
| Dutch | 90 | 0.5% |
| Eastern European | 24 | 0.1% |
| English | 2,784 | 16.3% |
| European | 167 | 1.0% |
| Fijian | 16 | 0.1% |
| French | 194 | 1.1% |
| French Canadian | 38 | 0.2% |
| German | 2,210 | 13.0% |
| Greek | 93 | 0.5% |
| Guatemalan | 24 | 0.1% |
| Hungarian | 11 | 0.1% |
| Indian (Asian) | 16 | 0.1% |
| Irish | 2,037 | 11.9% |
| Italian | 291 | 1.7% |
| Korean | 25 | 0.2% |
| Mexican | 169 | 1.0% |
| Norwegian | 23 | 0.1% |
| Pennsylvania German | 214 | 1.3% |
| Polish | 98 | 0.6% |
| Portuguese | 44 | 0.3% |
| Puerto Rican | 69 | 0.4% |
| Russian | 10 | 0.1% |
| Scandinavian | 123 | 0.7% |
| Scotch-Irish | 301 | 1.8% |
| Scottish | 334 | 2.0% |
| South African | 3 | 0.0% |
| Subsaharan African | 30 | 0.2% |
| Swedish | 15 | 0.1% |
| Swiss | 22 | 0.1% |
| Ugandan | 27 | 0.2% |
| Welsh | 33 | 0.2% | View All 43 Rows |
Immigrants in Mason County
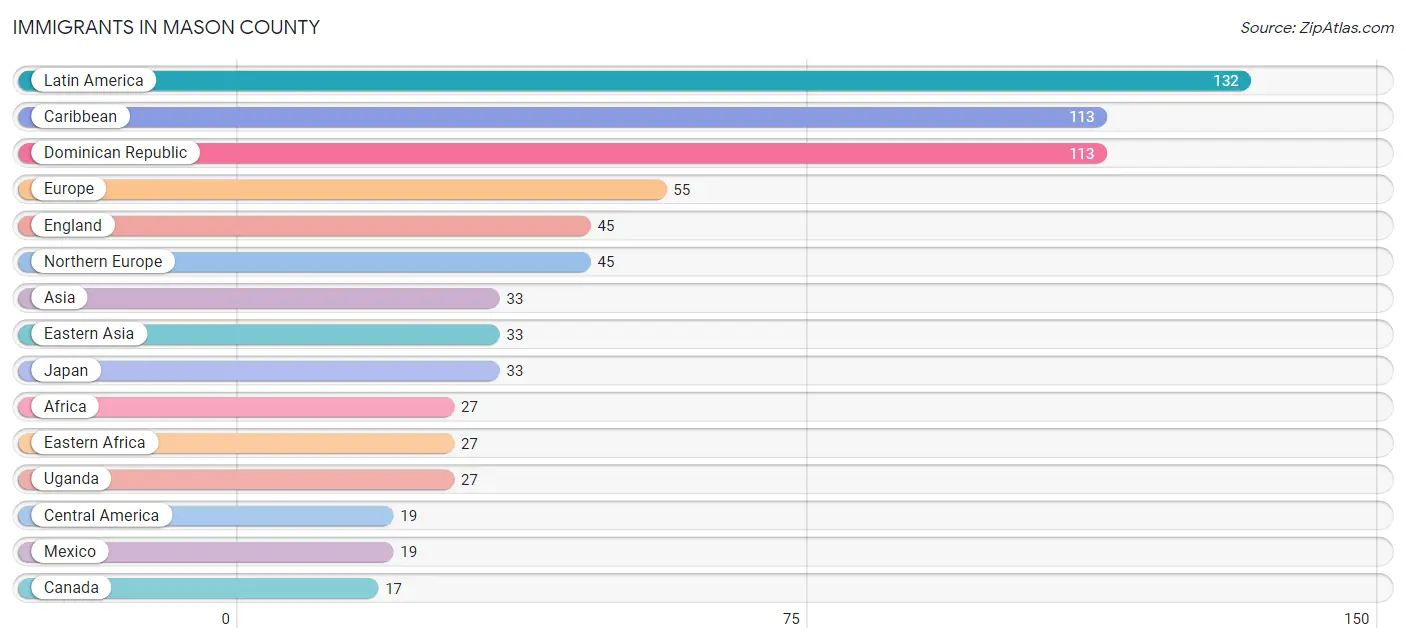
The most numerous immigrant groups reported in Mason County came from Latin America (132 | 0.8%), Caribbean (113 | 0.7%), Dominican Republic (113 | 0.7%), Europe (55 | 0.3%), and England (45 | 0.3%), together accounting for 2.7% of all Mason County residents.
| Immigration Origin | # Population | % Population |
| Africa | 27 | 0.2% |
| Asia | 33 | 0.2% |
| Canada | 17 | 0.1% |
| Caribbean | 113 | 0.7% |
| Central America | 19 | 0.1% |
| Dominican Republic | 113 | 0.7% |
| Eastern Africa | 27 | 0.2% |
| Eastern Asia | 33 | 0.2% |
| England | 45 | 0.3% |
| Europe | 55 | 0.3% |
| Japan | 33 | 0.2% |
| Latin America | 132 | 0.8% |
| Mexico | 19 | 0.1% |
| Northern Europe | 45 | 0.3% |
| Portugal | 10 | 0.1% |
| Southern Europe | 10 | 0.1% |
| Uganda | 27 | 0.2% | View All 17 Rows |
Sex and Age in Mason County
Sex and Age in Mason County
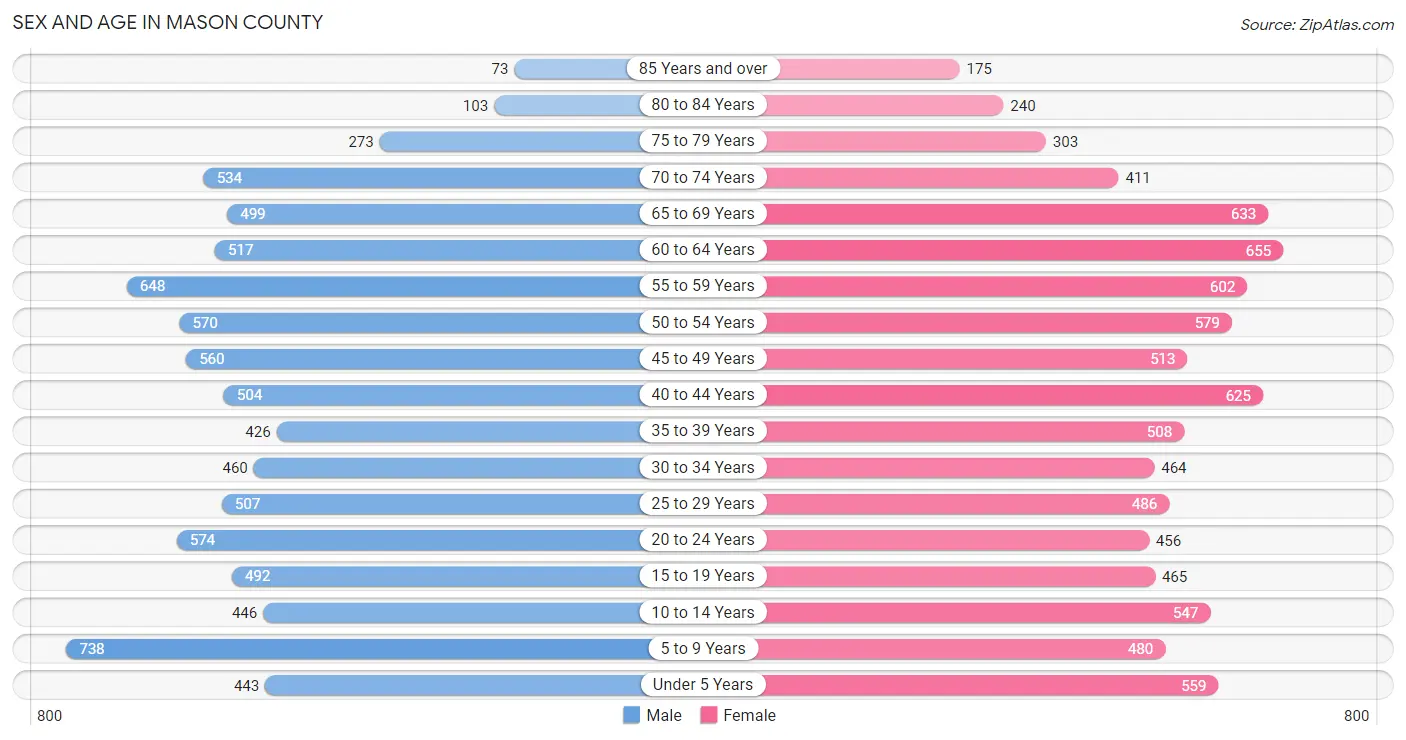
The most populous age groups in Mason County are 5 to 9 Years (738 | 8.8%) for men and 60 to 64 Years (655 | 7.5%) for women.
| Age Bracket | Male | Female |
| Under 5 Years | 443 (5.3%) | 559 (6.4%) |
| 5 to 9 Years | 738 (8.8%) | 480 (5.5%) |
| 10 to 14 Years | 446 (5.3%) | 547 (6.3%) |
| 15 to 19 Years | 492 (5.9%) | 465 (5.3%) |
| 20 to 24 Years | 574 (6.9%) | 456 (5.2%) |
| 25 to 29 Years | 507 (6.1%) | 486 (5.6%) |
| 30 to 34 Years | 460 (5.5%) | 464 (5.3%) |
| 35 to 39 Years | 426 (5.1%) | 508 (5.8%) |
| 40 to 44 Years | 504 (6.0%) | 625 (7.2%) |
| 45 to 49 Years | 560 (6.7%) | 513 (5.9%) |
| 50 to 54 Years | 570 (6.8%) | 579 (6.7%) |
| 55 to 59 Years | 648 (7.7%) | 602 (6.9%) |
| 60 to 64 Years | 517 (6.2%) | 655 (7.5%) |
| 65 to 69 Years | 499 (6.0%) | 633 (7.3%) |
| 70 to 74 Years | 534 (6.4%) | 411 (4.7%) |
| 75 to 79 Years | 273 (3.3%) | 303 (3.5%) |
| 80 to 84 Years | 103 (1.2%) | 240 (2.8%) |
| 85 Years and over | 73 (0.9%) | 175 (2.0%) |
| Total | 8,367 (100.0%) | 8,701 (100.0%) |
Families and Households in Mason County
Median Family Size in Mason County
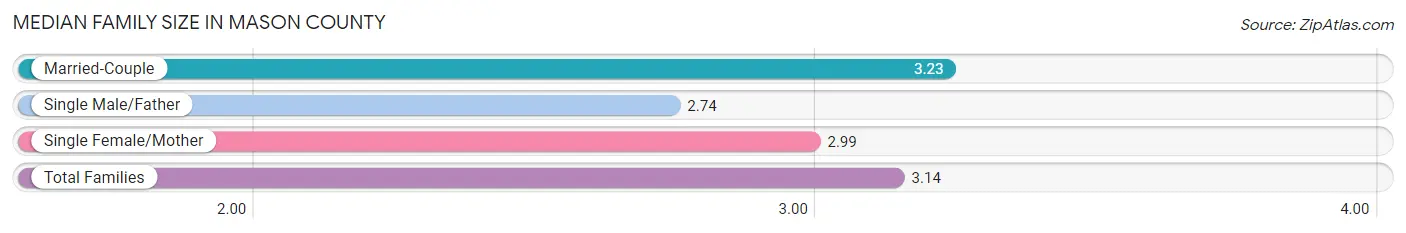
The median family size in Mason County is 3.14 persons per family, with married-couple families (3,120 | 70.9%) accounting for the largest median family size of 3.23 persons per family. On the other hand, single male/father families (321 | 7.3%) represent the smallest median family size with 2.74 persons per family.
| Family Type | # Families | Family Size |
| Married-Couple | 3,120 (70.9%) | 3.23 |
| Single Male/Father | 321 (7.3%) | 2.74 |
| Single Female/Mother | 959 (21.8%) | 2.99 |
| Total Families | 4,400 (100.0%) | 3.14 |
Median Household Size in Mason County
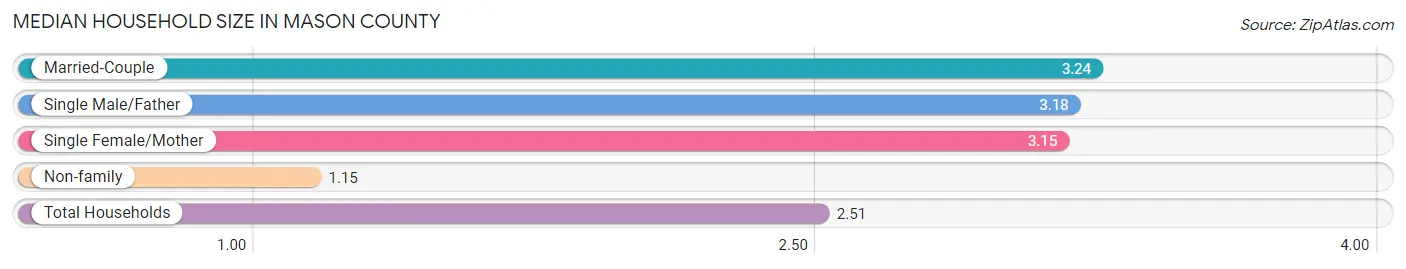
The median household size in Mason County is 2.51 persons per household, with married-couple households (3,120 | 46.6%) accounting for the largest median household size of 3.24 persons per household. non-family households (2,295 | 34.3%) represent the smallest median household size with 1.15 persons per household.
| Household Type | # Households | Household Size |
| Married-Couple | 3,120 (46.6%) | 3.24 |
| Single Male/Father | 321 (4.8%) | 3.18 |
| Single Female/Mother | 959 (14.3%) | 3.15 |
| Non-family | 2,295 (34.3%) | 1.15 |
| Total Households | 6,695 (100.0%) | 2.51 |
Household Size by Marriage Status in Mason County
Out of a total of 6,695 households in Mason County, 4,400 (65.7%) are family households, while 2,295 (34.3%) are nonfamily households. The most numerous type of family households are 2-person households, comprising 2,449, and the most common type of nonfamily households are 1-person households, comprising 2,004.
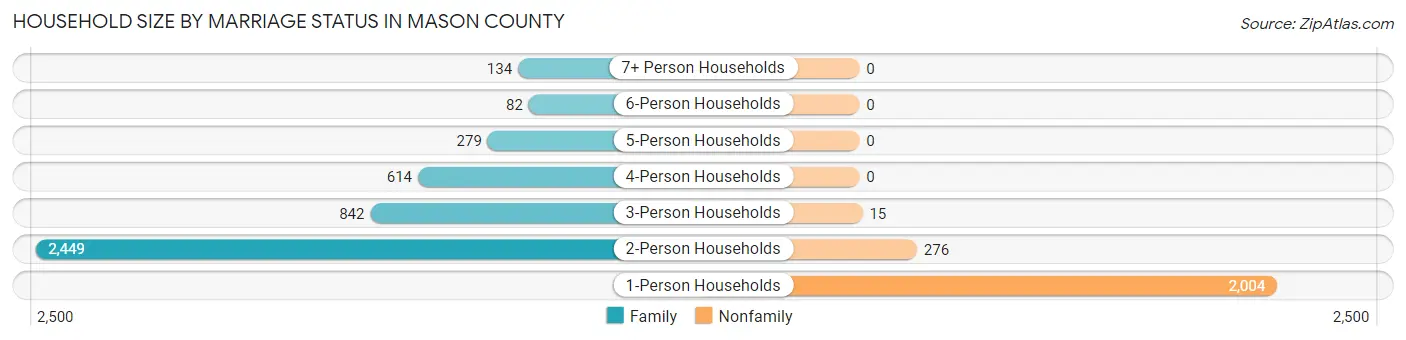
| Household Size | Family Households | Nonfamily Households |
| 1-Person Households | - | 2,004 (29.9%) |
| 2-Person Households | 2,449 (36.6%) | 276 (4.1%) |
| 3-Person Households | 842 (12.6%) | 15 (0.2%) |
| 4-Person Households | 614 (9.2%) | 0 (0.0%) |
| 5-Person Households | 279 (4.2%) | 0 (0.0%) |
| 6-Person Households | 82 (1.2%) | 0 (0.0%) |
| 7+ Person Households | 134 (2.0%) | 0 (0.0%) |
| Total | 4,400 (65.7%) | 2,295 (34.3%) |
Female Fertility in Mason County
Fertility by Age in Mason County
Average fertility rate in Mason County is 58.0 births per 1,000 women. Women in the age bracket of 20 to 34 years have the highest fertility rate with 112.0 births per 1,000 women. Women in the age bracket of 20 to 34 years acount for 75.6% of all women with births.
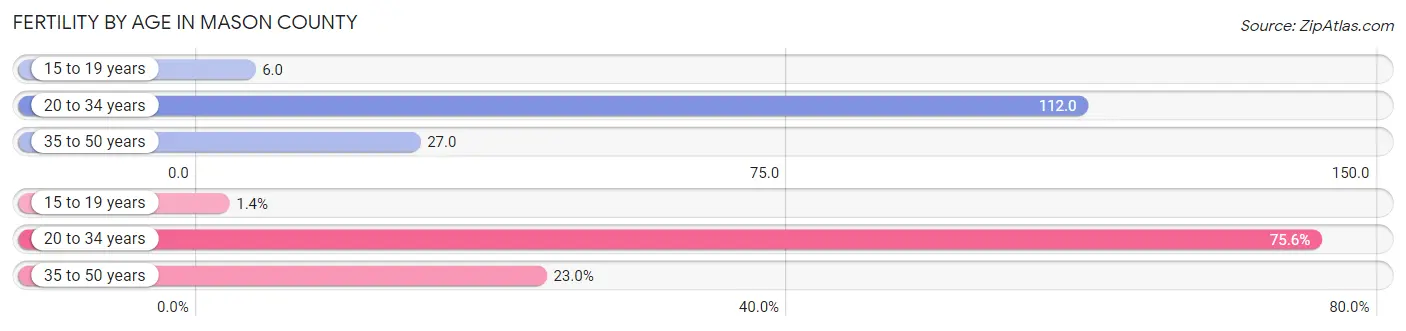
| Age Bracket | Women with Births | Births / 1,000 Women |
| 15 to 19 years | 3 (1.4%) | 6.0 |
| 20 to 34 years | 158 (75.6%) | 112.0 |
| 35 to 50 years | 48 (23.0%) | 27.0 |
| Total | 209 (100.0%) | 58.0 |
Fertility by Age by Marriage Status in Mason County
42.6% of women with births (209) in Mason County are married. The highest percentage of unmarried women with births falls into 20 to 34 years age bracket with 66.5% of them unmarried at the time of birth, while the lowest percentage of unmarried women with births belong to 15 to 19 years age bracket with 0.0% of them unmarried.
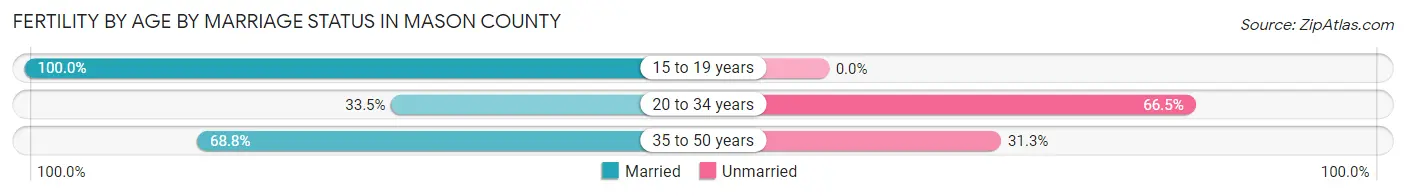
| Age Bracket | Married | Unmarried |
| 15 to 19 years | 3 (100.0%) | 0 (0.0%) |
| 20 to 34 years | 53 (33.5%) | 105 (66.5%) |
| 35 to 50 years | 33 (68.8%) | 15 (31.2%) |
| Total | 89 (42.6%) | 120 (57.4%) |
Fertility by Education in Mason County
Average fertility rate in Mason County is 58.0 births per 1,000 women. Women with the education attainment of graduate degree have the highest fertility rate of 128.0 births per 1,000 women, while women with the education attainment of bachelor's degree have the lowest fertility at 7.0 births per 1,000 women. Women with the education attainment of college or associate's degree represent 53.6% of all women with births.
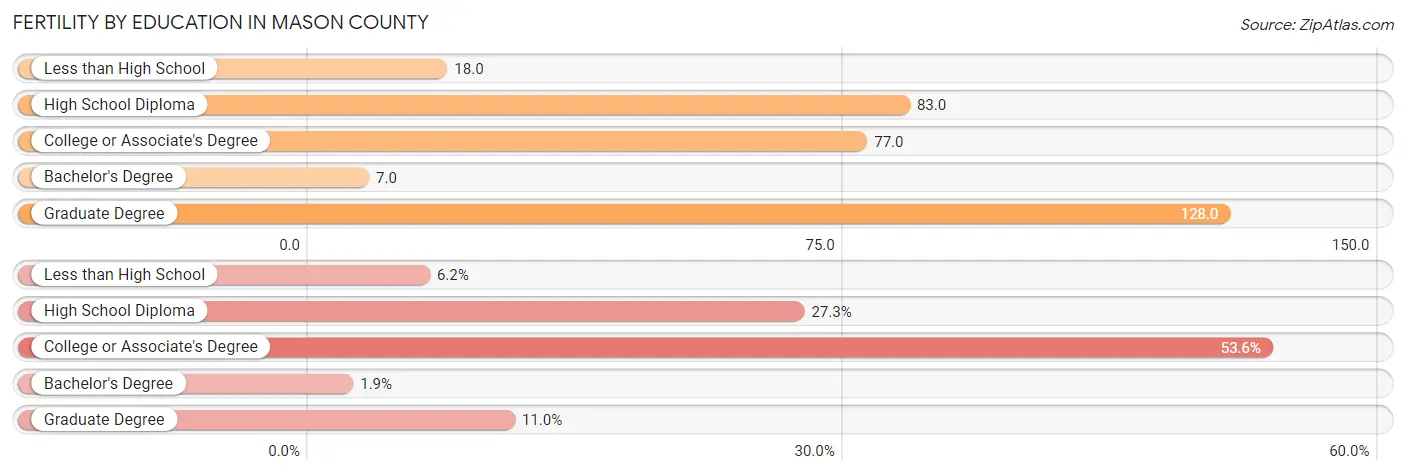
| Educational Attainment | Women with Births | Births / 1,000 Women |
| Less than High School | 13 (6.2%) | 18.0 |
| High School Diploma | 57 (27.3%) | 83.0 |
| College or Associate's Degree | 112 (53.6%) | 77.0 |
| Bachelor's Degree | 4 (1.9%) | 7.0 |
| Graduate Degree | 23 (11.0%) | 128.0 |
| Total | 209 (100.0%) | 58.0 |
Fertility by Education by Marriage Status in Mason County
57.4% of women with births in Mason County are unmarried. Women with the educational attainment of less than high school are most likely to be married with 100.0% of them married at childbirth, while women with the educational attainment of bachelor's degree are least likely to be married with 100.0% of them unmarried at childbirth.
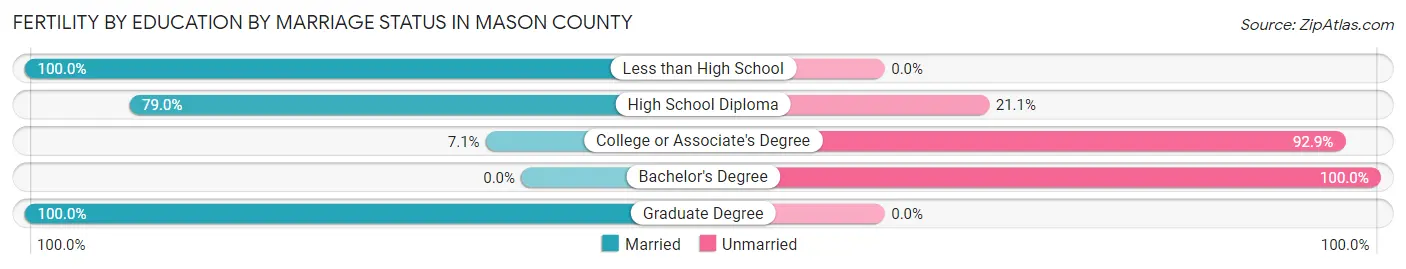
| Educational Attainment | Married | Unmarried |
| Less than High School | 13 (100.0%) | 0 (0.0%) |
| High School Diploma | 45 (78.9%) | 12 (21.0%) |
| College or Associate's Degree | 8 (7.1%) | 104 (92.9%) |
| Bachelor's Degree | 0 (0.0%) | 4 (100.0%) |
| Graduate Degree | 23 (100.0%) | 0 (0.0%) |
| Total | 89 (42.6%) | 120 (57.4%) |
Employment Characteristics in Mason County
Employment by Class of Employer in Mason County
Among the 7,236 employed individuals in Mason County, private company employees (4,980 | 68.8%), not-for-profit organizations (571 | 7.9%), and local government employees (415 | 5.7%) make up the most common classes of employment.
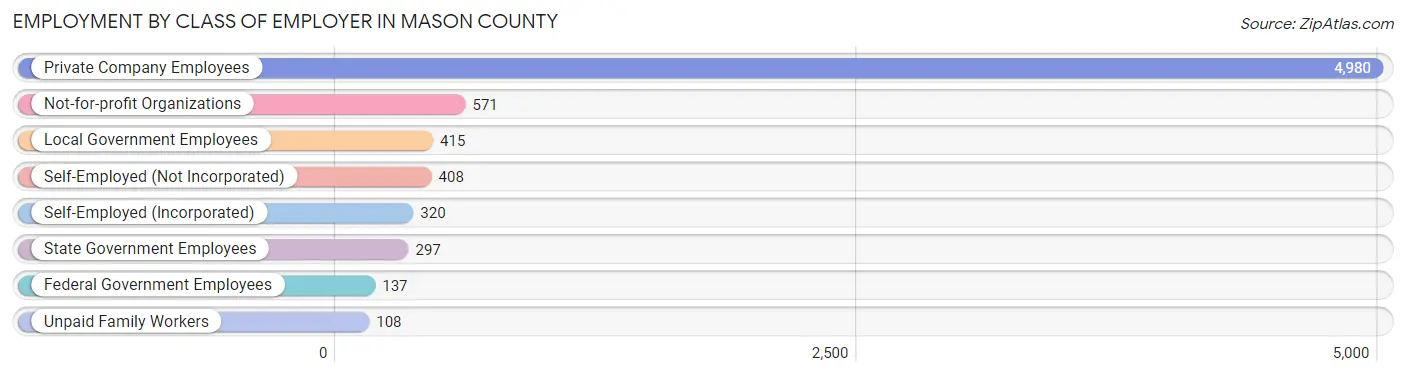
| Employer Class | # Employees | % Employees |
| Private Company Employees | 4,980 | 68.8% |
| Self-Employed (Incorporated) | 320 | 4.4% |
| Self-Employed (Not Incorporated) | 408 | 5.6% |
| Not-for-profit Organizations | 571 | 7.9% |
| Local Government Employees | 415 | 5.7% |
| State Government Employees | 297 | 4.1% |
| Federal Government Employees | 137 | 1.9% |
| Unpaid Family Workers | 108 | 1.5% |
| Total | 7,236 | 100.0% |
Employment Status by Age in Mason County
According to the labor force statistics for Mason County, out of the total population over 16 years of age (13,532), 56.5% or 7,646 individuals are in the labor force, with 4.7% or 359 of them unemployed. The age group with the highest labor force participation rate is 20 to 24 years, with 81.3% or 837 individuals in the labor force. Within the labor force, the 25 to 29 years age range has the highest percentage of unemployed individuals, with 8.6% or 69 of them being unemployed.
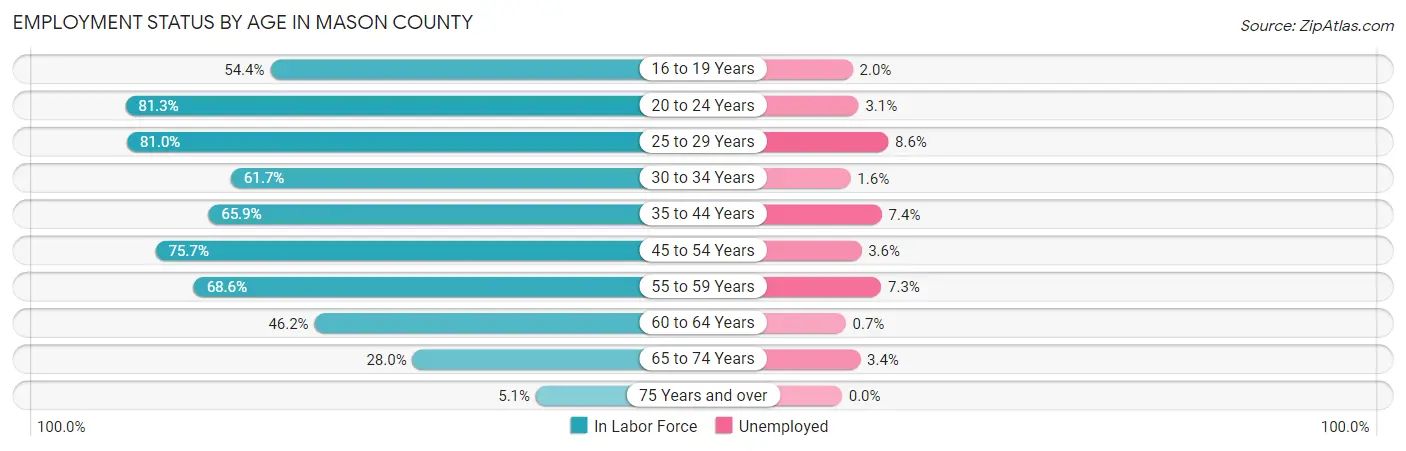
| Age Bracket | In Labor Force | Unemployed |
| 16 to 19 Years | 345 (54.4%) | 7 (2.0%) |
| 20 to 24 Years | 837 (81.3%) | 26 (3.1%) |
| 25 to 29 Years | 804 (81.0%) | 69 (8.6%) |
| 30 to 34 Years | 570 (61.7%) | 9 (1.6%) |
| 35 to 44 Years | 1,360 (65.9%) | 101 (7.4%) |
| 45 to 54 Years | 1,682 (75.7%) | 61 (3.6%) |
| 55 to 59 Years | 858 (68.6%) | 63 (7.3%) |
| 60 to 64 Years | 541 (46.2%) | 4 (0.7%) |
| 65 to 74 Years | 582 (28.0%) | 20 (3.4%) |
| 75 Years and over | 60 (5.1%) | 0 (0.0%) |
| Total | 7,646 (56.5%) | 359 (4.7%) |
Employment Status by Educational Attainment in Mason County
According to labor force statistics for Mason County, 67.4% of individuals (5,813) out of the total population between 25 and 64 years of age (8,624) are in the labor force, with 5.3% or 308 of them being unemployed. The group with the highest labor force participation rate are those with the educational attainment of college / associate degree, with 76.1% or 2,149 individuals in the labor force. Within the labor force, individuals with high school diploma education have the highest percentage of unemployment, with 11.5% or 188 of them being unemployed.
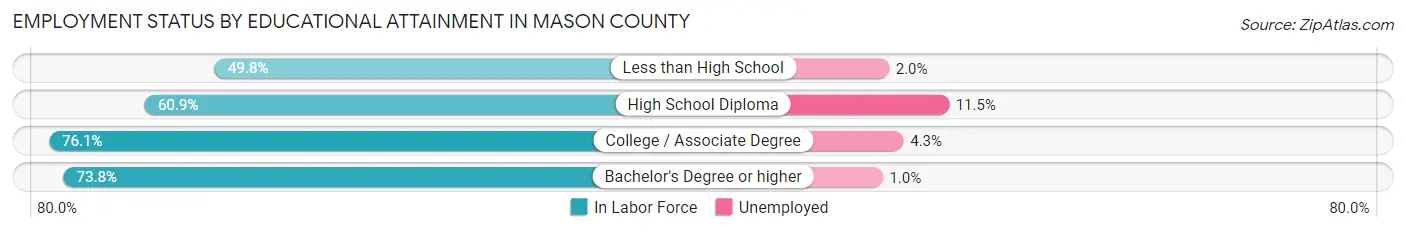
| Educational Attainment | In Labor Force | Unemployed |
| Less than High School | 556 (49.8%) | 22 (2.0%) |
| High School Diploma | 1,639 (60.9%) | 309 (11.5%) |
| College / Associate Degree | 2,149 (76.1%) | 121 (4.3%) |
| Bachelor's Degree or higher | 1,471 (73.8%) | 20 (1.0%) |
| Total | 5,813 (67.4%) | 457 (5.3%) |
Employment Occupations by Sex in Mason County
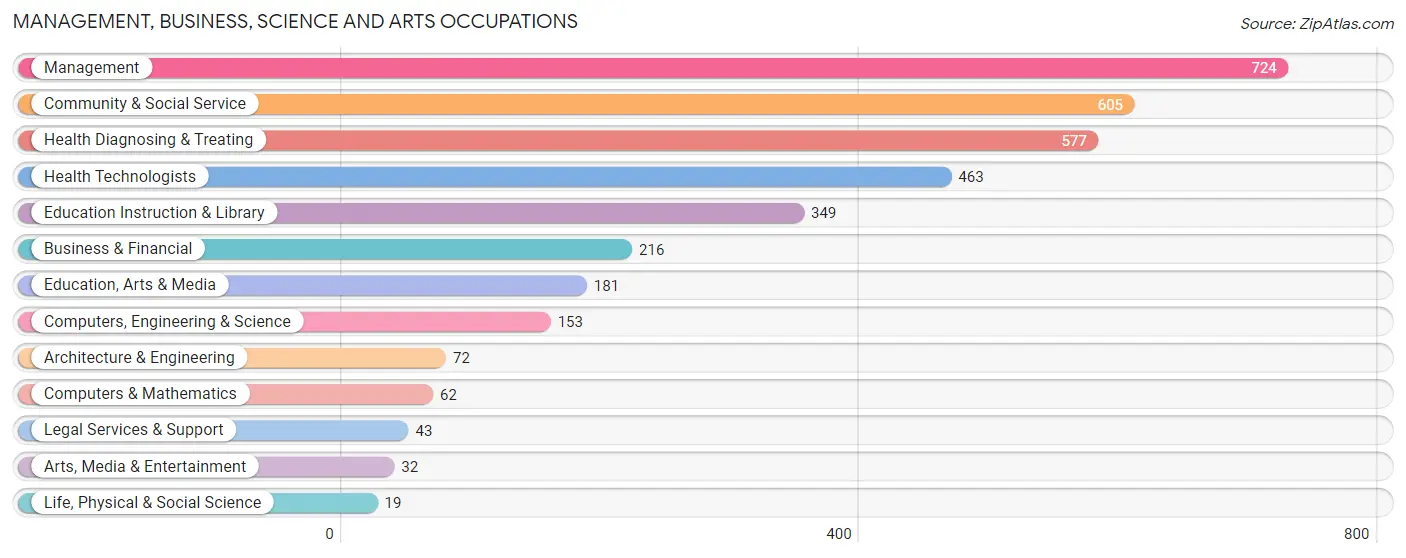
Management, Business, Science and Arts Occupations
The most common Management, Business, Science and Arts occupations in Mason County are Management (724 | 10.0%), Community & Social Service (605 | 8.3%), Health Diagnosing & Treating (577 | 7.9%), Health Technologists (463 | 6.4%), and Education Instruction & Library (349 | 4.8%).
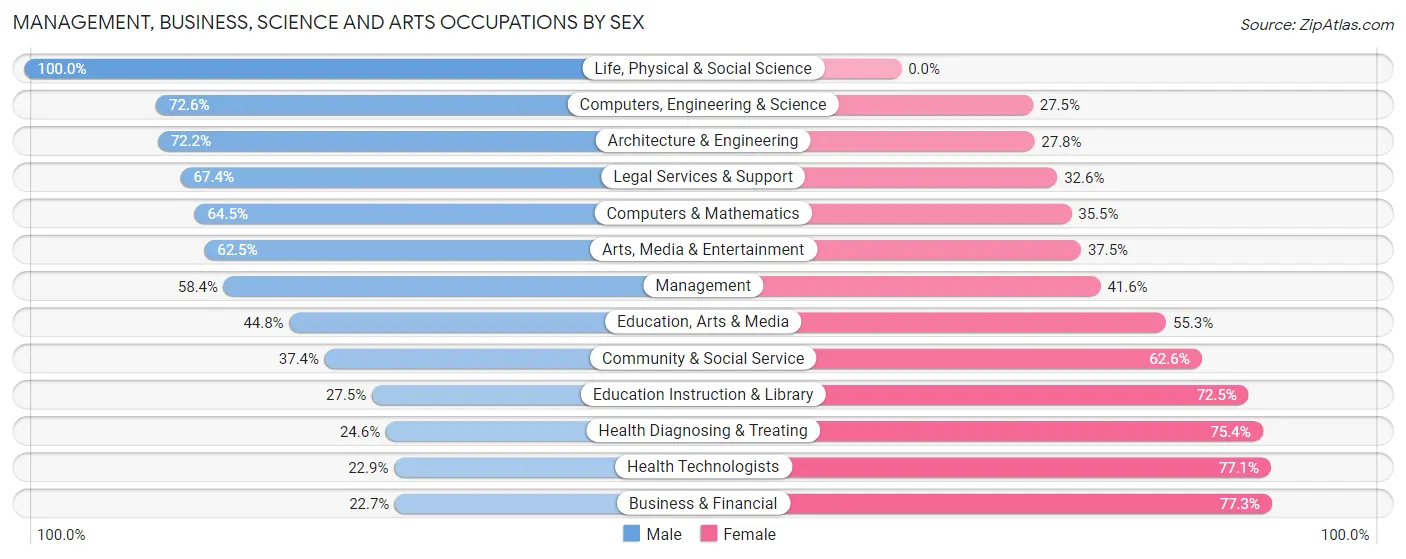
Management, Business, Science and Arts Occupations by Sex
Within the Management, Business, Science and Arts occupations in Mason County, the most male-oriented occupations are Life, Physical & Social Science (100.0%), Computers, Engineering & Science (72.6%), and Architecture & Engineering (72.2%), while the most female-oriented occupations are Business & Financial (77.3%), Health Technologists (77.1%), and Health Diagnosing & Treating (75.4%).
| Occupation | Male | Female |
| Management | 423 (58.4%) | 301 (41.6%) |
| Business & Financial | 49 (22.7%) | 167 (77.3%) |
| Computers, Engineering & Science | 111 (72.6%) | 42 (27.5%) |
| Computers & Mathematics | 40 (64.5%) | 22 (35.5%) |
| Architecture & Engineering | 52 (72.2%) | 20 (27.8%) |
| Life, Physical & Social Science | 19 (100.0%) | 0 (0.0%) |
| Community & Social Service | 226 (37.4%) | 379 (62.6%) |
| Education, Arts & Media | 81 (44.8%) | 100 (55.2%) |
| Legal Services & Support | 29 (67.4%) | 14 (32.6%) |
| Education Instruction & Library | 96 (27.5%) | 253 (72.5%) |
| Arts, Media & Entertainment | 20 (62.5%) | 12 (37.5%) |
| Health Diagnosing & Treating | 142 (24.6%) | 435 (75.4%) |
| Health Technologists | 106 (22.9%) | 357 (77.1%) |
| Total (Category) | 951 (41.8%) | 1,324 (58.2%) |
| Total (Overall) | 3,863 (53.1%) | 3,408 (46.9%) |
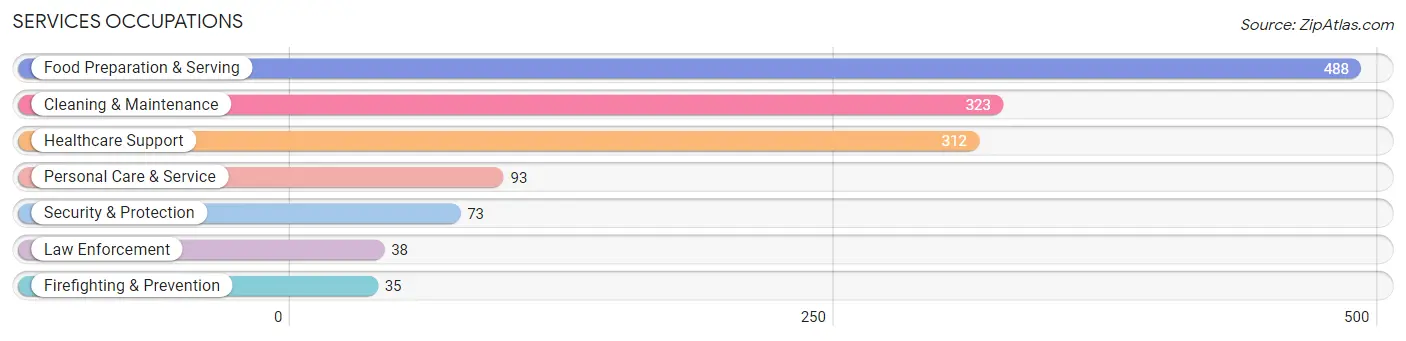
Services Occupations
The most common Services occupations in Mason County are Food Preparation & Serving (488 | 6.7%), Cleaning & Maintenance (323 | 4.4%), Healthcare Support (312 | 4.3%), Personal Care & Service (93 | 1.3%), and Security & Protection (73 | 1.0%).
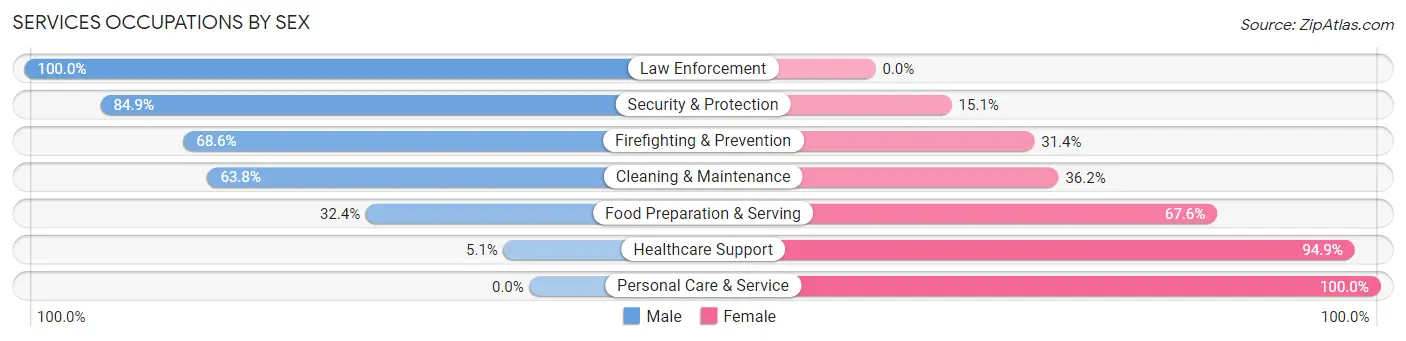
Services Occupations by Sex
Within the Services occupations in Mason County, the most male-oriented occupations are Law Enforcement (100.0%), Security & Protection (84.9%), and Firefighting & Prevention (68.6%), while the most female-oriented occupations are Personal Care & Service (100.0%), Healthcare Support (94.9%), and Food Preparation & Serving (67.6%).
| Occupation | Male | Female |
| Healthcare Support | 16 (5.1%) | 296 (94.9%) |
| Security & Protection | 62 (84.9%) | 11 (15.1%) |
| Firefighting & Prevention | 24 (68.6%) | 11 (31.4%) |
| Law Enforcement | 38 (100.0%) | 0 (0.0%) |
| Food Preparation & Serving | 158 (32.4%) | 330 (67.6%) |
| Cleaning & Maintenance | 206 (63.8%) | 117 (36.2%) |
| Personal Care & Service | 0 (0.0%) | 93 (100.0%) |
| Total (Category) | 442 (34.3%) | 847 (65.7%) |
| Total (Overall) | 3,863 (53.1%) | 3,408 (46.9%) |
Sales and Office Occupations
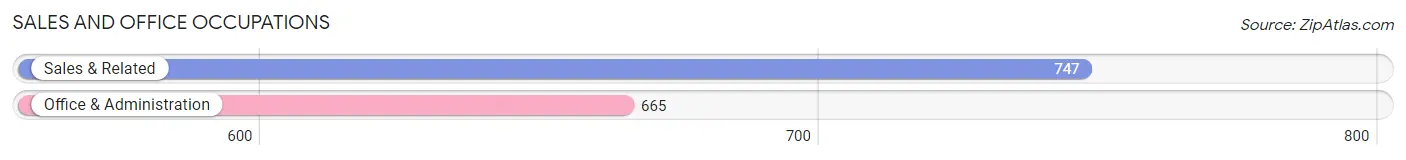
The most common Sales and Office occupations in Mason County are Sales & Related (747 | 10.3%), and Office & Administration (665 | 9.1%).
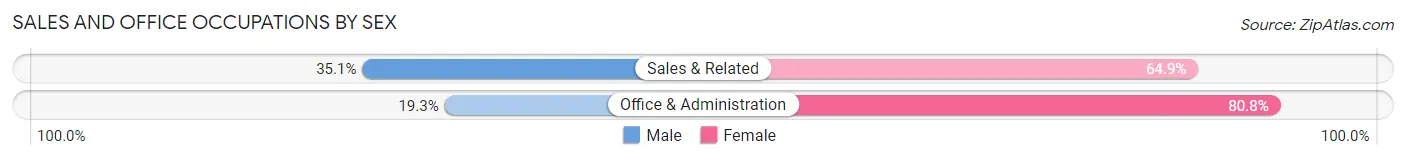
Sales and Office Occupations by Sex
| Occupation | Male | Female |
| Sales & Related | 262 (35.1%) | 485 (64.9%) |
| Office & Administration | 128 (19.3%) | 537 (80.7%) |
| Total (Category) | 390 (27.6%) | 1,022 (72.4%) |
| Total (Overall) | 3,863 (53.1%) | 3,408 (46.9%) |
Natural Resources, Construction and Maintenance Occupations
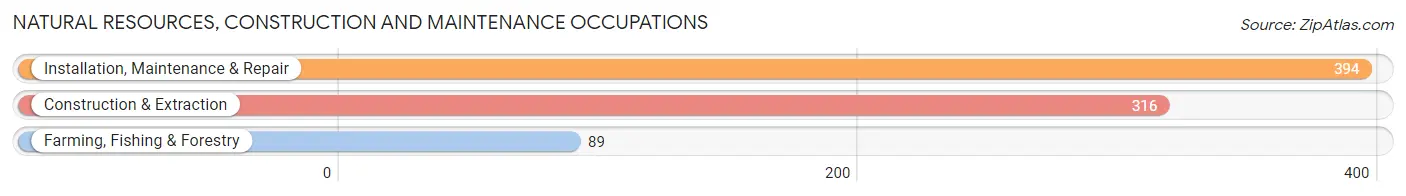
The most common Natural Resources, Construction and Maintenance occupations in Mason County are Installation, Maintenance & Repair (394 | 5.4%), Construction & Extraction (316 | 4.3%), and Farming, Fishing & Forestry (89 | 1.2%).
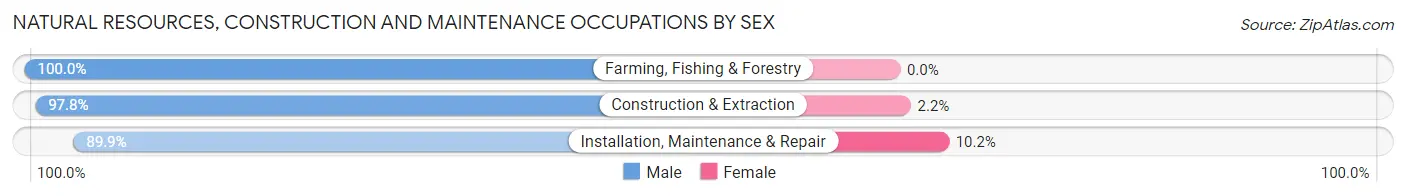
Natural Resources, Construction and Maintenance Occupations by Sex
| Occupation | Male | Female |
| Farming, Fishing & Forestry | 89 (100.0%) | 0 (0.0%) |
| Construction & Extraction | 309 (97.8%) | 7 (2.2%) |
| Installation, Maintenance & Repair | 354 (89.8%) | 40 (10.2%) |
| Total (Category) | 752 (94.1%) | 47 (5.9%) |
| Total (Overall) | 3,863 (53.1%) | 3,408 (46.9%) |
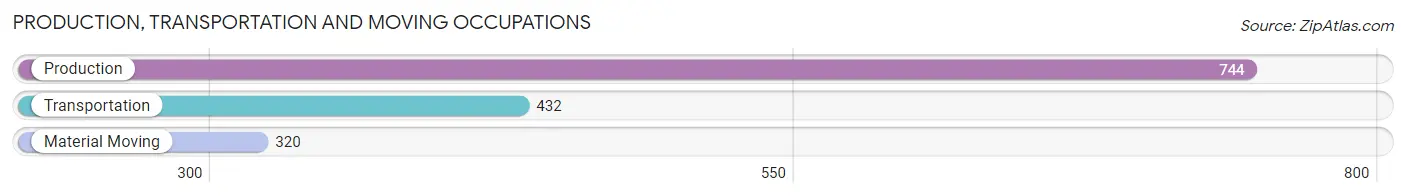
Production, Transportation and Moving Occupations
The most common Production, Transportation and Moving occupations in Mason County are Production (744 | 10.2%), Transportation (432 | 5.9%), and Material Moving (320 | 4.4%).
Production, Transportation and Moving Occupations by Sex
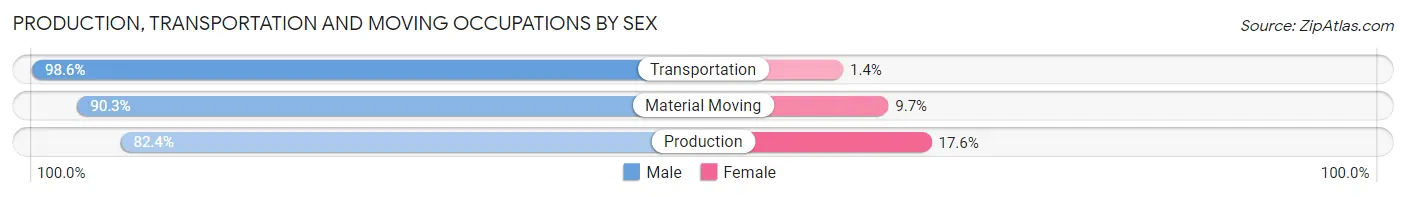
| Occupation | Male | Female |
| Production | 613 (82.4%) | 131 (17.6%) |
| Transportation | 426 (98.6%) | 6 (1.4%) |
| Material Moving | 289 (90.3%) | 31 (9.7%) |
| Total (Category) | 1,328 (88.8%) | 168 (11.2%) |
| Total (Overall) | 3,863 (53.1%) | 3,408 (46.9%) |
Employment Industries by Sex in Mason County
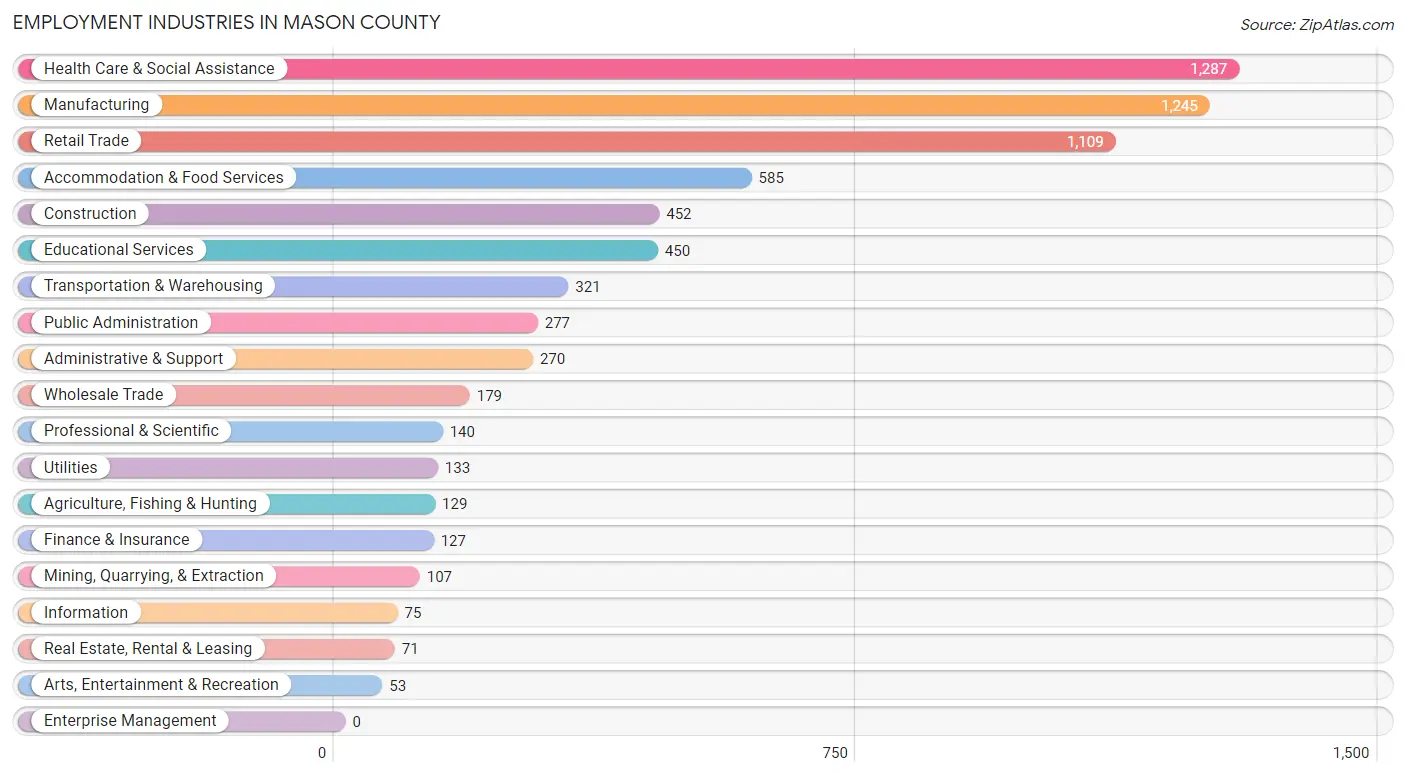
Employment Industries in Mason County
The major employment industries in Mason County include Health Care & Social Assistance (1,287 | 17.7%), Manufacturing (1,245 | 17.1%), Retail Trade (1,109 | 15.2%), Accommodation & Food Services (585 | 8.1%), and Construction (452 | 6.2%).
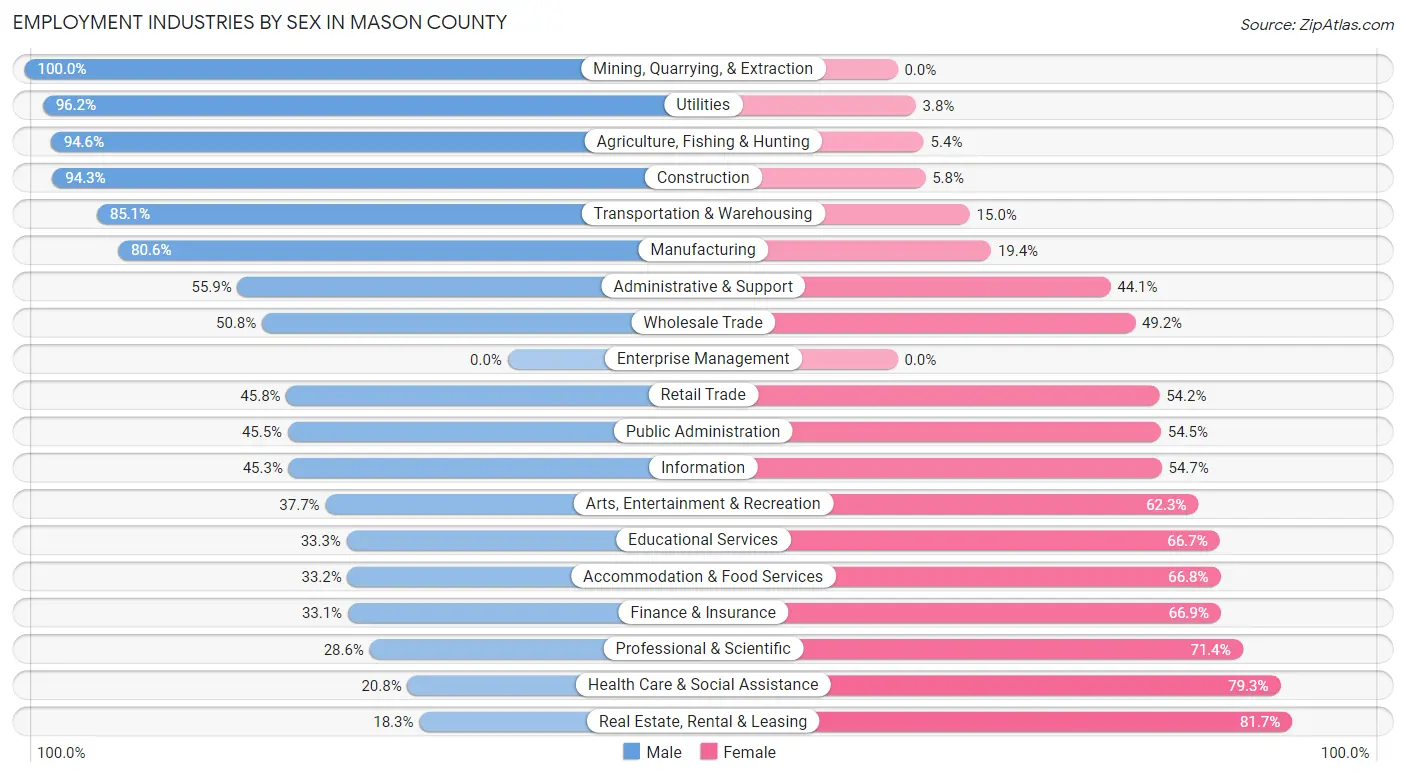
Employment Industries by Sex in Mason County
The Mason County industries that see more men than women are Mining, Quarrying, & Extraction (100.0%), Utilities (96.2%), and Agriculture, Fishing & Hunting (94.6%), whereas the industries that tend to have a higher number of women are Real Estate, Rental & Leasing (81.7%), Health Care & Social Assistance (79.2%), and Professional & Scientific (71.4%).
| Industry | Male | Female |
| Agriculture, Fishing & Hunting | 122 (94.6%) | 7 (5.4%) |
| Mining, Quarrying, & Extraction | 107 (100.0%) | 0 (0.0%) |
| Construction | 426 (94.3%) | 26 (5.8%) |
| Manufacturing | 1,004 (80.6%) | 241 (19.4%) |
| Wholesale Trade | 91 (50.8%) | 88 (49.2%) |
| Retail Trade | 508 (45.8%) | 601 (54.2%) |
| Transportation & Warehousing | 273 (85.1%) | 48 (14.9%) |
| Utilities | 128 (96.2%) | 5 (3.8%) |
| Information | 34 (45.3%) | 41 (54.7%) |
| Finance & Insurance | 42 (33.1%) | 85 (66.9%) |
| Real Estate, Rental & Leasing | 13 (18.3%) | 58 (81.7%) |
| Professional & Scientific | 40 (28.6%) | 100 (71.4%) |
| Enterprise Management | 0 (0.0%) | 0 (0.0%) |
| Administrative & Support | 151 (55.9%) | 119 (44.1%) |
| Educational Services | 150 (33.3%) | 300 (66.7%) |
| Health Care & Social Assistance | 267 (20.7%) | 1,020 (79.2%) |
| Arts, Entertainment & Recreation | 20 (37.7%) | 33 (62.3%) |
| Accommodation & Food Services | 194 (33.2%) | 391 (66.8%) |
| Public Administration | 126 (45.5%) | 151 (54.5%) |
| Total | 3,863 (53.1%) | 3,408 (46.9%) |
Education in Mason County
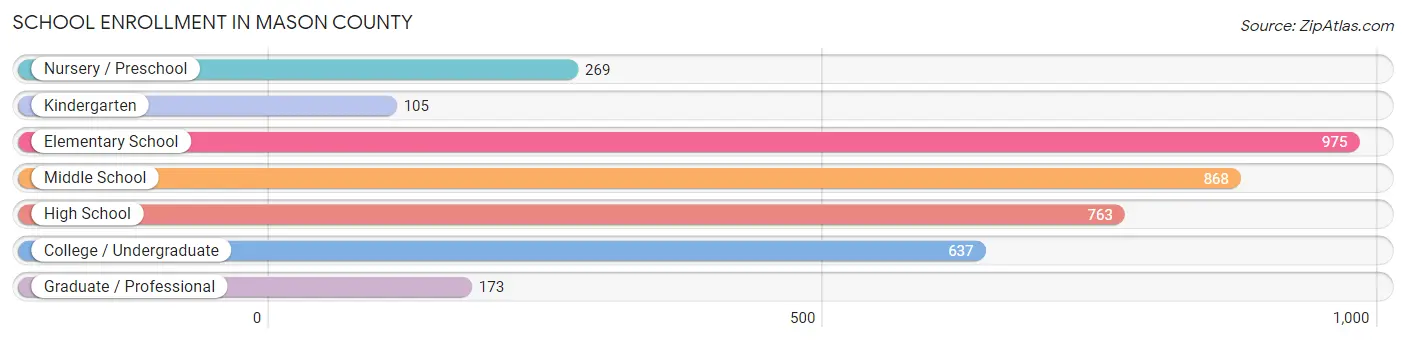
School Enrollment in Mason County
The most common levels of schooling among the 3,790 students in Mason County are elementary school (975 | 25.7%), middle school (868 | 22.9%), and high school (763 | 20.1%).
| School Level | # Students | % Students |
| Nursery / Preschool | 269 | 7.1% |
| Kindergarten | 105 | 2.8% |
| Elementary School | 975 | 25.7% |
| Middle School | 868 | 22.9% |
| High School | 763 | 20.1% |
| College / Undergraduate | 637 | 16.8% |
| Graduate / Professional | 173 | 4.6% |
| Total | 3,790 | 100.0% |
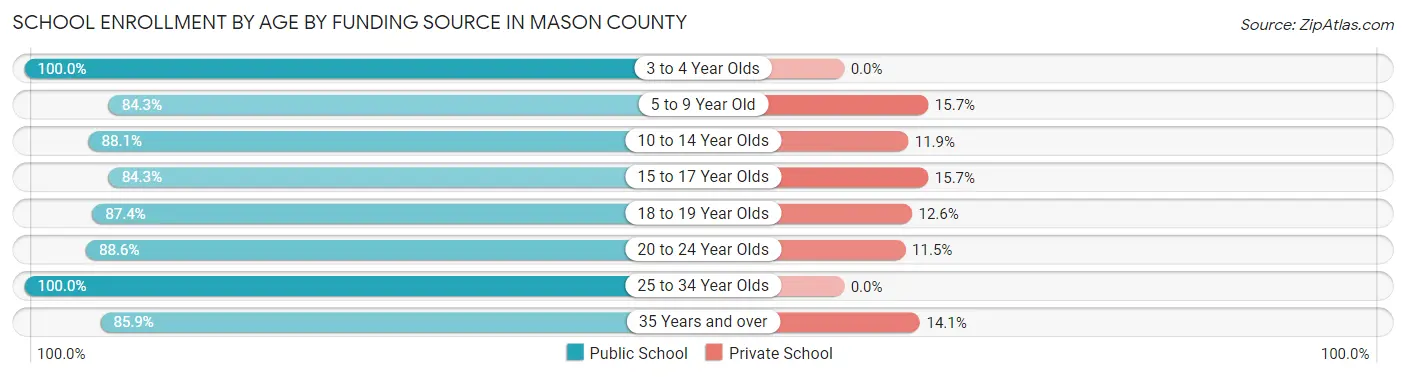
School Enrollment by Age by Funding Source in Mason County
Out of a total of 3,790 students who are enrolled in schools in Mason County, 485 (12.8%) attend a private institution, while the remaining 3,305 (87.2%) are enrolled in public schools. The age group of 5 to 9 year old has the highest likelihood of being enrolled in private schools, with 184 (15.7% in the age bracket) enrolled. Conversely, the age group of 3 to 4 year olds has the lowest likelihood of being enrolled in a private school, with 137 (100.0% in the age bracket) attending a public institution.
| Age Bracket | Public School | Private School |
| 3 to 4 Year Olds | 137 (100.0%) | 0 (0.0%) |
| 5 to 9 Year Old | 989 (84.3%) | 184 (15.7%) |
| 10 to 14 Year Olds | 848 (88.1%) | 115 (11.9%) |
| 15 to 17 Year Olds | 543 (84.3%) | 101 (15.7%) |
| 18 to 19 Year Olds | 152 (87.4%) | 22 (12.6%) |
| 20 to 24 Year Olds | 294 (88.5%) | 38 (11.5%) |
| 25 to 34 Year Olds | 183 (100.0%) | 0 (0.0%) |
| 35 Years and over | 158 (85.9%) | 26 (14.1%) |
| Total | 3,305 (87.2%) | 485 (12.8%) |
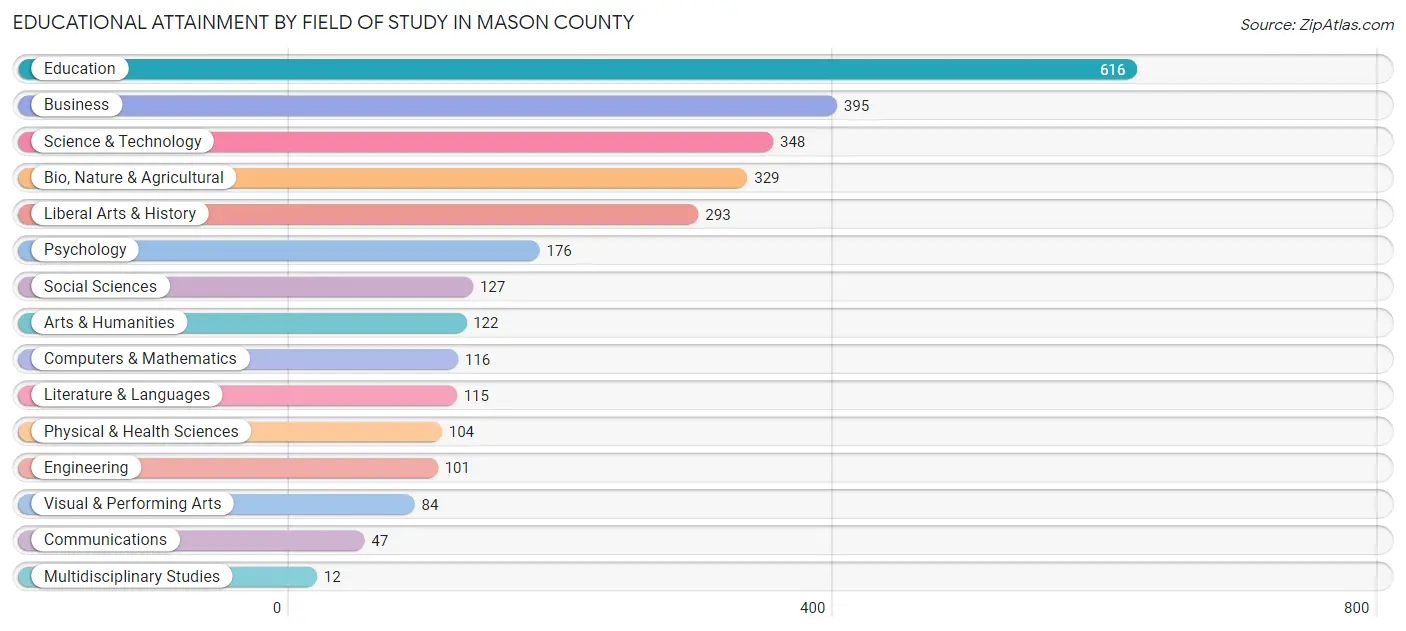
Educational Attainment by Field of Study in Mason County
Education (616 | 20.6%), business (395 | 13.2%), science & technology (348 | 11.7%), bio, nature & agricultural (329 | 11.0%), and liberal arts & history (293 | 9.8%) are the most common fields of study among 2,985 individuals in Mason County who have obtained a bachelor's degree or higher.
| Field of Study | # Graduates | % Graduates |
| Computers & Mathematics | 116 | 3.9% |
| Bio, Nature & Agricultural | 329 | 11.0% |
| Physical & Health Sciences | 104 | 3.5% |
| Psychology | 176 | 5.9% |
| Social Sciences | 127 | 4.3% |
| Engineering | 101 | 3.4% |
| Multidisciplinary Studies | 12 | 0.4% |
| Science & Technology | 348 | 11.7% |
| Business | 395 | 13.2% |
| Education | 616 | 20.6% |
| Literature & Languages | 115 | 3.8% |
| Liberal Arts & History | 293 | 9.8% |
| Visual & Performing Arts | 84 | 2.8% |
| Communications | 47 | 1.6% |
| Arts & Humanities | 122 | 4.1% |
| Total | 2,985 | 100.0% |
Transportation & Commute in Mason County
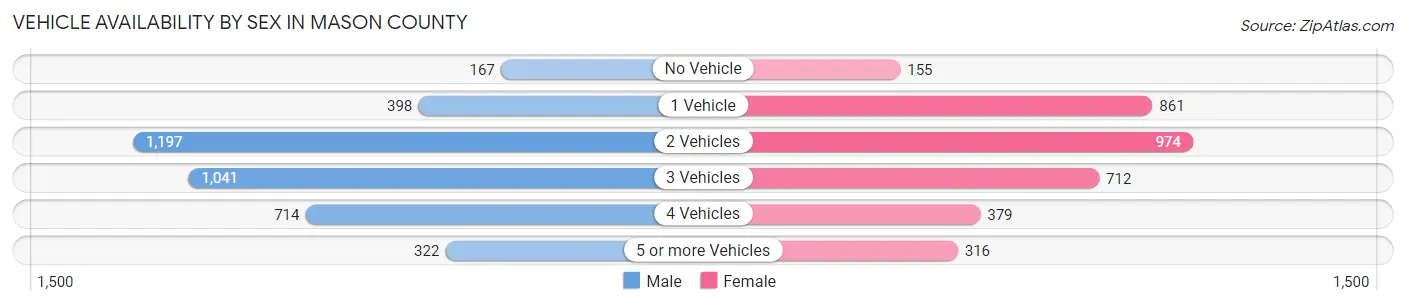
Vehicle Availability by Sex in Mason County
The most prevalent vehicle ownership categories in Mason County are males with 2 vehicles (1,197, accounting for 31.2%) and females with 2 vehicles (974, making up 35.2%).
| Vehicles Available | Male | Female |
| No Vehicle | 167 (4.3%) | 155 (4.6%) |
| 1 Vehicle | 398 (10.4%) | 861 (25.4%) |
| 2 Vehicles | 1,197 (31.2%) | 974 (28.7%) |
| 3 Vehicles | 1,041 (27.1%) | 712 (21.0%) |
| 4 Vehicles | 714 (18.6%) | 379 (11.2%) |
| 5 or more Vehicles | 322 (8.4%) | 316 (9.3%) |
| Total | 3,839 (100.0%) | 3,397 (100.0%) |
Commute Time in Mason County
The most frequently occuring commute durations in Mason County are 15 to 19 minutes (1,575 commuters, 23.0%), 5 to 9 minutes (982 commuters, 14.3%), and 10 to 14 minutes (980 commuters, 14.3%).
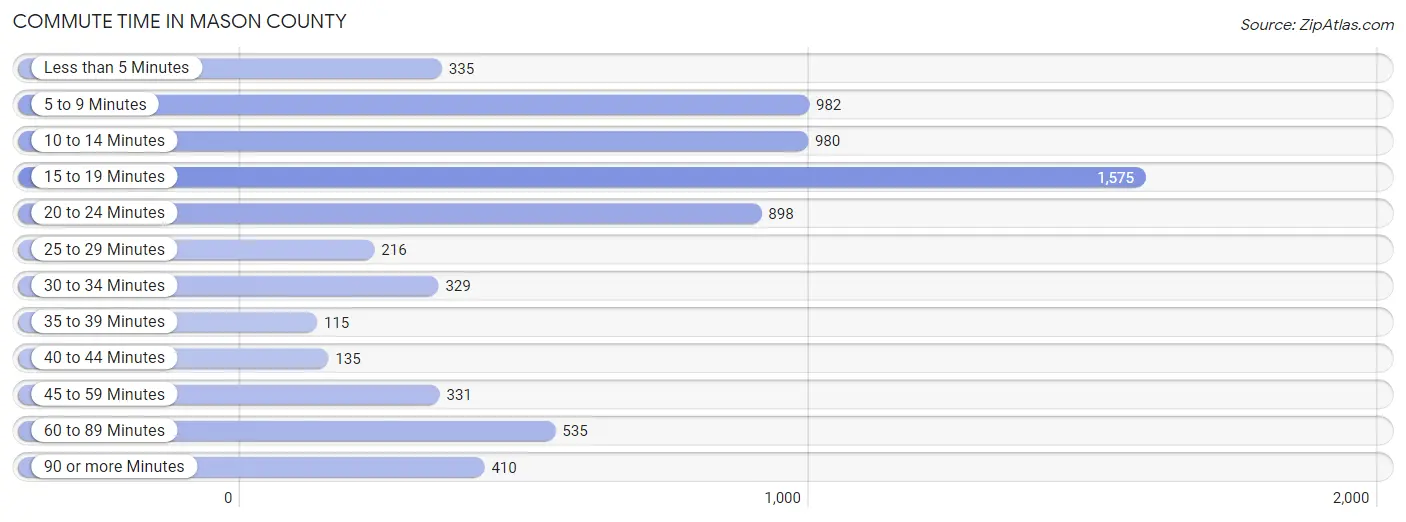
| Commute Time | # Commuters | % Commuters |
| Less than 5 Minutes | 335 | 4.9% |
| 5 to 9 Minutes | 982 | 14.3% |
| 10 to 14 Minutes | 980 | 14.3% |
| 15 to 19 Minutes | 1,575 | 23.0% |
| 20 to 24 Minutes | 898 | 13.1% |
| 25 to 29 Minutes | 216 | 3.2% |
| 30 to 34 Minutes | 329 | 4.8% |
| 35 to 39 Minutes | 115 | 1.7% |
| 40 to 44 Minutes | 135 | 2.0% |
| 45 to 59 Minutes | 331 | 4.8% |
| 60 to 89 Minutes | 535 | 7.8% |
| 90 or more Minutes | 410 | 6.0% |
Commute Time by Sex in Mason County
The most common commute times in Mason County are 20 to 24 minutes (669 commuters, 18.1%) for males and 15 to 19 minutes (984 commuters, 31.3%) for females.
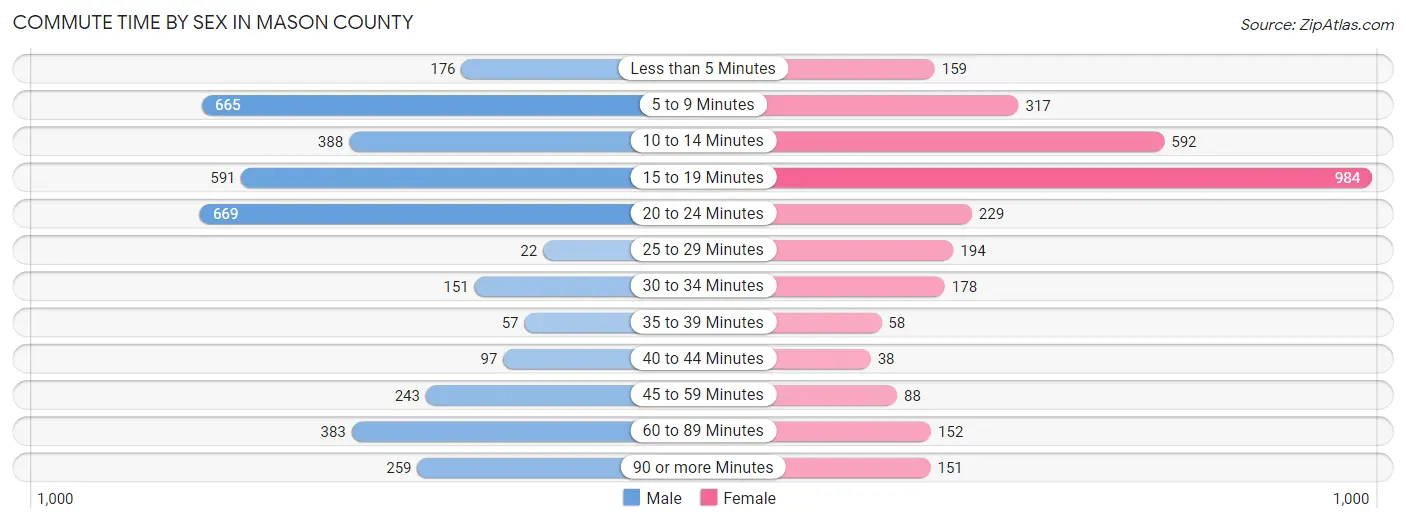
| Commute Time | Male | Female |
| Less than 5 Minutes | 176 (4.8%) | 159 (5.1%) |
| 5 to 9 Minutes | 665 (18.0%) | 317 (10.1%) |
| 10 to 14 Minutes | 388 (10.5%) | 592 (18.9%) |
| 15 to 19 Minutes | 591 (16.0%) | 984 (31.3%) |
| 20 to 24 Minutes | 669 (18.1%) | 229 (7.3%) |
| 25 to 29 Minutes | 22 (0.6%) | 194 (6.2%) |
| 30 to 34 Minutes | 151 (4.1%) | 178 (5.7%) |
| 35 to 39 Minutes | 57 (1.5%) | 58 (1.8%) |
| 40 to 44 Minutes | 97 (2.6%) | 38 (1.2%) |
| 45 to 59 Minutes | 243 (6.6%) | 88 (2.8%) |
| 60 to 89 Minutes | 383 (10.3%) | 152 (4.8%) |
| 90 or more Minutes | 259 (7.0%) | 151 (4.8%) |
Time of Departure to Work by Sex in Mason County
The most frequent times of departure to work in Mason County are 7:00 AM to 7:29 AM (829, 22.4%) for males and 7:00 AM to 7:29 AM (480, 15.3%) for females.
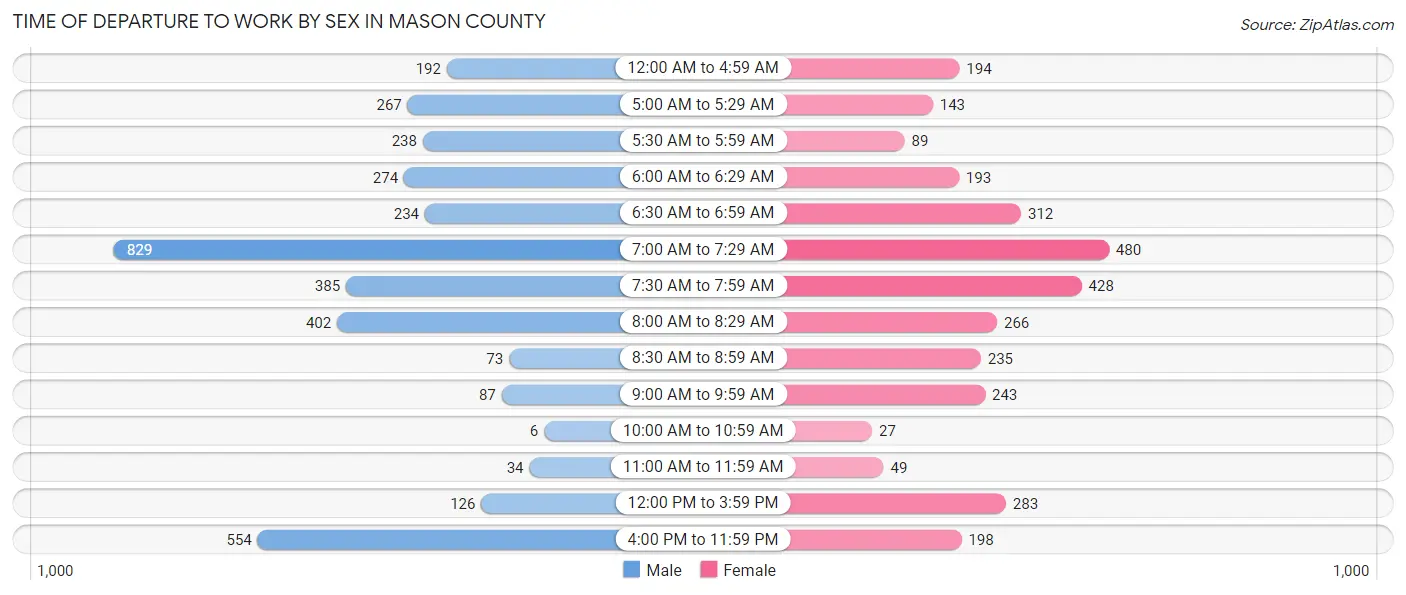
| Time of Departure | Male | Female |
| 12:00 AM to 4:59 AM | 192 (5.2%) | 194 (6.2%) |
| 5:00 AM to 5:29 AM | 267 (7.2%) | 143 (4.5%) |
| 5:30 AM to 5:59 AM | 238 (6.4%) | 89 (2.8%) |
| 6:00 AM to 6:29 AM | 274 (7.4%) | 193 (6.1%) |
| 6:30 AM to 6:59 AM | 234 (6.3%) | 312 (9.9%) |
| 7:00 AM to 7:29 AM | 829 (22.4%) | 480 (15.3%) |
| 7:30 AM to 7:59 AM | 385 (10.4%) | 428 (13.6%) |
| 8:00 AM to 8:29 AM | 402 (10.9%) | 266 (8.5%) |
| 8:30 AM to 8:59 AM | 73 (2.0%) | 235 (7.5%) |
| 9:00 AM to 9:59 AM | 87 (2.4%) | 243 (7.7%) |
| 10:00 AM to 10:59 AM | 6 (0.2%) | 27 (0.9%) |
| 11:00 AM to 11:59 AM | 34 (0.9%) | 49 (1.6%) |
| 12:00 PM to 3:59 PM | 126 (3.4%) | 283 (9.0%) |
| 4:00 PM to 11:59 PM | 554 (15.0%) | 198 (6.3%) |
| Total | 3,701 (100.0%) | 3,140 (100.0%) |
Housing Occupancy in Mason County
Occupancy by Ownership in Mason County
Of the total 6,695 dwellings in Mason County, owner-occupied units account for 4,596 (68.6%), while renter-occupied units make up 2,099 (31.4%).
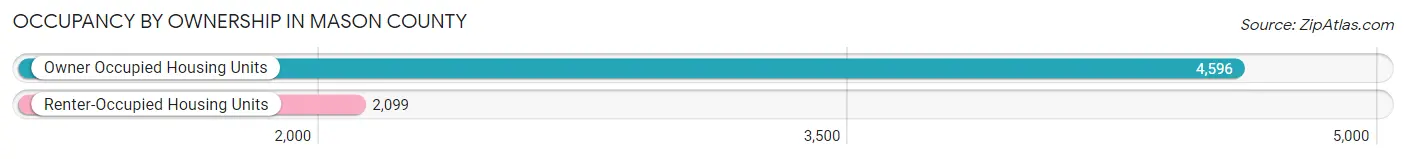
| Occupancy | # Housing Units | % Housing Units |
| Owner Occupied Housing Units | 4,596 | 68.6% |
| Renter-Occupied Housing Units | 2,099 | 31.4% |
| Total Occupied Housing Units | 6,695 | 100.0% |
Occupancy by Household Size in Mason County
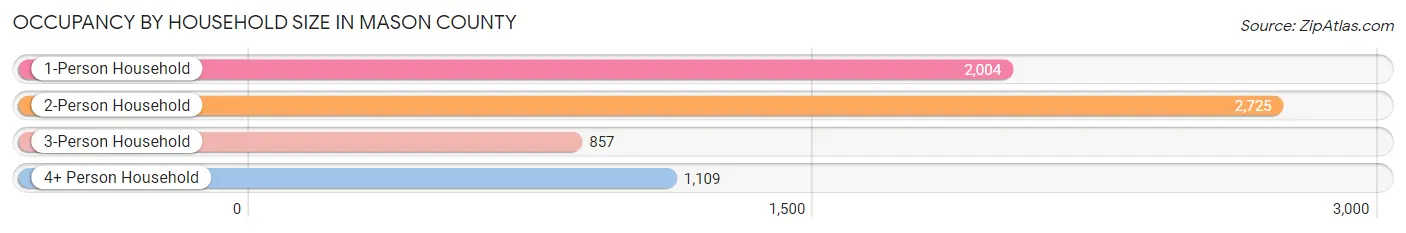
| Household Size | # Housing Units | % Housing Units |
| 1-Person Household | 2,004 | 29.9% |
| 2-Person Household | 2,725 | 40.7% |
| 3-Person Household | 857 | 12.8% |
| 4+ Person Household | 1,109 | 16.6% |
| Total Housing Units | 6,695 | 100.0% |
Occupancy by Ownership by Household Size in Mason County
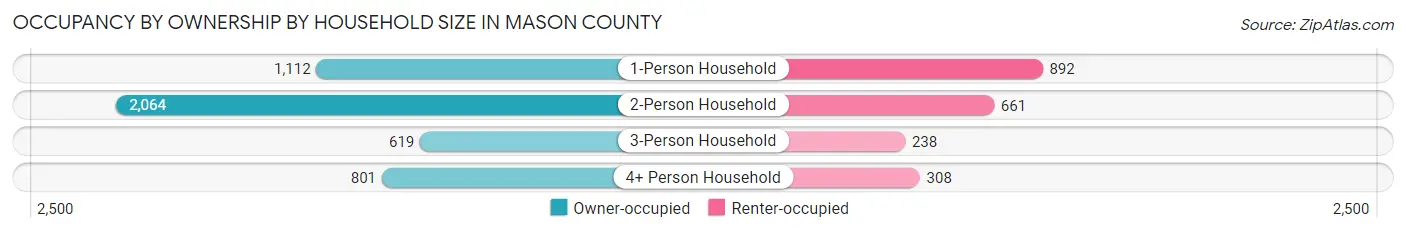
| Household Size | Owner-occupied | Renter-occupied |
| 1-Person Household | 1,112 (55.5%) | 892 (44.5%) |
| 2-Person Household | 2,064 (75.7%) | 661 (24.3%) |
| 3-Person Household | 619 (72.2%) | 238 (27.8%) |
| 4+ Person Household | 801 (72.2%) | 308 (27.8%) |
| Total Housing Units | 4,596 (68.6%) | 2,099 (31.4%) |
Occupancy by Educational Attainment in Mason County
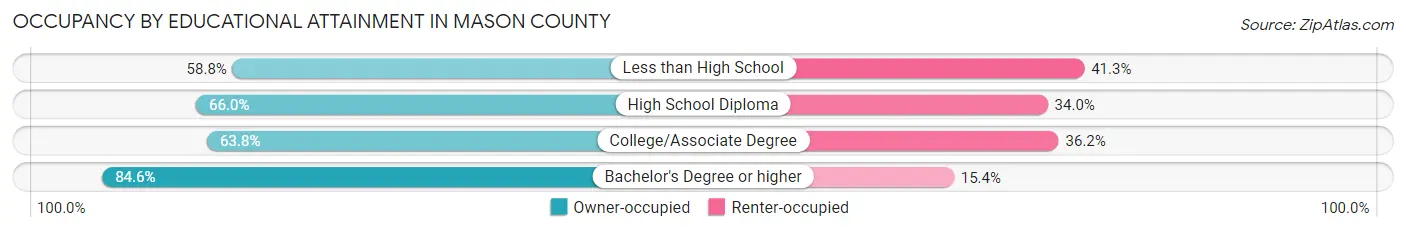
| Household Size | Owner-occupied | Renter-occupied |
| Less than High School | 487 (58.8%) | 342 (41.2%) |
| High School Diploma | 1,357 (66.0%) | 699 (34.0%) |
| College/Associate Degree | 1,449 (63.8%) | 821 (36.2%) |
| Bachelor's Degree or higher | 1,303 (84.6%) | 237 (15.4%) |
Occupancy by Age of Householder in Mason County
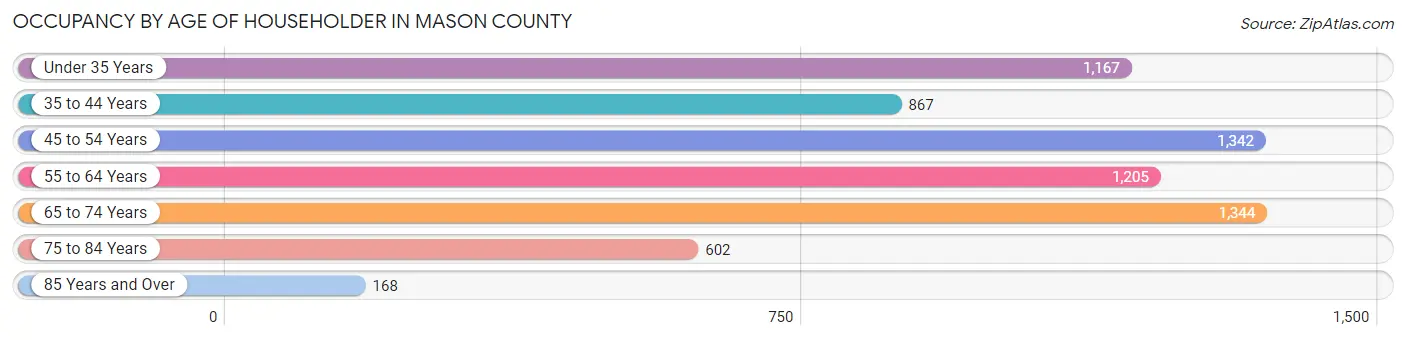
| Age Bracket | # Households | % Households |
| Under 35 Years | 1,167 | 17.4% |
| 35 to 44 Years | 867 | 13.0% |
| 45 to 54 Years | 1,342 | 20.0% |
| 55 to 64 Years | 1,205 | 18.0% |
| 65 to 74 Years | 1,344 | 20.1% |
| 75 to 84 Years | 602 | 9.0% |
| 85 Years and Over | 168 | 2.5% |
| Total | 6,695 | 100.0% |
Housing Finances in Mason County
Median Income by Occupancy in Mason County
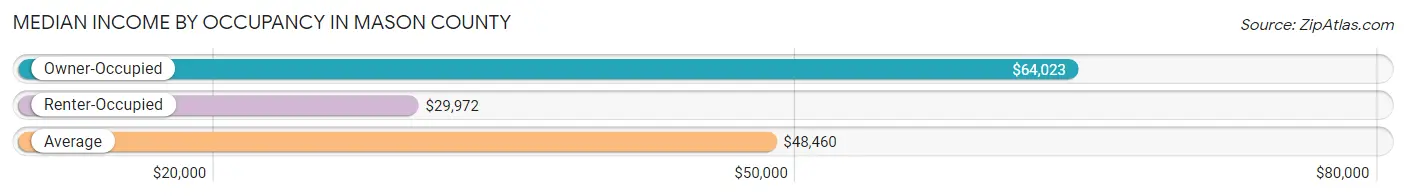
| Occupancy Type | # Households | Median Income |
| Owner-Occupied | 4,596 (68.6%) | $64,023 |
| Renter-Occupied | 2,099 (31.4%) | $29,972 |
| Average | 6,695 (100.0%) | $48,460 |
Occupancy by Householder Income Bracket in Mason County
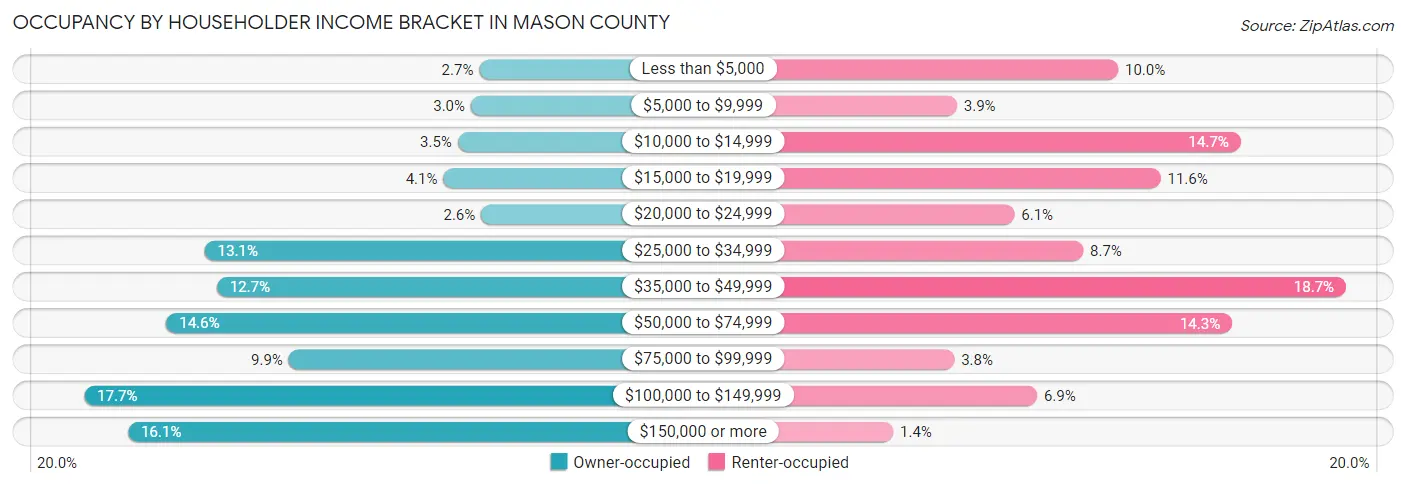
| Income Bracket | Owner-occupied | Renter-occupied |
| Less than $5,000 | 123 (2.7%) | 210 (10.0%) |
| $5,000 to $9,999 | 138 (3.0%) | 81 (3.9%) |
| $10,000 to $14,999 | 161 (3.5%) | 308 (14.7%) |
| $15,000 to $19,999 | 186 (4.1%) | 244 (11.6%) |
| $20,000 to $24,999 | 120 (2.6%) | 127 (6.0%) |
| $25,000 to $34,999 | 604 (13.1%) | 182 (8.7%) |
| $35,000 to $49,999 | 583 (12.7%) | 392 (18.7%) |
| $50,000 to $74,999 | 671 (14.6%) | 301 (14.3%) |
| $75,000 to $99,999 | 457 (9.9%) | 79 (3.8%) |
| $100,000 to $149,999 | 815 (17.7%) | 145 (6.9%) |
| $150,000 or more | 738 (16.1%) | 30 (1.4%) |
| Total | 4,596 (100.0%) | 2,099 (100.0%) |
Monthly Housing Cost Tiers in Mason County
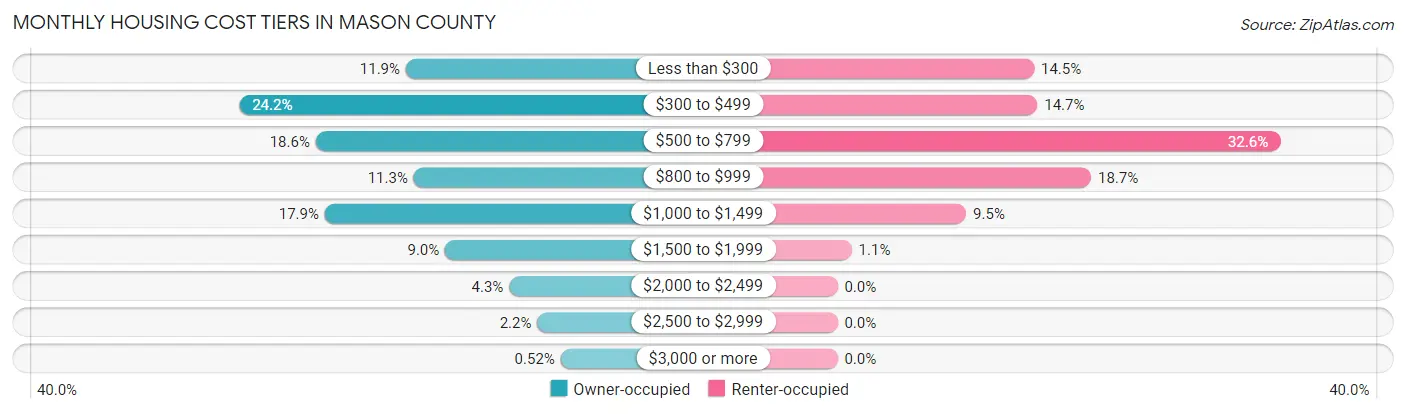
| Monthly Cost | Owner-occupied | Renter-occupied |
| Less than $300 | 548 (11.9%) | 304 (14.5%) |
| $300 to $499 | 1,112 (24.2%) | 309 (14.7%) |
| $500 to $799 | 853 (18.6%) | 684 (32.6%) |
| $800 to $999 | 521 (11.3%) | 392 (18.7%) |
| $1,000 to $1,499 | 822 (17.9%) | 199 (9.5%) |
| $1,500 to $1,999 | 415 (9.0%) | 22 (1.1%) |
| $2,000 to $2,499 | 198 (4.3%) | 0 (0.0%) |
| $2,500 to $2,999 | 103 (2.2%) | 0 (0.0%) |
| $3,000 or more | 24 (0.5%) | 0 (0.0%) |
| Total | 4,596 (100.0%) | 2,099 (100.0%) |
Physical Housing Characteristics in Mason County
Housing Structures in Mason County
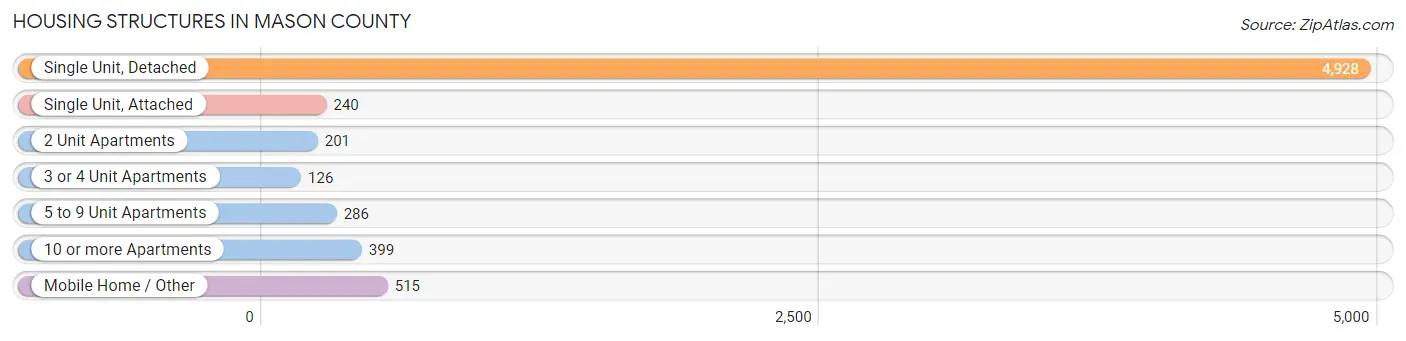
| Structure Type | # Housing Units | % Housing Units |
| Single Unit, Detached | 4,928 | 73.6% |
| Single Unit, Attached | 240 | 3.6% |
| 2 Unit Apartments | 201 | 3.0% |
| 3 or 4 Unit Apartments | 126 | 1.9% |
| 5 to 9 Unit Apartments | 286 | 4.3% |
| 10 or more Apartments | 399 | 6.0% |
| Mobile Home / Other | 515 | 7.7% |
| Total | 6,695 | 100.0% |
Housing Structures by Occupancy in Mason County
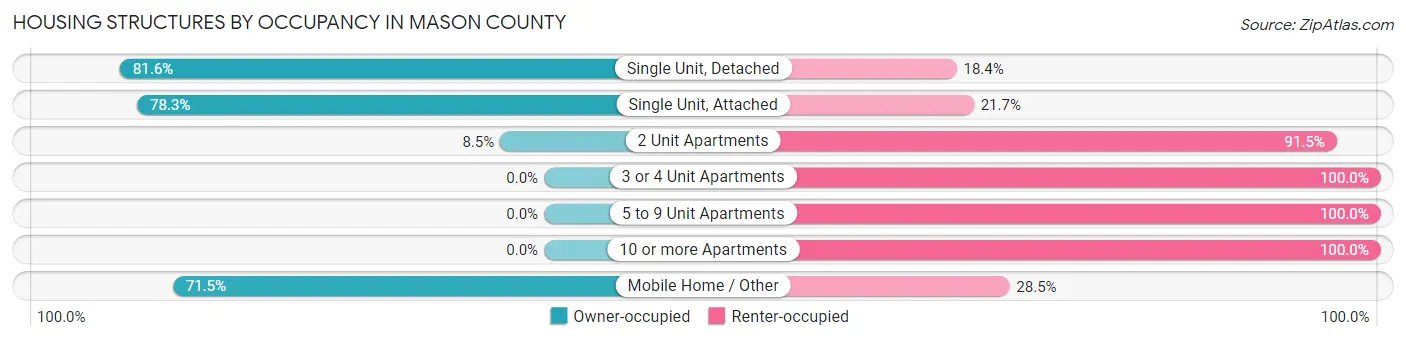
| Structure Type | Owner-occupied | Renter-occupied |
| Single Unit, Detached | 4,023 (81.6%) | 905 (18.4%) |
| Single Unit, Attached | 188 (78.3%) | 52 (21.7%) |
| 2 Unit Apartments | 17 (8.5%) | 184 (91.5%) |
| 3 or 4 Unit Apartments | 0 (0.0%) | 126 (100.0%) |
| 5 to 9 Unit Apartments | 0 (0.0%) | 286 (100.0%) |
| 10 or more Apartments | 0 (0.0%) | 399 (100.0%) |
| Mobile Home / Other | 368 (71.5%) | 147 (28.5%) |
| Total | 4,596 (68.6%) | 2,099 (31.4%) |
Housing Structures by Number of Rooms in Mason County
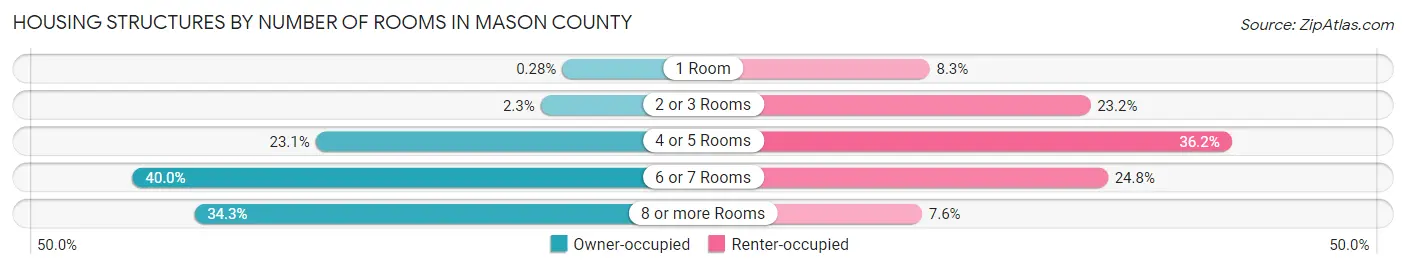
| Number of Rooms | Owner-occupied | Renter-occupied |
| 1 Room | 13 (0.3%) | 174 (8.3%) |
| 2 or 3 Rooms | 105 (2.3%) | 486 (23.2%) |
| 4 or 5 Rooms | 1,061 (23.1%) | 760 (36.2%) |
| 6 or 7 Rooms | 1,840 (40.0%) | 520 (24.8%) |
| 8 or more Rooms | 1,577 (34.3%) | 159 (7.6%) |
| Total | 4,596 (100.0%) | 2,099 (100.0%) |
Housing Structure by Heating Type in Mason County
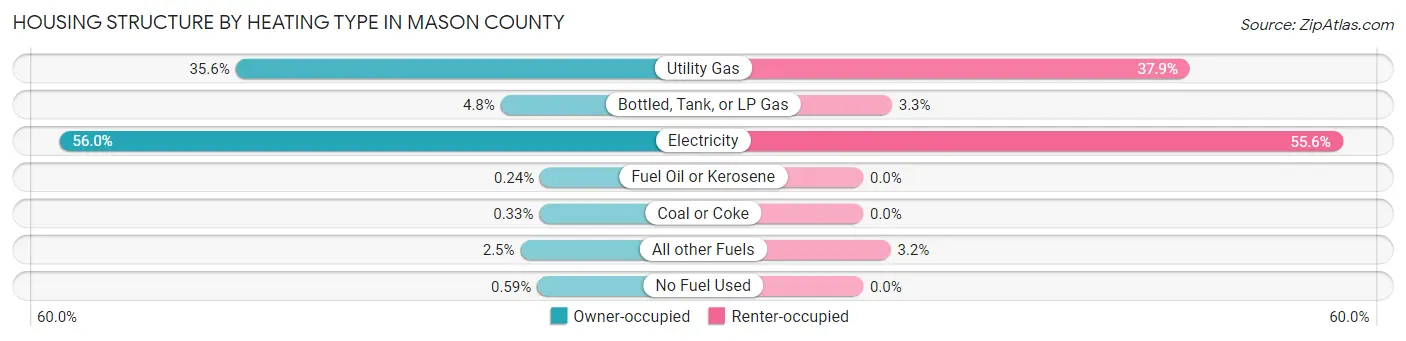
| Heating Type | Owner-occupied | Renter-occupied |
| Utility Gas | 1,634 (35.5%) | 795 (37.9%) |
| Bottled, Tank, or LP Gas | 221 (4.8%) | 70 (3.3%) |
| Electricity | 2,572 (56.0%) | 1,167 (55.6%) |
| Fuel Oil or Kerosene | 11 (0.2%) | 0 (0.0%) |
| Coal or Coke | 15 (0.3%) | 0 (0.0%) |
| All other Fuels | 116 (2.5%) | 67 (3.2%) |
| No Fuel Used | 27 (0.6%) | 0 (0.0%) |
| Total | 4,596 (100.0%) | 2,099 (100.0%) |
Household Vehicle Usage in Mason County
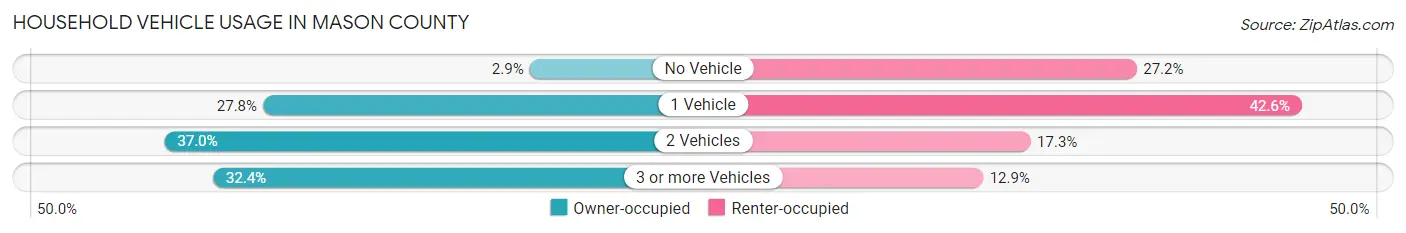
| Vehicles per Household | Owner-occupied | Renter-occupied |
| No Vehicle | 132 (2.9%) | 571 (27.2%) |
| 1 Vehicle | 1,276 (27.8%) | 895 (42.6%) |
| 2 Vehicles | 1,698 (36.9%) | 363 (17.3%) |
| 3 or more Vehicles | 1,490 (32.4%) | 270 (12.9%) |
| Total | 4,596 (100.0%) | 2,099 (100.0%) |
Real Estate & Mortgages in Mason County
Real Estate and Mortgage Overview in Mason County
| Characteristic | Without Mortgage | With Mortgage |
| Housing Units | 2,357 | 2,239 |
| Median Property Value | $138,600 | $171,100 |
| Median Household Income | $48,289 | $497 |
| Monthly Housing Costs | $405 | $24 |
| Real Estate Taxes | $776 | $62 |
Property Value by Mortgage Status in Mason County
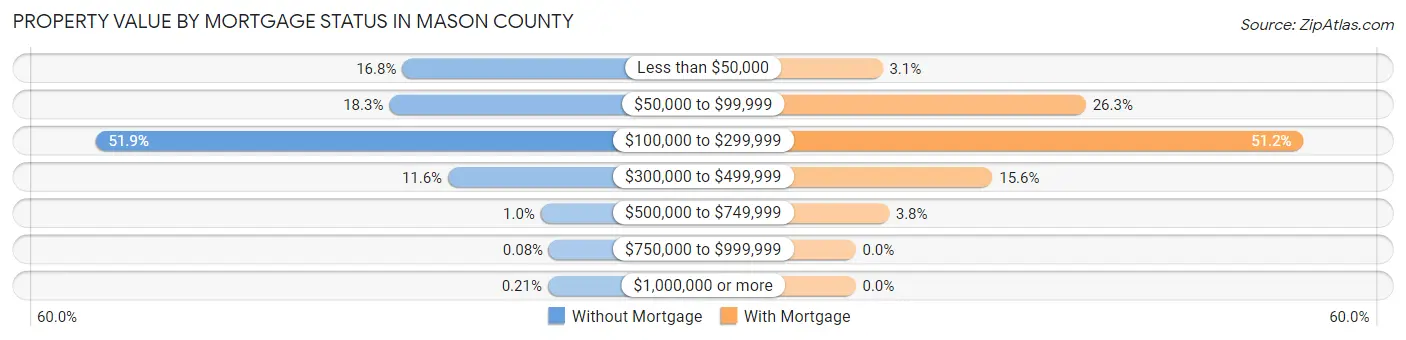
| Property Value | Without Mortgage | With Mortgage |
| Less than $50,000 | 397 (16.8%) | 69 (3.1%) |
| $50,000 to $99,999 | 432 (18.3%) | 589 (26.3%) |
| $100,000 to $299,999 | 1,223 (51.9%) | 1,146 (51.2%) |
| $300,000 to $499,999 | 274 (11.6%) | 350 (15.6%) |
| $500,000 to $749,999 | 24 (1.0%) | 85 (3.8%) |
| $750,000 to $999,999 | 2 (0.1%) | 0 (0.0%) |
| $1,000,000 or more | 5 (0.2%) | 0 (0.0%) |
| Total | 2,357 (100.0%) | 2,239 (100.0%) |
Household Income by Mortgage Status in Mason County
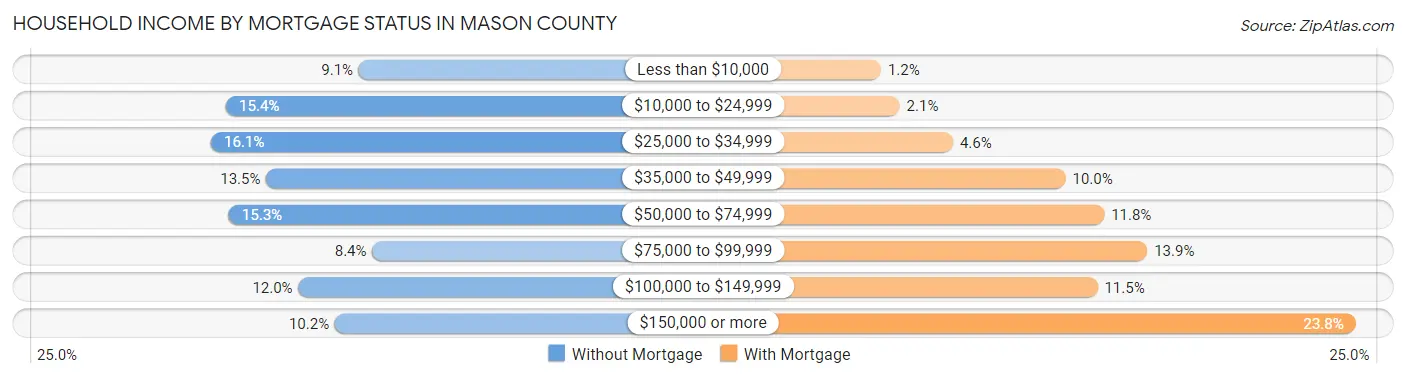
| Household Income | Without Mortgage | With Mortgage |
| Less than $10,000 | 214 (9.1%) | 27 (1.2%) |
| $10,000 to $24,999 | 363 (15.4%) | 47 (2.1%) |
| $25,000 to $34,999 | 380 (16.1%) | 104 (4.6%) |
| $35,000 to $49,999 | 318 (13.5%) | 224 (10.0%) |
| $50,000 to $74,999 | 360 (15.3%) | 265 (11.8%) |
| $75,000 to $99,999 | 199 (8.4%) | 311 (13.9%) |
| $100,000 to $149,999 | 282 (12.0%) | 258 (11.5%) |
| $150,000 or more | 241 (10.2%) | 533 (23.8%) |
| Total | 2,357 (100.0%) | 2,239 (100.0%) |
Property Value to Household Income Ratio in Mason County
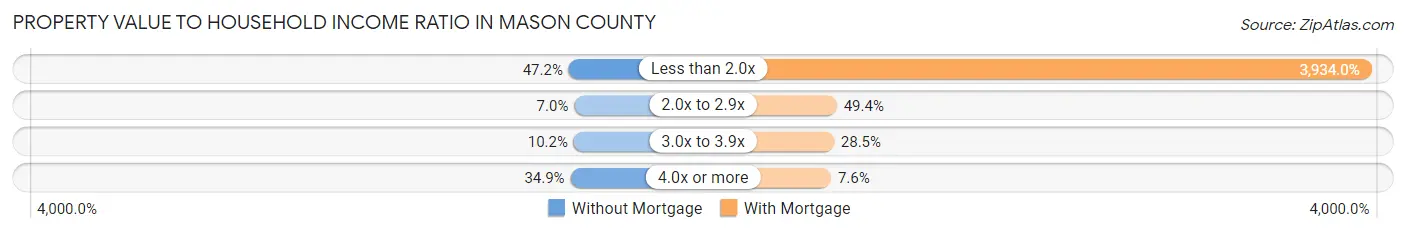
| Value-to-Income Ratio | Without Mortgage | With Mortgage |
| Less than 2.0x | 1,112 (47.2%) | 88,083 (3,934.0%) |
| 2.0x to 2.9x | 166 (7.0%) | 1,107 (49.4%) |
| 3.0x to 3.9x | 240 (10.2%) | 639 (28.5%) |
| 4.0x or more | 822 (34.9%) | 169 (7.5%) |
| Total | 2,357 (100.0%) | 2,239 (100.0%) |
Real Estate Taxes by Mortgage Status in Mason County
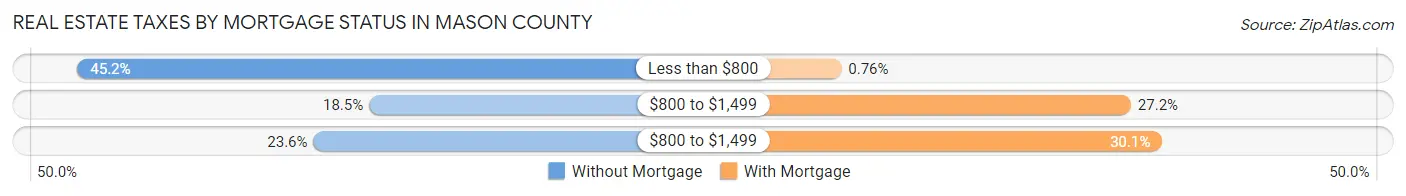
| Property Taxes | Without Mortgage | With Mortgage |
| Less than $800 | 1,065 (45.2%) | 17 (0.8%) |
| $800 to $1,499 | 437 (18.5%) | 609 (27.2%) |
| $800 to $1,499 | 557 (23.6%) | 673 (30.1%) |
| Total | 2,357 (100.0%) | 2,239 (100.0%) |
Health & Disability in Mason County
Health Insurance Coverage by Age in Mason County
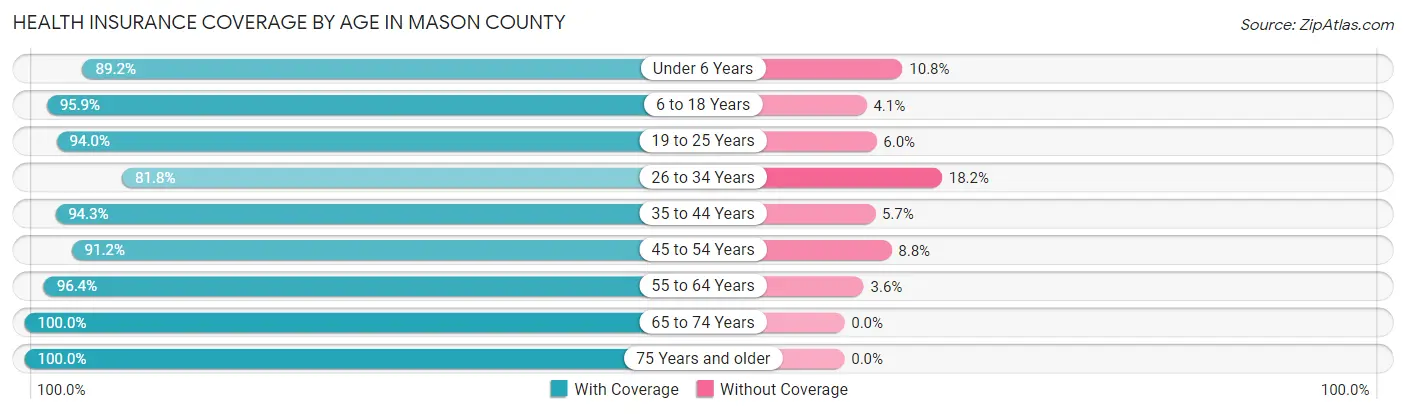
| Age Bracket | With Coverage | Without Coverage |
| Under 6 Years | 1,062 (89.2%) | 129 (10.8%) |
| 6 to 18 Years | 2,736 (95.9%) | 118 (4.1%) |
| 19 to 25 Years | 1,197 (94.0%) | 76 (6.0%) |
| 26 to 34 Years | 1,400 (81.8%) | 311 (18.2%) |
| 35 to 44 Years | 1,911 (94.3%) | 116 (5.7%) |
| 45 to 54 Years | 1,998 (91.2%) | 192 (8.8%) |
| 55 to 64 Years | 2,330 (96.4%) | 87 (3.6%) |
| 65 to 74 Years | 2,050 (100.0%) | 0 (0.0%) |
| 75 Years and older | 1,081 (100.0%) | 0 (0.0%) |
| Total | 15,765 (93.9%) | 1,029 (6.1%) |
Health Insurance Coverage by Citizenship Status in Mason County
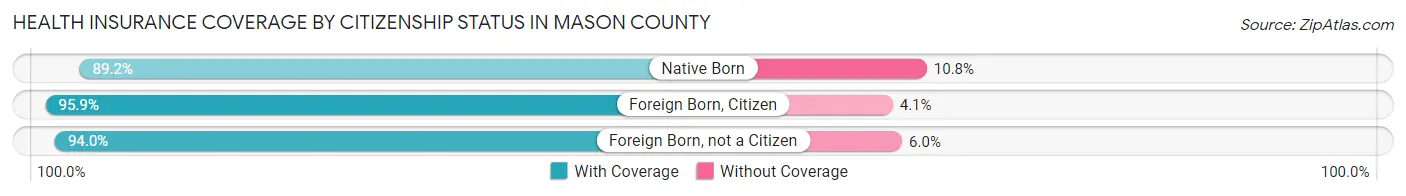
| Citizenship Status | With Coverage | Without Coverage |
| Native Born | 1,062 (89.2%) | 129 (10.8%) |
| Foreign Born, Citizen | 2,736 (95.9%) | 118 (4.1%) |
| Foreign Born, not a Citizen | 1,197 (94.0%) | 76 (6.0%) |
Health Insurance Coverage by Household Income in Mason County
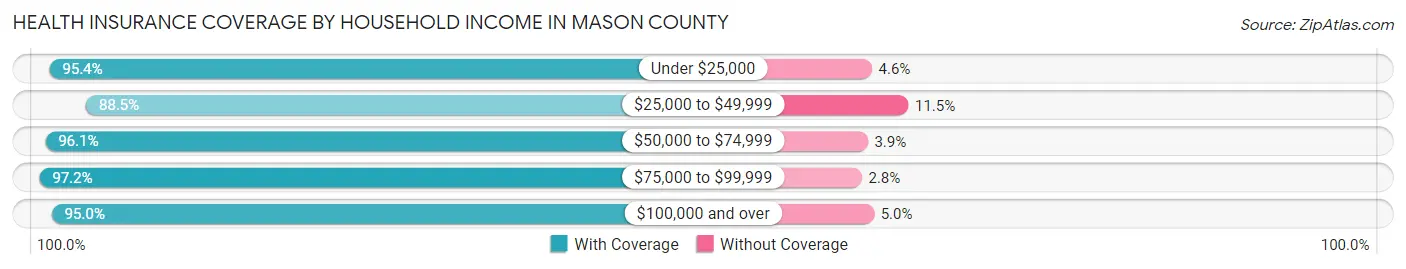
| Household Income | With Coverage | Without Coverage |
| Under $25,000 | 2,855 (95.4%) | 139 (4.6%) |
| $25,000 to $49,999 | 3,502 (88.5%) | 454 (11.5%) |
| $50,000 to $74,999 | 2,338 (96.1%) | 94 (3.9%) |
| $75,000 to $99,999 | 1,339 (97.2%) | 38 (2.8%) |
| $100,000 and over | 5,731 (95.0%) | 304 (5.0%) |
Public vs Private Health Insurance Coverage by Age in Mason County
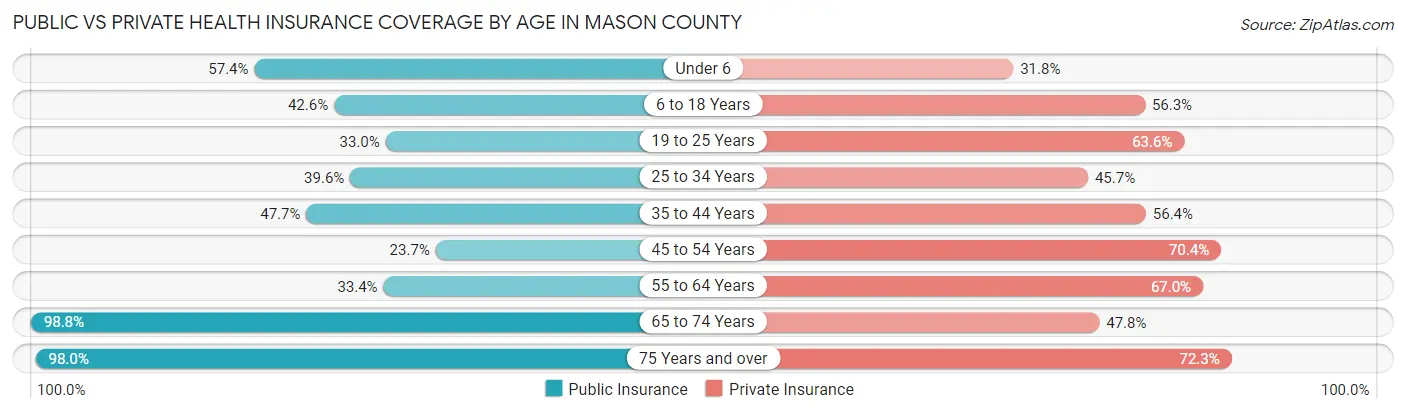
| Age Bracket | Public Insurance | Private Insurance |
| Under 6 | 683 (57.4%) | 379 (31.8%) |
| 6 to 18 Years | 1,215 (42.6%) | 1,606 (56.3%) |
| 19 to 25 Years | 420 (33.0%) | 809 (63.5%) |
| 25 to 34 Years | 677 (39.6%) | 782 (45.7%) |
| 35 to 44 Years | 967 (47.7%) | 1,144 (56.4%) |
| 45 to 54 Years | 519 (23.7%) | 1,542 (70.4%) |
| 55 to 64 Years | 807 (33.4%) | 1,620 (67.0%) |
| 65 to 74 Years | 2,026 (98.8%) | 980 (47.8%) |
| 75 Years and over | 1,059 (98.0%) | 782 (72.3%) |
| Total | 8,373 (49.9%) | 9,644 (57.4%) |
Disability Status by Sex by Age in Mason County
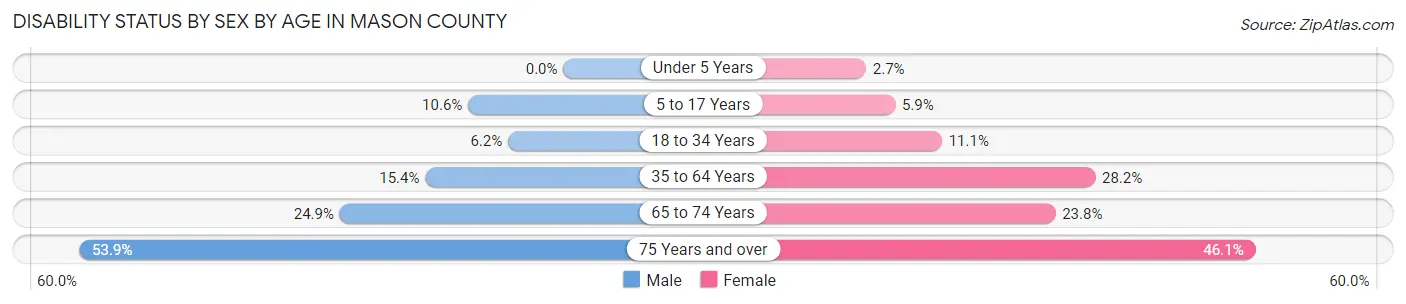
| Age Bracket | Male | Female |
| Under 5 Years | 0 (0.0%) | 15 (2.7%) |
| 5 to 17 Years | 160 (10.6%) | 82 (5.9%) |
| 18 to 34 Years | 100 (6.2%) | 168 (11.1%) |
| 35 to 64 Years | 487 (15.4%) | 977 (28.2%) |
| 65 to 74 Years | 257 (24.9%) | 242 (23.8%) |
| 75 Years and over | 233 (53.9%) | 299 (46.1%) |
Disability Class by Sex by Age in Mason County
Disability Class: Hearing Difficulty
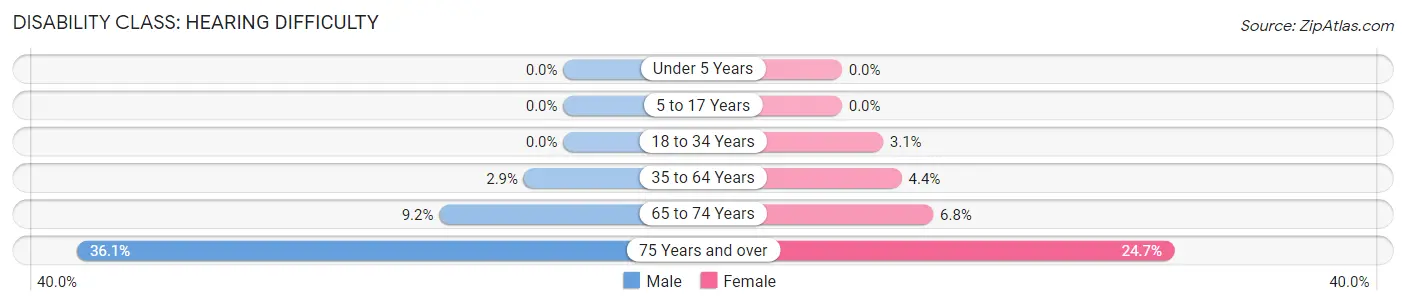
| Age Bracket | Male | Female |
| Under 5 Years | 0 (0.0%) | 0 (0.0%) |
| 5 to 17 Years | 0 (0.0%) | 0 (0.0%) |
| 18 to 34 Years | 0 (0.0%) | 46 (3.0%) |
| 35 to 64 Years | 93 (2.9%) | 154 (4.4%) |
| 65 to 74 Years | 95 (9.2%) | 69 (6.8%) |
| 75 Years and over | 156 (36.1%) | 160 (24.6%) |
Disability Class: Vision Difficulty
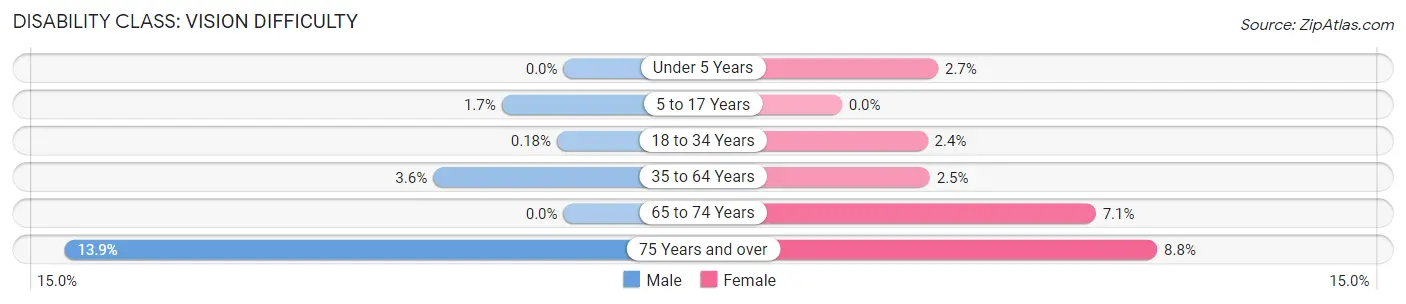
| Age Bracket | Male | Female |
| Under 5 Years | 0 (0.0%) | 15 (2.7%) |
| 5 to 17 Years | 26 (1.7%) | 0 (0.0%) |
| 18 to 34 Years | 3 (0.2%) | 36 (2.4%) |
| 35 to 64 Years | 115 (3.6%) | 85 (2.5%) |
| 65 to 74 Years | 0 (0.0%) | 72 (7.1%) |
| 75 Years and over | 60 (13.9%) | 57 (8.8%) |
Disability Class: Cognitive Difficulty
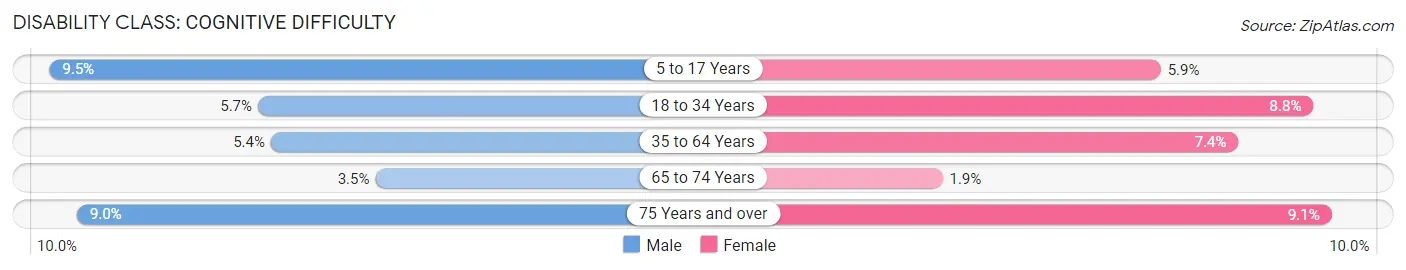
| Age Bracket | Male | Female |
| 5 to 17 Years | 144 (9.5%) | 82 (5.9%) |
| 18 to 34 Years | 92 (5.7%) | 132 (8.7%) |
| 35 to 64 Years | 172 (5.4%) | 255 (7.4%) |
| 65 to 74 Years | 36 (3.5%) | 19 (1.9%) |
| 75 Years and over | 39 (9.0%) | 59 (9.1%) |
Disability Class: Ambulatory Difficulty
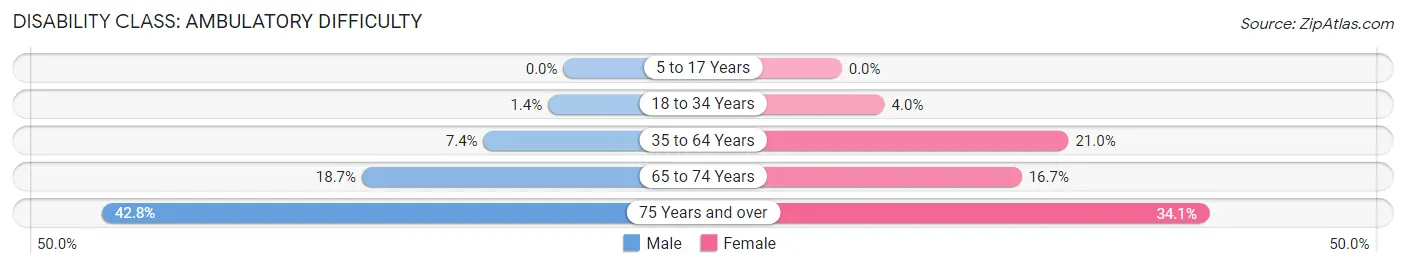
| Age Bracket | Male | Female |
| 5 to 17 Years | 0 (0.0%) | 0 (0.0%) |
| 18 to 34 Years | 23 (1.4%) | 60 (4.0%) |
| 35 to 64 Years | 235 (7.4%) | 729 (21.0%) |
| 65 to 74 Years | 193 (18.7%) | 170 (16.7%) |
| 75 Years and over | 185 (42.8%) | 221 (34.1%) |
Disability Class: Self-Care Difficulty
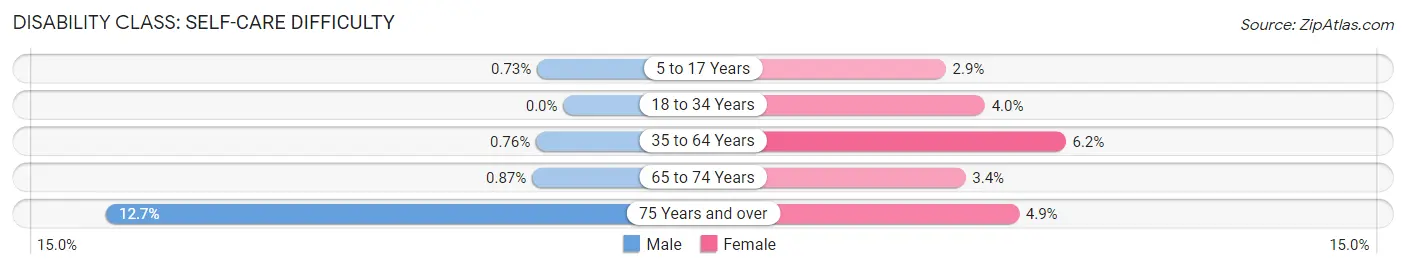
| Age Bracket | Male | Female |
| 5 to 17 Years | 11 (0.7%) | 40 (2.9%) |
| 18 to 34 Years | 0 (0.0%) | 60 (4.0%) |
| 35 to 64 Years | 24 (0.8%) | 216 (6.2%) |
| 65 to 74 Years | 9 (0.9%) | 35 (3.4%) |
| 75 Years and over | 55 (12.7%) | 32 (4.9%) |
Technology Access in Mason County
Computing Device Access in Mason County
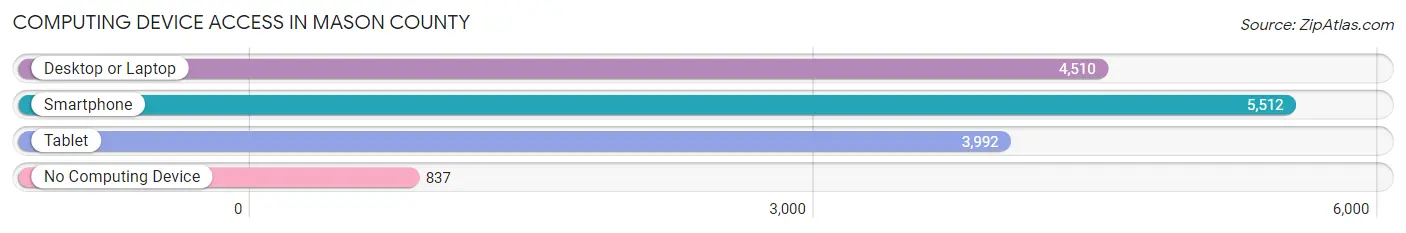
| Device Type | # Households | % Households |
| Desktop or Laptop | 4,510 | 67.4% |
| Smartphone | 5,512 | 82.3% |
| Tablet | 3,992 | 59.6% |
| No Computing Device | 837 | 12.5% |
| Total | 6,695 | 100.0% |
Internet Access in Mason County
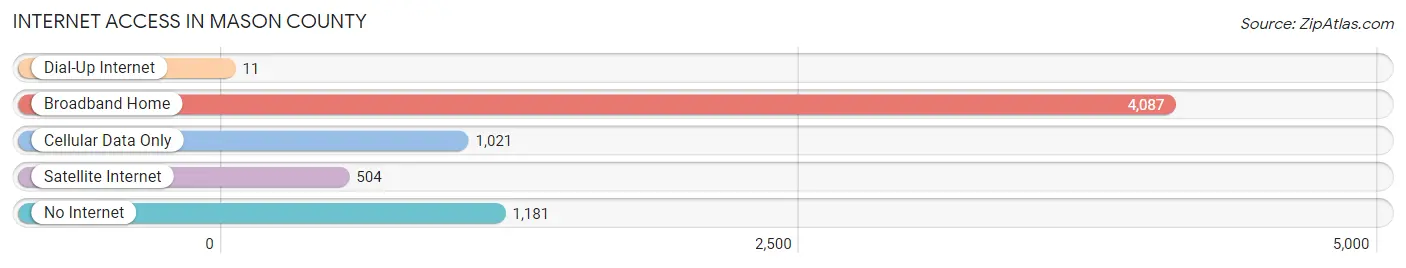
| Internet Type | # Households | % Households |
| Dial-Up Internet | 11 | 0.2% |
| Broadband Home | 4,087 | 61.1% |
| Cellular Data Only | 1,021 | 15.2% |
| Satellite Internet | 504 | 7.5% |
| No Internet | 1,181 | 17.6% |
| Total | 6,695 | 100.0% |
Mason County Summary
Mason County is located in the northeastern part of Kentucky, and is part of the Bluegrass Region. It is bordered by Lewis County to the north, Robertson County to the east, Bracken County to the south, and Fleming County to the west. The county seat is Maysville, which is also the largest city in the county. The county was established in 1788 and named after George Mason, a Founding Father of the United States.
Geography
Mason County covers an area of approximately 300 square miles and is located in the Bluegrass Region of Kentucky. The county is mostly flat, with some rolling hills in the northern and western parts. The county is drained by the Ohio River, which forms its northern border. The county is also home to several creeks, including Limestone Creek, which flows through the county seat of Maysville.
The climate of Mason County is humid subtropical, with hot, humid summers and cold, wet winters. The average annual temperature is around 57°F, and the average annual precipitation is around 44 inches.
Economy
Mason County has a diverse economy, with a mix of manufacturing, agriculture, and tourism. The county is home to several large manufacturing companies, including the Maysville Manufacturing Company, which produces furniture, and the Maysville Glass Company, which produces glass products.
Agriculture is also an important part of the county’s economy. The county is home to several large farms, which produce corn, soybeans, wheat, hay, and other crops. Livestock production is also important, with cattle, hogs, and poultry being raised in the county.
Tourism is also an important part of the county’s economy. The county is home to several attractions, including the Maysville Aquarium, the Maysville Historic District, and the Mason County Historical Society Museum.
Demographics
As of the 2010 census, Mason County had a population of 17,490. The population was spread out, with 48.3% male and 51.7% female. The median age was 41.7 years. The racial makeup of the county was 95.2% White, 2.3% African American, 0.3% Native American, 0.4% Asian, 0.1% Pacific Islander, 0.7% from other races, and 0.9% from two or more races. Hispanic or Latino of any race were 1.7% of the population.
The median household income in Mason County was $41,945, and the median family income was $50,945. The per capita income was $20,945. About 11.2% of the population was below the poverty line.
Conclusion
Mason County is a diverse county located in the Bluegrass Region of Kentucky. It has a mix of manufacturing, agriculture, and tourism, and is home to several attractions. The population is mostly White, with a median age of 41.7 years. The median household income is $41,945, and the per capita income is $20,945. Mason County is a great place to live, work, and visit.
Common Questions
What is Per Capita Income in Mason County?
Per Capita income in Mason County is $33,842.
What is the Median Family Income in Mason County?
Median Family Income in Mason County is $64,817.
What is the Median Household income in Mason County?
Median Household Income in Mason County is $48,460.
What is Income or Wage Gap in Mason County?
Income or Wage Gap in Mason County is 25.1%.
Women in Mason County earn 74.9 cents for every dollar earned by a man.
What is Family Income Deficit in Mason County?
Family Income Deficit in Mason County is $10,352.
Families that are below poverty line in Mason County earn $10,352 less on average than the poverty threshold level.
What is Inequality or Gini Index in Mason County?
Inequality or Gini Index in Mason County is 0.54.
What is the Total Population of Mason County?
Total Population of Mason County is 17,068.
What is the Total Male Population of Mason County?
Total Male Population of Mason County is 8,367.
What is the Total Female Population of Mason County?
Total Female Population of Mason County is 8,701.
What is the Ratio of Males per 100 Females in Mason County?
There are 96.16 Males per 100 Females in Mason County.
What is the Ratio of Females per 100 Males in Mason County?
There are 103.99 Females per 100 Males in Mason County.
What is the Median Population Age in Mason County?
Median Population Age in Mason County is 42.1 Years.
What is the Average Family Size in Mason County
Average Family Size in Mason County is 3.1 People.
What is the Average Household Size in Mason County
Average Household Size in Mason County is 2.5 People.
How Large is the Labor Force in Mason County?
There are 7,646 People in the Labor Forcein in Mason County.
What is the Percentage of People in the Labor Force in Mason County?
56.5% of People are in the Labor Force in Mason County.
What is the Unemployment Rate in Mason County?
Unemployment Rate in Mason County is 4.7%.