Magoffin County, KY Map & Demographics
Magoffin County Map
Magoffin County Overview
$19,582
PER CAPITA INCOME
$40,097
AVG FAMILY INCOME
$31,927
AVG HOUSEHOLD INCOME
35.6%
WAGE / INCOME GAP [ % ]
64.4¢/ $1
WAGE / INCOME GAP [ $ ]
$10,011
FAMILY INCOME DEFICIT
0.49
INEQUALITY / GINI INDEX
11,647
TOTAL POPULATION
5,888
MALE POPULATION
5,759
FEMALE POPULATION
102.24
MALES / 100 FEMALES
97.81
FEMALES / 100 MALES
41.4
MEDIAN AGE
3.2
AVG FAMILY SIZE
2.5
AVG HOUSEHOLD SIZE
3,422
LABOR FORCE [ PEOPLE ]
36.8%
PERCENT IN LABOR FORCE
12.8%
UNEMPLOYMENT RATE
Magoffin County Area Codes
Income in Magoffin County
Income Overview in Magoffin County
Per Capita Income in Magoffin County is $19,582, while median incomes of families and households are $40,097 and $31,927 respectively.
| Characteristic | Number | Measure |
| Per Capita Income | 11,647 | $19,582 |
| Median Family Income | 2,982 | $40,097 |
| Mean Family Income | 2,982 | $59,424 |
| Median Household Income | 4,554 | $31,927 |
| Mean Household Income | 4,554 | $48,375 |
| Income Deficit | 2,982 | $10,011 |
| Wage / Income Gap (%) | 11,647 | 35.61% |
| Wage / Income Gap ($) | 11,647 | 64.39¢ per $1 |
| Gini / Inequality Index | 11,647 | 0.49 |
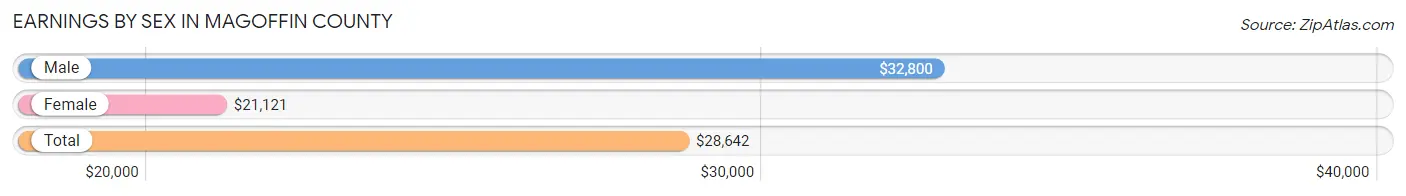
Earnings by Sex in Magoffin County
Average Earnings in Magoffin County are $28,642, $32,800 for men and $21,121 for women, a difference of 35.6%.
| Sex | Number | Average Earnings |
| Male | 1,870 (52.5%) | $32,800 |
| Female | 1,691 (47.5%) | $21,121 |
| Total | 3,561 (100.0%) | $28,642 |
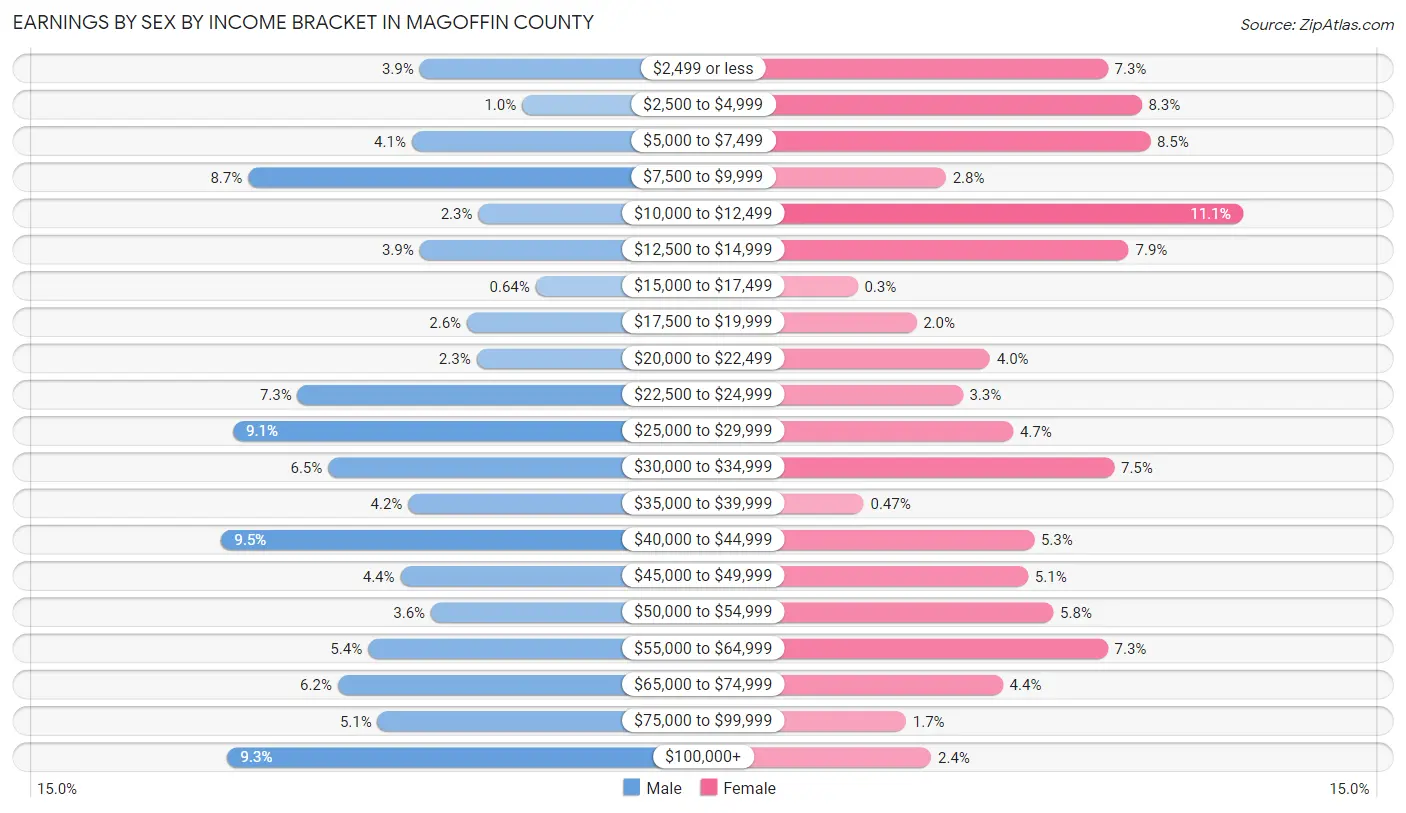
Earnings by Sex by Income Bracket in Magoffin County
The most common earnings brackets in Magoffin County are $40,000 to $44,999 for men (177 | 9.5%) and $10,000 to $12,499 for women (188 | 11.1%).
| Income | Male | Female |
| $2,499 or less | 73 (3.9%) | 124 (7.3%) |
| $2,500 to $4,999 | 19 (1.0%) | 140 (8.3%) |
| $5,000 to $7,499 | 77 (4.1%) | 144 (8.5%) |
| $7,500 to $9,999 | 163 (8.7%) | 47 (2.8%) |
| $10,000 to $12,499 | 42 (2.2%) | 188 (11.1%) |
| $12,500 to $14,999 | 73 (3.9%) | 134 (7.9%) |
| $15,000 to $17,499 | 12 (0.6%) | 5 (0.3%) |
| $17,500 to $19,999 | 48 (2.6%) | 33 (1.9%) |
| $20,000 to $22,499 | 43 (2.3%) | 68 (4.0%) |
| $22,500 to $24,999 | 137 (7.3%) | 55 (3.3%) |
| $25,000 to $29,999 | 171 (9.1%) | 79 (4.7%) |
| $30,000 to $34,999 | 121 (6.5%) | 127 (7.5%) |
| $35,000 to $39,999 | 79 (4.2%) | 8 (0.5%) |
| $40,000 to $44,999 | 177 (9.5%) | 89 (5.3%) |
| $45,000 to $49,999 | 83 (4.4%) | 86 (5.1%) |
| $50,000 to $54,999 | 67 (3.6%) | 98 (5.8%) |
| $55,000 to $64,999 | 100 (5.3%) | 124 (7.3%) |
| $65,000 to $74,999 | 116 (6.2%) | 74 (4.4%) |
| $75,000 to $99,999 | 95 (5.1%) | 28 (1.7%) |
| $100,000+ | 174 (9.3%) | 40 (2.4%) |
| Total | 1,870 (100.0%) | 1,691 (100.0%) |
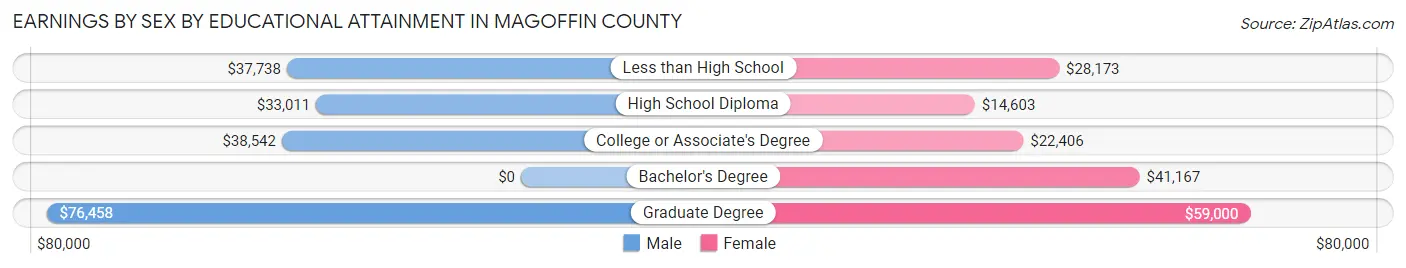
Earnings by Sex by Educational Attainment in Magoffin County
Average earnings in Magoffin County are $39,453 for men and $27,417 for women, a difference of 30.5%. Men with an educational attainment of graduate degree enjoy the highest average annual earnings of $76,458, while those with high school diploma education earn the least with $33,011. Women with an educational attainment of graduate degree earn the most with the average annual earnings of $59,000, while those with high school diploma education have the smallest earnings of $14,603.
| Educational Attainment | Male Income | Female Income |
| Less than High School | $37,738 | $28,173 |
| High School Diploma | $33,011 | $14,603 |
| College or Associate's Degree | $38,542 | $22,406 |
| Bachelor's Degree | - | - |
| Graduate Degree | $76,458 | $59,000 |
| Total | $39,453 | $27,417 |
Family Income in Magoffin County
Family Income Brackets in Magoffin County
According to the Magoffin County family income data, there are 537 families falling into the $25,000 to $34,999 income range, which is the most common income bracket and makes up 18.0% of all families. Conversely, the $150,000 to $199,999 income bracket is the least frequent group with only 66 families (2.2%) belonging to this category.
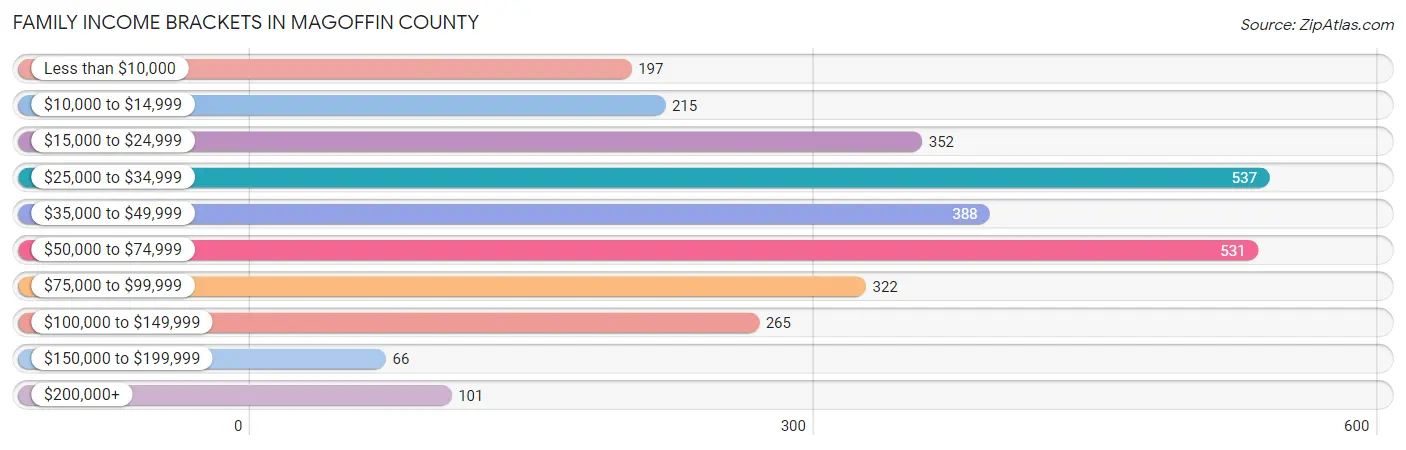
| Income Bracket | # Families | % Families |
| Less than $10,000 | 197 | 6.6% |
| $10,000 to $14,999 | 215 | 7.2% |
| $15,000 to $24,999 | 352 | 11.8% |
| $25,000 to $34,999 | 537 | 18.0% |
| $35,000 to $49,999 | 388 | 13.0% |
| $50,000 to $74,999 | 531 | 17.8% |
| $75,000 to $99,999 | 322 | 10.8% |
| $100,000 to $149,999 | 265 | 8.9% |
| $150,000 to $199,999 | 66 | 2.2% |
| $200,000+ | 101 | 3.4% |
Family Income by Famaliy Size in Magoffin County
4-person families (543 | 18.2%) account for the highest median family income in Magoffin County with $43,286 per family, while 2-person families (1,404 | 47.1%) have the highest median income of $18,689 per family member.
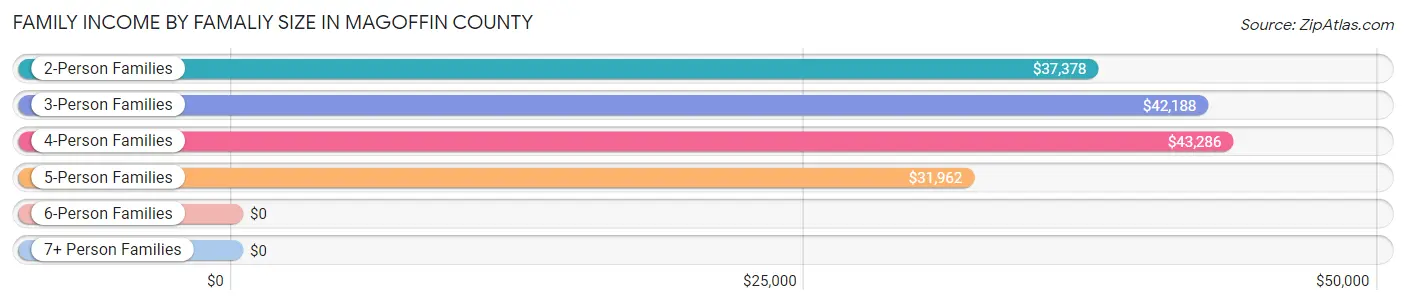
| Income Bracket | # Families | Median Income |
| 2-Person Families | 1,404 (47.1%) | $37,378 |
| 3-Person Families | 664 (22.3%) | $42,188 |
| 4-Person Families | 543 (18.2%) | $43,286 |
| 5-Person Families | 261 (8.7%) | $31,962 |
| 6-Person Families | 33 (1.1%) | $0 |
| 7+ Person Families | 77 (2.6%) | $0 |
| Total | 2,982 (100.0%) | $40,097 |
Family Income by Number of Earners in Magoffin County
The median family income in Magoffin County is $40,097, with families comprising 3+ earners (135) having the highest median family income of $133,958, while families with no earners (1,042) have the lowest median family income of $27,787, accounting for 4.5% and 34.9% of families, respectively.
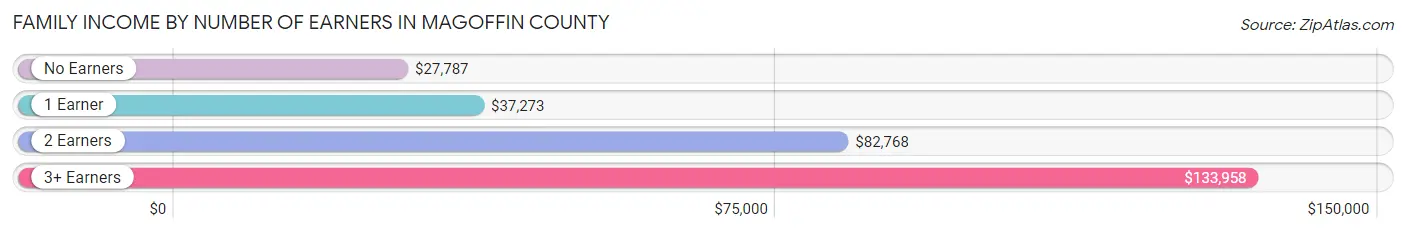
| Number of Earners | # Families | Median Income |
| No Earners | 1,042 (34.9%) | $27,787 |
| 1 Earner | 1,168 (39.2%) | $37,273 |
| 2 Earners | 637 (21.4%) | $82,768 |
| 3+ Earners | 135 (4.5%) | $133,958 |
| Total | 2,982 (100.0%) | $40,097 |
Household Income in Magoffin County
Household Income Brackets in Magoffin County
With 729 households falling in the category, the $15,000 to $24,999 income range is the most frequent in Magoffin County, accounting for 16.0% of all households. In contrast, only 100 households (2.2%) fall into the $150,000 to $199,999 income bracket, making it the least populous group.
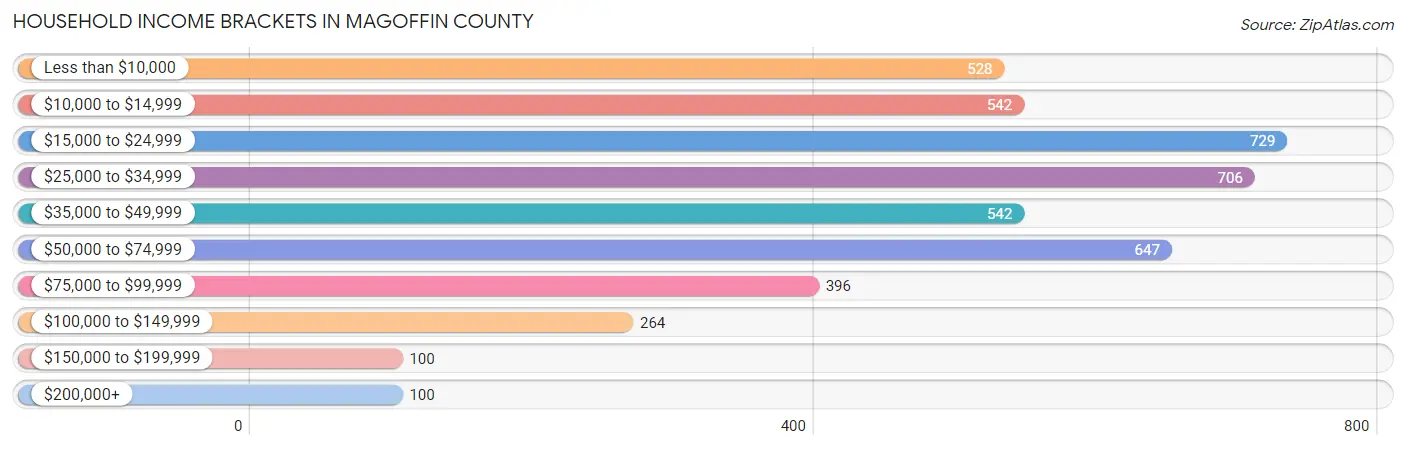
| Income Bracket | # Households | % Households |
| Less than $10,000 | 528 | 11.6% |
| $10,000 to $14,999 | 542 | 11.9% |
| $15,000 to $24,999 | 729 | 16.0% |
| $25,000 to $34,999 | 706 | 15.5% |
| $35,000 to $49,999 | 542 | 11.9% |
| $50,000 to $74,999 | 647 | 14.2% |
| $75,000 to $99,999 | 396 | 8.7% |
| $100,000 to $149,999 | 264 | 5.8% |
| $150,000 to $199,999 | 100 | 2.2% |
| $200,000+ | 100 | 2.2% |
Household Income by Householder Age in Magoffin County
The median household income in Magoffin County is $31,927, with the highest median household income of $40,875 found in the 25 to 44 years age bracket for the primary householder. A total of 1,158 households (25.4%) fall into this category. Meanwhile, the 15 to 24 years age bracket for the primary householder has the lowest median household income of $0, with 124 households (2.7%) in this group.
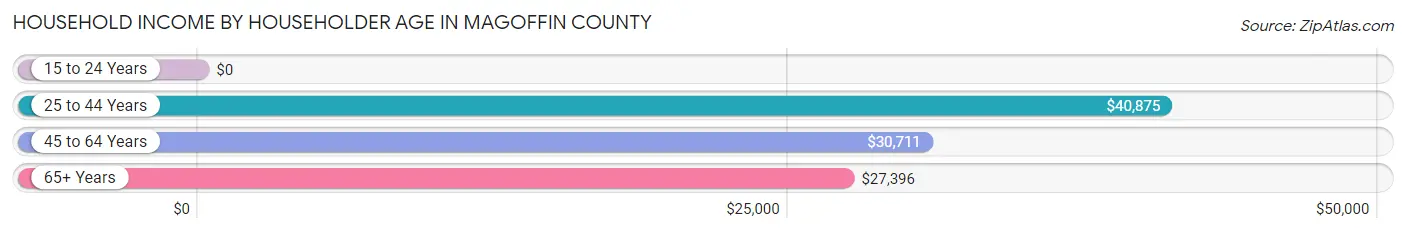
| Income Bracket | # Households | Median Income |
| 15 to 24 Years | 124 (2.7%) | $0 |
| 25 to 44 Years | 1,158 (25.4%) | $40,875 |
| 45 to 64 Years | 1,991 (43.7%) | $30,711 |
| 65+ Years | 1,281 (28.1%) | $27,396 |
| Total | 4,554 (100.0%) | $31,927 |
Poverty in Magoffin County
Income Below Poverty by Sex and Age in Magoffin County
With 29.2% poverty level for males and 31.8% for females among the residents of Magoffin County, 15 year old males and 5 year old females are the most vulnerable to poverty, with 57 males (77.0%) and 19 females (55.9%) in their respective age groups living below the poverty level.
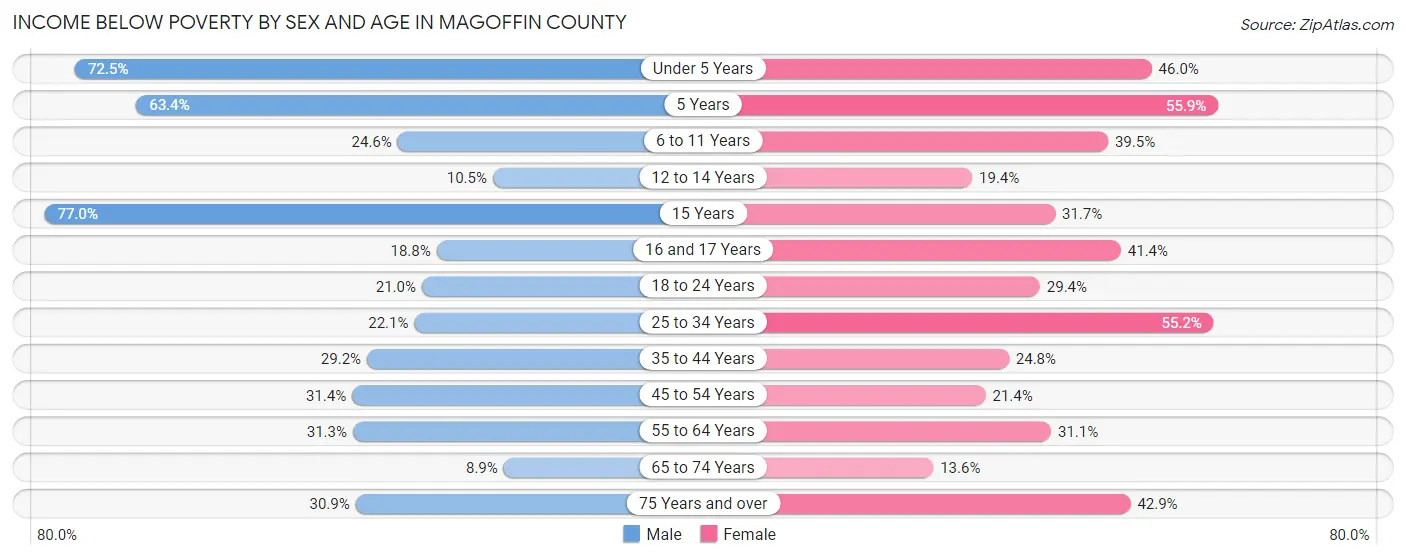
| Age Bracket | Male | Female |
| Under 5 Years | 269 (72.5%) | 150 (46.0%) |
| 5 Years | 52 (63.4%) | 19 (55.9%) |
| 6 to 11 Years | 143 (24.6%) | 151 (39.5%) |
| 12 to 14 Years | 9 (10.5%) | 54 (19.4%) |
| 15 Years | 57 (77.0%) | 38 (31.7%) |
| 16 and 17 Years | 29 (18.8%) | 46 (41.4%) |
| 18 to 24 Years | 91 (21.0%) | 120 (29.4%) |
| 25 to 34 Years | 157 (22.1%) | 360 (55.2%) |
| 35 to 44 Years | 194 (29.2%) | 166 (24.8%) |
| 45 to 54 Years | 268 (31.4%) | 165 (21.3%) |
| 55 to 64 Years | 278 (31.3%) | 265 (31.1%) |
| 65 to 74 Years | 54 (8.9%) | 88 (13.6%) |
| 75 Years and over | 100 (30.9%) | 180 (42.9%) |
| Total | 1,701 (29.2%) | 1,802 (31.8%) |
Income Above Poverty by Sex and Age in Magoffin County
According to the poverty statistics in Magoffin County, males aged 65 to 74 years and females aged 65 to 74 years are the age groups that are most secure financially, with 91.1% of males and 86.4% of females in these age groups living above the poverty line.
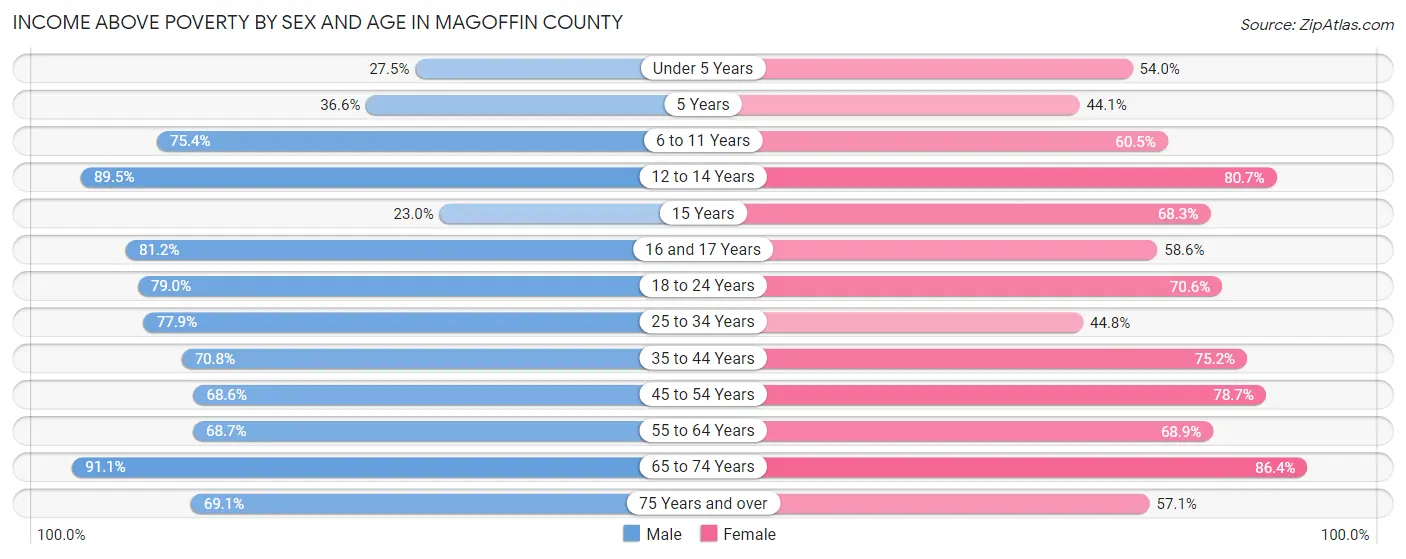
| Age Bracket | Male | Female |
| Under 5 Years | 102 (27.5%) | 176 (54.0%) |
| 5 Years | 30 (36.6%) | 15 (44.1%) |
| 6 to 11 Years | 438 (75.4%) | 231 (60.5%) |
| 12 to 14 Years | 77 (89.5%) | 225 (80.6%) |
| 15 Years | 17 (23.0%) | 82 (68.3%) |
| 16 and 17 Years | 125 (81.2%) | 65 (58.6%) |
| 18 to 24 Years | 342 (79.0%) | 288 (70.6%) |
| 25 to 34 Years | 552 (77.9%) | 292 (44.8%) |
| 35 to 44 Years | 471 (70.8%) | 503 (75.2%) |
| 45 to 54 Years | 586 (68.6%) | 608 (78.6%) |
| 55 to 64 Years | 611 (68.7%) | 588 (68.9%) |
| 65 to 74 Years | 555 (91.1%) | 560 (86.4%) |
| 75 Years and over | 224 (69.1%) | 240 (57.1%) |
| Total | 4,130 (70.8%) | 3,873 (68.2%) |
Income Below Poverty Among Married-Couple Families in Magoffin County
The poverty statistics for married-couple families in Magoffin County show that 19.7% or 391 of the total 1,989 families live below the poverty line. Families with 3 or 4 children have the highest poverty rate of 51.1%, comprising of 117 families. On the other hand, families with 5 or more children have the lowest poverty rate of 0.0%, which includes 0 families.
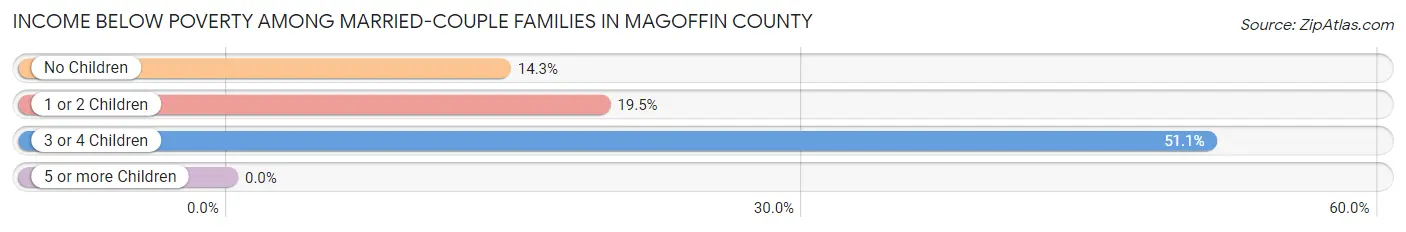
| Children | Above Poverty | Below Poverty |
| No Children | 1,095 (85.8%) | 182 (14.2%) |
| 1 or 2 Children | 381 (80.5%) | 92 (19.5%) |
| 3 or 4 Children | 112 (48.9%) | 117 (51.1%) |
| 5 or more Children | 10 (100.0%) | 0 (0.0%) |
| Total | 1,598 (80.3%) | 391 (19.7%) |
Income Below Poverty Among Single-Parent Households in Magoffin County
According to the poverty data in Magoffin County, 59.7% or 207 single-father households and 22.9% or 148 single-mother households are living below the poverty line. Among single-father households, those with 3 or 4 children have the highest poverty rate, with 52 households (85.3%) experiencing poverty. Likewise, among single-mother households, those with 1 or 2 children have the highest poverty rate, with 126 households (40.8%) falling below the poverty line.
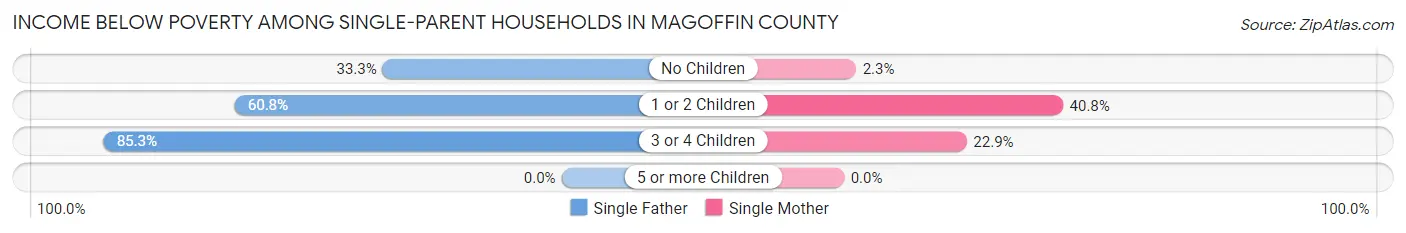
| Children | Single Father | Single Mother |
| No Children | 23 (33.3%) | 6 (2.2%) |
| 1 or 2 Children | 132 (60.8%) | 126 (40.8%) |
| 3 or 4 Children | 52 (85.3%) | 16 (22.9%) |
| 5 or more Children | 0 (0.0%) | 0 (0.0%) |
| Total | 207 (59.7%) | 148 (22.9%) |
Income Below Poverty Among Married-Couple vs Single-Parent Households in Magoffin County
The poverty data for Magoffin County shows that 391 of the married-couple family households (19.7%) and 355 of the single-parent households (35.7%) are living below the poverty level. Within the married-couple family households, those with 3 or 4 children have the highest poverty rate, with 117 households (51.1%) falling below the poverty line. Among the single-parent households, those with 3 or 4 children have the highest poverty rate, with 68 household (51.9%) living below poverty.
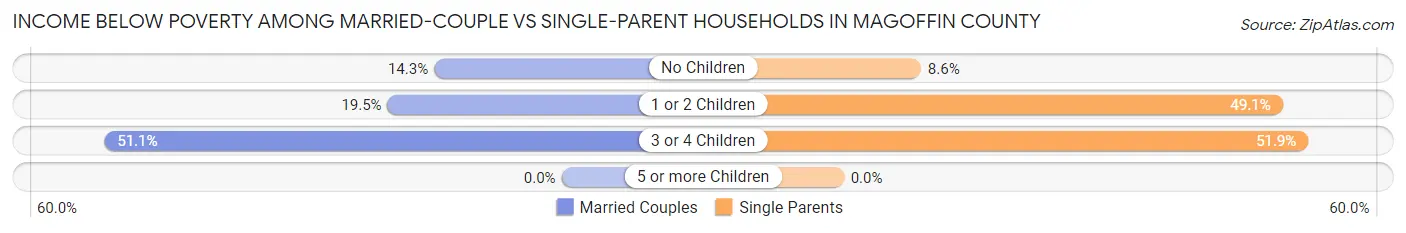
| Children | Married-Couple Families | Single-Parent Households |
| No Children | 182 (14.2%) | 29 (8.6%) |
| 1 or 2 Children | 92 (19.5%) | 258 (49.0%) |
| 3 or 4 Children | 117 (51.1%) | 68 (51.9%) |
| 5 or more Children | 0 (0.0%) | 0 (0.0%) |
| Total | 391 (19.7%) | 355 (35.7%) |
Race in Magoffin County
The most populous races in Magoffin County are White / Caucasian (11,404 | 97.9%), Hispanic or Latino (152 | 1.3%), and Two or more Races (139 | 1.2%).
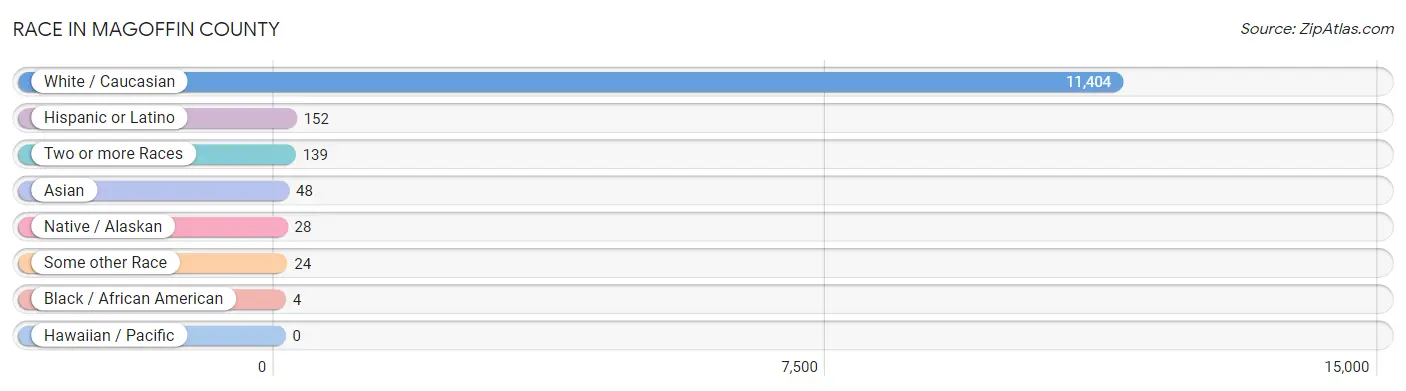
| Race | # Population | % Population |
| Asian | 48 | 0.4% |
| Black / African American | 4 | 0.0% |
| Hawaiian / Pacific | 0 | 0.0% |
| Hispanic or Latino | 152 | 1.3% |
| Native / Alaskan | 28 | 0.2% |
| White / Caucasian | 11,404 | 97.9% |
| Two or more Races | 139 | 1.2% |
| Some other Race | 24 | 0.2% |
| Total | 11,647 | 100.0% |
Ancestry in Magoffin County
The most populous ancestries reported in Magoffin County are American (3,866 | 33.2%), Irish (1,301 | 11.2%), German (1,029 | 8.8%), English (893 | 7.7%), and Scottish (198 | 1.7%), together accounting for 62.6% of all Magoffin County residents.
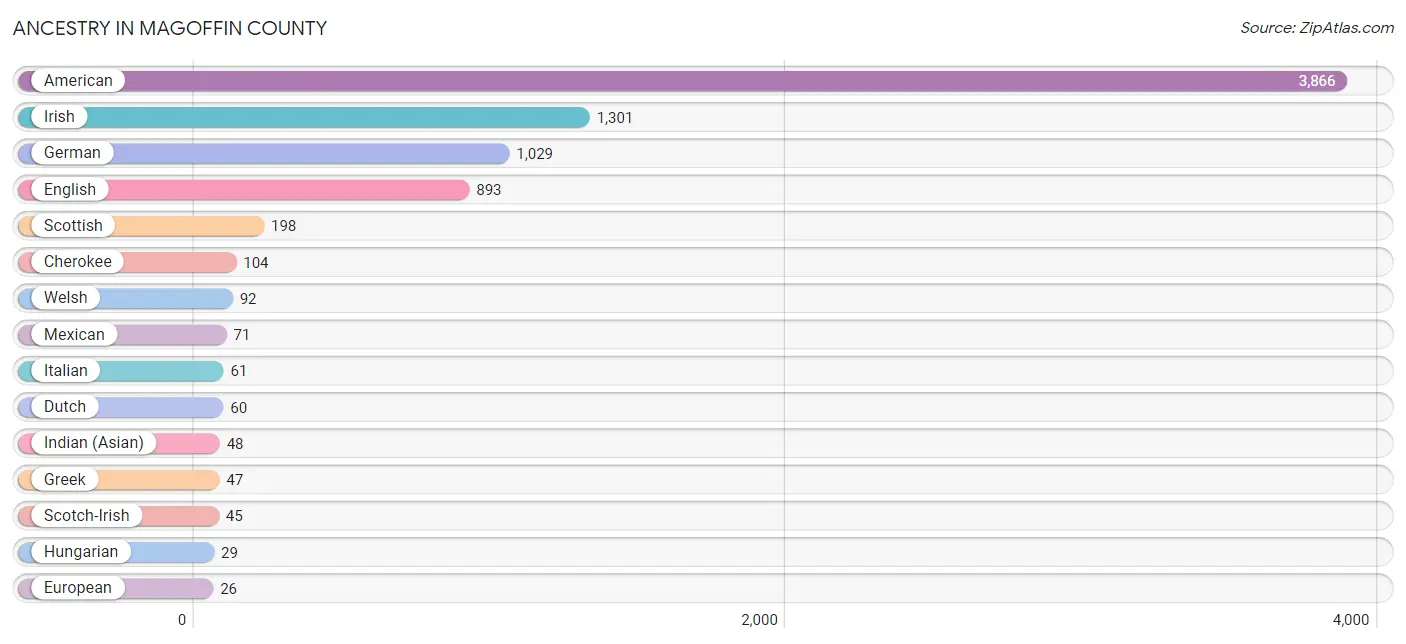
| Ancestry | # Population | % Population |
| American | 3,866 | 33.2% |
| Cherokee | 104 | 0.9% |
| Dutch | 60 | 0.5% |
| Eastern European | 5 | 0.0% |
| English | 893 | 7.7% |
| European | 26 | 0.2% |
| French | 5 | 0.0% |
| German | 1,029 | 8.8% |
| Greek | 47 | 0.4% |
| Hungarian | 29 | 0.3% |
| Indian (Asian) | 48 | 0.4% |
| Irish | 1,301 | 11.2% |
| Italian | 61 | 0.5% |
| Mexican | 71 | 0.6% |
| Norwegian | 20 | 0.2% |
| Polish | 26 | 0.2% |
| Scotch-Irish | 45 | 0.4% |
| Scottish | 198 | 1.7% |
| Welsh | 92 | 0.8% | View All 19 Rows |
Immigrants in Magoffin County
The most numerous immigrant groups reported in Magoffin County came from Asia (48 | 0.4%), China (48 | 0.4%), Eastern Asia (48 | 0.4%), Taiwan (48 | 0.4%), and Central America (24 | 0.2%), together accounting for 1.9% of all Magoffin County residents.
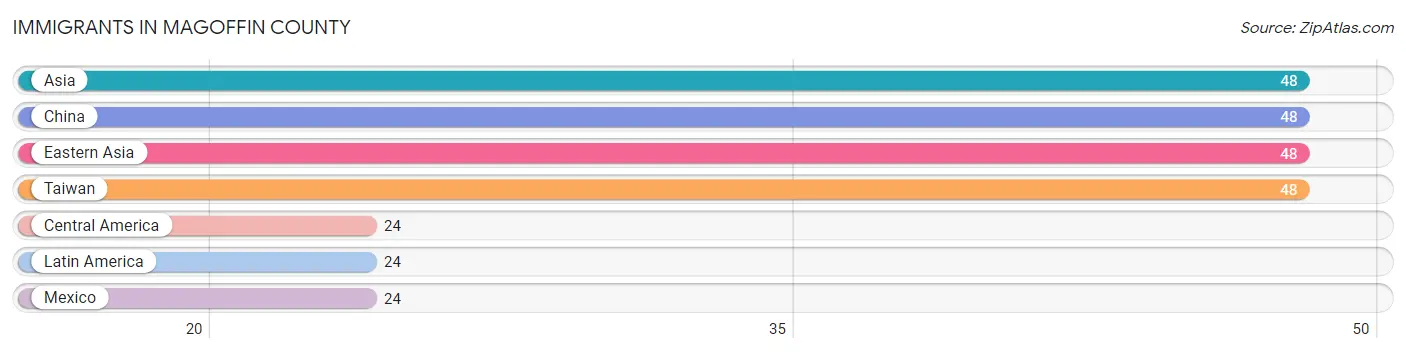
| Immigration Origin | # Population | % Population |
| Asia | 48 | 0.4% |
| Central America | 24 | 0.2% |
| China | 48 | 0.4% |
| Eastern Asia | 48 | 0.4% |
| Latin America | 24 | 0.2% |
| Mexico | 24 | 0.2% |
| Taiwan | 48 | 0.4% | View All 7 Rows |
Sex and Age in Magoffin County
Sex and Age in Magoffin County
The most populous age groups in Magoffin County are 60 to 64 Years (498 | 8.5%) for men and 60 to 64 Years (512 | 8.9%) for women.
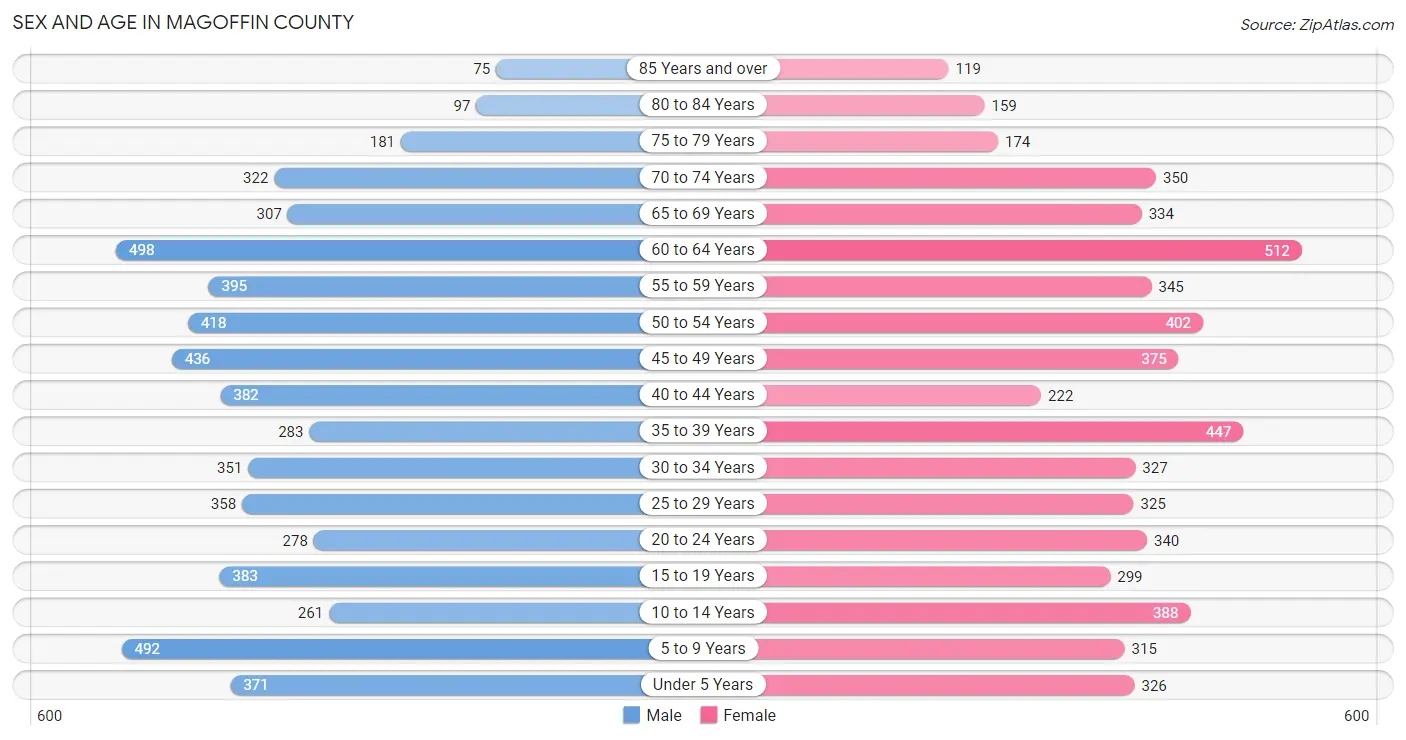
| Age Bracket | Male | Female |
| Under 5 Years | 371 (6.3%) | 326 (5.7%) |
| 5 to 9 Years | 492 (8.4%) | 315 (5.5%) |
| 10 to 14 Years | 261 (4.4%) | 388 (6.7%) |
| 15 to 19 Years | 383 (6.5%) | 299 (5.2%) |
| 20 to 24 Years | 278 (4.7%) | 340 (5.9%) |
| 25 to 29 Years | 358 (6.1%) | 325 (5.6%) |
| 30 to 34 Years | 351 (6.0%) | 327 (5.7%) |
| 35 to 39 Years | 283 (4.8%) | 447 (7.8%) |
| 40 to 44 Years | 382 (6.5%) | 222 (3.8%) |
| 45 to 49 Years | 436 (7.4%) | 375 (6.5%) |
| 50 to 54 Years | 418 (7.1%) | 402 (7.0%) |
| 55 to 59 Years | 395 (6.7%) | 345 (6.0%) |
| 60 to 64 Years | 498 (8.5%) | 512 (8.9%) |
| 65 to 69 Years | 307 (5.2%) | 334 (5.8%) |
| 70 to 74 Years | 322 (5.5%) | 350 (6.1%) |
| 75 to 79 Years | 181 (3.1%) | 174 (3.0%) |
| 80 to 84 Years | 97 (1.7%) | 159 (2.8%) |
| 85 Years and over | 75 (1.3%) | 119 (2.1%) |
| Total | 5,888 (100.0%) | 5,759 (100.0%) |
Families and Households in Magoffin County
Median Family Size in Magoffin County
The median family size in Magoffin County is 3.19 persons per family, with single female/mother families (646 | 21.7%) accounting for the largest median family size of 3.41 persons per family. On the other hand, married-couple families (1,989 | 66.7%) represent the smallest median family size with 3.13 persons per family.
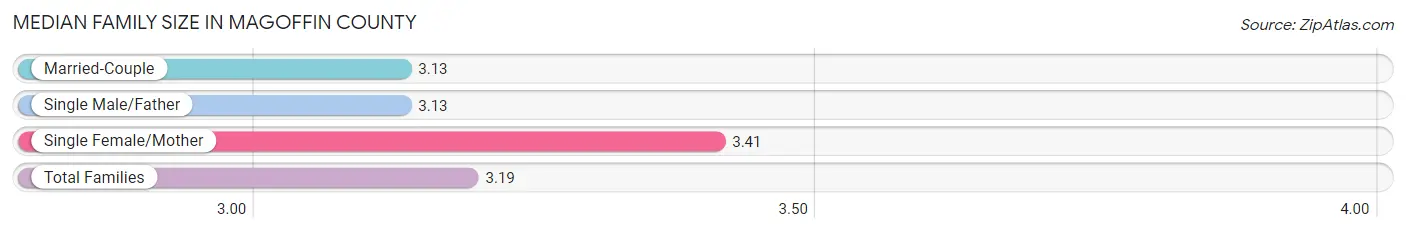
| Family Type | # Families | Family Size |
| Married-Couple | 1,989 (66.7%) | 3.13 |
| Single Male/Father | 347 (11.6%) | 3.13 |
| Single Female/Mother | 646 (21.7%) | 3.41 |
| Total Families | 2,982 (100.0%) | 3.19 |
Median Household Size in Magoffin County
The median household size in Magoffin County is 2.53 persons per household, with single female/mother households (646 | 14.2%) accounting for the largest median household size of 3.62 persons per household. non-family households (1,572 | 34.5%) represent the smallest median household size with 1.08 persons per household.
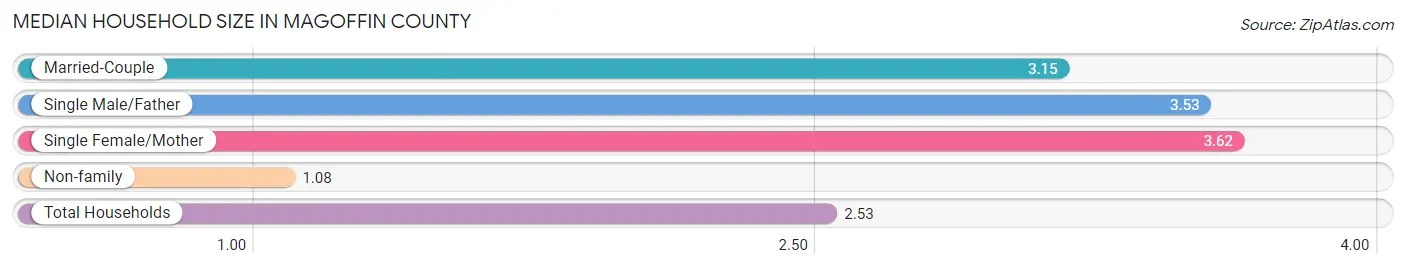
| Household Type | # Households | Household Size |
| Married-Couple | 1,989 (43.7%) | 3.15 |
| Single Male/Father | 347 (7.6%) | 3.53 |
| Single Female/Mother | 646 (14.2%) | 3.62 |
| Non-family | 1,572 (34.5%) | 1.08 |
| Total Households | 4,554 (100.0%) | 2.53 |
Household Size by Marriage Status in Magoffin County
Out of a total of 4,554 households in Magoffin County, 2,982 (65.5%) are family households, while 1,572 (34.5%) are nonfamily households. The most numerous type of family households are 2-person households, comprising 1,337, and the most common type of nonfamily households are 1-person households, comprising 1,470.
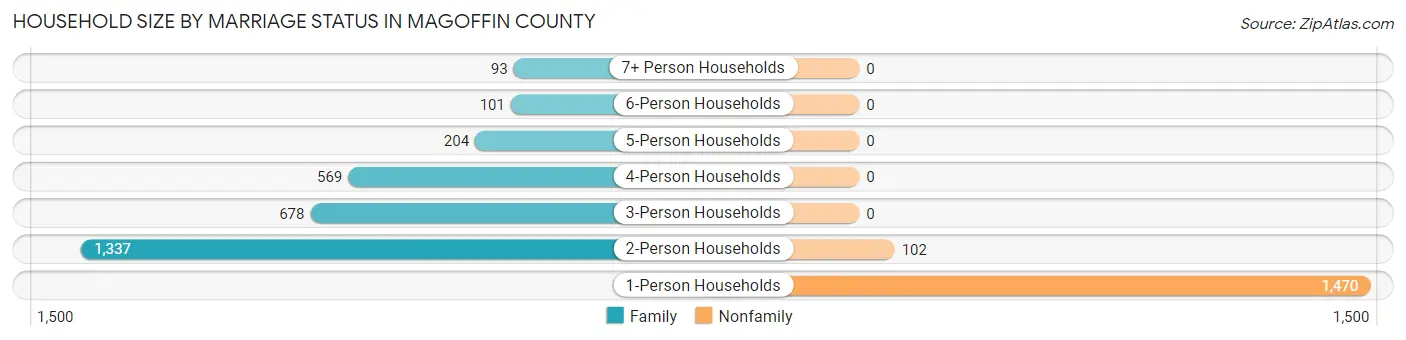
| Household Size | Family Households | Nonfamily Households |
| 1-Person Households | - | 1,470 (32.3%) |
| 2-Person Households | 1,337 (29.4%) | 102 (2.2%) |
| 3-Person Households | 678 (14.9%) | 0 (0.0%) |
| 4-Person Households | 569 (12.5%) | 0 (0.0%) |
| 5-Person Households | 204 (4.5%) | 0 (0.0%) |
| 6-Person Households | 101 (2.2%) | 0 (0.0%) |
| 7+ Person Households | 93 (2.0%) | 0 (0.0%) |
| Total | 2,982 (65.5%) | 1,572 (34.5%) |
Female Fertility in Magoffin County
Fertility by Age in Magoffin County
Average fertility rate in Magoffin County is 78.0 births per 1,000 women. Women in the age bracket of 20 to 34 years have the highest fertility rate with 182.0 births per 1,000 women. Women in the age bracket of 20 to 34 years acount for 96.8% of all women with births.
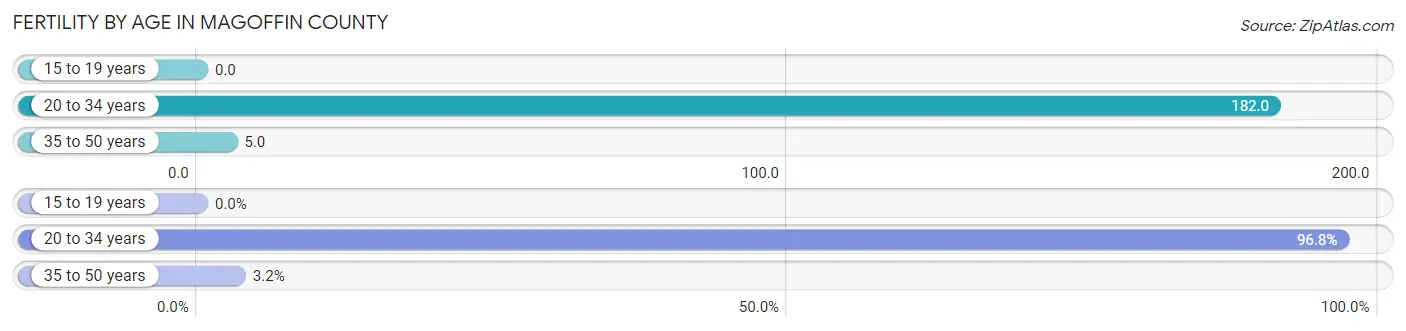
| Age Bracket | Women with Births | Births / 1,000 Women |
| 15 to 19 years | 0 (0.0%) | 0.0 |
| 20 to 34 years | 181 (96.8%) | 182.0 |
| 35 to 50 years | 6 (3.2%) | 5.0 |
| Total | 187 (100.0%) | 78.0 |
Fertility by Age by Marriage Status in Magoffin County
37.4% of women with births (187) in Magoffin County are married. The highest percentage of unmarried women with births falls into 20 to 34 years age bracket with 64.6% of them unmarried at the time of birth, while the lowest percentage of unmarried women with births belong to 35 to 50 years age bracket with 0.0% of them unmarried.
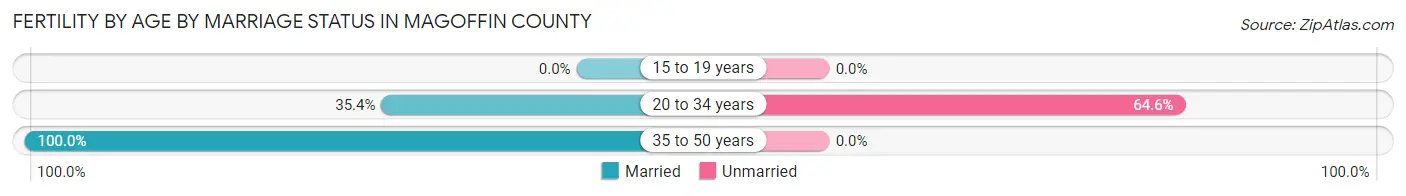
| Age Bracket | Married | Unmarried |
| 15 to 19 years | 0 (0.0%) | 0 (0.0%) |
| 20 to 34 years | 64 (35.4%) | 117 (64.6%) |
| 35 to 50 years | 6 (100.0%) | 0 (0.0%) |
| Total | 70 (37.4%) | 117 (62.6%) |
Fertility by Education in Magoffin County
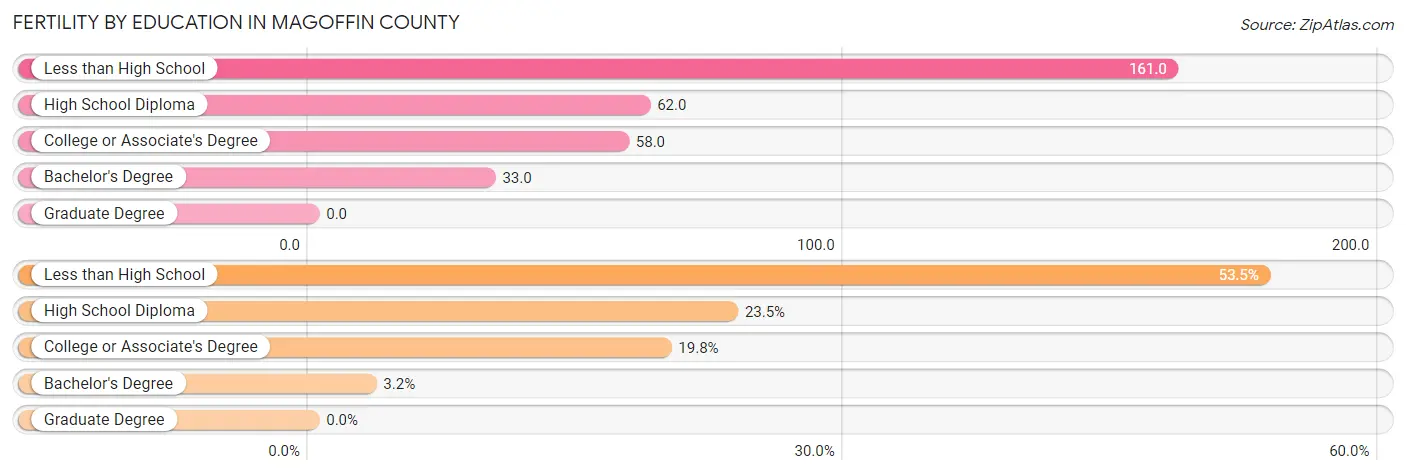
| Educational Attainment | Women with Births | Births / 1,000 Women |
| Less than High School | 100 (53.5%) | 161.0 |
| High School Diploma | 44 (23.5%) | 62.0 |
| College or Associate's Degree | 37 (19.8%) | 58.0 |
| Bachelor's Degree | 6 (3.2%) | 33.0 |
| Graduate Degree | 0 (0.0%) | 0.0 |
| Total | 187 (100.0%) | 78.0 |
Fertility by Education by Marriage Status in Magoffin County
62.6% of women with births in Magoffin County are unmarried. Women with the educational attainment of high school diploma are most likely to be married with 100.0% of them married at childbirth, while women with the educational attainment of less than high school are least likely to be married with 90.0% of them unmarried at childbirth.
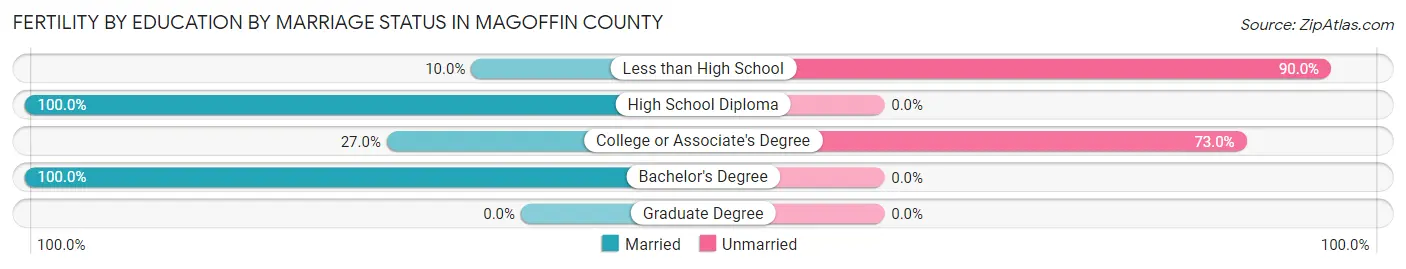
| Educational Attainment | Married | Unmarried |
| Less than High School | 10 (10.0%) | 90 (90.0%) |
| High School Diploma | 44 (100.0%) | 0 (0.0%) |
| College or Associate's Degree | 10 (27.0%) | 27 (73.0%) |
| Bachelor's Degree | 6 (100.0%) | 0 (0.0%) |
| Graduate Degree | 0 (0.0%) | 0 (0.0%) |
| Total | 70 (37.4%) | 117 (62.6%) |
Employment Characteristics in Magoffin County
Employment by Class of Employer in Magoffin County
Among the 2,859 employed individuals in Magoffin County, private company employees (1,817 | 63.5%), state government employees (505 | 17.7%), and not-for-profit organizations (193 | 6.8%) make up the most common classes of employment.
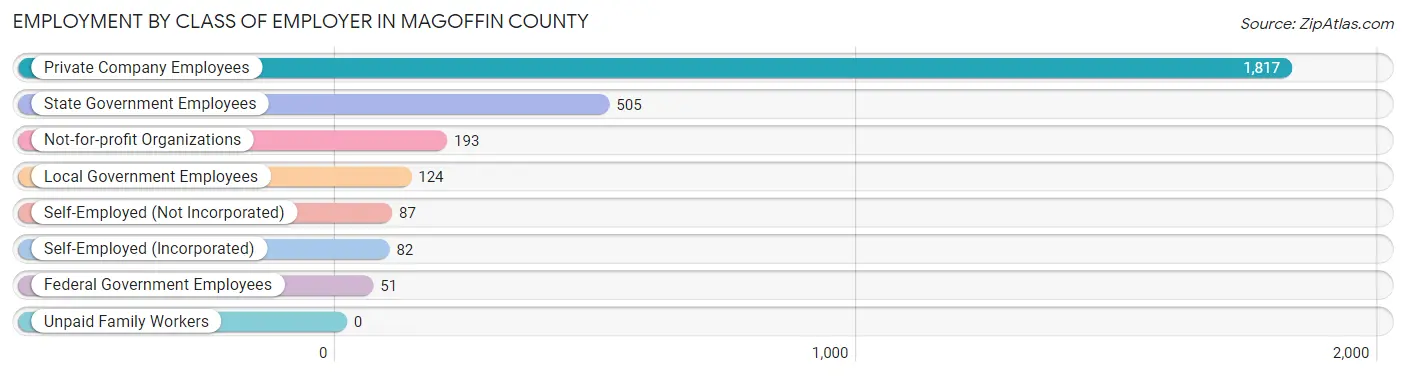
| Employer Class | # Employees | % Employees |
| Private Company Employees | 1,817 | 63.5% |
| Self-Employed (Incorporated) | 82 | 2.9% |
| Self-Employed (Not Incorporated) | 87 | 3.0% |
| Not-for-profit Organizations | 193 | 6.8% |
| Local Government Employees | 124 | 4.3% |
| State Government Employees | 505 | 17.7% |
| Federal Government Employees | 51 | 1.8% |
| Unpaid Family Workers | 0 | 0.0% |
| Total | 2,859 | 100.0% |
Employment Status by Age in Magoffin County
According to the labor force statistics for Magoffin County, out of the total population over 16 years of age (9,300), 36.8% or 3,422 individuals are in the labor force, with 12.8% or 438 of them unemployed. The age group with the highest labor force participation rate is 25 to 29 years, with 70.0% or 478 individuals in the labor force. Within the labor force, the 60 to 64 years age range has the highest percentage of unemployed individuals, with 31.8% or 83 of them being unemployed.
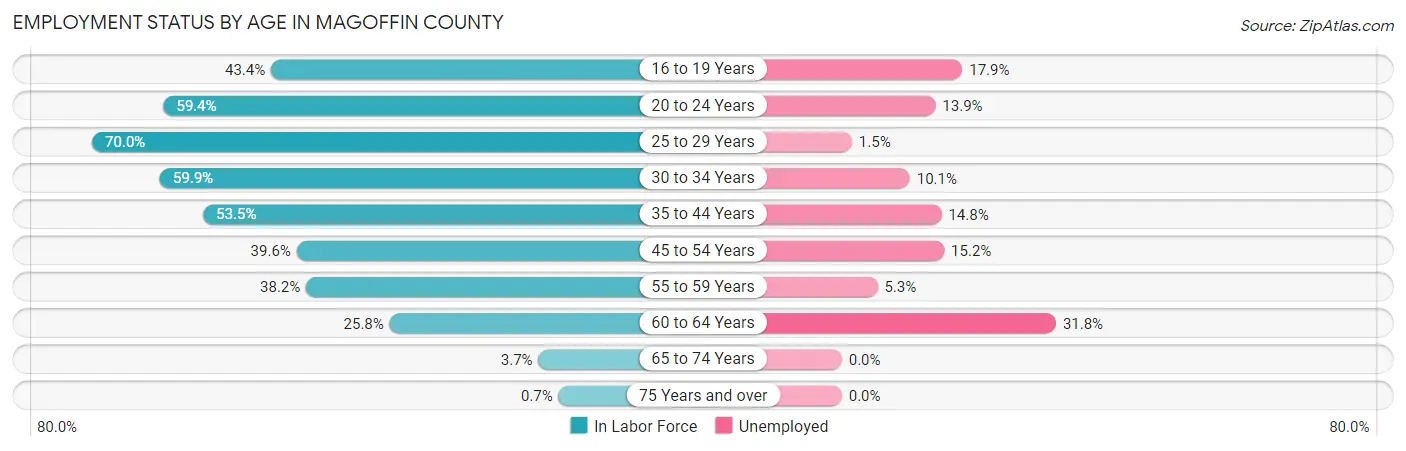
| Age Bracket | In Labor Force | Unemployed |
| 16 to 19 Years | 212 (43.4%) | 38 (17.9%) |
| 20 to 24 Years | 367 (59.4%) | 51 (13.9%) |
| 25 to 29 Years | 478 (70.0%) | 7 (1.5%) |
| 30 to 34 Years | 406 (59.9%) | 41 (10.1%) |
| 35 to 44 Years | 714 (53.5%) | 106 (14.8%) |
| 45 to 54 Years | 646 (39.6%) | 98 (15.2%) |
| 55 to 59 Years | 283 (38.2%) | 15 (5.3%) |
| 60 to 64 Years | 261 (25.8%) | 83 (31.8%) |
| 65 to 74 Years | 49 (3.7%) | 0 (0.0%) |
| 75 Years and over | 6 (0.7%) | 0 (0.0%) |
| Total | 3,422 (36.8%) | 438 (12.8%) |
Employment Status by Educational Attainment in Magoffin County
According to labor force statistics for Magoffin County, 45.9% of individuals (2,789) out of the total population between 25 and 64 years of age (6,076) are in the labor force, with 12.6% or 351 of them being unemployed. The group with the highest labor force participation rate are those with the educational attainment of bachelor's degree or higher, with 84.9% or 518 individuals in the labor force. Within the labor force, individuals with less than high school education have the highest percentage of unemployment, with 41.0% or 126 of them being unemployed.
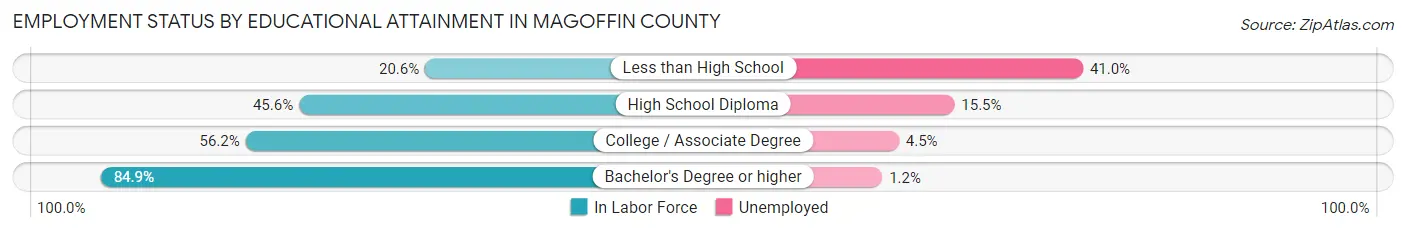
| Educational Attainment | In Labor Force | Unemployed |
| Less than High School | 307 (20.6%) | 610 (41.0%) |
| High School Diploma | 1,171 (45.6%) | 398 (15.5%) |
| College / Associate Degree | 792 (56.2%) | 63 (4.5%) |
| Bachelor's Degree or higher | 518 (84.9%) | 7 (1.2%) |
| Total | 2,789 (45.9%) | 766 (12.6%) |
Employment Occupations by Sex in Magoffin County
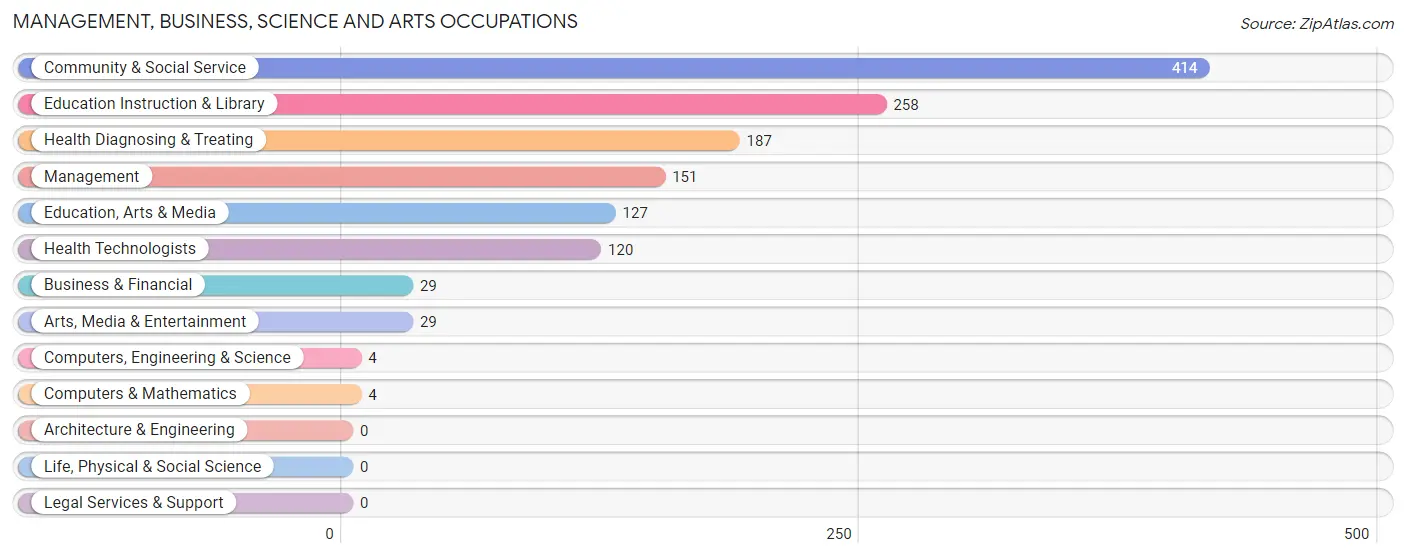
Management, Business, Science and Arts Occupations
The most common Management, Business, Science and Arts occupations in Magoffin County are Community & Social Service (414 | 13.9%), Education Instruction & Library (258 | 8.6%), Health Diagnosing & Treating (187 | 6.3%), Management (151 | 5.1%), and Education, Arts & Media (127 | 4.3%).
Management, Business, Science and Arts Occupations by Sex
Within the Management, Business, Science and Arts occupations in Magoffin County, the most male-oriented occupations are Management (81.5%), Business & Financial (44.8%), and Education Instruction & Library (27.9%), while the most female-oriented occupations are Computers, Engineering & Science (100.0%), Computers & Mathematics (100.0%), and Arts, Media & Entertainment (100.0%).
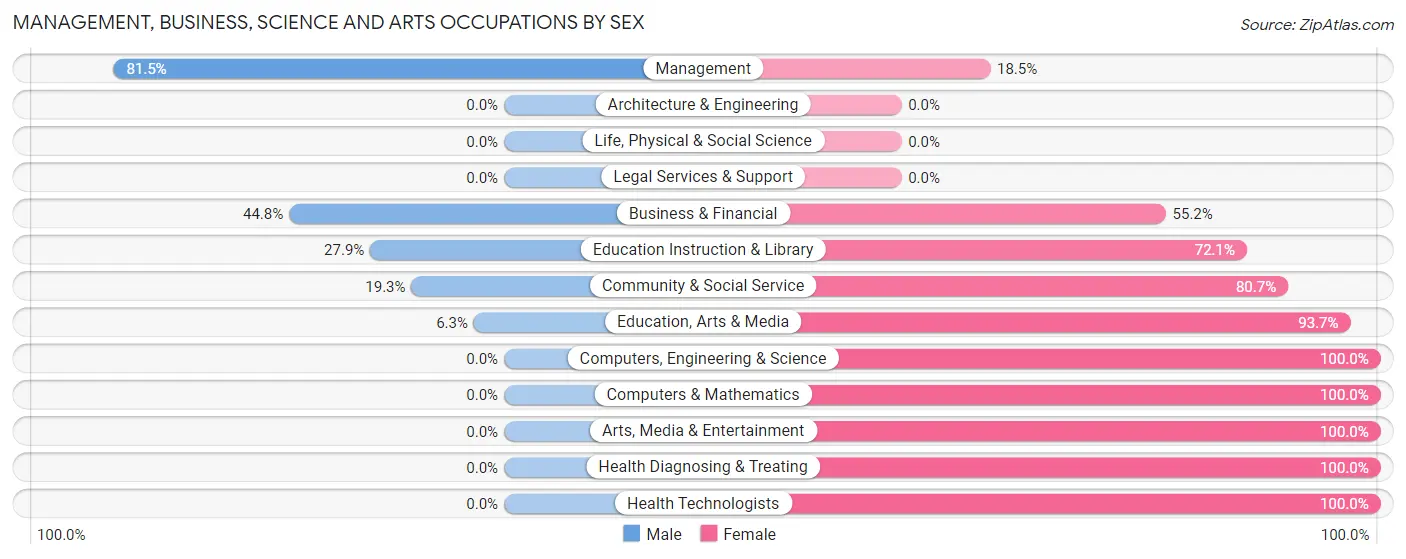
| Occupation | Male | Female |
| Management | 123 (81.5%) | 28 (18.5%) |
| Business & Financial | 13 (44.8%) | 16 (55.2%) |
| Computers, Engineering & Science | 0 (0.0%) | 4 (100.0%) |
| Computers & Mathematics | 0 (0.0%) | 4 (100.0%) |
| Architecture & Engineering | 0 (0.0%) | 0 (0.0%) |
| Life, Physical & Social Science | 0 (0.0%) | 0 (0.0%) |
| Community & Social Service | 80 (19.3%) | 334 (80.7%) |
| Education, Arts & Media | 8 (6.3%) | 119 (93.7%) |
| Legal Services & Support | 0 (0.0%) | 0 (0.0%) |
| Education Instruction & Library | 72 (27.9%) | 186 (72.1%) |
| Arts, Media & Entertainment | 0 (0.0%) | 29 (100.0%) |
| Health Diagnosing & Treating | 0 (0.0%) | 187 (100.0%) |
| Health Technologists | 0 (0.0%) | 120 (100.0%) |
| Total (Category) | 216 (27.5%) | 569 (72.5%) |
| Total (Overall) | 1,666 (55.8%) | 1,317 (44.2%) |
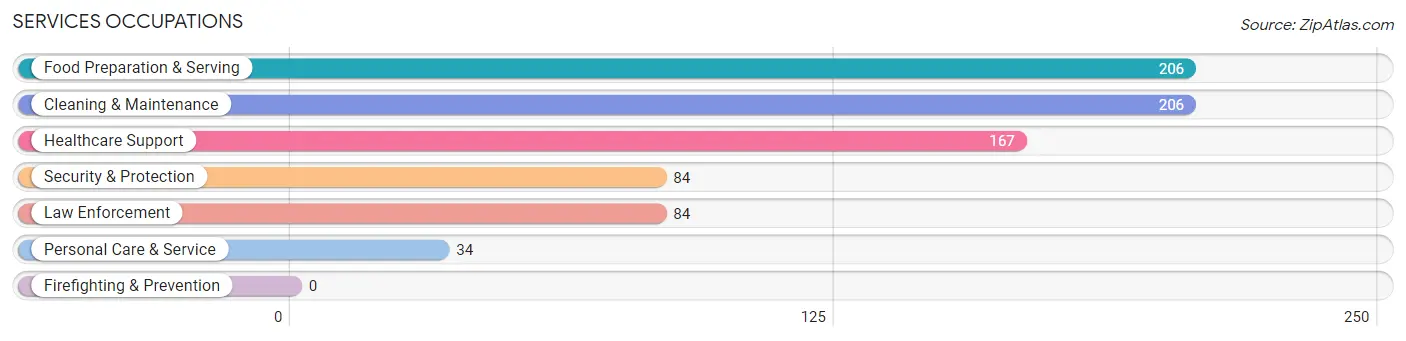
Services Occupations
The most common Services occupations in Magoffin County are Food Preparation & Serving (206 | 6.9%), Cleaning & Maintenance (206 | 6.9%), Healthcare Support (167 | 5.6%), Security & Protection (84 | 2.8%), and Law Enforcement (84 | 2.8%).
Services Occupations by Sex
Within the Services occupations in Magoffin County, the most male-oriented occupations are Security & Protection (100.0%), Law Enforcement (100.0%), and Cleaning & Maintenance (77.2%), while the most female-oriented occupations are Healthcare Support (79.0%), Food Preparation & Serving (74.3%), and Personal Care & Service (44.1%).
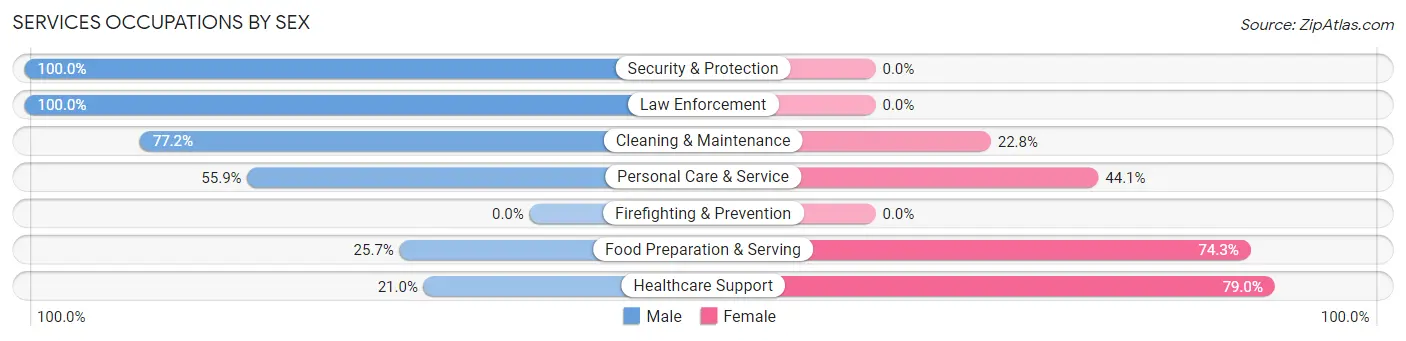
| Occupation | Male | Female |
| Healthcare Support | 35 (21.0%) | 132 (79.0%) |
| Security & Protection | 84 (100.0%) | 0 (0.0%) |
| Firefighting & Prevention | 0 (0.0%) | 0 (0.0%) |
| Law Enforcement | 84 (100.0%) | 0 (0.0%) |
| Food Preparation & Serving | 53 (25.7%) | 153 (74.3%) |
| Cleaning & Maintenance | 159 (77.2%) | 47 (22.8%) |
| Personal Care & Service | 19 (55.9%) | 15 (44.1%) |
| Total (Category) | 350 (50.2%) | 347 (49.8%) |
| Total (Overall) | 1,666 (55.8%) | 1,317 (44.2%) |
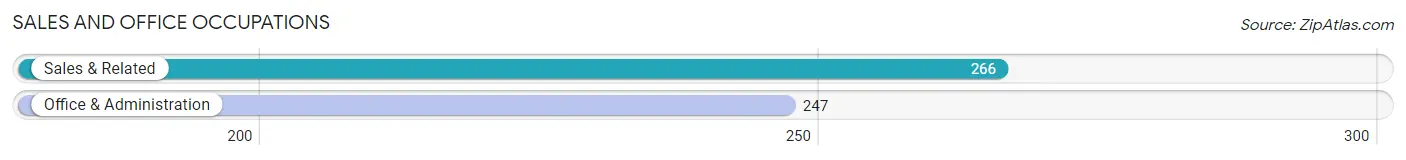
Sales and Office Occupations
The most common Sales and Office occupations in Magoffin County are Sales & Related (266 | 8.9%), and Office & Administration (247 | 8.3%).
Sales and Office Occupations by Sex
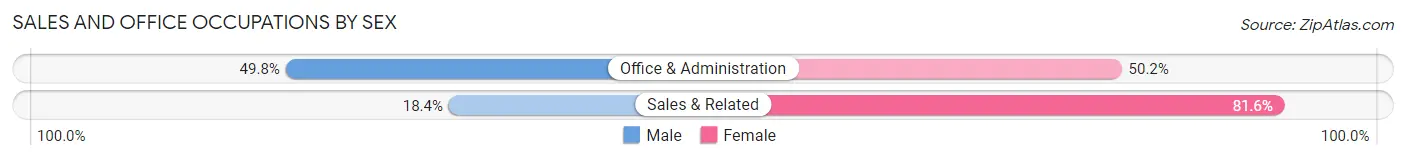
| Occupation | Male | Female |
| Sales & Related | 49 (18.4%) | 217 (81.6%) |
| Office & Administration | 123 (49.8%) | 124 (50.2%) |
| Total (Category) | 172 (33.5%) | 341 (66.5%) |
| Total (Overall) | 1,666 (55.8%) | 1,317 (44.2%) |
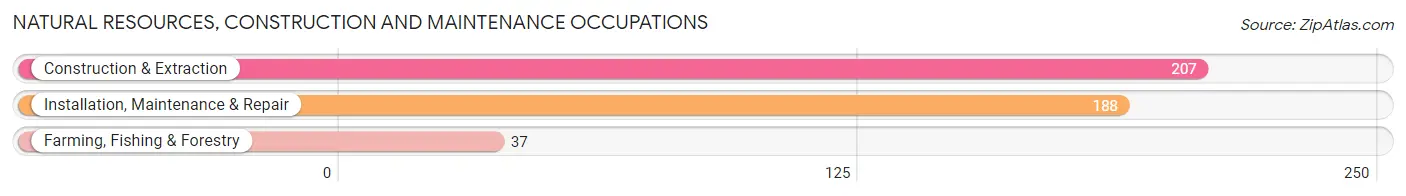
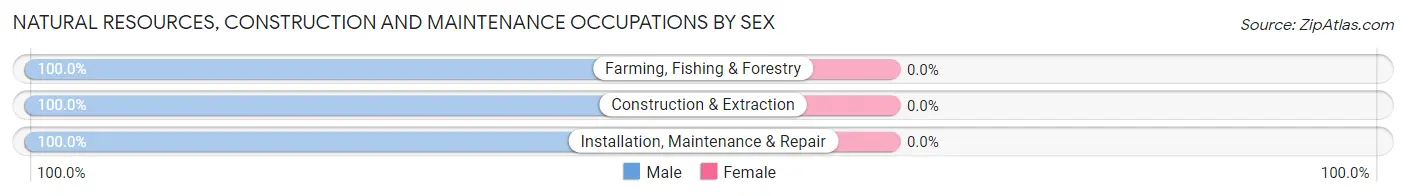
Natural Resources, Construction and Maintenance Occupations
The most common Natural Resources, Construction and Maintenance occupations in Magoffin County are Construction & Extraction (207 | 6.9%), Installation, Maintenance & Repair (188 | 6.3%), and Farming, Fishing & Forestry (37 | 1.2%).
Natural Resources, Construction and Maintenance Occupations by Sex
| Occupation | Male | Female |
| Farming, Fishing & Forestry | 37 (100.0%) | 0 (0.0%) |
| Construction & Extraction | 207 (100.0%) | 0 (0.0%) |
| Installation, Maintenance & Repair | 188 (100.0%) | 0 (0.0%) |
| Total (Category) | 432 (100.0%) | 0 (0.0%) |
| Total (Overall) | 1,666 (55.8%) | 1,317 (44.2%) |
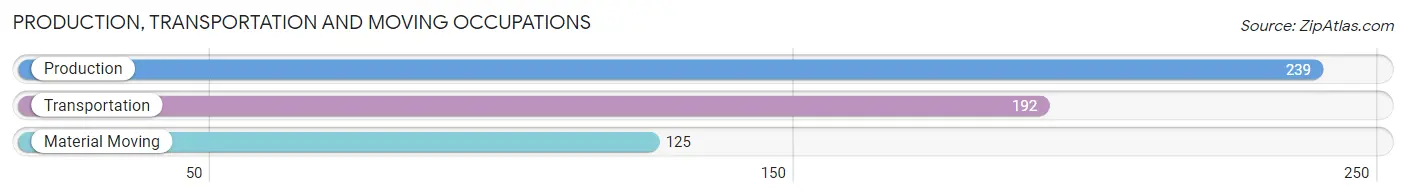
Production, Transportation and Moving Occupations
The most common Production, Transportation and Moving occupations in Magoffin County are Production (239 | 8.0%), Transportation (192 | 6.4%), and Material Moving (125 | 4.2%).
Production, Transportation and Moving Occupations by Sex
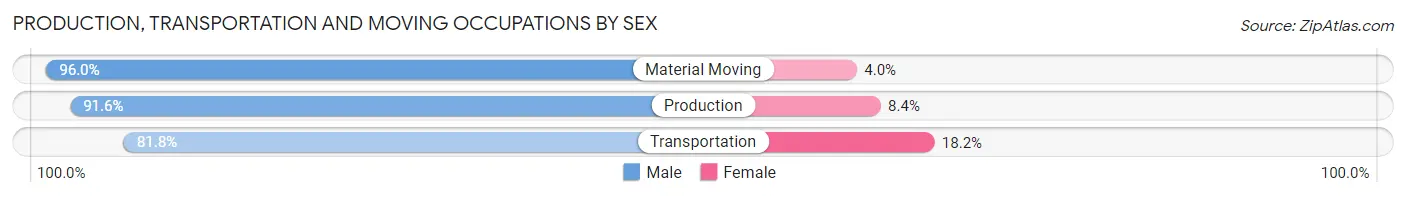
| Occupation | Male | Female |
| Production | 219 (91.6%) | 20 (8.4%) |
| Transportation | 157 (81.8%) | 35 (18.2%) |
| Material Moving | 120 (96.0%) | 5 (4.0%) |
| Total (Category) | 496 (89.2%) | 60 (10.8%) |
| Total (Overall) | 1,666 (55.8%) | 1,317 (44.2%) |
Employment Industries by Sex in Magoffin County
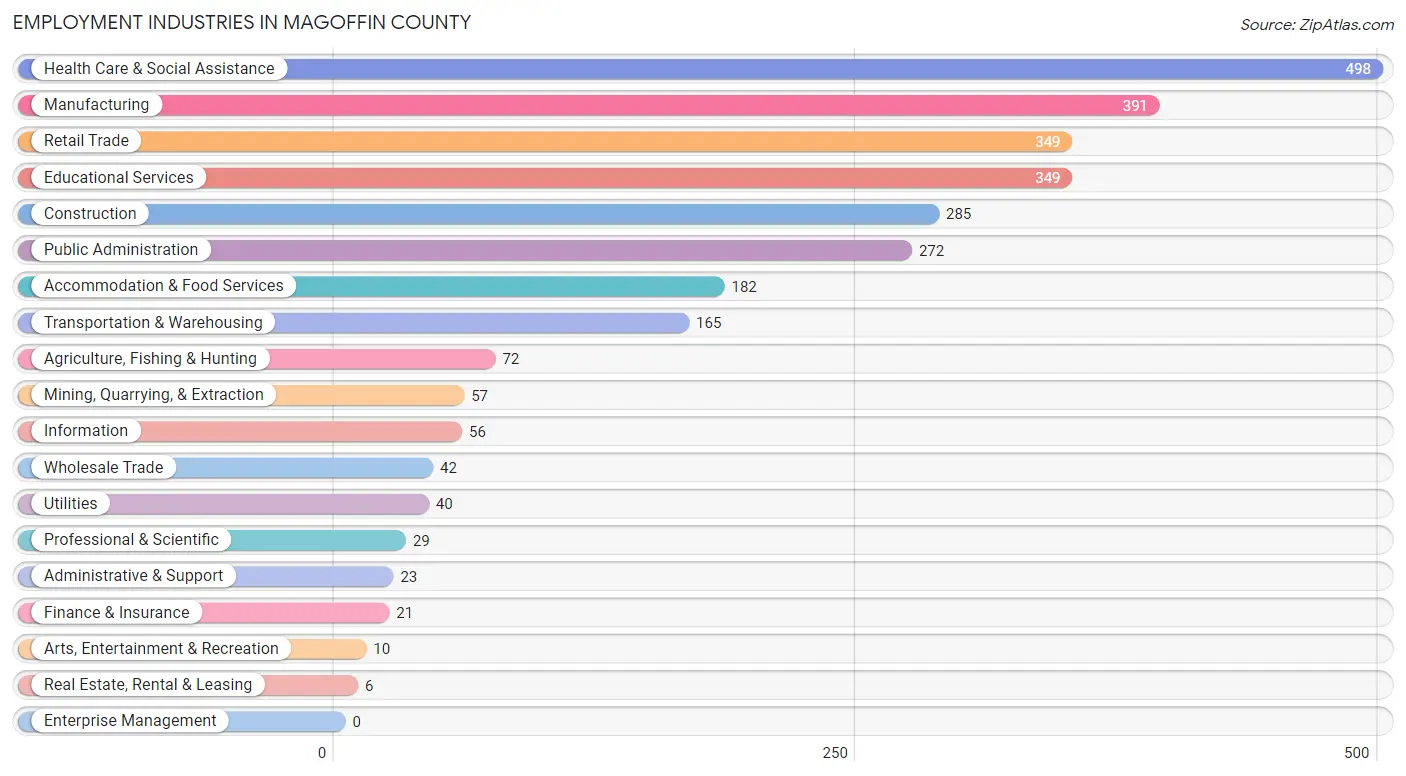
Employment Industries in Magoffin County
The major employment industries in Magoffin County include Health Care & Social Assistance (498 | 16.7%), Manufacturing (391 | 13.1%), Retail Trade (349 | 11.7%), Educational Services (349 | 11.7%), and Construction (285 | 9.6%).
Employment Industries by Sex in Magoffin County
The Magoffin County industries that see more men than women are Agriculture, Fishing & Hunting (100.0%), Wholesale Trade (100.0%), and Utilities (100.0%), whereas the industries that tend to have a higher number of women are Finance & Insurance (100.0%), Real Estate, Rental & Leasing (83.3%), and Health Care & Social Assistance (80.9%).
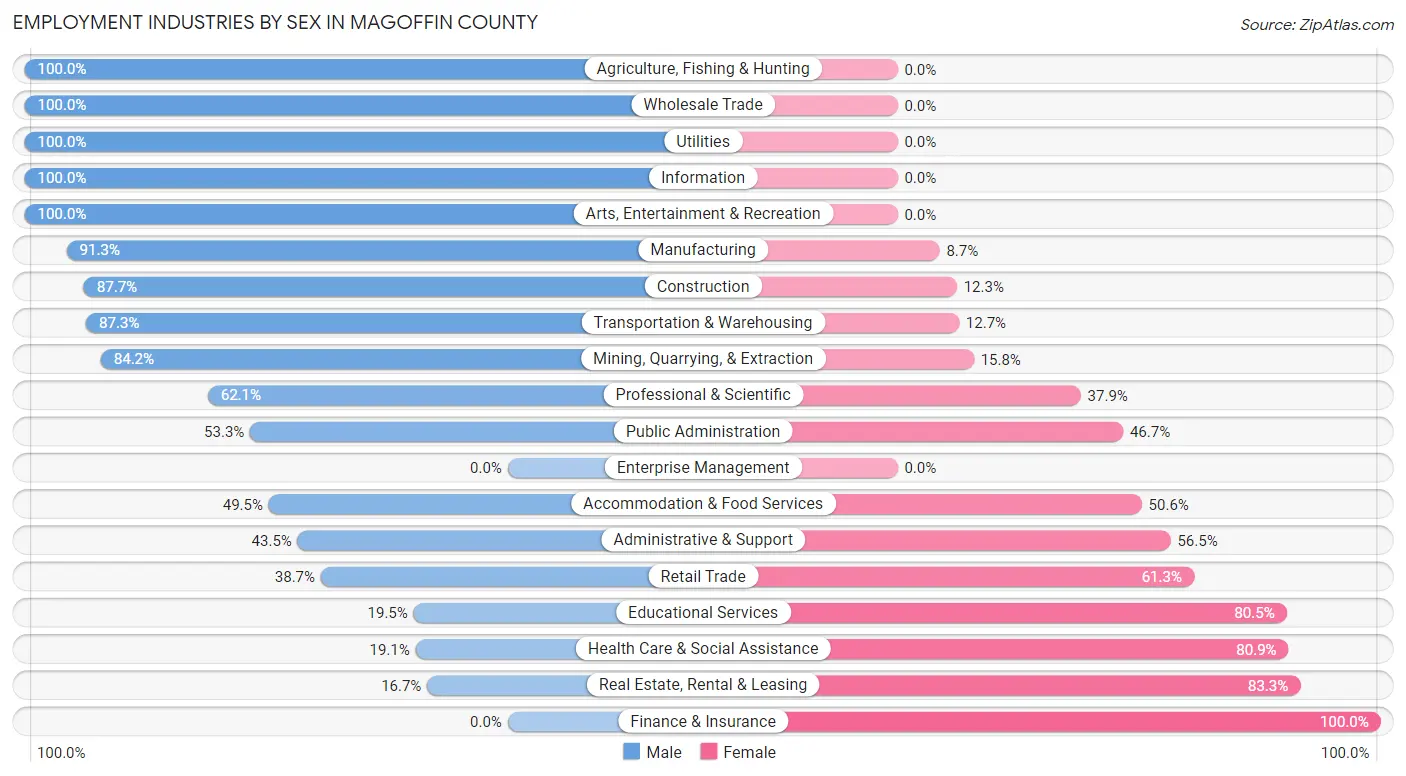
| Industry | Male | Female |
| Agriculture, Fishing & Hunting | 72 (100.0%) | 0 (0.0%) |
| Mining, Quarrying, & Extraction | 48 (84.2%) | 9 (15.8%) |
| Construction | 250 (87.7%) | 35 (12.3%) |
| Manufacturing | 357 (91.3%) | 34 (8.7%) |
| Wholesale Trade | 42 (100.0%) | 0 (0.0%) |
| Retail Trade | 135 (38.7%) | 214 (61.3%) |
| Transportation & Warehousing | 144 (87.3%) | 21 (12.7%) |
| Utilities | 40 (100.0%) | 0 (0.0%) |
| Information | 56 (100.0%) | 0 (0.0%) |
| Finance & Insurance | 0 (0.0%) | 21 (100.0%) |
| Real Estate, Rental & Leasing | 1 (16.7%) | 5 (83.3%) |
| Professional & Scientific | 18 (62.1%) | 11 (37.9%) |
| Enterprise Management | 0 (0.0%) | 0 (0.0%) |
| Administrative & Support | 10 (43.5%) | 13 (56.5%) |
| Educational Services | 68 (19.5%) | 281 (80.5%) |
| Health Care & Social Assistance | 95 (19.1%) | 403 (80.9%) |
| Arts, Entertainment & Recreation | 10 (100.0%) | 0 (0.0%) |
| Accommodation & Food Services | 90 (49.4%) | 92 (50.5%) |
| Public Administration | 145 (53.3%) | 127 (46.7%) |
| Total | 1,666 (55.8%) | 1,317 (44.2%) |
Education in Magoffin County
School Enrollment in Magoffin County
The most common levels of schooling among the 2,144 students in Magoffin County are elementary school (566 | 26.4%), middle school (543 | 25.3%), and high school (535 | 24.9%).
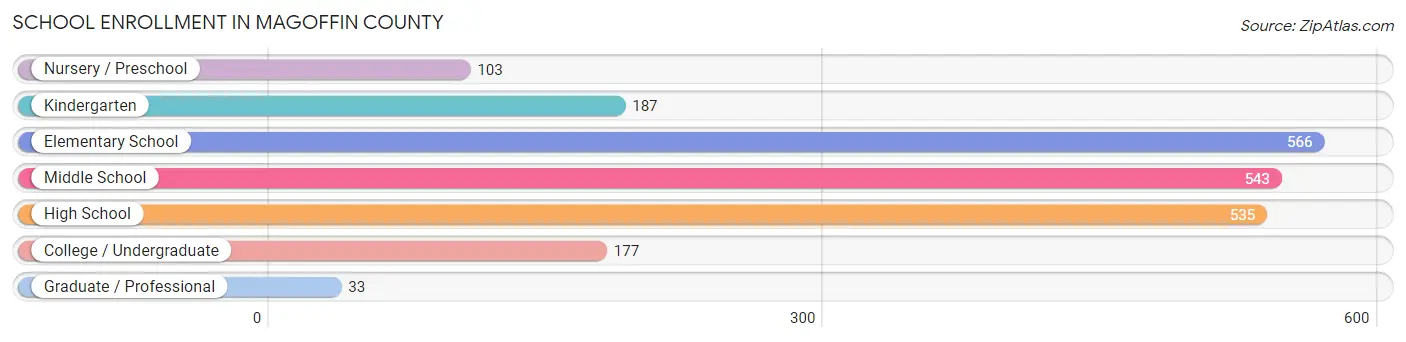
| School Level | # Students | % Students |
| Nursery / Preschool | 103 | 4.8% |
| Kindergarten | 187 | 8.7% |
| Elementary School | 566 | 26.4% |
| Middle School | 543 | 25.3% |
| High School | 535 | 24.9% |
| College / Undergraduate | 177 | 8.3% |
| Graduate / Professional | 33 | 1.5% |
| Total | 2,144 | 100.0% |
School Enrollment by Age by Funding Source in Magoffin County
Out of a total of 2,144 students who are enrolled in schools in Magoffin County, 174 (8.1%) attend a private institution, while the remaining 1,970 (91.9%) are enrolled in public schools. The age group of 35 years and over has the highest likelihood of being enrolled in private schools, with 25 (55.6% in the age bracket) enrolled. Conversely, the age group of 3 to 4 year olds has the lowest likelihood of being enrolled in a private school, with 70 (100.0% in the age bracket) attending a public institution.
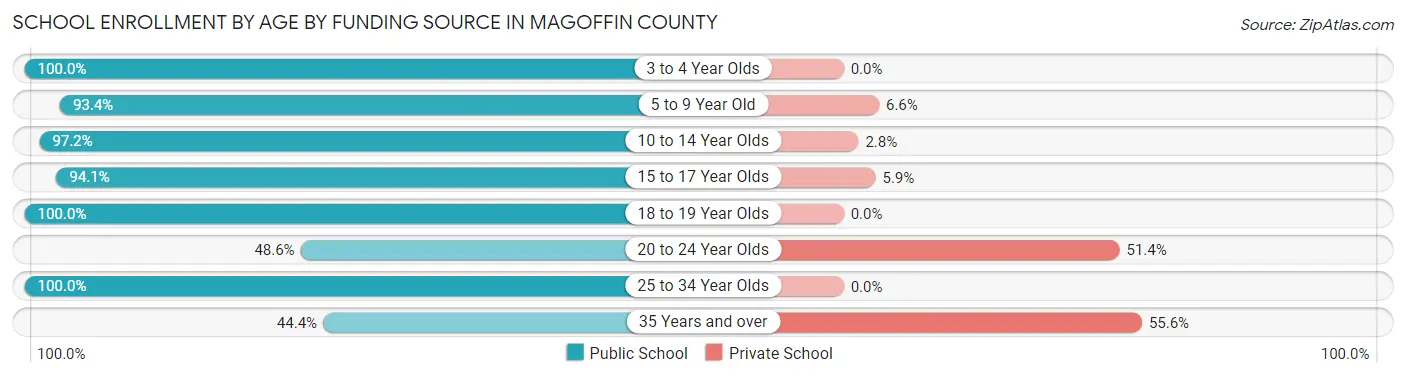
| Age Bracket | Public School | Private School |
| 3 to 4 Year Olds | 70 (100.0%) | 0 (0.0%) |
| 5 to 9 Year Old | 695 (93.4%) | 49 (6.6%) |
| 10 to 14 Year Olds | 599 (97.2%) | 17 (2.8%) |
| 15 to 17 Year Olds | 428 (94.1%) | 27 (5.9%) |
| 18 to 19 Year Olds | 81 (100.0%) | 0 (0.0%) |
| 20 to 24 Year Olds | 53 (48.6%) | 56 (51.4%) |
| 25 to 34 Year Olds | 24 (100.0%) | 0 (0.0%) |
| 35 Years and over | 20 (44.4%) | 25 (55.6%) |
| Total | 1,970 (91.9%) | 174 (8.1%) |
Educational Attainment by Field of Study in Magoffin County
Education (300 | 32.8%), science & technology (164 | 17.9%), business (96 | 10.5%), bio, nature & agricultural (86 | 9.4%), and arts & humanities (71 | 7.8%) are the most common fields of study among 914 individuals in Magoffin County who have obtained a bachelor's degree or higher.
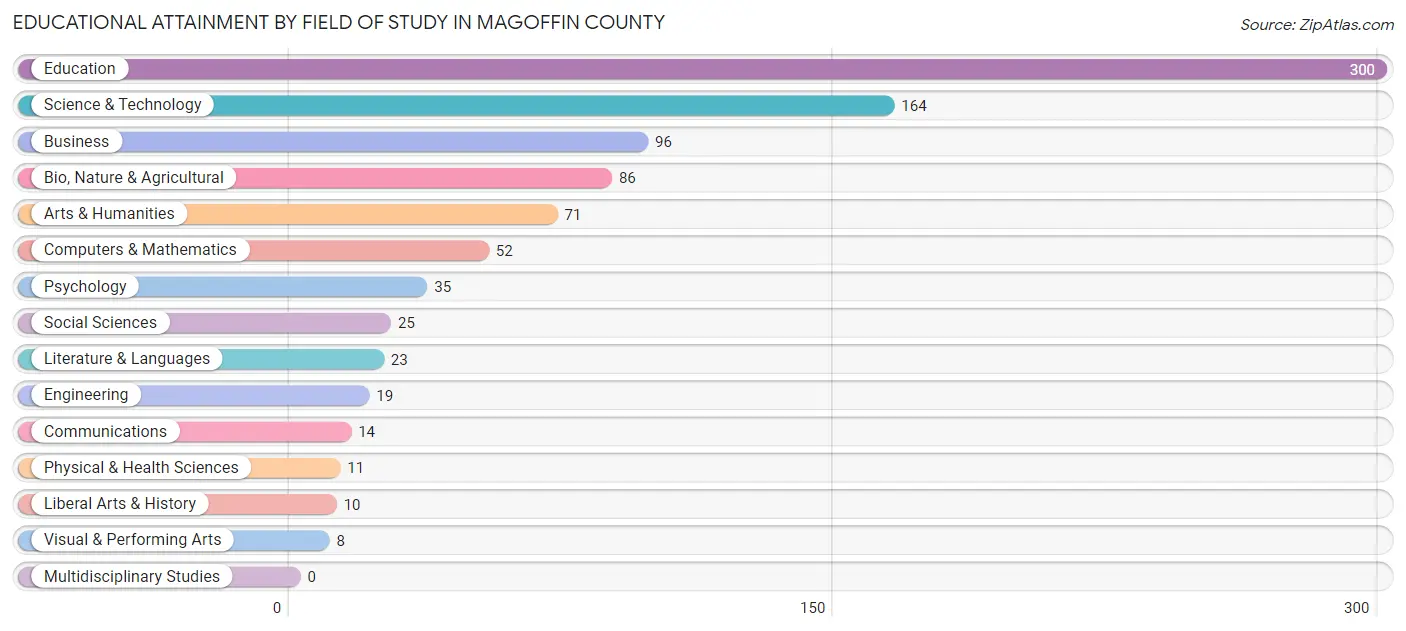
| Field of Study | # Graduates | % Graduates |
| Computers & Mathematics | 52 | 5.7% |
| Bio, Nature & Agricultural | 86 | 9.4% |
| Physical & Health Sciences | 11 | 1.2% |
| Psychology | 35 | 3.8% |
| Social Sciences | 25 | 2.7% |
| Engineering | 19 | 2.1% |
| Multidisciplinary Studies | 0 | 0.0% |
| Science & Technology | 164 | 17.9% |
| Business | 96 | 10.5% |
| Education | 300 | 32.8% |
| Literature & Languages | 23 | 2.5% |
| Liberal Arts & History | 10 | 1.1% |
| Visual & Performing Arts | 8 | 0.9% |
| Communications | 14 | 1.5% |
| Arts & Humanities | 71 | 7.8% |
| Total | 914 | 100.0% |
Transportation & Commute in Magoffin County
Vehicle Availability by Sex in Magoffin County
The most prevalent vehicle ownership categories in Magoffin County are males with 2 vehicles (731, accounting for 45.3%) and females with 2 vehicles (595, making up 58.8%).
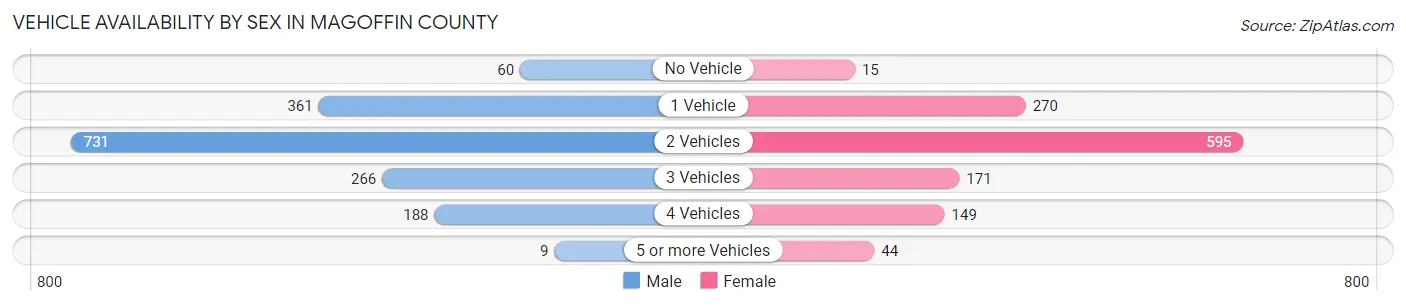
| Vehicles Available | Male | Female |
| No Vehicle | 60 (3.7%) | 15 (1.2%) |
| 1 Vehicle | 361 (22.4%) | 270 (21.7%) |
| 2 Vehicles | 731 (45.3%) | 595 (47.8%) |
| 3 Vehicles | 266 (16.5%) | 171 (13.8%) |
| 4 Vehicles | 188 (11.6%) | 149 (12.0%) |
| 5 or more Vehicles | 9 (0.6%) | 44 (3.5%) |
| Total | 1,615 (100.0%) | 1,244 (100.0%) |
Commute Time in Magoffin County
The most frequently occuring commute durations in Magoffin County are 30 to 34 minutes (444 commuters, 16.0%), 10 to 14 minutes (339 commuters, 12.2%), and 20 to 24 minutes (330 commuters, 11.9%).
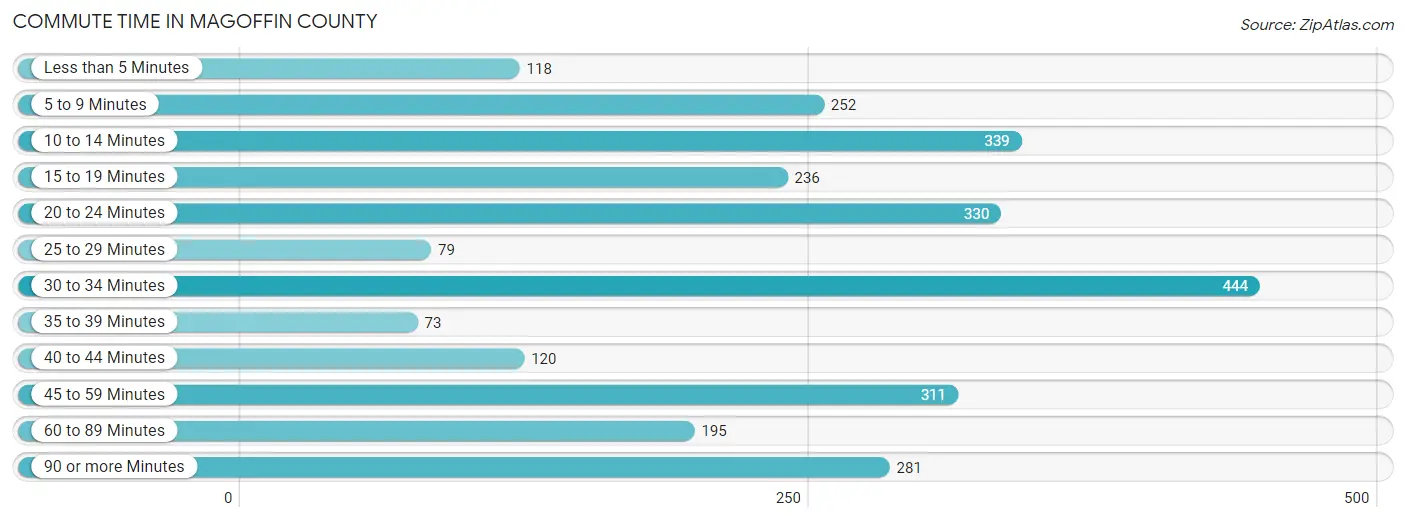
| Commute Time | # Commuters | % Commuters |
| Less than 5 Minutes | 118 | 4.3% |
| 5 to 9 Minutes | 252 | 9.1% |
| 10 to 14 Minutes | 339 | 12.2% |
| 15 to 19 Minutes | 236 | 8.5% |
| 20 to 24 Minutes | 330 | 11.9% |
| 25 to 29 Minutes | 79 | 2.8% |
| 30 to 34 Minutes | 444 | 16.0% |
| 35 to 39 Minutes | 73 | 2.6% |
| 40 to 44 Minutes | 120 | 4.3% |
| 45 to 59 Minutes | 311 | 11.2% |
| 60 to 89 Minutes | 195 | 7.0% |
| 90 or more Minutes | 281 | 10.1% |
Commute Time by Sex in Magoffin County
The most common commute times in Magoffin County are 90 or more minutes (256 commuters, 16.2%) for males and 30 to 34 minutes (263 commuters, 21.9%) for females.
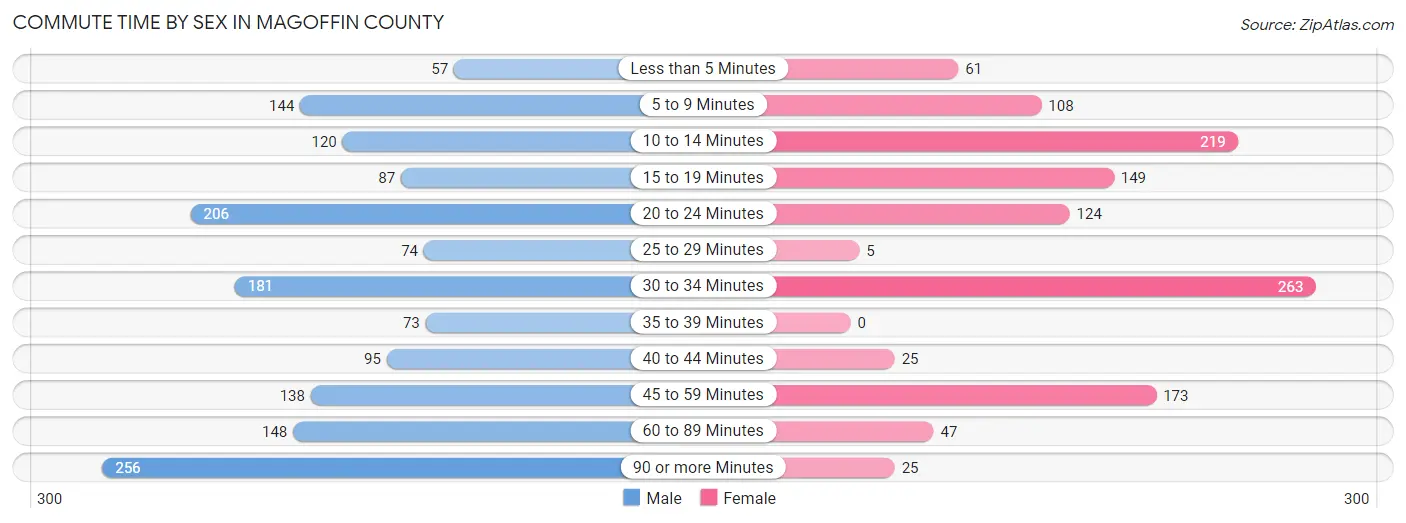
| Commute Time | Male | Female |
| Less than 5 Minutes | 57 (3.6%) | 61 (5.1%) |
| 5 to 9 Minutes | 144 (9.1%) | 108 (9.0%) |
| 10 to 14 Minutes | 120 (7.6%) | 219 (18.3%) |
| 15 to 19 Minutes | 87 (5.5%) | 149 (12.4%) |
| 20 to 24 Minutes | 206 (13.1%) | 124 (10.3%) |
| 25 to 29 Minutes | 74 (4.7%) | 5 (0.4%) |
| 30 to 34 Minutes | 181 (11.5%) | 263 (21.9%) |
| 35 to 39 Minutes | 73 (4.6%) | 0 (0.0%) |
| 40 to 44 Minutes | 95 (6.0%) | 25 (2.1%) |
| 45 to 59 Minutes | 138 (8.7%) | 173 (14.4%) |
| 60 to 89 Minutes | 148 (9.4%) | 47 (3.9%) |
| 90 or more Minutes | 256 (16.2%) | 25 (2.1%) |
Time of Departure to Work by Sex in Magoffin County
The most frequent times of departure to work in Magoffin County are 7:30 AM to 7:59 AM (337, 21.3%) for males and 7:30 AM to 7:59 AM (423, 35.3%) for females.
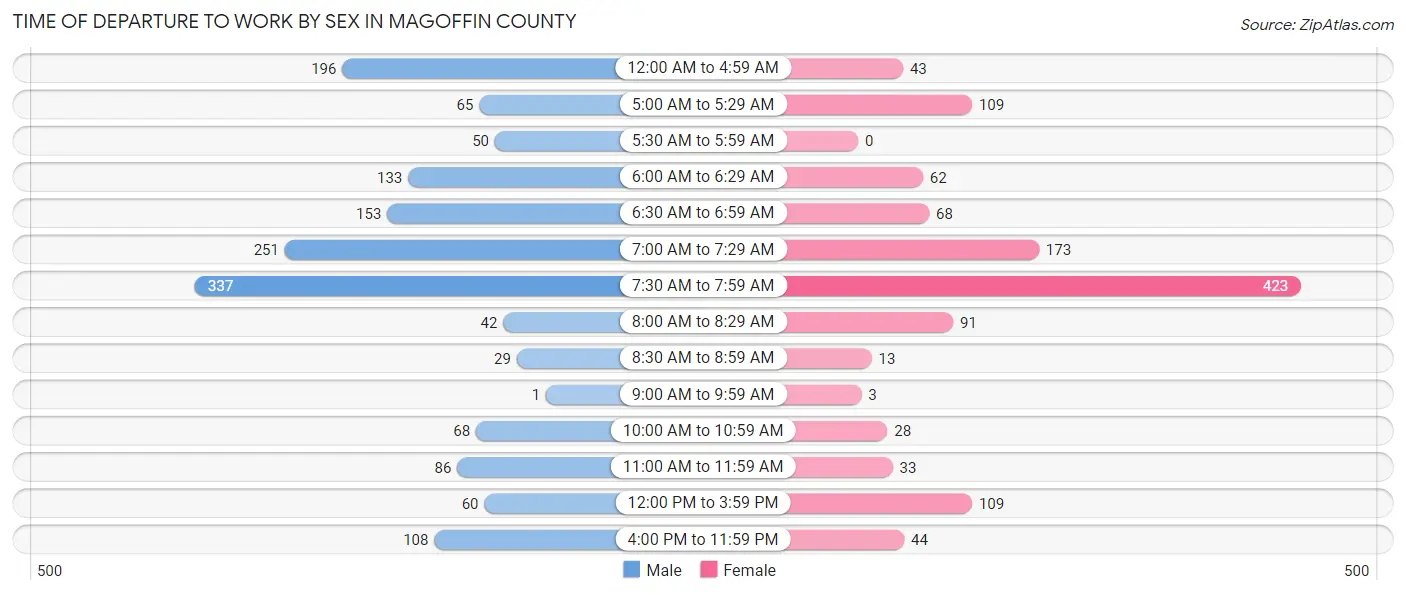
| Time of Departure | Male | Female |
| 12:00 AM to 4:59 AM | 196 (12.4%) | 43 (3.6%) |
| 5:00 AM to 5:29 AM | 65 (4.1%) | 109 (9.1%) |
| 5:30 AM to 5:59 AM | 50 (3.2%) | 0 (0.0%) |
| 6:00 AM to 6:29 AM | 133 (8.4%) | 62 (5.2%) |
| 6:30 AM to 6:59 AM | 153 (9.7%) | 68 (5.7%) |
| 7:00 AM to 7:29 AM | 251 (15.9%) | 173 (14.4%) |
| 7:30 AM to 7:59 AM | 337 (21.3%) | 423 (35.3%) |
| 8:00 AM to 8:29 AM | 42 (2.7%) | 91 (7.6%) |
| 8:30 AM to 8:59 AM | 29 (1.8%) | 13 (1.1%) |
| 9:00 AM to 9:59 AM | 1 (0.1%) | 3 (0.3%) |
| 10:00 AM to 10:59 AM | 68 (4.3%) | 28 (2.3%) |
| 11:00 AM to 11:59 AM | 86 (5.4%) | 33 (2.8%) |
| 12:00 PM to 3:59 PM | 60 (3.8%) | 109 (9.1%) |
| 4:00 PM to 11:59 PM | 108 (6.8%) | 44 (3.7%) |
| Total | 1,579 (100.0%) | 1,199 (100.0%) |
Housing Occupancy in Magoffin County
Occupancy by Ownership in Magoffin County
Of the total 4,554 dwellings in Magoffin County, owner-occupied units account for 3,424 (75.2%), while renter-occupied units make up 1,130 (24.8%).
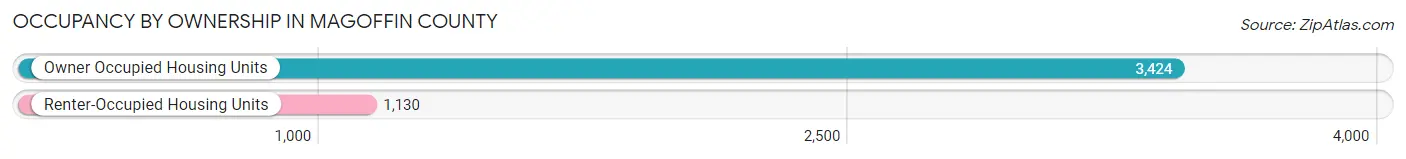
| Occupancy | # Housing Units | % Housing Units |
| Owner Occupied Housing Units | 3,424 | 75.2% |
| Renter-Occupied Housing Units | 1,130 | 24.8% |
| Total Occupied Housing Units | 4,554 | 100.0% |
Occupancy by Household Size in Magoffin County
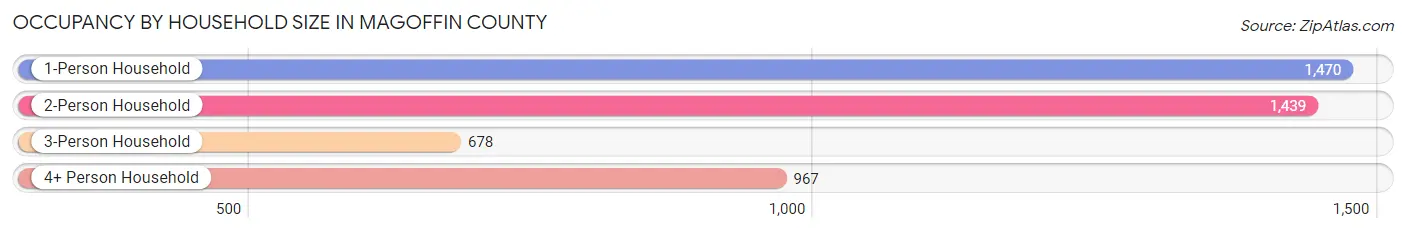
| Household Size | # Housing Units | % Housing Units |
| 1-Person Household | 1,470 | 32.3% |
| 2-Person Household | 1,439 | 31.6% |
| 3-Person Household | 678 | 14.9% |
| 4+ Person Household | 967 | 21.2% |
| Total Housing Units | 4,554 | 100.0% |
Occupancy by Ownership by Household Size in Magoffin County
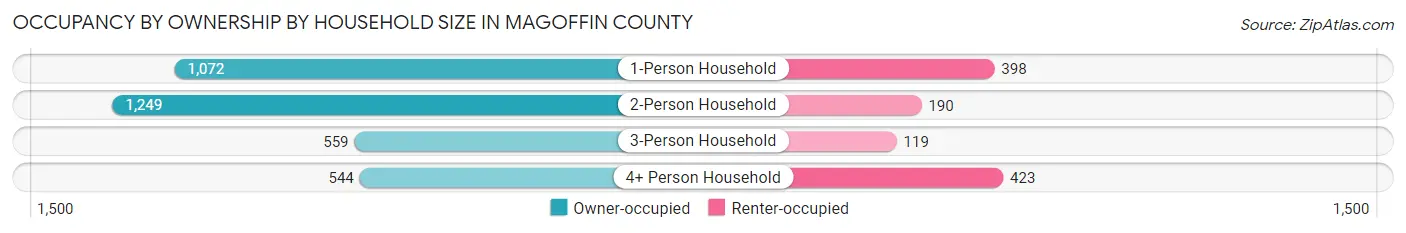
| Household Size | Owner-occupied | Renter-occupied |
| 1-Person Household | 1,072 (72.9%) | 398 (27.1%) |
| 2-Person Household | 1,249 (86.8%) | 190 (13.2%) |
| 3-Person Household | 559 (82.5%) | 119 (17.5%) |
| 4+ Person Household | 544 (56.3%) | 423 (43.7%) |
| Total Housing Units | 3,424 (75.2%) | 1,130 (24.8%) |
Occupancy by Educational Attainment in Magoffin County
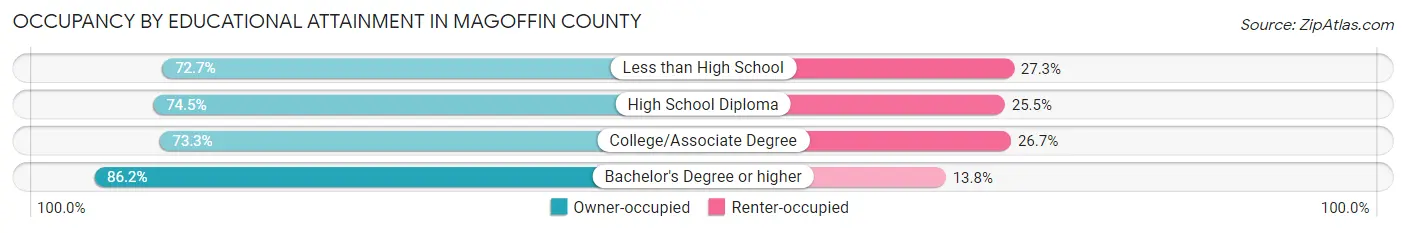
| Household Size | Owner-occupied | Renter-occupied |
| Less than High School | 908 (72.7%) | 341 (27.3%) |
| High School Diploma | 1,180 (74.5%) | 404 (25.5%) |
| College/Associate Degree | 836 (73.3%) | 305 (26.7%) |
| Bachelor's Degree or higher | 500 (86.2%) | 80 (13.8%) |
Occupancy by Age of Householder in Magoffin County
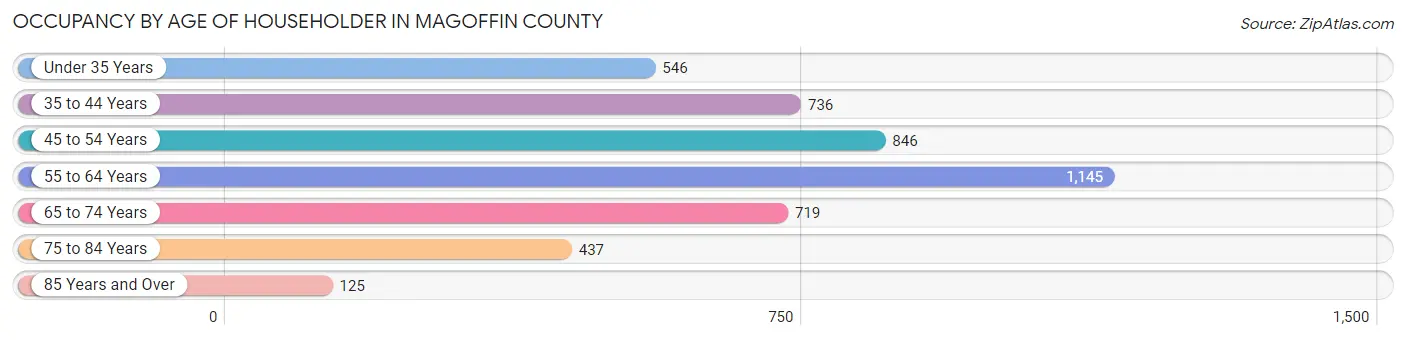
| Age Bracket | # Households | % Households |
| Under 35 Years | 546 | 12.0% |
| 35 to 44 Years | 736 | 16.2% |
| 45 to 54 Years | 846 | 18.6% |
| 55 to 64 Years | 1,145 | 25.1% |
| 65 to 74 Years | 719 | 15.8% |
| 75 to 84 Years | 437 | 9.6% |
| 85 Years and Over | 125 | 2.7% |
| Total | 4,554 | 100.0% |
Housing Finances in Magoffin County
Median Income by Occupancy in Magoffin County
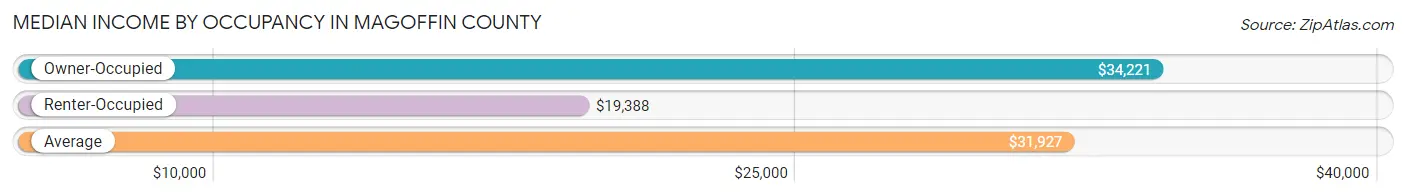
| Occupancy Type | # Households | Median Income |
| Owner-Occupied | 3,424 (75.2%) | $34,221 |
| Renter-Occupied | 1,130 (24.8%) | $19,388 |
| Average | 4,554 (100.0%) | $31,927 |
Occupancy by Householder Income Bracket in Magoffin County
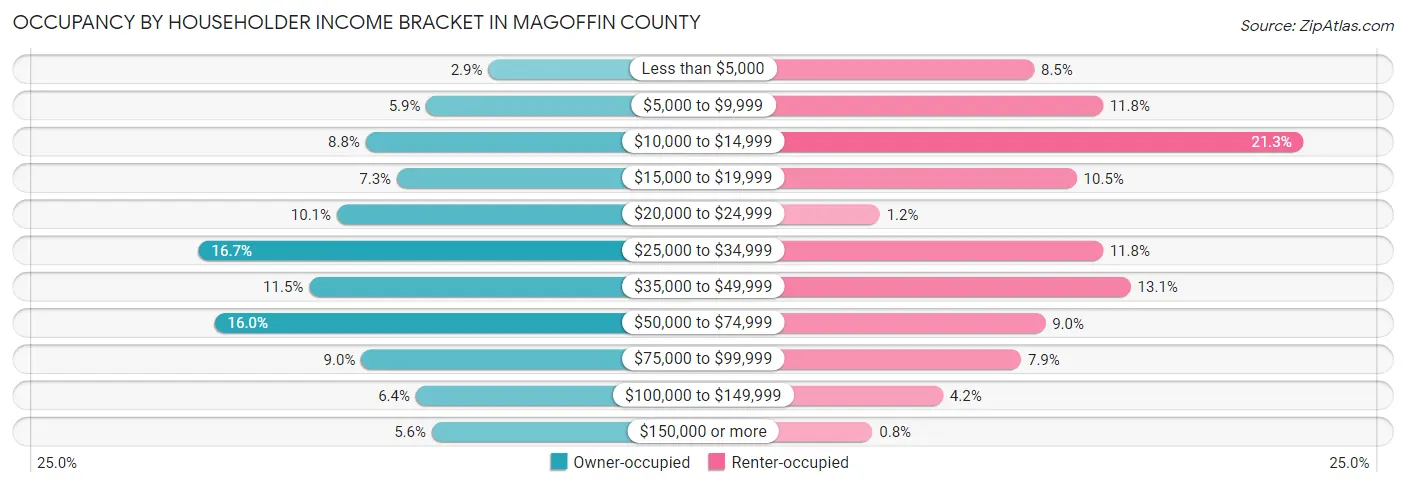
| Income Bracket | Owner-occupied | Renter-occupied |
| Less than $5,000 | 100 (2.9%) | 96 (8.5%) |
| $5,000 to $9,999 | 201 (5.9%) | 133 (11.8%) |
| $10,000 to $14,999 | 300 (8.8%) | 241 (21.3%) |
| $15,000 to $19,999 | 249 (7.3%) | 119 (10.5%) |
| $20,000 to $24,999 | 347 (10.1%) | 13 (1.1%) |
| $25,000 to $34,999 | 572 (16.7%) | 133 (11.8%) |
| $35,000 to $49,999 | 392 (11.5%) | 148 (13.1%) |
| $50,000 to $74,999 | 546 (16.0%) | 102 (9.0%) |
| $75,000 to $99,999 | 307 (9.0%) | 89 (7.9%) |
| $100,000 to $149,999 | 218 (6.4%) | 47 (4.2%) |
| $150,000 or more | 192 (5.6%) | 9 (0.8%) |
| Total | 3,424 (100.0%) | 1,130 (100.0%) |
Monthly Housing Cost Tiers in Magoffin County
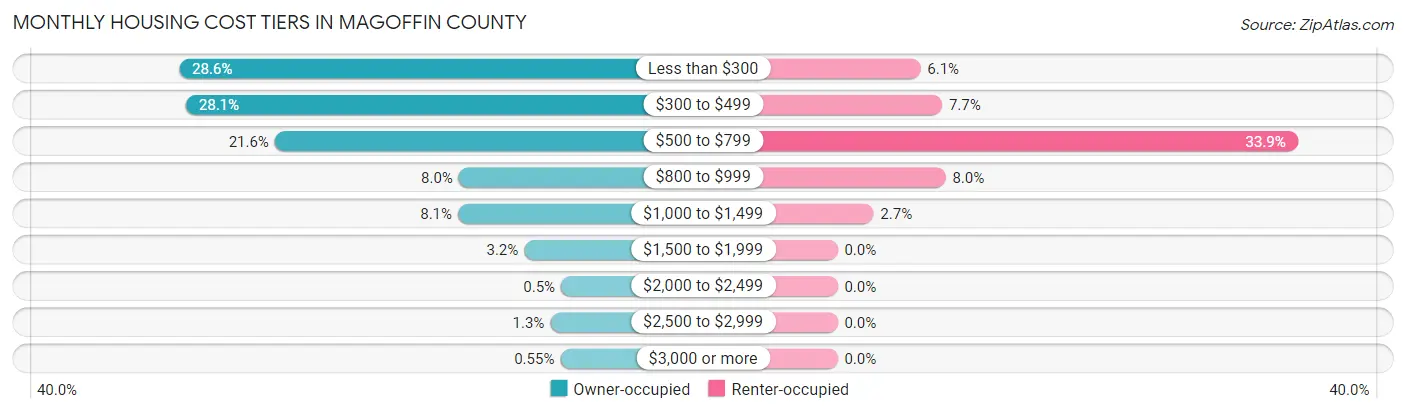
| Monthly Cost | Owner-occupied | Renter-occupied |
| Less than $300 | 980 (28.6%) | 69 (6.1%) |
| $300 to $499 | 963 (28.1%) | 87 (7.7%) |
| $500 to $799 | 739 (21.6%) | 383 (33.9%) |
| $800 to $999 | 275 (8.0%) | 90 (8.0%) |
| $1,000 to $1,499 | 277 (8.1%) | 30 (2.6%) |
| $1,500 to $1,999 | 110 (3.2%) | 0 (0.0%) |
| $2,000 to $2,499 | 17 (0.5%) | 0 (0.0%) |
| $2,500 to $2,999 | 44 (1.3%) | 0 (0.0%) |
| $3,000 or more | 19 (0.5%) | 0 (0.0%) |
| Total | 3,424 (100.0%) | 1,130 (100.0%) |
Physical Housing Characteristics in Magoffin County
Housing Structures in Magoffin County
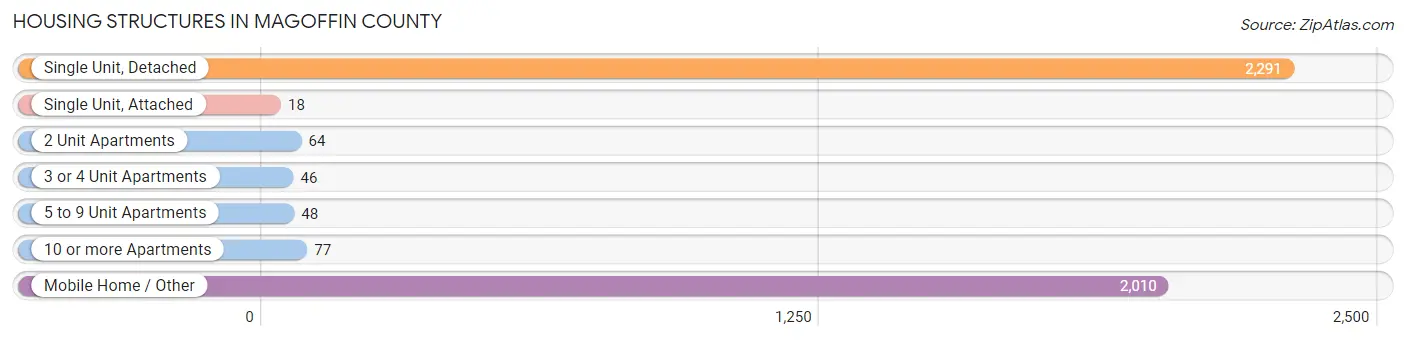
| Structure Type | # Housing Units | % Housing Units |
| Single Unit, Detached | 2,291 | 50.3% |
| Single Unit, Attached | 18 | 0.4% |
| 2 Unit Apartments | 64 | 1.4% |
| 3 or 4 Unit Apartments | 46 | 1.0% |
| 5 to 9 Unit Apartments | 48 | 1.1% |
| 10 or more Apartments | 77 | 1.7% |
| Mobile Home / Other | 2,010 | 44.1% |
| Total | 4,554 | 100.0% |
Housing Structures by Occupancy in Magoffin County
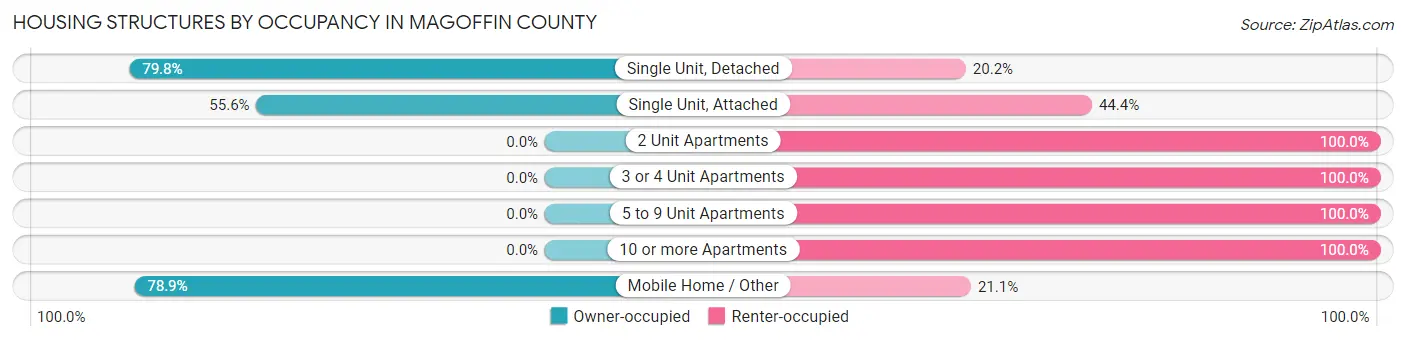
| Structure Type | Owner-occupied | Renter-occupied |
| Single Unit, Detached | 1,829 (79.8%) | 462 (20.2%) |
| Single Unit, Attached | 10 (55.6%) | 8 (44.4%) |
| 2 Unit Apartments | 0 (0.0%) | 64 (100.0%) |
| 3 or 4 Unit Apartments | 0 (0.0%) | 46 (100.0%) |
| 5 to 9 Unit Apartments | 0 (0.0%) | 48 (100.0%) |
| 10 or more Apartments | 0 (0.0%) | 77 (100.0%) |
| Mobile Home / Other | 1,585 (78.9%) | 425 (21.1%) |
| Total | 3,424 (75.2%) | 1,130 (24.8%) |
Housing Structures by Number of Rooms in Magoffin County
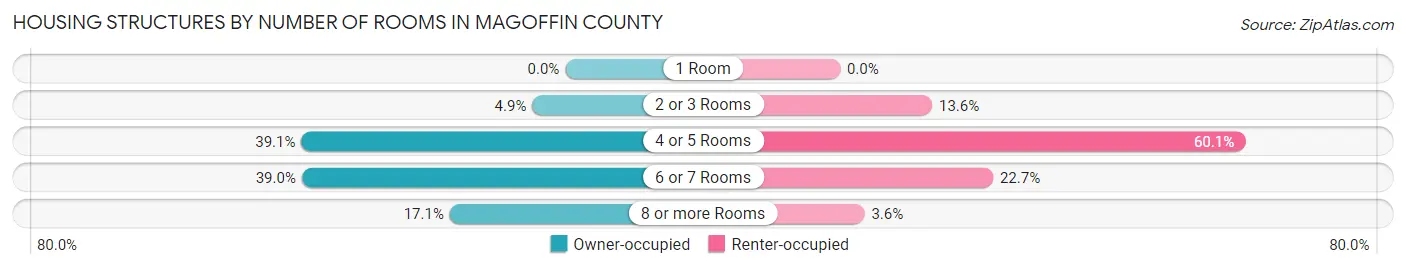
| Number of Rooms | Owner-occupied | Renter-occupied |
| 1 Room | 0 (0.0%) | 0 (0.0%) |
| 2 or 3 Rooms | 167 (4.9%) | 154 (13.6%) |
| 4 or 5 Rooms | 1,337 (39.1%) | 679 (60.1%) |
| 6 or 7 Rooms | 1,335 (39.0%) | 256 (22.7%) |
| 8 or more Rooms | 585 (17.1%) | 41 (3.6%) |
| Total | 3,424 (100.0%) | 1,130 (100.0%) |
Housing Structure by Heating Type in Magoffin County
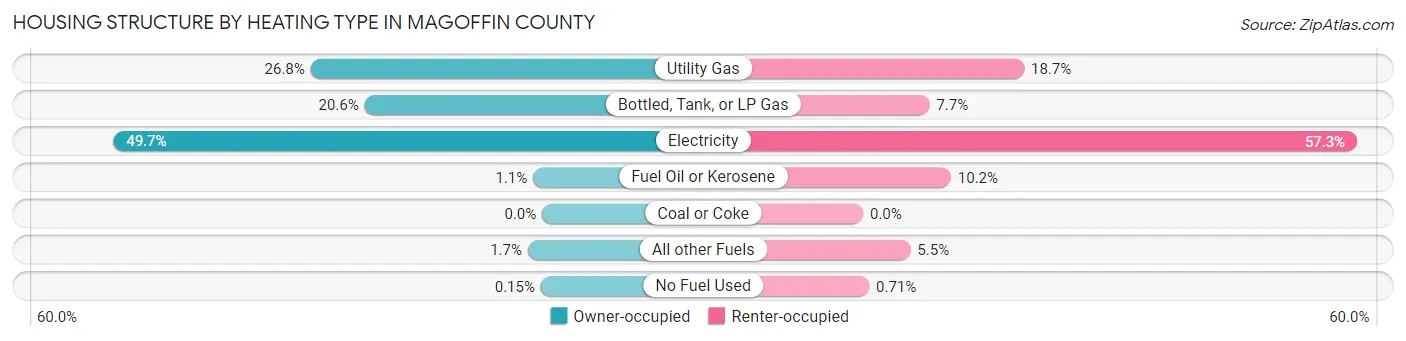
| Heating Type | Owner-occupied | Renter-occupied |
| Utility Gas | 919 (26.8%) | 211 (18.7%) |
| Bottled, Tank, or LP Gas | 705 (20.6%) | 87 (7.7%) |
| Electricity | 1,702 (49.7%) | 647 (57.3%) |
| Fuel Oil or Kerosene | 36 (1.1%) | 115 (10.2%) |
| Coal or Coke | 0 (0.0%) | 0 (0.0%) |
| All other Fuels | 57 (1.7%) | 62 (5.5%) |
| No Fuel Used | 5 (0.2%) | 8 (0.7%) |
| Total | 3,424 (100.0%) | 1,130 (100.0%) |
Household Vehicle Usage in Magoffin County
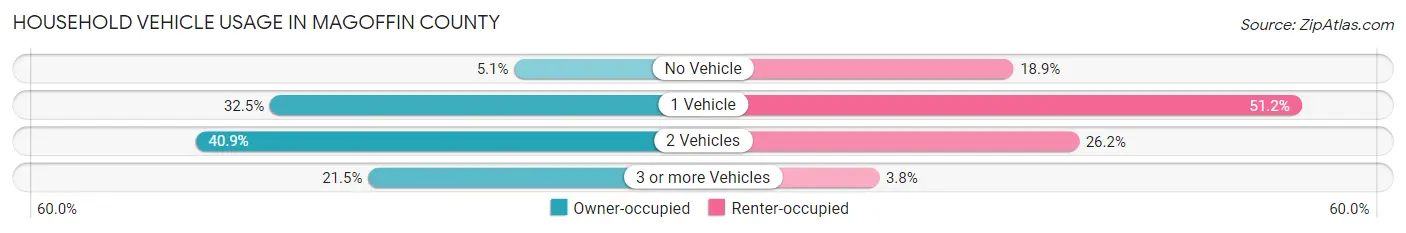
| Vehicles per Household | Owner-occupied | Renter-occupied |
| No Vehicle | 176 (5.1%) | 213 (18.9%) |
| 1 Vehicle | 1,113 (32.5%) | 578 (51.1%) |
| 2 Vehicles | 1,399 (40.9%) | 296 (26.2%) |
| 3 or more Vehicles | 736 (21.5%) | 43 (3.8%) |
| Total | 3,424 (100.0%) | 1,130 (100.0%) |
Real Estate & Mortgages in Magoffin County
Real Estate and Mortgage Overview in Magoffin County
| Characteristic | Without Mortgage | With Mortgage |
| Housing Units | 2,577 | 847 |
| Median Property Value | $68,800 | $126,200 |
| Median Household Income | $30,351 | $48 |
| Monthly Housing Costs | $371 | $0 |
| Real Estate Taxes | $464 | $121 |
Property Value by Mortgage Status in Magoffin County
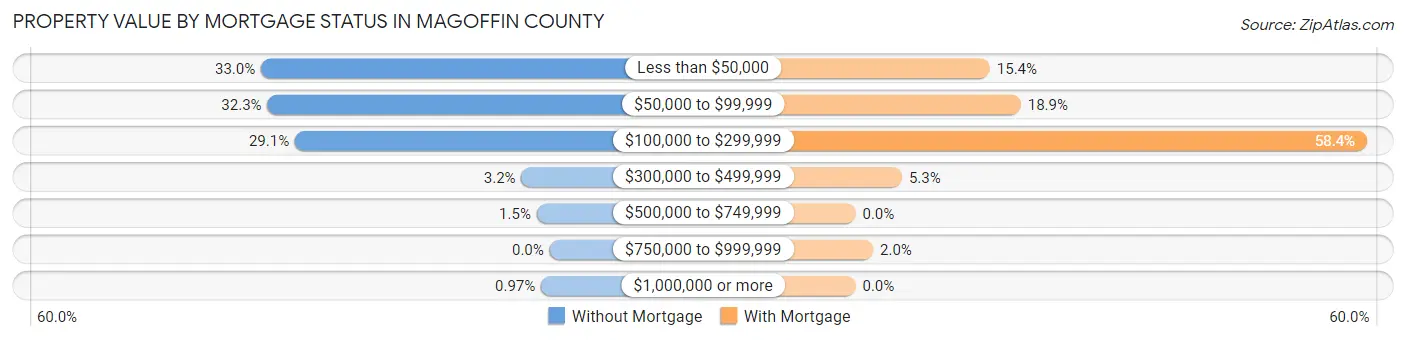
| Property Value | Without Mortgage | With Mortgage |
| Less than $50,000 | 850 (33.0%) | 130 (15.3%) |
| $50,000 to $99,999 | 831 (32.3%) | 160 (18.9%) |
| $100,000 to $299,999 | 750 (29.1%) | 495 (58.4%) |
| $300,000 to $499,999 | 83 (3.2%) | 45 (5.3%) |
| $500,000 to $749,999 | 38 (1.5%) | 0 (0.0%) |
| $750,000 to $999,999 | 0 (0.0%) | 17 (2.0%) |
| $1,000,000 or more | 25 (1.0%) | 0 (0.0%) |
| Total | 2,577 (100.0%) | 847 (100.0%) |
Household Income by Mortgage Status in Magoffin County
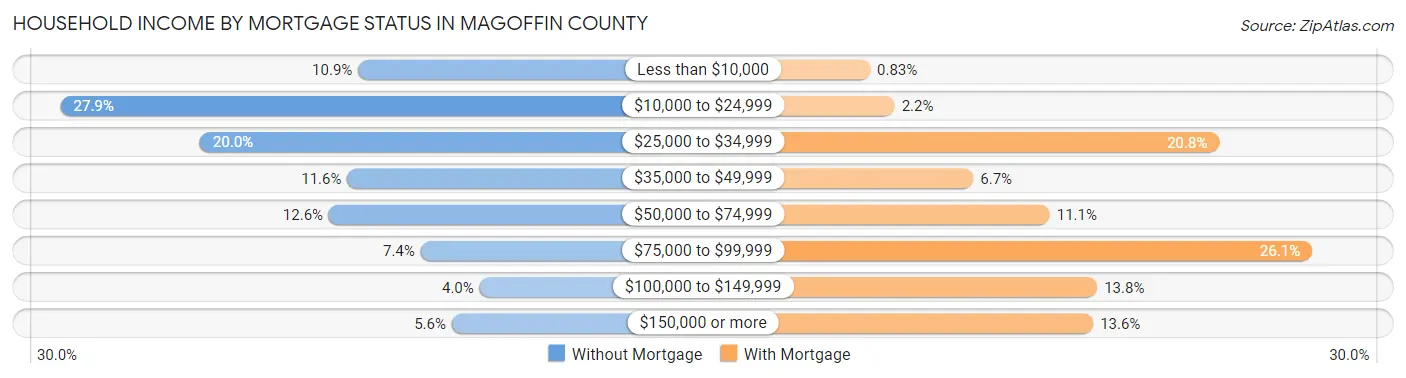
| Household Income | Without Mortgage | With Mortgage |
| Less than $10,000 | 282 (10.9%) | 7 (0.8%) |
| $10,000 to $24,999 | 720 (27.9%) | 19 (2.2%) |
| $25,000 to $34,999 | 515 (20.0%) | 176 (20.8%) |
| $35,000 to $49,999 | 298 (11.6%) | 57 (6.7%) |
| $50,000 to $74,999 | 325 (12.6%) | 94 (11.1%) |
| $75,000 to $99,999 | 190 (7.4%) | 221 (26.1%) |
| $100,000 to $149,999 | 103 (4.0%) | 117 (13.8%) |
| $150,000 or more | 144 (5.6%) | 115 (13.6%) |
| Total | 2,577 (100.0%) | 847 (100.0%) |
Property Value to Household Income Ratio in Magoffin County
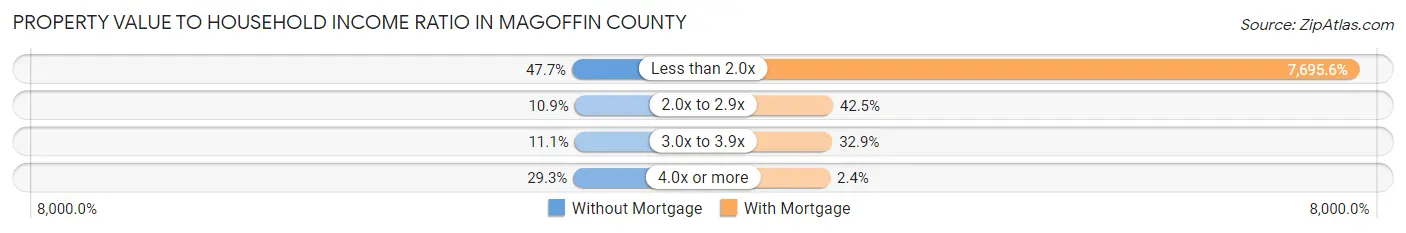
| Value-to-Income Ratio | Without Mortgage | With Mortgage |
| Less than 2.0x | 1,228 (47.6%) | 65,182 (7,695.6%) |
| 2.0x to 2.9x | 280 (10.9%) | 360 (42.5%) |
| 3.0x to 3.9x | 285 (11.1%) | 279 (32.9%) |
| 4.0x or more | 755 (29.3%) | 20 (2.4%) |
| Total | 2,577 (100.0%) | 847 (100.0%) |
Real Estate Taxes by Mortgage Status in Magoffin County
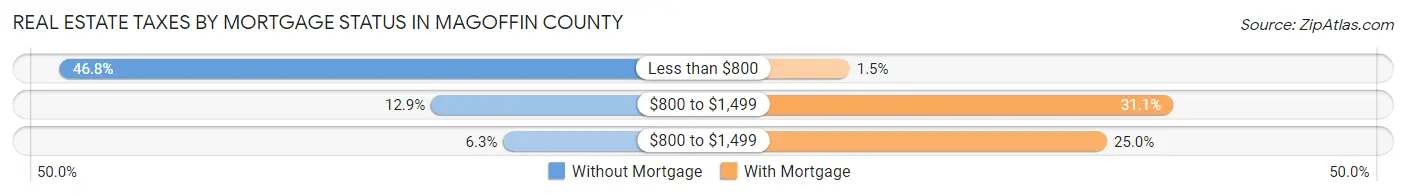
| Property Taxes | Without Mortgage | With Mortgage |
| Less than $800 | 1,205 (46.8%) | 13 (1.5%) |
| $800 to $1,499 | 332 (12.9%) | 263 (31.0%) |
| $800 to $1,499 | 162 (6.3%) | 212 (25.0%) |
| Total | 2,577 (100.0%) | 847 (100.0%) |
Health & Disability in Magoffin County
Health Insurance Coverage by Age in Magoffin County
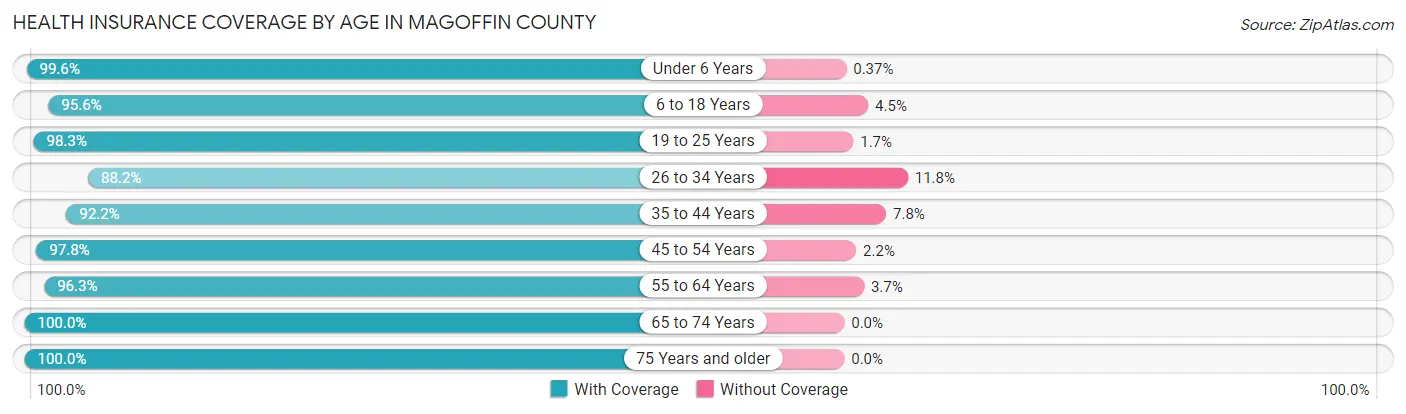
| Age Bracket | With Coverage | Without Coverage |
| Under 6 Years | 810 (99.6%) | 3 (0.4%) |
| 6 to 18 Years | 1,826 (95.6%) | 85 (4.4%) |
| 19 to 25 Years | 759 (98.3%) | 13 (1.7%) |
| 26 to 34 Years | 1,162 (88.2%) | 156 (11.8%) |
| 35 to 44 Years | 1,230 (92.2%) | 104 (7.8%) |
| 45 to 54 Years | 1,591 (97.8%) | 36 (2.2%) |
| 55 to 64 Years | 1,678 (96.3%) | 64 (3.7%) |
| 65 to 74 Years | 1,257 (100.0%) | 0 (0.0%) |
| 75 Years and older | 744 (100.0%) | 0 (0.0%) |
| Total | 11,057 (96.0%) | 461 (4.0%) |
Health Insurance Coverage by Citizenship Status in Magoffin County
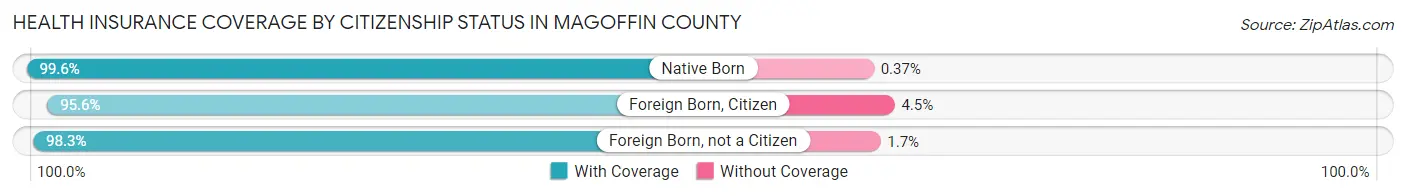
| Citizenship Status | With Coverage | Without Coverage |
| Native Born | 810 (99.6%) | 3 (0.4%) |
| Foreign Born, Citizen | 1,826 (95.6%) | 85 (4.4%) |
| Foreign Born, not a Citizen | 759 (98.3%) | 13 (1.7%) |
Health Insurance Coverage by Household Income in Magoffin County
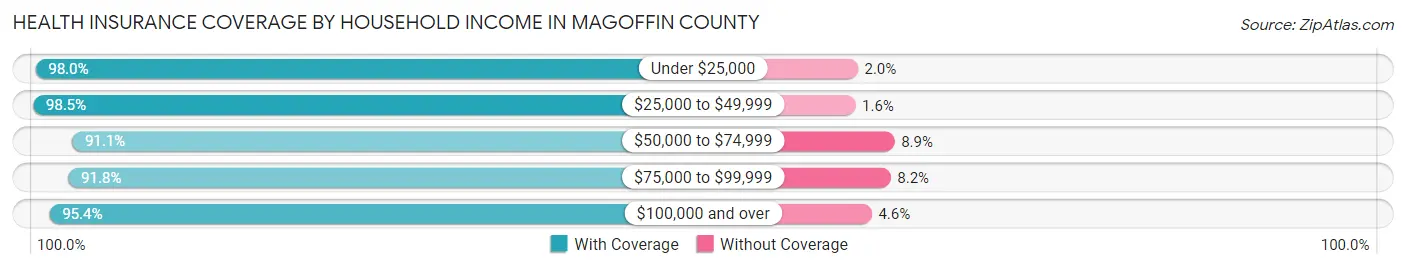
| Household Income | With Coverage | Without Coverage |
| Under $25,000 | 3,270 (98.0%) | 67 (2.0%) |
| $25,000 to $49,999 | 3,419 (98.5%) | 54 (1.5%) |
| $50,000 to $74,999 | 1,796 (91.1%) | 175 (8.9%) |
| $75,000 to $99,999 | 1,002 (91.8%) | 89 (8.2%) |
| $100,000 and over | 1,570 (95.4%) | 76 (4.6%) |
Public vs Private Health Insurance Coverage by Age in Magoffin County
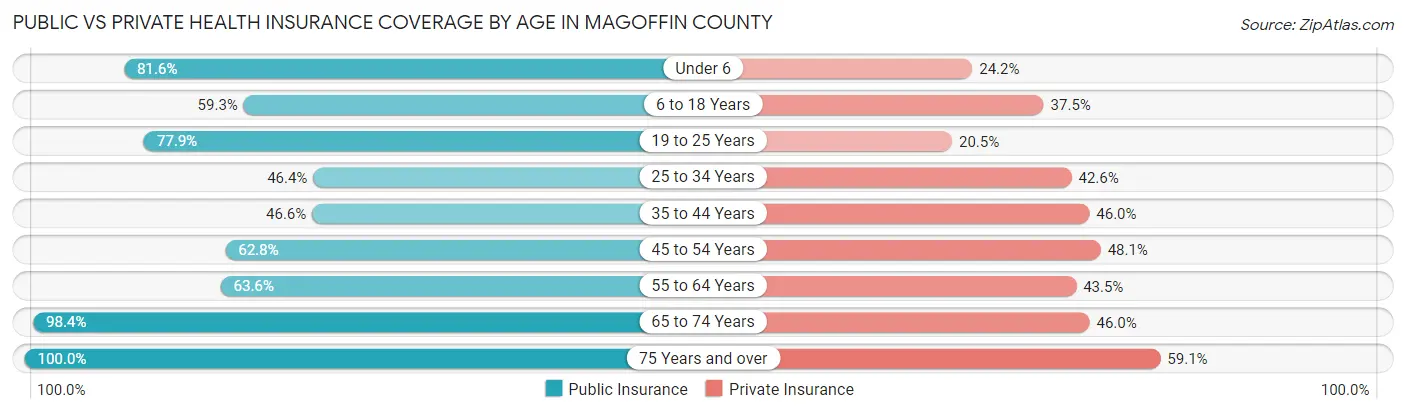
| Age Bracket | Public Insurance | Private Insurance |
| Under 6 | 663 (81.6%) | 197 (24.2%) |
| 6 to 18 Years | 1,134 (59.3%) | 716 (37.5%) |
| 19 to 25 Years | 601 (77.8%) | 158 (20.5%) |
| 25 to 34 Years | 612 (46.4%) | 562 (42.6%) |
| 35 to 44 Years | 622 (46.6%) | 613 (46.0%) |
| 45 to 54 Years | 1,021 (62.7%) | 782 (48.1%) |
| 55 to 64 Years | 1,108 (63.6%) | 758 (43.5%) |
| 65 to 74 Years | 1,237 (98.4%) | 578 (46.0%) |
| 75 Years and over | 744 (100.0%) | 440 (59.1%) |
| Total | 7,742 (67.2%) | 4,804 (41.7%) |
Disability Status by Sex by Age in Magoffin County
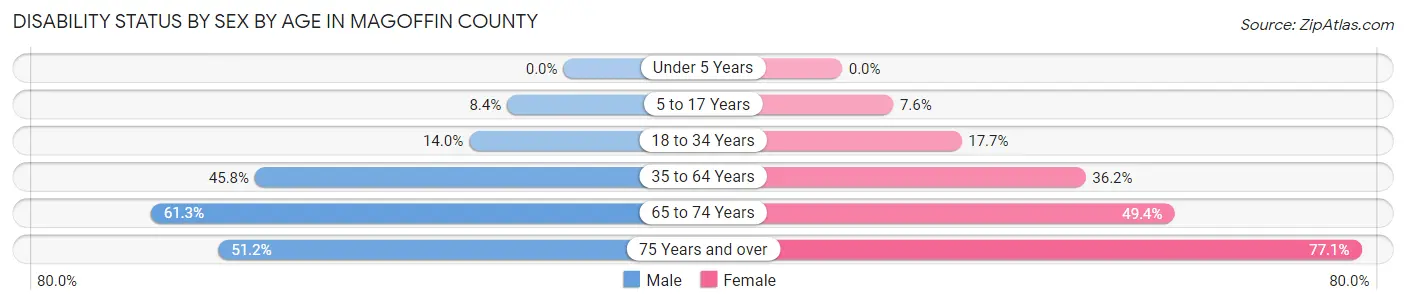
| Age Bracket | Male | Female |
| Under 5 Years | 0 (0.0%) | 0 (0.0%) |
| 5 to 17 Years | 82 (8.4%) | 71 (7.6%) |
| 18 to 34 Years | 160 (14.0%) | 188 (17.7%) |
| 35 to 64 Years | 1,103 (45.8%) | 830 (36.2%) |
| 65 to 74 Years | 373 (61.3%) | 320 (49.4%) |
| 75 Years and over | 166 (51.2%) | 324 (77.1%) |
Disability Class by Sex by Age in Magoffin County
Disability Class: Hearing Difficulty
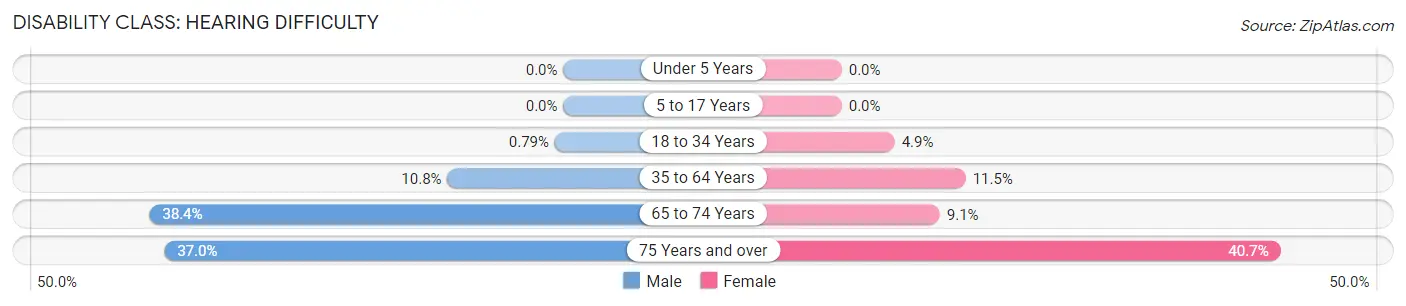
| Age Bracket | Male | Female |
| Under 5 Years | 0 (0.0%) | 0 (0.0%) |
| 5 to 17 Years | 0 (0.0%) | 0 (0.0%) |
| 18 to 34 Years | 9 (0.8%) | 52 (4.9%) |
| 35 to 64 Years | 259 (10.8%) | 264 (11.5%) |
| 65 to 74 Years | 234 (38.4%) | 59 (9.1%) |
| 75 Years and over | 120 (37.0%) | 171 (40.7%) |
Disability Class: Vision Difficulty
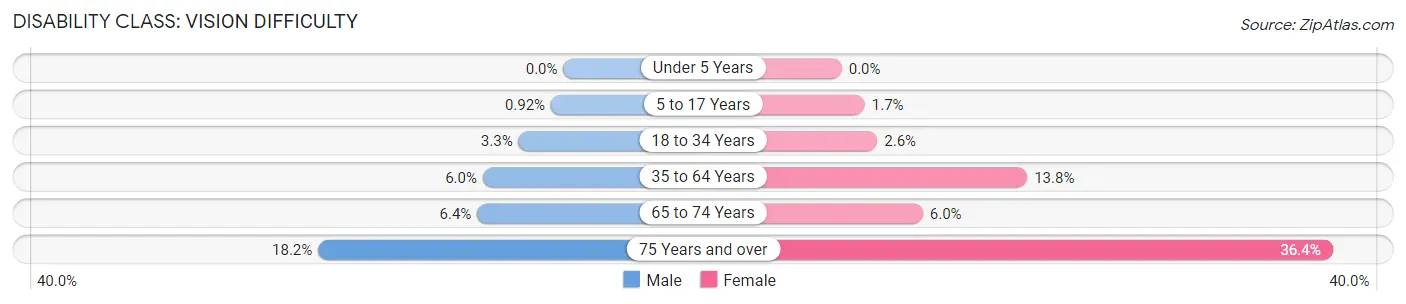
| Age Bracket | Male | Female |
| Under 5 Years | 0 (0.0%) | 0 (0.0%) |
| 5 to 17 Years | 9 (0.9%) | 16 (1.7%) |
| 18 to 34 Years | 38 (3.3%) | 28 (2.6%) |
| 35 to 64 Years | 144 (6.0%) | 316 (13.8%) |
| 65 to 74 Years | 39 (6.4%) | 39 (6.0%) |
| 75 Years and over | 59 (18.2%) | 153 (36.4%) |
Disability Class: Cognitive Difficulty
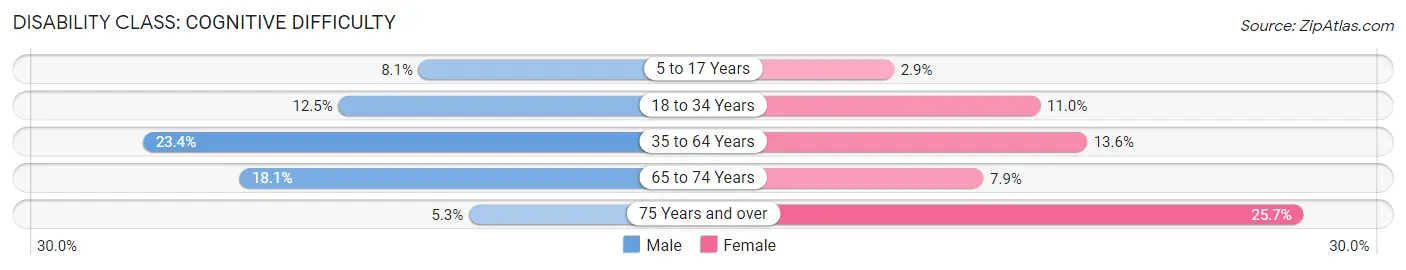
| Age Bracket | Male | Female |
| 5 to 17 Years | 79 (8.1%) | 27 (2.9%) |
| 18 to 34 Years | 143 (12.5%) | 117 (11.0%) |
| 35 to 64 Years | 564 (23.4%) | 313 (13.6%) |
| 65 to 74 Years | 110 (18.1%) | 51 (7.9%) |
| 75 Years and over | 17 (5.2%) | 108 (25.7%) |
Disability Class: Ambulatory Difficulty
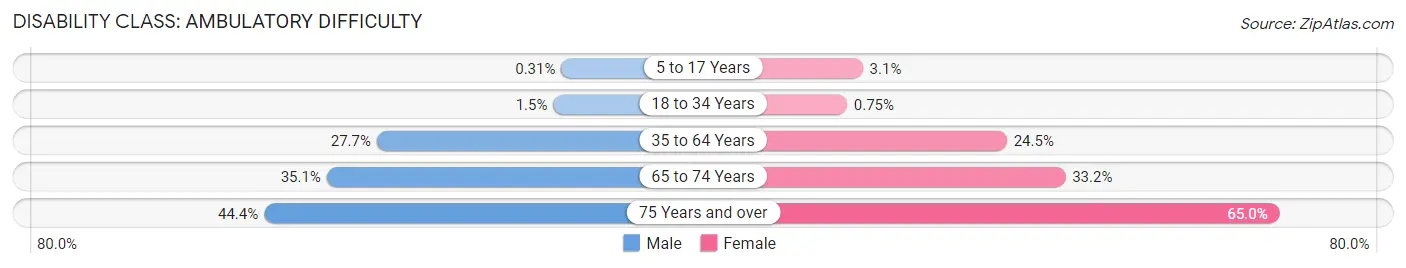
| Age Bracket | Male | Female |
| 5 to 17 Years | 3 (0.3%) | 29 (3.1%) |
| 18 to 34 Years | 17 (1.5%) | 8 (0.7%) |
| 35 to 64 Years | 667 (27.7%) | 562 (24.5%) |
| 65 to 74 Years | 214 (35.1%) | 215 (33.2%) |
| 75 Years and over | 144 (44.4%) | 273 (65.0%) |
Disability Class: Self-Care Difficulty
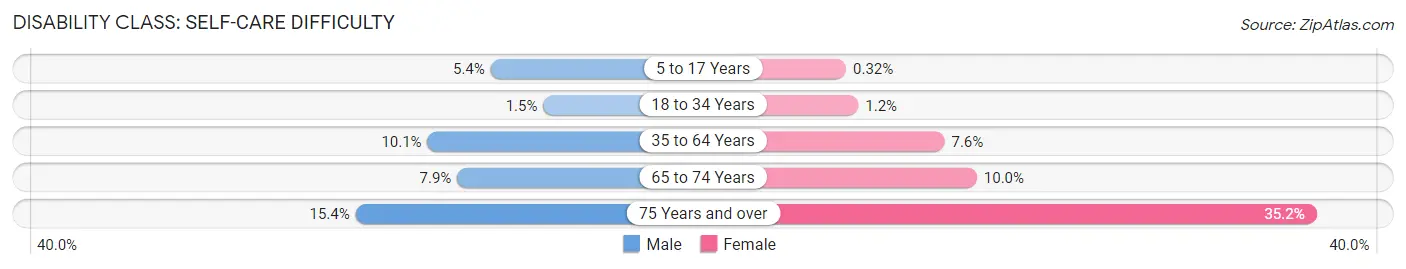
| Age Bracket | Male | Female |
| 5 to 17 Years | 53 (5.4%) | 3 (0.3%) |
| 18 to 34 Years | 17 (1.5%) | 13 (1.2%) |
| 35 to 64 Years | 243 (10.1%) | 175 (7.6%) |
| 65 to 74 Years | 48 (7.9%) | 65 (10.0%) |
| 75 Years and over | 50 (15.4%) | 148 (35.2%) |
Technology Access in Magoffin County
Computing Device Access in Magoffin County
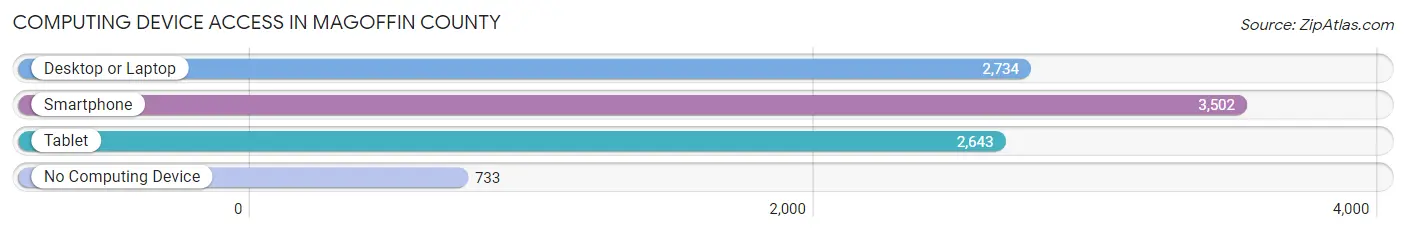
| Device Type | # Households | % Households |
| Desktop or Laptop | 2,734 | 60.0% |
| Smartphone | 3,502 | 76.9% |
| Tablet | 2,643 | 58.0% |
| No Computing Device | 733 | 16.1% |
| Total | 4,554 | 100.0% |
Internet Access in Magoffin County
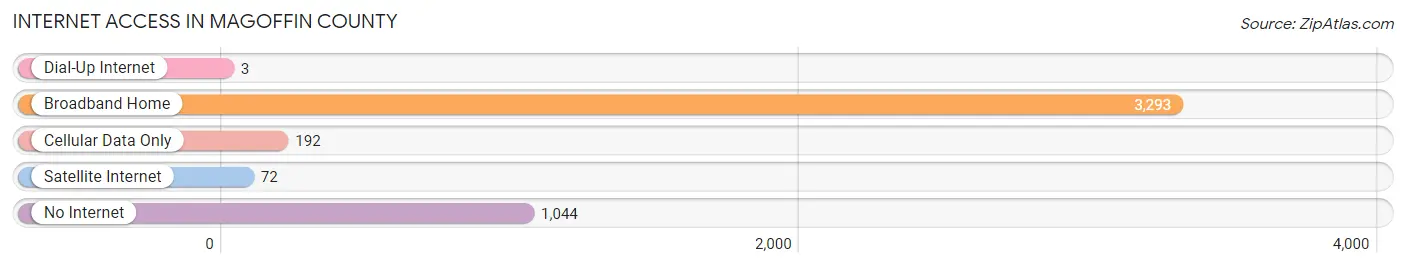
| Internet Type | # Households | % Households |
| Dial-Up Internet | 3 | 0.1% |
| Broadband Home | 3,293 | 72.3% |
| Cellular Data Only | 192 | 4.2% |
| Satellite Internet | 72 | 1.6% |
| No Internet | 1,044 | 22.9% |
| Total | 4,554 | 100.0% |
Magoffin County Summary
Magoffin County is located in the eastern part of Kentucky, in the foothills of the Appalachian Mountains. It is bordered by Floyd County to the north, Johnson County to the east, Morgan County to the south, and Wolfe County to the west. The county seat is Salyersville, and the county was formed in 1860 from parts of Floyd, Johnson, and Morgan counties. The county is named for Beriah Magoffin, who was the Governor of Kentucky from 1859 to 1862.
Geography
Magoffin County has an area of 437 square miles, of which 435 square miles is land and 2 square miles is water. The terrain is mostly hilly, with the highest point being the summit of Big Sandy Mountain at 2,890 feet. The county is drained by the Licking River, which flows through the county from north to south. The county is also home to several creeks, including Big Branch, Little Branch, and Indian Creek.
The climate of Magoffin County is humid subtropical, with hot summers and mild winters. The average annual temperature is 57°F, and the average annual precipitation is 45 inches.
Demographics
As of the 2010 census, the population of Magoffin County was 13,333, an increase of 4.3% from the 2000 census. The population density was 30.3 people per square mile. The racial makeup of the county was 97.2% White, 0.7% Black or African American, 0.3% Native American, 0.2% Asian, 0.1% Pacific Islander, 0.5% from other races, and 0.9% from two or more races. 1.7% of the population were Hispanic or Latino of any race.
The median household income in Magoffin County was $22,813, and the median family income was $27,917. The per capita income was $13,945. About 24.2% of the population was below the poverty line.
Economy
The economy of Magoffin County is largely based on agriculture and forestry. The county is home to several large farms, and the main crops grown are corn, soybeans, hay, and tobacco. The county is also home to several timber companies, which harvest timber from the county's forests.
The county is also home to several small businesses, including restaurants, retail stores, and service businesses. The county is home to several manufacturing companies, including a furniture factory and a plastics factory.
The county is served by the Salyersville-Magoffin County Airport, which offers general aviation services. The county is also served by several state and federal highways, including US Route 460 and Kentucky Route 114.
Conclusion
Magoffin County is a rural county located in the eastern part of Kentucky. The county is home to a diverse economy, with agriculture and forestry being the main industries. The county is also home to several small businesses, and is served by the Salyersville-Magoffin County Airport. The population of the county is 13,333, and the median household income is $22,813.
Common Questions
What is Per Capita Income in Magoffin County?
Per Capita income in Magoffin County is $19,582.
What is the Median Family Income in Magoffin County?
Median Family Income in Magoffin County is $40,097.
What is the Median Household income in Magoffin County?
Median Household Income in Magoffin County is $31,927.
What is Income or Wage Gap in Magoffin County?
Income or Wage Gap in Magoffin County is 35.6%.
Women in Magoffin County earn 64.4 cents for every dollar earned by a man.
What is Family Income Deficit in Magoffin County?
Family Income Deficit in Magoffin County is $10,011.
Families that are below poverty line in Magoffin County earn $10,011 less on average than the poverty threshold level.
What is Inequality or Gini Index in Magoffin County?
Inequality or Gini Index in Magoffin County is 0.49.
What is the Total Population of Magoffin County?
Total Population of Magoffin County is 11,647.
What is the Total Male Population of Magoffin County?
Total Male Population of Magoffin County is 5,888.
What is the Total Female Population of Magoffin County?
Total Female Population of Magoffin County is 5,759.
What is the Ratio of Males per 100 Females in Magoffin County?
There are 102.24 Males per 100 Females in Magoffin County.
What is the Ratio of Females per 100 Males in Magoffin County?
There are 97.81 Females per 100 Males in Magoffin County.
What is the Median Population Age in Magoffin County?
Median Population Age in Magoffin County is 41.4 Years.
What is the Average Family Size in Magoffin County
Average Family Size in Magoffin County is 3.2 People.
What is the Average Household Size in Magoffin County
Average Household Size in Magoffin County is 2.5 People.
How Large is the Labor Force in Magoffin County?
There are 3,422 People in the Labor Forcein in Magoffin County.
What is the Percentage of People in the Labor Force in Magoffin County?
36.8% of People are in the Labor Force in Magoffin County.
What is the Unemployment Rate in Magoffin County?
Unemployment Rate in Magoffin County is 12.8%.