Lincoln County, KY Map & Demographics
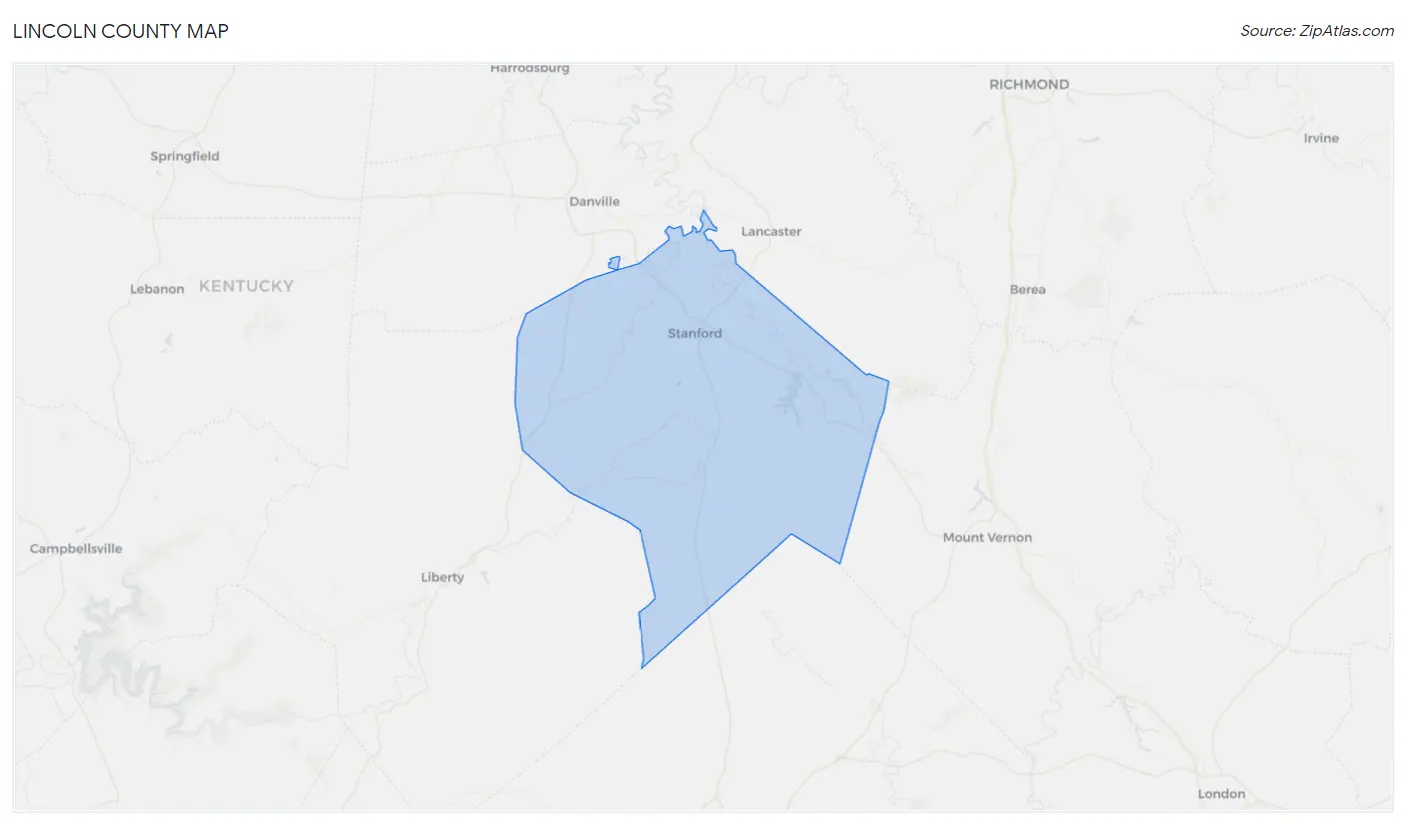
Lincoln County Map
Lincoln County Overview
$25,972
PER CAPITA INCOME
$58,639
AVG FAMILY INCOME
$49,487
AVG HOUSEHOLD INCOME
28.3%
WAGE / INCOME GAP [ % ]
71.7¢/ $1
WAGE / INCOME GAP [ $ ]
$9,023
FAMILY INCOME DEFICIT
0.45
INEQUALITY / GINI INDEX
24,320
TOTAL POPULATION
11,989
MALE POPULATION
12,331
FEMALE POPULATION
97.23
MALES / 100 FEMALES
102.85
FEMALES / 100 MALES
41.4
MEDIAN AGE
2.9
AVG FAMILY SIZE
2.5
AVG HOUSEHOLD SIZE
10,564
LABOR FORCE [ PEOPLE ]
55.1%
PERCENT IN LABOR FORCE
6.6%
UNEMPLOYMENT RATE
Lincoln County Area Codes
Income in Lincoln County
Income Overview in Lincoln County
Per Capita Income in Lincoln County is $25,972, while median incomes of families and households are $58,639 and $49,487 respectively.
| Characteristic | Number | Measure |
| Per Capita Income | 24,320 | $25,972 |
| Median Family Income | 6,897 | $58,639 |
| Mean Family Income | 6,897 | $74,964 |
| Median Household Income | 9,692 | $49,487 |
| Mean Household Income | 9,692 | $65,270 |
| Income Deficit | 6,897 | $9,023 |
| Wage / Income Gap (%) | 24,320 | 28.27% |
| Wage / Income Gap ($) | 24,320 | 71.73¢ per $1 |
| Gini / Inequality Index | 24,320 | 0.45 |
Earnings by Sex in Lincoln County
Average Earnings in Lincoln County are $35,125, $41,187 for men and $29,543 for women, a difference of 28.3%.

| Sex | Number | Average Earnings |
| Male | 5,873 (54.0%) | $41,187 |
| Female | 4,998 (46.0%) | $29,543 |
| Total | 10,871 (100.0%) | $35,125 |
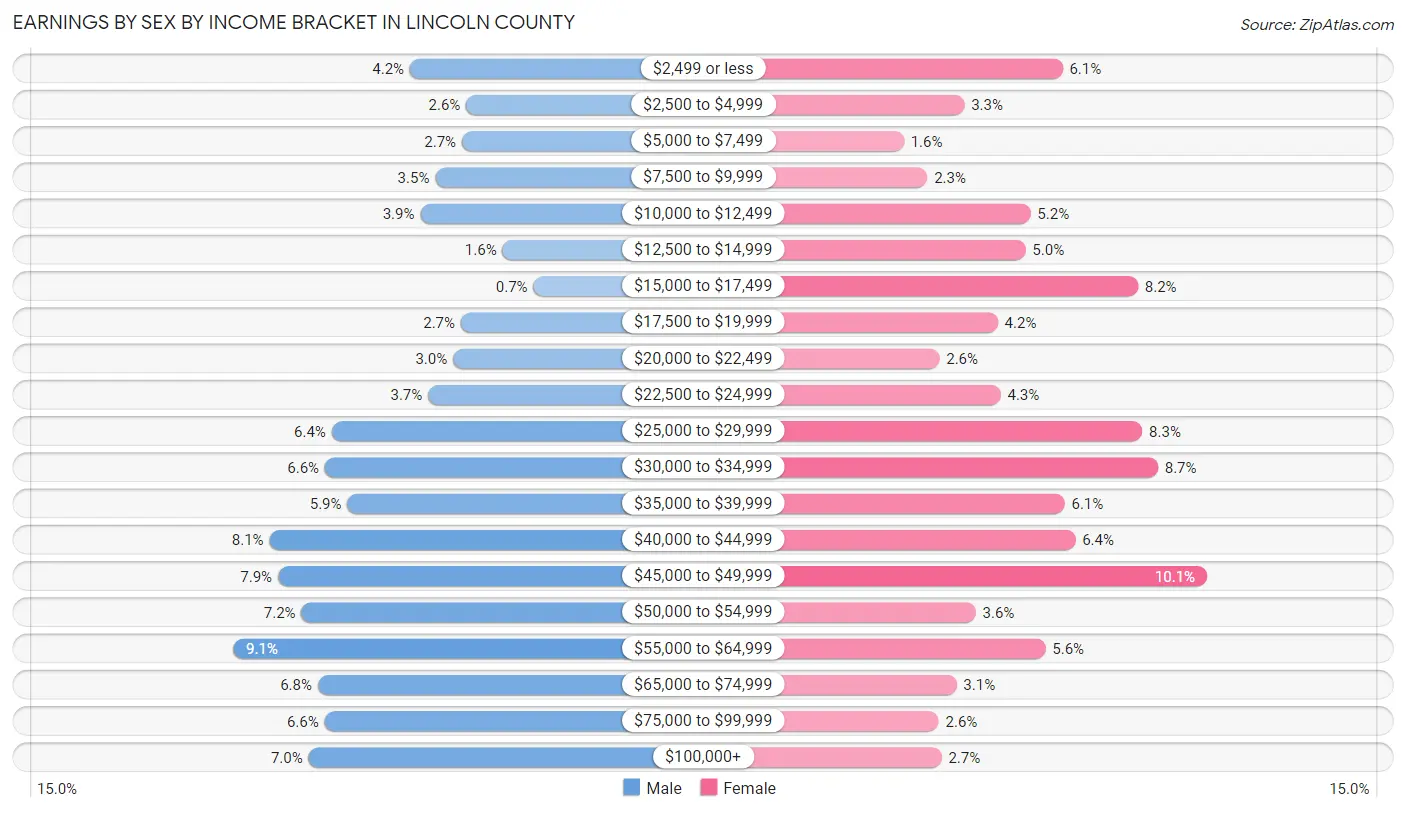
Earnings by Sex by Income Bracket in Lincoln County
The most common earnings brackets in Lincoln County are $55,000 to $64,999 for men (537 | 9.1%) and $45,000 to $49,999 for women (506 | 10.1%).
| Income | Male | Female |
| $2,499 or less | 245 (4.2%) | 303 (6.1%) |
| $2,500 to $4,999 | 152 (2.6%) | 165 (3.3%) |
| $5,000 to $7,499 | 159 (2.7%) | 80 (1.6%) |
| $7,500 to $9,999 | 203 (3.5%) | 113 (2.3%) |
| $10,000 to $12,499 | 228 (3.9%) | 258 (5.2%) |
| $12,500 to $14,999 | 92 (1.6%) | 251 (5.0%) |
| $15,000 to $17,499 | 41 (0.7%) | 409 (8.2%) |
| $17,500 to $19,999 | 161 (2.7%) | 212 (4.2%) |
| $20,000 to $22,499 | 174 (3.0%) | 130 (2.6%) |
| $22,500 to $24,999 | 215 (3.7%) | 216 (4.3%) |
| $25,000 to $29,999 | 374 (6.4%) | 415 (8.3%) |
| $30,000 to $34,999 | 385 (6.6%) | 437 (8.7%) |
| $35,000 to $39,999 | 348 (5.9%) | 306 (6.1%) |
| $40,000 to $44,999 | 477 (8.1%) | 321 (6.4%) |
| $45,000 to $49,999 | 463 (7.9%) | 506 (10.1%) |
| $50,000 to $54,999 | 424 (7.2%) | 181 (3.6%) |
| $55,000 to $64,999 | 537 (9.1%) | 279 (5.6%) |
| $65,000 to $74,999 | 397 (6.8%) | 154 (3.1%) |
| $75,000 to $99,999 | 386 (6.6%) | 129 (2.6%) |
| $100,000+ | 412 (7.0%) | 133 (2.7%) |
| Total | 5,873 (100.0%) | 4,998 (100.0%) |
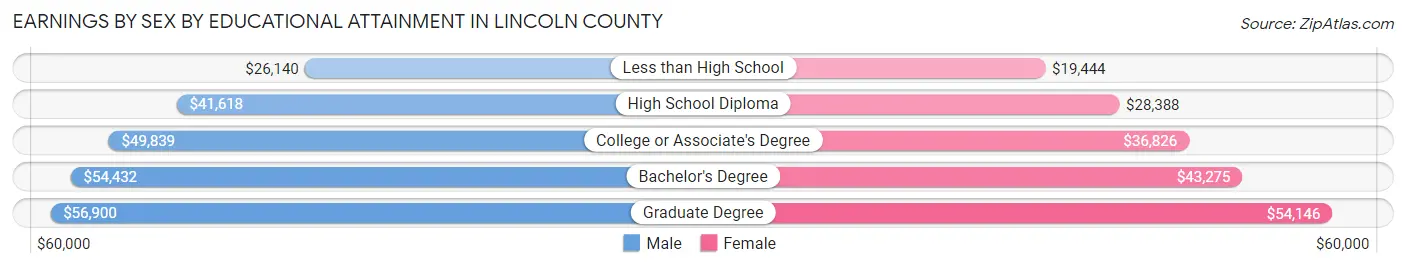
Earnings by Sex by Educational Attainment in Lincoln County
Average earnings in Lincoln County are $44,752 for men and $33,311 for women, a difference of 25.6%. Men with an educational attainment of graduate degree enjoy the highest average annual earnings of $56,900, while those with less than high school education earn the least with $26,140. Women with an educational attainment of graduate degree earn the most with the average annual earnings of $54,146, while those with less than high school education have the smallest earnings of $19,444.
| Educational Attainment | Male Income | Female Income |
| Less than High School | $26,140 | $19,444 |
| High School Diploma | $41,618 | $28,388 |
| College or Associate's Degree | $49,839 | $36,826 |
| Bachelor's Degree | $54,432 | $43,275 |
| Graduate Degree | $56,900 | $54,146 |
| Total | $44,752 | $33,311 |
Family Income in Lincoln County
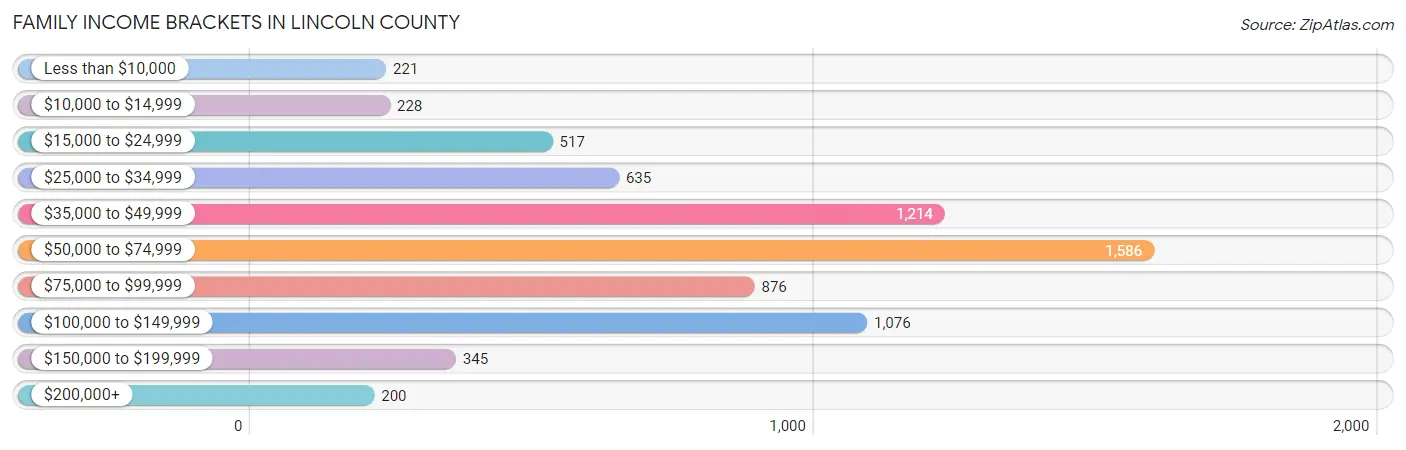
Family Income Brackets in Lincoln County
According to the Lincoln County family income data, there are 1,586 families falling into the $50,000 to $74,999 income range, which is the most common income bracket and makes up 23.0% of all families. Conversely, the $200,000+ income bracket is the least frequent group with only 200 families (2.9%) belonging to this category.
| Income Bracket | # Families | % Families |
| Less than $10,000 | 221 | 3.2% |
| $10,000 to $14,999 | 228 | 3.3% |
| $15,000 to $24,999 | 517 | 7.5% |
| $25,000 to $34,999 | 635 | 9.2% |
| $35,000 to $49,999 | 1,214 | 17.6% |
| $50,000 to $74,999 | 1,586 | 23.0% |
| $75,000 to $99,999 | 876 | 12.7% |
| $100,000 to $149,999 | 1,076 | 15.6% |
| $150,000 to $199,999 | 345 | 5.0% |
| $200,000+ | 200 | 2.9% |
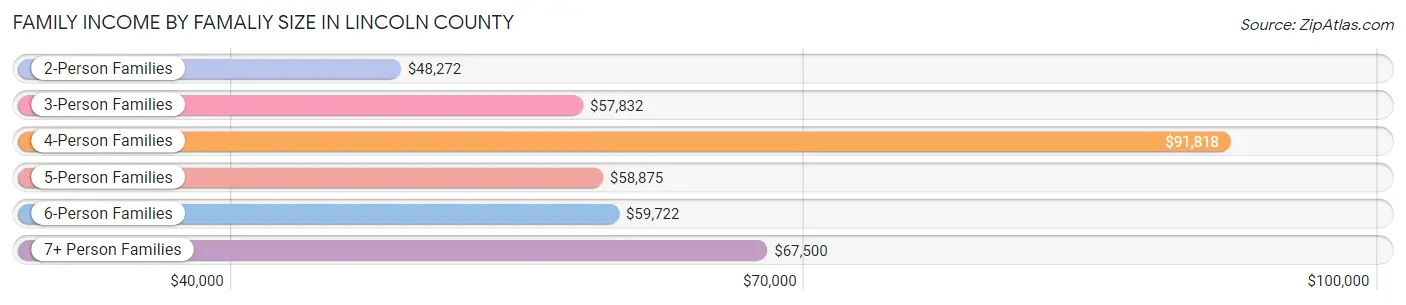
Family Income by Famaliy Size in Lincoln County
4-person families (1,356 | 19.7%) account for the highest median family income in Lincoln County with $91,818 per family, while 2-person families (3,289 | 47.7%) have the highest median income of $24,136 per family member.
| Income Bracket | # Families | Median Income |
| 2-Person Families | 3,289 (47.7%) | $48,272 |
| 3-Person Families | 1,365 (19.8%) | $57,832 |
| 4-Person Families | 1,356 (19.7%) | $91,818 |
| 5-Person Families | 577 (8.4%) | $58,875 |
| 6-Person Families | 164 (2.4%) | $59,722 |
| 7+ Person Families | 146 (2.1%) | $67,500 |
| Total | 6,897 (100.0%) | $58,639 |
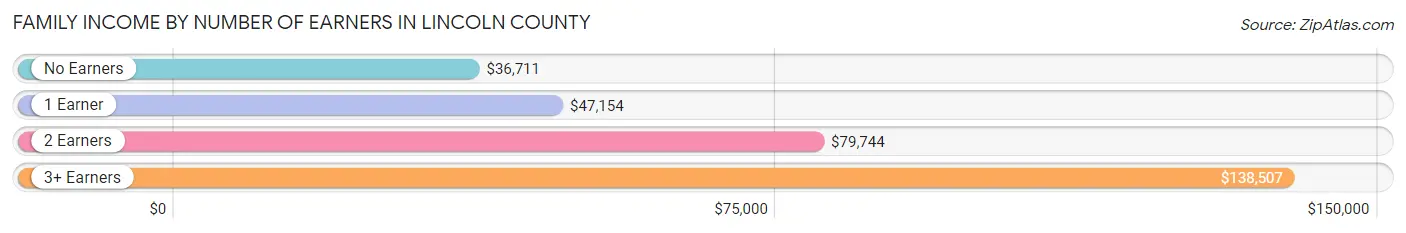
Family Income by Number of Earners in Lincoln County
The median family income in Lincoln County is $58,639, with families comprising 3+ earners (619) having the highest median family income of $138,507, while families with no earners (1,422) have the lowest median family income of $36,711, accounting for 9.0% and 20.6% of families, respectively.
| Number of Earners | # Families | Median Income |
| No Earners | 1,422 (20.6%) | $36,711 |
| 1 Earner | 2,251 (32.6%) | $47,154 |
| 2 Earners | 2,605 (37.8%) | $79,744 |
| 3+ Earners | 619 (9.0%) | $138,507 |
| Total | 6,897 (100.0%) | $58,639 |
Household Income in Lincoln County
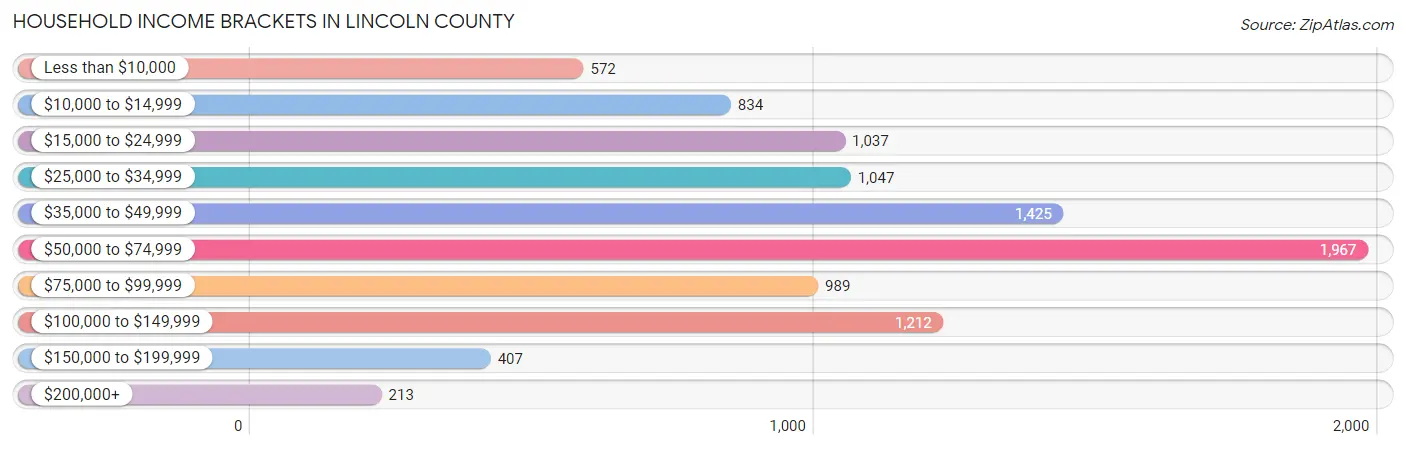
Household Income Brackets in Lincoln County
With 1,967 households falling in the category, the $50,000 to $74,999 income range is the most frequent in Lincoln County, accounting for 20.3% of all households. In contrast, only 213 households (2.2%) fall into the $200,000+ income bracket, making it the least populous group.
| Income Bracket | # Households | % Households |
| Less than $10,000 | 572 | 5.9% |
| $10,000 to $14,999 | 834 | 8.6% |
| $15,000 to $24,999 | 1,037 | 10.7% |
| $25,000 to $34,999 | 1,047 | 10.8% |
| $35,000 to $49,999 | 1,425 | 14.7% |
| $50,000 to $74,999 | 1,967 | 20.3% |
| $75,000 to $99,999 | 989 | 10.2% |
| $100,000 to $149,999 | 1,212 | 12.5% |
| $150,000 to $199,999 | 407 | 4.2% |
| $200,000+ | 213 | 2.2% |
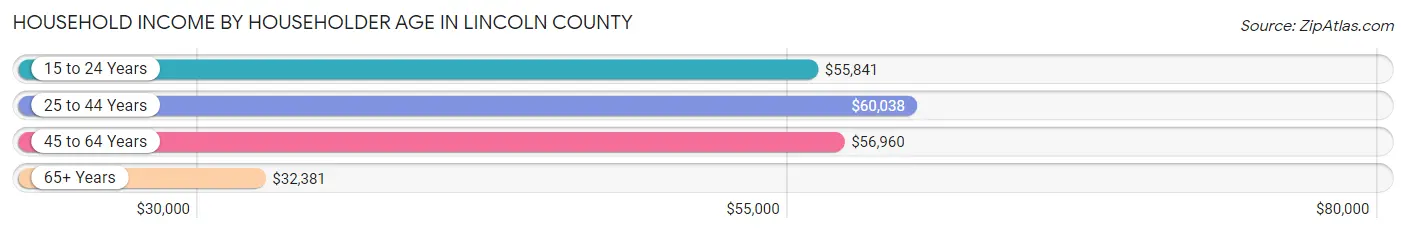
Household Income by Householder Age in Lincoln County
The median household income in Lincoln County is $49,487, with the highest median household income of $60,038 found in the 25 to 44 years age bracket for the primary householder. A total of 2,700 households (27.9%) fall into this category. Meanwhile, the 65+ years age bracket for the primary householder has the lowest median household income of $32,381, with 2,988 households (30.8%) in this group.
| Income Bracket | # Households | Median Income |
| 15 to 24 Years | 263 (2.7%) | $55,841 |
| 25 to 44 Years | 2,700 (27.9%) | $60,038 |
| 45 to 64 Years | 3,741 (38.6%) | $56,960 |
| 65+ Years | 2,988 (30.8%) | $32,381 |
| Total | 9,692 (100.0%) | $49,487 |
Poverty in Lincoln County
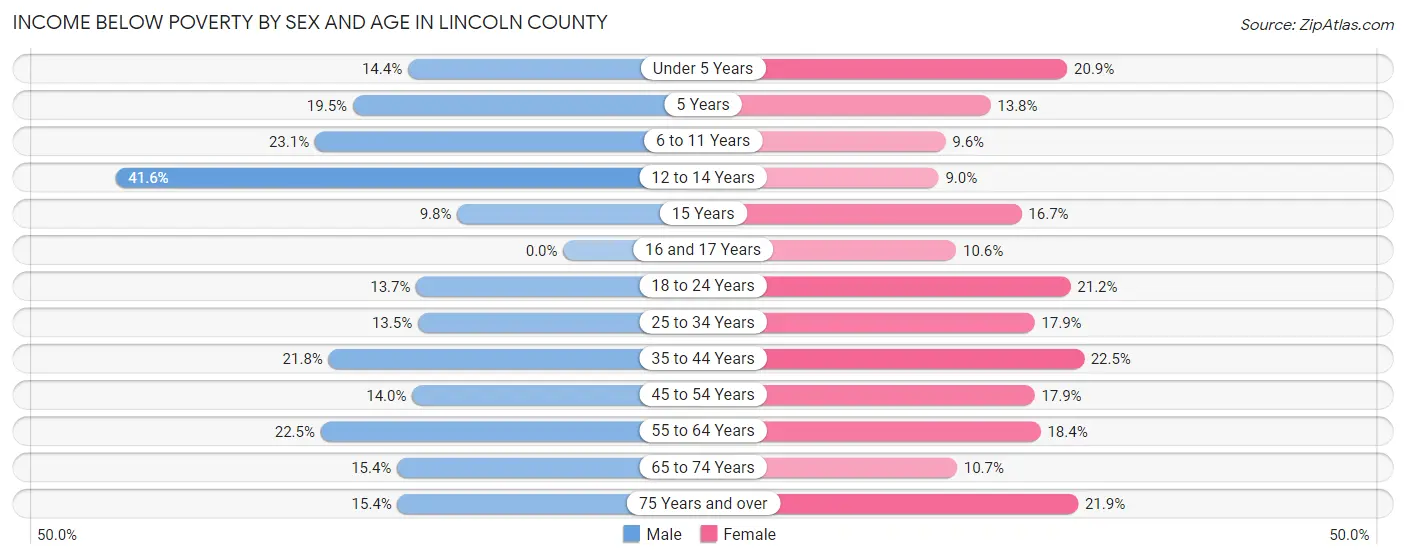
Income Below Poverty by Sex and Age in Lincoln County
With 17.5% poverty level for males and 17.2% for females among the residents of Lincoln County, 12 to 14 year old males and 35 to 44 year old females are the most vulnerable to poverty, with 138 males (41.6%) and 334 females (22.5%) in their respective age groups living below the poverty level.
| Age Bracket | Male | Female |
| Under 5 Years | 119 (14.4%) | 157 (20.9%) |
| 5 Years | 42 (19.5%) | 12 (13.8%) |
| 6 to 11 Years | 239 (23.1%) | 88 (9.6%) |
| 12 to 14 Years | 138 (41.6%) | 41 (9.0%) |
| 15 Years | 18 (9.8%) | 24 (16.7%) |
| 16 and 17 Years | 0 (0.0%) | 35 (10.6%) |
| 18 to 24 Years | 123 (13.7%) | 190 (21.2%) |
| 25 to 34 Years | 193 (13.5%) | 248 (17.9%) |
| 35 to 44 Years | 287 (21.8%) | 334 (22.5%) |
| 45 to 54 Years | 212 (14.0%) | 295 (17.9%) |
| 55 to 64 Years | 380 (22.5%) | 294 (18.4%) |
| 65 to 74 Years | 191 (15.4%) | 152 (10.7%) |
| 75 Years and over | 114 (15.4%) | 224 (21.9%) |
| Total | 2,056 (17.5%) | 2,094 (17.2%) |
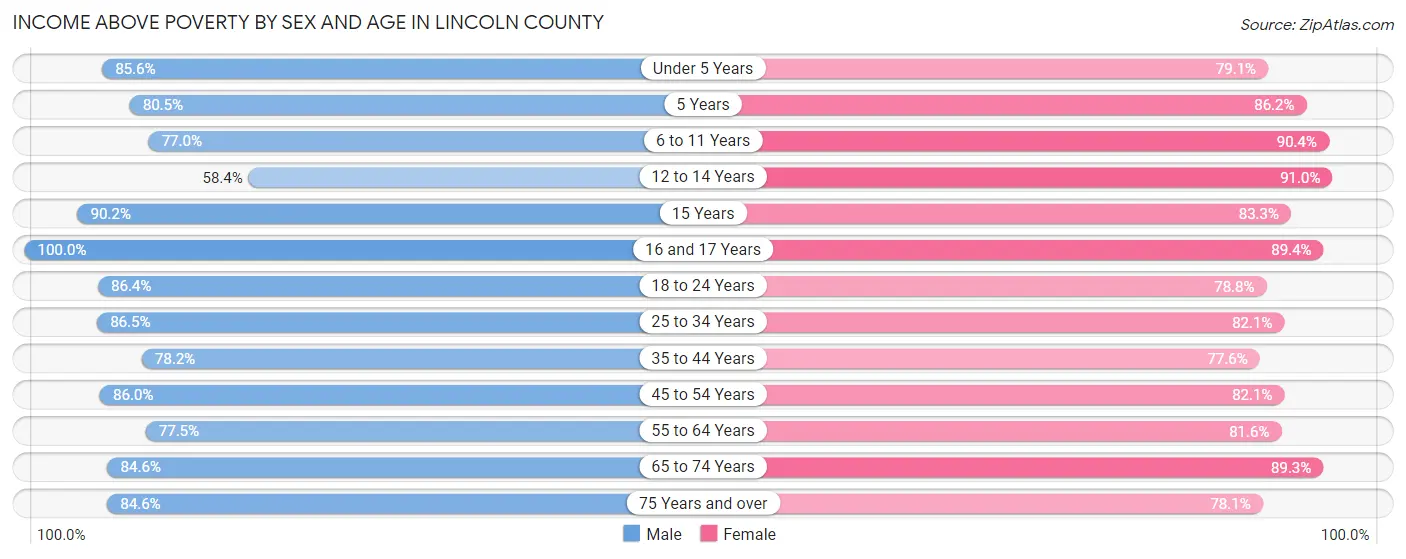
Income Above Poverty by Sex and Age in Lincoln County
According to the poverty statistics in Lincoln County, males aged 16 and 17 years and females aged 12 to 14 years are the age groups that are most secure financially, with 100.0% of males and 91.0% of females in these age groups living above the poverty line.
| Age Bracket | Male | Female |
| Under 5 Years | 706 (85.6%) | 594 (79.1%) |
| 5 Years | 173 (80.5%) | 75 (86.2%) |
| 6 to 11 Years | 798 (76.9%) | 828 (90.4%) |
| 12 to 14 Years | 194 (58.4%) | 416 (91.0%) |
| 15 Years | 165 (90.2%) | 120 (83.3%) |
| 16 and 17 Years | 317 (100.0%) | 295 (89.4%) |
| 18 to 24 Years | 778 (86.4%) | 706 (78.8%) |
| 25 to 34 Years | 1,238 (86.5%) | 1,139 (82.1%) |
| 35 to 44 Years | 1,031 (78.2%) | 1,154 (77.5%) |
| 45 to 54 Years | 1,300 (86.0%) | 1,355 (82.1%) |
| 55 to 64 Years | 1,308 (77.5%) | 1,300 (81.6%) |
| 65 to 74 Years | 1,048 (84.6%) | 1,272 (89.3%) |
| 75 Years and over | 627 (84.6%) | 798 (78.1%) |
| Total | 9,683 (82.5%) | 10,052 (82.8%) |
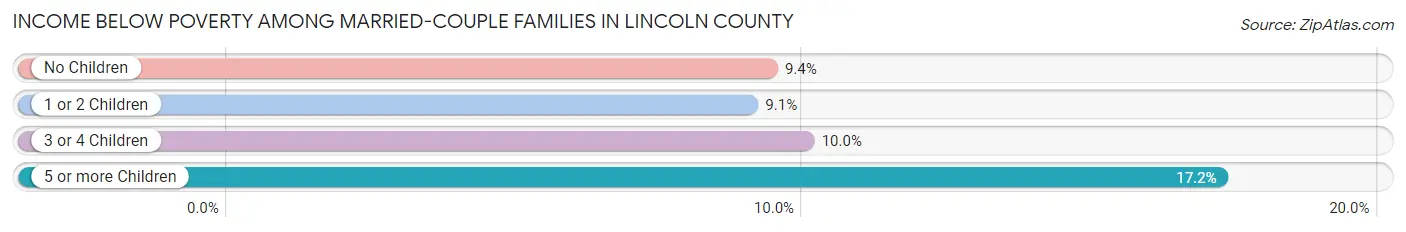
Income Below Poverty Among Married-Couple Families in Lincoln County
The poverty statistics for married-couple families in Lincoln County show that 9.4% or 486 of the total 5,147 families live below the poverty line. Families with 5 or more children have the highest poverty rate of 17.2%, comprising of 10 families. On the other hand, families with 1 or 2 children have the lowest poverty rate of 9.1%, which includes 143 families.
| Children | Above Poverty | Below Poverty |
| No Children | 2,757 (90.6%) | 286 (9.4%) |
| 1 or 2 Children | 1,435 (90.9%) | 143 (9.1%) |
| 3 or 4 Children | 421 (90.0%) | 47 (10.0%) |
| 5 or more Children | 48 (82.8%) | 10 (17.2%) |
| Total | 4,661 (90.6%) | 486 (9.4%) |
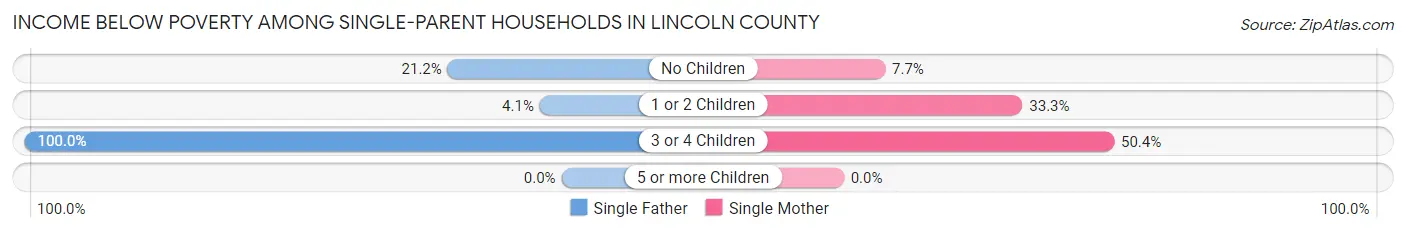
Income Below Poverty Among Single-Parent Households in Lincoln County
According to the poverty data in Lincoln County, 10.5% or 54 single-father households and 25.8% or 319 single-mother households are living below the poverty line. Among single-father households, those with 3 or 4 children have the highest poverty rate, with 11 households (100.0%) experiencing poverty. Likewise, among single-mother households, those with 3 or 4 children have the highest poverty rate, with 69 households (50.4%) falling below the poverty line.
| Children | Single Father | Single Mother |
| No Children | 28 (21.2%) | 35 (7.7%) |
| 1 or 2 Children | 15 (4.1%) | 215 (33.3%) |
| 3 or 4 Children | 11 (100.0%) | 69 (50.4%) |
| 5 or more Children | 0 (0.0%) | 0 (0.0%) |
| Total | 54 (10.5%) | 319 (25.8%) |
Income Below Poverty Among Married-Couple vs Single-Parent Households in Lincoln County
The poverty data for Lincoln County shows that 486 of the married-couple family households (9.4%) and 373 of the single-parent households (21.3%) are living below the poverty level. Within the married-couple family households, those with 5 or more children have the highest poverty rate, with 10 households (17.2%) falling below the poverty line. Among the single-parent households, those with 3 or 4 children have the highest poverty rate, with 80 household (54.0%) living below poverty.
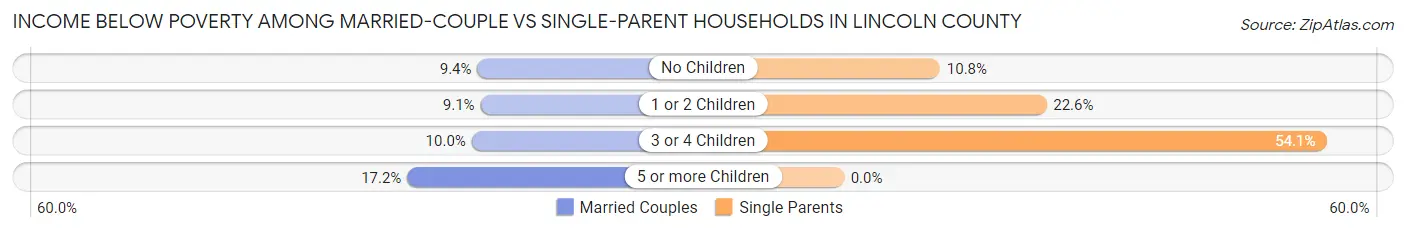
| Children | Married-Couple Families | Single-Parent Households |
| No Children | 286 (9.4%) | 63 (10.7%) |
| 1 or 2 Children | 143 (9.1%) | 230 (22.6%) |
| 3 or 4 Children | 47 (10.0%) | 80 (54.0%) |
| 5 or more Children | 10 (17.2%) | 0 (0.0%) |
| Total | 486 (9.4%) | 373 (21.3%) |
Race in Lincoln County
The most populous races in Lincoln County are White / Caucasian (22,818 | 93.8%), Two or more Races (612 | 2.5%), and Hispanic or Latino (457 | 1.9%).
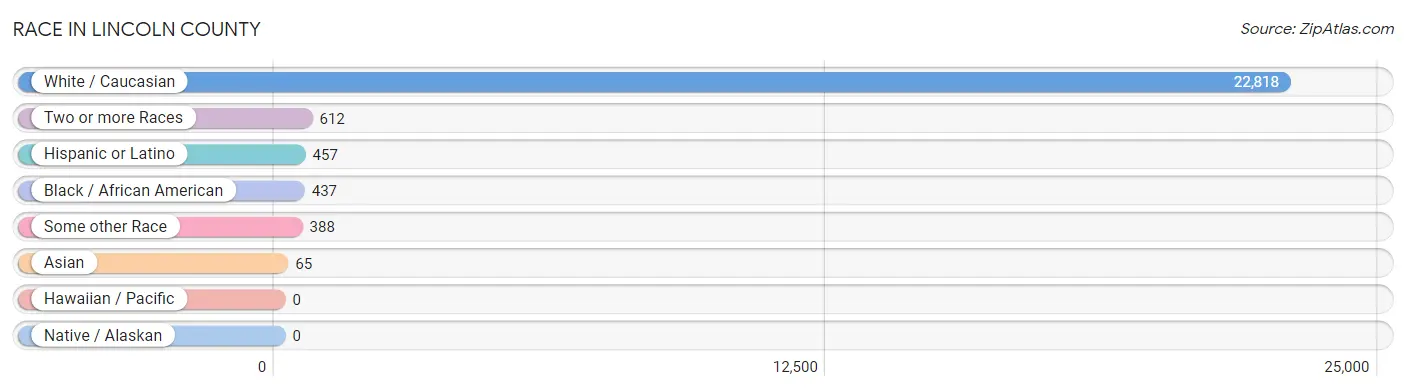
| Race | # Population | % Population |
| Asian | 65 | 0.3% |
| Black / African American | 437 | 1.8% |
| Hawaiian / Pacific | 0 | 0.0% |
| Hispanic or Latino | 457 | 1.9% |
| Native / Alaskan | 0 | 0.0% |
| White / Caucasian | 22,818 | 93.8% |
| Two or more Races | 612 | 2.5% |
| Some other Race | 388 | 1.6% |
| Total | 24,320 | 100.0% |
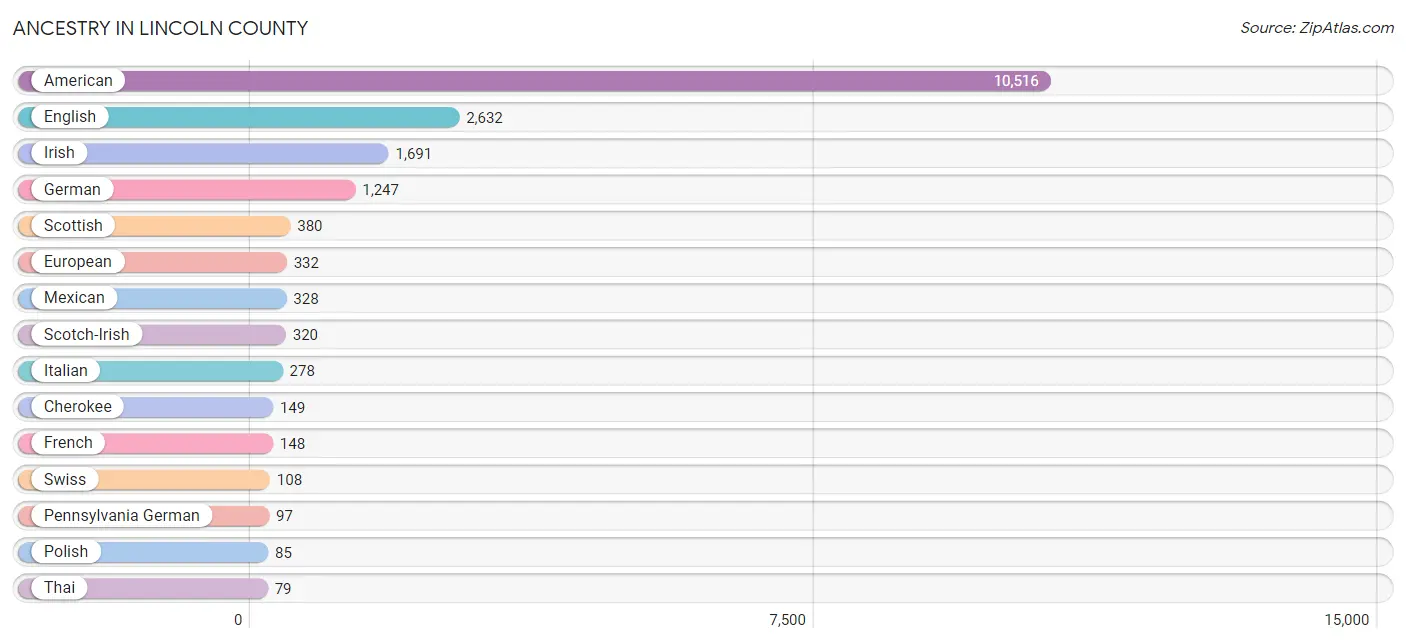
Ancestry in Lincoln County
The most populous ancestries reported in Lincoln County are American (10,516 | 43.2%), English (2,632 | 10.8%), Irish (1,691 | 7.0%), German (1,247 | 5.1%), and Scottish (380 | 1.6%), together accounting for 67.7% of all Lincoln County residents.
| Ancestry | # Population | % Population |
| American | 10,516 | 43.2% |
| Australian | 11 | 0.1% |
| Austrian | 5 | 0.0% |
| Bhutanese | 15 | 0.1% |
| Brazilian | 10 | 0.0% |
| British | 12 | 0.1% |
| Central American | 10 | 0.0% |
| Cherokee | 149 | 0.6% |
| Choctaw | 8 | 0.0% |
| Danish | 43 | 0.2% |
| Dutch | 19 | 0.1% |
| Eastern European | 7 | 0.0% |
| English | 2,632 | 10.8% |
| European | 332 | 1.4% |
| Finnish | 5 | 0.0% |
| French | 148 | 0.6% |
| French Canadian | 19 | 0.1% |
| German | 1,247 | 5.1% |
| Greek | 11 | 0.1% |
| Guatemalan | 10 | 0.0% |
| Indian (Asian) | 40 | 0.2% |
| Iranian | 10 | 0.0% |
| Irish | 1,691 | 7.0% |
| Italian | 278 | 1.1% |
| Korean | 41 | 0.2% |
| Mexican | 328 | 1.3% |
| Northern European | 2 | 0.0% |
| Norwegian | 10 | 0.0% |
| Pakistani | 12 | 0.1% |
| Pennsylvania German | 97 | 0.4% |
| Polish | 85 | 0.4% |
| Puerto Rican | 25 | 0.1% |
| Scandinavian | 18 | 0.1% |
| Scotch-Irish | 320 | 1.3% |
| Scottish | 380 | 1.6% |
| Sri Lankan | 13 | 0.1% |
| Swedish | 44 | 0.2% |
| Swiss | 108 | 0.4% |
| Thai | 79 | 0.3% |
| Welsh | 22 | 0.1% | View All 40 Rows |
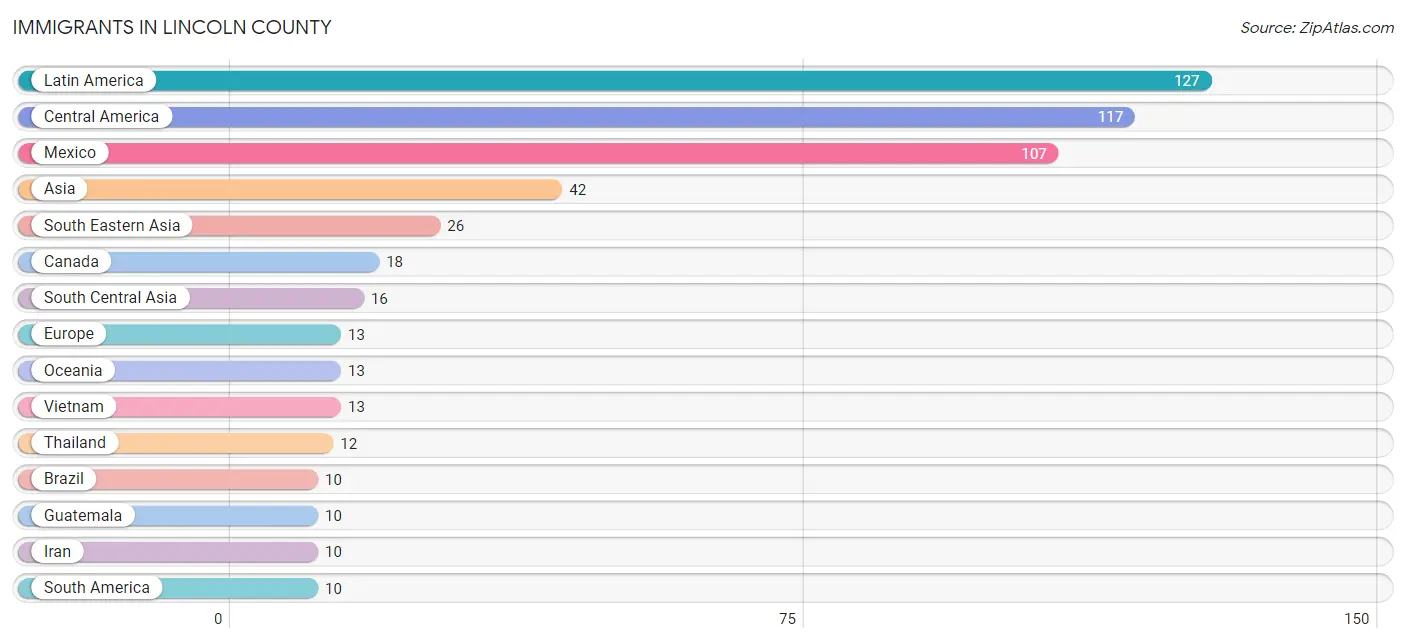
Immigrants in Lincoln County
The most numerous immigrant groups reported in Lincoln County came from Latin America (127 | 0.5%), Central America (117 | 0.5%), Mexico (107 | 0.4%), Asia (42 | 0.2%), and South Eastern Asia (26 | 0.1%), together accounting for 1.7% of all Lincoln County residents.
| Immigration Origin | # Population | % Population |
| Asia | 42 | 0.2% |
| Brazil | 10 | 0.0% |
| Canada | 18 | 0.1% |
| Central America | 117 | 0.5% |
| Eastern Europe | 5 | 0.0% |
| Europe | 13 | 0.1% |
| Germany | 8 | 0.0% |
| Guatemala | 10 | 0.0% |
| India | 6 | 0.0% |
| Iran | 10 | 0.0% |
| Latin America | 127 | 0.5% |
| Mexico | 107 | 0.4% |
| Oceania | 13 | 0.1% |
| Philippines | 1 | 0.0% |
| South America | 10 | 0.0% |
| South Central Asia | 16 | 0.1% |
| South Eastern Asia | 26 | 0.1% |
| Thailand | 12 | 0.1% |
| Ukraine | 5 | 0.0% |
| Vietnam | 13 | 0.1% |
| Western Europe | 8 | 0.0% | View All 21 Rows |
Sex and Age in Lincoln County
Sex and Age in Lincoln County
The most populous age groups in Lincoln County are 55 to 59 Years (913 | 7.6%) for men and 55 to 59 Years (924 | 7.5%) for women.
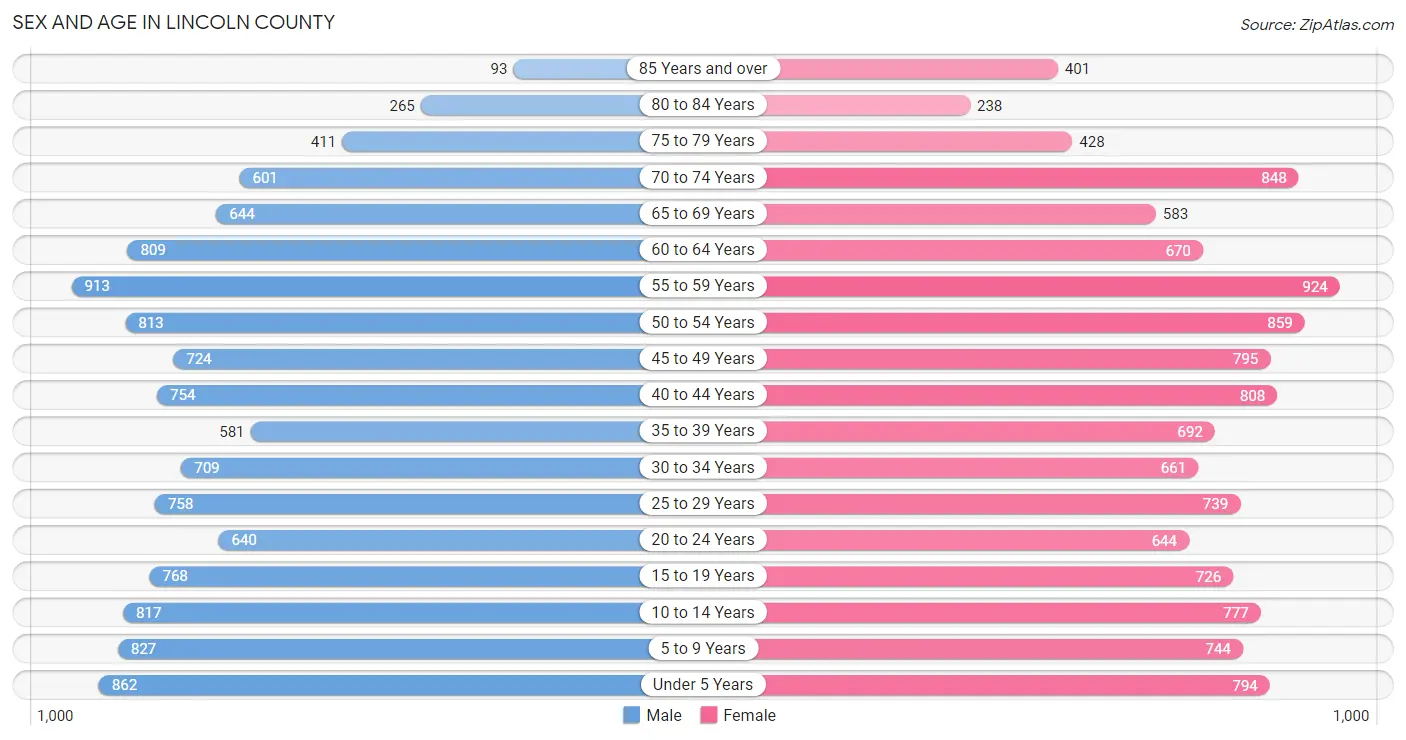
| Age Bracket | Male | Female |
| Under 5 Years | 862 (7.2%) | 794 (6.4%) |
| 5 to 9 Years | 827 (6.9%) | 744 (6.0%) |
| 10 to 14 Years | 817 (6.8%) | 777 (6.3%) |
| 15 to 19 Years | 768 (6.4%) | 726 (5.9%) |
| 20 to 24 Years | 640 (5.3%) | 644 (5.2%) |
| 25 to 29 Years | 758 (6.3%) | 739 (6.0%) |
| 30 to 34 Years | 709 (5.9%) | 661 (5.4%) |
| 35 to 39 Years | 581 (4.9%) | 692 (5.6%) |
| 40 to 44 Years | 754 (6.3%) | 808 (6.6%) |
| 45 to 49 Years | 724 (6.0%) | 795 (6.5%) |
| 50 to 54 Years | 813 (6.8%) | 859 (7.0%) |
| 55 to 59 Years | 913 (7.6%) | 924 (7.5%) |
| 60 to 64 Years | 809 (6.8%) | 670 (5.4%) |
| 65 to 69 Years | 644 (5.4%) | 583 (4.7%) |
| 70 to 74 Years | 601 (5.0%) | 848 (6.9%) |
| 75 to 79 Years | 411 (3.4%) | 428 (3.5%) |
| 80 to 84 Years | 265 (2.2%) | 238 (1.9%) |
| 85 Years and over | 93 (0.8%) | 401 (3.3%) |
| Total | 11,989 (100.0%) | 12,331 (100.0%) |
Families and Households in Lincoln County
Median Family Size in Lincoln County
The median family size in Lincoln County is 2.94 persons per family, with single male/father families (513 | 7.4%) accounting for the largest median family size of 3.23 persons per family. On the other hand, single female/mother families (1,237 | 17.9%) represent the smallest median family size with 2.68 persons per family.
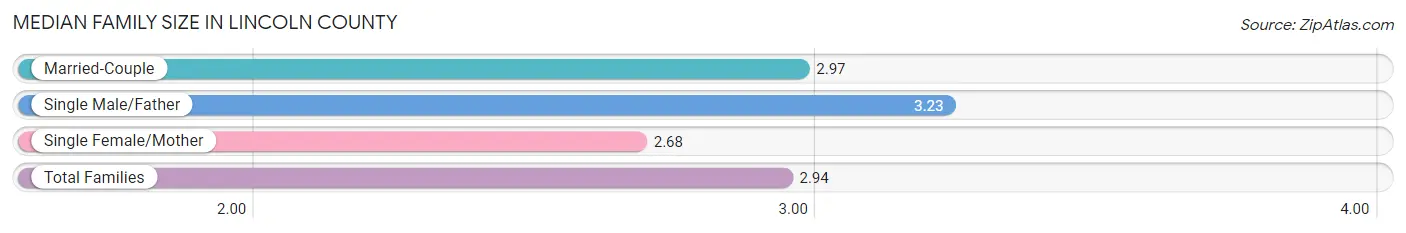
| Family Type | # Families | Family Size |
| Married-Couple | 5,147 (74.6%) | 2.97 |
| Single Male/Father | 513 (7.4%) | 3.23 |
| Single Female/Mother | 1,237 (17.9%) | 2.68 |
| Total Families | 6,897 (100.0%) | 2.94 |
Median Household Size in Lincoln County
The median household size in Lincoln County is 2.48 persons per household, with single male/father households (513 | 5.3%) accounting for the largest median household size of 3.68 persons per household. non-family households (2,795 | 28.8%) represent the smallest median household size with 1.14 persons per household.
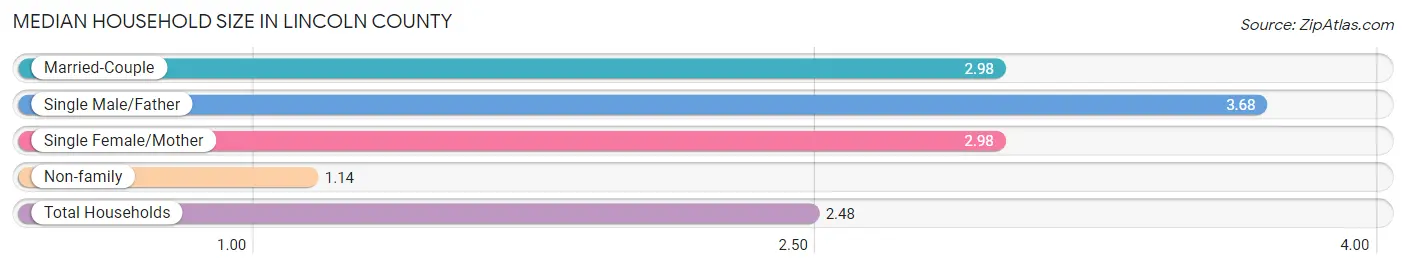
| Household Type | # Households | Household Size |
| Married-Couple | 5,147 (53.1%) | 2.98 |
| Single Male/Father | 513 (5.3%) | 3.68 |
| Single Female/Mother | 1,237 (12.8%) | 2.98 |
| Non-family | 2,795 (28.8%) | 1.14 |
| Total Households | 9,692 (100.0%) | 2.48 |
Household Size by Marriage Status in Lincoln County
Out of a total of 9,692 households in Lincoln County, 6,897 (71.2%) are family households, while 2,795 (28.8%) are nonfamily households. The most numerous type of family households are 2-person households, comprising 3,056, and the most common type of nonfamily households are 1-person households, comprising 2,483.
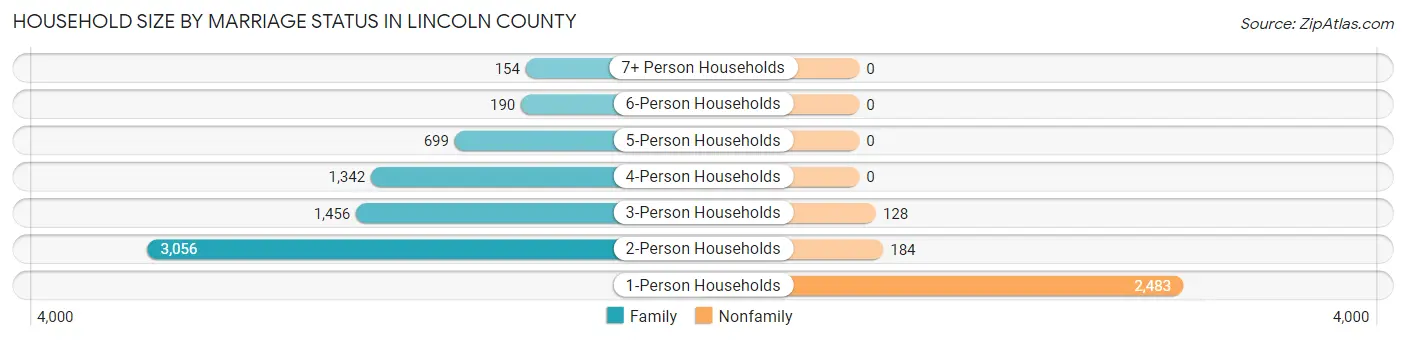
| Household Size | Family Households | Nonfamily Households |
| 1-Person Households | - | 2,483 (25.6%) |
| 2-Person Households | 3,056 (31.5%) | 184 (1.9%) |
| 3-Person Households | 1,456 (15.0%) | 128 (1.3%) |
| 4-Person Households | 1,342 (13.9%) | 0 (0.0%) |
| 5-Person Households | 699 (7.2%) | 0 (0.0%) |
| 6-Person Households | 190 (2.0%) | 0 (0.0%) |
| 7+ Person Households | 154 (1.6%) | 0 (0.0%) |
| Total | 6,897 (71.2%) | 2,795 (28.8%) |
Female Fertility in Lincoln County
Fertility by Age in Lincoln County
Average fertility rate in Lincoln County is 70.0 births per 1,000 women. Women in the age bracket of 20 to 34 years have the highest fertility rate with 102.0 births per 1,000 women. Women in the age bracket of 20 to 34 years acount for 56.4% of all women with births.
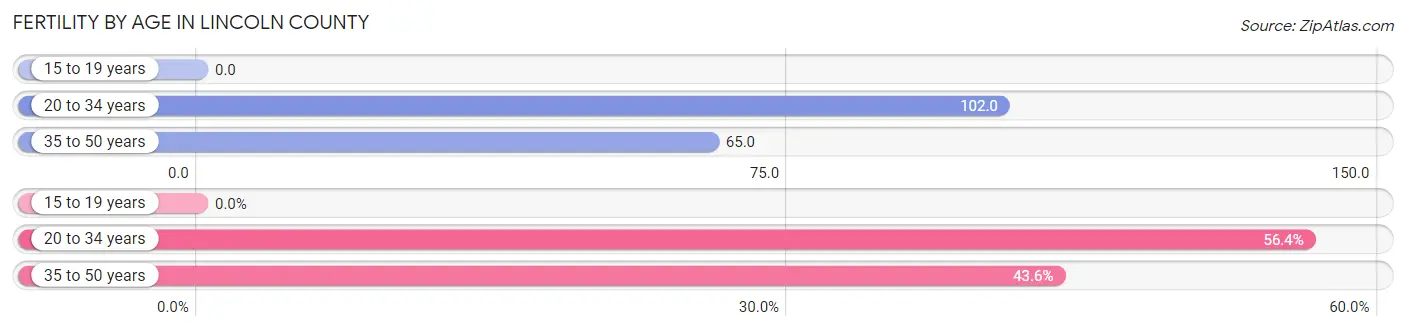
| Age Bracket | Women with Births | Births / 1,000 Women |
| 15 to 19 years | 0 (0.0%) | 0.0 |
| 20 to 34 years | 208 (56.4%) | 102.0 |
| 35 to 50 years | 161 (43.6%) | 65.0 |
| Total | 369 (100.0%) | 70.0 |
Fertility by Age by Marriage Status in Lincoln County
96.5% of women with births (369) in Lincoln County are married. The highest percentage of unmarried women with births falls into 20 to 34 years age bracket with 6.2% of them unmarried at the time of birth, while the lowest percentage of unmarried women with births belong to 35 to 50 years age bracket with 0.0% of them unmarried.
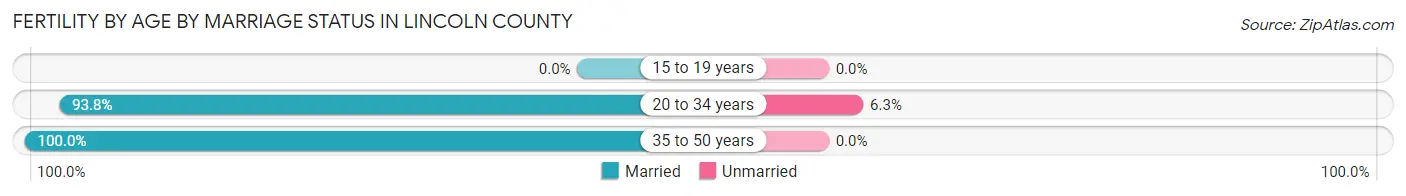
| Age Bracket | Married | Unmarried |
| 15 to 19 years | 0 (0.0%) | 0 (0.0%) |
| 20 to 34 years | 195 (93.8%) | 13 (6.2%) |
| 35 to 50 years | 161 (100.0%) | 0 (0.0%) |
| Total | 356 (96.5%) | 13 (3.5%) |
Fertility by Education in Lincoln County
Average fertility rate in Lincoln County is 70.0 births per 1,000 women. Women with the education attainment of graduate degree have the highest fertility rate of 203.0 births per 1,000 women, while women with the education attainment of college or associate's degree have the lowest fertility at 31.0 births per 1,000 women. Women with the education attainment of high school diploma represent 49.9% of all women with births.
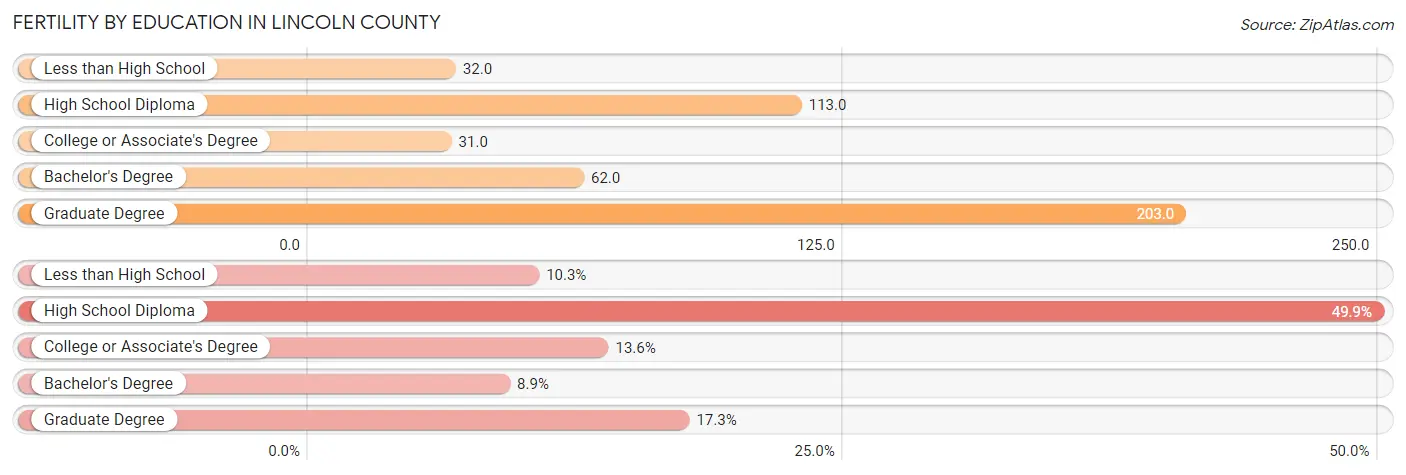
| Educational Attainment | Women with Births | Births / 1,000 Women |
| Less than High School | 38 (10.3%) | 32.0 |
| High School Diploma | 184 (49.9%) | 113.0 |
| College or Associate's Degree | 50 (13.6%) | 31.0 |
| Bachelor's Degree | 33 (8.9%) | 62.0 |
| Graduate Degree | 64 (17.3%) | 203.0 |
| Total | 369 (100.0%) | 70.0 |
Fertility by Education by Marriage Status in Lincoln County
3.5% of women with births in Lincoln County are unmarried. Women with the educational attainment of less than high school are most likely to be married with 100.0% of them married at childbirth, while women with the educational attainment of high school diploma are least likely to be married with 7.1% of them unmarried at childbirth.
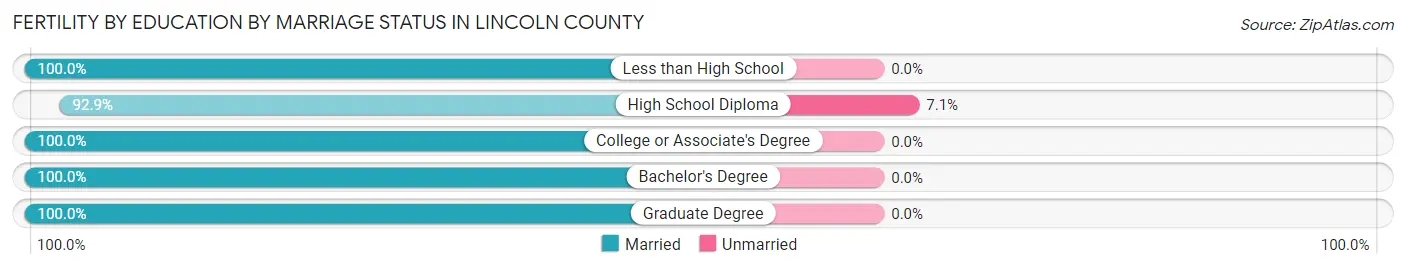
| Educational Attainment | Married | Unmarried |
| Less than High School | 38 (100.0%) | 0 (0.0%) |
| High School Diploma | 171 (92.9%) | 13 (7.1%) |
| College or Associate's Degree | 50 (100.0%) | 0 (0.0%) |
| Bachelor's Degree | 33 (100.0%) | 0 (0.0%) |
| Graduate Degree | 64 (100.0%) | 0 (0.0%) |
| Total | 356 (96.5%) | 13 (3.5%) |
Employment Characteristics in Lincoln County
Employment by Class of Employer in Lincoln County
Among the 9,532 employed individuals in Lincoln County, private company employees (6,037 | 63.3%), self-employed (not incorporated) (949 | 10.0%), and local government employees (877 | 9.2%) make up the most common classes of employment.
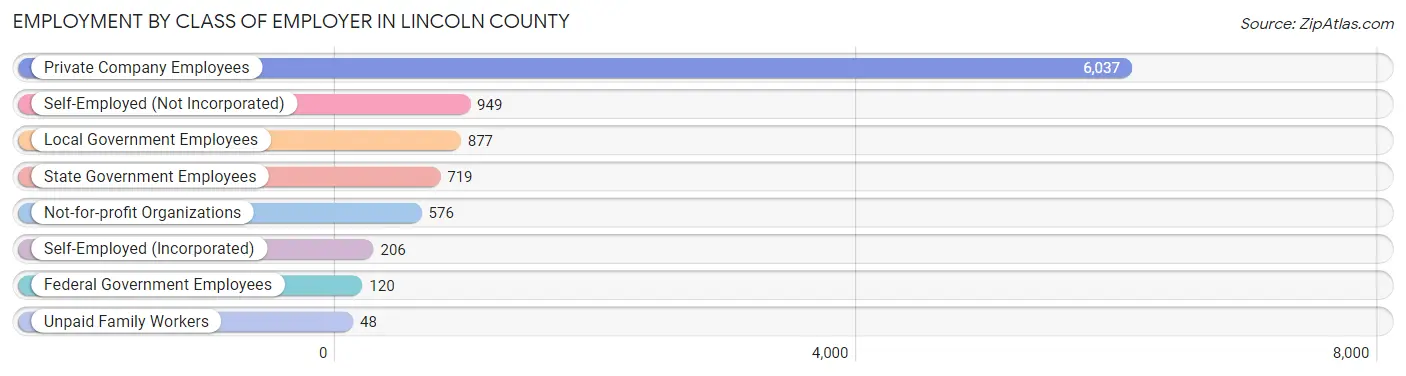
| Employer Class | # Employees | % Employees |
| Private Company Employees | 6,037 | 63.3% |
| Self-Employed (Incorporated) | 206 | 2.2% |
| Self-Employed (Not Incorporated) | 949 | 10.0% |
| Not-for-profit Organizations | 576 | 6.0% |
| Local Government Employees | 877 | 9.2% |
| State Government Employees | 719 | 7.5% |
| Federal Government Employees | 120 | 1.3% |
| Unpaid Family Workers | 48 | 0.5% |
| Total | 9,532 | 100.0% |
Employment Status by Age in Lincoln County
According to the labor force statistics for Lincoln County, out of the total population over 16 years of age (19,172), 55.1% or 10,564 individuals are in the labor force, with 6.6% or 697 of them unemployed. The age group with the highest labor force participation rate is 25 to 29 years, with 84.6% or 1,266 individuals in the labor force. Within the labor force, the 30 to 34 years age range has the highest percentage of unemployed individuals, with 17.5% or 197 of them being unemployed.
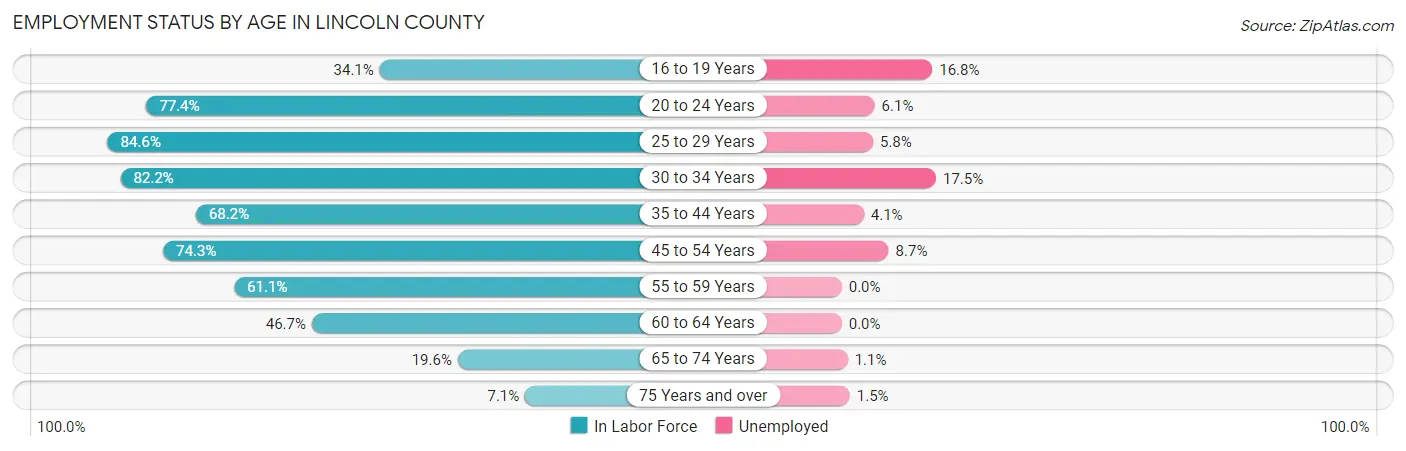
| Age Bracket | In Labor Force | Unemployed |
| 16 to 19 Years | 398 (34.1%) | 67 (16.8%) |
| 20 to 24 Years | 994 (77.4%) | 61 (6.1%) |
| 25 to 29 Years | 1,266 (84.6%) | 73 (5.8%) |
| 30 to 34 Years | 1,126 (82.2%) | 197 (17.5%) |
| 35 to 44 Years | 1,933 (68.2%) | 79 (4.1%) |
| 45 to 54 Years | 2,371 (74.3%) | 206 (8.7%) |
| 55 to 59 Years | 1,122 (61.1%) | 0 (0.0%) |
| 60 to 64 Years | 691 (46.7%) | 0 (0.0%) |
| 65 to 74 Years | 524 (19.6%) | 6 (1.1%) |
| 75 Years and over | 130 (7.1%) | 2 (1.5%) |
| Total | 10,564 (55.1%) | 697 (6.6%) |
Employment Status by Educational Attainment in Lincoln County
According to labor force statistics for Lincoln County, 69.7% of individuals (8,510) out of the total population between 25 and 64 years of age (12,209) are in the labor force, with 6.5% or 553 of them being unemployed. The group with the highest labor force participation rate are those with the educational attainment of bachelor's degree or higher, with 87.8% or 1,830 individuals in the labor force. Within the labor force, individuals with high school diploma education have the highest percentage of unemployment, with 8.9% or 319 of them being unemployed.
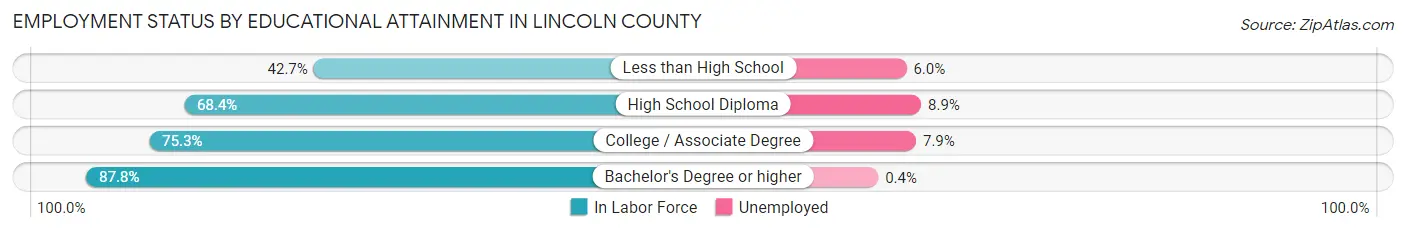
| Educational Attainment | In Labor Force | Unemployed |
| Less than High School | 761 (42.7%) | 107 (6.0%) |
| High School Diploma | 3,588 (68.4%) | 467 (8.9%) |
| College / Associate Degree | 2,331 (75.3%) | 245 (7.9%) |
| Bachelor's Degree or higher | 1,830 (87.8%) | 8 (0.4%) |
| Total | 8,510 (69.7%) | 794 (6.5%) |
Employment Occupations by Sex in Lincoln County
Management, Business, Science and Arts Occupations
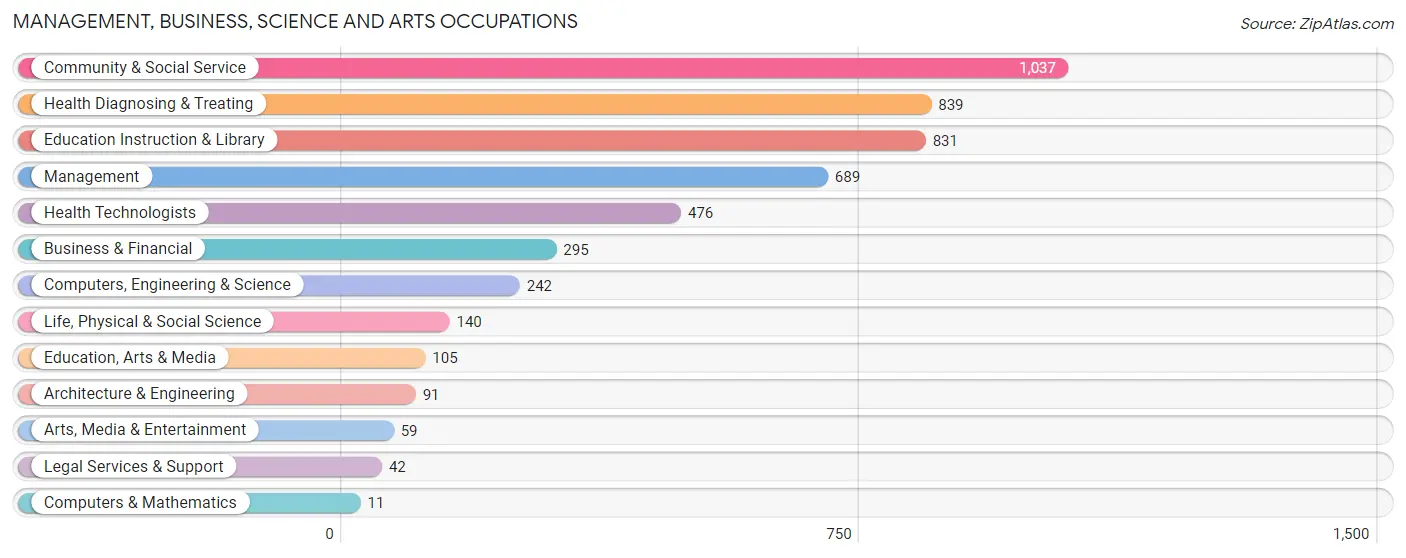
The most common Management, Business, Science and Arts occupations in Lincoln County are Community & Social Service (1,037 | 10.5%), Health Diagnosing & Treating (839 | 8.5%), Education Instruction & Library (831 | 8.4%), Management (689 | 7.0%), and Health Technologists (476 | 4.8%).
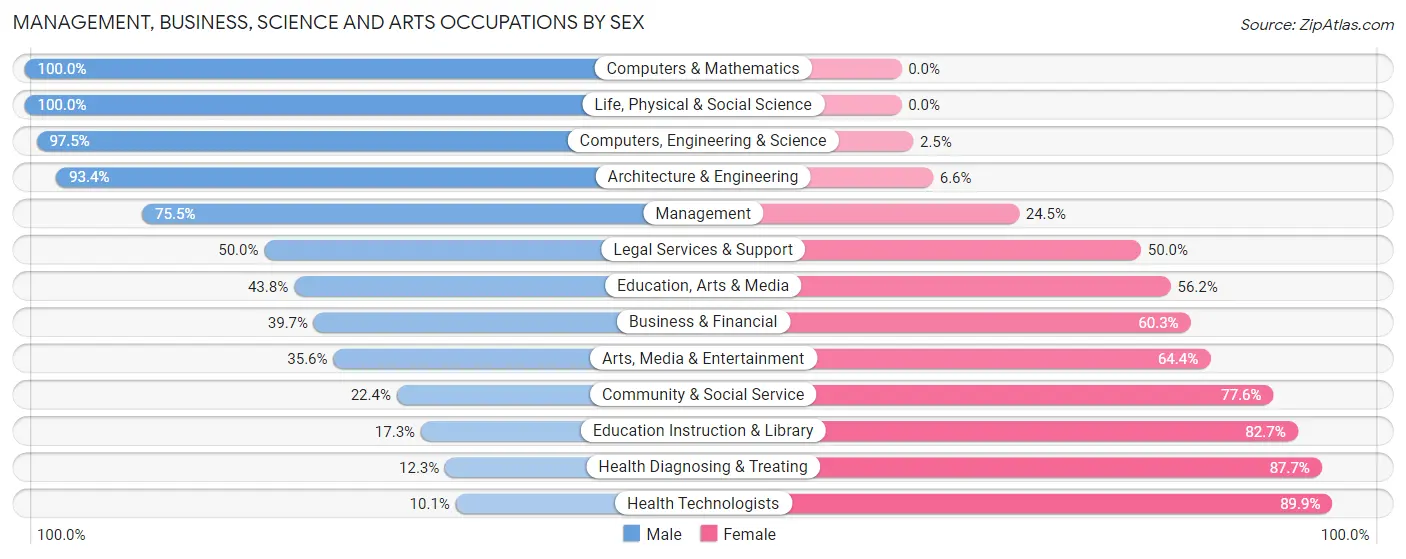
Management, Business, Science and Arts Occupations by Sex
Within the Management, Business, Science and Arts occupations in Lincoln County, the most male-oriented occupations are Computers & Mathematics (100.0%), Life, Physical & Social Science (100.0%), and Computers, Engineering & Science (97.5%), while the most female-oriented occupations are Health Technologists (89.9%), Health Diagnosing & Treating (87.7%), and Education Instruction & Library (82.7%).
| Occupation | Male | Female |
| Management | 520 (75.5%) | 169 (24.5%) |
| Business & Financial | 117 (39.7%) | 178 (60.3%) |
| Computers, Engineering & Science | 236 (97.5%) | 6 (2.5%) |
| Computers & Mathematics | 11 (100.0%) | 0 (0.0%) |
| Architecture & Engineering | 85 (93.4%) | 6 (6.6%) |
| Life, Physical & Social Science | 140 (100.0%) | 0 (0.0%) |
| Community & Social Service | 232 (22.4%) | 805 (77.6%) |
| Education, Arts & Media | 46 (43.8%) | 59 (56.2%) |
| Legal Services & Support | 21 (50.0%) | 21 (50.0%) |
| Education Instruction & Library | 144 (17.3%) | 687 (82.7%) |
| Arts, Media & Entertainment | 21 (35.6%) | 38 (64.4%) |
| Health Diagnosing & Treating | 103 (12.3%) | 736 (87.7%) |
| Health Technologists | 48 (10.1%) | 428 (89.9%) |
| Total (Category) | 1,208 (38.9%) | 1,894 (61.1%) |
| Total (Overall) | 5,330 (54.0%) | 4,535 (46.0%) |
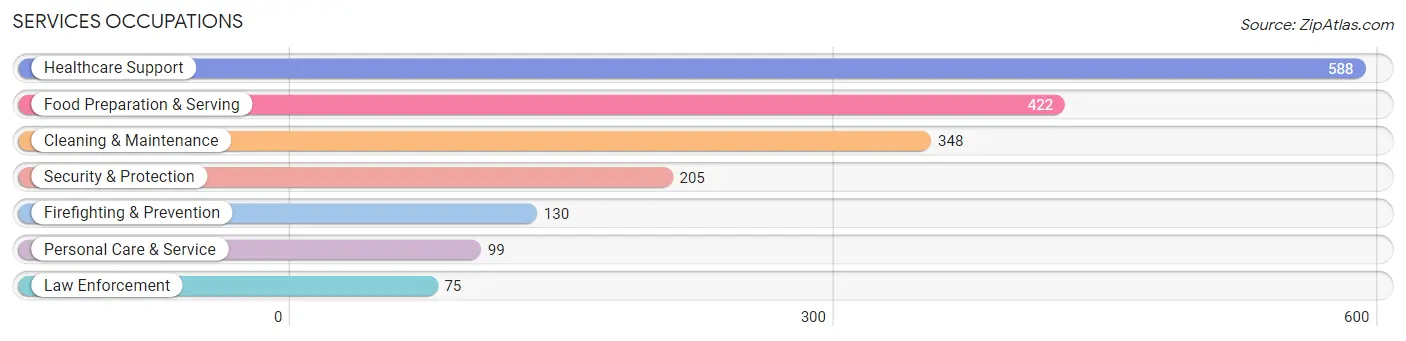
Services Occupations
The most common Services occupations in Lincoln County are Healthcare Support (588 | 6.0%), Food Preparation & Serving (422 | 4.3%), Cleaning & Maintenance (348 | 3.5%), Security & Protection (205 | 2.1%), and Firefighting & Prevention (130 | 1.3%).
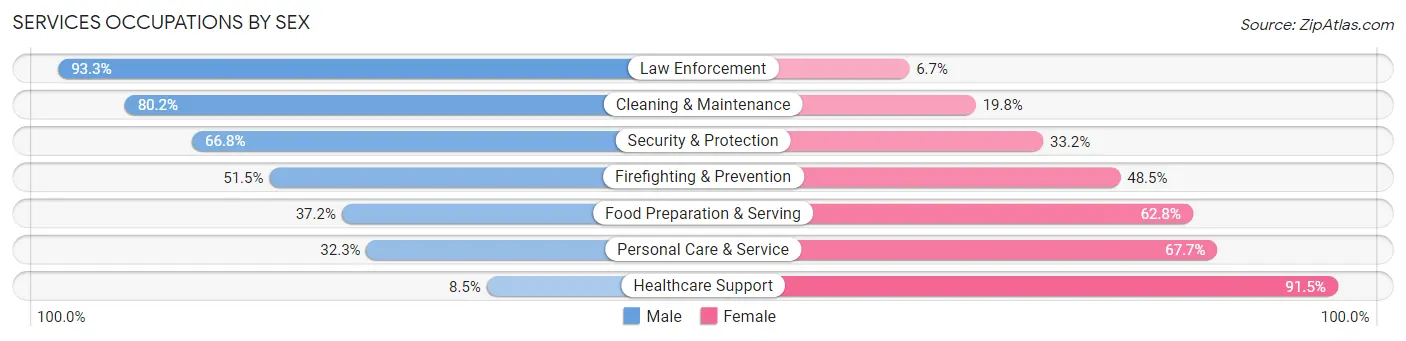
Services Occupations by Sex
Within the Services occupations in Lincoln County, the most male-oriented occupations are Law Enforcement (93.3%), Cleaning & Maintenance (80.2%), and Security & Protection (66.8%), while the most female-oriented occupations are Healthcare Support (91.5%), Personal Care & Service (67.7%), and Food Preparation & Serving (62.8%).
| Occupation | Male | Female |
| Healthcare Support | 50 (8.5%) | 538 (91.5%) |
| Security & Protection | 137 (66.8%) | 68 (33.2%) |
| Firefighting & Prevention | 67 (51.5%) | 63 (48.5%) |
| Law Enforcement | 70 (93.3%) | 5 (6.7%) |
| Food Preparation & Serving | 157 (37.2%) | 265 (62.8%) |
| Cleaning & Maintenance | 279 (80.2%) | 69 (19.8%) |
| Personal Care & Service | 32 (32.3%) | 67 (67.7%) |
| Total (Category) | 655 (39.4%) | 1,007 (60.6%) |
| Total (Overall) | 5,330 (54.0%) | 4,535 (46.0%) |
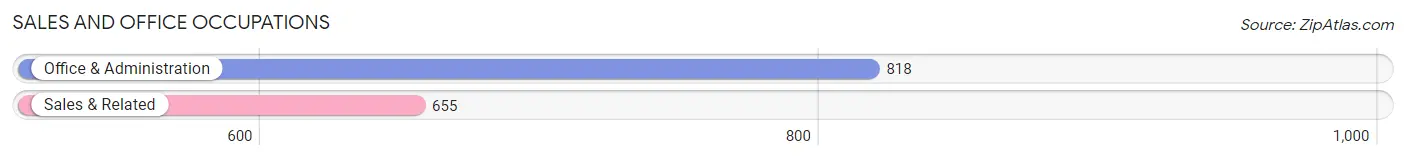
Sales and Office Occupations
The most common Sales and Office occupations in Lincoln County are Office & Administration (818 | 8.3%), and Sales & Related (655 | 6.6%).
Sales and Office Occupations by Sex
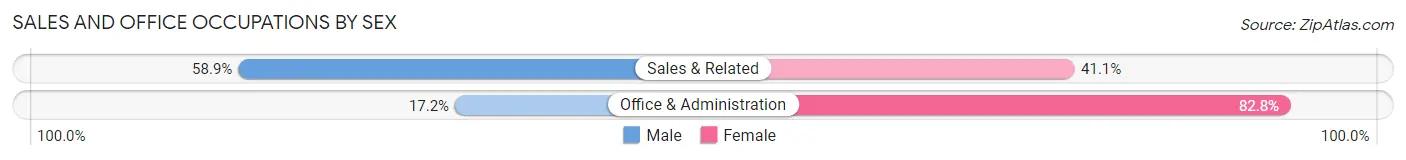
| Occupation | Male | Female |
| Sales & Related | 386 (58.9%) | 269 (41.1%) |
| Office & Administration | 141 (17.2%) | 677 (82.8%) |
| Total (Category) | 527 (35.8%) | 946 (64.2%) |
| Total (Overall) | 5,330 (54.0%) | 4,535 (46.0%) |
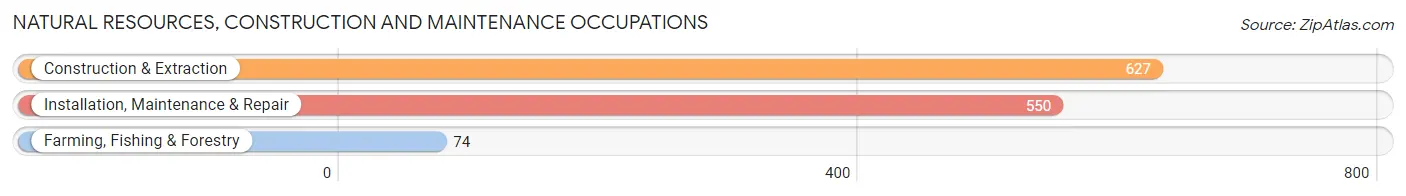
Natural Resources, Construction and Maintenance Occupations
The most common Natural Resources, Construction and Maintenance occupations in Lincoln County are Construction & Extraction (627 | 6.4%), Installation, Maintenance & Repair (550 | 5.6%), and Farming, Fishing & Forestry (74 | 0.7%).
Natural Resources, Construction and Maintenance Occupations by Sex
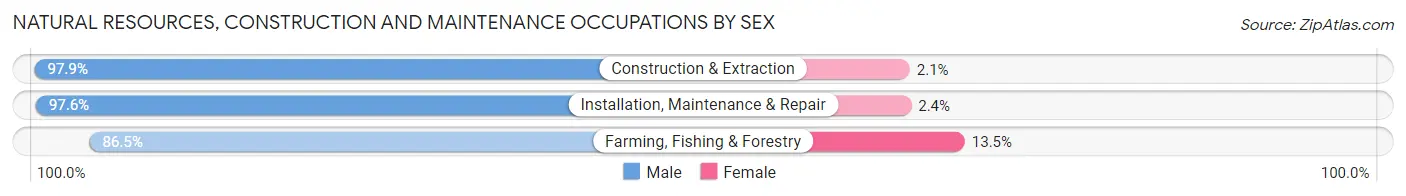
| Occupation | Male | Female |
| Farming, Fishing & Forestry | 64 (86.5%) | 10 (13.5%) |
| Construction & Extraction | 614 (97.9%) | 13 (2.1%) |
| Installation, Maintenance & Repair | 537 (97.6%) | 13 (2.4%) |
| Total (Category) | 1,215 (97.1%) | 36 (2.9%) |
| Total (Overall) | 5,330 (54.0%) | 4,535 (46.0%) |
Production, Transportation and Moving Occupations
The most common Production, Transportation and Moving occupations in Lincoln County are Production (1,047 | 10.6%), Material Moving (751 | 7.6%), and Transportation (579 | 5.9%).
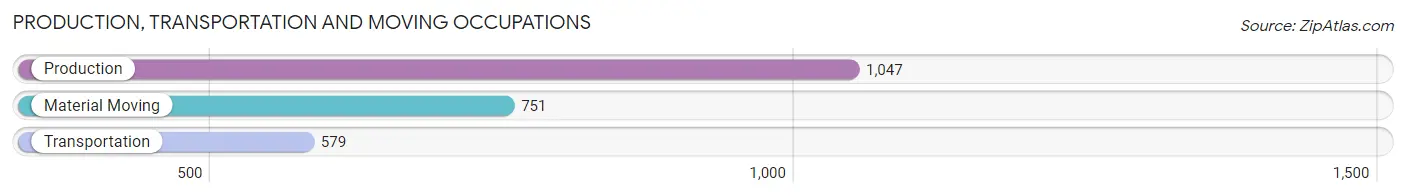
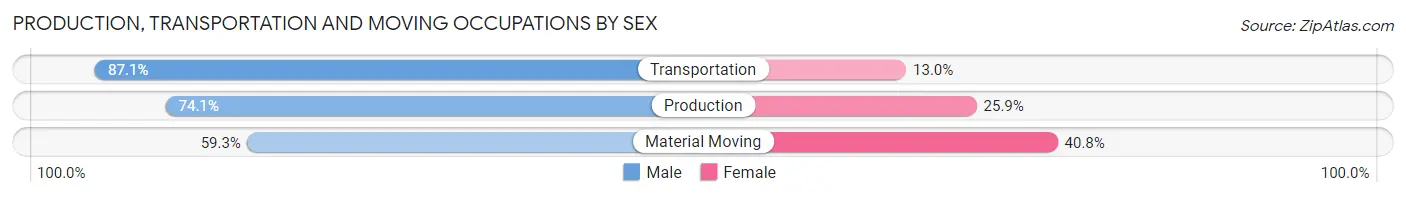
Production, Transportation and Moving Occupations by Sex
| Occupation | Male | Female |
| Production | 776 (74.1%) | 271 (25.9%) |
| Transportation | 504 (87.1%) | 75 (13.0%) |
| Material Moving | 445 (59.3%) | 306 (40.7%) |
| Total (Category) | 1,725 (72.6%) | 652 (27.4%) |
| Total (Overall) | 5,330 (54.0%) | 4,535 (46.0%) |
Employment Industries by Sex in Lincoln County
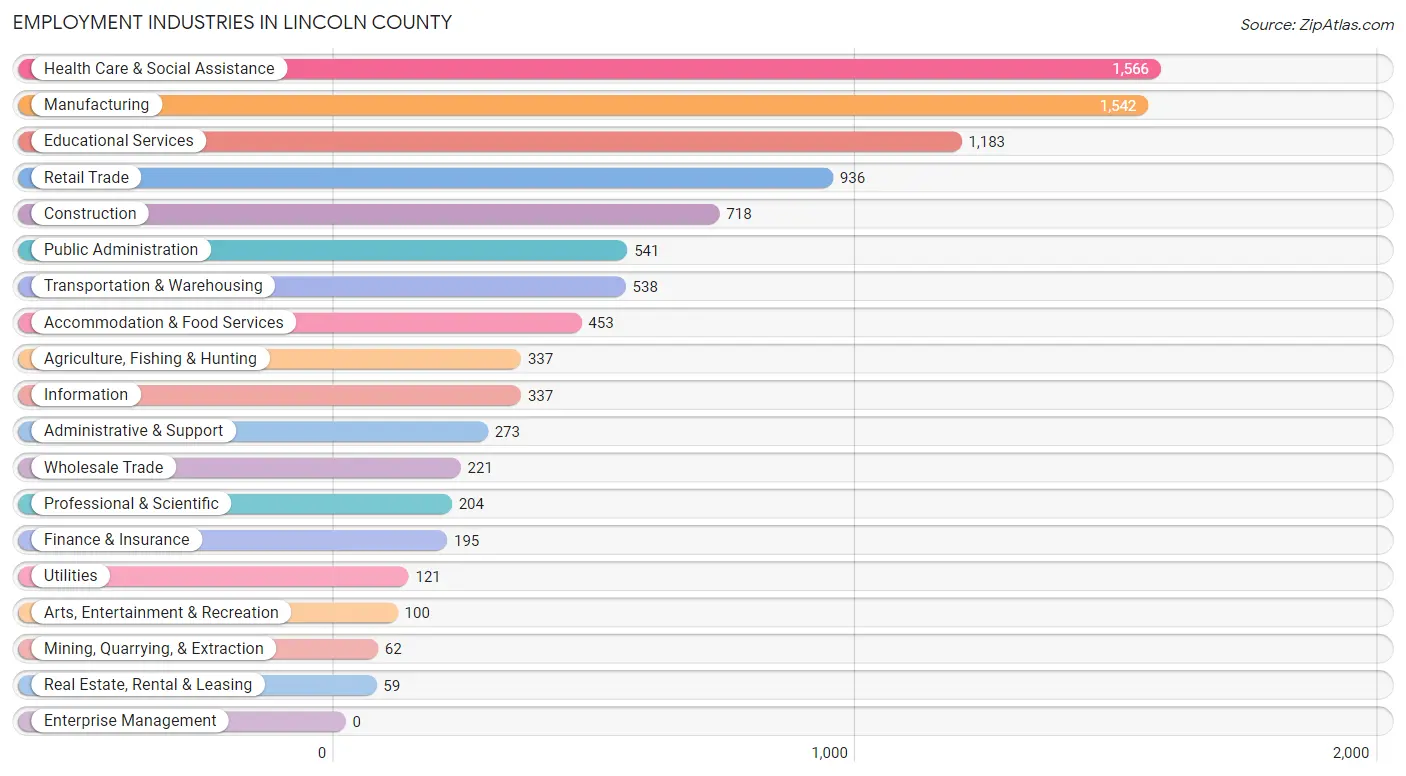
Employment Industries in Lincoln County
The major employment industries in Lincoln County include Health Care & Social Assistance (1,566 | 15.9%), Manufacturing (1,542 | 15.6%), Educational Services (1,183 | 12.0%), Retail Trade (936 | 9.5%), and Construction (718 | 7.3%).
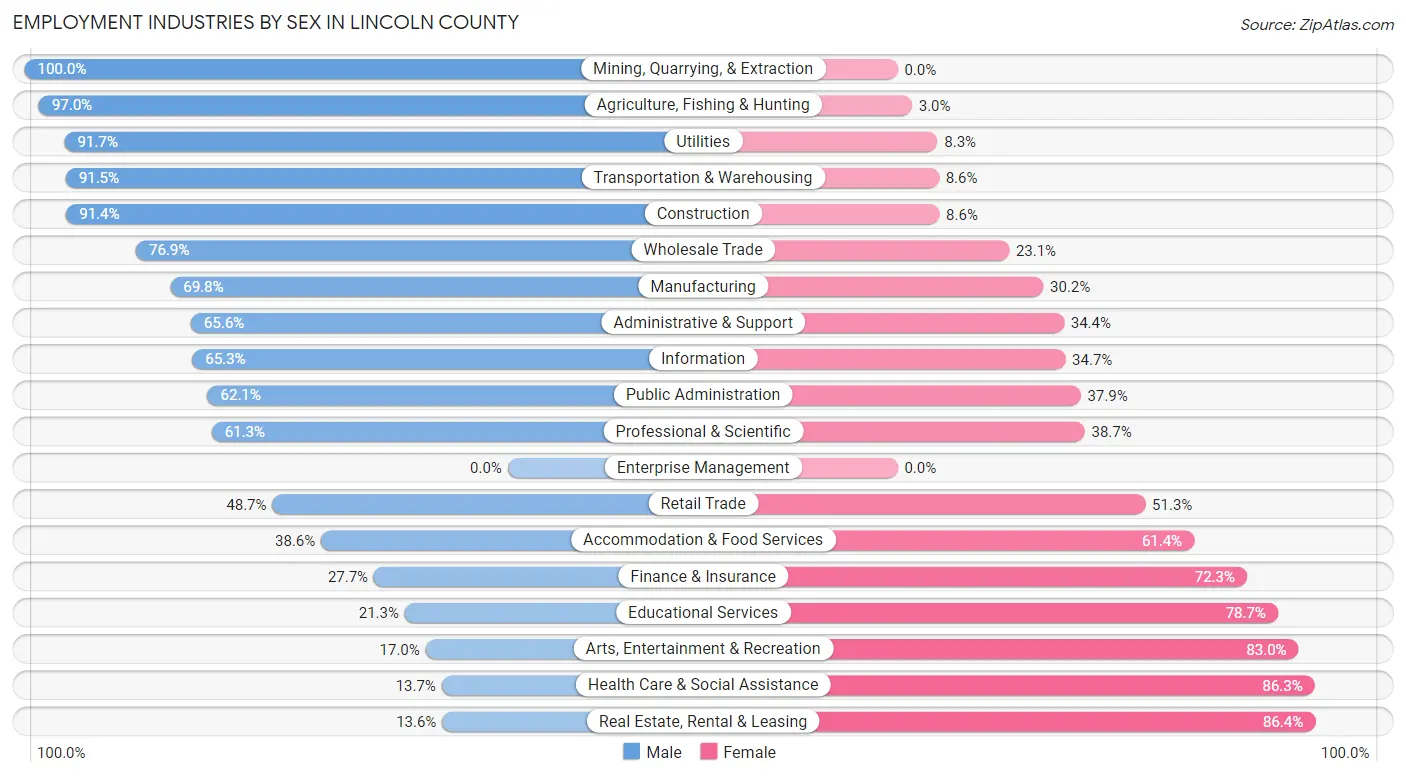
Employment Industries by Sex in Lincoln County
The Lincoln County industries that see more men than women are Mining, Quarrying, & Extraction (100.0%), Agriculture, Fishing & Hunting (97.0%), and Utilities (91.7%), whereas the industries that tend to have a higher number of women are Real Estate, Rental & Leasing (86.4%), Health Care & Social Assistance (86.3%), and Arts, Entertainment & Recreation (83.0%).
| Industry | Male | Female |
| Agriculture, Fishing & Hunting | 327 (97.0%) | 10 (3.0%) |
| Mining, Quarrying, & Extraction | 62 (100.0%) | 0 (0.0%) |
| Construction | 656 (91.4%) | 62 (8.6%) |
| Manufacturing | 1,077 (69.8%) | 465 (30.2%) |
| Wholesale Trade | 170 (76.9%) | 51 (23.1%) |
| Retail Trade | 456 (48.7%) | 480 (51.3%) |
| Transportation & Warehousing | 492 (91.4%) | 46 (8.6%) |
| Utilities | 111 (91.7%) | 10 (8.3%) |
| Information | 220 (65.3%) | 117 (34.7%) |
| Finance & Insurance | 54 (27.7%) | 141 (72.3%) |
| Real Estate, Rental & Leasing | 8 (13.6%) | 51 (86.4%) |
| Professional & Scientific | 125 (61.3%) | 79 (38.7%) |
| Enterprise Management | 0 (0.0%) | 0 (0.0%) |
| Administrative & Support | 179 (65.6%) | 94 (34.4%) |
| Educational Services | 252 (21.3%) | 931 (78.7%) |
| Health Care & Social Assistance | 214 (13.7%) | 1,352 (86.3%) |
| Arts, Entertainment & Recreation | 17 (17.0%) | 83 (83.0%) |
| Accommodation & Food Services | 175 (38.6%) | 278 (61.4%) |
| Public Administration | 336 (62.1%) | 205 (37.9%) |
| Total | 5,330 (54.0%) | 4,535 (46.0%) |
Education in Lincoln County
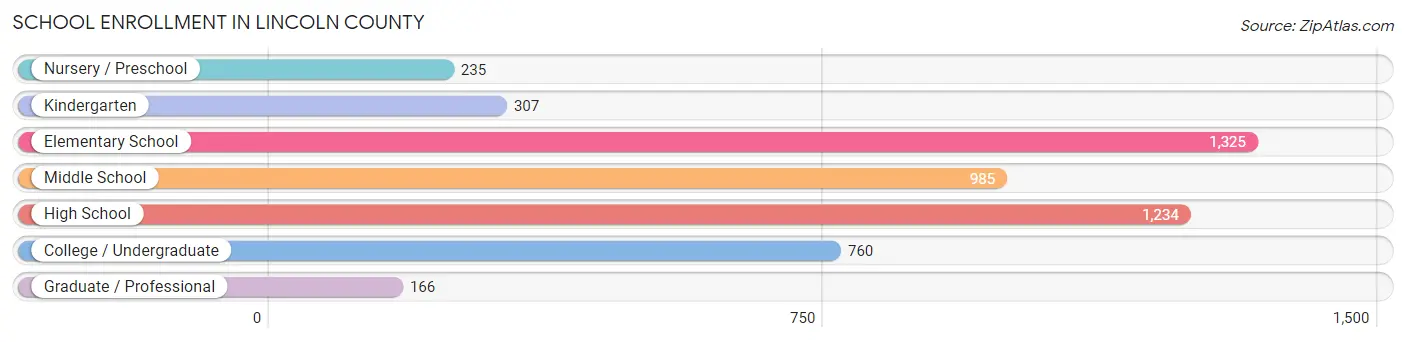
School Enrollment in Lincoln County
The most common levels of schooling among the 5,012 students in Lincoln County are elementary school (1,325 | 26.4%), high school (1,234 | 24.6%), and middle school (985 | 19.7%).
| School Level | # Students | % Students |
| Nursery / Preschool | 235 | 4.7% |
| Kindergarten | 307 | 6.1% |
| Elementary School | 1,325 | 26.4% |
| Middle School | 985 | 19.7% |
| High School | 1,234 | 24.6% |
| College / Undergraduate | 760 | 15.2% |
| Graduate / Professional | 166 | 3.3% |
| Total | 5,012 | 100.0% |
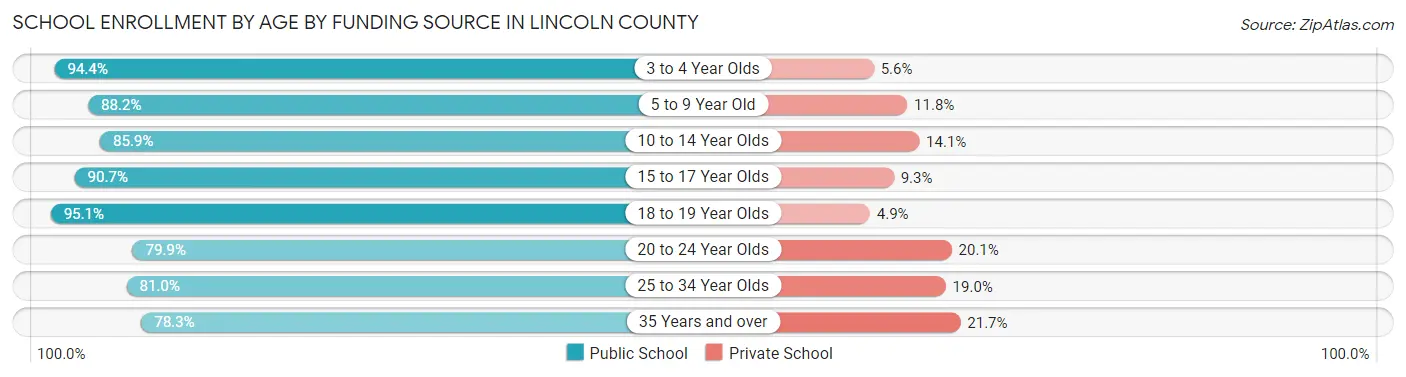
School Enrollment by Age by Funding Source in Lincoln County
Out of a total of 5,012 students who are enrolled in schools in Lincoln County, 642 (12.8%) attend a private institution, while the remaining 4,370 (87.2%) are enrolled in public schools. The age group of 35 years and over has the highest likelihood of being enrolled in private schools, with 55 (21.7% in the age bracket) enrolled. Conversely, the age group of 18 to 19 year olds has the lowest likelihood of being enrolled in a private school, with 293 (95.1% in the age bracket) attending a public institution.
| Age Bracket | Public School | Private School |
| 3 to 4 Year Olds | 135 (94.4%) | 8 (5.6%) |
| 5 to 9 Year Old | 1,200 (88.2%) | 161 (11.8%) |
| 10 to 14 Year Olds | 1,265 (85.9%) | 207 (14.1%) |
| 15 to 17 Year Olds | 817 (90.7%) | 84 (9.3%) |
| 18 to 19 Year Olds | 293 (95.1%) | 15 (4.9%) |
| 20 to 24 Year Olds | 282 (79.9%) | 71 (20.1%) |
| 25 to 34 Year Olds | 179 (81.0%) | 42 (19.0%) |
| 35 Years and over | 198 (78.3%) | 55 (21.7%) |
| Total | 4,370 (87.2%) | 642 (12.8%) |
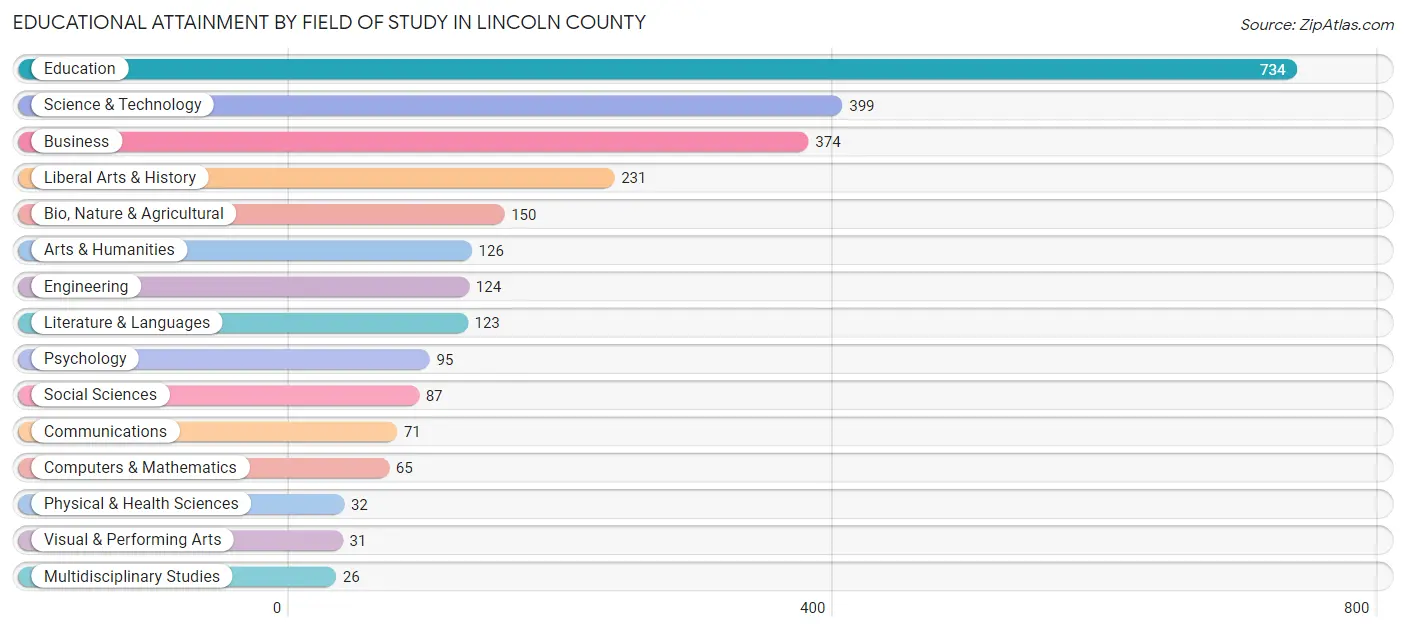
Educational Attainment by Field of Study in Lincoln County
Education (734 | 27.5%), science & technology (399 | 15.0%), business (374 | 14.0%), liberal arts & history (231 | 8.7%), and bio, nature & agricultural (150 | 5.6%) are the most common fields of study among 2,668 individuals in Lincoln County who have obtained a bachelor's degree or higher.
| Field of Study | # Graduates | % Graduates |
| Computers & Mathematics | 65 | 2.4% |
| Bio, Nature & Agricultural | 150 | 5.6% |
| Physical & Health Sciences | 32 | 1.2% |
| Psychology | 95 | 3.6% |
| Social Sciences | 87 | 3.3% |
| Engineering | 124 | 4.6% |
| Multidisciplinary Studies | 26 | 1.0% |
| Science & Technology | 399 | 15.0% |
| Business | 374 | 14.0% |
| Education | 734 | 27.5% |
| Literature & Languages | 123 | 4.6% |
| Liberal Arts & History | 231 | 8.7% |
| Visual & Performing Arts | 31 | 1.2% |
| Communications | 71 | 2.7% |
| Arts & Humanities | 126 | 4.7% |
| Total | 2,668 | 100.0% |
Transportation & Commute in Lincoln County
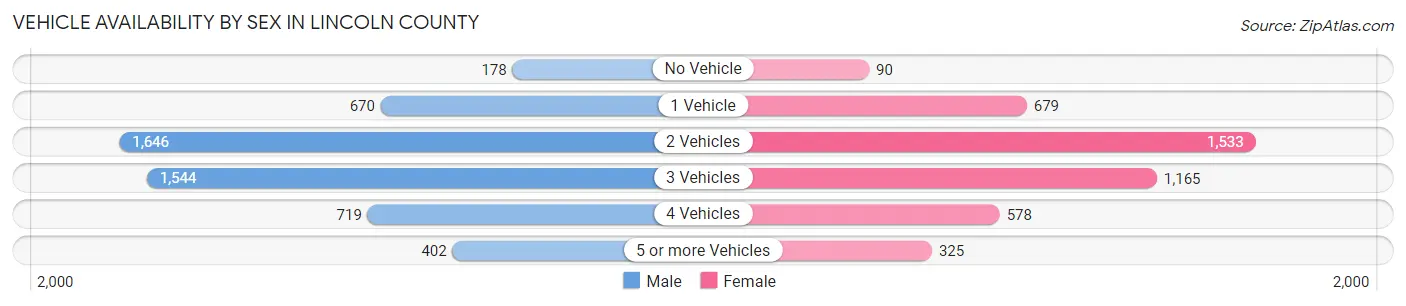
Vehicle Availability by Sex in Lincoln County
The most prevalent vehicle ownership categories in Lincoln County are males with 2 vehicles (1,646, accounting for 31.9%) and females with 2 vehicles (1,533, making up 37.7%).
| Vehicles Available | Male | Female |
| No Vehicle | 178 (3.5%) | 90 (2.1%) |
| 1 Vehicle | 670 (13.0%) | 679 (15.5%) |
| 2 Vehicles | 1,646 (31.9%) | 1,533 (35.1%) |
| 3 Vehicles | 1,544 (29.9%) | 1,165 (26.7%) |
| 4 Vehicles | 719 (13.9%) | 578 (13.2%) |
| 5 or more Vehicles | 402 (7.8%) | 325 (7.4%) |
| Total | 5,159 (100.0%) | 4,370 (100.0%) |
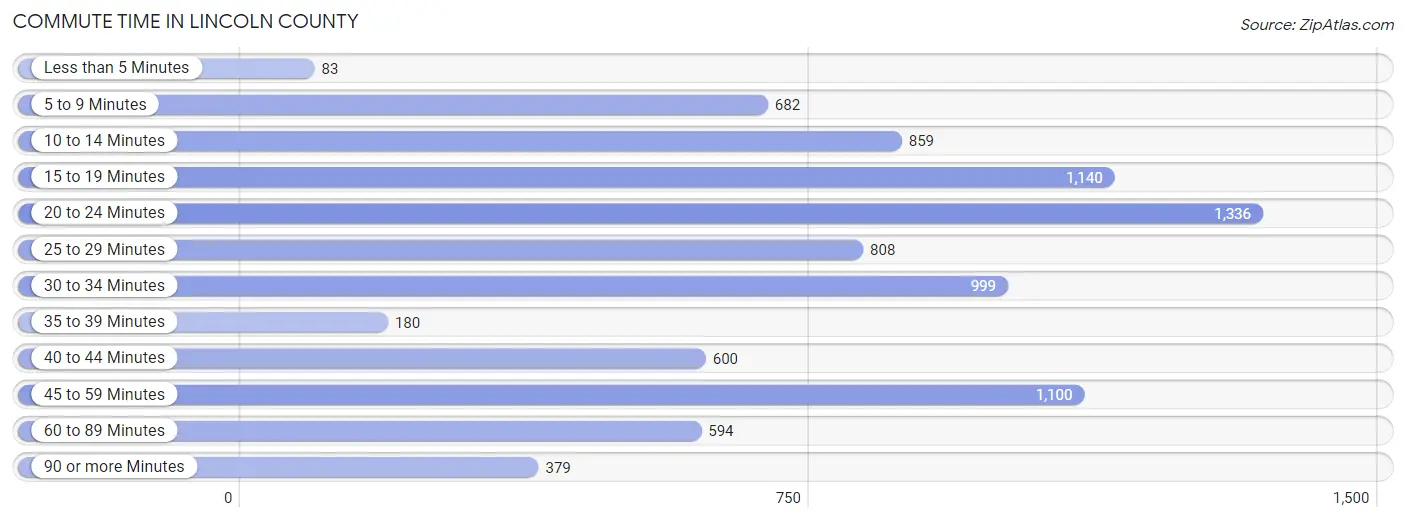
Commute Time in Lincoln County
The most frequently occuring commute durations in Lincoln County are 20 to 24 minutes (1,336 commuters, 15.2%), 15 to 19 minutes (1,140 commuters, 13.0%), and 45 to 59 minutes (1,100 commuters, 12.6%).
| Commute Time | # Commuters | % Commuters |
| Less than 5 Minutes | 83 | 0.9% |
| 5 to 9 Minutes | 682 | 7.8% |
| 10 to 14 Minutes | 859 | 9.8% |
| 15 to 19 Minutes | 1,140 | 13.0% |
| 20 to 24 Minutes | 1,336 | 15.2% |
| 25 to 29 Minutes | 808 | 9.2% |
| 30 to 34 Minutes | 999 | 11.4% |
| 35 to 39 Minutes | 180 | 2.1% |
| 40 to 44 Minutes | 600 | 6.9% |
| 45 to 59 Minutes | 1,100 | 12.6% |
| 60 to 89 Minutes | 594 | 6.8% |
| 90 or more Minutes | 379 | 4.3% |
Commute Time by Sex in Lincoln County
The most common commute times in Lincoln County are 45 to 59 minutes (722 commuters, 15.4%) for males and 20 to 24 minutes (674 commuters, 16.6%) for females.
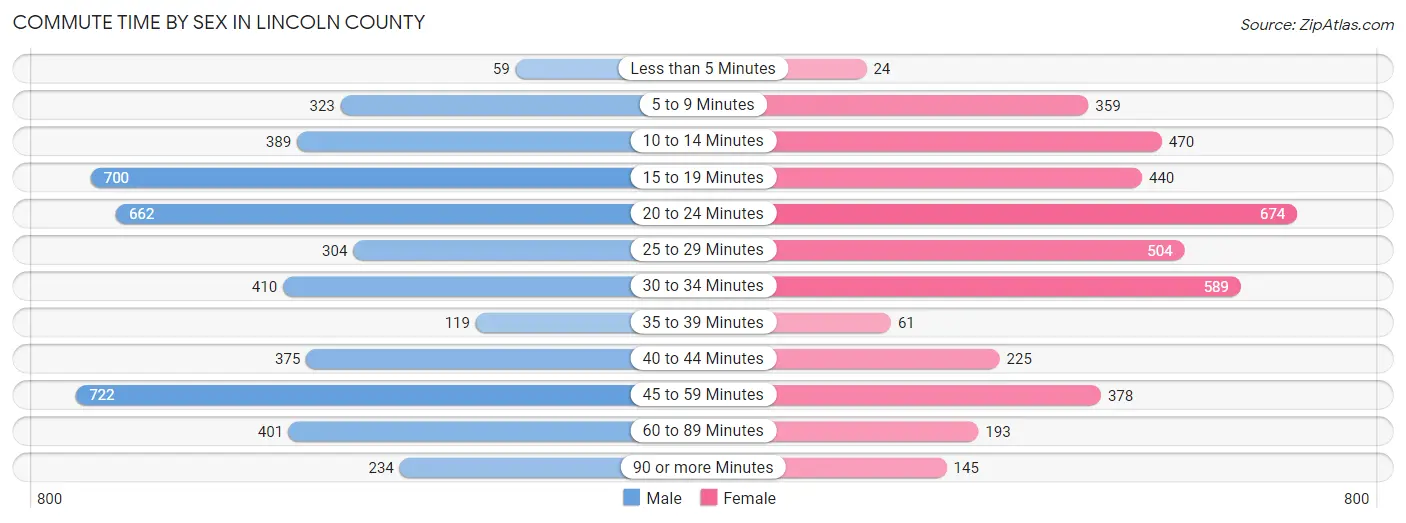
| Commute Time | Male | Female |
| Less than 5 Minutes | 59 (1.3%) | 24 (0.6%) |
| 5 to 9 Minutes | 323 (6.9%) | 359 (8.8%) |
| 10 to 14 Minutes | 389 (8.3%) | 470 (11.6%) |
| 15 to 19 Minutes | 700 (14.9%) | 440 (10.8%) |
| 20 to 24 Minutes | 662 (14.1%) | 674 (16.6%) |
| 25 to 29 Minutes | 304 (6.5%) | 504 (12.4%) |
| 30 to 34 Minutes | 410 (8.7%) | 589 (14.5%) |
| 35 to 39 Minutes | 119 (2.5%) | 61 (1.5%) |
| 40 to 44 Minutes | 375 (8.0%) | 225 (5.5%) |
| 45 to 59 Minutes | 722 (15.4%) | 378 (9.3%) |
| 60 to 89 Minutes | 401 (8.5%) | 193 (4.8%) |
| 90 or more Minutes | 234 (5.0%) | 145 (3.6%) |
Time of Departure to Work by Sex in Lincoln County
The most frequent times of departure to work in Lincoln County are 7:00 AM to 7:29 AM (835, 17.8%) for males and 6:30 AM to 6:59 AM (565, 13.9%) for females.
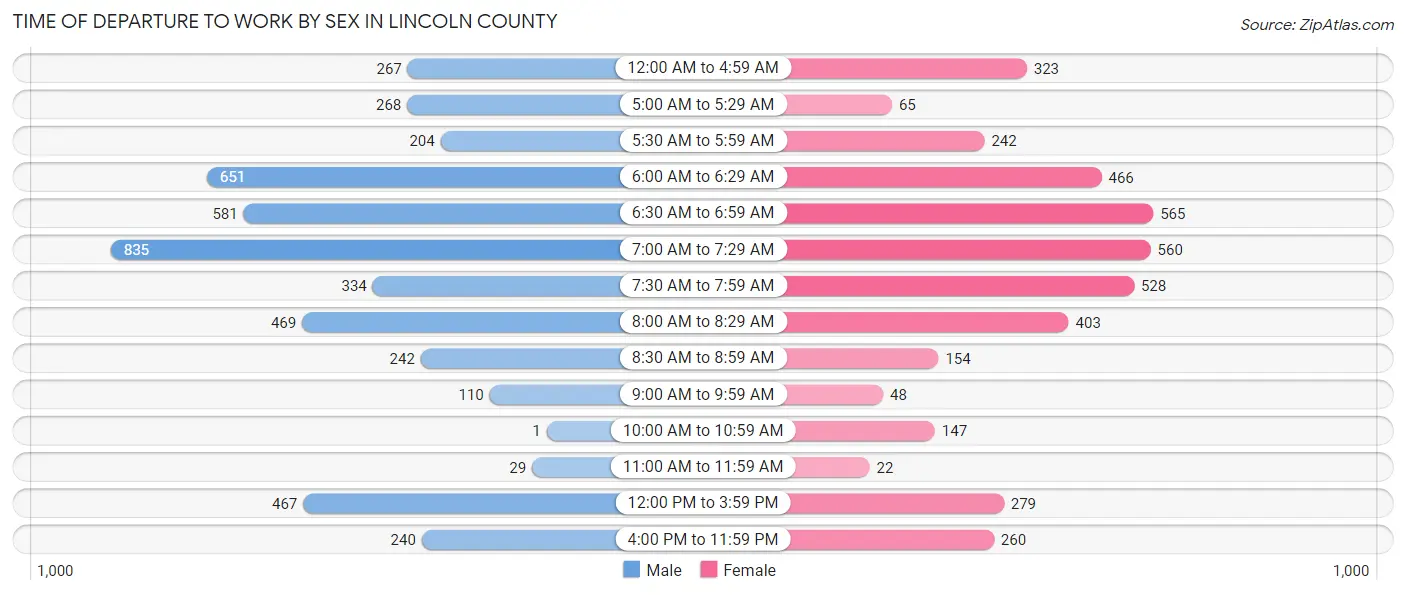
| Time of Departure | Male | Female |
| 12:00 AM to 4:59 AM | 267 (5.7%) | 323 (8.0%) |
| 5:00 AM to 5:29 AM | 268 (5.7%) | 65 (1.6%) |
| 5:30 AM to 5:59 AM | 204 (4.3%) | 242 (6.0%) |
| 6:00 AM to 6:29 AM | 651 (13.9%) | 466 (11.5%) |
| 6:30 AM to 6:59 AM | 581 (12.4%) | 565 (13.9%) |
| 7:00 AM to 7:29 AM | 835 (17.8%) | 560 (13.8%) |
| 7:30 AM to 7:59 AM | 334 (7.1%) | 528 (13.0%) |
| 8:00 AM to 8:29 AM | 469 (10.0%) | 403 (9.9%) |
| 8:30 AM to 8:59 AM | 242 (5.1%) | 154 (3.8%) |
| 9:00 AM to 9:59 AM | 110 (2.3%) | 48 (1.2%) |
| 10:00 AM to 10:59 AM | 1 (0.0%) | 147 (3.6%) |
| 11:00 AM to 11:59 AM | 29 (0.6%) | 22 (0.5%) |
| 12:00 PM to 3:59 PM | 467 (9.9%) | 279 (6.9%) |
| 4:00 PM to 11:59 PM | 240 (5.1%) | 260 (6.4%) |
| Total | 4,698 (100.0%) | 4,062 (100.0%) |
Housing Occupancy in Lincoln County
Occupancy by Ownership in Lincoln County
Of the total 9,692 dwellings in Lincoln County, owner-occupied units account for 7,615 (78.6%), while renter-occupied units make up 2,077 (21.4%).
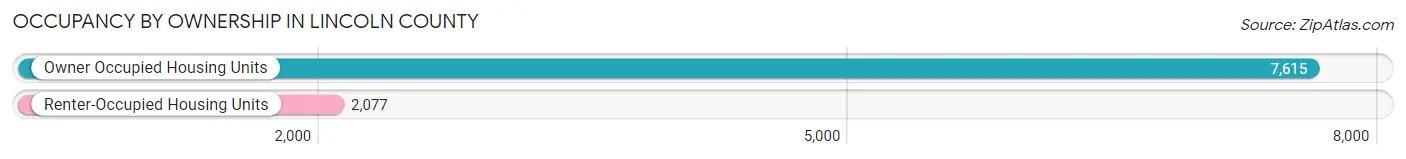
| Occupancy | # Housing Units | % Housing Units |
| Owner Occupied Housing Units | 7,615 | 78.6% |
| Renter-Occupied Housing Units | 2,077 | 21.4% |
| Total Occupied Housing Units | 9,692 | 100.0% |
Occupancy by Household Size in Lincoln County
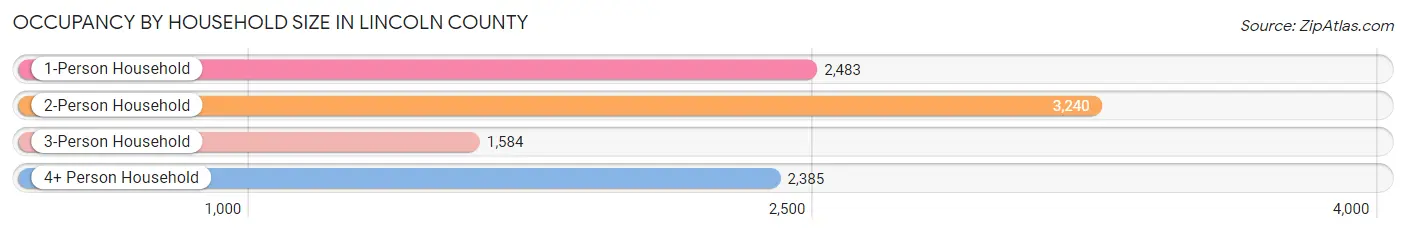
| Household Size | # Housing Units | % Housing Units |
| 1-Person Household | 2,483 | 25.6% |
| 2-Person Household | 3,240 | 33.4% |
| 3-Person Household | 1,584 | 16.3% |
| 4+ Person Household | 2,385 | 24.6% |
| Total Housing Units | 9,692 | 100.0% |
Occupancy by Ownership by Household Size in Lincoln County
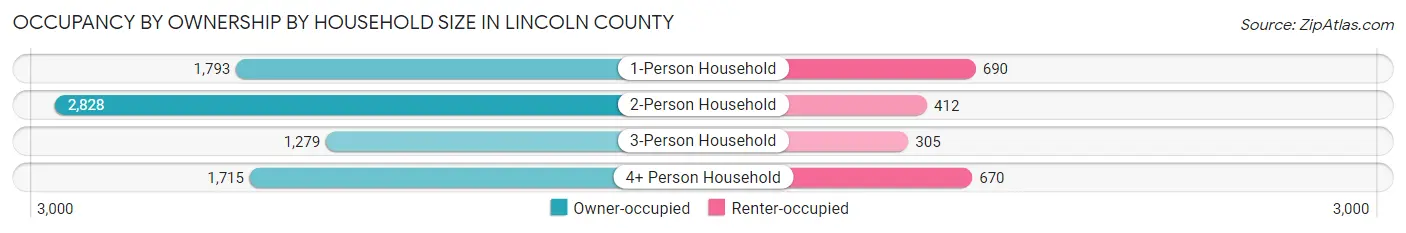
| Household Size | Owner-occupied | Renter-occupied |
| 1-Person Household | 1,793 (72.2%) | 690 (27.8%) |
| 2-Person Household | 2,828 (87.3%) | 412 (12.7%) |
| 3-Person Household | 1,279 (80.7%) | 305 (19.3%) |
| 4+ Person Household | 1,715 (71.9%) | 670 (28.1%) |
| Total Housing Units | 7,615 (78.6%) | 2,077 (21.4%) |
Occupancy by Educational Attainment in Lincoln County
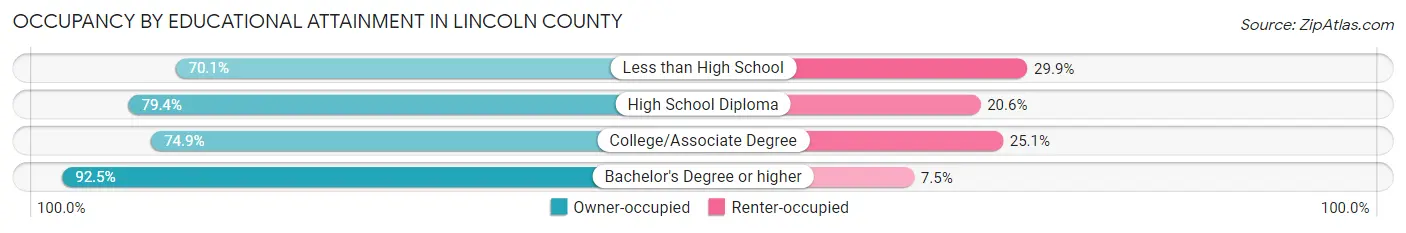
| Household Size | Owner-occupied | Renter-occupied |
| Less than High School | 1,313 (70.1%) | 561 (29.9%) |
| High School Diploma | 3,039 (79.4%) | 790 (20.6%) |
| College/Associate Degree | 1,816 (74.9%) | 609 (25.1%) |
| Bachelor's Degree or higher | 1,447 (92.5%) | 117 (7.5%) |
Occupancy by Age of Householder in Lincoln County
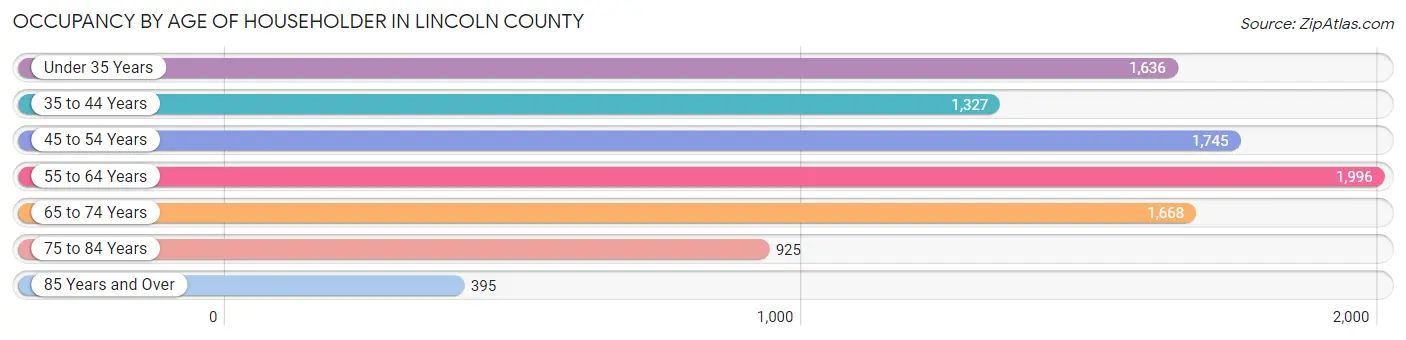
| Age Bracket | # Households | % Households |
| Under 35 Years | 1,636 | 16.9% |
| 35 to 44 Years | 1,327 | 13.7% |
| 45 to 54 Years | 1,745 | 18.0% |
| 55 to 64 Years | 1,996 | 20.6% |
| 65 to 74 Years | 1,668 | 17.2% |
| 75 to 84 Years | 925 | 9.5% |
| 85 Years and Over | 395 | 4.1% |
| Total | 9,692 | 100.0% |
Housing Finances in Lincoln County
Median Income by Occupancy in Lincoln County
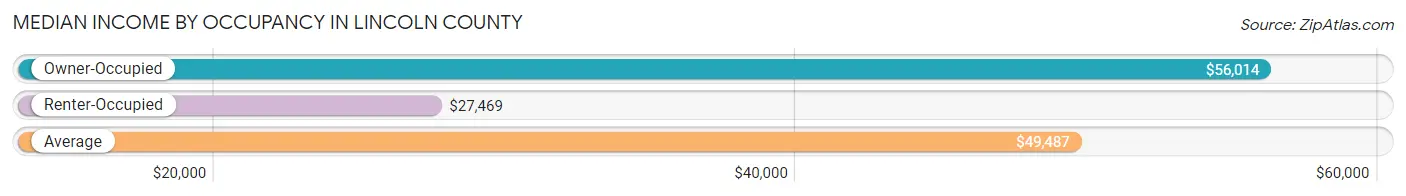
| Occupancy Type | # Households | Median Income |
| Owner-Occupied | 7,615 (78.6%) | $56,014 |
| Renter-Occupied | 2,077 (21.4%) | $27,469 |
| Average | 9,692 (100.0%) | $49,487 |
Occupancy by Householder Income Bracket in Lincoln County
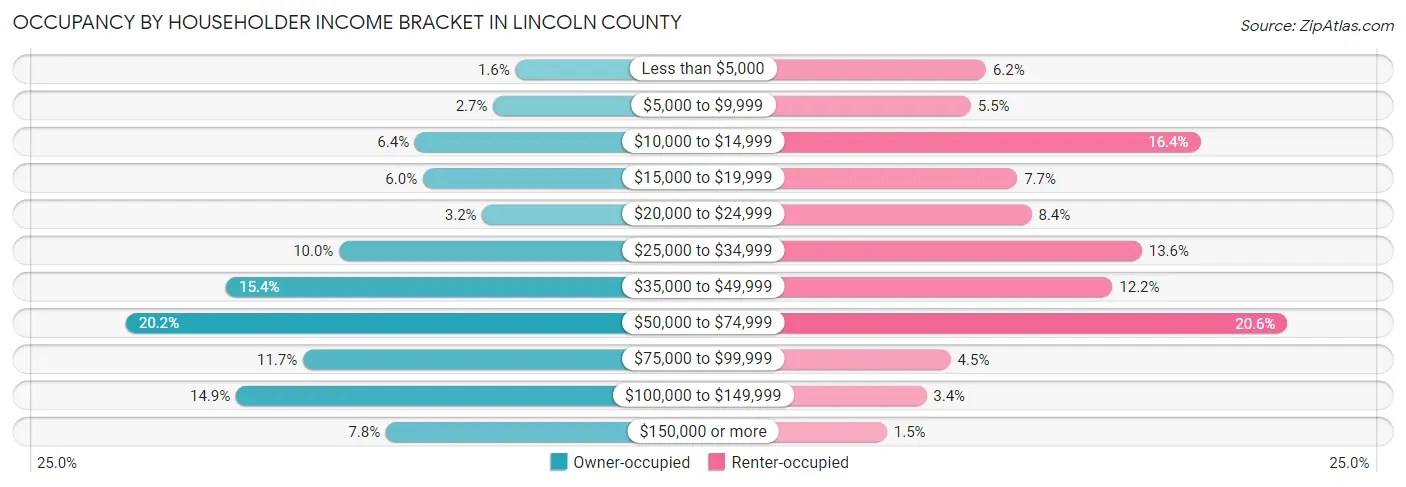
| Income Bracket | Owner-occupied | Renter-occupied |
| Less than $5,000 | 123 (1.6%) | 129 (6.2%) |
| $5,000 to $9,999 | 204 (2.7%) | 114 (5.5%) |
| $10,000 to $14,999 | 488 (6.4%) | 341 (16.4%) |
| $15,000 to $19,999 | 459 (6.0%) | 160 (7.7%) |
| $20,000 to $24,999 | 244 (3.2%) | 174 (8.4%) |
| $25,000 to $34,999 | 763 (10.0%) | 283 (13.6%) |
| $35,000 to $49,999 | 1,173 (15.4%) | 254 (12.2%) |
| $50,000 to $74,999 | 1,537 (20.2%) | 427 (20.6%) |
| $75,000 to $99,999 | 894 (11.7%) | 94 (4.5%) |
| $100,000 to $149,999 | 1,137 (14.9%) | 70 (3.4%) |
| $150,000 or more | 593 (7.8%) | 31 (1.5%) |
| Total | 7,615 (100.0%) | 2,077 (100.0%) |
Monthly Housing Cost Tiers in Lincoln County
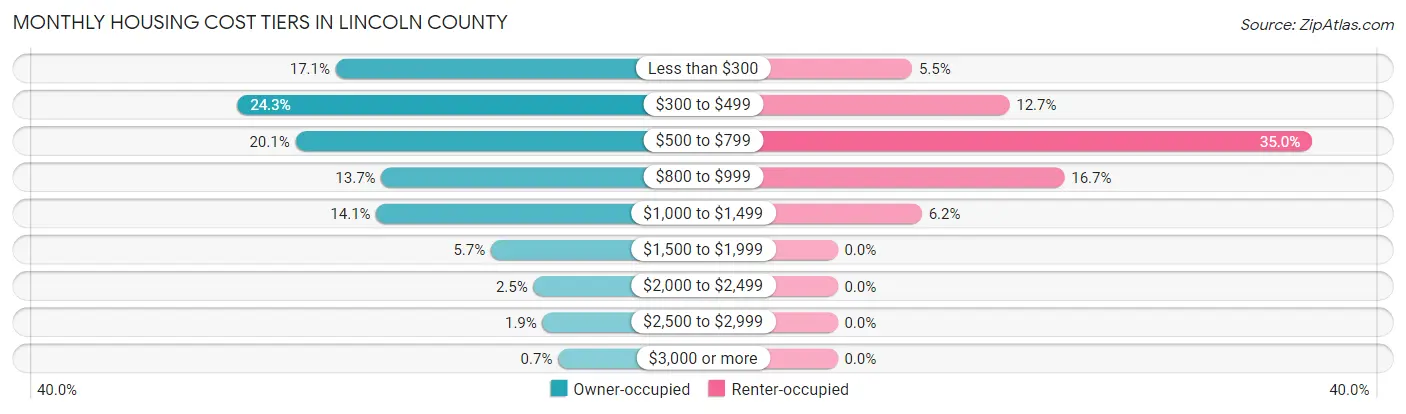
| Monthly Cost | Owner-occupied | Renter-occupied |
| Less than $300 | 1,301 (17.1%) | 114 (5.5%) |
| $300 to $499 | 1,853 (24.3%) | 263 (12.7%) |
| $500 to $799 | 1,527 (20.1%) | 726 (34.9%) |
| $800 to $999 | 1,045 (13.7%) | 347 (16.7%) |
| $1,000 to $1,499 | 1,073 (14.1%) | 129 (6.2%) |
| $1,500 to $1,999 | 430 (5.7%) | 0 (0.0%) |
| $2,000 to $2,499 | 192 (2.5%) | 0 (0.0%) |
| $2,500 to $2,999 | 141 (1.8%) | 0 (0.0%) |
| $3,000 or more | 53 (0.7%) | 0 (0.0%) |
| Total | 7,615 (100.0%) | 2,077 (100.0%) |
Physical Housing Characteristics in Lincoln County
Housing Structures in Lincoln County
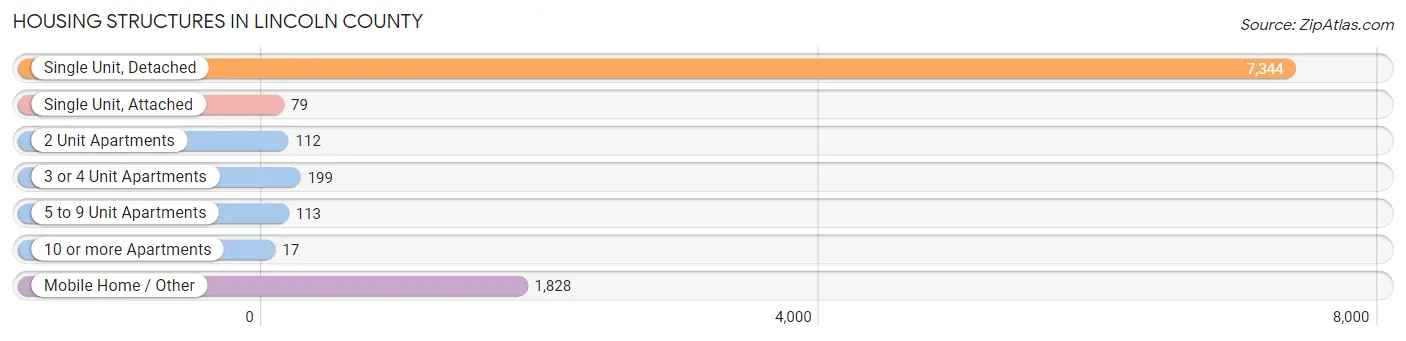
| Structure Type | # Housing Units | % Housing Units |
| Single Unit, Detached | 7,344 | 75.8% |
| Single Unit, Attached | 79 | 0.8% |
| 2 Unit Apartments | 112 | 1.2% |
| 3 or 4 Unit Apartments | 199 | 2.1% |
| 5 to 9 Unit Apartments | 113 | 1.2% |
| 10 or more Apartments | 17 | 0.2% |
| Mobile Home / Other | 1,828 | 18.9% |
| Total | 9,692 | 100.0% |
Housing Structures by Occupancy in Lincoln County
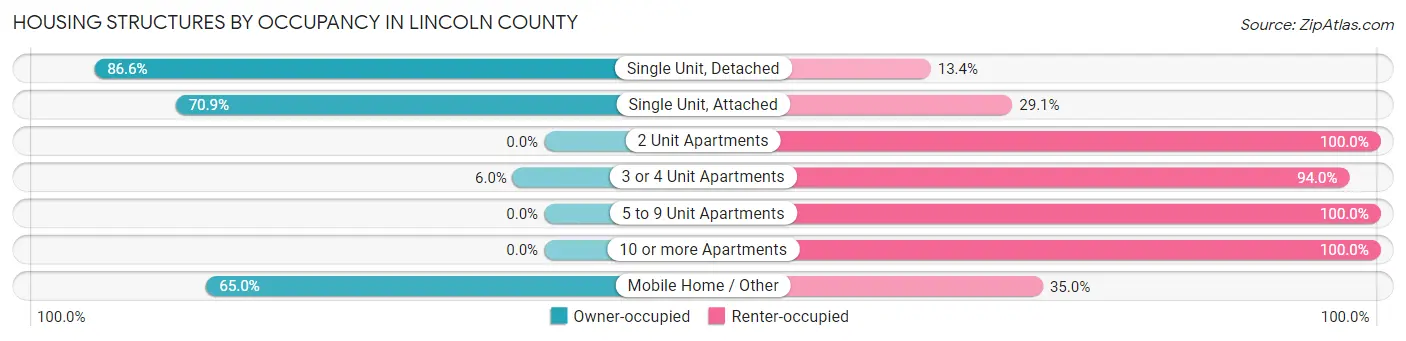
| Structure Type | Owner-occupied | Renter-occupied |
| Single Unit, Detached | 6,359 (86.6%) | 985 (13.4%) |
| Single Unit, Attached | 56 (70.9%) | 23 (29.1%) |
| 2 Unit Apartments | 0 (0.0%) | 112 (100.0%) |
| 3 or 4 Unit Apartments | 12 (6.0%) | 187 (94.0%) |
| 5 to 9 Unit Apartments | 0 (0.0%) | 113 (100.0%) |
| 10 or more Apartments | 0 (0.0%) | 17 (100.0%) |
| Mobile Home / Other | 1,188 (65.0%) | 640 (35.0%) |
| Total | 7,615 (78.6%) | 2,077 (21.4%) |
Housing Structures by Number of Rooms in Lincoln County
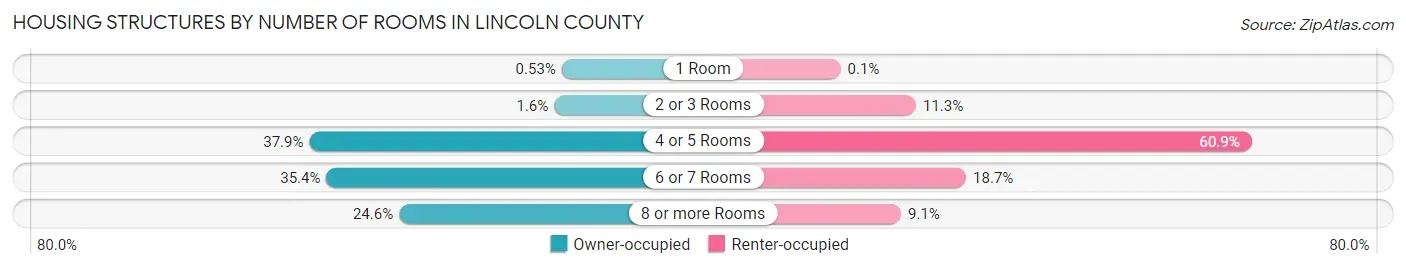
| Number of Rooms | Owner-occupied | Renter-occupied |
| 1 Room | 40 (0.5%) | 2 (0.1%) |
| 2 or 3 Rooms | 125 (1.6%) | 234 (11.3%) |
| 4 or 5 Rooms | 2,884 (37.9%) | 1,265 (60.9%) |
| 6 or 7 Rooms | 2,693 (35.4%) | 388 (18.7%) |
| 8 or more Rooms | 1,873 (24.6%) | 188 (9.0%) |
| Total | 7,615 (100.0%) | 2,077 (100.0%) |
Housing Structure by Heating Type in Lincoln County
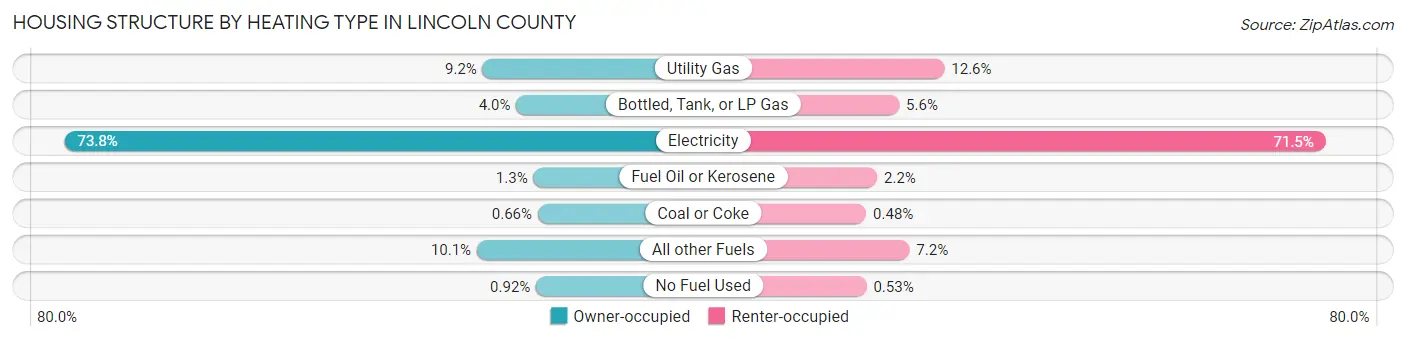
| Heating Type | Owner-occupied | Renter-occupied |
| Utility Gas | 700 (9.2%) | 261 (12.6%) |
| Bottled, Tank, or LP Gas | 304 (4.0%) | 116 (5.6%) |
| Electricity | 5,623 (73.8%) | 1,485 (71.5%) |
| Fuel Oil or Kerosene | 101 (1.3%) | 45 (2.2%) |
| Coal or Coke | 50 (0.7%) | 10 (0.5%) |
| All other Fuels | 767 (10.1%) | 149 (7.2%) |
| No Fuel Used | 70 (0.9%) | 11 (0.5%) |
| Total | 7,615 (100.0%) | 2,077 (100.0%) |
Household Vehicle Usage in Lincoln County
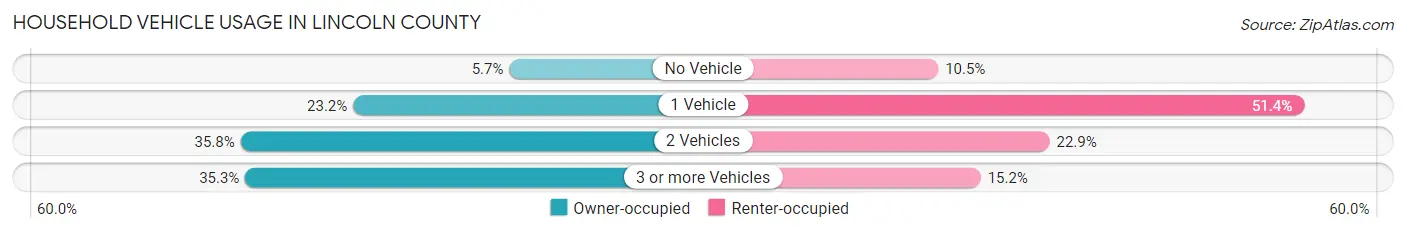
| Vehicles per Household | Owner-occupied | Renter-occupied |
| No Vehicle | 434 (5.7%) | 217 (10.4%) |
| 1 Vehicle | 1,767 (23.2%) | 1,068 (51.4%) |
| 2 Vehicles | 2,727 (35.8%) | 476 (22.9%) |
| 3 or more Vehicles | 2,687 (35.3%) | 316 (15.2%) |
| Total | 7,615 (100.0%) | 2,077 (100.0%) |
Real Estate & Mortgages in Lincoln County
Real Estate and Mortgage Overview in Lincoln County
| Characteristic | Without Mortgage | With Mortgage |
| Housing Units | 3,871 | 3,744 |
| Median Property Value | $115,500 | $141,900 |
| Median Household Income | $45,564 | $410 |
| Monthly Housing Costs | $358 | $43 |
| Real Estate Taxes | $706 | $144 |
Property Value by Mortgage Status in Lincoln County
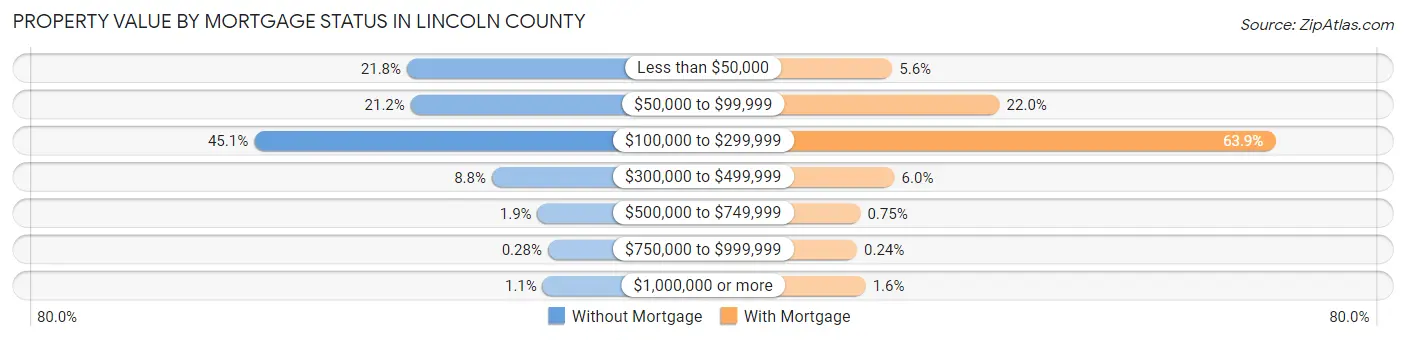
| Property Value | Without Mortgage | With Mortgage |
| Less than $50,000 | 842 (21.7%) | 210 (5.6%) |
| $50,000 to $99,999 | 820 (21.2%) | 822 (22.0%) |
| $100,000 to $299,999 | 1,744 (45.1%) | 2,394 (63.9%) |
| $300,000 to $499,999 | 341 (8.8%) | 223 (6.0%) |
| $500,000 to $749,999 | 72 (1.9%) | 28 (0.7%) |
| $750,000 to $999,999 | 11 (0.3%) | 9 (0.2%) |
| $1,000,000 or more | 41 (1.1%) | 58 (1.5%) |
| Total | 3,871 (100.0%) | 3,744 (100.0%) |
Household Income by Mortgage Status in Lincoln County
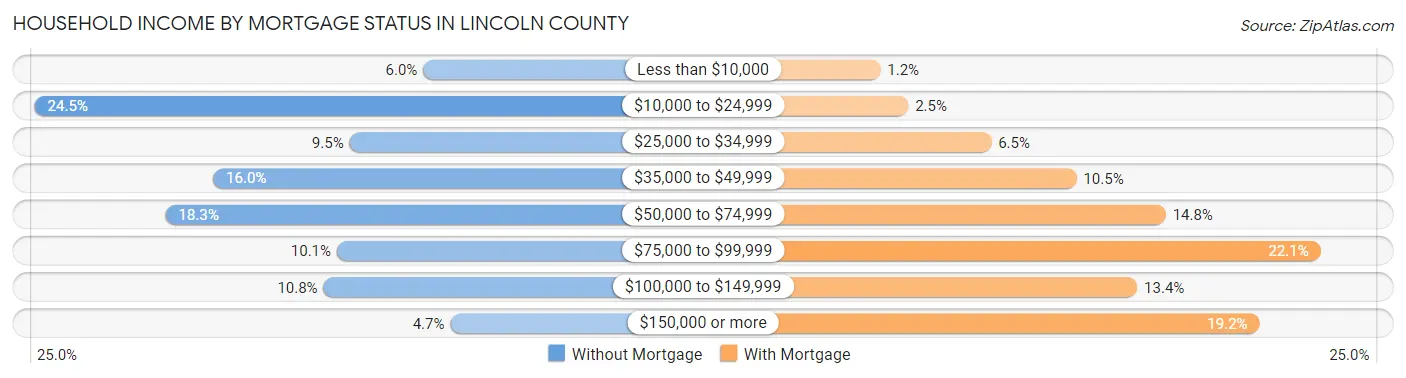
| Household Income | Without Mortgage | With Mortgage |
| Less than $10,000 | 233 (6.0%) | 44 (1.2%) |
| $10,000 to $24,999 | 949 (24.5%) | 94 (2.5%) |
| $25,000 to $34,999 | 369 (9.5%) | 242 (6.5%) |
| $35,000 to $49,999 | 620 (16.0%) | 394 (10.5%) |
| $50,000 to $74,999 | 708 (18.3%) | 553 (14.8%) |
| $75,000 to $99,999 | 392 (10.1%) | 829 (22.1%) |
| $100,000 to $149,999 | 417 (10.8%) | 502 (13.4%) |
| $150,000 or more | 183 (4.7%) | 720 (19.2%) |
| Total | 3,871 (100.0%) | 3,744 (100.0%) |
Property Value to Household Income Ratio in Lincoln County
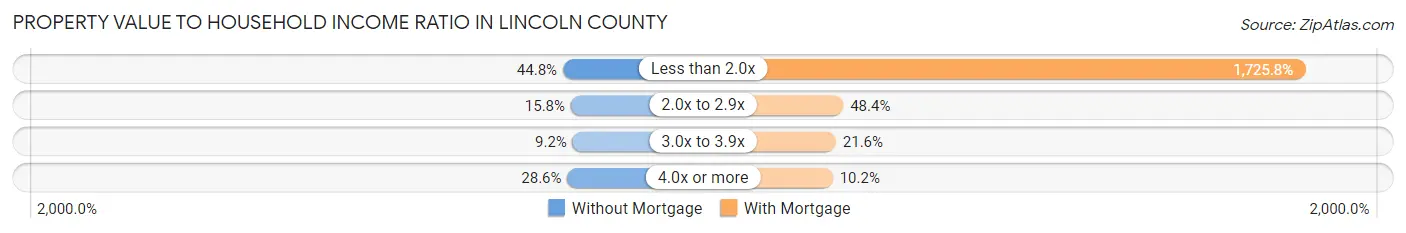
| Value-to-Income Ratio | Without Mortgage | With Mortgage |
| Less than 2.0x | 1,735 (44.8%) | 64,615 (1,725.8%) |
| 2.0x to 2.9x | 610 (15.8%) | 1,811 (48.4%) |
| 3.0x to 3.9x | 357 (9.2%) | 808 (21.6%) |
| 4.0x or more | 1,107 (28.6%) | 382 (10.2%) |
| Total | 3,871 (100.0%) | 3,744 (100.0%) |
Real Estate Taxes by Mortgage Status in Lincoln County
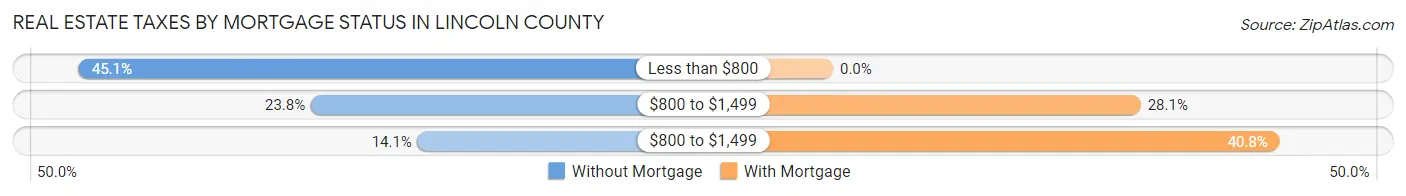
| Property Taxes | Without Mortgage | With Mortgage |
| Less than $800 | 1,744 (45.1%) | 0 (0.0%) |
| $800 to $1,499 | 923 (23.8%) | 1,052 (28.1%) |
| $800 to $1,499 | 546 (14.1%) | 1,527 (40.8%) |
| Total | 3,871 (100.0%) | 3,744 (100.0%) |
Health & Disability in Lincoln County
Health Insurance Coverage by Age in Lincoln County
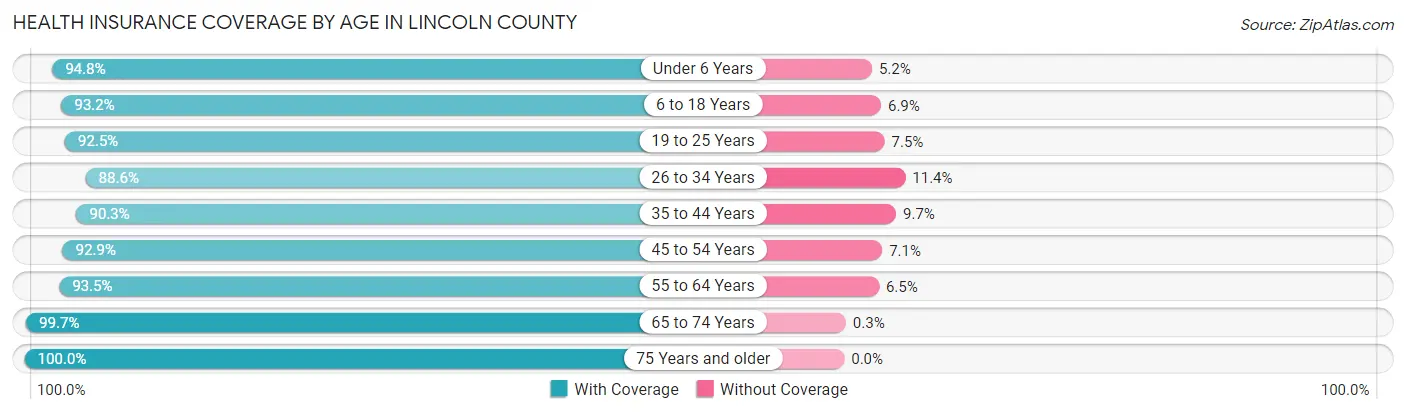
| Age Bracket | With Coverage | Without Coverage |
| Under 6 Years | 1,857 (94.8%) | 101 (5.2%) |
| 6 to 18 Years | 3,807 (93.1%) | 280 (6.9%) |
| 19 to 25 Years | 1,722 (92.5%) | 140 (7.5%) |
| 26 to 34 Years | 2,218 (88.6%) | 285 (11.4%) |
| 35 to 44 Years | 2,535 (90.3%) | 271 (9.7%) |
| 45 to 54 Years | 2,938 (92.9%) | 224 (7.1%) |
| 55 to 64 Years | 3,070 (93.5%) | 212 (6.5%) |
| 65 to 74 Years | 2,655 (99.7%) | 8 (0.3%) |
| 75 Years and older | 1,763 (100.0%) | 0 (0.0%) |
| Total | 22,565 (93.7%) | 1,521 (6.3%) |
Health Insurance Coverage by Citizenship Status in Lincoln County
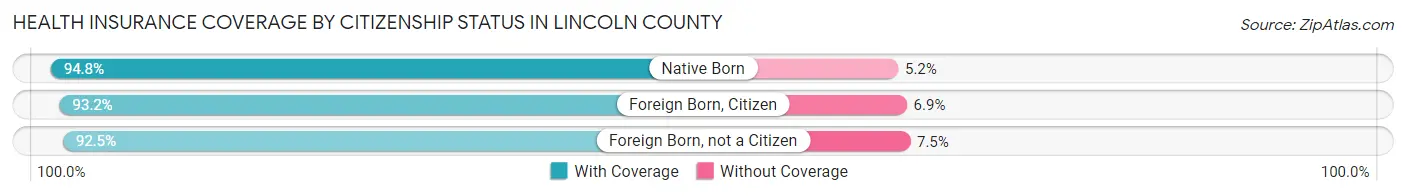
| Citizenship Status | With Coverage | Without Coverage |
| Native Born | 1,857 (94.8%) | 101 (5.2%) |
| Foreign Born, Citizen | 3,807 (93.1%) | 280 (6.9%) |
| Foreign Born, not a Citizen | 1,722 (92.5%) | 140 (7.5%) |
Health Insurance Coverage by Household Income in Lincoln County
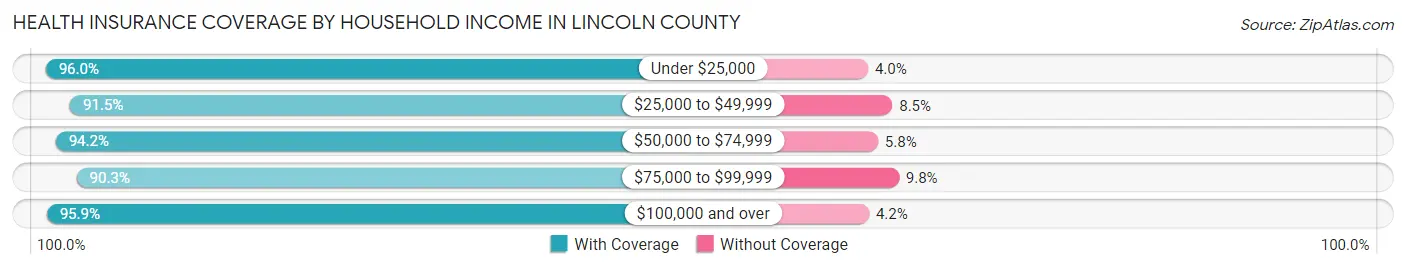
| Household Income | With Coverage | Without Coverage |
| Under $25,000 | 4,031 (96.0%) | 166 (4.0%) |
| $25,000 to $49,999 | 5,307 (91.5%) | 494 (8.5%) |
| $50,000 to $74,999 | 4,908 (94.2%) | 304 (5.8%) |
| $75,000 to $99,999 | 3,044 (90.2%) | 329 (9.8%) |
| $100,000 and over | 5,267 (95.9%) | 228 (4.2%) |
Public vs Private Health Insurance Coverage by Age in Lincoln County
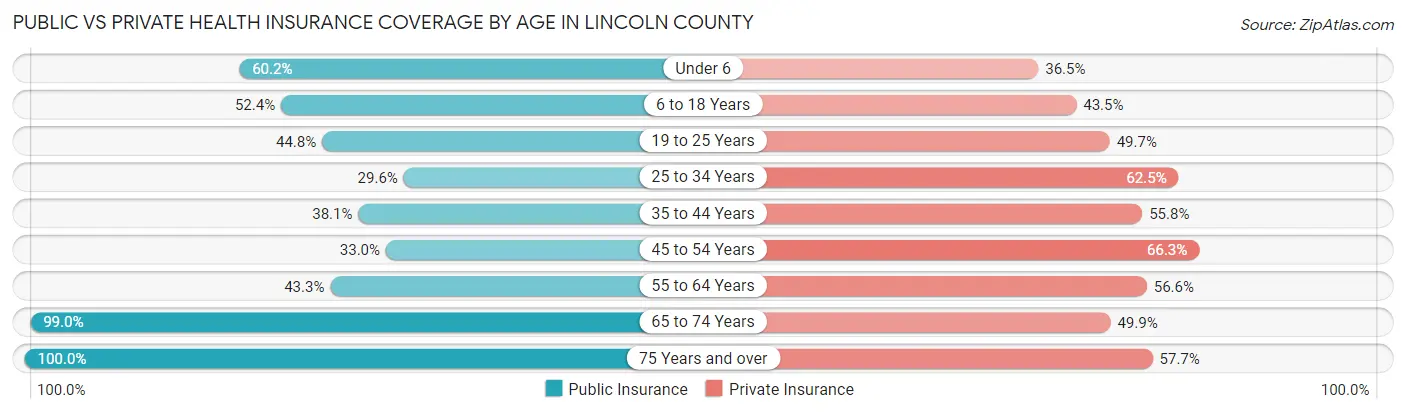
| Age Bracket | Public Insurance | Private Insurance |
| Under 6 | 1,178 (60.2%) | 714 (36.5%) |
| 6 to 18 Years | 2,142 (52.4%) | 1,779 (43.5%) |
| 19 to 25 Years | 834 (44.8%) | 926 (49.7%) |
| 25 to 34 Years | 742 (29.6%) | 1,564 (62.5%) |
| 35 to 44 Years | 1,068 (38.1%) | 1,565 (55.8%) |
| 45 to 54 Years | 1,042 (33.0%) | 2,097 (66.3%) |
| 55 to 64 Years | 1,420 (43.3%) | 1,858 (56.6%) |
| 65 to 74 Years | 2,635 (99.0%) | 1,328 (49.9%) |
| 75 Years and over | 1,763 (100.0%) | 1,017 (57.7%) |
| Total | 12,824 (53.2%) | 12,848 (53.3%) |
Disability Status by Sex by Age in Lincoln County
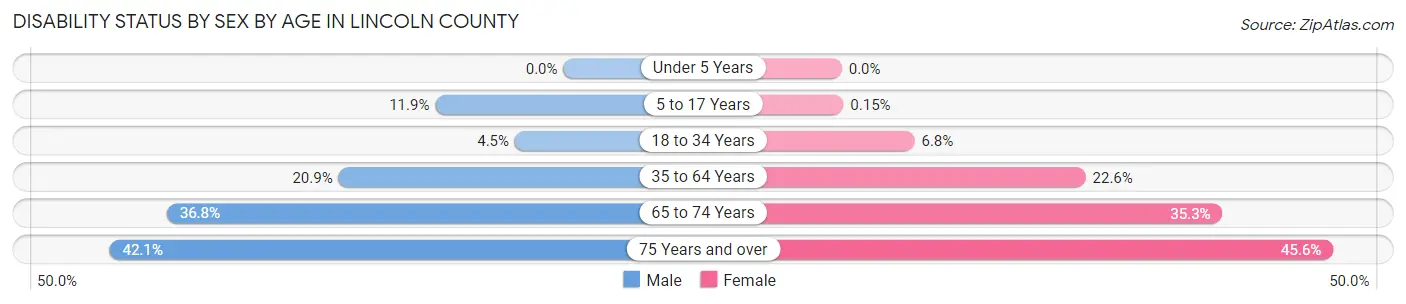
| Age Bracket | Male | Female |
| Under 5 Years | 0 (0.0%) | 0 (0.0%) |
| 5 to 17 Years | 255 (11.9%) | 3 (0.2%) |
| 18 to 34 Years | 105 (4.5%) | 154 (6.8%) |
| 35 to 64 Years | 943 (20.9%) | 1,071 (22.6%) |
| 65 to 74 Years | 456 (36.8%) | 503 (35.3%) |
| 75 Years and over | 312 (42.1%) | 466 (45.6%) |
Disability Class by Sex by Age in Lincoln County
Disability Class: Hearing Difficulty
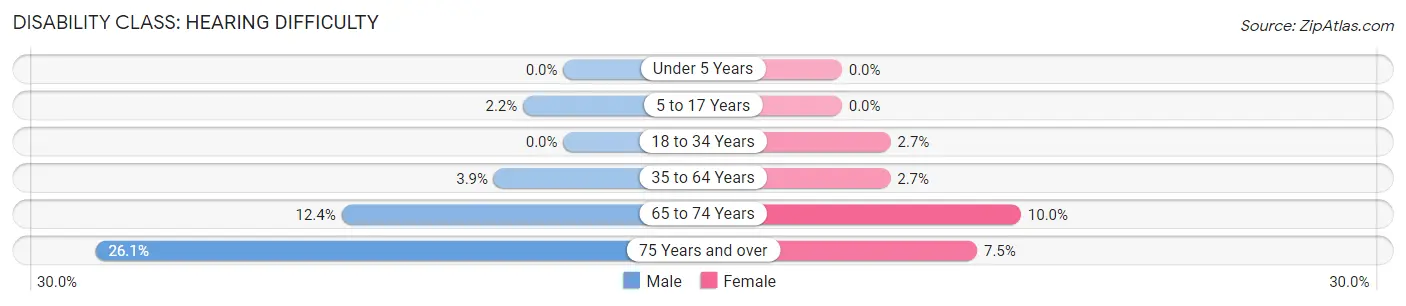
| Age Bracket | Male | Female |
| Under 5 Years | 0 (0.0%) | 0 (0.0%) |
| 5 to 17 Years | 48 (2.2%) | 0 (0.0%) |
| 18 to 34 Years | 0 (0.0%) | 62 (2.7%) |
| 35 to 64 Years | 175 (3.9%) | 128 (2.7%) |
| 65 to 74 Years | 153 (12.3%) | 142 (10.0%) |
| 75 Years and over | 193 (26.1%) | 77 (7.5%) |
Disability Class: Vision Difficulty
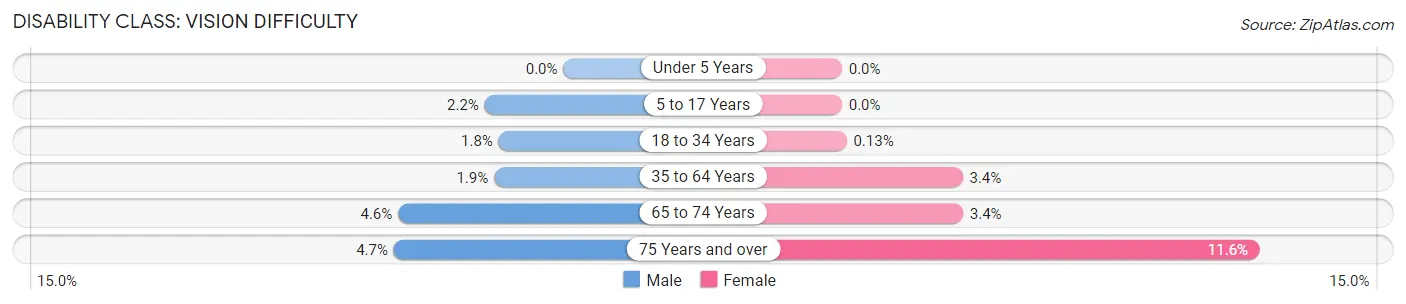
| Age Bracket | Male | Female |
| Under 5 Years | 0 (0.0%) | 0 (0.0%) |
| 5 to 17 Years | 47 (2.2%) | 0 (0.0%) |
| 18 to 34 Years | 42 (1.8%) | 3 (0.1%) |
| 35 to 64 Years | 87 (1.9%) | 159 (3.4%) |
| 65 to 74 Years | 57 (4.6%) | 48 (3.4%) |
| 75 Years and over | 35 (4.7%) | 119 (11.6%) |
Disability Class: Cognitive Difficulty
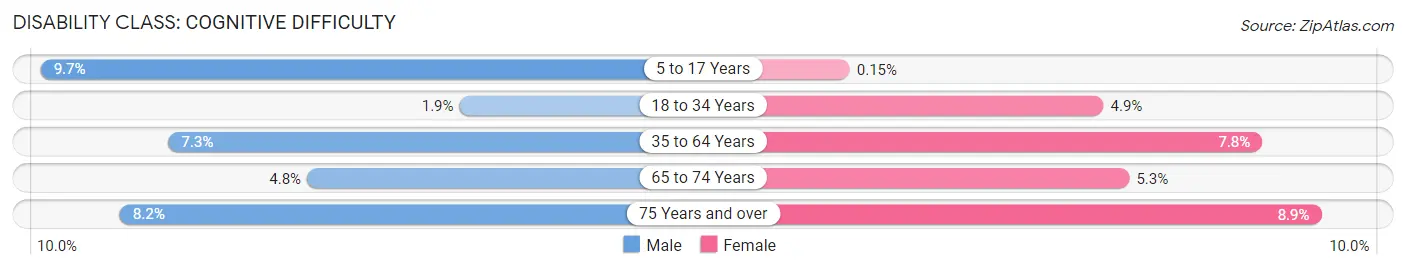
| Age Bracket | Male | Female |
| 5 to 17 Years | 208 (9.7%) | 3 (0.2%) |
| 18 to 34 Years | 45 (1.9%) | 111 (4.9%) |
| 35 to 64 Years | 331 (7.3%) | 369 (7.8%) |
| 65 to 74 Years | 59 (4.8%) | 76 (5.3%) |
| 75 Years and over | 61 (8.2%) | 91 (8.9%) |
Disability Class: Ambulatory Difficulty
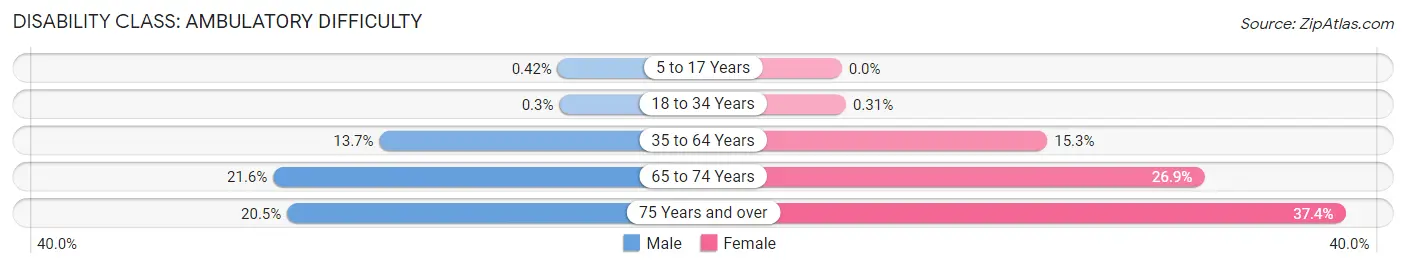
| Age Bracket | Male | Female |
| 5 to 17 Years | 9 (0.4%) | 0 (0.0%) |
| 18 to 34 Years | 7 (0.3%) | 7 (0.3%) |
| 35 to 64 Years | 617 (13.7%) | 722 (15.3%) |
| 65 to 74 Years | 267 (21.5%) | 383 (26.9%) |
| 75 Years and over | 152 (20.5%) | 382 (37.4%) |
Disability Class: Self-Care Difficulty
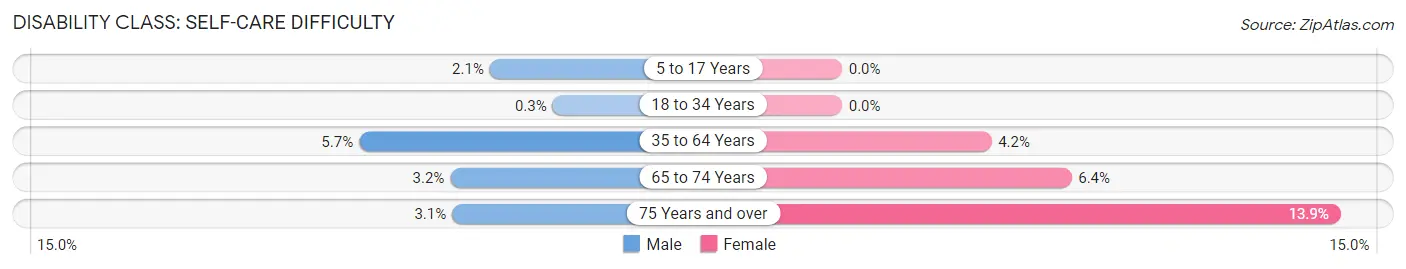
| Age Bracket | Male | Female |
| 5 to 17 Years | 44 (2.1%) | 0 (0.0%) |
| 18 to 34 Years | 7 (0.3%) | 0 (0.0%) |
| 35 to 64 Years | 257 (5.7%) | 197 (4.2%) |
| 65 to 74 Years | 39 (3.2%) | 91 (6.4%) |
| 75 Years and over | 23 (3.1%) | 142 (13.9%) |
Technology Access in Lincoln County
Computing Device Access in Lincoln County
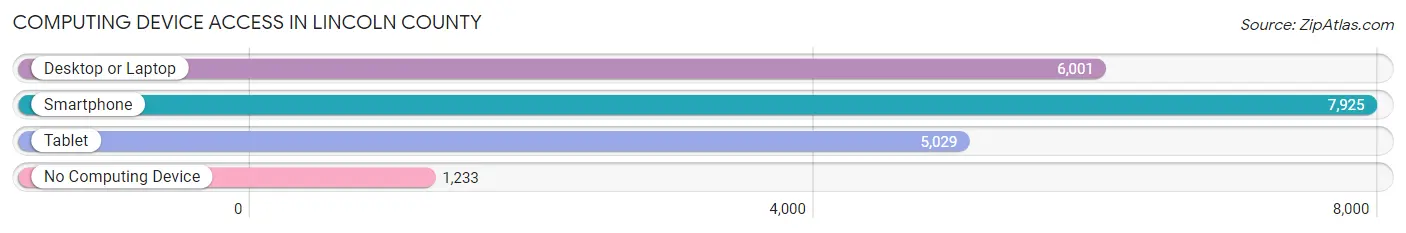
| Device Type | # Households | % Households |
| Desktop or Laptop | 6,001 | 61.9% |
| Smartphone | 7,925 | 81.8% |
| Tablet | 5,029 | 51.9% |
| No Computing Device | 1,233 | 12.7% |
| Total | 9,692 | 100.0% |
Internet Access in Lincoln County
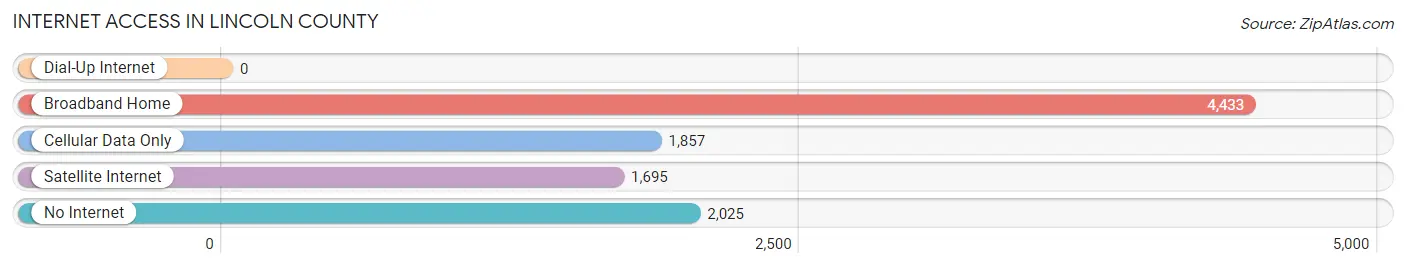
| Internet Type | # Households | % Households |
| Dial-Up Internet | 0 | 0.0% |
| Broadband Home | 4,433 | 45.7% |
| Cellular Data Only | 1,857 | 19.2% |
| Satellite Internet | 1,695 | 17.5% |
| No Internet | 2,025 | 20.9% |
| Total | 9,692 | 100.0% |
Lincoln County Summary
Lincoln County is located in the central part of Kentucky, in the Appalachian region of the United States. It is bordered by Pulaski County to the north, Rockcastle County to the east, Laurel County to the south, and Garrard County to the west. The county seat is Stanford, and the largest city is Crab Orchard. The county was formed in 1780 and named after Major General Benjamin Lincoln, who served in the American Revolutionary War.
Geography
Lincoln County covers an area of 437 square miles, of which 434 square miles is land and 3 square miles is water. The county is located in the Appalachian region of Kentucky, and is characterized by rolling hills and valleys. The highest point in the county is located at the intersection of KY-1247 and KY-1248, at an elevation of 1,068 feet. The county is drained by the South Fork of the Kentucky River, which flows through the county from north to south.
The climate of Lincoln County is humid subtropical, with hot, humid summers and mild winters. The average annual temperature is 57°F, and the average annual precipitation is 45 inches.
Economy
The economy of Lincoln County is largely based on agriculture and manufacturing. The county is home to several large farms, which produce corn, soybeans, wheat, hay, and tobacco. The county is also home to several manufacturing companies, including a furniture factory, a plastics factory, and a paper mill.
The county is also home to several tourist attractions, including the Lincoln County Historical Museum, the Lincoln County Courthouse, and the Lincoln County Fairgrounds.
Demographics
As of the 2010 census, Lincoln County had a population of 24,742. The racial makeup of the county was 95.3% White, 2.3% Black or African American, 0.3% Native American, 0.3% Asian, 0.2% Pacific Islander, 0.7% from other races, and 0.9% from two or more races. Hispanic or Latino of any race were 1.7% of the population.
The median household income in Lincoln County was $37,945, and the median family income was $45,945. The per capita income was $19,845. About 17.2% of the population was below the poverty line.
Education
Lincoln County is served by the Lincoln County School District, which operates seven elementary schools, two middle schools, and two high schools. The county is also home to several private schools, including the Lincoln County Christian Academy and the Lincoln County Academy. The county is also home to several post-secondary institutions, including the Lincoln County Technical College and the Lincoln County Community College.
Common Questions
What is Per Capita Income in Lincoln County?
Per Capita income in Lincoln County is $25,972.
What is the Median Family Income in Lincoln County?
Median Family Income in Lincoln County is $58,639.
What is the Median Household income in Lincoln County?
Median Household Income in Lincoln County is $49,487.
What is Income or Wage Gap in Lincoln County?
Income or Wage Gap in Lincoln County is 28.3%.
Women in Lincoln County earn 71.7 cents for every dollar earned by a man.
What is Family Income Deficit in Lincoln County?
Family Income Deficit in Lincoln County is $9,023.
Families that are below poverty line in Lincoln County earn $9,023 less on average than the poverty threshold level.
What is Inequality or Gini Index in Lincoln County?
Inequality or Gini Index in Lincoln County is 0.45.
What is the Total Population of Lincoln County?
Total Population of Lincoln County is 24,320.
What is the Total Male Population of Lincoln County?
Total Male Population of Lincoln County is 11,989.
What is the Total Female Population of Lincoln County?
Total Female Population of Lincoln County is 12,331.
What is the Ratio of Males per 100 Females in Lincoln County?
There are 97.23 Males per 100 Females in Lincoln County.
What is the Ratio of Females per 100 Males in Lincoln County?
There are 102.85 Females per 100 Males in Lincoln County.
What is the Median Population Age in Lincoln County?
Median Population Age in Lincoln County is 41.4 Years.
What is the Average Family Size in Lincoln County
Average Family Size in Lincoln County is 2.9 People.
What is the Average Household Size in Lincoln County
Average Household Size in Lincoln County is 2.5 People.
How Large is the Labor Force in Lincoln County?
There are 10,564 People in the Labor Forcein in Lincoln County.
What is the Percentage of People in the Labor Force in Lincoln County?
55.1% of People are in the Labor Force in Lincoln County.
What is the Unemployment Rate in Lincoln County?
Unemployment Rate in Lincoln County is 6.6%.