Leslie County, KY Map & Demographics
Leslie County Map
Leslie County Overview
$18,739
PER CAPITA INCOME
$50,819
AVG FAMILY INCOME
$37,019
AVG HOUSEHOLD INCOME
52.5%
WAGE / INCOME GAP [ % ]
47.5¢/ $1
WAGE / INCOME GAP [ $ ]
$10,244
FAMILY INCOME DEFICIT
0.42
INEQUALITY / GINI INDEX
10,468
TOTAL POPULATION
5,249
MALE POPULATION
5,219
FEMALE POPULATION
100.57
MALES / 100 FEMALES
99.43
FEMALES / 100 MALES
43.2
MEDIAN AGE
3.6
AVG FAMILY SIZE
2.7
AVG HOUSEHOLD SIZE
3,716
LABOR FORCE [ PEOPLE ]
43.8%
PERCENT IN LABOR FORCE
10.0%
UNEMPLOYMENT RATE
Leslie County Area Codes
Income in Leslie County
Income Overview in Leslie County
Per Capita Income in Leslie County is $18,739, while median incomes of families and households are $50,819 and $37,019 respectively.
| Characteristic | Number | Measure |
| Per Capita Income | 10,468 | $18,739 |
| Median Family Income | 2,324 | $50,819 |
| Mean Family Income | 2,324 | $59,117 |
| Median Household Income | 3,698 | $37,019 |
| Mean Household Income | 3,698 | $48,176 |
| Income Deficit | 2,324 | $10,244 |
| Wage / Income Gap (%) | 10,468 | 52.52% |
| Wage / Income Gap ($) | 10,468 | 47.48¢ per $1 |
| Gini / Inequality Index | 10,468 | 0.42 |
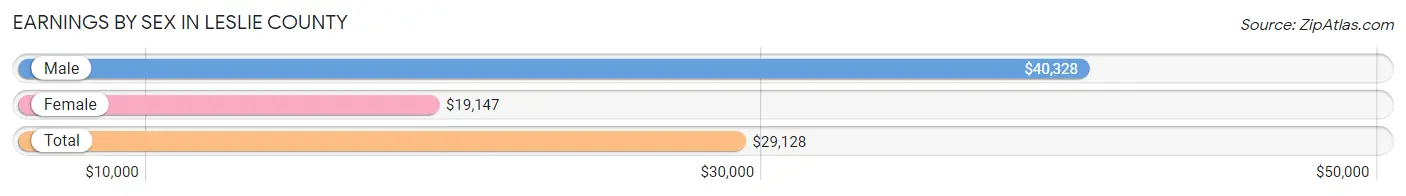
Earnings by Sex in Leslie County
Average Earnings in Leslie County are $29,128, $40,328 for men and $19,147 for women, a difference of 52.5%.
| Sex | Number | Average Earnings |
| Male | 1,874 (50.0%) | $40,328 |
| Female | 1,875 (50.0%) | $19,147 |
| Total | 3,749 (100.0%) | $29,128 |
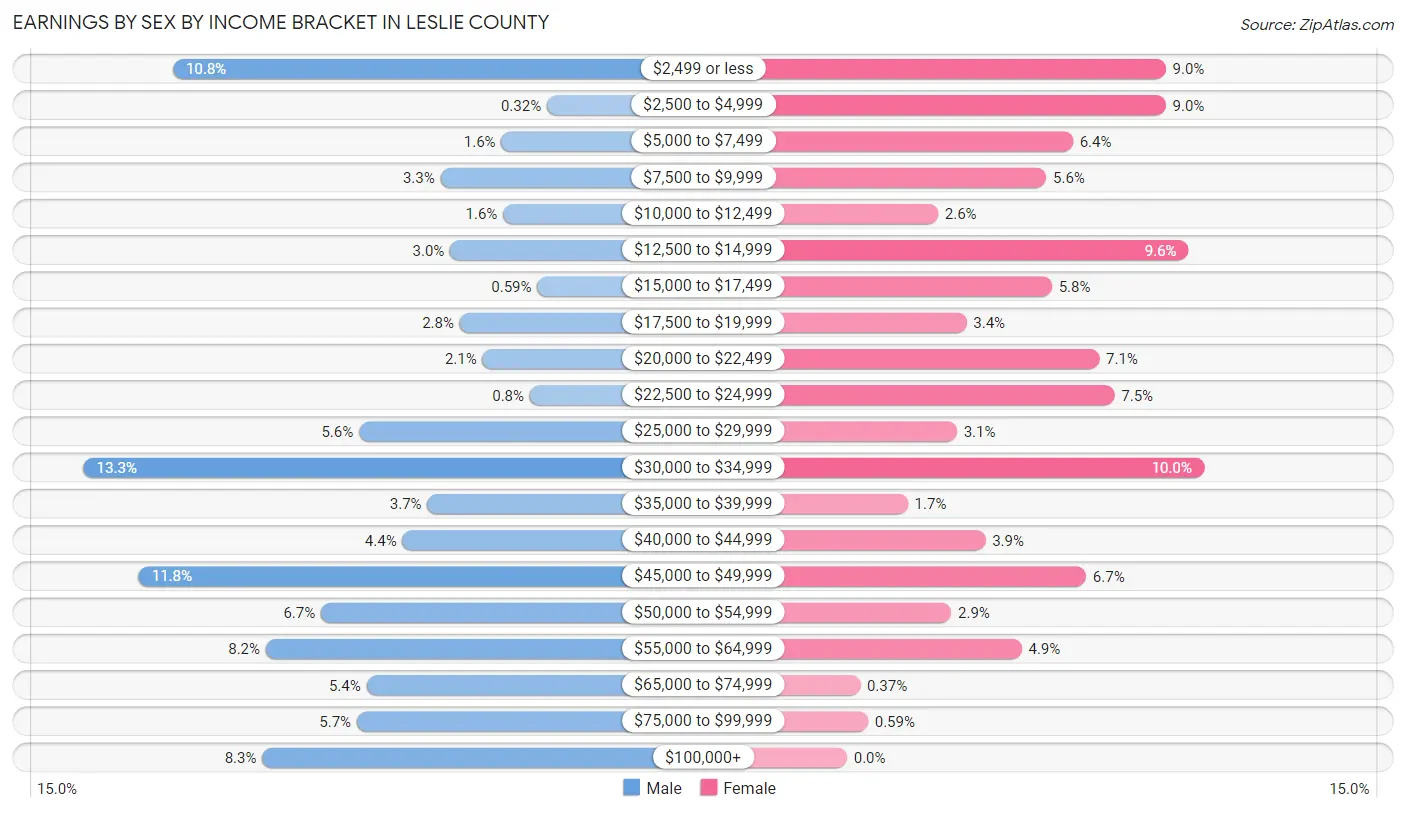
Earnings by Sex by Income Bracket in Leslie County
The most common earnings brackets in Leslie County are $30,000 to $34,999 for men (250 | 13.3%) and $30,000 to $34,999 for women (188 | 10.0%).
| Income | Male | Female |
| $2,499 or less | 203 (10.8%) | 168 (9.0%) |
| $2,500 to $4,999 | 6 (0.3%) | 168 (9.0%) |
| $5,000 to $7,499 | 30 (1.6%) | 119 (6.4%) |
| $7,500 to $9,999 | 62 (3.3%) | 105 (5.6%) |
| $10,000 to $12,499 | 29 (1.5%) | 48 (2.6%) |
| $12,500 to $14,999 | 57 (3.0%) | 180 (9.6%) |
| $15,000 to $17,499 | 11 (0.6%) | 108 (5.8%) |
| $17,500 to $19,999 | 52 (2.8%) | 63 (3.4%) |
| $20,000 to $22,499 | 40 (2.1%) | 133 (7.1%) |
| $22,500 to $24,999 | 15 (0.8%) | 141 (7.5%) |
| $25,000 to $29,999 | 105 (5.6%) | 58 (3.1%) |
| $30,000 to $34,999 | 250 (13.3%) | 188 (10.0%) |
| $35,000 to $39,999 | 69 (3.7%) | 32 (1.7%) |
| $40,000 to $44,999 | 82 (4.4%) | 73 (3.9%) |
| $45,000 to $49,999 | 221 (11.8%) | 126 (6.7%) |
| $50,000 to $54,999 | 125 (6.7%) | 55 (2.9%) |
| $55,000 to $64,999 | 154 (8.2%) | 92 (4.9%) |
| $65,000 to $74,999 | 101 (5.4%) | 7 (0.4%) |
| $75,000 to $99,999 | 106 (5.7%) | 11 (0.6%) |
| $100,000+ | 156 (8.3%) | 0 (0.0%) |
| Total | 1,874 (100.0%) | 1,875 (100.0%) |
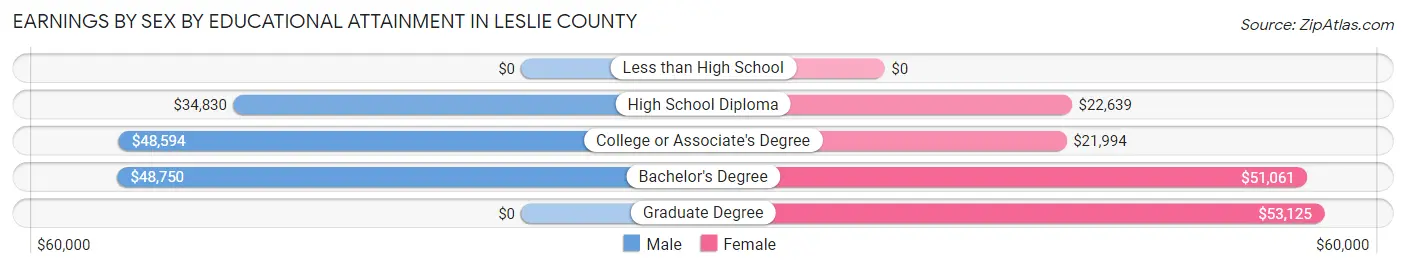
Earnings by Sex by Educational Attainment in Leslie County
Average earnings in Leslie County are $42,356 for men and $22,969 for women, a difference of 45.8%. Men with an educational attainment of bachelor's degree enjoy the highest average annual earnings of $48,750, while those with high school diploma education earn the least with $34,830. Women with an educational attainment of graduate degree earn the most with the average annual earnings of $53,125, while those with college or associate's degree education have the smallest earnings of $21,994.
| Educational Attainment | Male Income | Female Income |
| Less than High School | - | - |
| High School Diploma | $34,830 | $22,639 |
| College or Associate's Degree | $48,594 | $21,994 |
| Bachelor's Degree | $48,750 | $51,061 |
| Graduate Degree | - | - |
| Total | $42,356 | $22,969 |
Family Income in Leslie County
Family Income Brackets in Leslie County
According to the Leslie County family income data, there are 581 families falling into the $50,000 to $74,999 income range, which is the most common income bracket and makes up 25.0% of all families. Conversely, the $150,000 to $199,999 income bracket is the least frequent group with only 9 families (0.4%) belonging to this category.
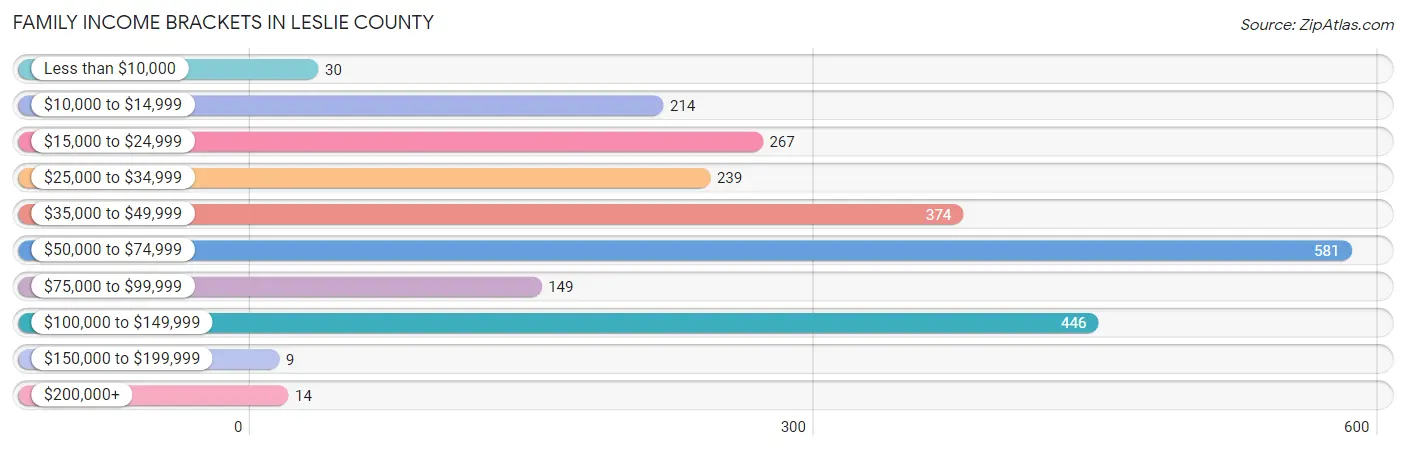
| Income Bracket | # Families | % Families |
| Less than $10,000 | 30 | 1.3% |
| $10,000 to $14,999 | 214 | 9.2% |
| $15,000 to $24,999 | 267 | 11.5% |
| $25,000 to $34,999 | 239 | 10.3% |
| $35,000 to $49,999 | 374 | 16.1% |
| $50,000 to $74,999 | 581 | 25.0% |
| $75,000 to $99,999 | 149 | 6.4% |
| $100,000 to $149,999 | 446 | 19.2% |
| $150,000 to $199,999 | 9 | 0.4% |
| $200,000+ | 14 | 0.6% |
Family Income by Famaliy Size in Leslie County
3-person families (511 | 22.0%) account for the highest median family income in Leslie County with $63,839 per family, while 2-person families (1,181 | 50.8%) have the highest median income of $23,454 per family member.
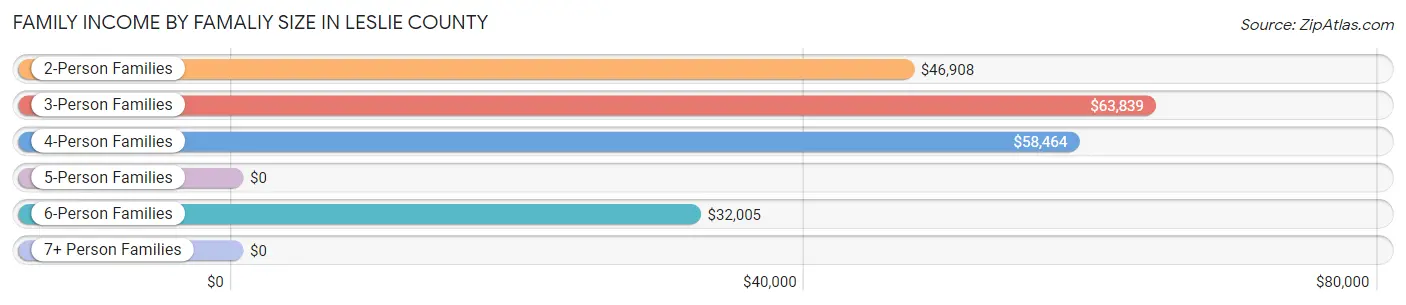
| Income Bracket | # Families | Median Income |
| 2-Person Families | 1,181 (50.8%) | $46,908 |
| 3-Person Families | 511 (22.0%) | $63,839 |
| 4-Person Families | 239 (10.3%) | $58,464 |
| 5-Person Families | 197 (8.5%) | $0 |
| 6-Person Families | 133 (5.7%) | $32,005 |
| 7+ Person Families | 63 (2.7%) | $0 |
| Total | 2,324 (100.0%) | $50,819 |
Family Income by Number of Earners in Leslie County
The median family income in Leslie County is $50,819, with families comprising 3+ earners (63) having the highest median family income of $104,007, while families with no earners (588) have the lowest median family income of $26,250, accounting for 2.7% and 25.3% of families, respectively.
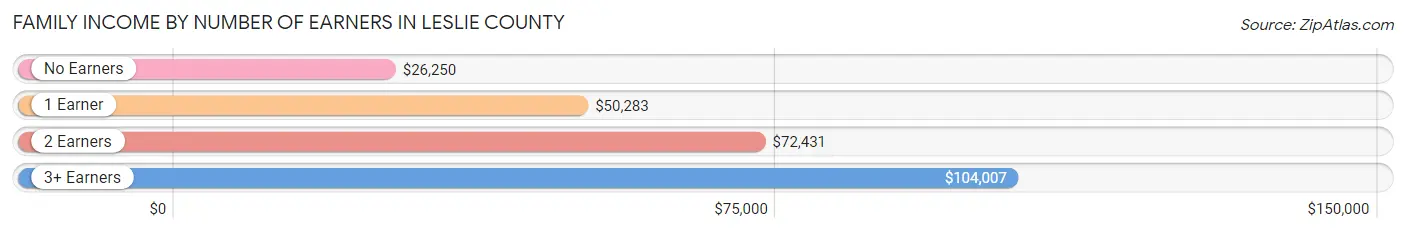
| Number of Earners | # Families | Median Income |
| No Earners | 588 (25.3%) | $26,250 |
| 1 Earner | 912 (39.2%) | $50,283 |
| 2 Earners | 761 (32.8%) | $72,431 |
| 3+ Earners | 63 (2.7%) | $104,007 |
| Total | 2,324 (100.0%) | $50,819 |
Household Income in Leslie County
Household Income Brackets in Leslie County
With 695 households falling in the category, the $50,000 to $74,999 income range is the most frequent in Leslie County, accounting for 18.8% of all households. In contrast, only 11 households (0.3%) fall into the $150,000 to $199,999 income bracket, making it the least populous group.
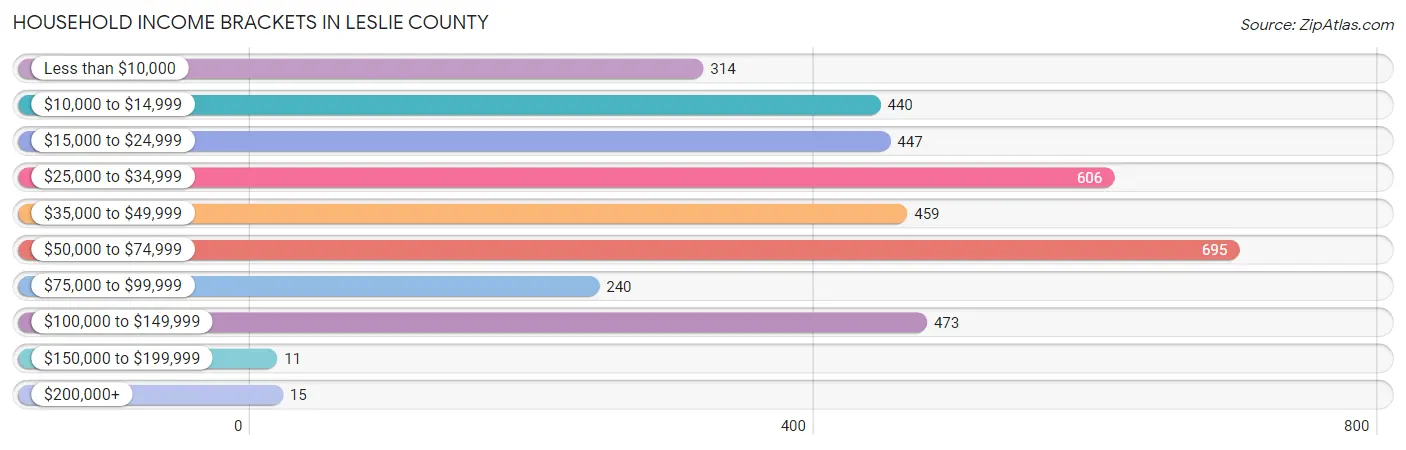
| Income Bracket | # Households | % Households |
| Less than $10,000 | 314 | 8.5% |
| $10,000 to $14,999 | 440 | 11.9% |
| $15,000 to $24,999 | 447 | 12.1% |
| $25,000 to $34,999 | 606 | 16.4% |
| $35,000 to $49,999 | 459 | 12.4% |
| $50,000 to $74,999 | 695 | 18.8% |
| $75,000 to $99,999 | 240 | 6.5% |
| $100,000 to $149,999 | 473 | 12.8% |
| $150,000 to $199,999 | 11 | 0.3% |
| $200,000+ | 15 | 0.4% |
Household Income by Householder Age in Leslie County
The median household income in Leslie County is $37,019, with the highest median household income of $53,869 found in the 25 to 44 years age bracket for the primary householder. A total of 809 households (21.9%) fall into this category. Meanwhile, the 65+ years age bracket for the primary householder has the lowest median household income of $28,284, with 1,210 households (32.7%) in this group.
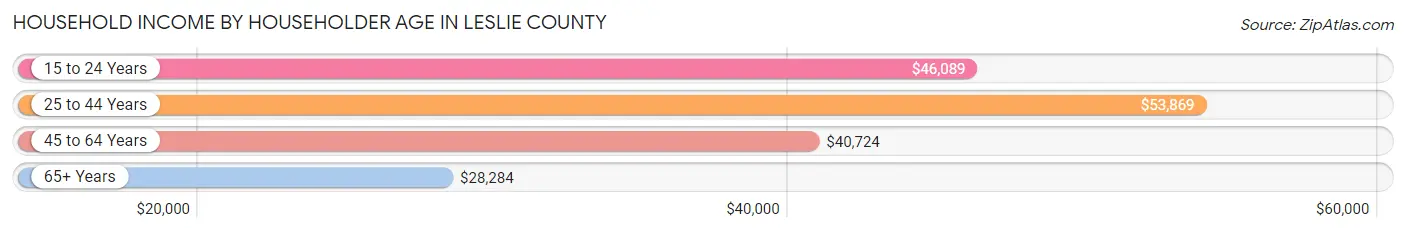
| Income Bracket | # Households | Median Income |
| 15 to 24 Years | 83 (2.2%) | $46,089 |
| 25 to 44 Years | 809 (21.9%) | $53,869 |
| 45 to 64 Years | 1,596 (43.2%) | $40,724 |
| 65+ Years | 1,210 (32.7%) | $28,284 |
| Total | 3,698 (100.0%) | $37,019 |
Poverty in Leslie County
Income Below Poverty by Sex and Age in Leslie County
With 30.6% poverty level for males and 36.6% for females among the residents of Leslie County, 15 year old males and 5 year old females are the most vulnerable to poverty, with 52 males (66.7%) and 23 females (100.0%) in their respective age groups living below the poverty level.
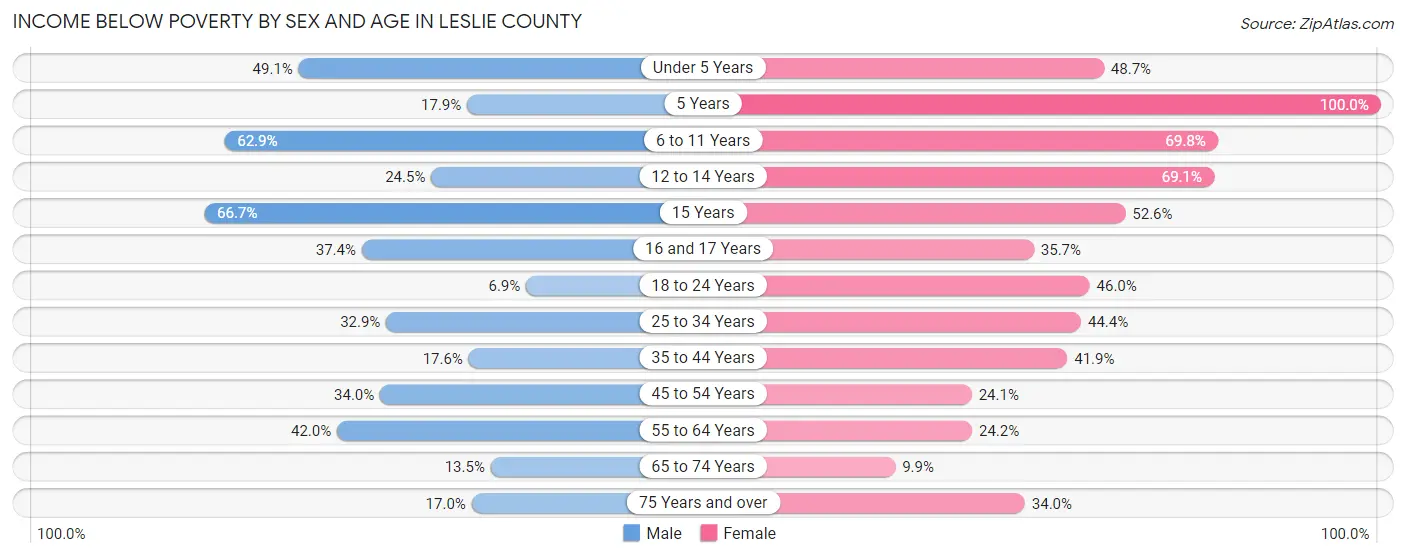
| Age Bracket | Male | Female |
| Under 5 Years | 142 (49.1%) | 108 (48.6%) |
| 5 Years | 15 (17.9%) | 23 (100.0%) |
| 6 to 11 Years | 219 (62.9%) | 173 (69.8%) |
| 12 to 14 Years | 51 (24.5%) | 232 (69.1%) |
| 15 Years | 52 (66.7%) | 40 (52.6%) |
| 16 and 17 Years | 52 (37.4%) | 41 (35.6%) |
| 18 to 24 Years | 28 (6.9%) | 253 (46.0%) |
| 25 to 34 Years | 194 (32.9%) | 131 (44.4%) |
| 35 to 44 Years | 100 (17.6%) | 288 (41.9%) |
| 45 to 54 Years | 234 (34.0%) | 172 (24.1%) |
| 55 to 64 Years | 326 (42.0%) | 184 (24.2%) |
| 65 to 74 Years | 76 (13.5%) | 59 (9.9%) |
| 75 Years and over | 48 (17.0%) | 140 (34.0%) |
| Total | 1,537 (30.6%) | 1,844 (36.6%) |
Income Above Poverty by Sex and Age in Leslie County
According to the poverty statistics in Leslie County, males aged 18 to 24 years and females aged 65 to 74 years are the age groups that are most secure financially, with 93.1% of males and 90.1% of females in these age groups living above the poverty line.
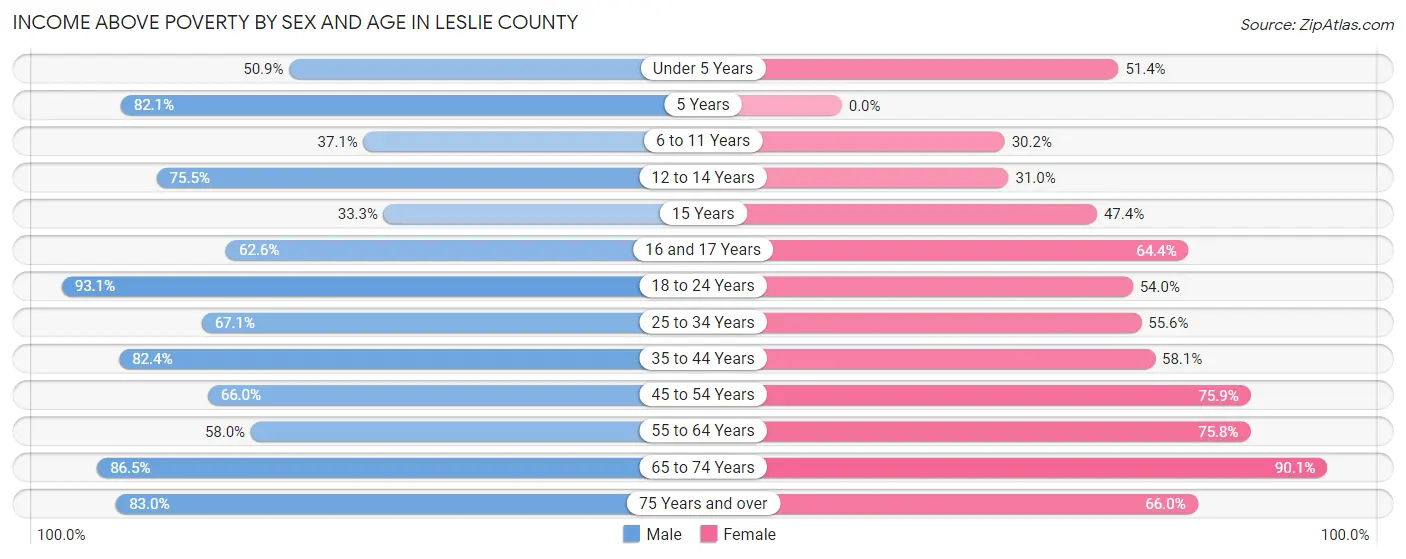
| Age Bracket | Male | Female |
| Under 5 Years | 147 (50.9%) | 114 (51.3%) |
| 5 Years | 69 (82.1%) | 0 (0.0%) |
| 6 to 11 Years | 129 (37.1%) | 75 (30.2%) |
| 12 to 14 Years | 157 (75.5%) | 104 (30.9%) |
| 15 Years | 26 (33.3%) | 36 (47.4%) |
| 16 and 17 Years | 87 (62.6%) | 74 (64.3%) |
| 18 to 24 Years | 377 (93.1%) | 297 (54.0%) |
| 25 to 34 Years | 396 (67.1%) | 164 (55.6%) |
| 35 to 44 Years | 469 (82.4%) | 400 (58.1%) |
| 45 to 54 Years | 454 (66.0%) | 541 (75.9%) |
| 55 to 64 Years | 450 (58.0%) | 577 (75.8%) |
| 65 to 74 Years | 488 (86.5%) | 536 (90.1%) |
| 75 Years and over | 234 (83.0%) | 272 (66.0%) |
| Total | 3,483 (69.4%) | 3,190 (63.4%) |
Income Below Poverty Among Married-Couple Families in Leslie County
The poverty statistics for married-couple families in Leslie County show that 16.4% or 291 of the total 1,772 families live below the poverty line. Families with 5 or more children have the highest poverty rate of 54.9%, comprising of 28 families. On the other hand, families with no children have the lowest poverty rate of 8.1%, which includes 91 families.
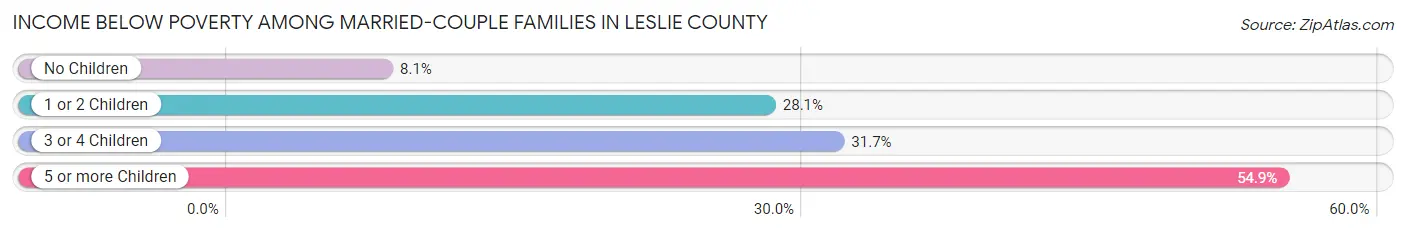
| Children | Above Poverty | Below Poverty |
| No Children | 1,033 (91.9%) | 91 (8.1%) |
| 1 or 2 Children | 343 (71.9%) | 134 (28.1%) |
| 3 or 4 Children | 82 (68.3%) | 38 (31.7%) |
| 5 or more Children | 23 (45.1%) | 28 (54.9%) |
| Total | 1,481 (83.6%) | 291 (16.4%) |
Income Below Poverty Among Single-Parent Households in Leslie County
According to the poverty data in Leslie County, 63.2% or 72 single-father households and 38.6% or 169 single-mother households are living below the poverty line. Among single-father households, those with 3 or 4 children have the highest poverty rate, with 32 households (100.0%) experiencing poverty. Likewise, among single-mother households, those with 3 or 4 children have the highest poverty rate, with 55 households (100.0%) falling below the poverty line.
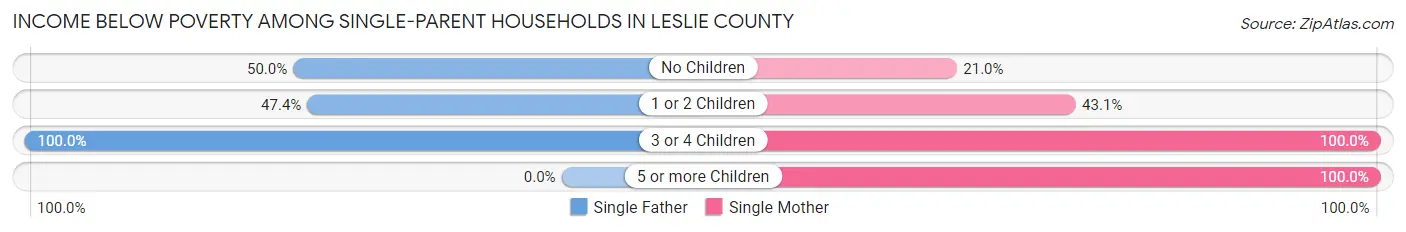
| Children | Single Father | Single Mother |
| No Children | 22 (50.0%) | 55 (21.0%) |
| 1 or 2 Children | 18 (47.4%) | 47 (43.1%) |
| 3 or 4 Children | 32 (100.0%) | 55 (100.0%) |
| 5 or more Children | 0 (0.0%) | 12 (100.0%) |
| Total | 72 (63.2%) | 169 (38.6%) |
Income Below Poverty Among Married-Couple vs Single-Parent Households in Leslie County
The poverty data for Leslie County shows that 291 of the married-couple family households (16.4%) and 241 of the single-parent households (43.7%) are living below the poverty level. Within the married-couple family households, those with 5 or more children have the highest poverty rate, with 28 households (54.9%) falling below the poverty line. Among the single-parent households, those with 3 or 4 children have the highest poverty rate, with 87 household (100.0%) living below poverty.
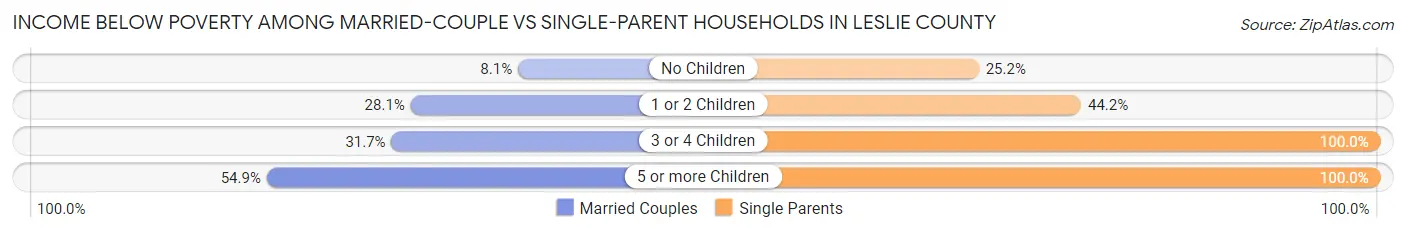
| Children | Married-Couple Families | Single-Parent Households |
| No Children | 91 (8.1%) | 77 (25.2%) |
| 1 or 2 Children | 134 (28.1%) | 65 (44.2%) |
| 3 or 4 Children | 38 (31.7%) | 87 (100.0%) |
| 5 or more Children | 28 (54.9%) | 12 (100.0%) |
| Total | 291 (16.4%) | 241 (43.7%) |
Race in Leslie County
The most populous races in Leslie County are White / Caucasian (10,164 | 97.1%), Two or more Races (234 | 2.2%), and Hispanic or Latino (73 | 0.7%).
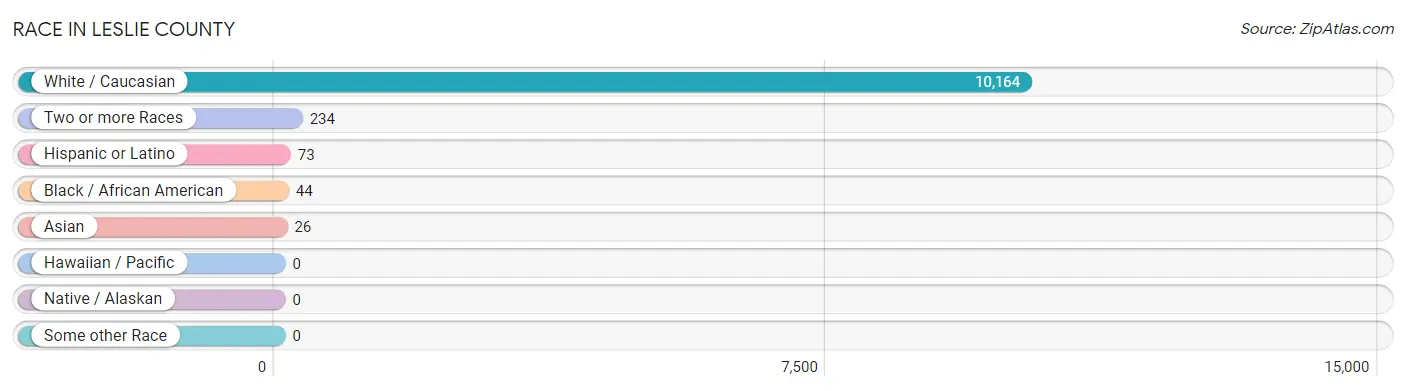
| Race | # Population | % Population |
| Asian | 26 | 0.3% |
| Black / African American | 44 | 0.4% |
| Hawaiian / Pacific | 0 | 0.0% |
| Hispanic or Latino | 73 | 0.7% |
| Native / Alaskan | 0 | 0.0% |
| White / Caucasian | 10,164 | 97.1% |
| Two or more Races | 234 | 2.2% |
| Some other Race | 0 | 0.0% |
| Total | 10,468 | 100.0% |
Ancestry in Leslie County
The most populous ancestries reported in Leslie County are American (1,215 | 11.6%), Irish (1,187 | 11.3%), English (1,007 | 9.6%), German (459 | 4.4%), and Scotch-Irish (227 | 2.2%), together accounting for 39.1% of all Leslie County residents.
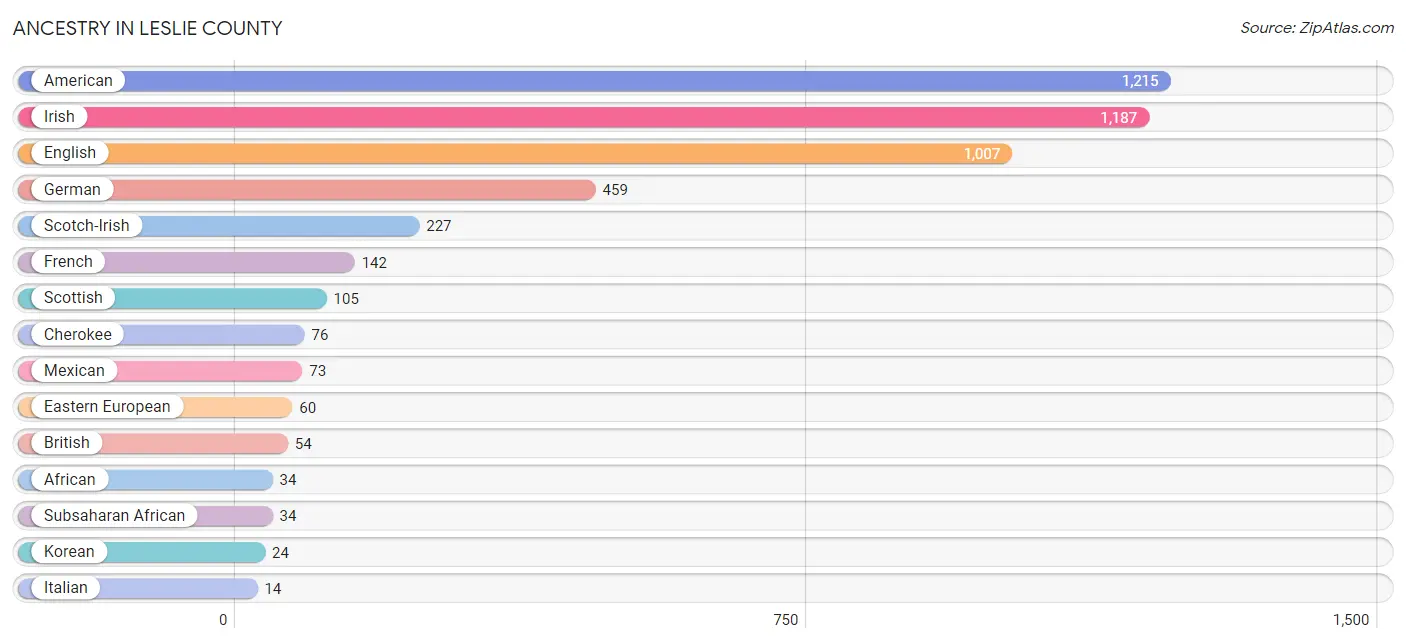
| Ancestry | # Population | % Population |
| African | 34 | 0.3% |
| American | 1,215 | 11.6% |
| British | 54 | 0.5% |
| Cherokee | 76 | 0.7% |
| Eastern European | 60 | 0.6% |
| English | 1,007 | 9.6% |
| European | 11 | 0.1% |
| French | 142 | 1.4% |
| German | 459 | 4.4% |
| Irish | 1,187 | 11.3% |
| Italian | 14 | 0.1% |
| Korean | 24 | 0.2% |
| Mexican | 73 | 0.7% |
| Scandinavian | 11 | 0.1% |
| Scotch-Irish | 227 | 2.2% |
| Scottish | 105 | 1.0% |
| Subsaharan African | 34 | 0.3% |
| Welsh | 13 | 0.1% | View All 18 Rows |
Immigrants in Leslie County
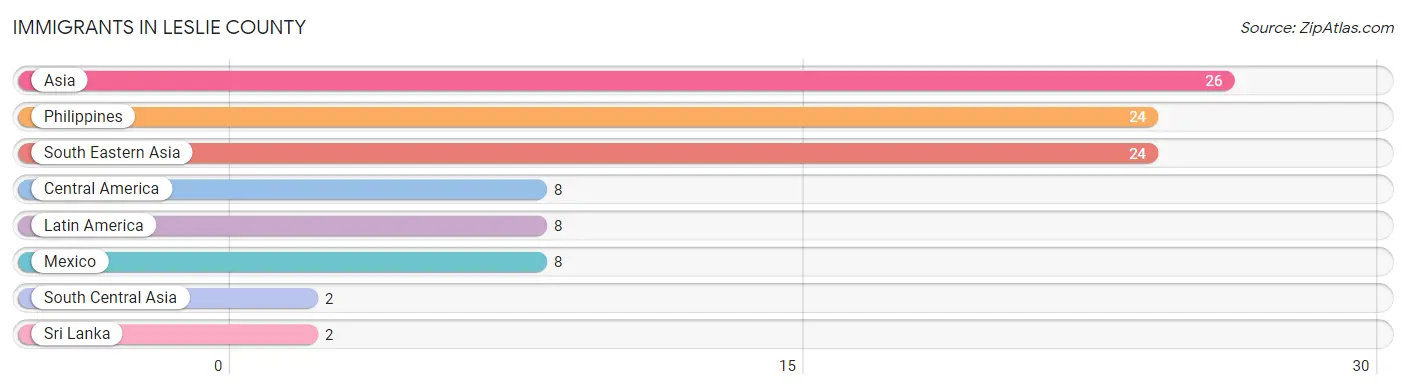
The most numerous immigrant groups reported in Leslie County came from Asia (26 | 0.3%), Philippines (24 | 0.2%), South Eastern Asia (24 | 0.2%), Central America (8 | 0.1%), and Latin America (8 | 0.1%), together accounting for 0.9% of all Leslie County residents.
| Immigration Origin | # Population | % Population |
| Asia | 26 | 0.3% |
| Central America | 8 | 0.1% |
| Latin America | 8 | 0.1% |
| Mexico | 8 | 0.1% |
| Philippines | 24 | 0.2% |
| South Central Asia | 2 | 0.0% |
| South Eastern Asia | 24 | 0.2% |
| Sri Lanka | 2 | 0.0% | View All 8 Rows |
Sex and Age in Leslie County
Sex and Age in Leslie County
The most populous age groups in Leslie County are 40 to 44 Years (455 | 8.7%) for men and 65 to 69 Years (514 | 9.9%) for women.
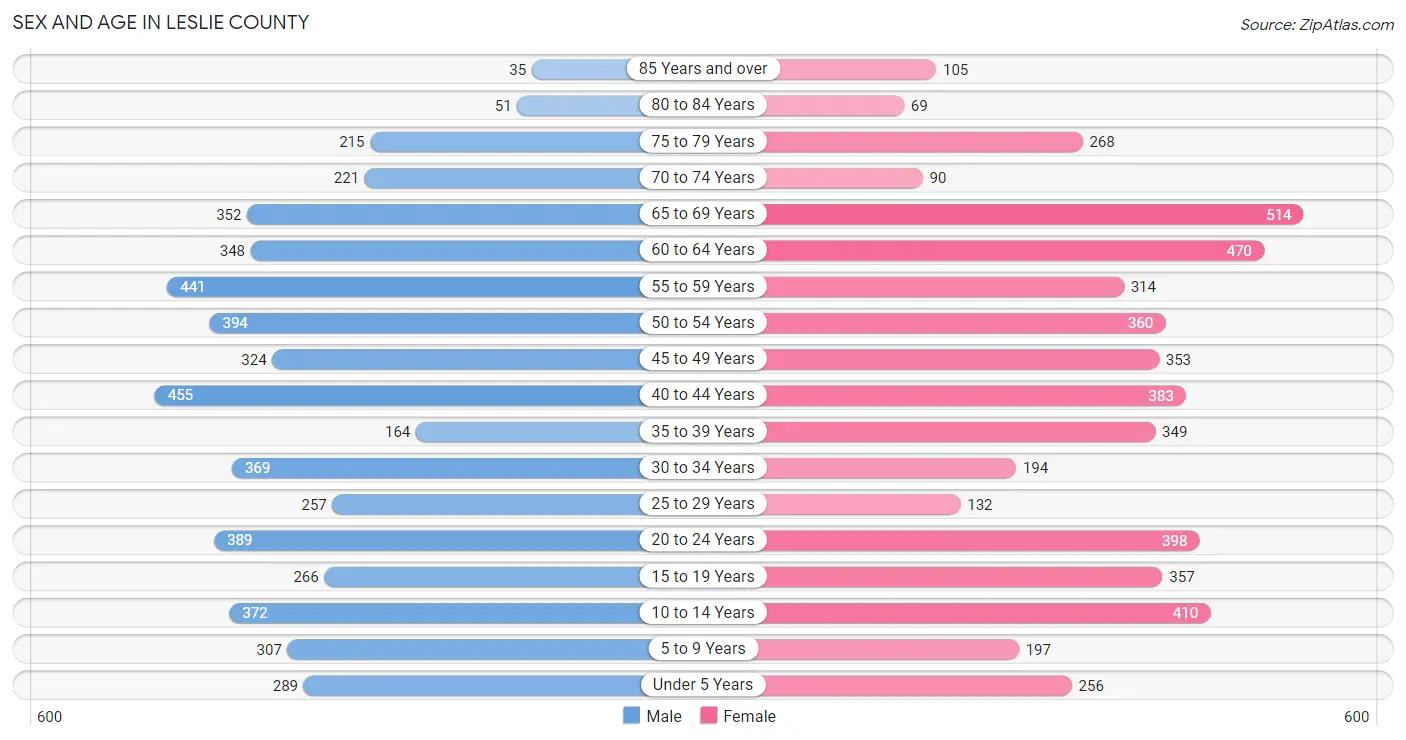
| Age Bracket | Male | Female |
| Under 5 Years | 289 (5.5%) | 256 (4.9%) |
| 5 to 9 Years | 307 (5.9%) | 197 (3.8%) |
| 10 to 14 Years | 372 (7.1%) | 410 (7.9%) |
| 15 to 19 Years | 266 (5.1%) | 357 (6.8%) |
| 20 to 24 Years | 389 (7.4%) | 398 (7.6%) |
| 25 to 29 Years | 257 (4.9%) | 132 (2.5%) |
| 30 to 34 Years | 369 (7.0%) | 194 (3.7%) |
| 35 to 39 Years | 164 (3.1%) | 349 (6.7%) |
| 40 to 44 Years | 455 (8.7%) | 383 (7.3%) |
| 45 to 49 Years | 324 (6.2%) | 353 (6.8%) |
| 50 to 54 Years | 394 (7.5%) | 360 (6.9%) |
| 55 to 59 Years | 441 (8.4%) | 314 (6.0%) |
| 60 to 64 Years | 348 (6.6%) | 470 (9.0%) |
| 65 to 69 Years | 352 (6.7%) | 514 (9.9%) |
| 70 to 74 Years | 221 (4.2%) | 90 (1.7%) |
| 75 to 79 Years | 215 (4.1%) | 268 (5.1%) |
| 80 to 84 Years | 51 (1.0%) | 69 (1.3%) |
| 85 Years and over | 35 (0.7%) | 105 (2.0%) |
| Total | 5,249 (100.0%) | 5,219 (100.0%) |
Families and Households in Leslie County
Median Family Size in Leslie County
The median family size in Leslie County is 3.57 persons per family, with single female/mother families (438 | 18.9%) accounting for the largest median family size of 4.95 persons per family. On the other hand, single male/father families (114 | 4.9%) represent the smallest median family size with 3.24 persons per family.
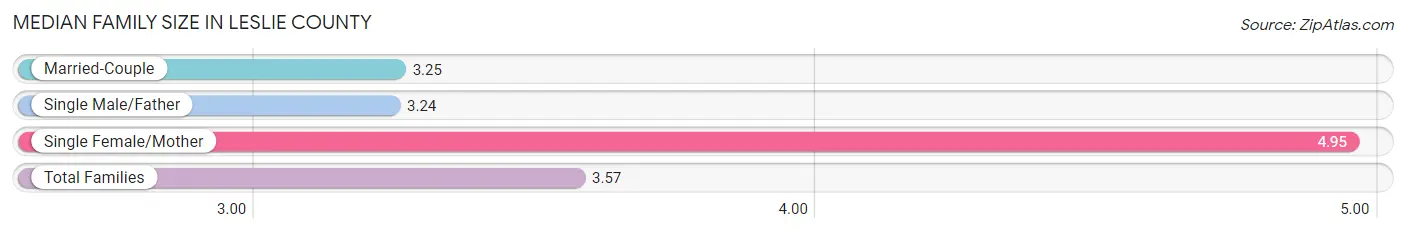
| Family Type | # Families | Family Size |
| Married-Couple | 1,772 (76.2%) | 3.25 |
| Single Male/Father | 114 (4.9%) | 3.24 |
| Single Female/Mother | 438 (18.9%) | 4.95 |
| Total Families | 2,324 (100.0%) | 3.57 |
Median Household Size in Leslie County
The median household size in Leslie County is 2.74 persons per household, with single female/mother households (438 | 11.8%) accounting for the largest median household size of 5.05 persons per household. non-family households (1,374 | 37.2%) represent the smallest median household size with 1.16 persons per household.
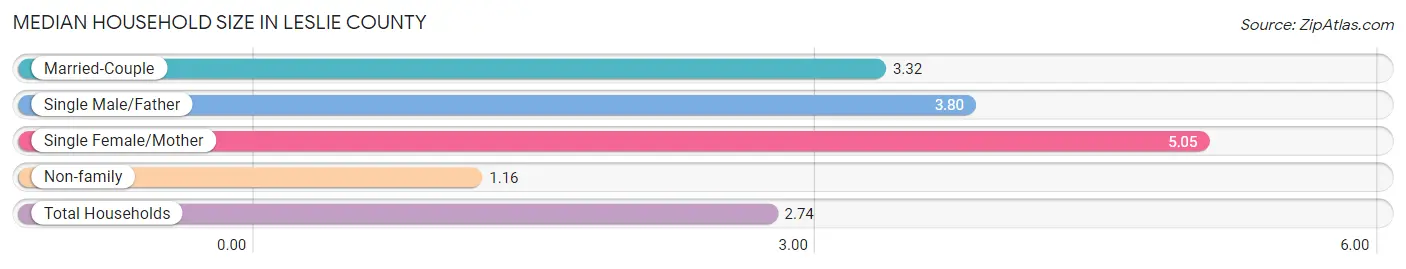
| Household Type | # Households | Household Size |
| Married-Couple | 1,772 (47.9%) | 3.32 |
| Single Male/Father | 114 (3.1%) | 3.80 |
| Single Female/Mother | 438 (11.8%) | 5.05 |
| Non-family | 1,374 (37.2%) | 1.16 |
| Total Households | 3,698 (100.0%) | 2.74 |
Household Size by Marriage Status in Leslie County
Out of a total of 3,698 households in Leslie County, 2,324 (62.8%) are family households, while 1,374 (37.2%) are nonfamily households. The most numerous type of family households are 2-person households, comprising 1,104, and the most common type of nonfamily households are 1-person households, comprising 1,168.
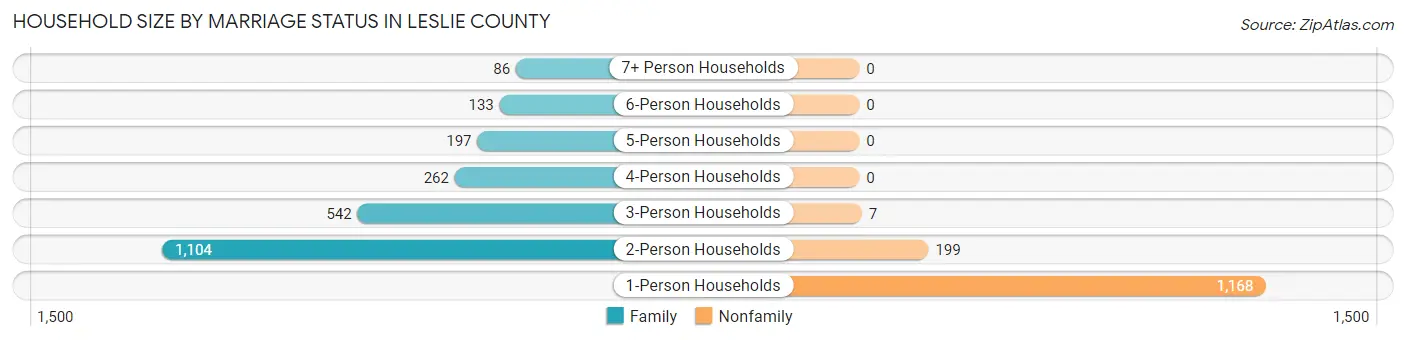
| Household Size | Family Households | Nonfamily Households |
| 1-Person Households | - | 1,168 (31.6%) |
| 2-Person Households | 1,104 (29.8%) | 199 (5.4%) |
| 3-Person Households | 542 (14.7%) | 7 (0.2%) |
| 4-Person Households | 262 (7.1%) | 0 (0.0%) |
| 5-Person Households | 197 (5.3%) | 0 (0.0%) |
| 6-Person Households | 133 (3.6%) | 0 (0.0%) |
| 7+ Person Households | 86 (2.3%) | 0 (0.0%) |
| Total | 2,324 (62.8%) | 1,374 (37.2%) |
Female Fertility in Leslie County
Fertility by Age in Leslie County
Average fertility rate in Leslie County is 74.0 births per 1,000 women. Women in the age bracket of 20 to 34 years have the highest fertility rate with 146.0 births per 1,000 women. Women in the age bracket of 20 to 34 years acount for 65.8% of all women with births.
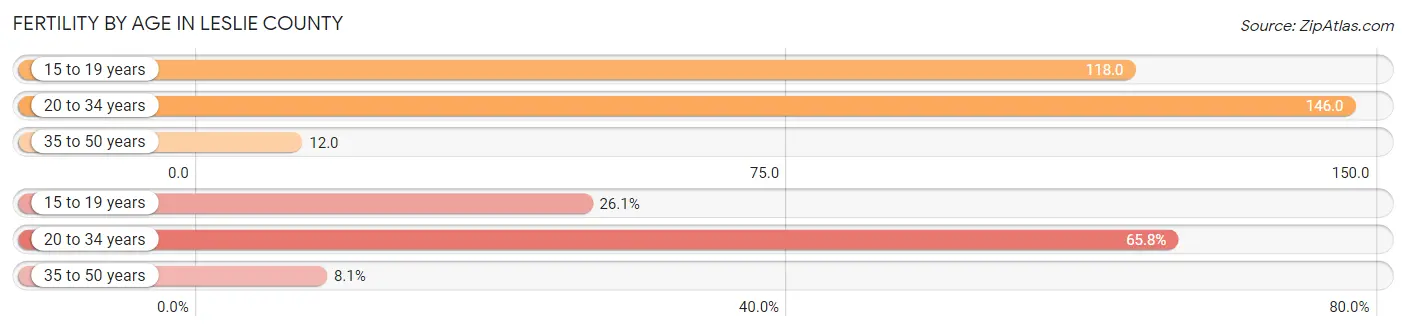
| Age Bracket | Women with Births | Births / 1,000 Women |
| 15 to 19 years | 42 (26.1%) | 118.0 |
| 20 to 34 years | 106 (65.8%) | 146.0 |
| 35 to 50 years | 13 (8.1%) | 12.0 |
| Total | 161 (100.0%) | 74.0 |
Fertility by Age by Marriage Status in Leslie County
38.5% of women with births (161) in Leslie County are married. The highest percentage of unmarried women with births falls into 15 to 19 years age bracket with 100.0% of them unmarried at the time of birth, while the lowest percentage of unmarried women with births belong to 35 to 50 years age bracket with 38.5% of them unmarried.
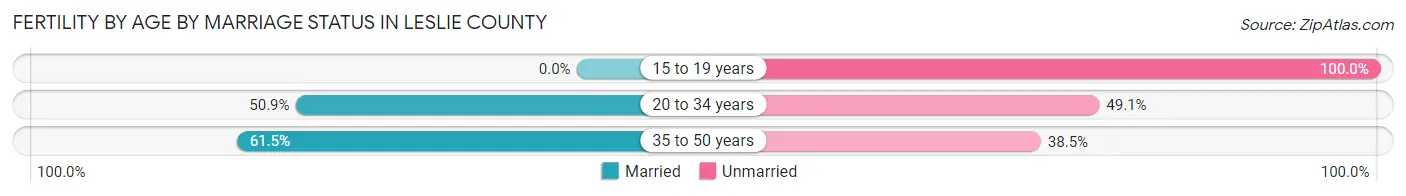
| Age Bracket | Married | Unmarried |
| 15 to 19 years | 0 (0.0%) | 42 (100.0%) |
| 20 to 34 years | 54 (50.9%) | 52 (49.1%) |
| 35 to 50 years | 8 (61.5%) | 5 (38.5%) |
| Total | 62 (38.5%) | 99 (61.5%) |
Fertility by Education in Leslie County
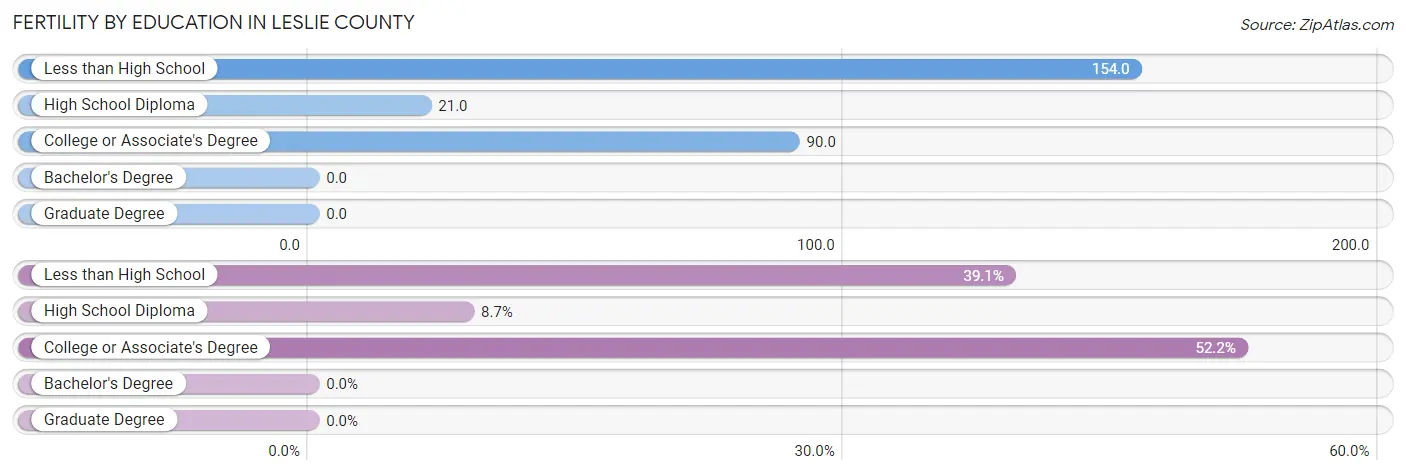
| Educational Attainment | Women with Births | Births / 1,000 Women |
| Less than High School | 63 (39.1%) | 154.0 |
| High School Diploma | 14 (8.7%) | 21.0 |
| College or Associate's Degree | 84 (52.2%) | 90.0 |
| Bachelor's Degree | 0 (0.0%) | 0.0 |
| Graduate Degree | 0 (0.0%) | 0.0 |
| Total | 161 (100.0%) | 74.0 |
Fertility by Education by Marriage Status in Leslie County
61.5% of women with births in Leslie County are unmarried. Women with the educational attainment of college or associate's degree are most likely to be married with 64.3% of them married at childbirth, while women with the educational attainment of less than high school are least likely to be married with 100.0% of them unmarried at childbirth.
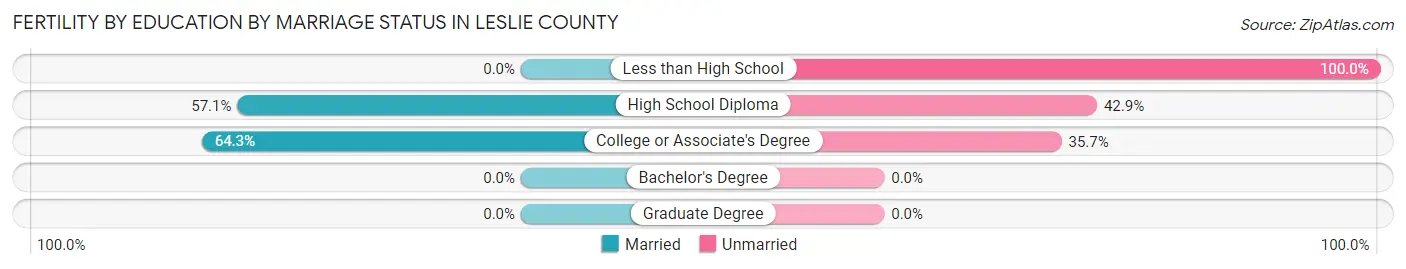
| Educational Attainment | Married | Unmarried |
| Less than High School | 0 (0.0%) | 63 (100.0%) |
| High School Diploma | 8 (57.1%) | 6 (42.9%) |
| College or Associate's Degree | 54 (64.3%) | 30 (35.7%) |
| Bachelor's Degree | 0 (0.0%) | 0 (0.0%) |
| Graduate Degree | 0 (0.0%) | 0 (0.0%) |
| Total | 62 (38.5%) | 99 (61.5%) |
Employment Characteristics in Leslie County
Employment by Class of Employer in Leslie County
Among the 3,236 employed individuals in Leslie County, private company employees (2,194 | 67.8%), local government employees (398 | 12.3%), and state government employees (245 | 7.6%) make up the most common classes of employment.
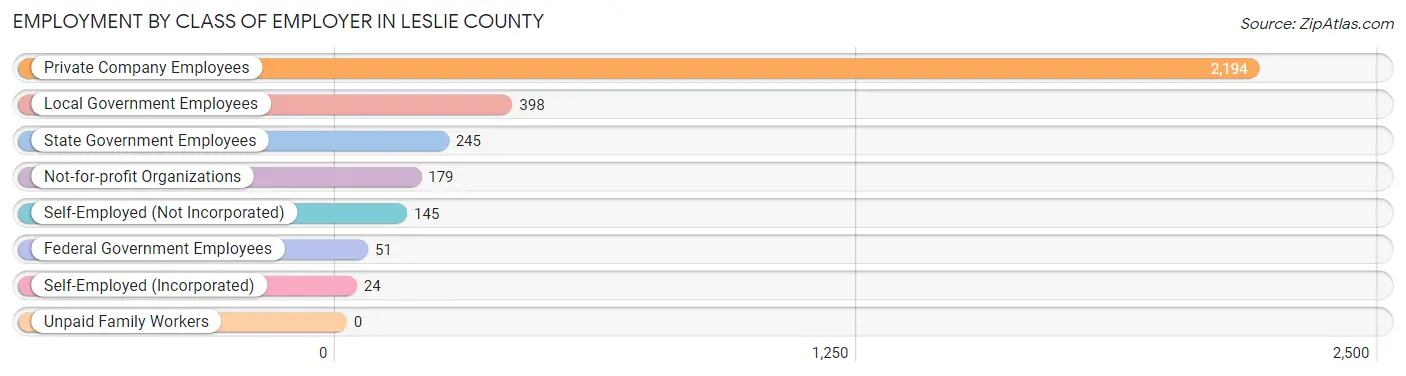
| Employer Class | # Employees | % Employees |
| Private Company Employees | 2,194 | 67.8% |
| Self-Employed (Incorporated) | 24 | 0.7% |
| Self-Employed (Not Incorporated) | 145 | 4.5% |
| Not-for-profit Organizations | 179 | 5.5% |
| Local Government Employees | 398 | 12.3% |
| State Government Employees | 245 | 7.6% |
| Federal Government Employees | 51 | 1.6% |
| Unpaid Family Workers | 0 | 0.0% |
| Total | 3,236 | 100.0% |
Employment Status by Age in Leslie County
According to the labor force statistics for Leslie County, out of the total population over 16 years of age (8,483), 43.8% or 3,716 individuals are in the labor force, with 10.0% or 372 of them unemployed. The age group with the highest labor force participation rate is 30 to 34 years, with 79.8% or 449 individuals in the labor force. Within the labor force, the 30 to 34 years age range has the highest percentage of unemployed individuals, with 29.2% or 131 of them being unemployed.
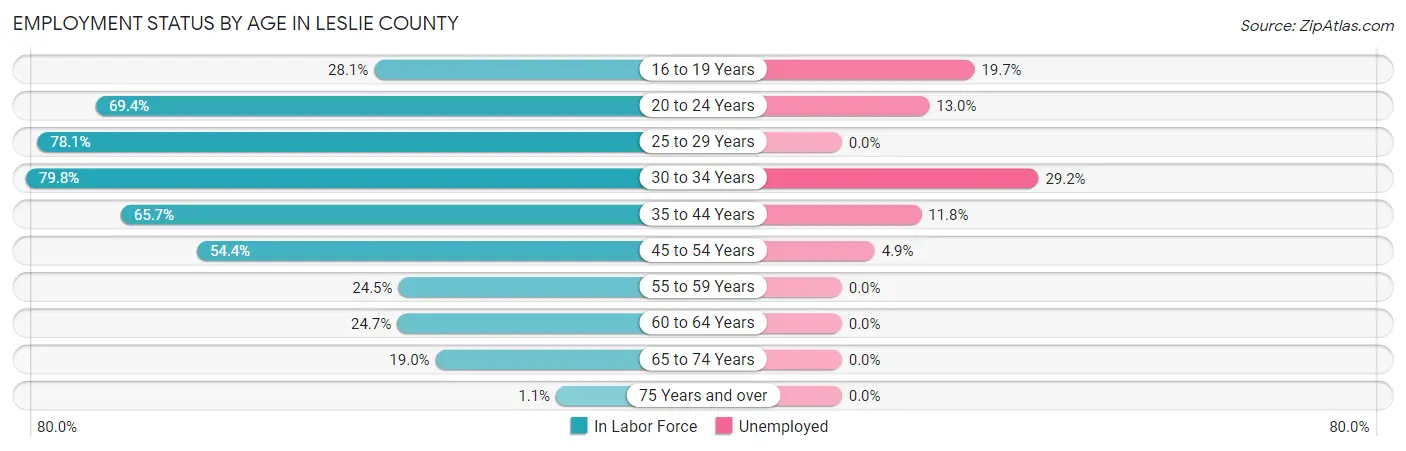
| Age Bracket | In Labor Force | Unemployed |
| 16 to 19 Years | 132 (28.1%) | 26 (19.7%) |
| 20 to 24 Years | 546 (69.4%) | 71 (13.0%) |
| 25 to 29 Years | 304 (78.1%) | 0 (0.0%) |
| 30 to 34 Years | 449 (79.8%) | 131 (29.2%) |
| 35 to 44 Years | 888 (65.7%) | 105 (11.8%) |
| 45 to 54 Years | 778 (54.4%) | 38 (4.9%) |
| 55 to 59 Years | 185 (24.5%) | 0 (0.0%) |
| 60 to 64 Years | 202 (24.7%) | 0 (0.0%) |
| 65 to 74 Years | 224 (19.0%) | 0 (0.0%) |
| 75 Years and over | 8 (1.1%) | 0 (0.0%) |
| Total | 3,716 (43.8%) | 372 (10.0%) |
Employment Status by Educational Attainment in Leslie County
According to labor force statistics for Leslie County, 52.9% of individuals (2,807) out of the total population between 25 and 64 years of age (5,307) are in the labor force, with 9.8% or 275 of them being unemployed. The group with the highest labor force participation rate are those with the educational attainment of bachelor's degree or higher, with 69.4% or 442 individuals in the labor force. Within the labor force, individuals with less than high school education have the highest percentage of unemployment, with 19.5% or 39 of them being unemployed.
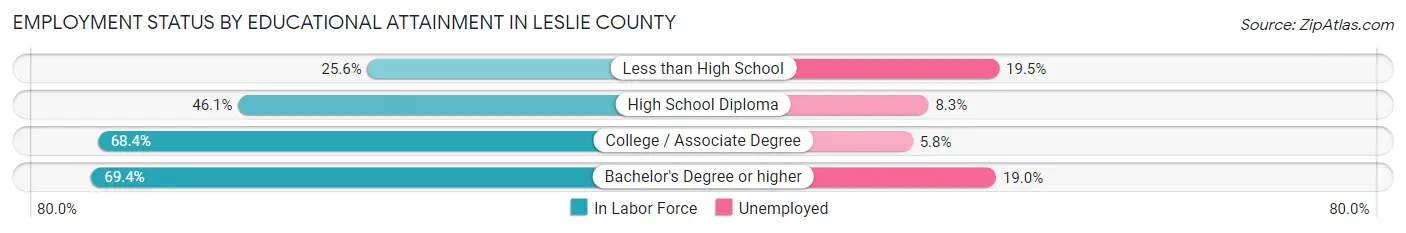
| Educational Attainment | In Labor Force | Unemployed |
| Less than High School | 200 (25.6%) | 152 (19.5%) |
| High School Diploma | 1,029 (46.1%) | 185 (8.3%) |
| College / Associate Degree | 1,133 (68.4%) | 96 (5.8%) |
| Bachelor's Degree or higher | 442 (69.4%) | 121 (19.0%) |
| Total | 2,807 (52.9%) | 520 (9.8%) |
Employment Occupations by Sex in Leslie County
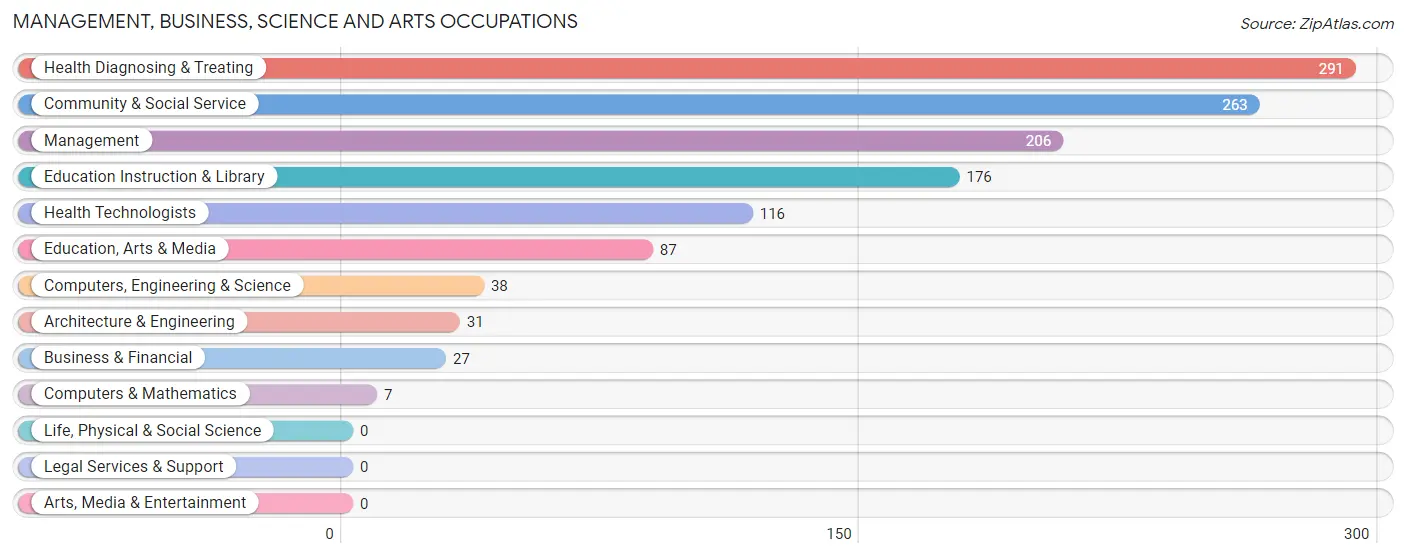
Management, Business, Science and Arts Occupations
The most common Management, Business, Science and Arts occupations in Leslie County are Health Diagnosing & Treating (291 | 8.7%), Community & Social Service (263 | 7.9%), Management (206 | 6.2%), Education Instruction & Library (176 | 5.3%), and Health Technologists (116 | 3.5%).
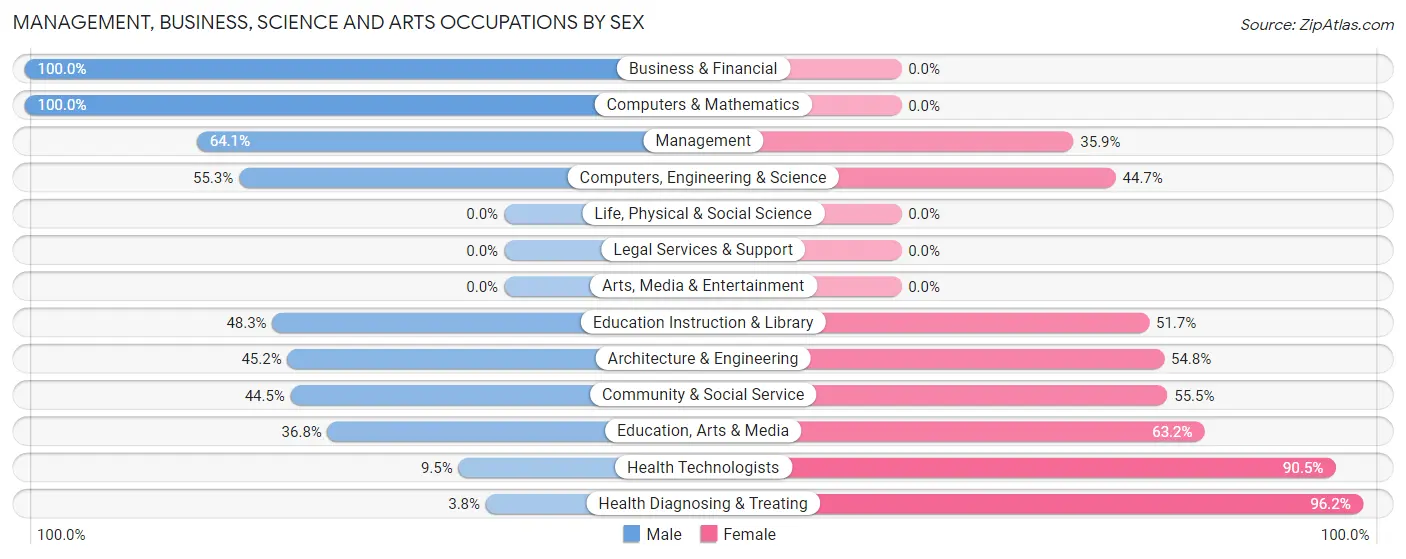
Management, Business, Science and Arts Occupations by Sex
Within the Management, Business, Science and Arts occupations in Leslie County, the most male-oriented occupations are Business & Financial (100.0%), Computers & Mathematics (100.0%), and Management (64.1%), while the most female-oriented occupations are Health Diagnosing & Treating (96.2%), Health Technologists (90.5%), and Education, Arts & Media (63.2%).
| Occupation | Male | Female |
| Management | 132 (64.1%) | 74 (35.9%) |
| Business & Financial | 27 (100.0%) | 0 (0.0%) |
| Computers, Engineering & Science | 21 (55.3%) | 17 (44.7%) |
| Computers & Mathematics | 7 (100.0%) | 0 (0.0%) |
| Architecture & Engineering | 14 (45.2%) | 17 (54.8%) |
| Life, Physical & Social Science | 0 (0.0%) | 0 (0.0%) |
| Community & Social Service | 117 (44.5%) | 146 (55.5%) |
| Education, Arts & Media | 32 (36.8%) | 55 (63.2%) |
| Legal Services & Support | 0 (0.0%) | 0 (0.0%) |
| Education Instruction & Library | 85 (48.3%) | 91 (51.7%) |
| Arts, Media & Entertainment | 0 (0.0%) | 0 (0.0%) |
| Health Diagnosing & Treating | 11 (3.8%) | 280 (96.2%) |
| Health Technologists | 11 (9.5%) | 105 (90.5%) |
| Total (Category) | 308 (37.3%) | 517 (62.7%) |
| Total (Overall) | 1,679 (50.2%) | 1,665 (49.8%) |
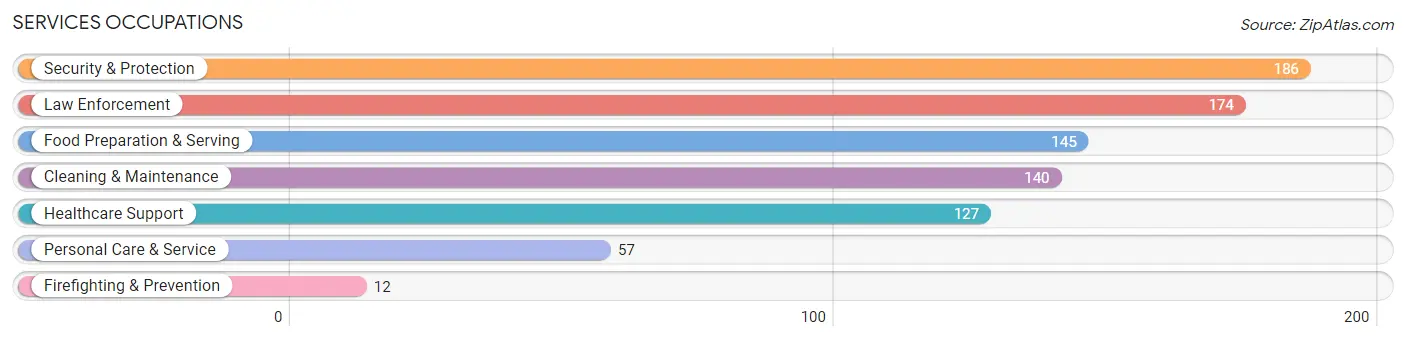
Services Occupations
The most common Services occupations in Leslie County are Security & Protection (186 | 5.6%), Law Enforcement (174 | 5.2%), Food Preparation & Serving (145 | 4.3%), Cleaning & Maintenance (140 | 4.2%), and Healthcare Support (127 | 3.8%).
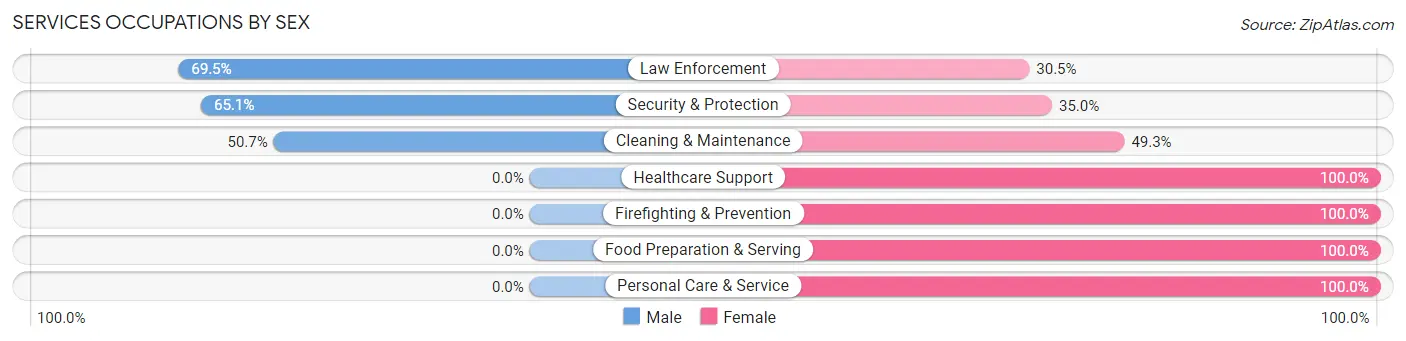
Services Occupations by Sex
Within the Services occupations in Leslie County, the most male-oriented occupations are Law Enforcement (69.5%), Security & Protection (65.0%), and Cleaning & Maintenance (50.7%), while the most female-oriented occupations are Healthcare Support (100.0%), Firefighting & Prevention (100.0%), and Food Preparation & Serving (100.0%).
| Occupation | Male | Female |
| Healthcare Support | 0 (0.0%) | 127 (100.0%) |
| Security & Protection | 121 (65.0%) | 65 (34.9%) |
| Firefighting & Prevention | 0 (0.0%) | 12 (100.0%) |
| Law Enforcement | 121 (69.5%) | 53 (30.5%) |
| Food Preparation & Serving | 0 (0.0%) | 145 (100.0%) |
| Cleaning & Maintenance | 71 (50.7%) | 69 (49.3%) |
| Personal Care & Service | 0 (0.0%) | 57 (100.0%) |
| Total (Category) | 192 (29.3%) | 463 (70.7%) |
| Total (Overall) | 1,679 (50.2%) | 1,665 (49.8%) |
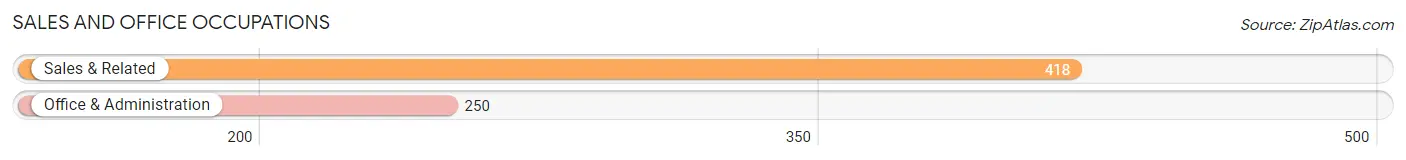
Sales and Office Occupations
The most common Sales and Office occupations in Leslie County are Sales & Related (418 | 12.5%), and Office & Administration (250 | 7.5%).
Sales and Office Occupations by Sex
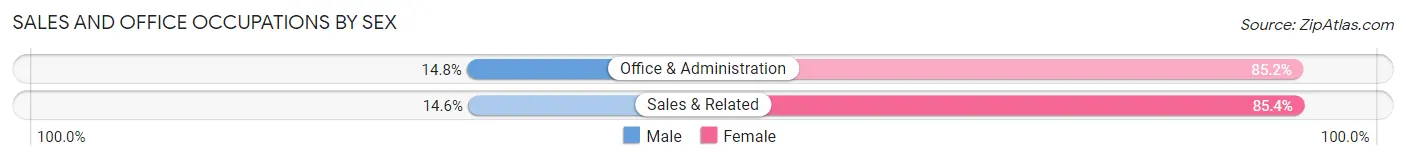
| Occupation | Male | Female |
| Sales & Related | 61 (14.6%) | 357 (85.4%) |
| Office & Administration | 37 (14.8%) | 213 (85.2%) |
| Total (Category) | 98 (14.7%) | 570 (85.3%) |
| Total (Overall) | 1,679 (50.2%) | 1,665 (49.8%) |
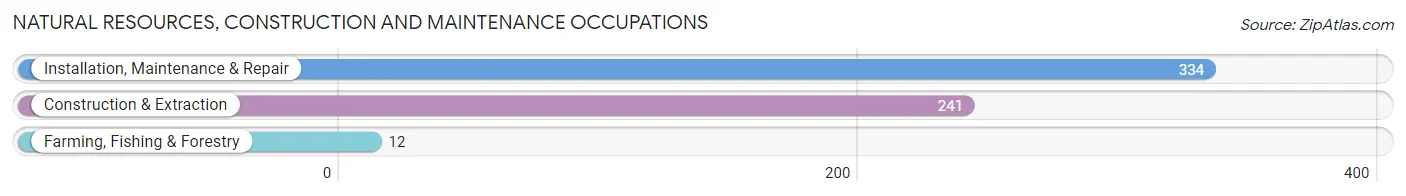
Natural Resources, Construction and Maintenance Occupations
The most common Natural Resources, Construction and Maintenance occupations in Leslie County are Installation, Maintenance & Repair (334 | 10.0%), Construction & Extraction (241 | 7.2%), and Farming, Fishing & Forestry (12 | 0.4%).
Natural Resources, Construction and Maintenance Occupations by Sex
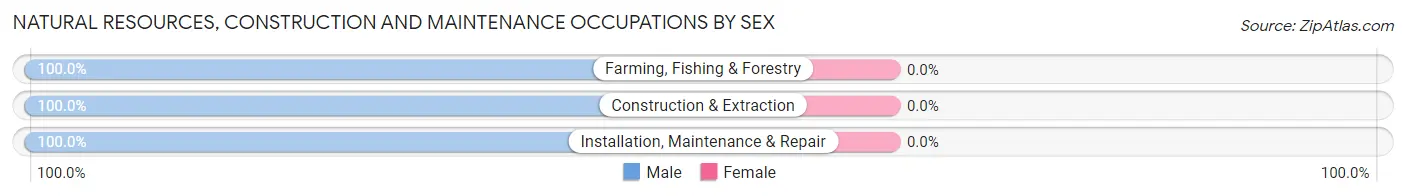
| Occupation | Male | Female |
| Farming, Fishing & Forestry | 12 (100.0%) | 0 (0.0%) |
| Construction & Extraction | 241 (100.0%) | 0 (0.0%) |
| Installation, Maintenance & Repair | 334 (100.0%) | 0 (0.0%) |
| Total (Category) | 587 (100.0%) | 0 (0.0%) |
| Total (Overall) | 1,679 (50.2%) | 1,665 (49.8%) |
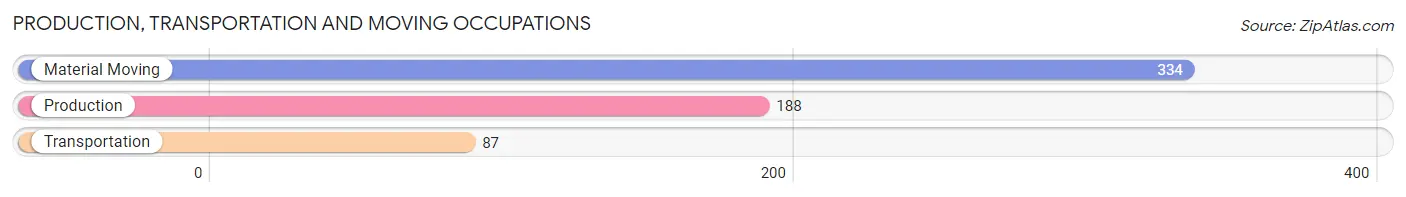
Production, Transportation and Moving Occupations
The most common Production, Transportation and Moving occupations in Leslie County are Material Moving (334 | 10.0%), Production (188 | 5.6%), and Transportation (87 | 2.6%).
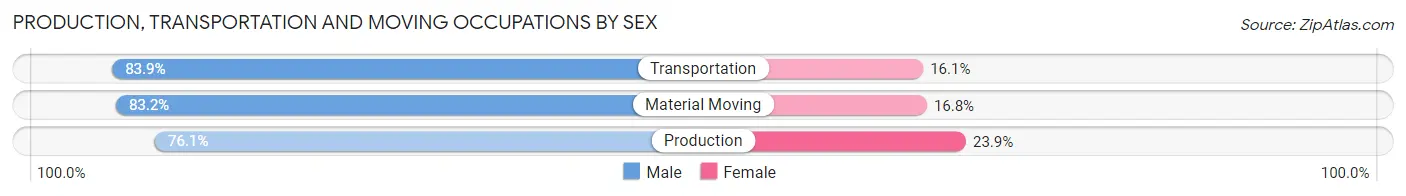
Production, Transportation and Moving Occupations by Sex
| Occupation | Male | Female |
| Production | 143 (76.1%) | 45 (23.9%) |
| Transportation | 73 (83.9%) | 14 (16.1%) |
| Material Moving | 278 (83.2%) | 56 (16.8%) |
| Total (Category) | 494 (81.1%) | 115 (18.9%) |
| Total (Overall) | 1,679 (50.2%) | 1,665 (49.8%) |
Employment Industries by Sex in Leslie County
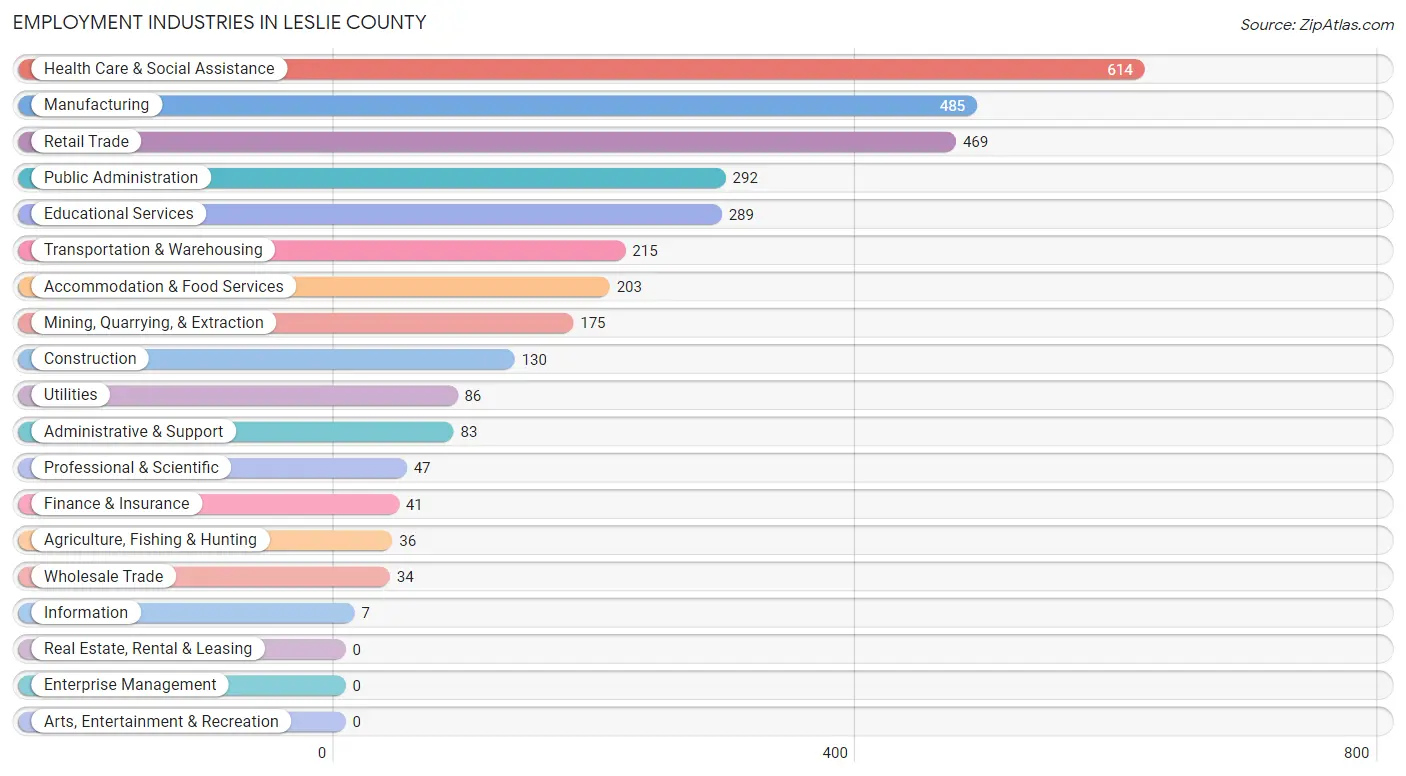
Employment Industries in Leslie County
The major employment industries in Leslie County include Health Care & Social Assistance (614 | 18.4%), Manufacturing (485 | 14.5%), Retail Trade (469 | 14.0%), Public Administration (292 | 8.7%), and Educational Services (289 | 8.6%).
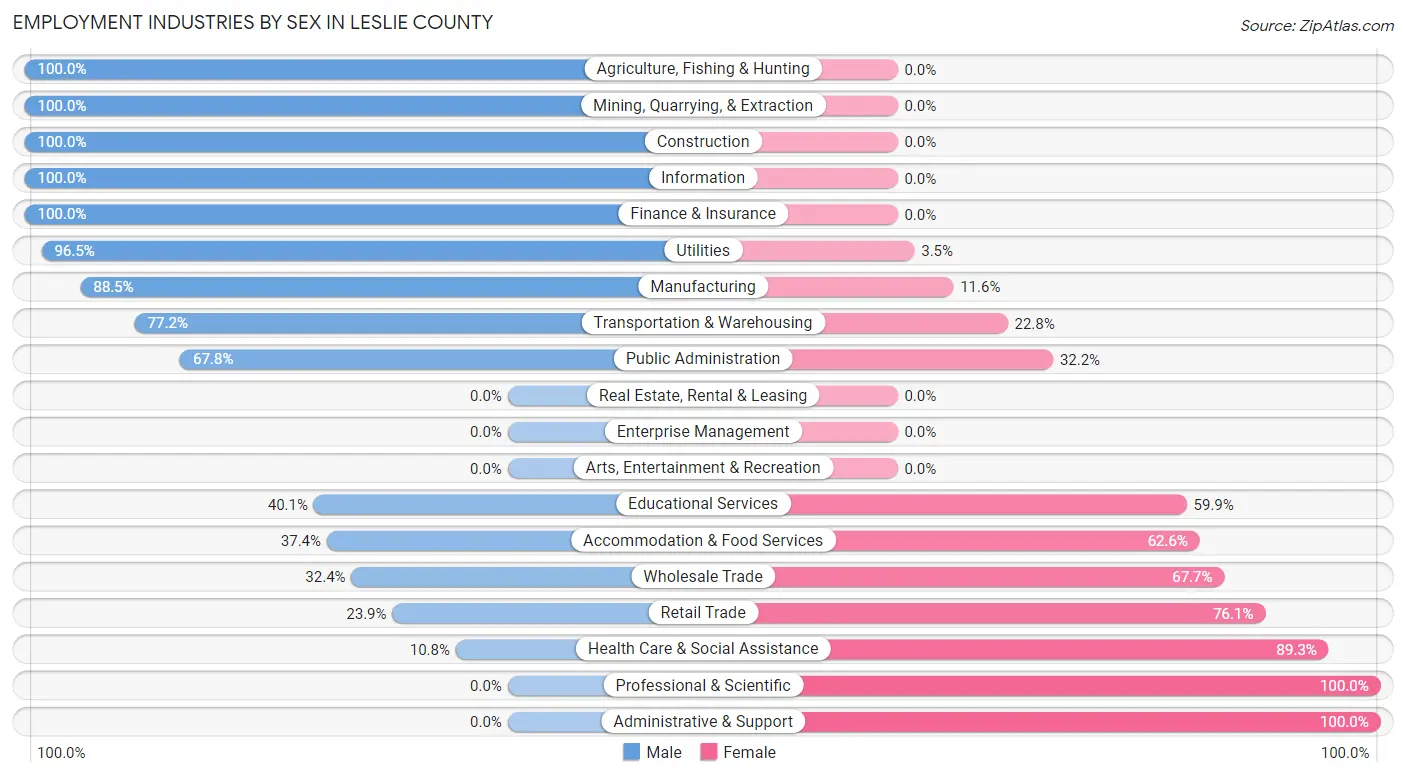
Employment Industries by Sex in Leslie County
The Leslie County industries that see more men than women are Agriculture, Fishing & Hunting (100.0%), Mining, Quarrying, & Extraction (100.0%), and Construction (100.0%), whereas the industries that tend to have a higher number of women are Professional & Scientific (100.0%), Administrative & Support (100.0%), and Health Care & Social Assistance (89.2%).
| Industry | Male | Female |
| Agriculture, Fishing & Hunting | 36 (100.0%) | 0 (0.0%) |
| Mining, Quarrying, & Extraction | 175 (100.0%) | 0 (0.0%) |
| Construction | 130 (100.0%) | 0 (0.0%) |
| Manufacturing | 429 (88.4%) | 56 (11.6%) |
| Wholesale Trade | 11 (32.4%) | 23 (67.6%) |
| Retail Trade | 112 (23.9%) | 357 (76.1%) |
| Transportation & Warehousing | 166 (77.2%) | 49 (22.8%) |
| Utilities | 83 (96.5%) | 3 (3.5%) |
| Information | 7 (100.0%) | 0 (0.0%) |
| Finance & Insurance | 41 (100.0%) | 0 (0.0%) |
| Real Estate, Rental & Leasing | 0 (0.0%) | 0 (0.0%) |
| Professional & Scientific | 0 (0.0%) | 47 (100.0%) |
| Enterprise Management | 0 (0.0%) | 0 (0.0%) |
| Administrative & Support | 0 (0.0%) | 83 (100.0%) |
| Educational Services | 116 (40.1%) | 173 (59.9%) |
| Health Care & Social Assistance | 66 (10.7%) | 548 (89.2%) |
| Arts, Entertainment & Recreation | 0 (0.0%) | 0 (0.0%) |
| Accommodation & Food Services | 76 (37.4%) | 127 (62.6%) |
| Public Administration | 198 (67.8%) | 94 (32.2%) |
| Total | 1,679 (50.2%) | 1,665 (49.8%) |
Education in Leslie County
School Enrollment in Leslie County
The most common levels of schooling among the 2,043 students in Leslie County are middle school (495 | 24.2%), high school (421 | 20.6%), and elementary school (389 | 19.0%).
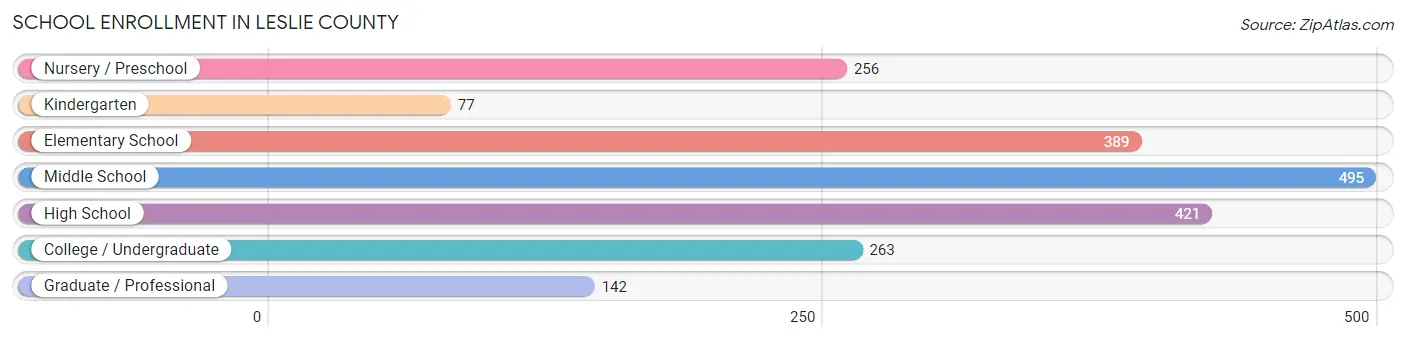
| School Level | # Students | % Students |
| Nursery / Preschool | 256 | 12.5% |
| Kindergarten | 77 | 3.8% |
| Elementary School | 389 | 19.0% |
| Middle School | 495 | 24.2% |
| High School | 421 | 20.6% |
| College / Undergraduate | 263 | 12.9% |
| Graduate / Professional | 142 | 7.0% |
| Total | 2,043 | 100.0% |
School Enrollment by Age by Funding Source in Leslie County
Out of a total of 2,043 students who are enrolled in schools in Leslie County, 170 (8.3%) attend a private institution, while the remaining 1,873 (91.7%) are enrolled in public schools. The age group of 35 years and over has the highest likelihood of being enrolled in private schools, with 21 (50.0% in the age bracket) enrolled. Conversely, the age group of 3 to 4 year olds has the lowest likelihood of being enrolled in a private school, with 163 (100.0% in the age bracket) attending a public institution.
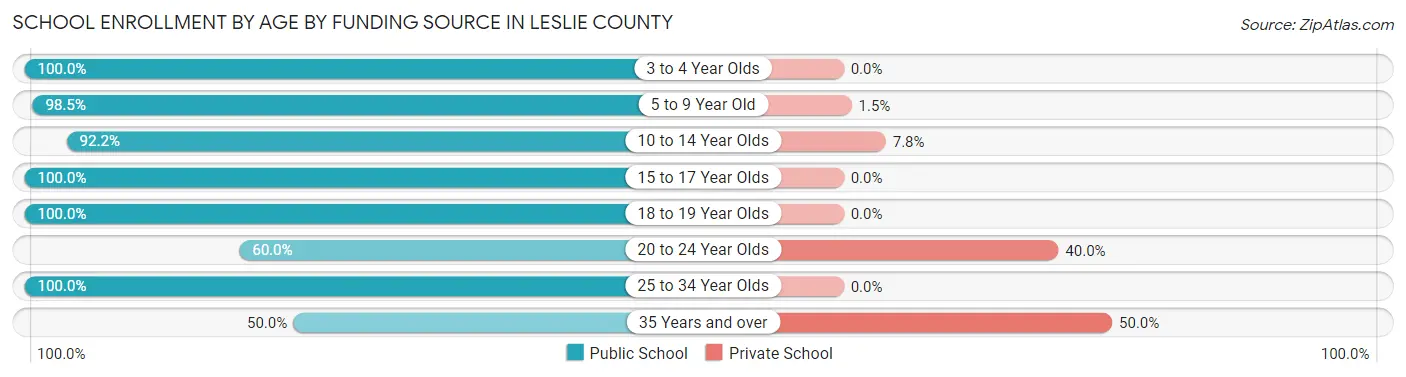
| Age Bracket | Public School | Private School |
| 3 to 4 Year Olds | 163 (100.0%) | 0 (0.0%) |
| 5 to 9 Year Old | 469 (98.5%) | 7 (1.5%) |
| 10 to 14 Year Olds | 564 (92.2%) | 48 (7.8%) |
| 15 to 17 Year Olds | 340 (100.0%) | 0 (0.0%) |
| 18 to 19 Year Olds | 67 (100.0%) | 0 (0.0%) |
| 20 to 24 Year Olds | 141 (60.0%) | 94 (40.0%) |
| 25 to 34 Year Olds | 108 (100.0%) | 0 (0.0%) |
| 35 Years and over | 21 (50.0%) | 21 (50.0%) |
| Total | 1,873 (91.7%) | 170 (8.3%) |
Educational Attainment by Field of Study in Leslie County
Business (268 | 31.9%), education (119 | 14.2%), science & technology (106 | 12.6%), arts & humanities (94 | 11.2%), and computers & mathematics (84 | 10.0%) are the most common fields of study among 840 individuals in Leslie County who have obtained a bachelor's degree or higher.
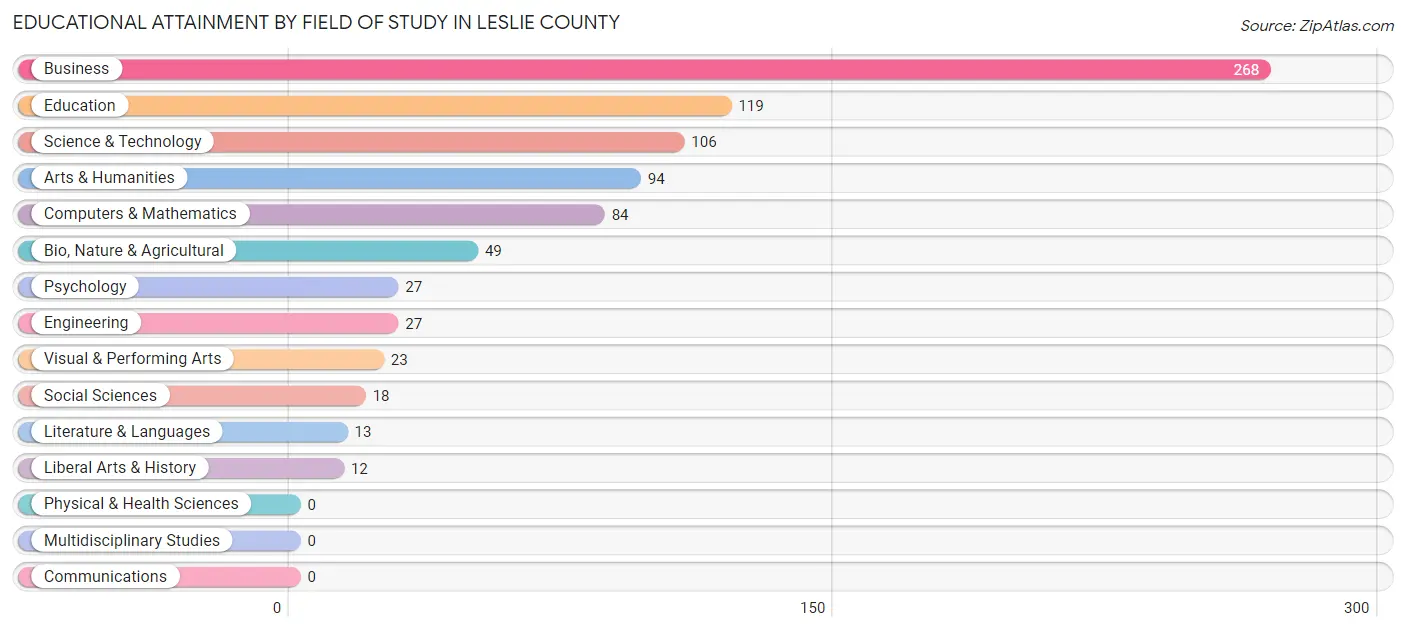
| Field of Study | # Graduates | % Graduates |
| Computers & Mathematics | 84 | 10.0% |
| Bio, Nature & Agricultural | 49 | 5.8% |
| Physical & Health Sciences | 0 | 0.0% |
| Psychology | 27 | 3.2% |
| Social Sciences | 18 | 2.1% |
| Engineering | 27 | 3.2% |
| Multidisciplinary Studies | 0 | 0.0% |
| Science & Technology | 106 | 12.6% |
| Business | 268 | 31.9% |
| Education | 119 | 14.2% |
| Literature & Languages | 13 | 1.5% |
| Liberal Arts & History | 12 | 1.4% |
| Visual & Performing Arts | 23 | 2.7% |
| Communications | 0 | 0.0% |
| Arts & Humanities | 94 | 11.2% |
| Total | 840 | 100.0% |
Transportation & Commute in Leslie County
Vehicle Availability by Sex in Leslie County
The most prevalent vehicle ownership categories in Leslie County are males with 3 vehicles (668, accounting for 40.1%) and females with 3 vehicles (477, making up 42.8%).
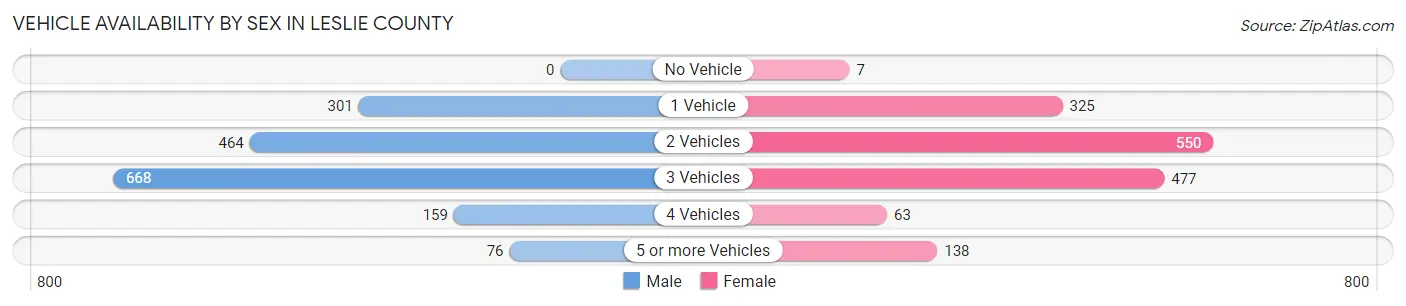
| Vehicles Available | Male | Female |
| No Vehicle | 0 (0.0%) | 7 (0.4%) |
| 1 Vehicle | 301 (18.0%) | 325 (20.8%) |
| 2 Vehicles | 464 (27.8%) | 550 (35.3%) |
| 3 Vehicles | 668 (40.1%) | 477 (30.6%) |
| 4 Vehicles | 159 (9.5%) | 63 (4.0%) |
| 5 or more Vehicles | 76 (4.6%) | 138 (8.8%) |
| Total | 1,668 (100.0%) | 1,560 (100.0%) |
Commute Time in Leslie County
The most frequently occuring commute durations in Leslie County are 30 to 34 minutes (549 commuters, 17.6%), 60 to 89 minutes (537 commuters, 17.2%), and 15 to 19 minutes (438 commuters, 14.1%).
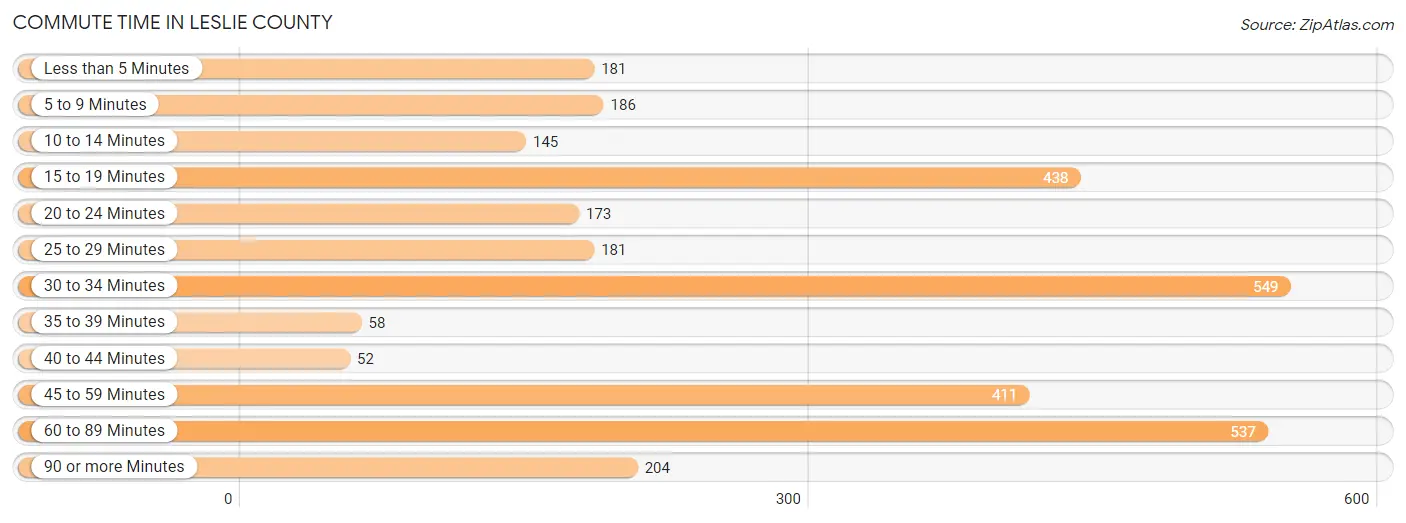
| Commute Time | # Commuters | % Commuters |
| Less than 5 Minutes | 181 | 5.8% |
| 5 to 9 Minutes | 186 | 6.0% |
| 10 to 14 Minutes | 145 | 4.6% |
| 15 to 19 Minutes | 438 | 14.1% |
| 20 to 24 Minutes | 173 | 5.6% |
| 25 to 29 Minutes | 181 | 5.8% |
| 30 to 34 Minutes | 549 | 17.6% |
| 35 to 39 Minutes | 58 | 1.9% |
| 40 to 44 Minutes | 52 | 1.7% |
| 45 to 59 Minutes | 411 | 13.2% |
| 60 to 89 Minutes | 537 | 17.2% |
| 90 or more Minutes | 204 | 6.6% |
Commute Time by Sex in Leslie County
The most common commute times in Leslie County are 60 to 89 minutes (336 commuters, 20.3%) for males and 15 to 19 minutes (247 commuters, 16.9%) for females.
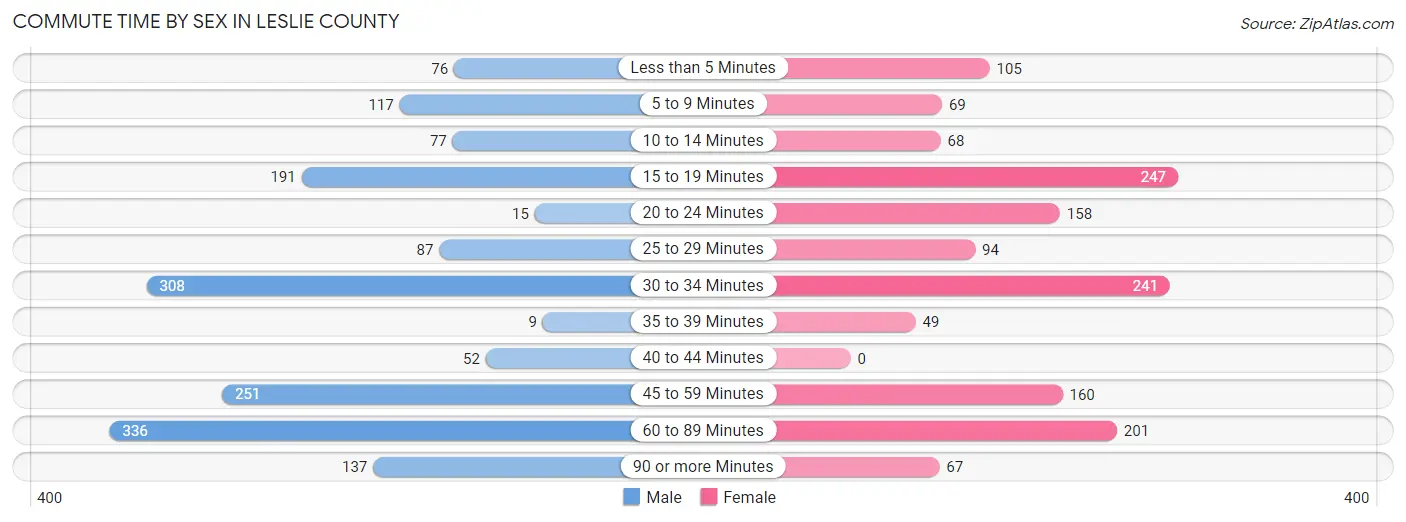
| Commute Time | Male | Female |
| Less than 5 Minutes | 76 (4.6%) | 105 (7.2%) |
| 5 to 9 Minutes | 117 (7.1%) | 69 (4.7%) |
| 10 to 14 Minutes | 77 (4.6%) | 68 (4.7%) |
| 15 to 19 Minutes | 191 (11.5%) | 247 (16.9%) |
| 20 to 24 Minutes | 15 (0.9%) | 158 (10.8%) |
| 25 to 29 Minutes | 87 (5.2%) | 94 (6.4%) |
| 30 to 34 Minutes | 308 (18.6%) | 241 (16.5%) |
| 35 to 39 Minutes | 9 (0.5%) | 49 (3.4%) |
| 40 to 44 Minutes | 52 (3.1%) | 0 (0.0%) |
| 45 to 59 Minutes | 251 (15.2%) | 160 (11.0%) |
| 60 to 89 Minutes | 336 (20.3%) | 201 (13.8%) |
| 90 or more Minutes | 137 (8.3%) | 67 (4.6%) |
Time of Departure to Work by Sex in Leslie County
The most frequent times of departure to work in Leslie County are 12:00 AM to 4:59 AM (273, 16.5%) for males and 7:30 AM to 7:59 AM (275, 18.9%) for females.
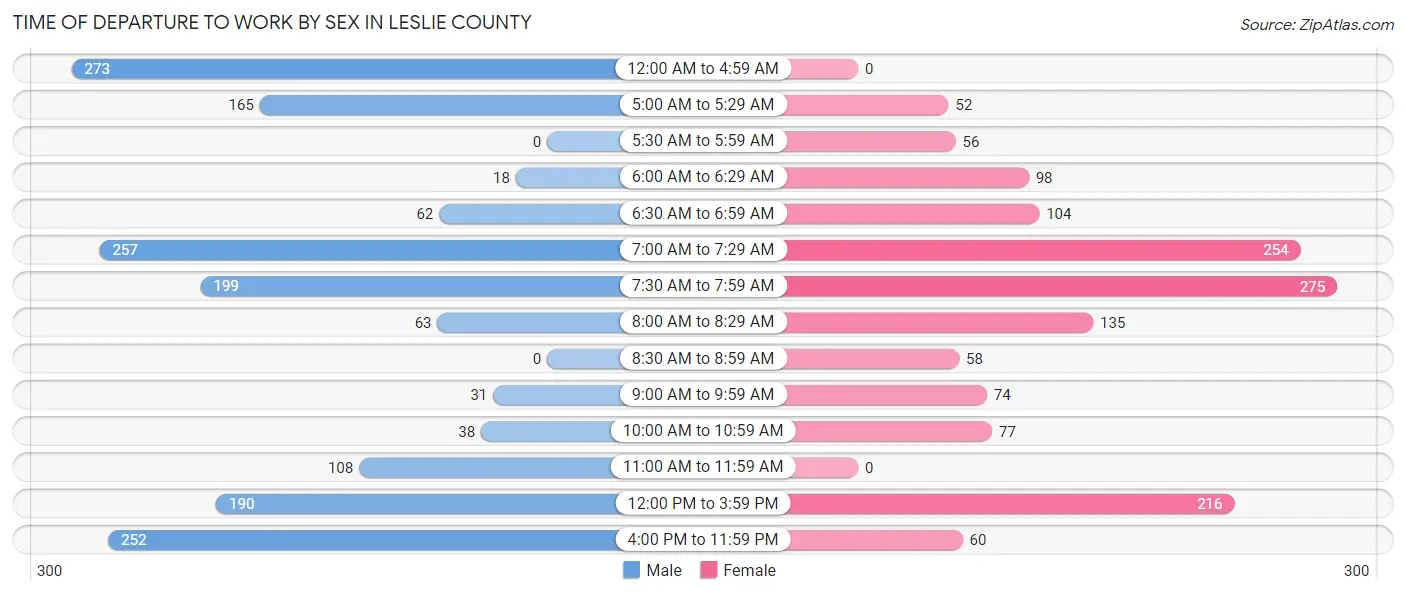
| Time of Departure | Male | Female |
| 12:00 AM to 4:59 AM | 273 (16.5%) | 0 (0.0%) |
| 5:00 AM to 5:29 AM | 165 (10.0%) | 52 (3.6%) |
| 5:30 AM to 5:59 AM | 0 (0.0%) | 56 (3.8%) |
| 6:00 AM to 6:29 AM | 18 (1.1%) | 98 (6.7%) |
| 6:30 AM to 6:59 AM | 62 (3.7%) | 104 (7.1%) |
| 7:00 AM to 7:29 AM | 257 (15.5%) | 254 (17.4%) |
| 7:30 AM to 7:59 AM | 199 (12.0%) | 275 (18.9%) |
| 8:00 AM to 8:29 AM | 63 (3.8%) | 135 (9.2%) |
| 8:30 AM to 8:59 AM | 0 (0.0%) | 58 (4.0%) |
| 9:00 AM to 9:59 AM | 31 (1.9%) | 74 (5.1%) |
| 10:00 AM to 10:59 AM | 38 (2.3%) | 77 (5.3%) |
| 11:00 AM to 11:59 AM | 108 (6.5%) | 0 (0.0%) |
| 12:00 PM to 3:59 PM | 190 (11.5%) | 216 (14.8%) |
| 4:00 PM to 11:59 PM | 252 (15.2%) | 60 (4.1%) |
| Total | 1,656 (100.0%) | 1,459 (100.0%) |
Housing Occupancy in Leslie County
Occupancy by Ownership in Leslie County
Of the total 3,698 dwellings in Leslie County, owner-occupied units account for 3,209 (86.8%), while renter-occupied units make up 489 (13.2%).
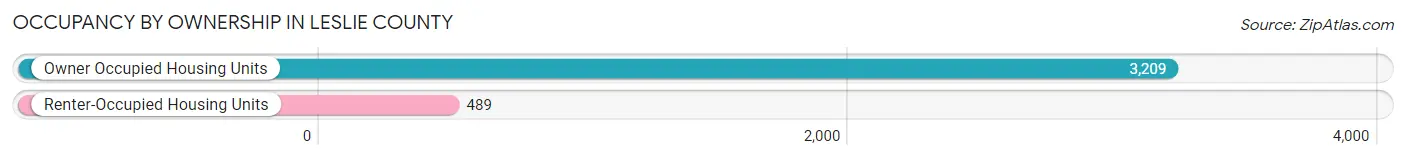
| Occupancy | # Housing Units | % Housing Units |
| Owner Occupied Housing Units | 3,209 | 86.8% |
| Renter-Occupied Housing Units | 489 | 13.2% |
| Total Occupied Housing Units | 3,698 | 100.0% |
Occupancy by Household Size in Leslie County
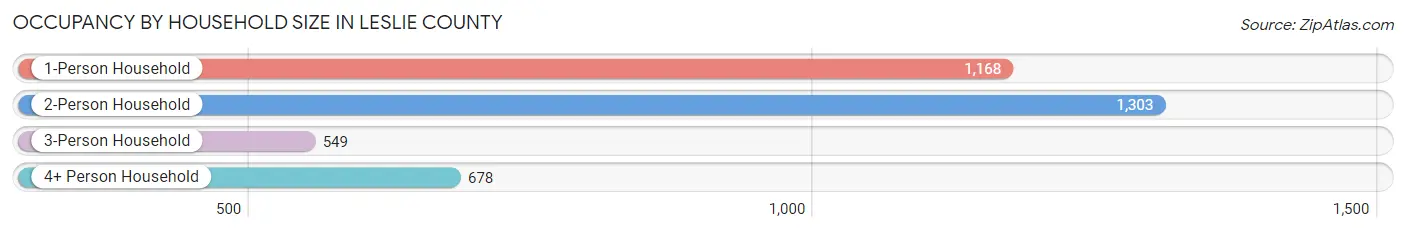
| Household Size | # Housing Units | % Housing Units |
| 1-Person Household | 1,168 | 31.6% |
| 2-Person Household | 1,303 | 35.2% |
| 3-Person Household | 549 | 14.8% |
| 4+ Person Household | 678 | 18.3% |
| Total Housing Units | 3,698 | 100.0% |
Occupancy by Ownership by Household Size in Leslie County
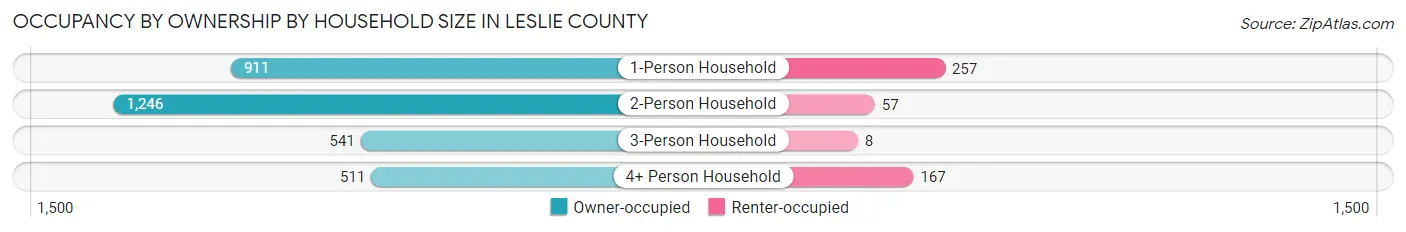
| Household Size | Owner-occupied | Renter-occupied |
| 1-Person Household | 911 (78.0%) | 257 (22.0%) |
| 2-Person Household | 1,246 (95.6%) | 57 (4.4%) |
| 3-Person Household | 541 (98.5%) | 8 (1.5%) |
| 4+ Person Household | 511 (75.4%) | 167 (24.6%) |
| Total Housing Units | 3,209 (86.8%) | 489 (13.2%) |
Occupancy by Educational Attainment in Leslie County
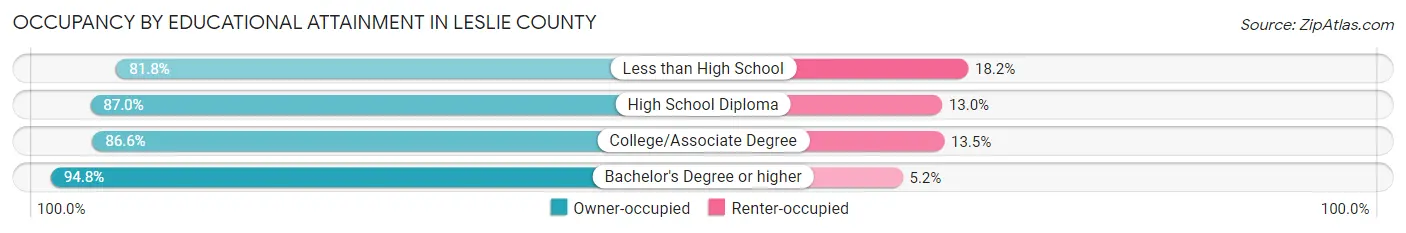
| Household Size | Owner-occupied | Renter-occupied |
| Less than High School | 629 (81.8%) | 140 (18.2%) |
| High School Diploma | 1,180 (87.0%) | 177 (13.0%) |
| College/Associate Degree | 946 (86.6%) | 147 (13.5%) |
| Bachelor's Degree or higher | 454 (94.8%) | 25 (5.2%) |
Occupancy by Age of Householder in Leslie County
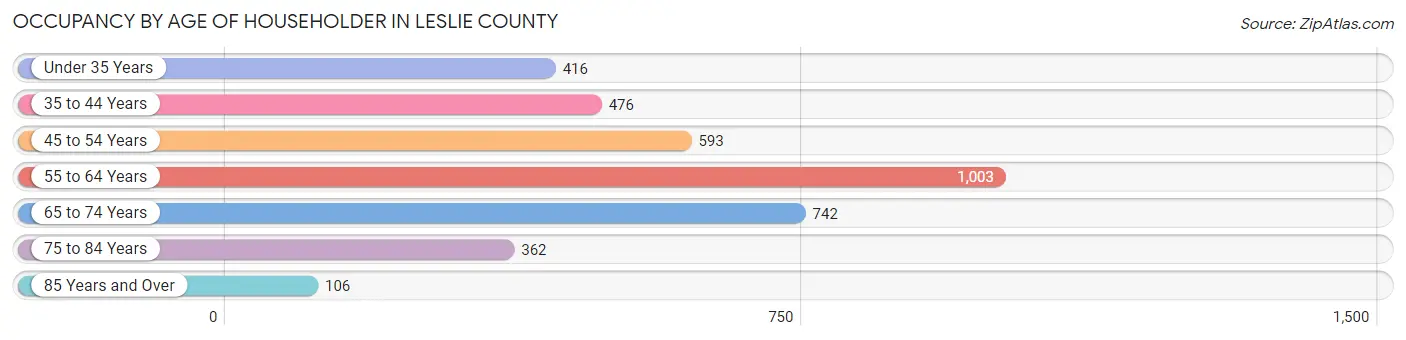
| Age Bracket | # Households | % Households |
| Under 35 Years | 416 | 11.3% |
| 35 to 44 Years | 476 | 12.9% |
| 45 to 54 Years | 593 | 16.0% |
| 55 to 64 Years | 1,003 | 27.1% |
| 65 to 74 Years | 742 | 20.1% |
| 75 to 84 Years | 362 | 9.8% |
| 85 Years and Over | 106 | 2.9% |
| Total | 3,698 | 100.0% |
Housing Finances in Leslie County
Median Income by Occupancy in Leslie County
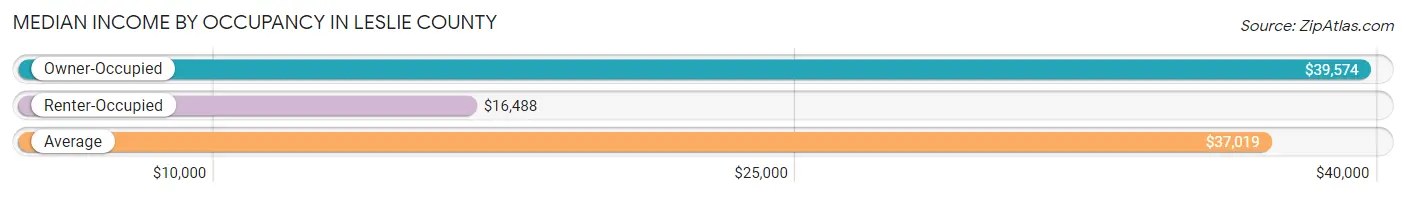
| Occupancy Type | # Households | Median Income |
| Owner-Occupied | 3,209 (86.8%) | $39,574 |
| Renter-Occupied | 489 (13.2%) | $16,488 |
| Average | 3,698 (100.0%) | $37,019 |
Occupancy by Householder Income Bracket in Leslie County
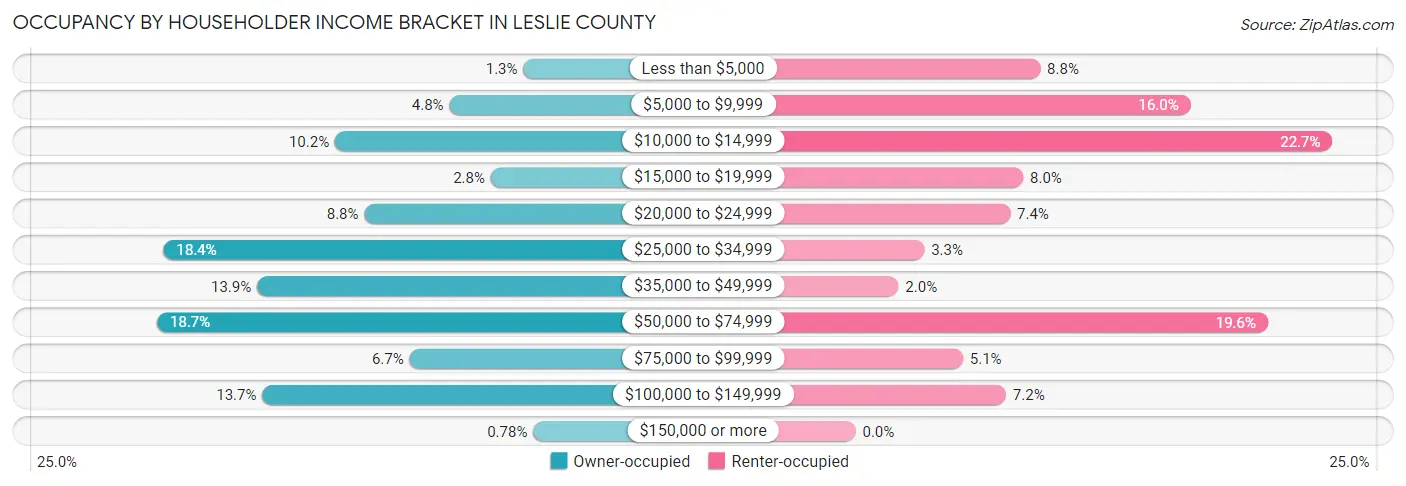
| Income Bracket | Owner-occupied | Renter-occupied |
| Less than $5,000 | 40 (1.3%) | 43 (8.8%) |
| $5,000 to $9,999 | 153 (4.8%) | 78 (16.0%) |
| $10,000 to $14,999 | 328 (10.2%) | 111 (22.7%) |
| $15,000 to $19,999 | 90 (2.8%) | 39 (8.0%) |
| $20,000 to $24,999 | 283 (8.8%) | 36 (7.4%) |
| $25,000 to $34,999 | 590 (18.4%) | 16 (3.3%) |
| $35,000 to $49,999 | 447 (13.9%) | 10 (2.0%) |
| $50,000 to $74,999 | 600 (18.7%) | 96 (19.6%) |
| $75,000 to $99,999 | 214 (6.7%) | 25 (5.1%) |
| $100,000 to $149,999 | 439 (13.7%) | 35 (7.2%) |
| $150,000 or more | 25 (0.8%) | 0 (0.0%) |
| Total | 3,209 (100.0%) | 489 (100.0%) |
Monthly Housing Cost Tiers in Leslie County
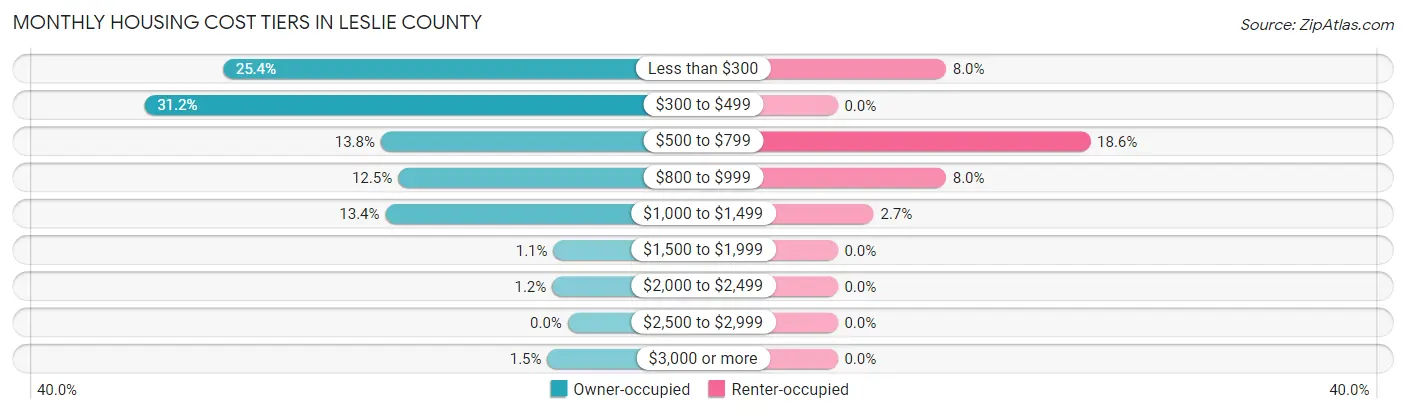
| Monthly Cost | Owner-occupied | Renter-occupied |
| Less than $300 | 815 (25.4%) | 39 (8.0%) |
| $300 to $499 | 1,001 (31.2%) | 0 (0.0%) |
| $500 to $799 | 442 (13.8%) | 91 (18.6%) |
| $800 to $999 | 401 (12.5%) | 39 (8.0%) |
| $1,000 to $1,499 | 431 (13.4%) | 13 (2.7%) |
| $1,500 to $1,999 | 34 (1.1%) | 0 (0.0%) |
| $2,000 to $2,499 | 37 (1.1%) | 0 (0.0%) |
| $2,500 to $2,999 | 0 (0.0%) | 0 (0.0%) |
| $3,000 or more | 48 (1.5%) | 0 (0.0%) |
| Total | 3,209 (100.0%) | 489 (100.0%) |
Physical Housing Characteristics in Leslie County
Housing Structures in Leslie County
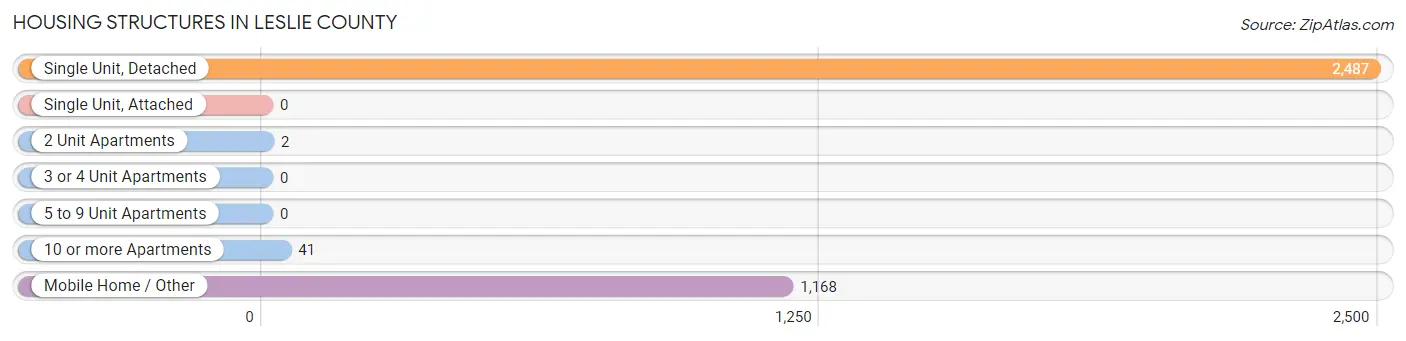
| Structure Type | # Housing Units | % Housing Units |
| Single Unit, Detached | 2,487 | 67.2% |
| Single Unit, Attached | 0 | 0.0% |
| 2 Unit Apartments | 2 | 0.1% |
| 3 or 4 Unit Apartments | 0 | 0.0% |
| 5 to 9 Unit Apartments | 0 | 0.0% |
| 10 or more Apartments | 41 | 1.1% |
| Mobile Home / Other | 1,168 | 31.6% |
| Total | 3,698 | 100.0% |
Housing Structures by Occupancy in Leslie County
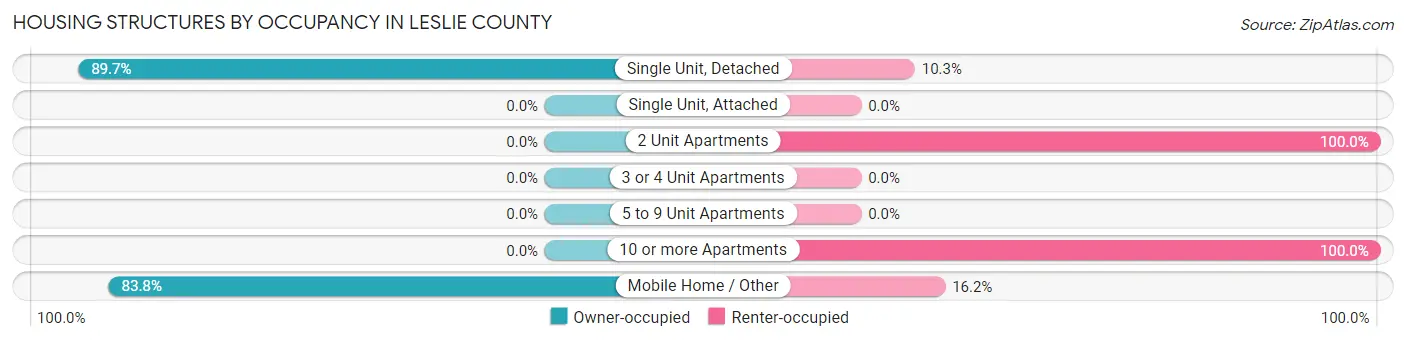
| Structure Type | Owner-occupied | Renter-occupied |
| Single Unit, Detached | 2,230 (89.7%) | 257 (10.3%) |
| Single Unit, Attached | 0 (0.0%) | 0 (0.0%) |
| 2 Unit Apartments | 0 (0.0%) | 2 (100.0%) |
| 3 or 4 Unit Apartments | 0 (0.0%) | 0 (0.0%) |
| 5 to 9 Unit Apartments | 0 (0.0%) | 0 (0.0%) |
| 10 or more Apartments | 0 (0.0%) | 41 (100.0%) |
| Mobile Home / Other | 979 (83.8%) | 189 (16.2%) |
| Total | 3,209 (86.8%) | 489 (13.2%) |
Housing Structures by Number of Rooms in Leslie County
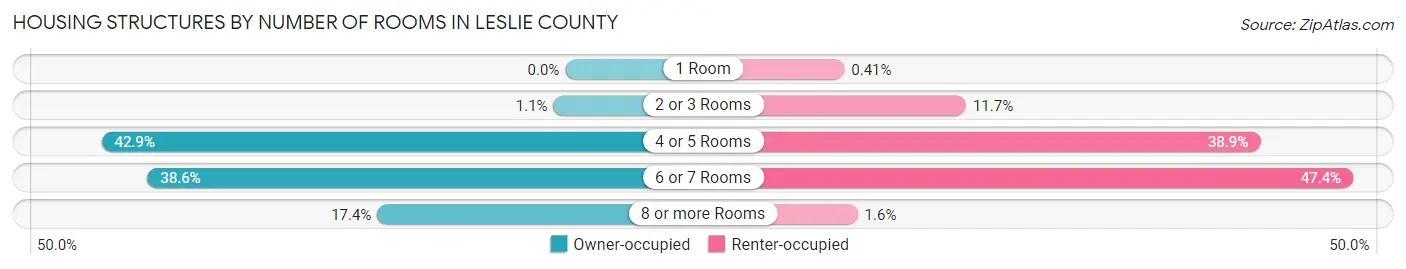
| Number of Rooms | Owner-occupied | Renter-occupied |
| 1 Room | 0 (0.0%) | 2 (0.4%) |
| 2 or 3 Rooms | 35 (1.1%) | 57 (11.7%) |
| 4 or 5 Rooms | 1,376 (42.9%) | 190 (38.9%) |
| 6 or 7 Rooms | 1,240 (38.6%) | 232 (47.4%) |
| 8 or more Rooms | 558 (17.4%) | 8 (1.6%) |
| Total | 3,209 (100.0%) | 489 (100.0%) |
Housing Structure by Heating Type in Leslie County
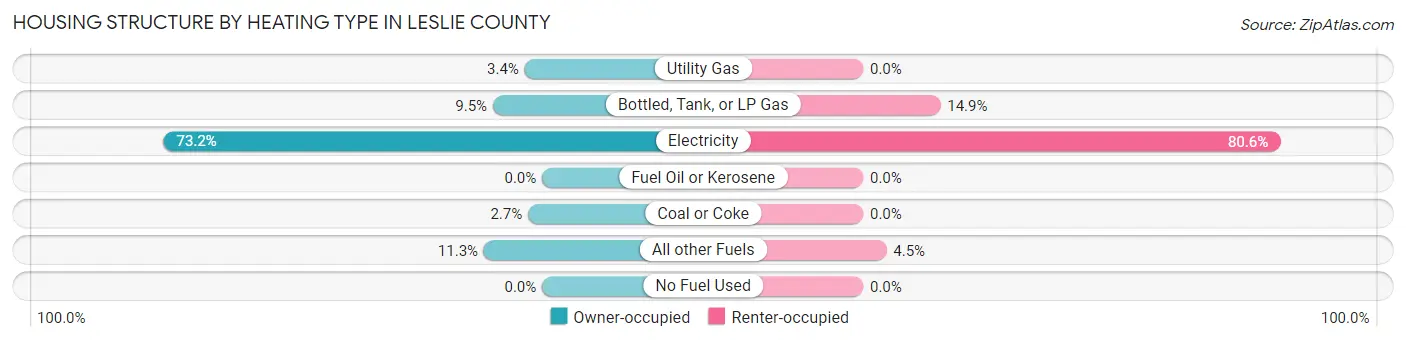
| Heating Type | Owner-occupied | Renter-occupied |
| Utility Gas | 108 (3.4%) | 0 (0.0%) |
| Bottled, Tank, or LP Gas | 305 (9.5%) | 73 (14.9%) |
| Electricity | 2,348 (73.2%) | 394 (80.6%) |
| Fuel Oil or Kerosene | 0 (0.0%) | 0 (0.0%) |
| Coal or Coke | 87 (2.7%) | 0 (0.0%) |
| All other Fuels | 361 (11.3%) | 22 (4.5%) |
| No Fuel Used | 0 (0.0%) | 0 (0.0%) |
| Total | 3,209 (100.0%) | 489 (100.0%) |
Household Vehicle Usage in Leslie County
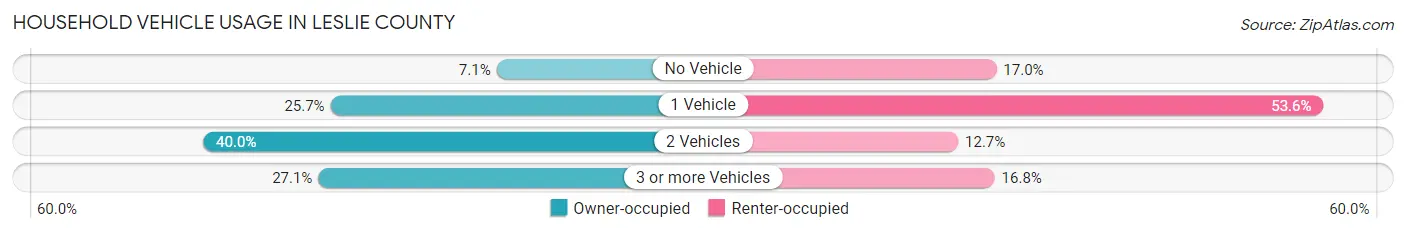
| Vehicles per Household | Owner-occupied | Renter-occupied |
| No Vehicle | 229 (7.1%) | 83 (17.0%) |
| 1 Vehicle | 826 (25.7%) | 262 (53.6%) |
| 2 Vehicles | 1,284 (40.0%) | 62 (12.7%) |
| 3 or more Vehicles | 870 (27.1%) | 82 (16.8%) |
| Total | 3,209 (100.0%) | 489 (100.0%) |
Real Estate & Mortgages in Leslie County
Real Estate and Mortgage Overview in Leslie County
| Characteristic | Without Mortgage | With Mortgage |
| Housing Units | 2,060 | 1,149 |
| Median Property Value | $72,700 | $89,900 |
| Median Household Income | $31,633 | $0 |
| Monthly Housing Costs | $343 | $48 |
| Real Estate Taxes | $504 | $35 |
Property Value by Mortgage Status in Leslie County
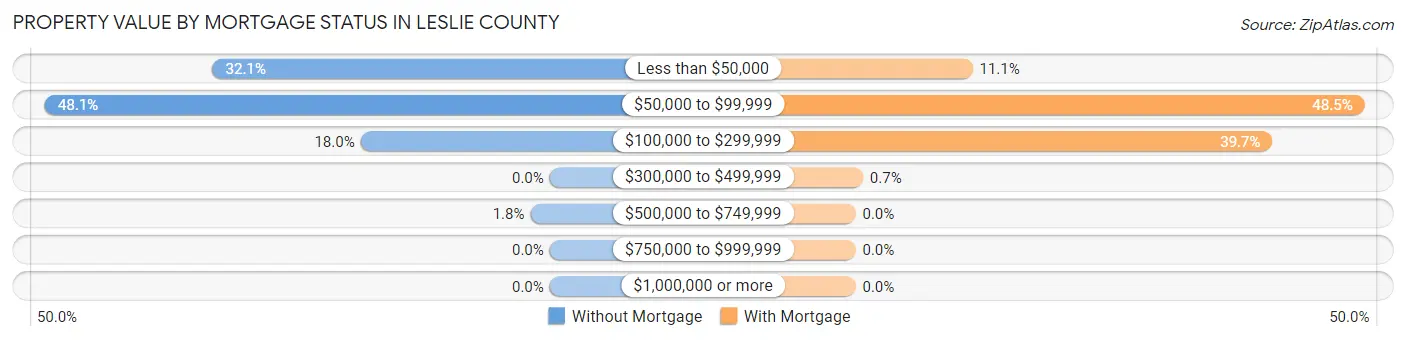
| Property Value | Without Mortgage | With Mortgage |
| Less than $50,000 | 661 (32.1%) | 128 (11.1%) |
| $50,000 to $99,999 | 990 (48.1%) | 557 (48.5%) |
| $100,000 to $299,999 | 371 (18.0%) | 456 (39.7%) |
| $300,000 to $499,999 | 0 (0.0%) | 8 (0.7%) |
| $500,000 to $749,999 | 38 (1.8%) | 0 (0.0%) |
| $750,000 to $999,999 | 0 (0.0%) | 0 (0.0%) |
| $1,000,000 or more | 0 (0.0%) | 0 (0.0%) |
| Total | 2,060 (100.0%) | 1,149 (100.0%) |
Household Income by Mortgage Status in Leslie County
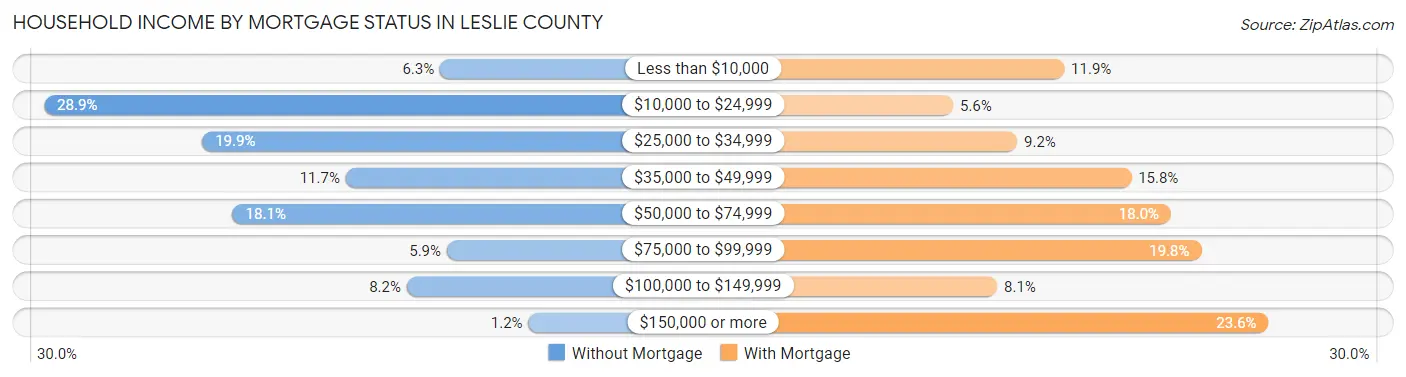
| Household Income | Without Mortgage | With Mortgage |
| Less than $10,000 | 129 (6.3%) | 137 (11.9%) |
| $10,000 to $24,999 | 595 (28.9%) | 64 (5.6%) |
| $25,000 to $34,999 | 409 (19.9%) | 106 (9.2%) |
| $35,000 to $49,999 | 240 (11.7%) | 181 (15.8%) |
| $50,000 to $74,999 | 373 (18.1%) | 207 (18.0%) |
| $75,000 to $99,999 | 121 (5.9%) | 227 (19.8%) |
| $100,000 to $149,999 | 168 (8.2%) | 93 (8.1%) |
| $150,000 or more | 25 (1.2%) | 271 (23.6%) |
| Total | 2,060 (100.0%) | 1,149 (100.0%) |
Property Value to Household Income Ratio in Leslie County
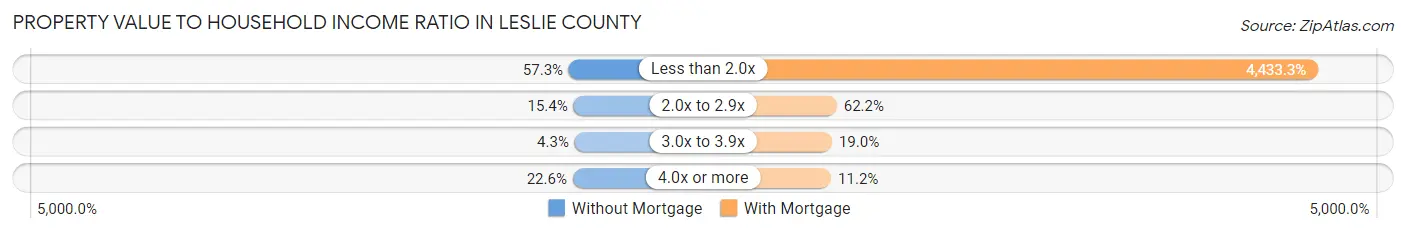
| Value-to-Income Ratio | Without Mortgage | With Mortgage |
| Less than 2.0x | 1,181 (57.3%) | 50,938 (4,433.3%) |
| 2.0x to 2.9x | 317 (15.4%) | 715 (62.2%) |
| 3.0x to 3.9x | 89 (4.3%) | 218 (19.0%) |
| 4.0x or more | 465 (22.6%) | 129 (11.2%) |
| Total | 2,060 (100.0%) | 1,149 (100.0%) |
Real Estate Taxes by Mortgage Status in Leslie County
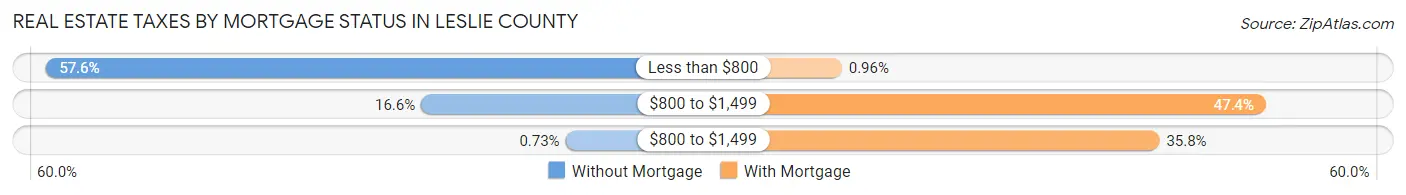
| Property Taxes | Without Mortgage | With Mortgage |
| Less than $800 | 1,187 (57.6%) | 11 (1.0%) |
| $800 to $1,499 | 341 (16.6%) | 545 (47.4%) |
| $800 to $1,499 | 15 (0.7%) | 411 (35.8%) |
| Total | 2,060 (100.0%) | 1,149 (100.0%) |
Health & Disability in Leslie County
Health Insurance Coverage by Age in Leslie County
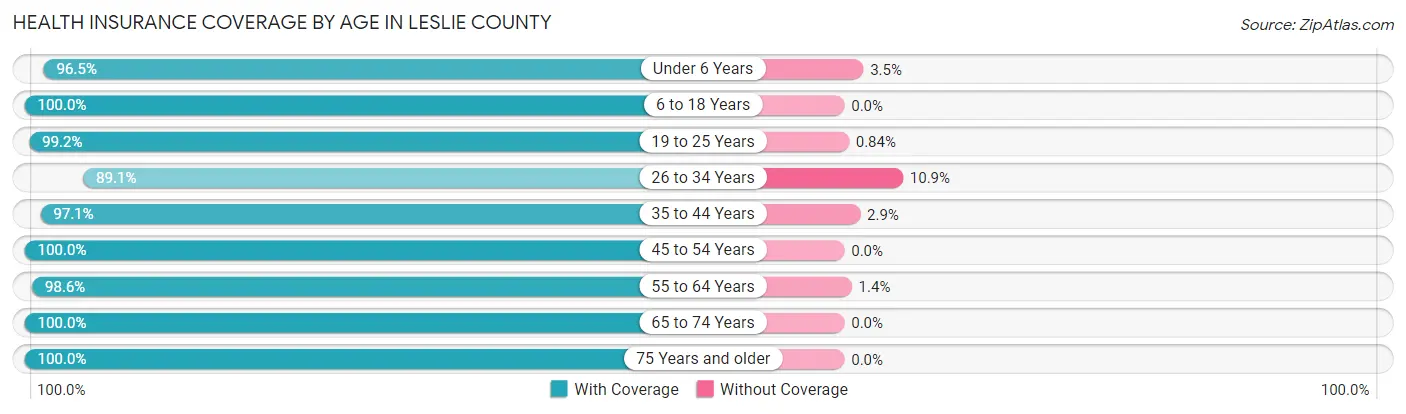
| Age Bracket | With Coverage | Without Coverage |
| Under 6 Years | 629 (96.5%) | 23 (3.5%) |
| 6 to 18 Years | 1,654 (100.0%) | 0 (0.0%) |
| 19 to 25 Years | 1,066 (99.2%) | 9 (0.8%) |
| 26 to 34 Years | 636 (89.1%) | 78 (10.9%) |
| 35 to 44 Years | 1,220 (97.1%) | 37 (2.9%) |
| 45 to 54 Years | 1,401 (100.0%) | 0 (0.0%) |
| 55 to 64 Years | 1,516 (98.6%) | 21 (1.4%) |
| 65 to 74 Years | 1,159 (100.0%) | 0 (0.0%) |
| 75 Years and older | 694 (100.0%) | 0 (0.0%) |
| Total | 9,975 (98.3%) | 168 (1.7%) |
Health Insurance Coverage by Citizenship Status in Leslie County
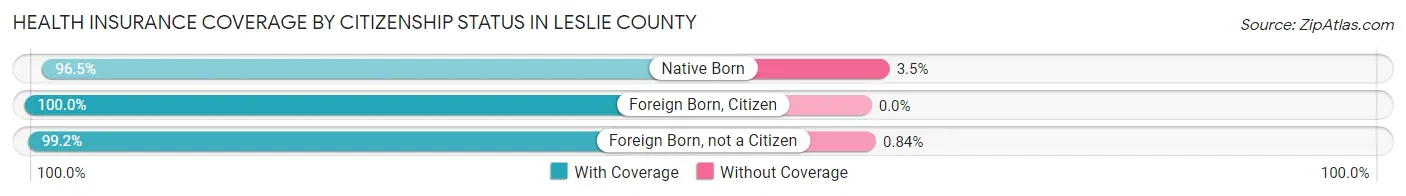
| Citizenship Status | With Coverage | Without Coverage |
| Native Born | 629 (96.5%) | 23 (3.5%) |
| Foreign Born, Citizen | 1,654 (100.0%) | 0 (0.0%) |
| Foreign Born, not a Citizen | 1,066 (99.2%) | 9 (0.8%) |
Health Insurance Coverage by Household Income in Leslie County
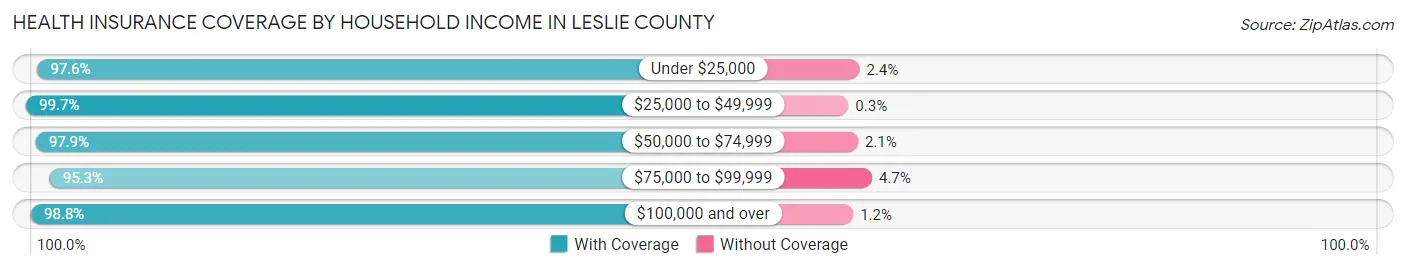
| Household Income | With Coverage | Without Coverage |
| Under $25,000 | 2,452 (97.6%) | 60 (2.4%) |
| $25,000 to $49,999 | 2,957 (99.7%) | 9 (0.3%) |
| $50,000 to $74,999 | 2,194 (97.9%) | 47 (2.1%) |
| $75,000 to $99,999 | 624 (95.3%) | 31 (4.7%) |
| $100,000 and over | 1,729 (98.8%) | 21 (1.2%) |
Public vs Private Health Insurance Coverage by Age in Leslie County
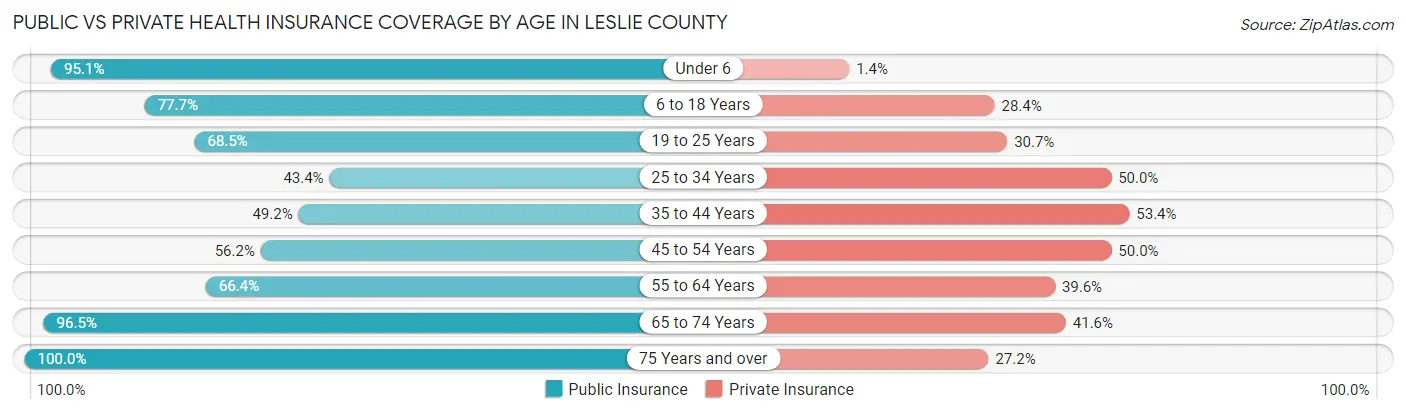
| Age Bracket | Public Insurance | Private Insurance |
| Under 6 | 620 (95.1%) | 9 (1.4%) |
| 6 to 18 Years | 1,285 (77.7%) | 469 (28.4%) |
| 19 to 25 Years | 736 (68.5%) | 330 (30.7%) |
| 25 to 34 Years | 310 (43.4%) | 357 (50.0%) |
| 35 to 44 Years | 618 (49.2%) | 671 (53.4%) |
| 45 to 54 Years | 787 (56.2%) | 701 (50.0%) |
| 55 to 64 Years | 1,020 (66.4%) | 608 (39.6%) |
| 65 to 74 Years | 1,118 (96.5%) | 482 (41.6%) |
| 75 Years and over | 694 (100.0%) | 189 (27.2%) |
| Total | 7,188 (70.9%) | 3,816 (37.6%) |
Disability Status by Sex by Age in Leslie County
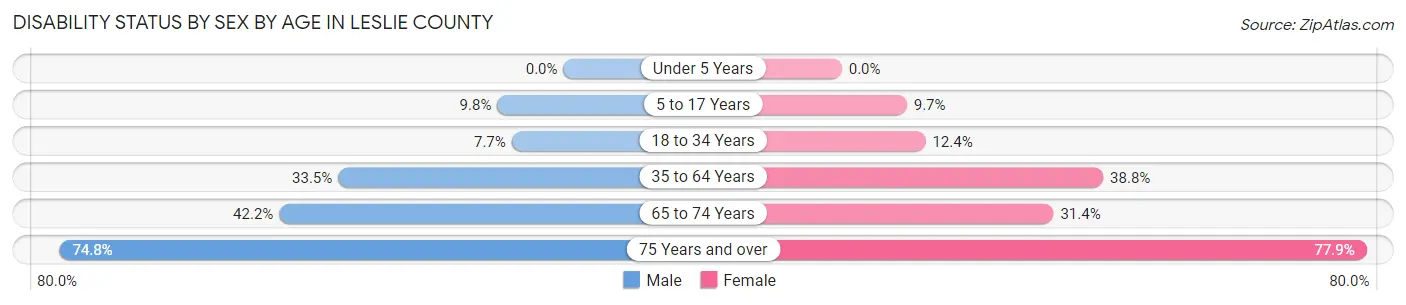
| Age Bracket | Male | Female |
| Under 5 Years | 0 (0.0%) | 0 (0.0%) |
| 5 to 17 Years | 88 (9.8%) | 77 (9.7%) |
| 18 to 34 Years | 77 (7.7%) | 106 (12.4%) |
| 35 to 64 Years | 680 (33.5%) | 839 (38.8%) |
| 65 to 74 Years | 238 (42.2%) | 187 (31.4%) |
| 75 Years and over | 211 (74.8%) | 321 (77.9%) |
Disability Class by Sex by Age in Leslie County
Disability Class: Hearing Difficulty
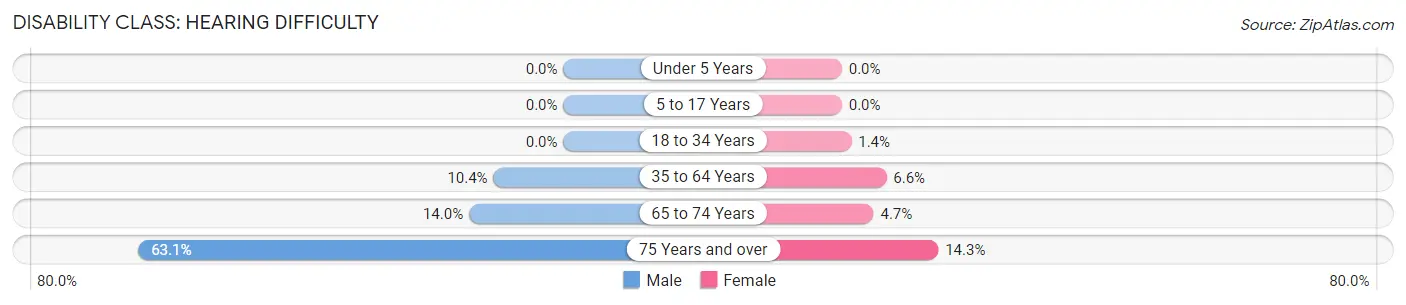
| Age Bracket | Male | Female |
| Under 5 Years | 0 (0.0%) | 0 (0.0%) |
| 5 to 17 Years | 0 (0.0%) | 0 (0.0%) |
| 18 to 34 Years | 0 (0.0%) | 12 (1.4%) |
| 35 to 64 Years | 211 (10.4%) | 143 (6.6%) |
| 65 to 74 Years | 79 (14.0%) | 28 (4.7%) |
| 75 Years and over | 178 (63.1%) | 59 (14.3%) |
Disability Class: Vision Difficulty
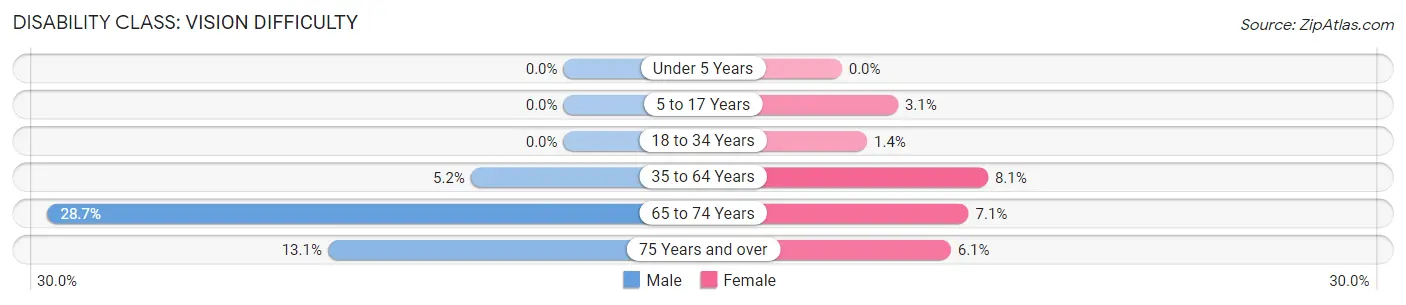
| Age Bracket | Male | Female |
| Under 5 Years | 0 (0.0%) | 0 (0.0%) |
| 5 to 17 Years | 0 (0.0%) | 25 (3.1%) |
| 18 to 34 Years | 0 (0.0%) | 12 (1.4%) |
| 35 to 64 Years | 105 (5.2%) | 176 (8.1%) |
| 65 to 74 Years | 162 (28.7%) | 42 (7.1%) |
| 75 Years and over | 37 (13.1%) | 25 (6.1%) |
Disability Class: Cognitive Difficulty
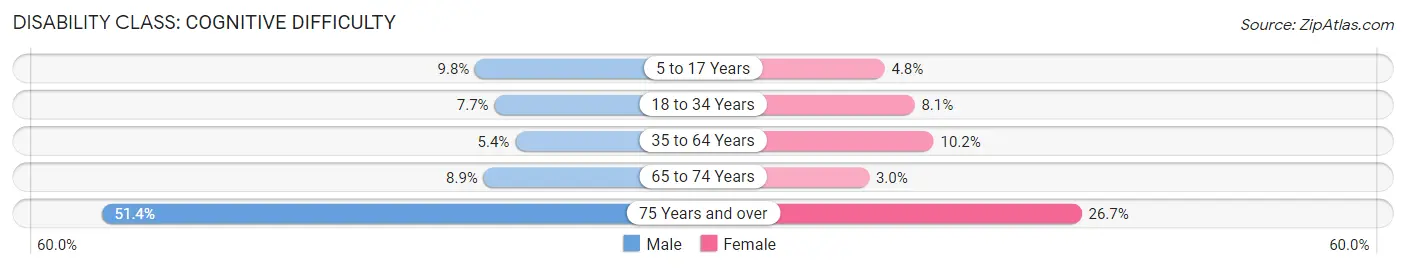
| Age Bracket | Male | Female |
| 5 to 17 Years | 88 (9.8%) | 38 (4.8%) |
| 18 to 34 Years | 77 (7.7%) | 69 (8.1%) |
| 35 to 64 Years | 109 (5.4%) | 221 (10.2%) |
| 65 to 74 Years | 50 (8.9%) | 18 (3.0%) |
| 75 Years and over | 145 (51.4%) | 110 (26.7%) |
Disability Class: Ambulatory Difficulty
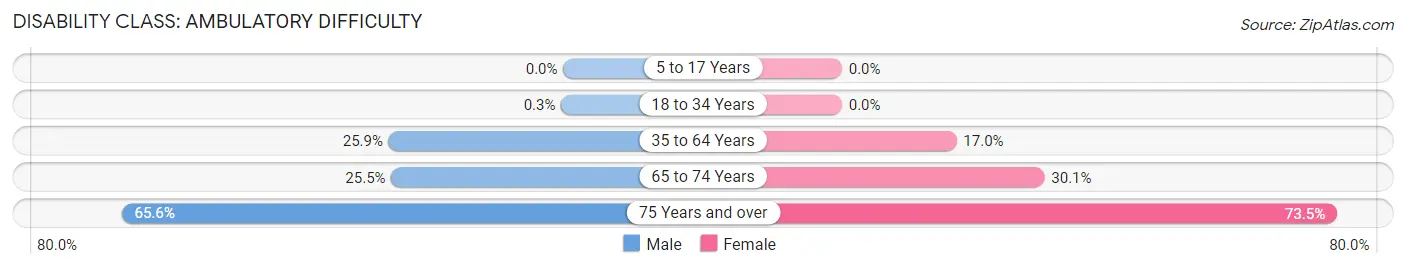
| Age Bracket | Male | Female |
| 5 to 17 Years | 0 (0.0%) | 0 (0.0%) |
| 18 to 34 Years | 3 (0.3%) | 0 (0.0%) |
| 35 to 64 Years | 527 (25.9%) | 368 (17.0%) |
| 65 to 74 Years | 144 (25.5%) | 179 (30.1%) |
| 75 Years and over | 185 (65.6%) | 303 (73.5%) |
Disability Class: Self-Care Difficulty
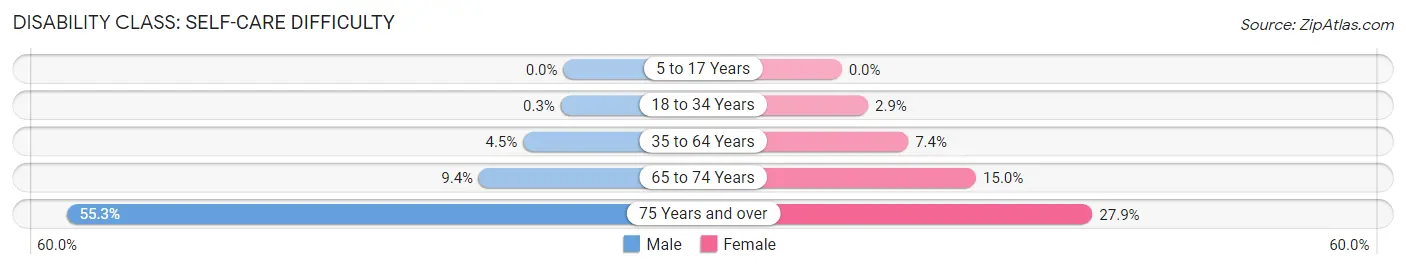
| Age Bracket | Male | Female |
| 5 to 17 Years | 0 (0.0%) | 0 (0.0%) |
| 18 to 34 Years | 3 (0.3%) | 25 (2.9%) |
| 35 to 64 Years | 91 (4.5%) | 160 (7.4%) |
| 65 to 74 Years | 53 (9.4%) | 89 (15.0%) |
| 75 Years and over | 156 (55.3%) | 115 (27.9%) |
Technology Access in Leslie County
Computing Device Access in Leslie County
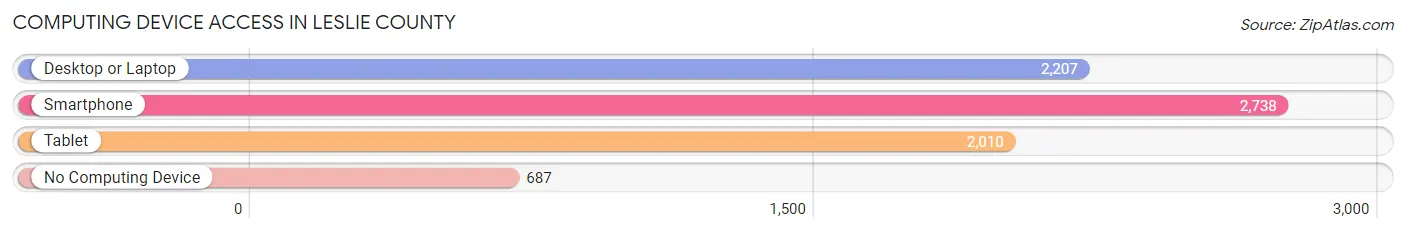
| Device Type | # Households | % Households |
| Desktop or Laptop | 2,207 | 59.7% |
| Smartphone | 2,738 | 74.0% |
| Tablet | 2,010 | 54.3% |
| No Computing Device | 687 | 18.6% |
| Total | 3,698 | 100.0% |
Internet Access in Leslie County
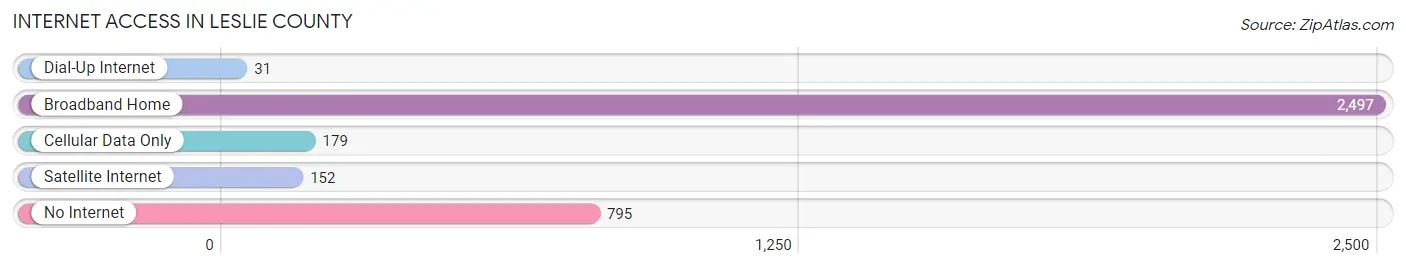
| Internet Type | # Households | % Households |
| Dial-Up Internet | 31 | 0.8% |
| Broadband Home | 2,497 | 67.5% |
| Cellular Data Only | 179 | 4.8% |
| Satellite Internet | 152 | 4.1% |
| No Internet | 795 | 21.5% |
| Total | 3,698 | 100.0% |
Leslie County Summary
Leslie County is located in the southeastern part of Kentucky, and is part of the Appalachian region. It is bordered by Clay County to the north, Harlan County to the east, Bell County to the south, and Perry County to the west. The county seat is Hyden, and the county was formed in 1878 from parts of Clay, Harlan, and Perry counties.
Geography
Leslie County covers an area of 437 square miles, and is located in the Appalachian Mountains. The terrain is mostly mountainous, with the highest point being Big Black Mountain at 4,145 feet. The county is drained by the Middle Fork of the Kentucky River, which flows through the county from north to south. Other major waterways include the Red Bird River, Troublesome Creek, and the South Fork of the Kentucky River. The county is mostly forested, with the majority of the land being used for timber production.
Demographics
As of the 2010 census, Leslie County had a population of 11,310. The population was 97.2% white, 0.7% black or African American, 0.3% Native American, 0.2% Asian, 0.1% Pacific Islander, 0.7% from other races, and 0.9% from two or more races. Hispanic or Latino of any race were 1.3% of the population.
The median household income was $20,945, and the median family income was $25,917. The per capita income was $12,845. About 24.2% of the population was below the poverty line.
Economy
The economy of Leslie County is largely based on agriculture and timber production. The county is home to several large timber companies, and the timber industry is the largest employer in the county. Other major industries include coal mining, manufacturing, and tourism.
The county is home to several state parks, including Kingdom Come State Park, which is located in the county seat of Hyden. The park is a popular destination for camping, fishing, and hiking. The county also has several recreational areas, including the Red Bird River Valley Recreation Area, which offers camping, fishing, and boating.
Education
Leslie County is served by the Leslie County School District, which operates seven elementary schools, two middle schools, and one high school. The county also has several private schools, including the Leslie County Christian Academy and the Leslie County Academy.
Conclusion
Leslie County is a rural county located in the Appalachian Mountains of southeastern Kentucky. The county is largely agricultural and timber-based, and is home to several state parks and recreational areas. The county is served by the Leslie County School District, which operates seven elementary schools, two middle schools, and one high school. The county has a population of 11,310, and the median household income is $20,945.
Common Questions
What is Per Capita Income in Leslie County?
Per Capita income in Leslie County is $18,739.
What is the Median Family Income in Leslie County?
Median Family Income in Leslie County is $50,819.
What is the Median Household income in Leslie County?
Median Household Income in Leslie County is $37,019.
What is Income or Wage Gap in Leslie County?
Income or Wage Gap in Leslie County is 52.5%.
Women in Leslie County earn 47.5 cents for every dollar earned by a man.
What is Family Income Deficit in Leslie County?
Family Income Deficit in Leslie County is $10,244.
Families that are below poverty line in Leslie County earn $10,244 less on average than the poverty threshold level.
What is Inequality or Gini Index in Leslie County?
Inequality or Gini Index in Leslie County is 0.42.
What is the Total Population of Leslie County?
Total Population of Leslie County is 10,468.
What is the Total Male Population of Leslie County?
Total Male Population of Leslie County is 5,249.
What is the Total Female Population of Leslie County?
Total Female Population of Leslie County is 5,219.
What is the Ratio of Males per 100 Females in Leslie County?
There are 100.57 Males per 100 Females in Leslie County.
What is the Ratio of Females per 100 Males in Leslie County?
There are 99.43 Females per 100 Males in Leslie County.
What is the Median Population Age in Leslie County?
Median Population Age in Leslie County is 43.2 Years.
What is the Average Family Size in Leslie County
Average Family Size in Leslie County is 3.6 People.
What is the Average Household Size in Leslie County
Average Household Size in Leslie County is 2.7 People.
How Large is the Labor Force in Leslie County?
There are 3,716 People in the Labor Forcein in Leslie County.
What is the Percentage of People in the Labor Force in Leslie County?
43.8% of People are in the Labor Force in Leslie County.
What is the Unemployment Rate in Leslie County?
Unemployment Rate in Leslie County is 10.0%.