Lee County, KY Map & Demographics
Lee County Map
Lee County Overview
$18,651
PER CAPITA INCOME
$39,402
AVG FAMILY INCOME
$31,682
AVG HOUSEHOLD INCOME
23.2%
WAGE / INCOME GAP [ % ]
76.8¢/ $1
WAGE / INCOME GAP [ $ ]
$10,812
FAMILY INCOME DEFICIT
0.50
INEQUALITY / GINI INDEX
7,338
TOTAL POPULATION
4,183
MALE POPULATION
3,155
FEMALE POPULATION
132.58
MALES / 100 FEMALES
75.42
FEMALES / 100 MALES
41.8
MEDIAN AGE
3.3
AVG FAMILY SIZE
2.5
AVG HOUSEHOLD SIZE
2,499
LABOR FORCE [ PEOPLE ]
41.6%
PERCENT IN LABOR FORCE
8.1%
UNEMPLOYMENT RATE
Lee County Area Codes
Income in Lee County
Income Overview in Lee County
Per Capita Income in Lee County is $18,651, while median incomes of families and households are $39,402 and $31,682 respectively.
| Characteristic | Number | Measure |
| Per Capita Income | 7,338 | $18,651 |
| Median Family Income | 1,597 | $39,402 |
| Mean Family Income | 1,597 | $58,383 |
| Median Household Income | 2,637 | $31,682 |
| Mean Household Income | 2,637 | $45,719 |
| Income Deficit | 1,597 | $10,812 |
| Wage / Income Gap (%) | 7,338 | 23.20% |
| Wage / Income Gap ($) | 7,338 | 76.80¢ per $1 |
| Gini / Inequality Index | 7,338 | 0.50 |
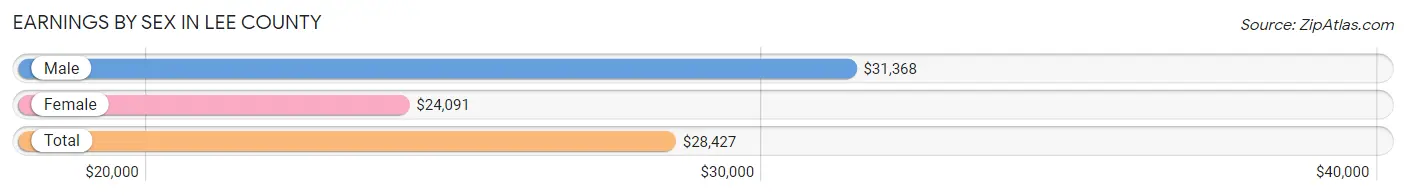
Earnings by Sex in Lee County
Average Earnings in Lee County are $28,427, $31,368 for men and $24,091 for women, a difference of 23.2%.
| Sex | Number | Average Earnings |
| Male | 1,742 (63.6%) | $31,368 |
| Female | 996 (36.4%) | $24,091 |
| Total | 2,738 (100.0%) | $28,427 |
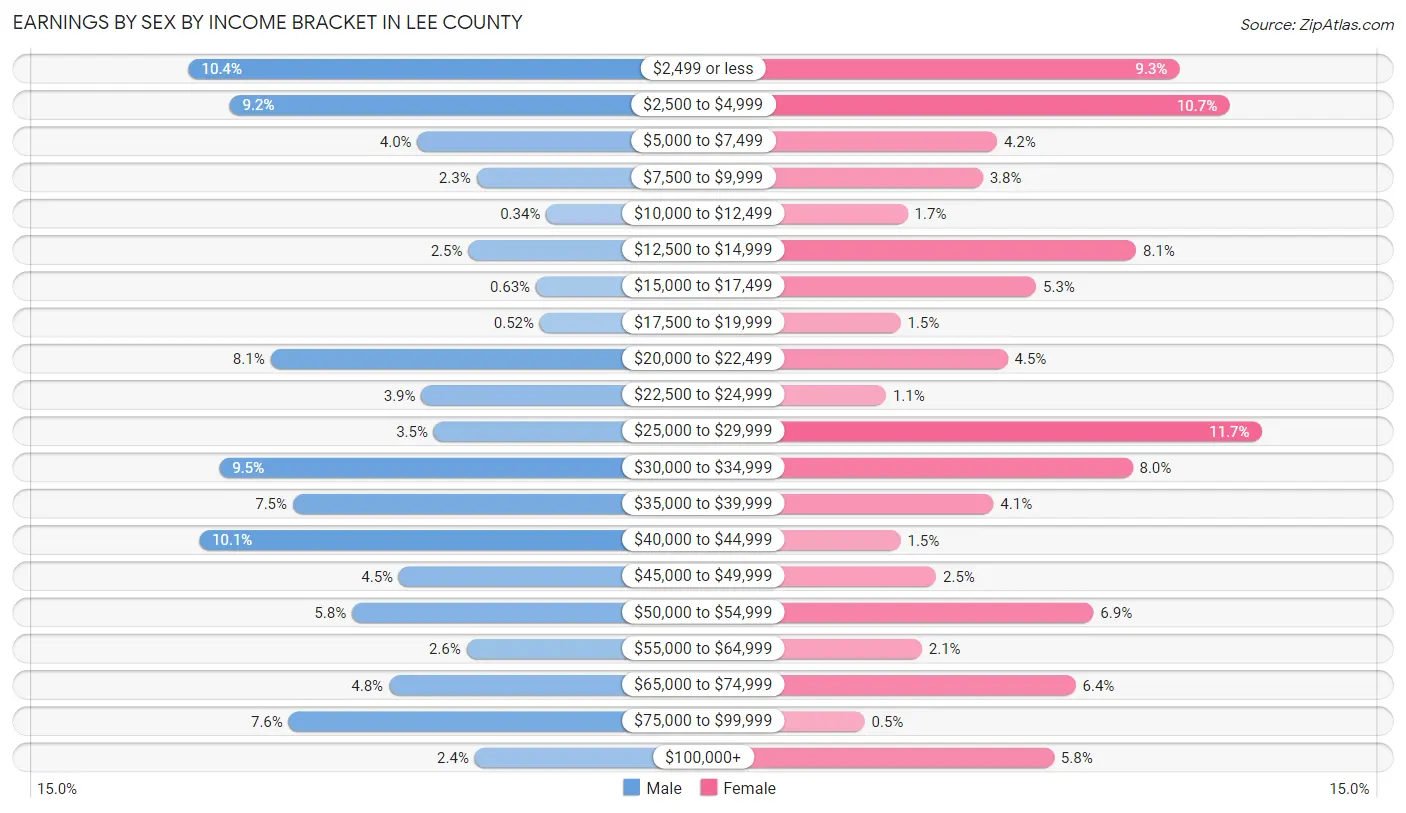
Earnings by Sex by Income Bracket in Lee County
The most common earnings brackets in Lee County are $2,499 or less for men (181 | 10.4%) and $25,000 to $29,999 for women (116 | 11.7%).
| Income | Male | Female |
| $2,499 or less | 181 (10.4%) | 93 (9.3%) |
| $2,500 to $4,999 | 161 (9.2%) | 107 (10.7%) |
| $5,000 to $7,499 | 69 (4.0%) | 42 (4.2%) |
| $7,500 to $9,999 | 40 (2.3%) | 38 (3.8%) |
| $10,000 to $12,499 | 6 (0.3%) | 17 (1.7%) |
| $12,500 to $14,999 | 44 (2.5%) | 81 (8.1%) |
| $15,000 to $17,499 | 11 (0.6%) | 53 (5.3%) |
| $17,500 to $19,999 | 9 (0.5%) | 15 (1.5%) |
| $20,000 to $22,499 | 141 (8.1%) | 45 (4.5%) |
| $22,500 to $24,999 | 67 (3.8%) | 11 (1.1%) |
| $25,000 to $29,999 | 61 (3.5%) | 116 (11.7%) |
| $30,000 to $34,999 | 166 (9.5%) | 80 (8.0%) |
| $35,000 to $39,999 | 130 (7.5%) | 41 (4.1%) |
| $40,000 to $44,999 | 176 (10.1%) | 15 (1.5%) |
| $45,000 to $49,999 | 78 (4.5%) | 25 (2.5%) |
| $50,000 to $54,999 | 101 (5.8%) | 69 (6.9%) |
| $55,000 to $64,999 | 45 (2.6%) | 21 (2.1%) |
| $65,000 to $74,999 | 83 (4.8%) | 64 (6.4%) |
| $75,000 to $99,999 | 132 (7.6%) | 5 (0.5%) |
| $100,000+ | 41 (2.4%) | 58 (5.8%) |
| Total | 1,742 (100.0%) | 996 (100.0%) |
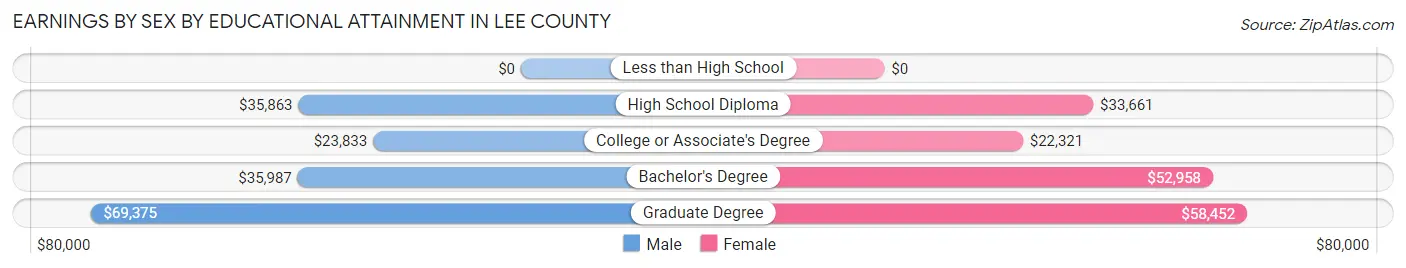
Earnings by Sex by Educational Attainment in Lee County
Average earnings in Lee County are $35,298 for men and $27,137 for women, a difference of 23.1%. Men with an educational attainment of graduate degree enjoy the highest average annual earnings of $69,375, while those with college or associate's degree education earn the least with $23,833. Women with an educational attainment of graduate degree earn the most with the average annual earnings of $58,452, while those with college or associate's degree education have the smallest earnings of $22,321.
| Educational Attainment | Male Income | Female Income |
| Less than High School | - | - |
| High School Diploma | $35,863 | $33,661 |
| College or Associate's Degree | $23,833 | $22,321 |
| Bachelor's Degree | $35,987 | $52,958 |
| Graduate Degree | $69,375 | $58,452 |
| Total | $35,298 | $27,137 |
Family Income in Lee County
Family Income Brackets in Lee County
According to the Lee County family income data, there are 327 families falling into the $35,000 to $49,999 income range, which is the most common income bracket and makes up 20.5% of all families. Conversely, the $200,000+ income bracket is the least frequent group with only 21 families (1.3%) belonging to this category.
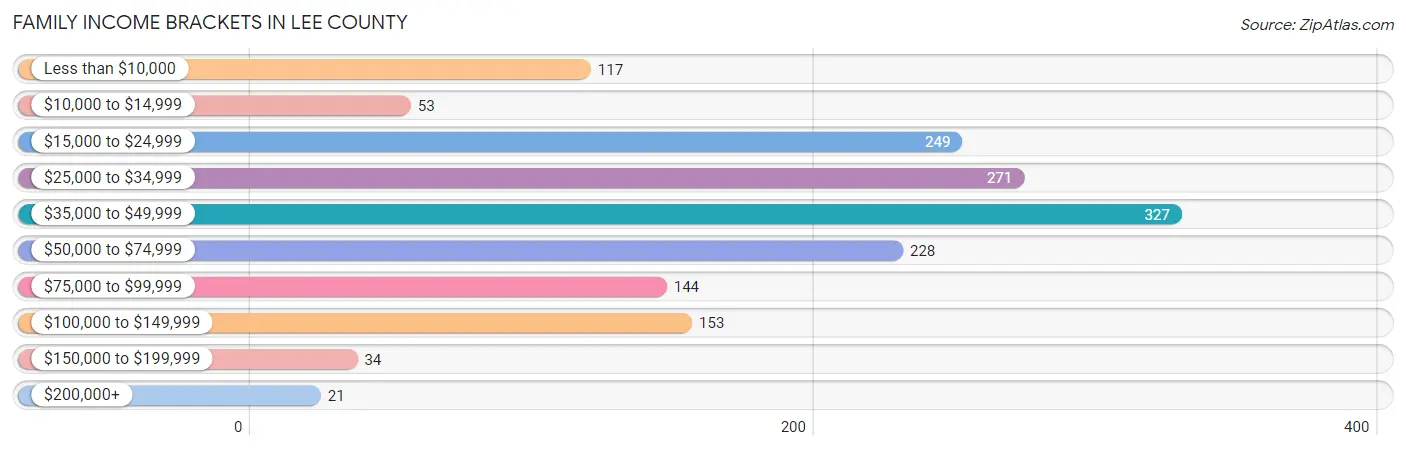
| Income Bracket | # Families | % Families |
| Less than $10,000 | 117 | 7.3% |
| $10,000 to $14,999 | 53 | 3.3% |
| $15,000 to $24,999 | 249 | 15.6% |
| $25,000 to $34,999 | 271 | 17.0% |
| $35,000 to $49,999 | 327 | 20.5% |
| $50,000 to $74,999 | 228 | 14.3% |
| $75,000 to $99,999 | 144 | 9.0% |
| $100,000 to $149,999 | 153 | 9.6% |
| $150,000 to $199,999 | 34 | 2.1% |
| $200,000+ | 21 | 1.3% |
Family Income by Famaliy Size in Lee County
4-person families (169 | 10.6%) account for the highest median family income in Lee County with $44,514 per family, while 2-person families (912 | 57.1%) have the highest median income of $18,554 per family member.
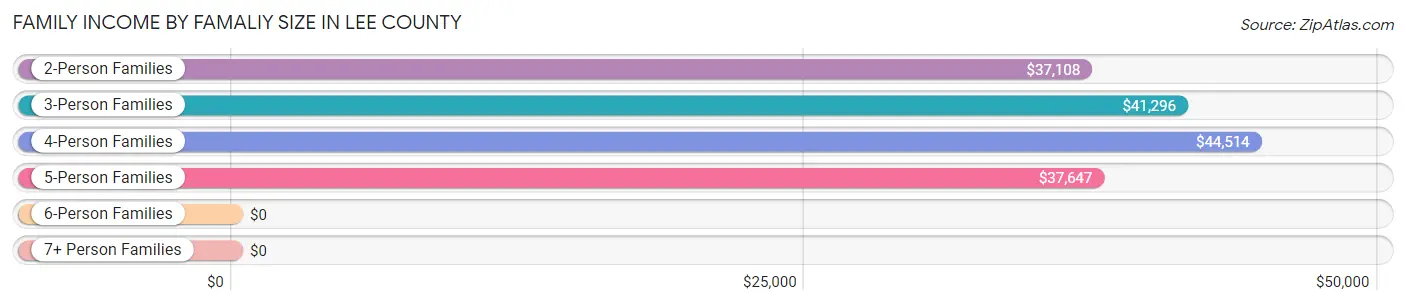
| Income Bracket | # Families | Median Income |
| 2-Person Families | 912 (57.1%) | $37,108 |
| 3-Person Families | 298 (18.7%) | $41,296 |
| 4-Person Families | 169 (10.6%) | $44,514 |
| 5-Person Families | 148 (9.3%) | $37,647 |
| 6-Person Families | 31 (1.9%) | $0 |
| 7+ Person Families | 39 (2.4%) | $0 |
| Total | 1,597 (100.0%) | $39,402 |
Family Income by Number of Earners in Lee County
The median family income in Lee County is $39,402, with families comprising 3+ earners (60) having the highest median family income of $120,652, while families with no earners (426) have the lowest median family income of $24,151, accounting for 3.8% and 26.7% of families, respectively.
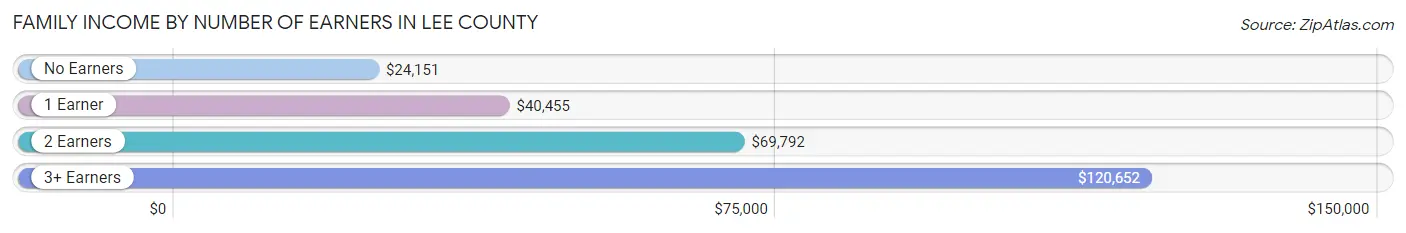
| Number of Earners | # Families | Median Income |
| No Earners | 426 (26.7%) | $24,151 |
| 1 Earner | 742 (46.5%) | $40,455 |
| 2 Earners | 369 (23.1%) | $69,792 |
| 3+ Earners | 60 (3.8%) | $120,652 |
| Total | 1,597 (100.0%) | $39,402 |
Household Income in Lee County
Household Income Brackets in Lee County
With 422 households falling in the category, the $25,000 to $34,999 income range is the most frequent in Lee County, accounting for 16.0% of all households. In contrast, only 24 households (0.9%) fall into the $200,000+ income bracket, making it the least populous group.
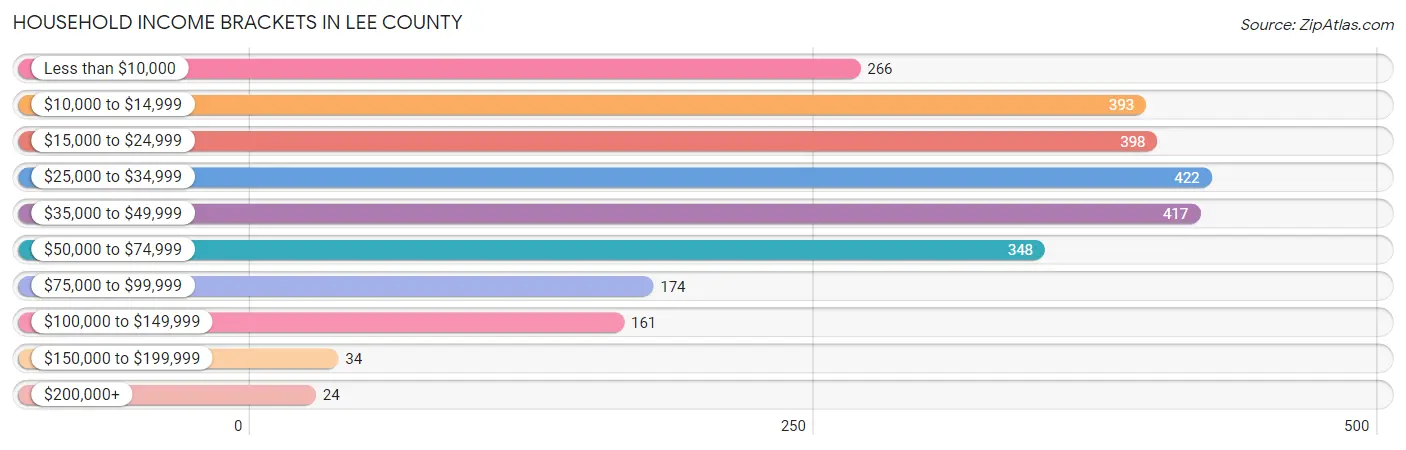
| Income Bracket | # Households | % Households |
| Less than $10,000 | 266 | 10.1% |
| $10,000 to $14,999 | 393 | 14.9% |
| $15,000 to $24,999 | 398 | 15.1% |
| $25,000 to $34,999 | 422 | 16.0% |
| $35,000 to $49,999 | 417 | 15.8% |
| $50,000 to $74,999 | 348 | 13.2% |
| $75,000 to $99,999 | 174 | 6.6% |
| $100,000 to $149,999 | 161 | 6.1% |
| $150,000 to $199,999 | 34 | 1.3% |
| $200,000+ | 24 | 0.9% |
Household Income by Householder Age in Lee County
The median household income in Lee County is $31,682, with the highest median household income of $42,037 found in the 45 to 64 years age bracket for the primary householder. A total of 1,150 households (43.6%) fall into this category. Meanwhile, the 15 to 24 years age bracket for the primary householder has the lowest median household income of $2,499, with 93 households (3.5%) in this group.
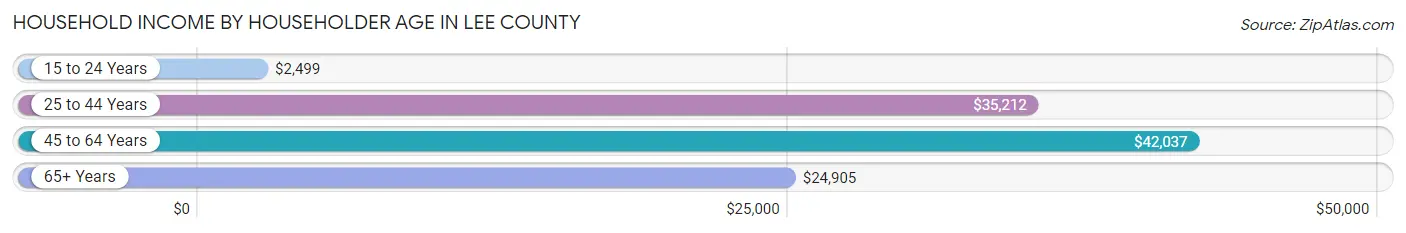
| Income Bracket | # Households | Median Income |
| 15 to 24 Years | 93 (3.5%) | $2,499 |
| 25 to 44 Years | 557 (21.1%) | $35,212 |
| 45 to 64 Years | 1,150 (43.6%) | $42,037 |
| 65+ Years | 837 (31.7%) | $24,905 |
| Total | 2,637 (100.0%) | $31,682 |
Poverty in Lee County
Income Below Poverty by Sex and Age in Lee County
With 29.9% poverty level for males and 33.0% for females among the residents of Lee County, 6 to 11 year old males and 15 year old females are the most vulnerable to poverty, with 186 males (56.9%) and 8 females (100.0%) in their respective age groups living below the poverty level.
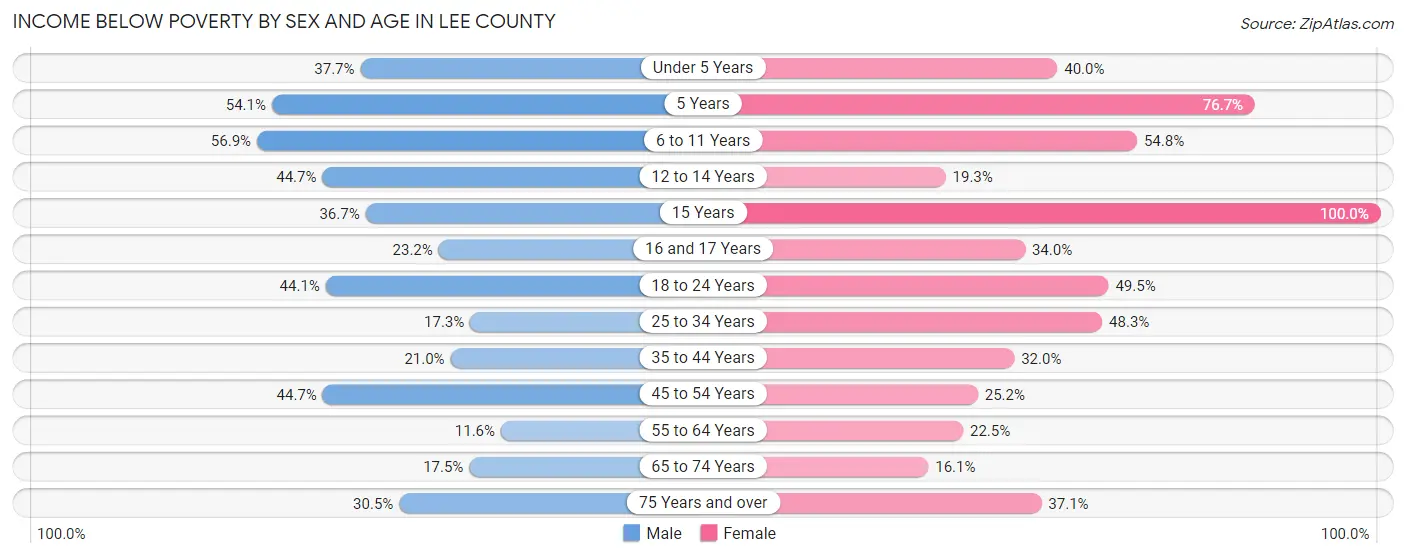
| Age Bracket | Male | Female |
| Under 5 Years | 52 (37.7%) | 88 (40.0%) |
| 5 Years | 46 (54.1%) | 23 (76.7%) |
| 6 to 11 Years | 186 (56.9%) | 120 (54.8%) |
| 12 to 14 Years | 34 (44.7%) | 21 (19.3%) |
| 15 Years | 36 (36.7%) | 8 (100.0%) |
| 16 and 17 Years | 25 (23.2%) | 17 (34.0%) |
| 18 to 24 Years | 120 (44.1%) | 100 (49.5%) |
| 25 to 34 Years | 63 (17.3%) | 159 (48.3%) |
| 35 to 44 Years | 100 (21.0%) | 113 (32.0%) |
| 45 to 54 Years | 210 (44.7%) | 105 (25.2%) |
| 55 to 64 Years | 63 (11.6%) | 115 (22.5%) |
| 65 to 74 Years | 72 (17.5%) | 66 (16.1%) |
| 75 Years and over | 57 (30.5%) | 83 (37.0%) |
| Total | 1,064 (29.9%) | 1,018 (33.0%) |
Income Above Poverty by Sex and Age in Lee County
According to the poverty statistics in Lee County, males aged 55 to 64 years and females aged 65 to 74 years are the age groups that are most secure financially, with 88.4% of males and 83.9% of females in these age groups living above the poverty line.
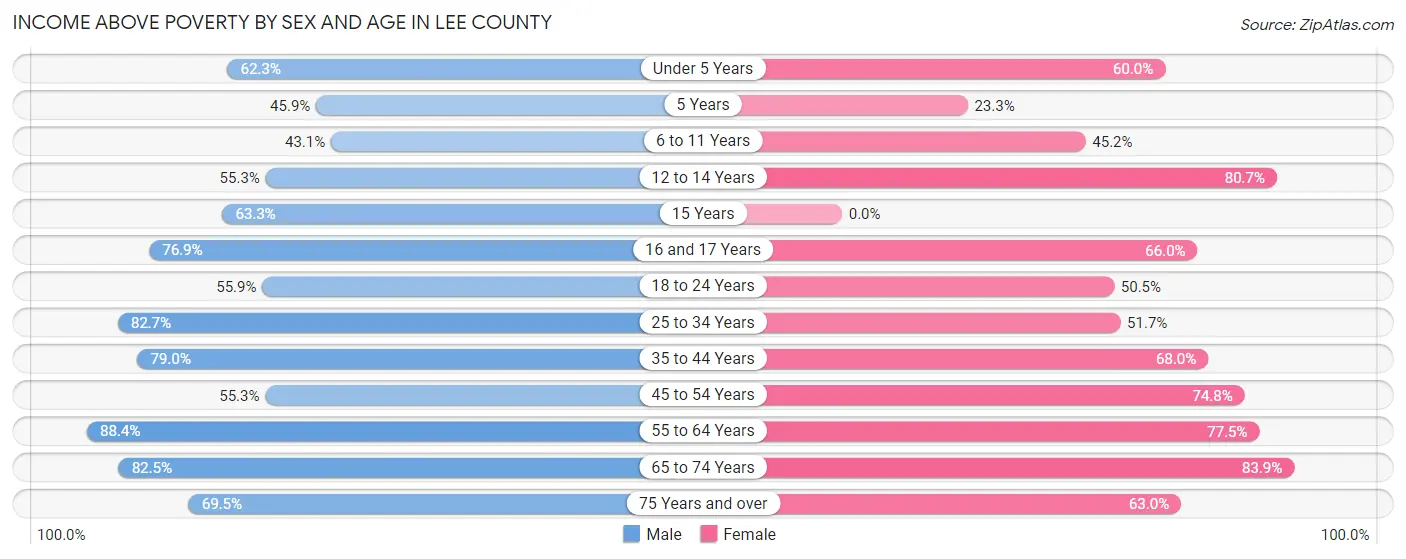
| Age Bracket | Male | Female |
| Under 5 Years | 86 (62.3%) | 132 (60.0%) |
| 5 Years | 39 (45.9%) | 7 (23.3%) |
| 6 to 11 Years | 141 (43.1%) | 99 (45.2%) |
| 12 to 14 Years | 42 (55.3%) | 88 (80.7%) |
| 15 Years | 62 (63.3%) | 0 (0.0%) |
| 16 and 17 Years | 83 (76.8%) | 33 (66.0%) |
| 18 to 24 Years | 152 (55.9%) | 102 (50.5%) |
| 25 to 34 Years | 301 (82.7%) | 170 (51.7%) |
| 35 to 44 Years | 377 (79.0%) | 240 (68.0%) |
| 45 to 54 Years | 260 (55.3%) | 311 (74.8%) |
| 55 to 64 Years | 480 (88.4%) | 396 (77.5%) |
| 65 to 74 Years | 340 (82.5%) | 345 (83.9%) |
| 75 Years and over | 130 (69.5%) | 141 (62.9%) |
| Total | 2,493 (70.1%) | 2,064 (67.0%) |
Income Below Poverty Among Married-Couple Families in Lee County
The poverty statistics for married-couple families in Lee County show that 13.0% or 136 of the total 1,045 families live below the poverty line. Families with 5 or more children have the highest poverty rate of 100.0%, comprising of 29 families. On the other hand, families with no children have the lowest poverty rate of 7.4%, which includes 49 families.
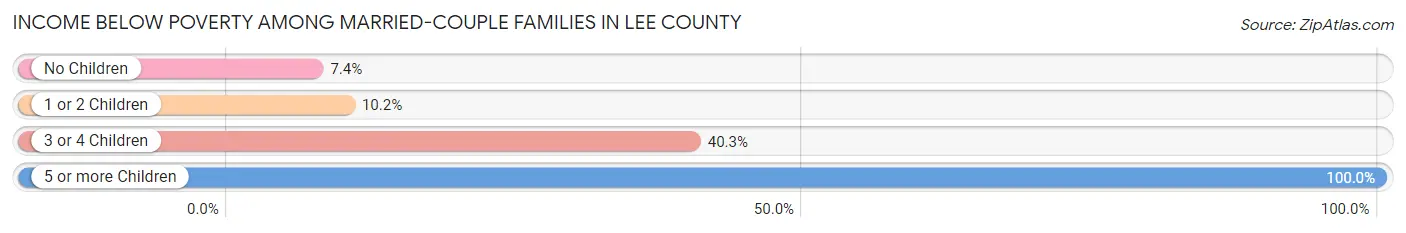
| Children | Above Poverty | Below Poverty |
| No Children | 610 (92.6%) | 49 (7.4%) |
| 1 or 2 Children | 256 (89.8%) | 29 (10.2%) |
| 3 or 4 Children | 43 (59.7%) | 29 (40.3%) |
| 5 or more Children | 0 (0.0%) | 29 (100.0%) |
| Total | 909 (87.0%) | 136 (13.0%) |
Income Below Poverty Among Single-Parent Households in Lee County
According to the poverty data in Lee County, 30.9% or 67 single-father households and 40.3% or 135 single-mother households are living below the poverty line. Among single-father households, those with 1 or 2 children have the highest poverty rate, with 34 households (32.7%) experiencing poverty. Likewise, among single-mother households, those with 3 or 4 children have the highest poverty rate, with 61 households (70.1%) falling below the poverty line.
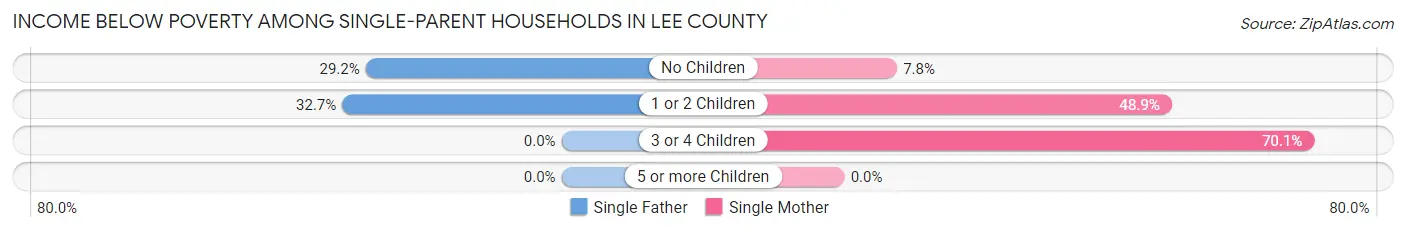
| Children | Single Father | Single Mother |
| No Children | 33 (29.2%) | 9 (7.8%) |
| 1 or 2 Children | 34 (32.7%) | 65 (48.9%) |
| 3 or 4 Children | 0 (0.0%) | 61 (70.1%) |
| 5 or more Children | 0 (0.0%) | 0 (0.0%) |
| Total | 67 (30.9%) | 135 (40.3%) |
Income Below Poverty Among Married-Couple vs Single-Parent Households in Lee County
The poverty data for Lee County shows that 136 of the married-couple family households (13.0%) and 202 of the single-parent households (36.6%) are living below the poverty level. Within the married-couple family households, those with 5 or more children have the highest poverty rate, with 29 households (100.0%) falling below the poverty line. Among the single-parent households, those with 3 or 4 children have the highest poverty rate, with 61 household (70.1%) living below poverty.
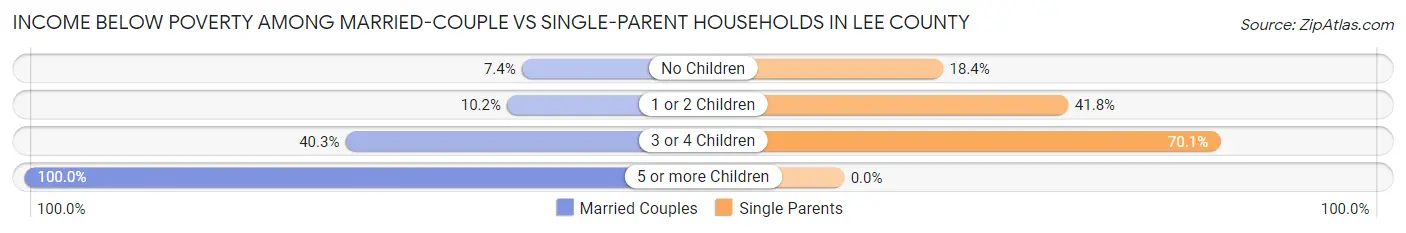
| Children | Married-Couple Families | Single-Parent Households |
| No Children | 49 (7.4%) | 42 (18.4%) |
| 1 or 2 Children | 29 (10.2%) | 99 (41.8%) |
| 3 or 4 Children | 29 (40.3%) | 61 (70.1%) |
| 5 or more Children | 29 (100.0%) | 0 (0.0%) |
| Total | 136 (13.0%) | 202 (36.6%) |
Race in Lee County
The most populous races in Lee County are White / Caucasian (6,901 | 94.0%), Two or more Races (254 | 3.5%), and Hispanic or Latino (171 | 2.3%).
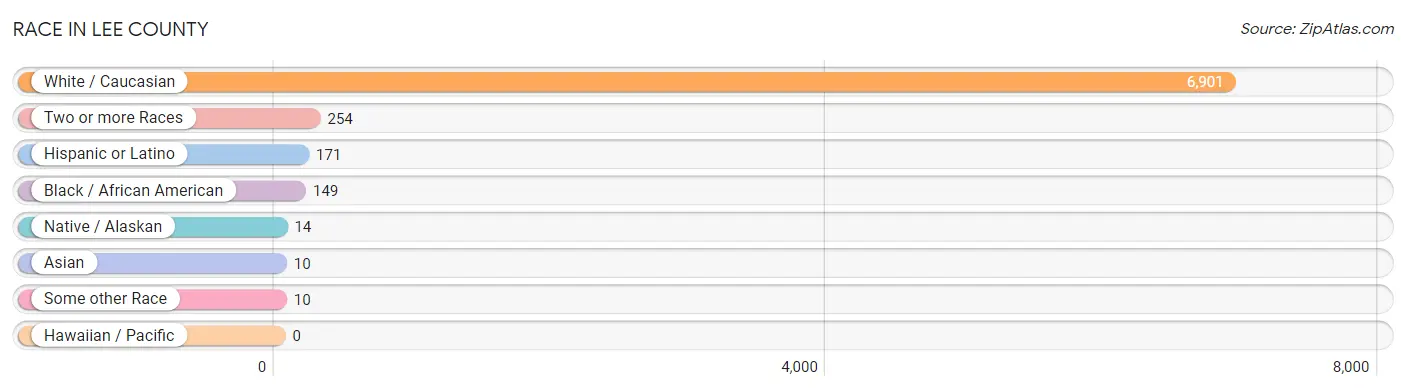
| Race | # Population | % Population |
| Asian | 10 | 0.1% |
| Black / African American | 149 | 2.0% |
| Hawaiian / Pacific | 0 | 0.0% |
| Hispanic or Latino | 171 | 2.3% |
| Native / Alaskan | 14 | 0.2% |
| White / Caucasian | 6,901 | 94.0% |
| Two or more Races | 254 | 3.5% |
| Some other Race | 10 | 0.1% |
| Total | 7,338 | 100.0% |
Ancestry in Lee County
The most populous ancestries reported in Lee County are American (1,680 | 22.9%), English (1,368 | 18.6%), German (994 | 13.6%), Irish (702 | 9.6%), and Scottish (164 | 2.2%), together accounting for 66.9% of all Lee County residents.
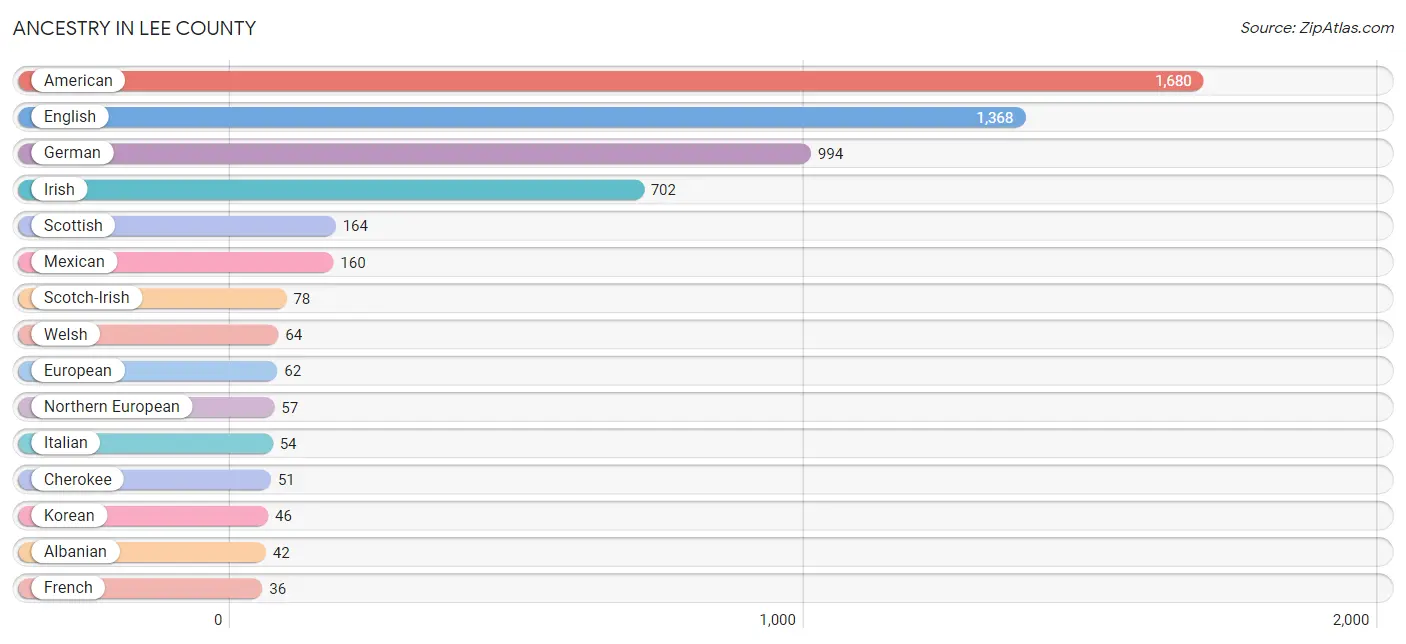
| Ancestry | # Population | % Population |
| African | 7 | 0.1% |
| Albanian | 42 | 0.6% |
| American | 1,680 | 22.9% |
| Austrian | 23 | 0.3% |
| Cherokee | 51 | 0.7% |
| Chippewa | 14 | 0.2% |
| Dutch | 23 | 0.3% |
| Dutch West Indian | 13 | 0.2% |
| English | 1,368 | 18.6% |
| European | 62 | 0.8% |
| French | 36 | 0.5% |
| German | 994 | 13.6% |
| Irish | 702 | 9.6% |
| Italian | 54 | 0.7% |
| Korean | 46 | 0.6% |
| Mexican | 160 | 2.2% |
| Navajo | 14 | 0.2% |
| Northern European | 57 | 0.8% |
| Norwegian | 32 | 0.4% |
| Polish | 9 | 0.1% |
| Russian | 21 | 0.3% |
| Scotch-Irish | 78 | 1.1% |
| Scottish | 164 | 2.2% |
| Subsaharan African | 7 | 0.1% |
| Swedish | 8 | 0.1% |
| Welsh | 64 | 0.9% | View All 26 Rows |
Immigrants in Lee County
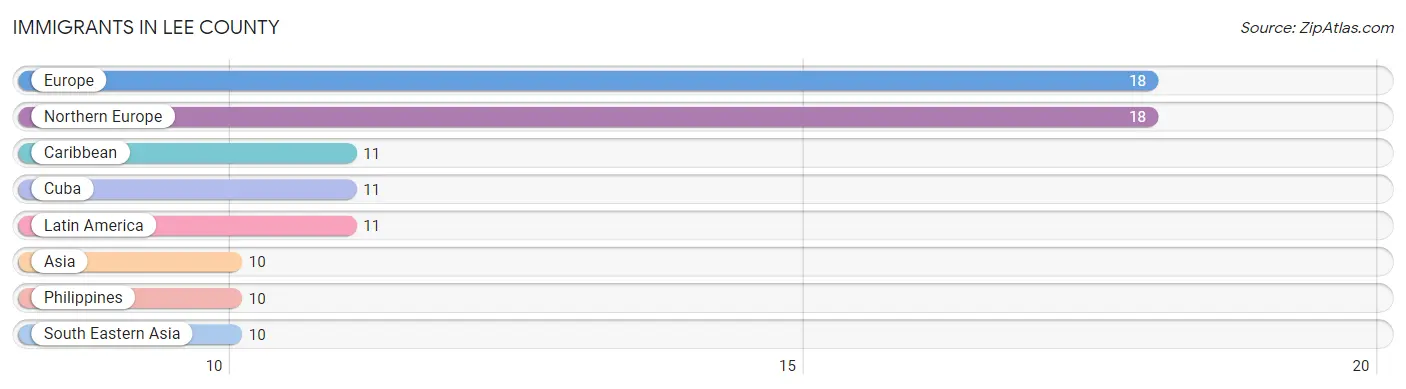
The most numerous immigrant groups reported in Lee County came from Europe (18 | 0.3%), Northern Europe (18 | 0.3%), Caribbean (11 | 0.2%), Cuba (11 | 0.2%), and Latin America (11 | 0.2%), together accounting for 0.9% of all Lee County residents.
| Immigration Origin | # Population | % Population |
| Asia | 10 | 0.1% |
| Caribbean | 11 | 0.2% |
| Cuba | 11 | 0.2% |
| Europe | 18 | 0.3% |
| Latin America | 11 | 0.2% |
| Northern Europe | 18 | 0.3% |
| Philippines | 10 | 0.1% |
| South Eastern Asia | 10 | 0.1% | View All 8 Rows |
Sex and Age in Lee County
Sex and Age in Lee County
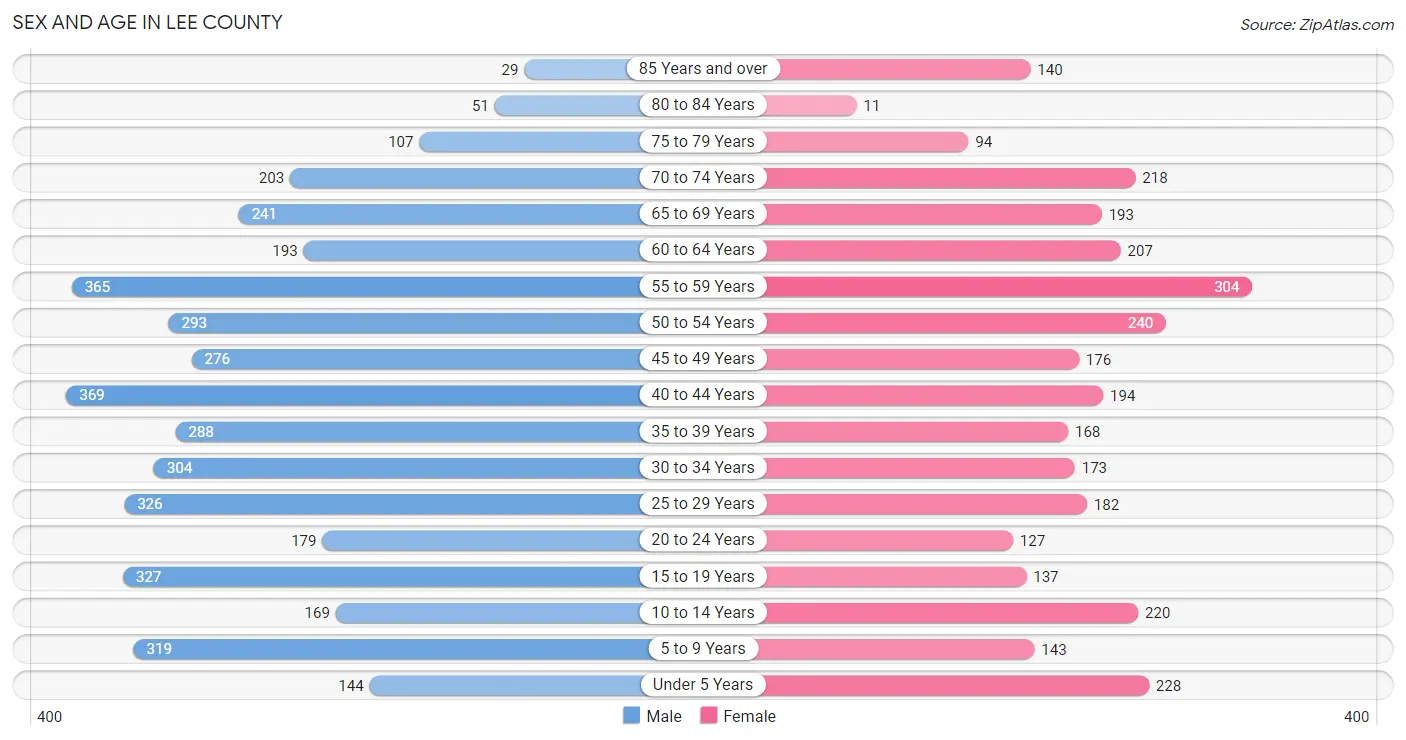
The most populous age groups in Lee County are 40 to 44 Years (369 | 8.8%) for men and 55 to 59 Years (304 | 9.6%) for women.
| Age Bracket | Male | Female |
| Under 5 Years | 144 (3.4%) | 228 (7.2%) |
| 5 to 9 Years | 319 (7.6%) | 143 (4.5%) |
| 10 to 14 Years | 169 (4.0%) | 220 (7.0%) |
| 15 to 19 Years | 327 (7.8%) | 137 (4.3%) |
| 20 to 24 Years | 179 (4.3%) | 127 (4.0%) |
| 25 to 29 Years | 326 (7.8%) | 182 (5.8%) |
| 30 to 34 Years | 304 (7.3%) | 173 (5.5%) |
| 35 to 39 Years | 288 (6.9%) | 168 (5.3%) |
| 40 to 44 Years | 369 (8.8%) | 194 (6.1%) |
| 45 to 49 Years | 276 (6.6%) | 176 (5.6%) |
| 50 to 54 Years | 293 (7.0%) | 240 (7.6%) |
| 55 to 59 Years | 365 (8.7%) | 304 (9.6%) |
| 60 to 64 Years | 193 (4.6%) | 207 (6.6%) |
| 65 to 69 Years | 241 (5.8%) | 193 (6.1%) |
| 70 to 74 Years | 203 (4.9%) | 218 (6.9%) |
| 75 to 79 Years | 107 (2.6%) | 94 (3.0%) |
| 80 to 84 Years | 51 (1.2%) | 11 (0.4%) |
| 85 Years and over | 29 (0.7%) | 140 (4.4%) |
| Total | 4,183 (100.0%) | 3,155 (100.0%) |
Families and Households in Lee County
Median Family Size in Lee County
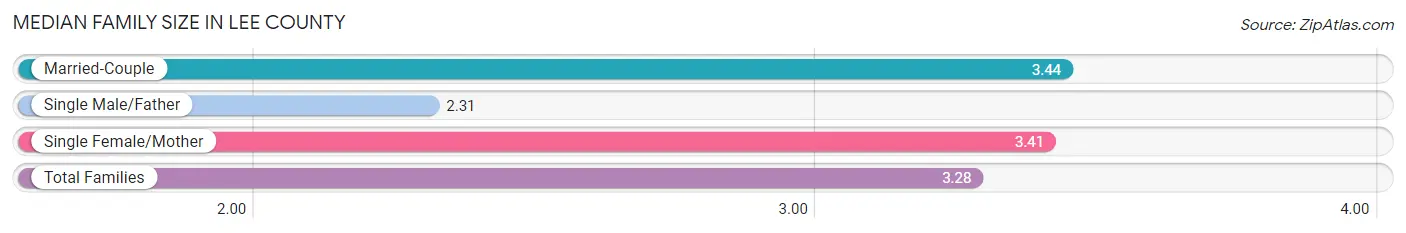
The median family size in Lee County is 3.28 persons per family, with married-couple families (1,045 | 65.4%) accounting for the largest median family size of 3.44 persons per family. On the other hand, single male/father families (217 | 13.6%) represent the smallest median family size with 2.31 persons per family.
| Family Type | # Families | Family Size |
| Married-Couple | 1,045 (65.4%) | 3.44 |
| Single Male/Father | 217 (13.6%) | 2.31 |
| Single Female/Mother | 335 (21.0%) | 3.41 |
| Total Families | 1,597 (100.0%) | 3.28 |
Median Household Size in Lee County
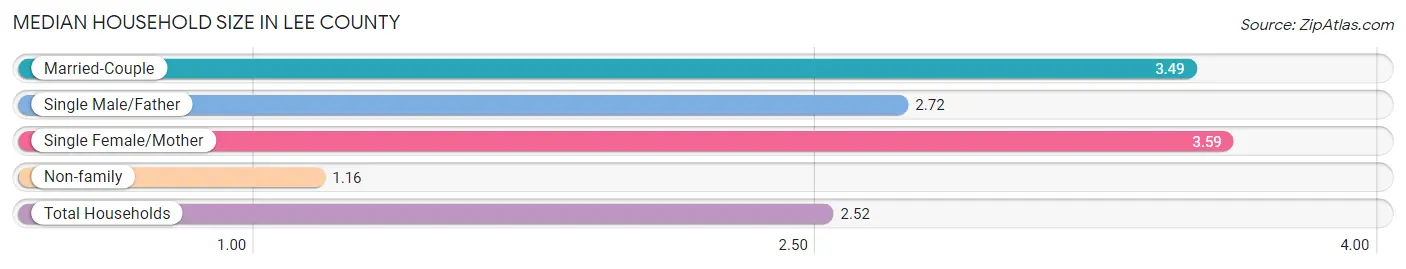
The median household size in Lee County is 2.52 persons per household, with single female/mother households (335 | 12.7%) accounting for the largest median household size of 3.59 persons per household. non-family households (1,040 | 39.4%) represent the smallest median household size with 1.16 persons per household.
| Household Type | # Households | Household Size |
| Married-Couple | 1,045 (39.6%) | 3.49 |
| Single Male/Father | 217 (8.2%) | 2.72 |
| Single Female/Mother | 335 (12.7%) | 3.59 |
| Non-family | 1,040 (39.4%) | 1.16 |
| Total Households | 2,637 (100.0%) | 2.52 |
Household Size by Marriage Status in Lee County
Out of a total of 2,637 households in Lee County, 1,597 (60.6%) are family households, while 1,040 (39.4%) are nonfamily households. The most numerous type of family households are 2-person households, comprising 808, and the most common type of nonfamily households are 1-person households, comprising 894.
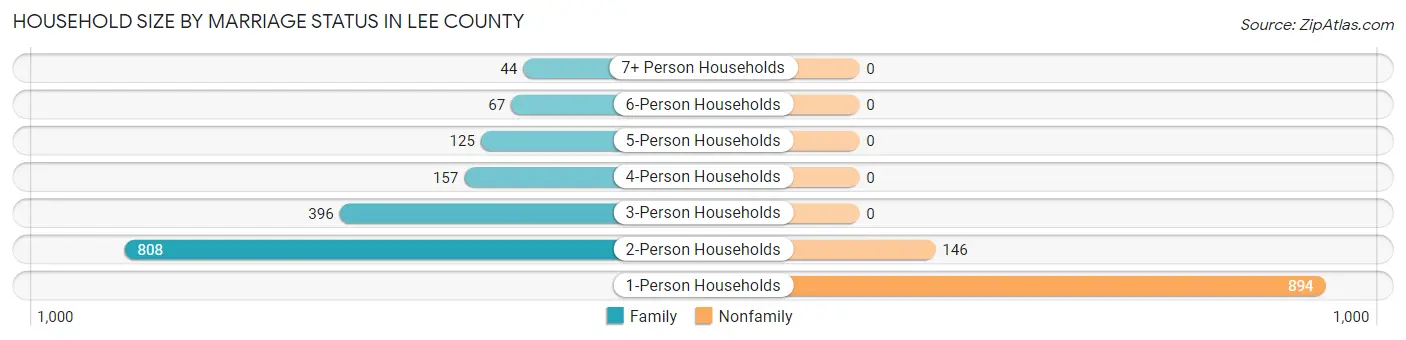
| Household Size | Family Households | Nonfamily Households |
| 1-Person Households | - | 894 (33.9%) |
| 2-Person Households | 808 (30.6%) | 146 (5.5%) |
| 3-Person Households | 396 (15.0%) | 0 (0.0%) |
| 4-Person Households | 157 (5.9%) | 0 (0.0%) |
| 5-Person Households | 125 (4.7%) | 0 (0.0%) |
| 6-Person Households | 67 (2.5%) | 0 (0.0%) |
| 7+ Person Households | 44 (1.7%) | 0 (0.0%) |
| Total | 1,597 (60.6%) | 1,040 (39.4%) |
Female Fertility in Lee County
Fertility by Age in Lee County
Average fertility rate in Lee County is 28.0 births per 1,000 women. Women in the age bracket of 20 to 34 years have the highest fertility rate with 60.0 births per 1,000 women. Women in the age bracket of 20 to 34 years acount for 85.3% of all women with births.
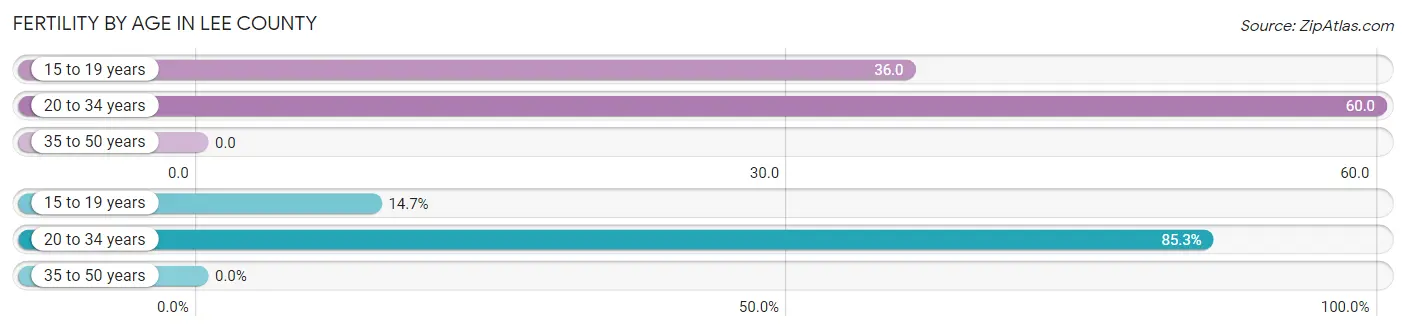
| Age Bracket | Women with Births | Births / 1,000 Women |
| 15 to 19 years | 5 (14.7%) | 36.0 |
| 20 to 34 years | 29 (85.3%) | 60.0 |
| 35 to 50 years | 0 (0.0%) | 0.0 |
| Total | 34 (100.0%) | 28.0 |
Fertility by Age by Marriage Status in Lee County
26.5% of women with births (34) in Lee County are married. The highest percentage of unmarried women with births falls into 15 to 19 years age bracket with 100.0% of them unmarried at the time of birth, while the lowest percentage of unmarried women with births belong to 20 to 34 years age bracket with 69.0% of them unmarried.
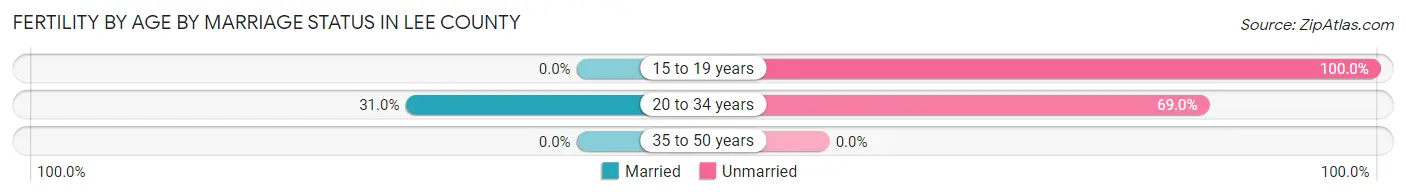
| Age Bracket | Married | Unmarried |
| 15 to 19 years | 0 (0.0%) | 5 (100.0%) |
| 20 to 34 years | 9 (31.0%) | 20 (69.0%) |
| 35 to 50 years | 0 (0.0%) | 0 (0.0%) |
| Total | 9 (26.5%) | 25 (73.5%) |
Fertility by Education in Lee County
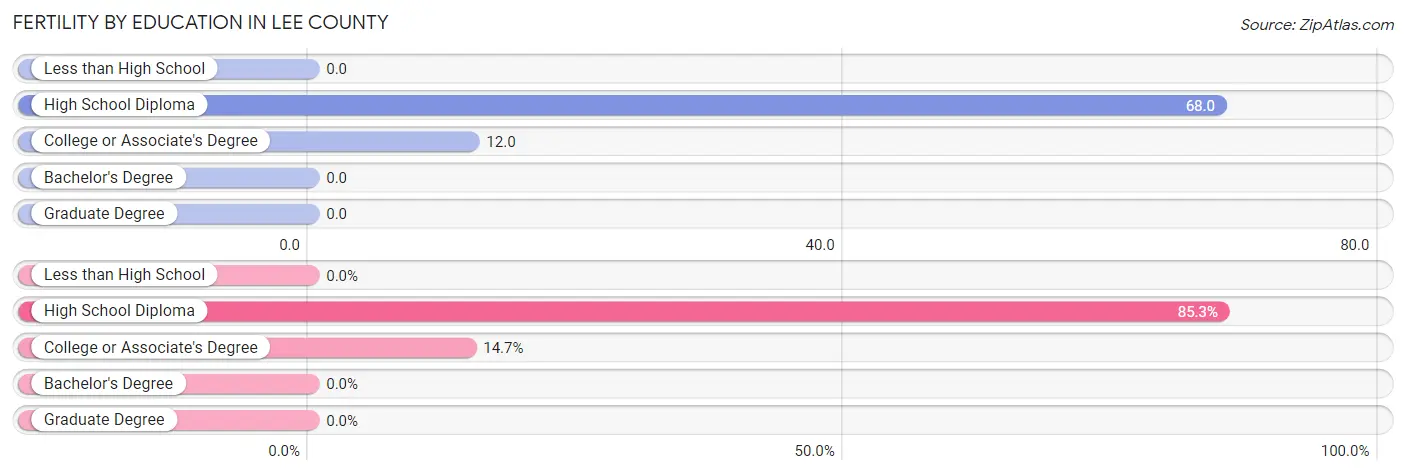
| Educational Attainment | Women with Births | Births / 1,000 Women |
| Less than High School | 0 (0.0%) | 0.0 |
| High School Diploma | 29 (85.3%) | 68.0 |
| College or Associate's Degree | 5 (14.7%) | 12.0 |
| Bachelor's Degree | 0 (0.0%) | 0.0 |
| Graduate Degree | 0 (0.0%) | 0.0 |
| Total | 34 (100.0%) | 28.0 |
Fertility by Education by Marriage Status in Lee County
73.5% of women with births in Lee County are unmarried. Women with the educational attainment of high school diploma are most likely to be married with 31.0% of them married at childbirth, while women with the educational attainment of college or associate's degree are least likely to be married with 100.0% of them unmarried at childbirth.
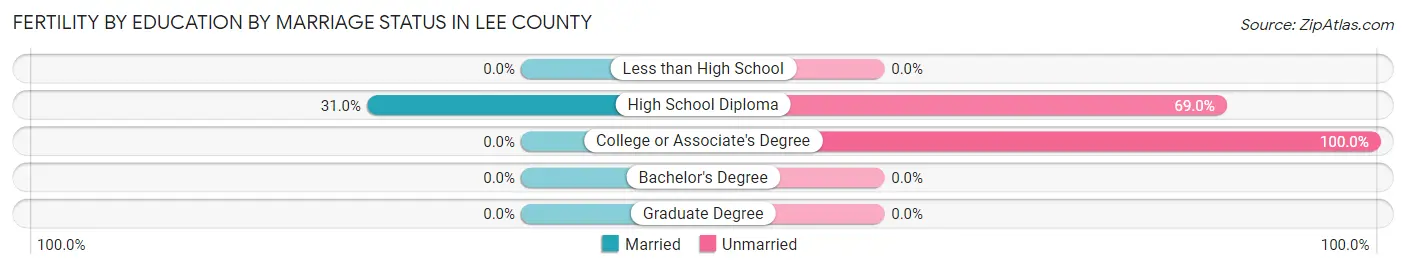
| Educational Attainment | Married | Unmarried |
| Less than High School | 0 (0.0%) | 0 (0.0%) |
| High School Diploma | 9 (31.0%) | 20 (69.0%) |
| College or Associate's Degree | 0 (0.0%) | 5 (100.0%) |
| Bachelor's Degree | 0 (0.0%) | 0 (0.0%) |
| Graduate Degree | 0 (0.0%) | 0 (0.0%) |
| Total | 9 (26.5%) | 25 (73.5%) |
Employment Characteristics in Lee County
Employment by Class of Employer in Lee County
Among the 2,232 employed individuals in Lee County, private company employees (1,462 | 65.5%), local government employees (231 | 10.3%), and state government employees (187 | 8.4%) make up the most common classes of employment.
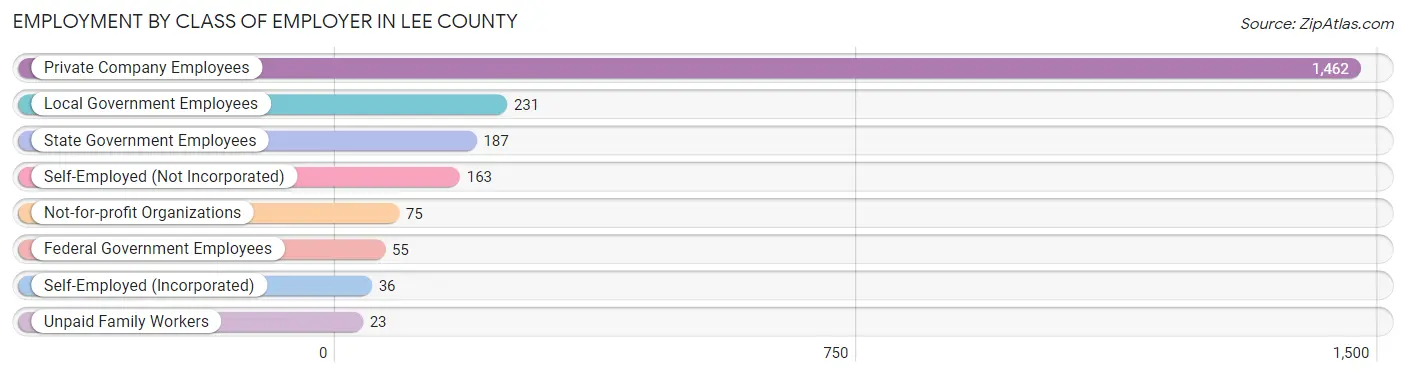
| Employer Class | # Employees | % Employees |
| Private Company Employees | 1,462 | 65.5% |
| Self-Employed (Incorporated) | 36 | 1.6% |
| Self-Employed (Not Incorporated) | 163 | 7.3% |
| Not-for-profit Organizations | 75 | 3.4% |
| Local Government Employees | 231 | 10.3% |
| State Government Employees | 187 | 8.4% |
| Federal Government Employees | 55 | 2.5% |
| Unpaid Family Workers | 23 | 1.0% |
| Total | 2,232 | 100.0% |
Employment Status by Age in Lee County
According to the labor force statistics for Lee County, out of the total population over 16 years of age (6,008), 41.6% or 2,499 individuals are in the labor force, with 8.1% or 202 of them unemployed. The age group with the highest labor force participation rate is 55 to 59 years, with 64.7% or 433 individuals in the labor force. Within the labor force, the 16 to 19 years age range has the highest percentage of unemployed individuals, with 17.9% or 25 of them being unemployed.
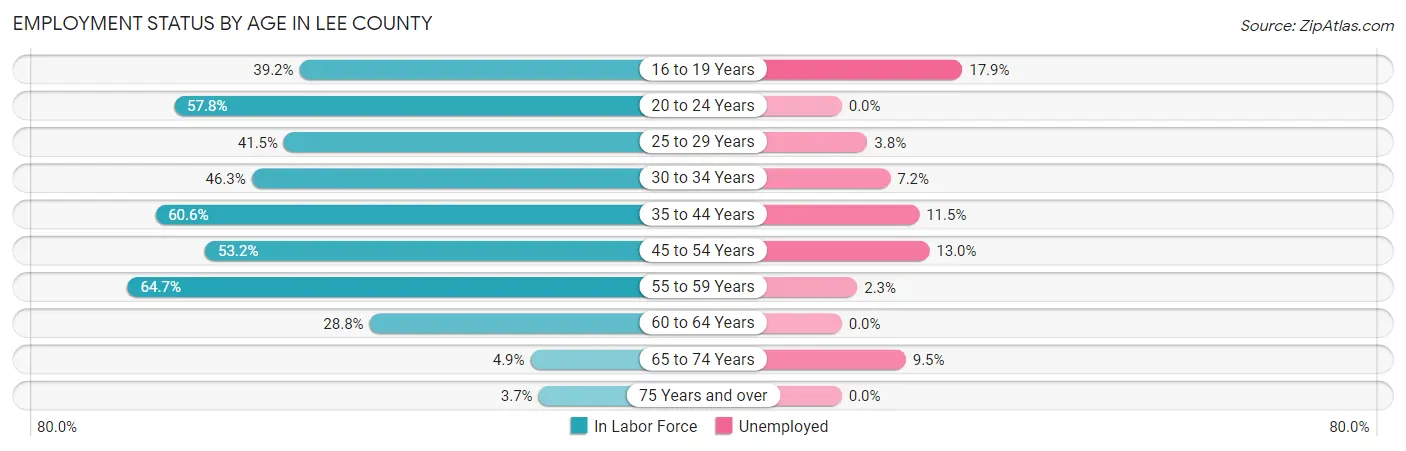
| Age Bracket | In Labor Force | Unemployed |
| 16 to 19 Years | 140 (39.2%) | 25 (17.9%) |
| 20 to 24 Years | 177 (57.8%) | 0 (0.0%) |
| 25 to 29 Years | 211 (41.5%) | 8 (3.8%) |
| 30 to 34 Years | 221 (46.3%) | 16 (7.2%) |
| 35 to 44 Years | 618 (60.6%) | 71 (11.5%) |
| 45 to 54 Years | 524 (53.2%) | 68 (13.0%) |
| 55 to 59 Years | 433 (64.7%) | 10 (2.3%) |
| 60 to 64 Years | 115 (28.8%) | 0 (0.0%) |
| 65 to 74 Years | 42 (4.9%) | 4 (9.5%) |
| 75 Years and over | 16 (3.7%) | 0 (0.0%) |
| Total | 2,499 (41.6%) | 202 (8.1%) |
Employment Status by Educational Attainment in Lee County
According to labor force statistics for Lee County, 52.3% of individuals (2,122) out of the total population between 25 and 64 years of age (4,058) are in the labor force, with 8.1% or 172 of them being unemployed. The group with the highest labor force participation rate are those with the educational attainment of bachelor's degree or higher, with 97.0% or 319 individuals in the labor force. Within the labor force, individuals with less than high school education have the highest percentage of unemployment, with 16.8% or 32 of them being unemployed.
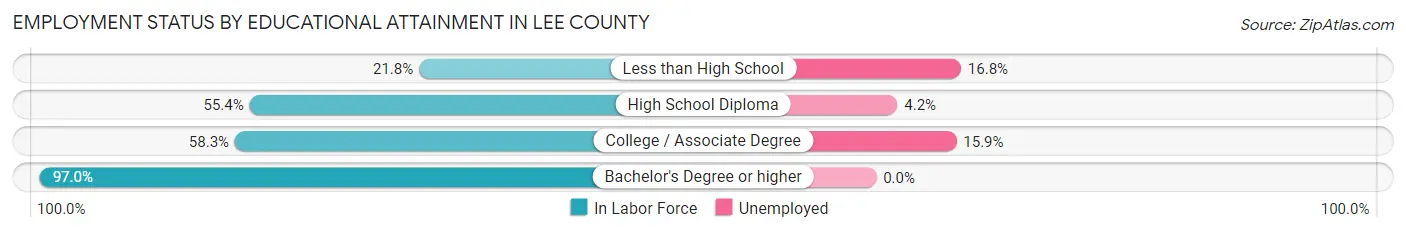
| Educational Attainment | In Labor Force | Unemployed |
| Less than High School | 190 (21.8%) | 147 (16.8%) |
| High School Diploma | 982 (55.4%) | 74 (4.2%) |
| College / Associate Degree | 632 (58.3%) | 172 (15.9%) |
| Bachelor's Degree or higher | 319 (97.0%) | 0 (0.0%) |
| Total | 2,122 (52.3%) | 329 (8.1%) |
Employment Occupations by Sex in Lee County
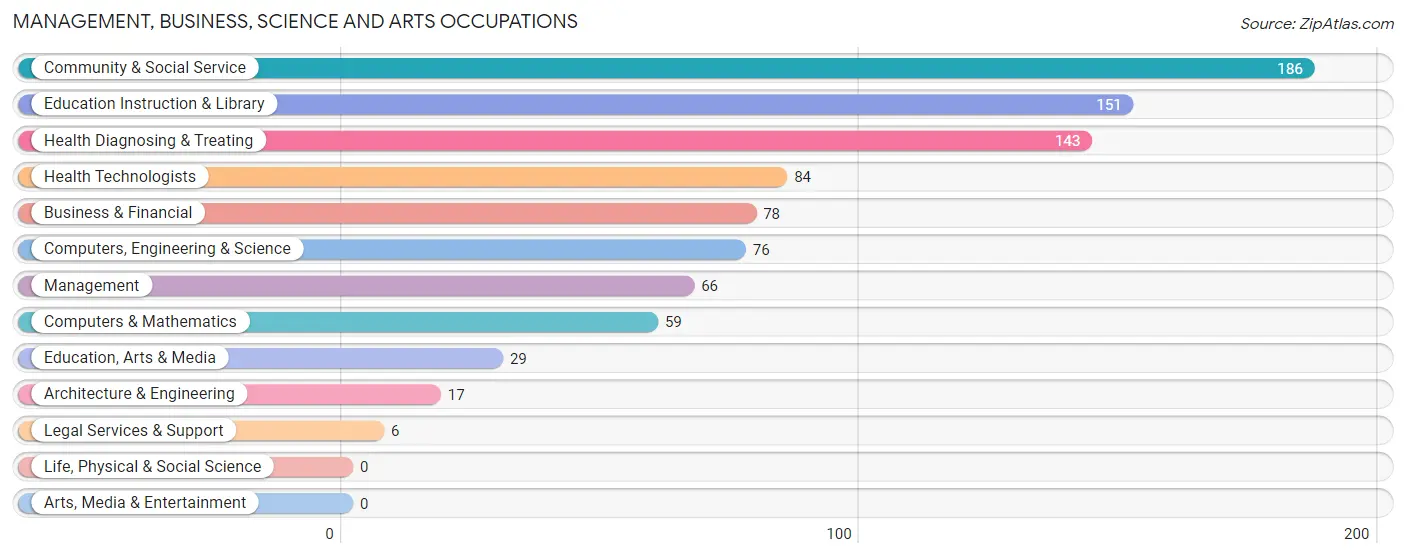
Management, Business, Science and Arts Occupations
The most common Management, Business, Science and Arts occupations in Lee County are Community & Social Service (186 | 8.1%), Education Instruction & Library (151 | 6.6%), Health Diagnosing & Treating (143 | 6.3%), Health Technologists (84 | 3.7%), and Business & Financial (78 | 3.4%).
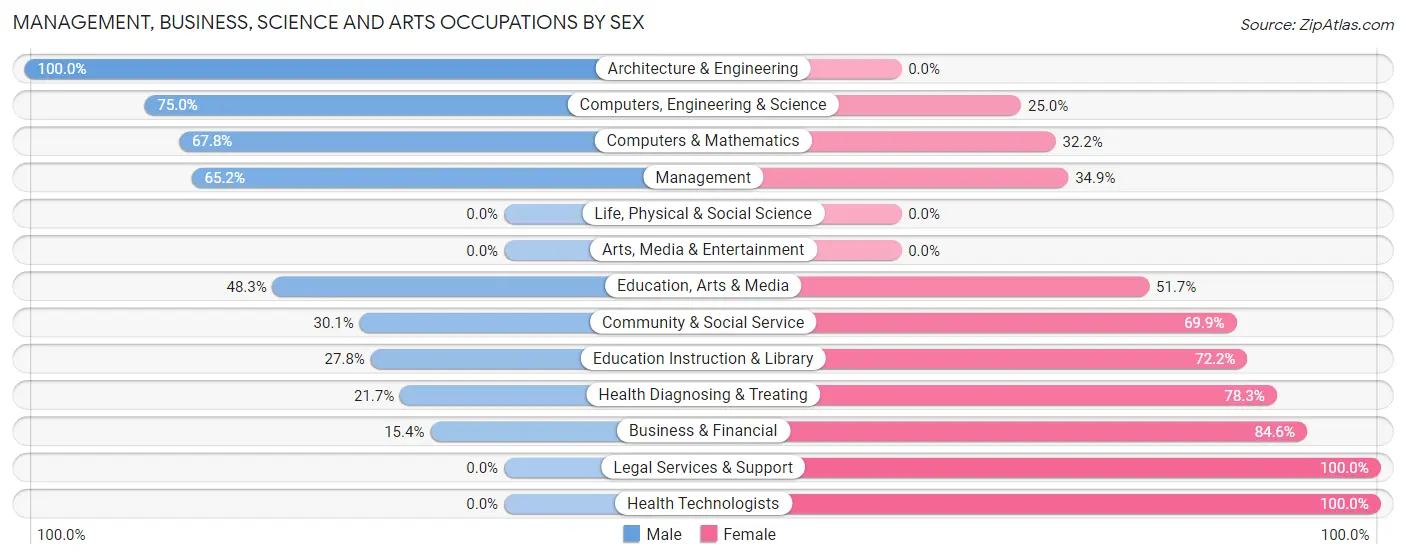
Management, Business, Science and Arts Occupations by Sex
Within the Management, Business, Science and Arts occupations in Lee County, the most male-oriented occupations are Architecture & Engineering (100.0%), Computers, Engineering & Science (75.0%), and Computers & Mathematics (67.8%), while the most female-oriented occupations are Legal Services & Support (100.0%), Health Technologists (100.0%), and Business & Financial (84.6%).
| Occupation | Male | Female |
| Management | 43 (65.1%) | 23 (34.8%) |
| Business & Financial | 12 (15.4%) | 66 (84.6%) |
| Computers, Engineering & Science | 57 (75.0%) | 19 (25.0%) |
| Computers & Mathematics | 40 (67.8%) | 19 (32.2%) |
| Architecture & Engineering | 17 (100.0%) | 0 (0.0%) |
| Life, Physical & Social Science | 0 (0.0%) | 0 (0.0%) |
| Community & Social Service | 56 (30.1%) | 130 (69.9%) |
| Education, Arts & Media | 14 (48.3%) | 15 (51.7%) |
| Legal Services & Support | 0 (0.0%) | 6 (100.0%) |
| Education Instruction & Library | 42 (27.8%) | 109 (72.2%) |
| Arts, Media & Entertainment | 0 (0.0%) | 0 (0.0%) |
| Health Diagnosing & Treating | 31 (21.7%) | 112 (78.3%) |
| Health Technologists | 0 (0.0%) | 84 (100.0%) |
| Total (Category) | 199 (36.2%) | 350 (63.7%) |
| Total (Overall) | 1,437 (62.9%) | 849 (37.1%) |
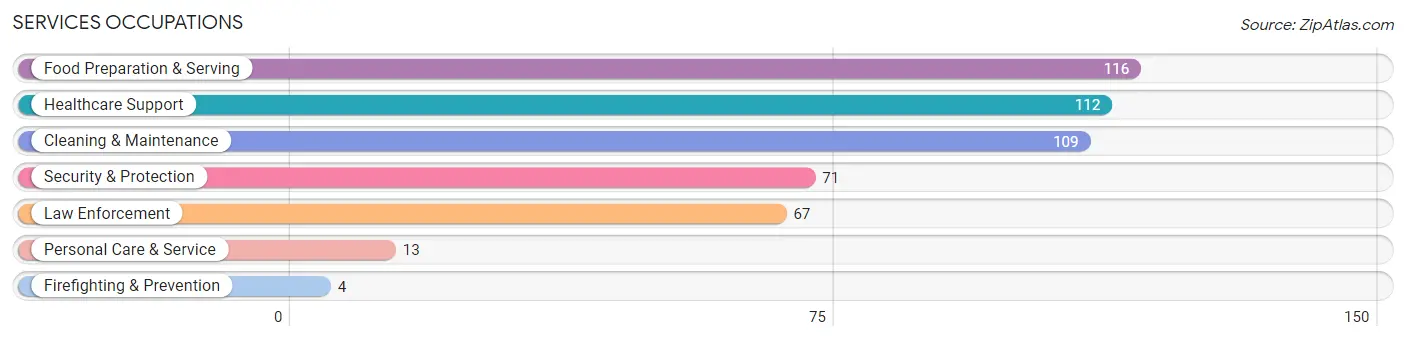
Services Occupations
The most common Services occupations in Lee County are Food Preparation & Serving (116 | 5.1%), Healthcare Support (112 | 4.9%), Cleaning & Maintenance (109 | 4.8%), Security & Protection (71 | 3.1%), and Law Enforcement (67 | 2.9%).
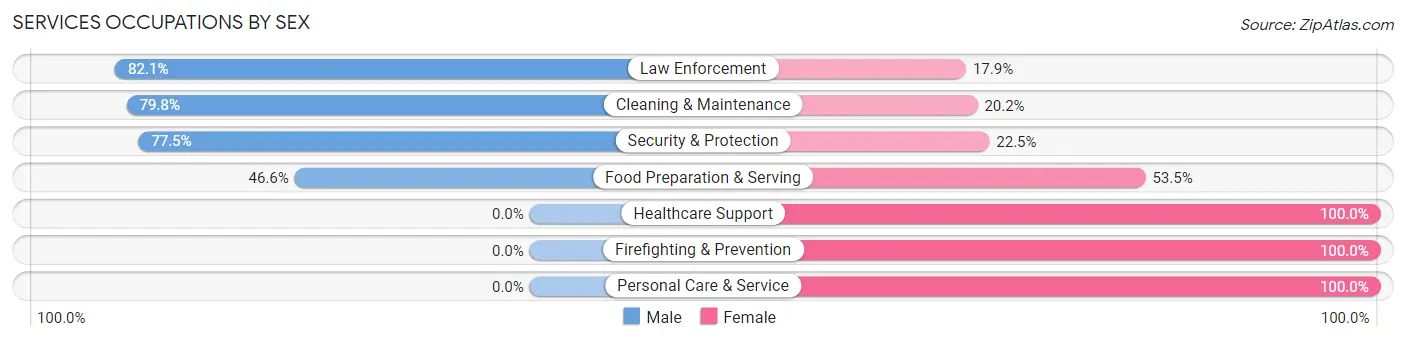
Services Occupations by Sex
Within the Services occupations in Lee County, the most male-oriented occupations are Law Enforcement (82.1%), Cleaning & Maintenance (79.8%), and Security & Protection (77.5%), while the most female-oriented occupations are Healthcare Support (100.0%), Firefighting & Prevention (100.0%), and Personal Care & Service (100.0%).
| Occupation | Male | Female |
| Healthcare Support | 0 (0.0%) | 112 (100.0%) |
| Security & Protection | 55 (77.5%) | 16 (22.5%) |
| Firefighting & Prevention | 0 (0.0%) | 4 (100.0%) |
| Law Enforcement | 55 (82.1%) | 12 (17.9%) |
| Food Preparation & Serving | 54 (46.6%) | 62 (53.4%) |
| Cleaning & Maintenance | 87 (79.8%) | 22 (20.2%) |
| Personal Care & Service | 0 (0.0%) | 13 (100.0%) |
| Total (Category) | 196 (46.6%) | 225 (53.4%) |
| Total (Overall) | 1,437 (62.9%) | 849 (37.1%) |
Sales and Office Occupations
The most common Sales and Office occupations in Lee County are Sales & Related (215 | 9.4%), and Office & Administration (204 | 8.9%).
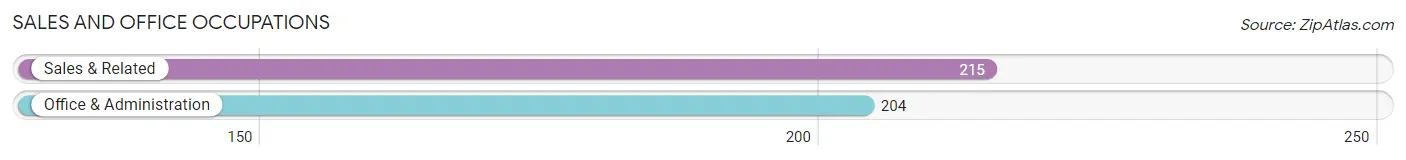
Sales and Office Occupations by Sex
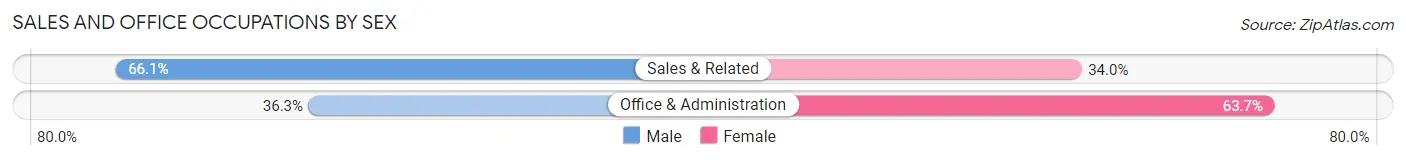
| Occupation | Male | Female |
| Sales & Related | 142 (66.0%) | 73 (34.0%) |
| Office & Administration | 74 (36.3%) | 130 (63.7%) |
| Total (Category) | 216 (51.5%) | 203 (48.4%) |
| Total (Overall) | 1,437 (62.9%) | 849 (37.1%) |
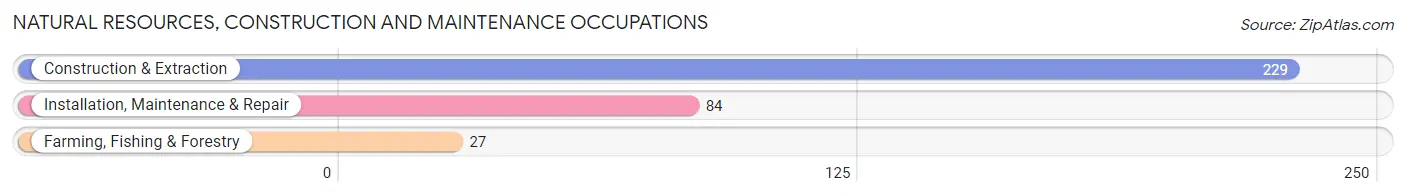
Natural Resources, Construction and Maintenance Occupations
The most common Natural Resources, Construction and Maintenance occupations in Lee County are Construction & Extraction (229 | 10.0%), Installation, Maintenance & Repair (84 | 3.7%), and Farming, Fishing & Forestry (27 | 1.2%).
Natural Resources, Construction and Maintenance Occupations by Sex
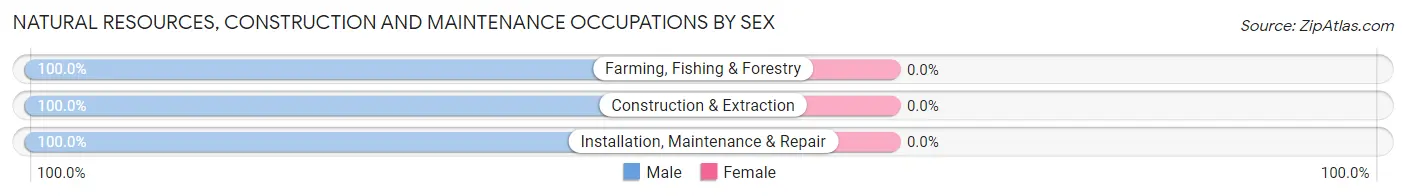
| Occupation | Male | Female |
| Farming, Fishing & Forestry | 27 (100.0%) | 0 (0.0%) |
| Construction & Extraction | 229 (100.0%) | 0 (0.0%) |
| Installation, Maintenance & Repair | 84 (100.0%) | 0 (0.0%) |
| Total (Category) | 340 (100.0%) | 0 (0.0%) |
| Total (Overall) | 1,437 (62.9%) | 849 (37.1%) |
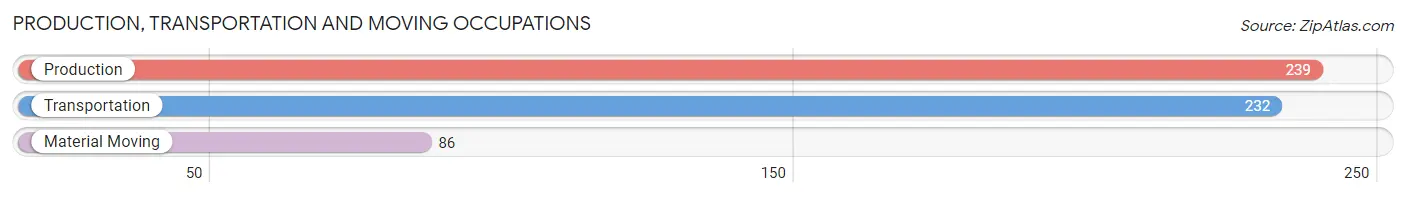
Production, Transportation and Moving Occupations
The most common Production, Transportation and Moving occupations in Lee County are Production (239 | 10.4%), Transportation (232 | 10.2%), and Material Moving (86 | 3.8%).
Production, Transportation and Moving Occupations by Sex
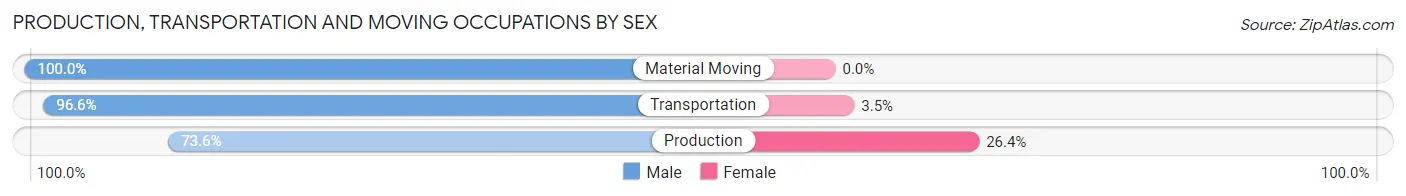
| Occupation | Male | Female |
| Production | 176 (73.6%) | 63 (26.4%) |
| Transportation | 224 (96.6%) | 8 (3.5%) |
| Material Moving | 86 (100.0%) | 0 (0.0%) |
| Total (Category) | 486 (87.3%) | 71 (12.8%) |
| Total (Overall) | 1,437 (62.9%) | 849 (37.1%) |
Employment Industries by Sex in Lee County
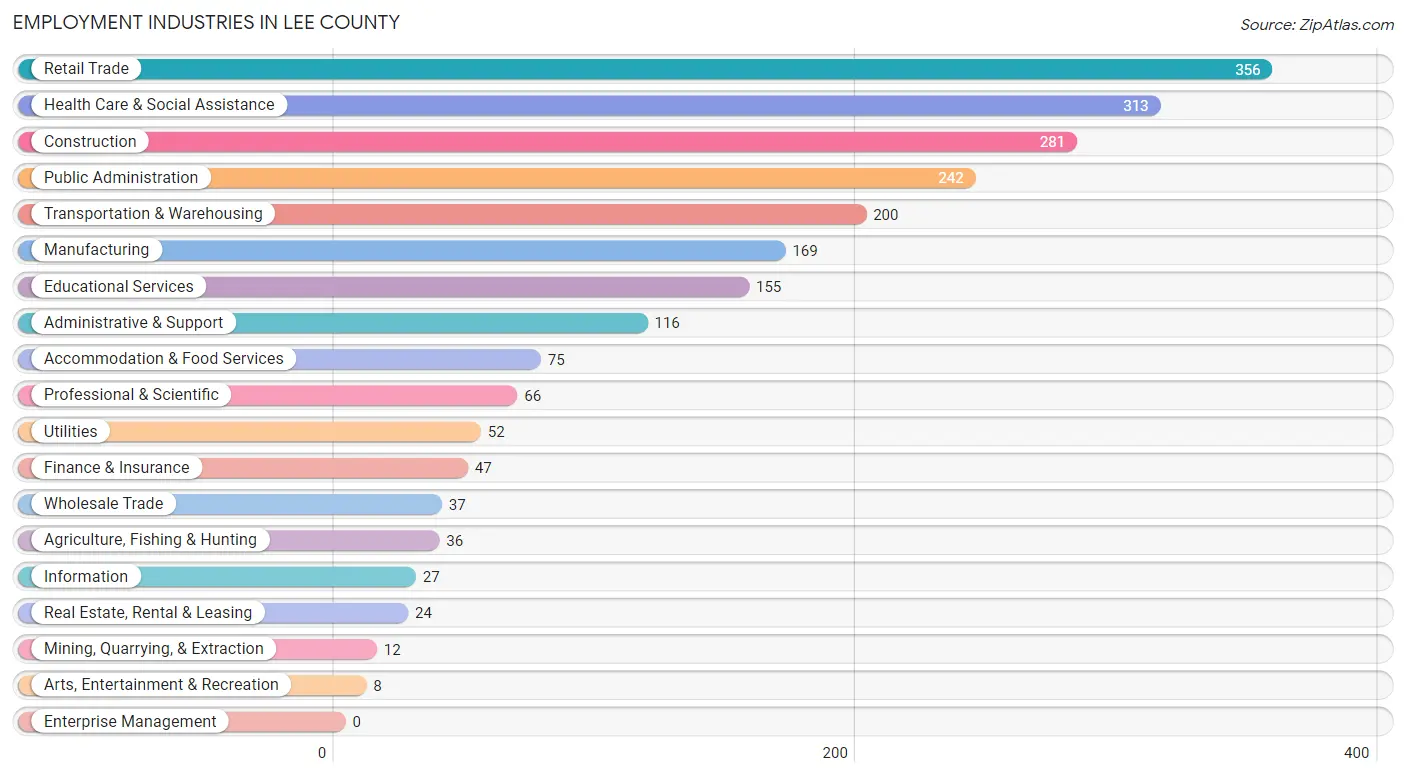
Employment Industries in Lee County
The major employment industries in Lee County include Retail Trade (356 | 15.6%), Health Care & Social Assistance (313 | 13.7%), Construction (281 | 12.3%), Public Administration (242 | 10.6%), and Transportation & Warehousing (200 | 8.7%).
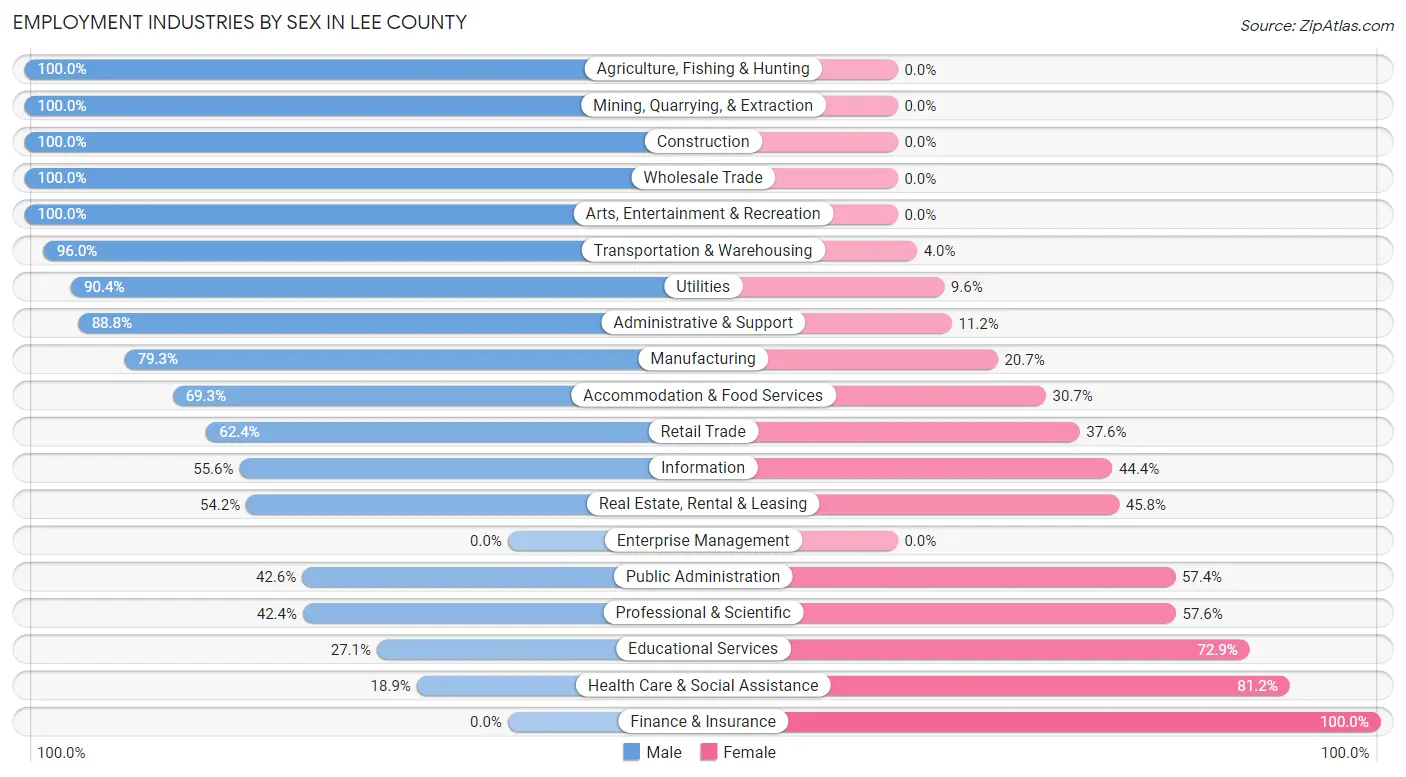
Employment Industries by Sex in Lee County
The Lee County industries that see more men than women are Agriculture, Fishing & Hunting (100.0%), Mining, Quarrying, & Extraction (100.0%), and Construction (100.0%), whereas the industries that tend to have a higher number of women are Finance & Insurance (100.0%), Health Care & Social Assistance (81.1%), and Educational Services (72.9%).
| Industry | Male | Female |
| Agriculture, Fishing & Hunting | 36 (100.0%) | 0 (0.0%) |
| Mining, Quarrying, & Extraction | 12 (100.0%) | 0 (0.0%) |
| Construction | 281 (100.0%) | 0 (0.0%) |
| Manufacturing | 134 (79.3%) | 35 (20.7%) |
| Wholesale Trade | 37 (100.0%) | 0 (0.0%) |
| Retail Trade | 222 (62.4%) | 134 (37.6%) |
| Transportation & Warehousing | 192 (96.0%) | 8 (4.0%) |
| Utilities | 47 (90.4%) | 5 (9.6%) |
| Information | 15 (55.6%) | 12 (44.4%) |
| Finance & Insurance | 0 (0.0%) | 47 (100.0%) |
| Real Estate, Rental & Leasing | 13 (54.2%) | 11 (45.8%) |
| Professional & Scientific | 28 (42.4%) | 38 (57.6%) |
| Enterprise Management | 0 (0.0%) | 0 (0.0%) |
| Administrative & Support | 103 (88.8%) | 13 (11.2%) |
| Educational Services | 42 (27.1%) | 113 (72.9%) |
| Health Care & Social Assistance | 59 (18.9%) | 254 (81.1%) |
| Arts, Entertainment & Recreation | 8 (100.0%) | 0 (0.0%) |
| Accommodation & Food Services | 52 (69.3%) | 23 (30.7%) |
| Public Administration | 103 (42.6%) | 139 (57.4%) |
| Total | 1,437 (62.9%) | 849 (37.1%) |
Education in Lee County
School Enrollment in Lee County
The most common levels of schooling among the 1,424 students in Lee County are high school (412 | 28.9%), elementary school (358 | 25.1%), and middle school (262 | 18.4%).
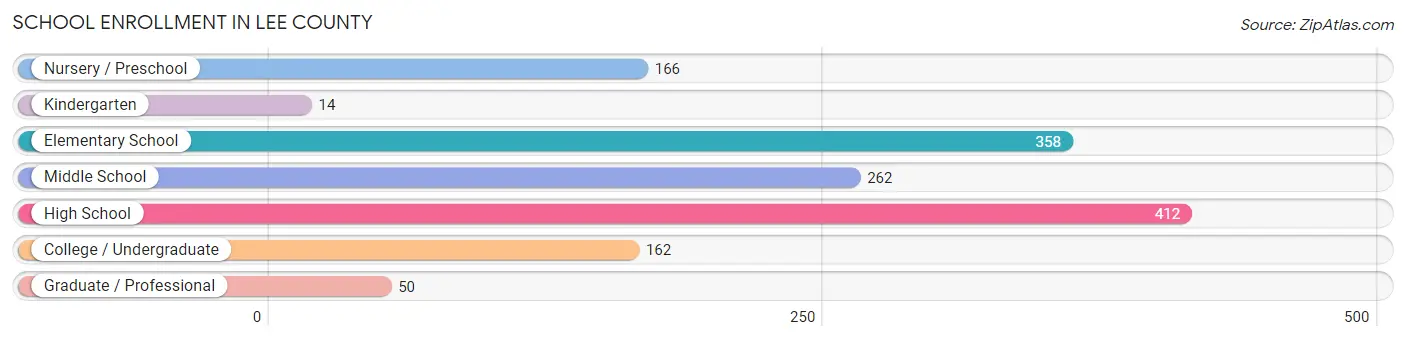
| School Level | # Students | % Students |
| Nursery / Preschool | 166 | 11.7% |
| Kindergarten | 14 | 1.0% |
| Elementary School | 358 | 25.1% |
| Middle School | 262 | 18.4% |
| High School | 412 | 28.9% |
| College / Undergraduate | 162 | 11.4% |
| Graduate / Professional | 50 | 3.5% |
| Total | 1,424 | 100.0% |
School Enrollment by Age by Funding Source in Lee County
Out of a total of 1,424 students who are enrolled in schools in Lee County, 246 (17.3%) attend a private institution, while the remaining 1,178 (82.7%) are enrolled in public schools. The age group of 35 years and over has the highest likelihood of being enrolled in private schools, with 38 (41.3% in the age bracket) enrolled. Conversely, the age group of 3 to 4 year olds has the lowest likelihood of being enrolled in a private school, with 57 (98.3% in the age bracket) attending a public institution.
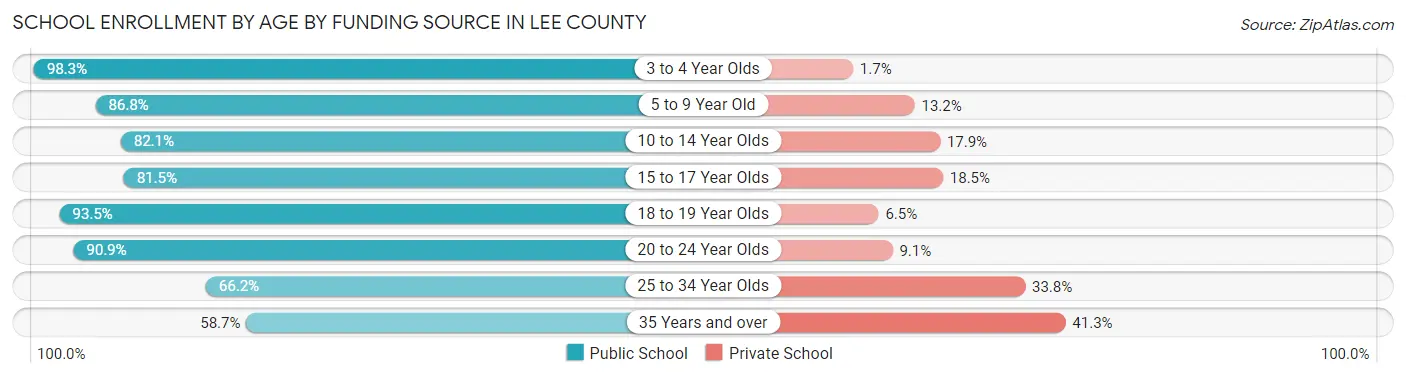
| Age Bracket | Public School | Private School |
| 3 to 4 Year Olds | 57 (98.3%) | 1 (1.7%) |
| 5 to 9 Year Old | 401 (86.8%) | 61 (13.2%) |
| 10 to 14 Year Olds | 302 (82.1%) | 66 (17.9%) |
| 15 to 17 Year Olds | 203 (81.5%) | 46 (18.5%) |
| 18 to 19 Year Olds | 72 (93.5%) | 5 (6.5%) |
| 20 to 24 Year Olds | 40 (90.9%) | 4 (9.1%) |
| 25 to 34 Year Olds | 49 (66.2%) | 25 (33.8%) |
| 35 Years and over | 54 (58.7%) | 38 (41.3%) |
| Total | 1,178 (82.7%) | 246 (17.3%) |
Educational Attainment by Field of Study in Lee County
Arts & humanities (87 | 20.9%), computers & mathematics (58 | 13.9%), education (56 | 13.5%), science & technology (48 | 11.5%), and business (29 | 7.0%) are the most common fields of study among 416 individuals in Lee County who have obtained a bachelor's degree or higher.
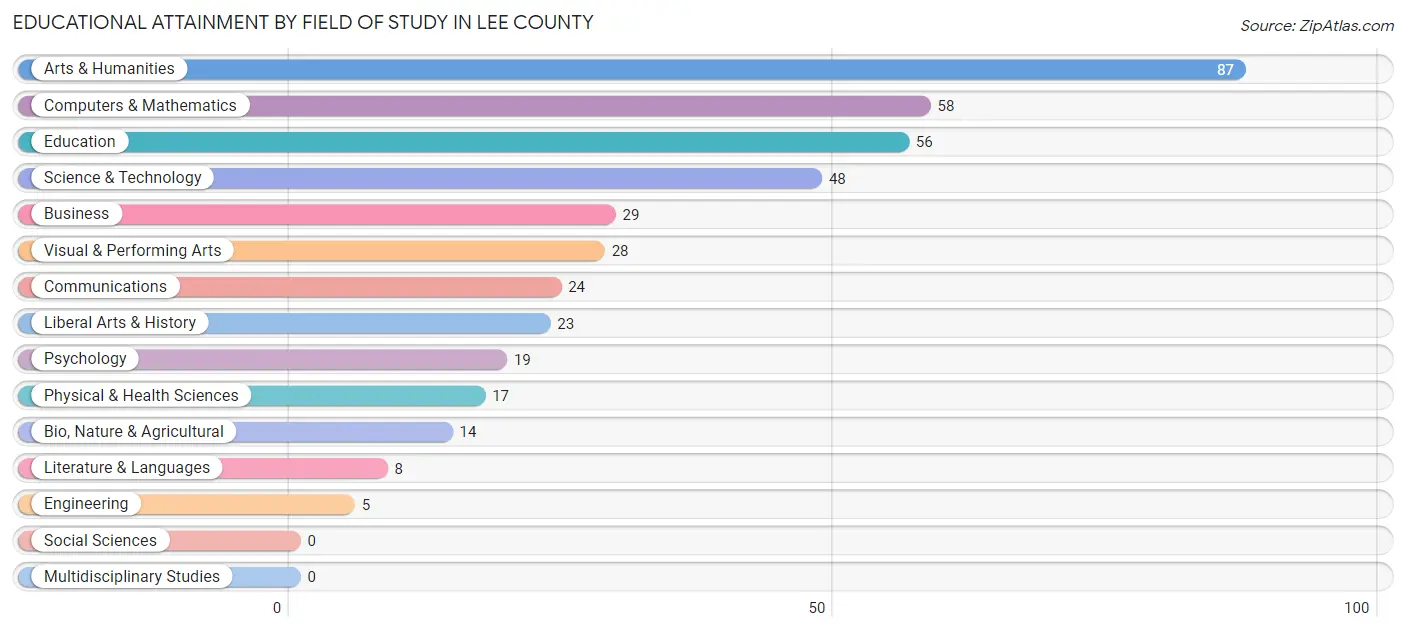
| Field of Study | # Graduates | % Graduates |
| Computers & Mathematics | 58 | 13.9% |
| Bio, Nature & Agricultural | 14 | 3.4% |
| Physical & Health Sciences | 17 | 4.1% |
| Psychology | 19 | 4.6% |
| Social Sciences | 0 | 0.0% |
| Engineering | 5 | 1.2% |
| Multidisciplinary Studies | 0 | 0.0% |
| Science & Technology | 48 | 11.5% |
| Business | 29 | 7.0% |
| Education | 56 | 13.5% |
| Literature & Languages | 8 | 1.9% |
| Liberal Arts & History | 23 | 5.5% |
| Visual & Performing Arts | 28 | 6.7% |
| Communications | 24 | 5.8% |
| Arts & Humanities | 87 | 20.9% |
| Total | 416 | 100.0% |
Transportation & Commute in Lee County
Vehicle Availability by Sex in Lee County
The most prevalent vehicle ownership categories in Lee County are males with 2 vehicles (448, accounting for 32.3%) and females with 2 vehicles (214, making up 53.3%).
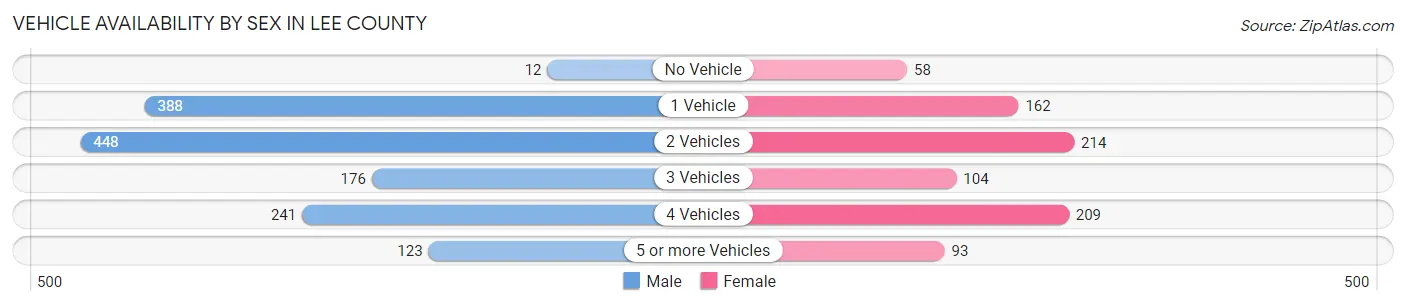
| Vehicles Available | Male | Female |
| No Vehicle | 12 (0.9%) | 58 (6.9%) |
| 1 Vehicle | 388 (28.0%) | 162 (19.3%) |
| 2 Vehicles | 448 (32.3%) | 214 (25.5%) |
| 3 Vehicles | 176 (12.7%) | 104 (12.4%) |
| 4 Vehicles | 241 (17.4%) | 209 (24.9%) |
| 5 or more Vehicles | 123 (8.9%) | 93 (11.1%) |
| Total | 1,388 (100.0%) | 840 (100.0%) |
Commute Time in Lee County
The most frequently occuring commute durations in Lee County are 5 to 9 minutes (434 commuters, 21.1%), 90 or more minutes (391 commuters, 19.0%), and 20 to 24 minutes (282 commuters, 13.7%).
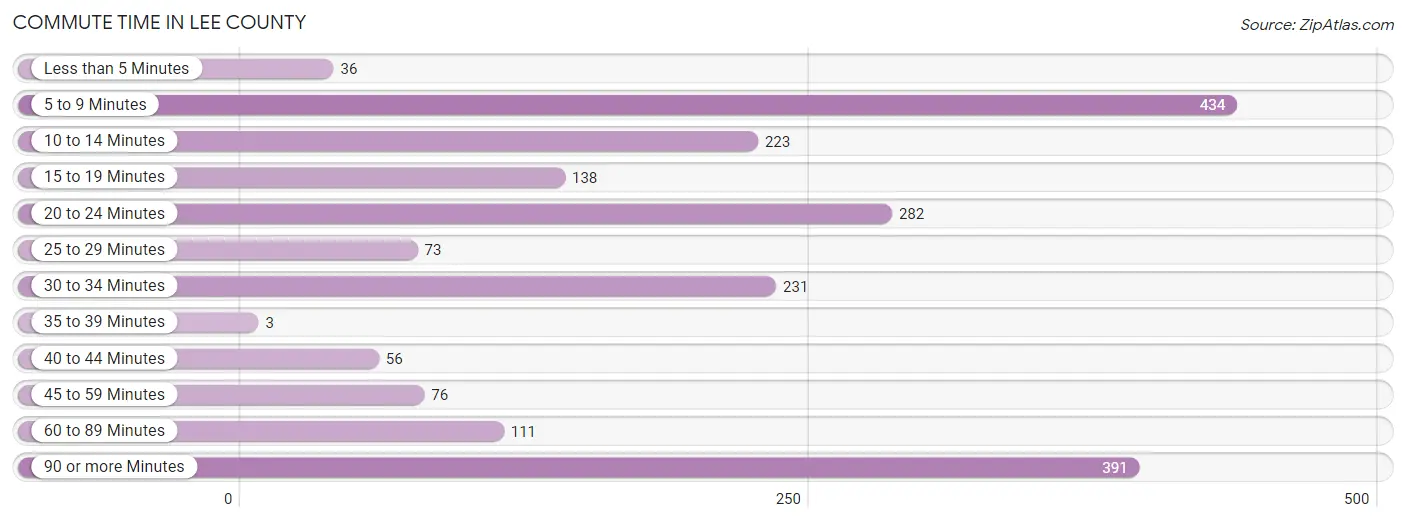
| Commute Time | # Commuters | % Commuters |
| Less than 5 Minutes | 36 | 1.8% |
| 5 to 9 Minutes | 434 | 21.1% |
| 10 to 14 Minutes | 223 | 10.9% |
| 15 to 19 Minutes | 138 | 6.7% |
| 20 to 24 Minutes | 282 | 13.7% |
| 25 to 29 Minutes | 73 | 3.5% |
| 30 to 34 Minutes | 231 | 11.3% |
| 35 to 39 Minutes | 3 | 0.2% |
| 40 to 44 Minutes | 56 | 2.7% |
| 45 to 59 Minutes | 76 | 3.7% |
| 60 to 89 Minutes | 111 | 5.4% |
| 90 or more Minutes | 391 | 19.0% |
Commute Time by Sex in Lee County
The most common commute times in Lee County are 90 or more minutes (338 commuters, 25.3%) for males and 20 to 24 minutes (223 commuters, 31.0%) for females.
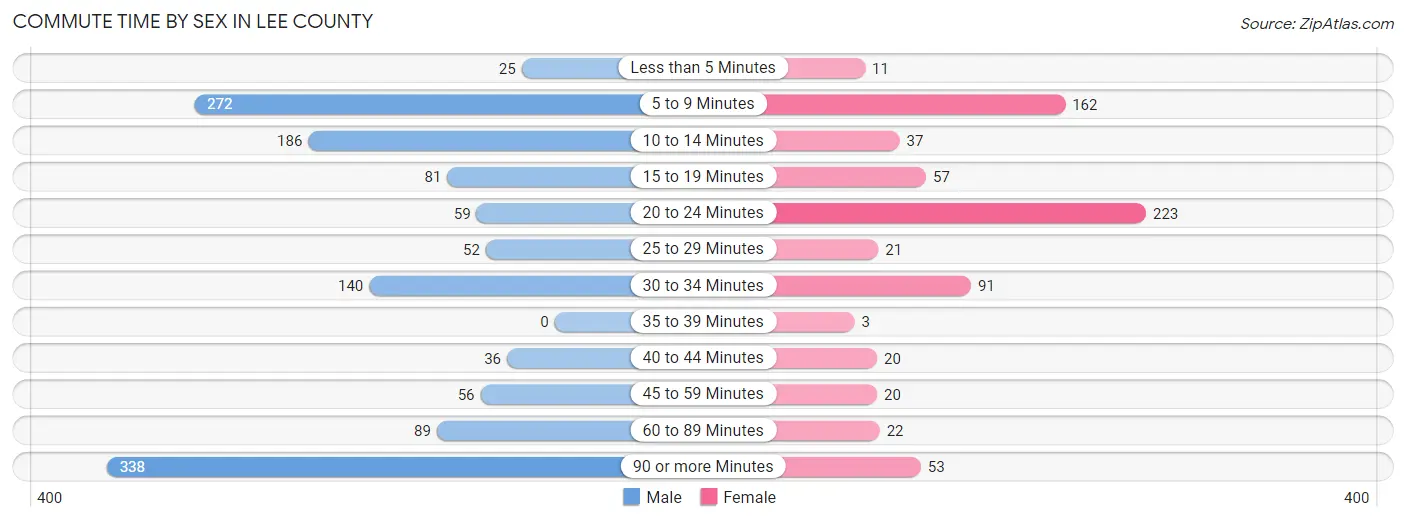
| Commute Time | Male | Female |
| Less than 5 Minutes | 25 (1.9%) | 11 (1.5%) |
| 5 to 9 Minutes | 272 (20.4%) | 162 (22.5%) |
| 10 to 14 Minutes | 186 (13.9%) | 37 (5.1%) |
| 15 to 19 Minutes | 81 (6.1%) | 57 (7.9%) |
| 20 to 24 Minutes | 59 (4.4%) | 223 (31.0%) |
| 25 to 29 Minutes | 52 (3.9%) | 21 (2.9%) |
| 30 to 34 Minutes | 140 (10.5%) | 91 (12.6%) |
| 35 to 39 Minutes | 0 (0.0%) | 3 (0.4%) |
| 40 to 44 Minutes | 36 (2.7%) | 20 (2.8%) |
| 45 to 59 Minutes | 56 (4.2%) | 20 (2.8%) |
| 60 to 89 Minutes | 89 (6.7%) | 22 (3.1%) |
| 90 or more Minutes | 338 (25.3%) | 53 (7.4%) |
Time of Departure to Work by Sex in Lee County
The most frequent times of departure to work in Lee County are 12:00 AM to 4:59 AM (214, 16.0%) for males and 7:30 AM to 7:59 AM (167, 23.2%) for females.
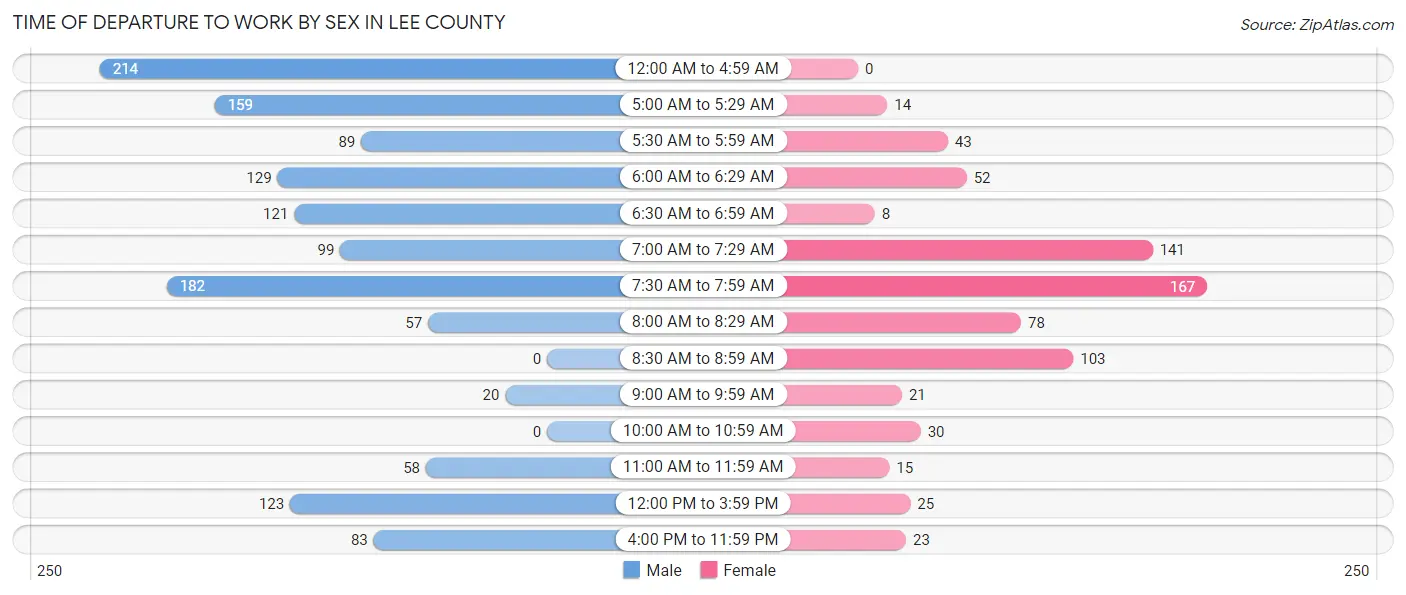
| Time of Departure | Male | Female |
| 12:00 AM to 4:59 AM | 214 (16.0%) | 0 (0.0%) |
| 5:00 AM to 5:29 AM | 159 (11.9%) | 14 (1.9%) |
| 5:30 AM to 5:59 AM | 89 (6.7%) | 43 (6.0%) |
| 6:00 AM to 6:29 AM | 129 (9.7%) | 52 (7.2%) |
| 6:30 AM to 6:59 AM | 121 (9.1%) | 8 (1.1%) |
| 7:00 AM to 7:29 AM | 99 (7.4%) | 141 (19.6%) |
| 7:30 AM to 7:59 AM | 182 (13.6%) | 167 (23.2%) |
| 8:00 AM to 8:29 AM | 57 (4.3%) | 78 (10.8%) |
| 8:30 AM to 8:59 AM | 0 (0.0%) | 103 (14.3%) |
| 9:00 AM to 9:59 AM | 20 (1.5%) | 21 (2.9%) |
| 10:00 AM to 10:59 AM | 0 (0.0%) | 30 (4.2%) |
| 11:00 AM to 11:59 AM | 58 (4.3%) | 15 (2.1%) |
| 12:00 PM to 3:59 PM | 123 (9.2%) | 25 (3.5%) |
| 4:00 PM to 11:59 PM | 83 (6.2%) | 23 (3.2%) |
| Total | 1,334 (100.0%) | 720 (100.0%) |
Housing Occupancy in Lee County
Occupancy by Ownership in Lee County
Of the total 2,637 dwellings in Lee County, owner-occupied units account for 1,835 (69.6%), while renter-occupied units make up 802 (30.4%).
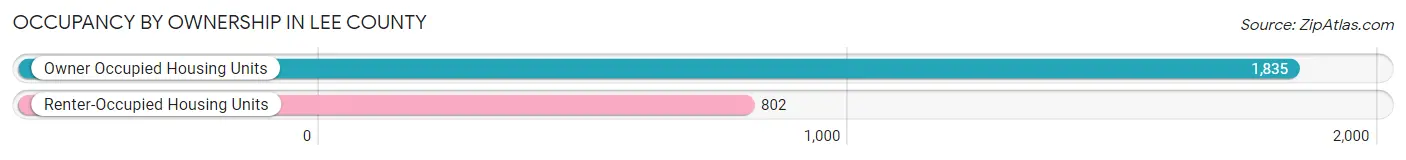
| Occupancy | # Housing Units | % Housing Units |
| Owner Occupied Housing Units | 1,835 | 69.6% |
| Renter-Occupied Housing Units | 802 | 30.4% |
| Total Occupied Housing Units | 2,637 | 100.0% |
Occupancy by Household Size in Lee County

| Household Size | # Housing Units | % Housing Units |
| 1-Person Household | 894 | 33.9% |
| 2-Person Household | 954 | 36.2% |
| 3-Person Household | 396 | 15.0% |
| 4+ Person Household | 393 | 14.9% |
| Total Housing Units | 2,637 | 100.0% |
Occupancy by Ownership by Household Size in Lee County
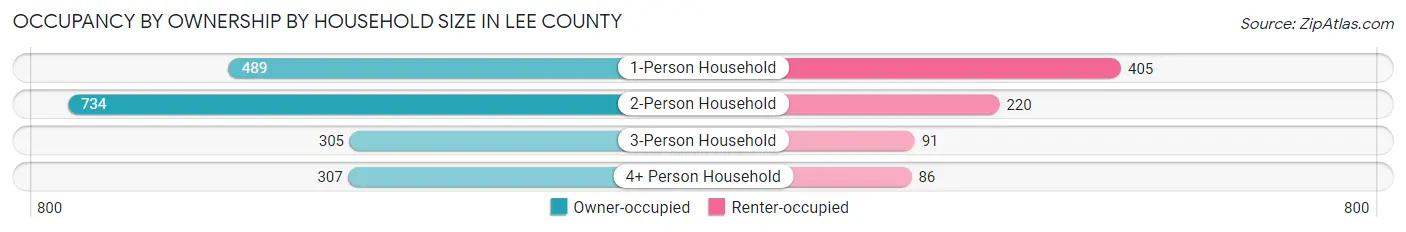
| Household Size | Owner-occupied | Renter-occupied |
| 1-Person Household | 489 (54.7%) | 405 (45.3%) |
| 2-Person Household | 734 (76.9%) | 220 (23.1%) |
| 3-Person Household | 305 (77.0%) | 91 (23.0%) |
| 4+ Person Household | 307 (78.1%) | 86 (21.9%) |
| Total Housing Units | 1,835 (69.6%) | 802 (30.4%) |
Occupancy by Educational Attainment in Lee County
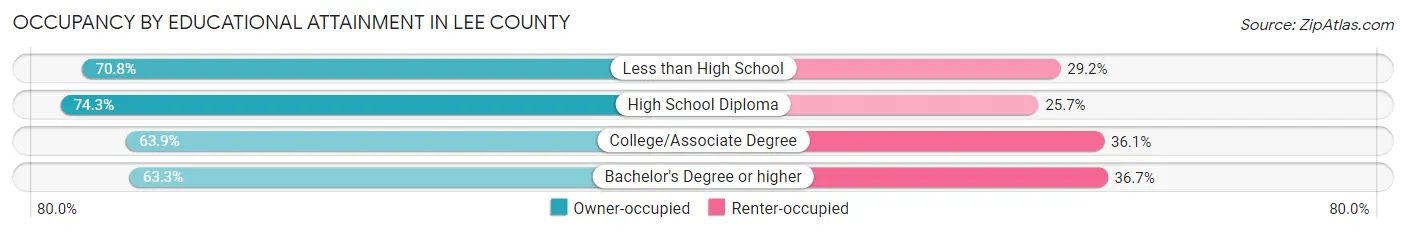
| Household Size | Owner-occupied | Renter-occupied |
| Less than High School | 405 (70.8%) | 167 (29.2%) |
| High School Diploma | 802 (74.3%) | 278 (25.7%) |
| College/Associate Degree | 509 (63.9%) | 288 (36.1%) |
| Bachelor's Degree or higher | 119 (63.3%) | 69 (36.7%) |
Occupancy by Age of Householder in Lee County

| Age Bracket | # Households | % Households |
| Under 35 Years | 305 | 11.6% |
| 35 to 44 Years | 345 | 13.1% |
| 45 to 54 Years | 598 | 22.7% |
| 55 to 64 Years | 552 | 20.9% |
| 65 to 74 Years | 548 | 20.8% |
| 75 to 84 Years | 193 | 7.3% |
| 85 Years and Over | 96 | 3.6% |
| Total | 2,637 | 100.0% |
Housing Finances in Lee County
Median Income by Occupancy in Lee County
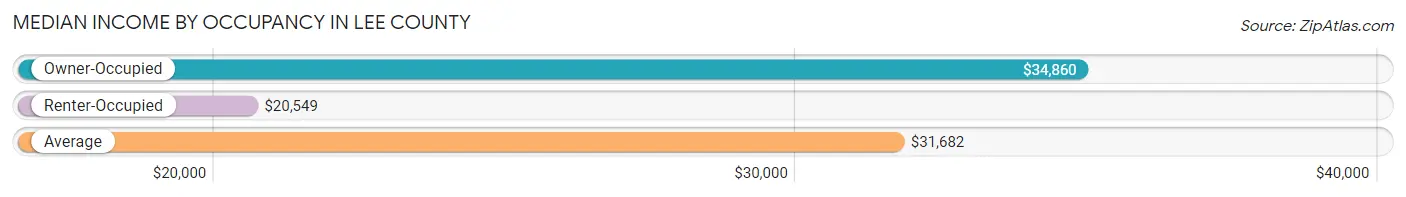
| Occupancy Type | # Households | Median Income |
| Owner-Occupied | 1,835 (69.6%) | $34,860 |
| Renter-Occupied | 802 (30.4%) | $20,549 |
| Average | 2,637 (100.0%) | $31,682 |
Occupancy by Householder Income Bracket in Lee County
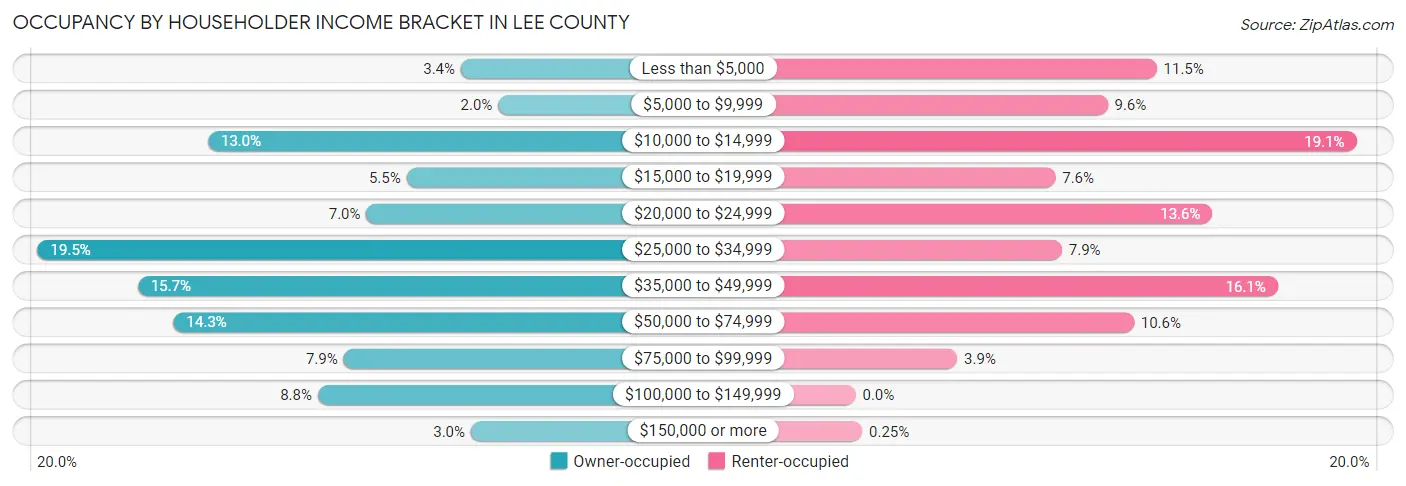
| Income Bracket | Owner-occupied | Renter-occupied |
| Less than $5,000 | 62 (3.4%) | 92 (11.5%) |
| $5,000 to $9,999 | 36 (2.0%) | 77 (9.6%) |
| $10,000 to $14,999 | 239 (13.0%) | 153 (19.1%) |
| $15,000 to $19,999 | 100 (5.4%) | 61 (7.6%) |
| $20,000 to $24,999 | 128 (7.0%) | 109 (13.6%) |
| $25,000 to $34,999 | 358 (19.5%) | 63 (7.9%) |
| $35,000 to $49,999 | 288 (15.7%) | 129 (16.1%) |
| $50,000 to $74,999 | 263 (14.3%) | 85 (10.6%) |
| $75,000 to $99,999 | 144 (7.9%) | 31 (3.9%) |
| $100,000 to $149,999 | 162 (8.8%) | 0 (0.0%) |
| $150,000 or more | 55 (3.0%) | 2 (0.3%) |
| Total | 1,835 (100.0%) | 802 (100.0%) |
Monthly Housing Cost Tiers in Lee County
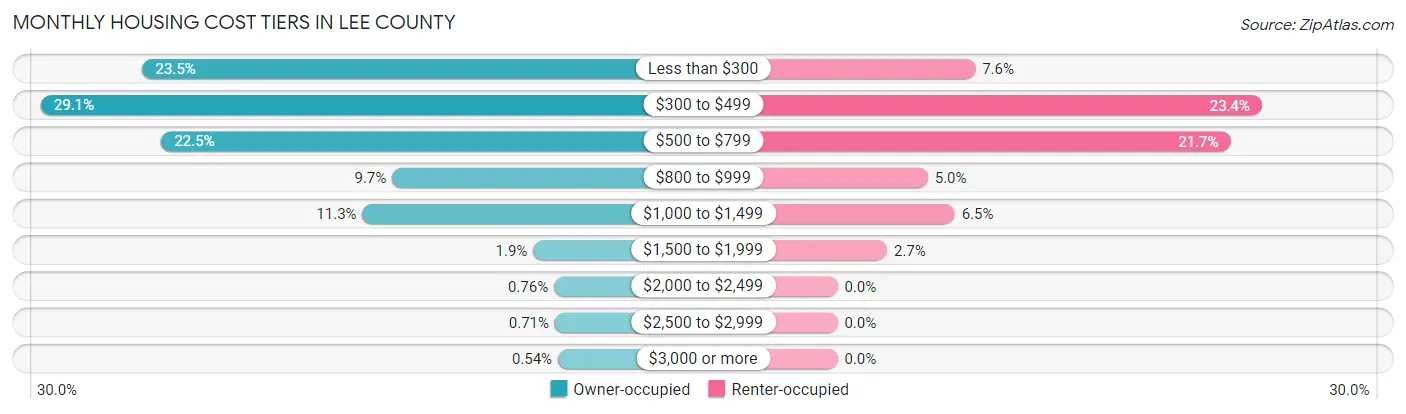
| Monthly Cost | Owner-occupied | Renter-occupied |
| Less than $300 | 431 (23.5%) | 61 (7.6%) |
| $300 to $499 | 534 (29.1%) | 188 (23.4%) |
| $500 to $799 | 412 (22.5%) | 174 (21.7%) |
| $800 to $999 | 178 (9.7%) | 40 (5.0%) |
| $1,000 to $1,499 | 208 (11.3%) | 52 (6.5%) |
| $1,500 to $1,999 | 35 (1.9%) | 22 (2.7%) |
| $2,000 to $2,499 | 14 (0.8%) | 0 (0.0%) |
| $2,500 to $2,999 | 13 (0.7%) | 0 (0.0%) |
| $3,000 or more | 10 (0.5%) | 0 (0.0%) |
| Total | 1,835 (100.0%) | 802 (100.0%) |
Physical Housing Characteristics in Lee County
Housing Structures in Lee County
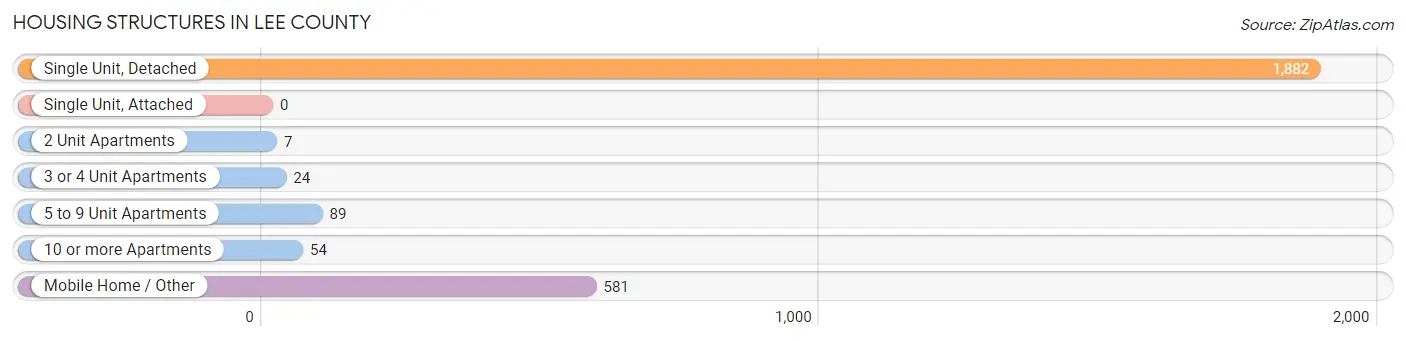
| Structure Type | # Housing Units | % Housing Units |
| Single Unit, Detached | 1,882 | 71.4% |
| Single Unit, Attached | 0 | 0.0% |
| 2 Unit Apartments | 7 | 0.3% |
| 3 or 4 Unit Apartments | 24 | 0.9% |
| 5 to 9 Unit Apartments | 89 | 3.4% |
| 10 or more Apartments | 54 | 2.1% |
| Mobile Home / Other | 581 | 22.0% |
| Total | 2,637 | 100.0% |
Housing Structures by Occupancy in Lee County
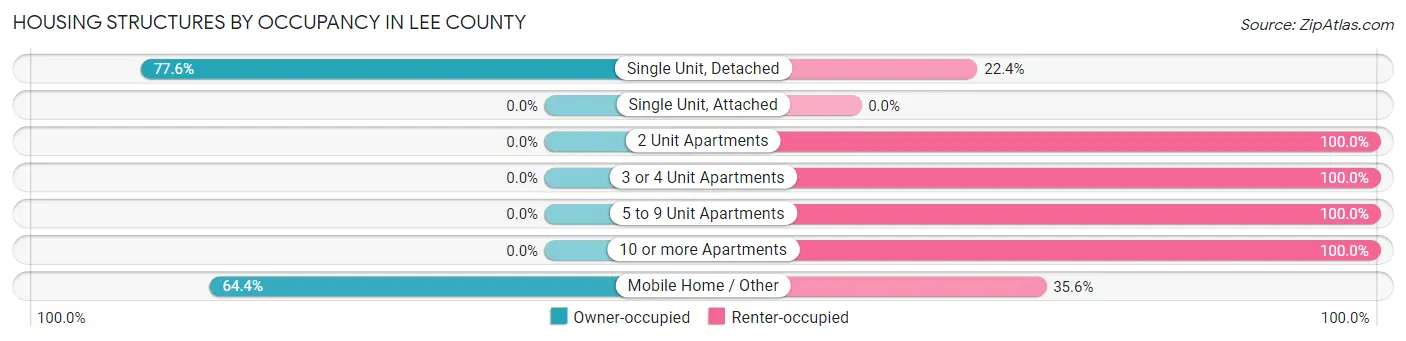
| Structure Type | Owner-occupied | Renter-occupied |
| Single Unit, Detached | 1,461 (77.6%) | 421 (22.4%) |
| Single Unit, Attached | 0 (0.0%) | 0 (0.0%) |
| 2 Unit Apartments | 0 (0.0%) | 7 (100.0%) |
| 3 or 4 Unit Apartments | 0 (0.0%) | 24 (100.0%) |
| 5 to 9 Unit Apartments | 0 (0.0%) | 89 (100.0%) |
| 10 or more Apartments | 0 (0.0%) | 54 (100.0%) |
| Mobile Home / Other | 374 (64.4%) | 207 (35.6%) |
| Total | 1,835 (69.6%) | 802 (30.4%) |
Housing Structures by Number of Rooms in Lee County
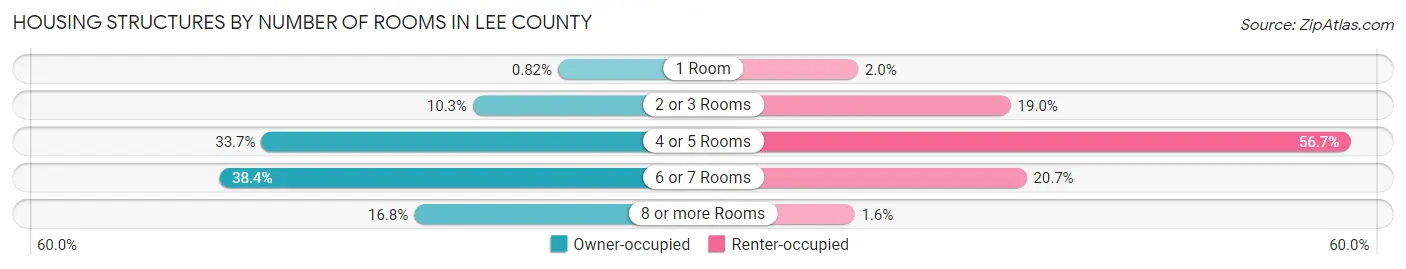
| Number of Rooms | Owner-occupied | Renter-occupied |
| 1 Room | 15 (0.8%) | 16 (2.0%) |
| 2 or 3 Rooms | 188 (10.2%) | 152 (19.0%) |
| 4 or 5 Rooms | 619 (33.7%) | 455 (56.7%) |
| 6 or 7 Rooms | 705 (38.4%) | 166 (20.7%) |
| 8 or more Rooms | 308 (16.8%) | 13 (1.6%) |
| Total | 1,835 (100.0%) | 802 (100.0%) |
Housing Structure by Heating Type in Lee County
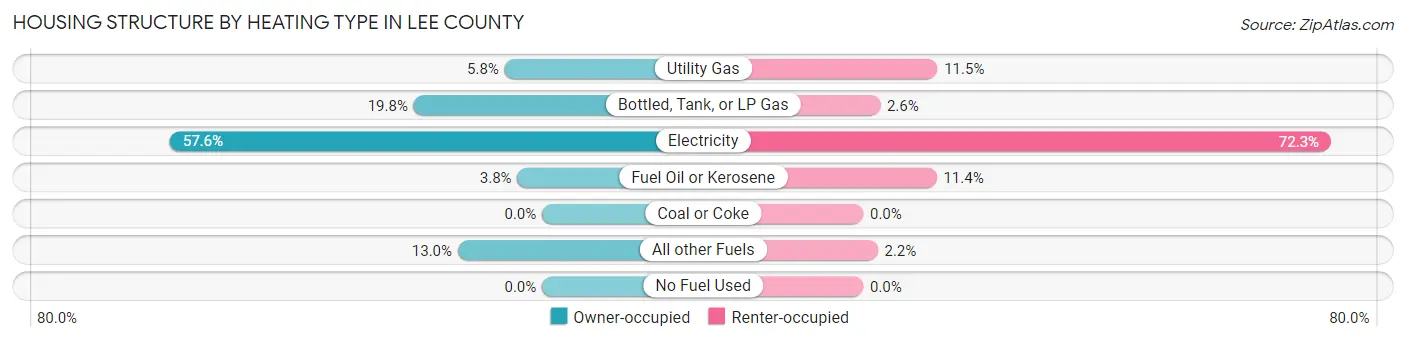
| Heating Type | Owner-occupied | Renter-occupied |
| Utility Gas | 106 (5.8%) | 92 (11.5%) |
| Bottled, Tank, or LP Gas | 364 (19.8%) | 21 (2.6%) |
| Electricity | 1,056 (57.6%) | 580 (72.3%) |
| Fuel Oil or Kerosene | 70 (3.8%) | 91 (11.4%) |
| Coal or Coke | 0 (0.0%) | 0 (0.0%) |
| All other Fuels | 239 (13.0%) | 18 (2.2%) |
| No Fuel Used | 0 (0.0%) | 0 (0.0%) |
| Total | 1,835 (100.0%) | 802 (100.0%) |
Household Vehicle Usage in Lee County
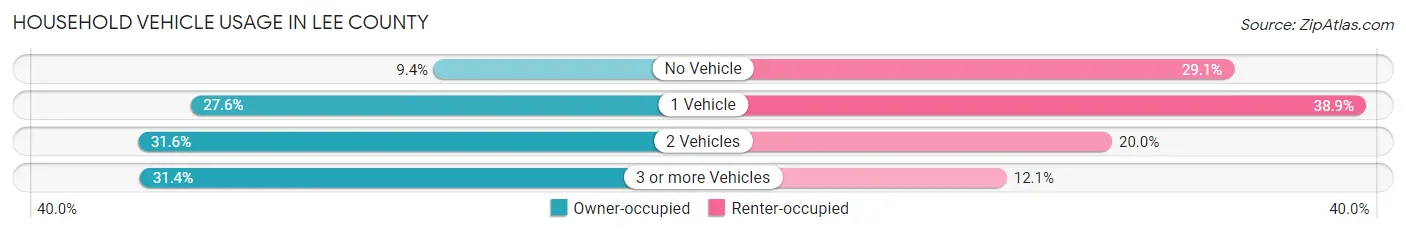
| Vehicles per Household | Owner-occupied | Renter-occupied |
| No Vehicle | 173 (9.4%) | 233 (29.0%) |
| 1 Vehicle | 507 (27.6%) | 312 (38.9%) |
| 2 Vehicles | 579 (31.6%) | 160 (20.0%) |
| 3 or more Vehicles | 576 (31.4%) | 97 (12.1%) |
| Total | 1,835 (100.0%) | 802 (100.0%) |
Real Estate & Mortgages in Lee County
Real Estate and Mortgage Overview in Lee County
| Characteristic | Without Mortgage | With Mortgage |
| Housing Units | 1,146 | 689 |
| Median Property Value | $71,200 | $88,800 |
| Median Household Income | $31,319 | $41 |
| Monthly Housing Costs | $368 | $10 |
| Real Estate Taxes | $558 | $112 |
Property Value by Mortgage Status in Lee County
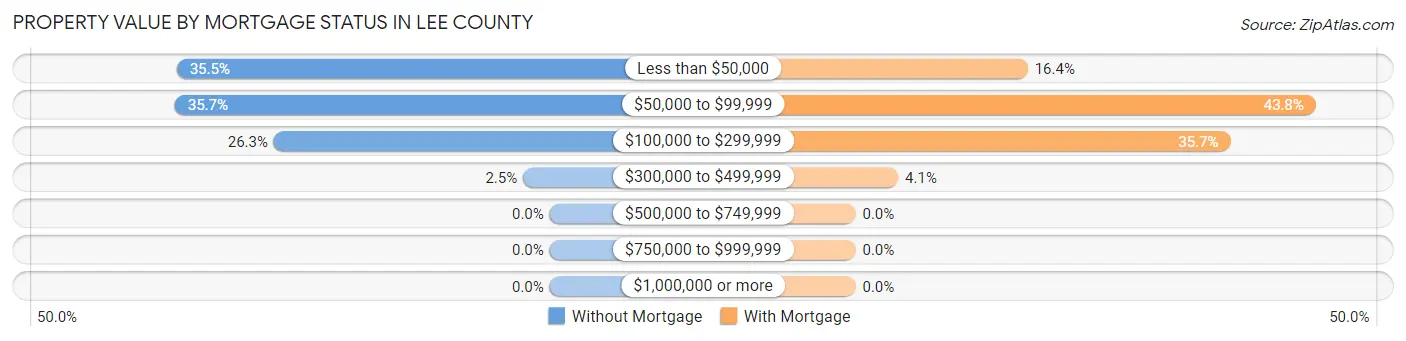
| Property Value | Without Mortgage | With Mortgage |
| Less than $50,000 | 407 (35.5%) | 113 (16.4%) |
| $50,000 to $99,999 | 409 (35.7%) | 302 (43.8%) |
| $100,000 to $299,999 | 301 (26.3%) | 246 (35.7%) |
| $300,000 to $499,999 | 29 (2.5%) | 28 (4.1%) |
| $500,000 to $749,999 | 0 (0.0%) | 0 (0.0%) |
| $750,000 to $999,999 | 0 (0.0%) | 0 (0.0%) |
| $1,000,000 or more | 0 (0.0%) | 0 (0.0%) |
| Total | 1,146 (100.0%) | 689 (100.0%) |
Household Income by Mortgage Status in Lee County
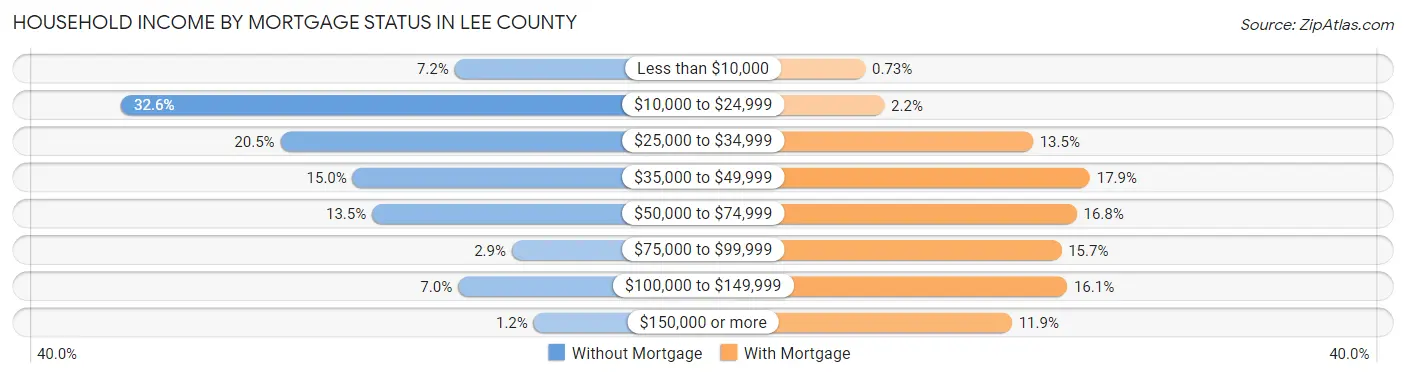
| Household Income | Without Mortgage | With Mortgage |
| Less than $10,000 | 83 (7.2%) | 5 (0.7%) |
| $10,000 to $24,999 | 374 (32.6%) | 15 (2.2%) |
| $25,000 to $34,999 | 235 (20.5%) | 93 (13.5%) |
| $35,000 to $49,999 | 172 (15.0%) | 123 (17.8%) |
| $50,000 to $74,999 | 155 (13.5%) | 116 (16.8%) |
| $75,000 to $99,999 | 33 (2.9%) | 108 (15.7%) |
| $100,000 to $149,999 | 80 (7.0%) | 111 (16.1%) |
| $150,000 or more | 14 (1.2%) | 82 (11.9%) |
| Total | 1,146 (100.0%) | 689 (100.0%) |
Property Value to Household Income Ratio in Lee County
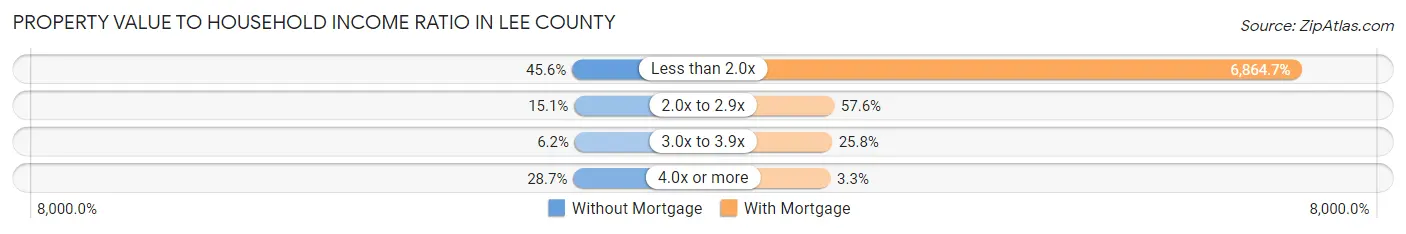
| Value-to-Income Ratio | Without Mortgage | With Mortgage |
| Less than 2.0x | 522 (45.6%) | 47,298 (6,864.7%) |
| 2.0x to 2.9x | 173 (15.1%) | 397 (57.6%) |
| 3.0x to 3.9x | 71 (6.2%) | 178 (25.8%) |
| 4.0x or more | 329 (28.7%) | 23 (3.3%) |
| Total | 1,146 (100.0%) | 689 (100.0%) |
Real Estate Taxes by Mortgage Status in Lee County
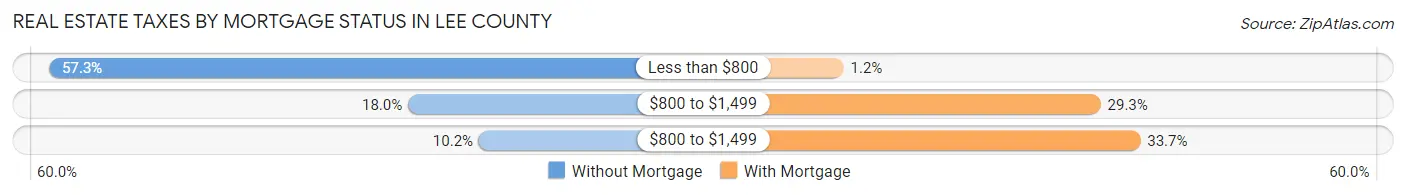
| Property Taxes | Without Mortgage | With Mortgage |
| Less than $800 | 657 (57.3%) | 8 (1.2%) |
| $800 to $1,499 | 206 (18.0%) | 202 (29.3%) |
| $800 to $1,499 | 117 (10.2%) | 232 (33.7%) |
| Total | 1,146 (100.0%) | 689 (100.0%) |
Health & Disability in Lee County
Health Insurance Coverage by Age in Lee County
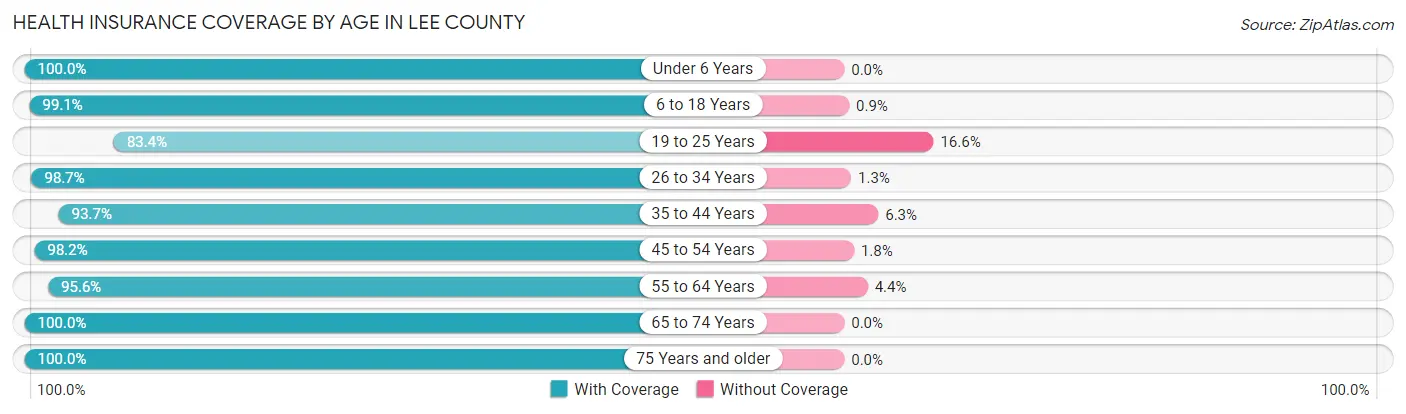
| Age Bracket | With Coverage | Without Coverage |
| Under 6 Years | 487 (100.0%) | 0 (0.0%) |
| 6 to 18 Years | 1,101 (99.1%) | 10 (0.9%) |
| 19 to 25 Years | 356 (83.4%) | 71 (16.6%) |
| 26 to 34 Years | 621 (98.7%) | 8 (1.3%) |
| 35 to 44 Years | 768 (93.7%) | 52 (6.3%) |
| 45 to 54 Years | 870 (98.2%) | 16 (1.8%) |
| 55 to 64 Years | 1,008 (95.6%) | 46 (4.4%) |
| 65 to 74 Years | 823 (100.0%) | 0 (0.0%) |
| 75 Years and older | 411 (100.0%) | 0 (0.0%) |
| Total | 6,445 (97.0%) | 203 (3.0%) |
Health Insurance Coverage by Citizenship Status in Lee County
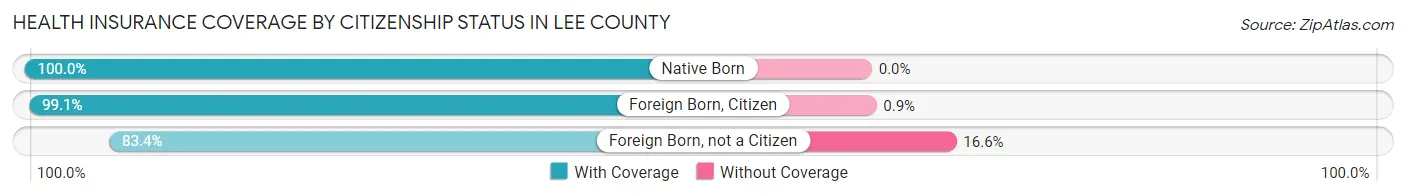
| Citizenship Status | With Coverage | Without Coverage |
| Native Born | 487 (100.0%) | 0 (0.0%) |
| Foreign Born, Citizen | 1,101 (99.1%) | 10 (0.9%) |
| Foreign Born, not a Citizen | 356 (83.4%) | 71 (16.6%) |
Health Insurance Coverage by Household Income in Lee County
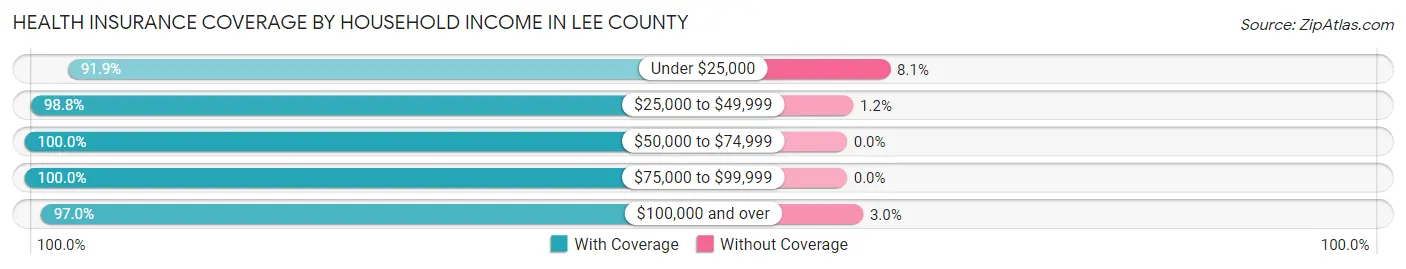
| Household Income | With Coverage | Without Coverage |
| Under $25,000 | 1,630 (91.9%) | 144 (8.1%) |
| $25,000 to $49,999 | 2,492 (98.8%) | 30 (1.2%) |
| $50,000 to $74,999 | 827 (100.0%) | 0 (0.0%) |
| $75,000 to $99,999 | 562 (100.0%) | 0 (0.0%) |
| $100,000 and over | 929 (97.0%) | 29 (3.0%) |
Public vs Private Health Insurance Coverage by Age in Lee County
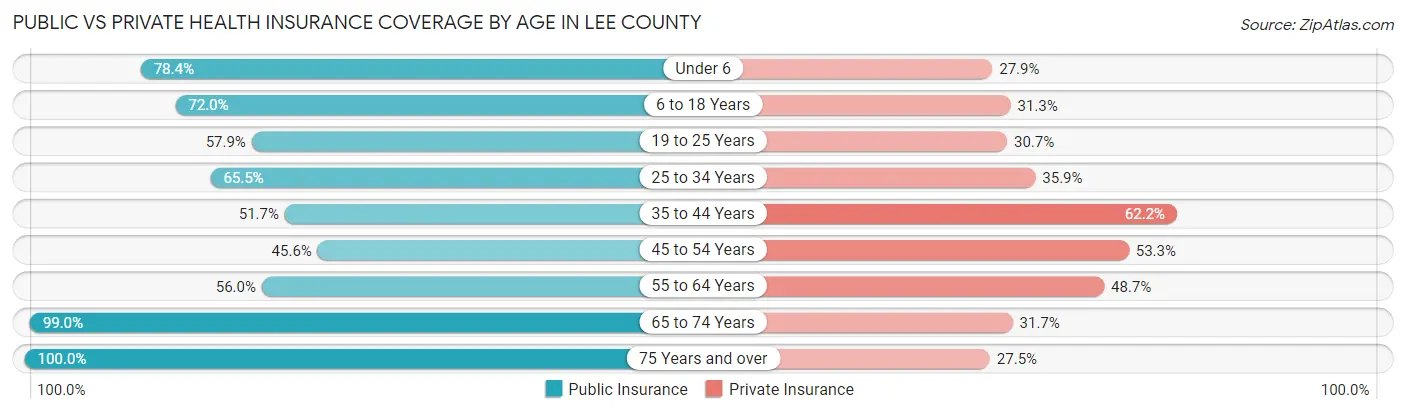
| Age Bracket | Public Insurance | Private Insurance |
| Under 6 | 382 (78.4%) | 136 (27.9%) |
| 6 to 18 Years | 800 (72.0%) | 348 (31.3%) |
| 19 to 25 Years | 247 (57.9%) | 131 (30.7%) |
| 25 to 34 Years | 412 (65.5%) | 226 (35.9%) |
| 35 to 44 Years | 424 (51.7%) | 510 (62.2%) |
| 45 to 54 Years | 404 (45.6%) | 472 (53.3%) |
| 55 to 64 Years | 590 (56.0%) | 513 (48.7%) |
| 65 to 74 Years | 815 (99.0%) | 261 (31.7%) |
| 75 Years and over | 411 (100.0%) | 113 (27.5%) |
| Total | 4,485 (67.5%) | 2,710 (40.8%) |
Disability Status by Sex by Age in Lee County
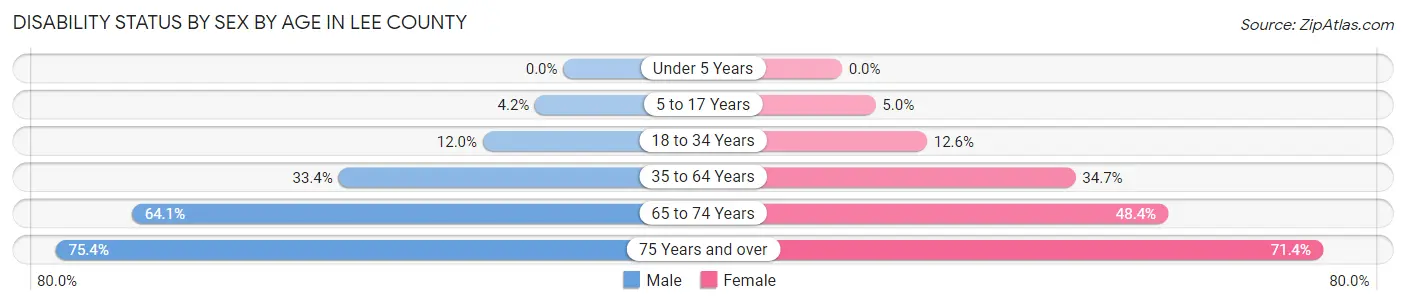
| Age Bracket | Male | Female |
| Under 5 Years | 0 (0.0%) | 0 (0.0%) |
| 5 to 17 Years | 29 (4.2%) | 21 (5.0%) |
| 18 to 34 Years | 76 (11.9%) | 67 (12.6%) |
| 35 to 64 Years | 494 (33.4%) | 444 (34.7%) |
| 65 to 74 Years | 264 (64.1%) | 199 (48.4%) |
| 75 Years and over | 141 (75.4%) | 160 (71.4%) |
Disability Class by Sex by Age in Lee County
Disability Class: Hearing Difficulty
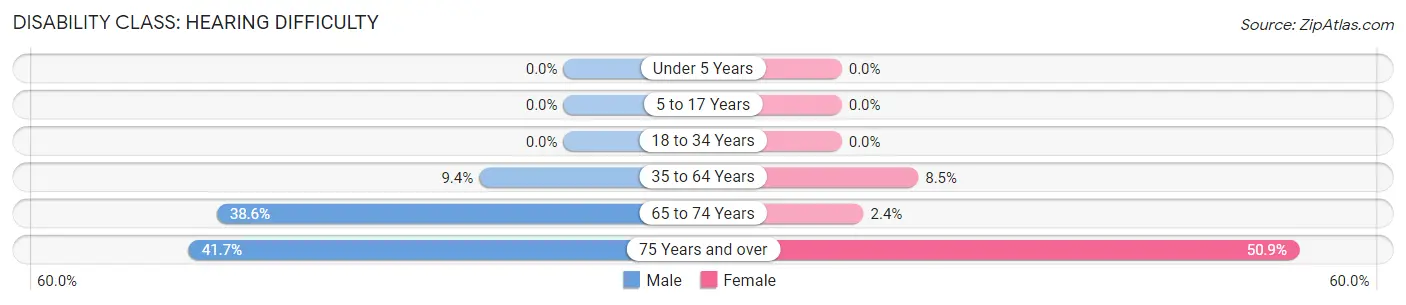
| Age Bracket | Male | Female |
| Under 5 Years | 0 (0.0%) | 0 (0.0%) |
| 5 to 17 Years | 0 (0.0%) | 0 (0.0%) |
| 18 to 34 Years | 0 (0.0%) | 0 (0.0%) |
| 35 to 64 Years | 139 (9.4%) | 109 (8.5%) |
| 65 to 74 Years | 159 (38.6%) | 10 (2.4%) |
| 75 Years and over | 78 (41.7%) | 114 (50.9%) |
Disability Class: Vision Difficulty
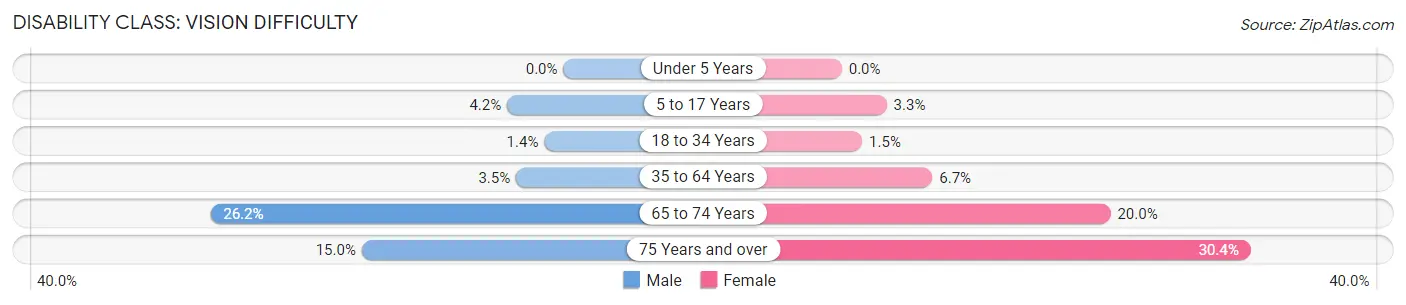
| Age Bracket | Male | Female |
| Under 5 Years | 0 (0.0%) | 0 (0.0%) |
| 5 to 17 Years | 29 (4.2%) | 14 (3.3%) |
| 18 to 34 Years | 9 (1.4%) | 8 (1.5%) |
| 35 to 64 Years | 52 (3.5%) | 86 (6.7%) |
| 65 to 74 Years | 108 (26.2%) | 82 (20.0%) |
| 75 Years and over | 28 (15.0%) | 68 (30.4%) |
Disability Class: Cognitive Difficulty
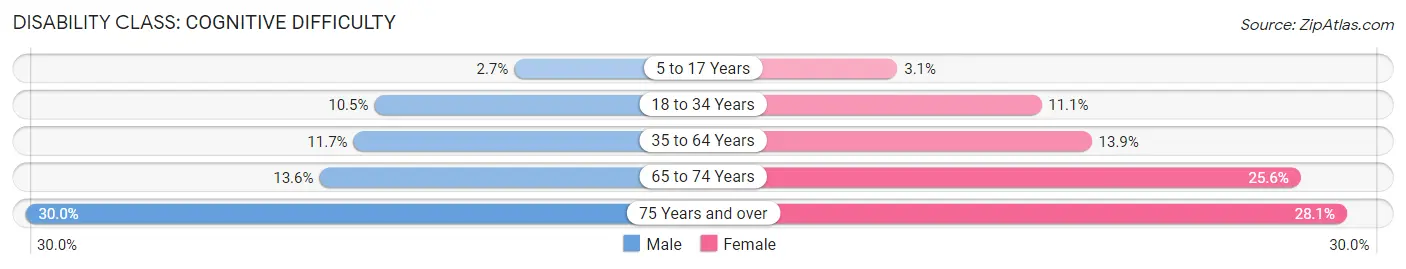
| Age Bracket | Male | Female |
| 5 to 17 Years | 19 (2.7%) | 13 (3.1%) |
| 18 to 34 Years | 67 (10.5%) | 59 (11.1%) |
| 35 to 64 Years | 173 (11.7%) | 178 (13.9%) |
| 65 to 74 Years | 56 (13.6%) | 105 (25.6%) |
| 75 Years and over | 56 (29.9%) | 63 (28.1%) |
Disability Class: Ambulatory Difficulty
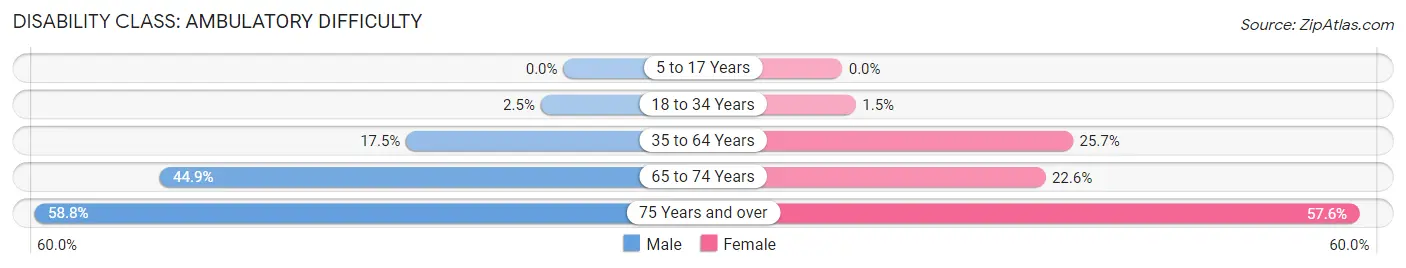
| Age Bracket | Male | Female |
| 5 to 17 Years | 0 (0.0%) | 0 (0.0%) |
| 18 to 34 Years | 16 (2.5%) | 8 (1.5%) |
| 35 to 64 Years | 259 (17.5%) | 329 (25.7%) |
| 65 to 74 Years | 185 (44.9%) | 93 (22.6%) |
| 75 Years and over | 110 (58.8%) | 129 (57.6%) |
Disability Class: Self-Care Difficulty
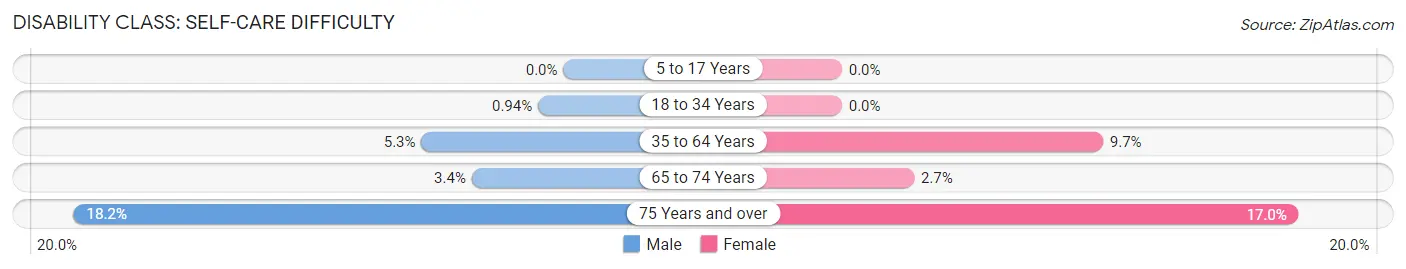
| Age Bracket | Male | Female |
| 5 to 17 Years | 0 (0.0%) | 0 (0.0%) |
| 18 to 34 Years | 6 (0.9%) | 0 (0.0%) |
| 35 to 64 Years | 78 (5.3%) | 124 (9.7%) |
| 65 to 74 Years | 14 (3.4%) | 11 (2.7%) |
| 75 Years and over | 34 (18.2%) | 38 (17.0%) |
Technology Access in Lee County
Computing Device Access in Lee County
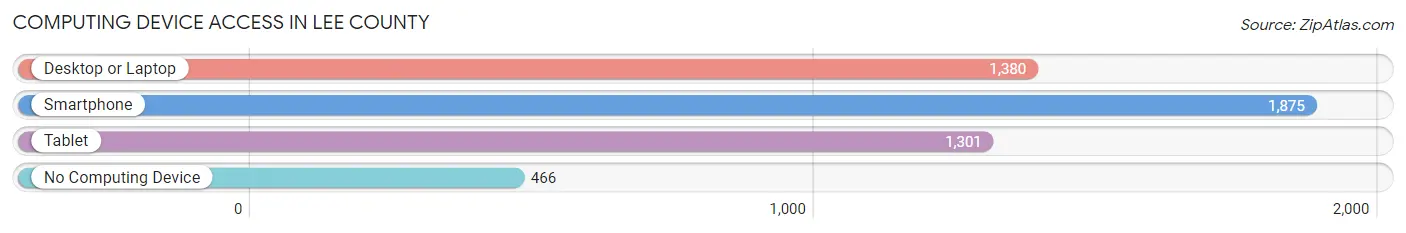
| Device Type | # Households | % Households |
| Desktop or Laptop | 1,380 | 52.3% |
| Smartphone | 1,875 | 71.1% |
| Tablet | 1,301 | 49.3% |
| No Computing Device | 466 | 17.7% |
| Total | 2,637 | 100.0% |
Internet Access in Lee County
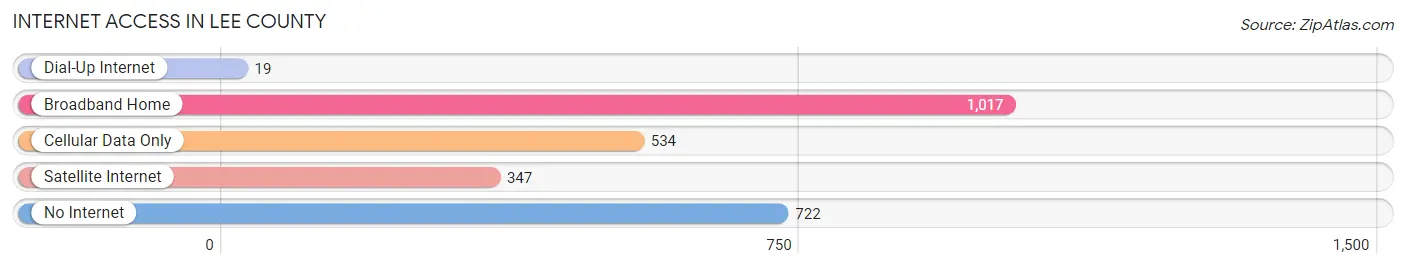
| Internet Type | # Households | % Households |
| Dial-Up Internet | 19 | 0.7% |
| Broadband Home | 1,017 | 38.6% |
| Cellular Data Only | 534 | 20.3% |
| Satellite Internet | 347 | 13.2% |
| No Internet | 722 | 27.4% |
| Total | 2,637 | 100.0% |
Lee County Summary
Lee County is located in the eastern part of Kentucky, in the Appalachian Mountains. It is bordered by Breathitt County to the north, Owsley County to the east, Wolfe County to the south, and Estill County to the west. The county seat is Beattyville, and the county was formed in 1870 from parts of Breathitt, Estill, and Owsley counties.
Geography
Lee County is located in the Appalachian Mountains of eastern Kentucky. It is bordered by Breathitt County to the north, Owsley County to the east, Wolfe County to the south, and Estill County to the west. The county has a total area of 441 square miles, of which 439 square miles is land and 2 square miles is water. The terrain is mostly hilly and rugged, with the highest point being the summit of Big Hill at 2,890 feet. The county is drained by the Kentucky River and its tributaries, including the Red River, the South Fork of the Kentucky River, and the North Fork of the Kentucky River.
History
Lee County was formed in 1870 from parts of Breathitt, Estill, and Owsley counties. It was named for General Robert E. Lee, the commander of the Confederate Army during the Civil War. The county seat is Beattyville, which was named for James Beatty, a local landowner.
The county was largely rural and agricultural until the 1950s, when the coal industry began to expand in the area. The coal industry has since declined, and the county is now largely dependent on tourism and small businesses.
Economy
Lee County has a largely rural economy, with the majority of the population employed in agriculture and tourism. The county is home to several small businesses, including restaurants, retail stores, and service providers. The county is also home to several state parks, including Natural Bridge State Resort Park, which is the largest state park in Kentucky.
The county is also home to several coal mines, although the coal industry has declined in recent years. The county is also home to several natural gas wells, which provide jobs and revenue for the county.
Demographics
As of the 2010 census, the population of Lee County was 7,887. The population is largely white (96.2%), with a small African American population (2.2%) and a small Hispanic population (1.2%). The median household income is $30,945, and the median age is 41.7 years.
The county is largely rural, with only one incorporated town, Beattyville. The county is served by two school districts, the Lee County School District and the Beattyville Independent School District.
Conclusion
Lee County is a rural county located in the Appalachian Mountains of eastern Kentucky. It is bordered by Breathitt County to the north, Owsley County to the east, Wolfe County to the south, and Estill County to the west. The county has a largely rural economy, with the majority of the population employed in agriculture and tourism. The county is also home to several coal mines and natural gas wells. The population of Lee County is largely white, with a small African American and Hispanic population. The median household income is $30,945, and the median age is 41.7 years.
Common Questions
What is Per Capita Income in Lee County?
Per Capita income in Lee County is $18,651.
What is the Median Family Income in Lee County?
Median Family Income in Lee County is $39,402.
What is the Median Household income in Lee County?
Median Household Income in Lee County is $31,682.
What is Income or Wage Gap in Lee County?
Income or Wage Gap in Lee County is 23.2%.
Women in Lee County earn 76.8 cents for every dollar earned by a man.
What is Family Income Deficit in Lee County?
Family Income Deficit in Lee County is $10,812.
Families that are below poverty line in Lee County earn $10,812 less on average than the poverty threshold level.
What is Inequality or Gini Index in Lee County?
Inequality or Gini Index in Lee County is 0.50.
What is the Total Population of Lee County?
Total Population of Lee County is 7,338.
What is the Total Male Population of Lee County?
Total Male Population of Lee County is 4,183.
What is the Total Female Population of Lee County?
Total Female Population of Lee County is 3,155.
What is the Ratio of Males per 100 Females in Lee County?
There are 132.58 Males per 100 Females in Lee County.
What is the Ratio of Females per 100 Males in Lee County?
There are 75.42 Females per 100 Males in Lee County.
What is the Median Population Age in Lee County?
Median Population Age in Lee County is 41.8 Years.
What is the Average Family Size in Lee County
Average Family Size in Lee County is 3.3 People.
What is the Average Household Size in Lee County
Average Household Size in Lee County is 2.5 People.
How Large is the Labor Force in Lee County?
There are 2,499 People in the Labor Forcein in Lee County.
What is the Percentage of People in the Labor Force in Lee County?
41.6% of People are in the Labor Force in Lee County.
What is the Unemployment Rate in Lee County?
Unemployment Rate in Lee County is 8.1%.