Larue County, KY Map & Demographics
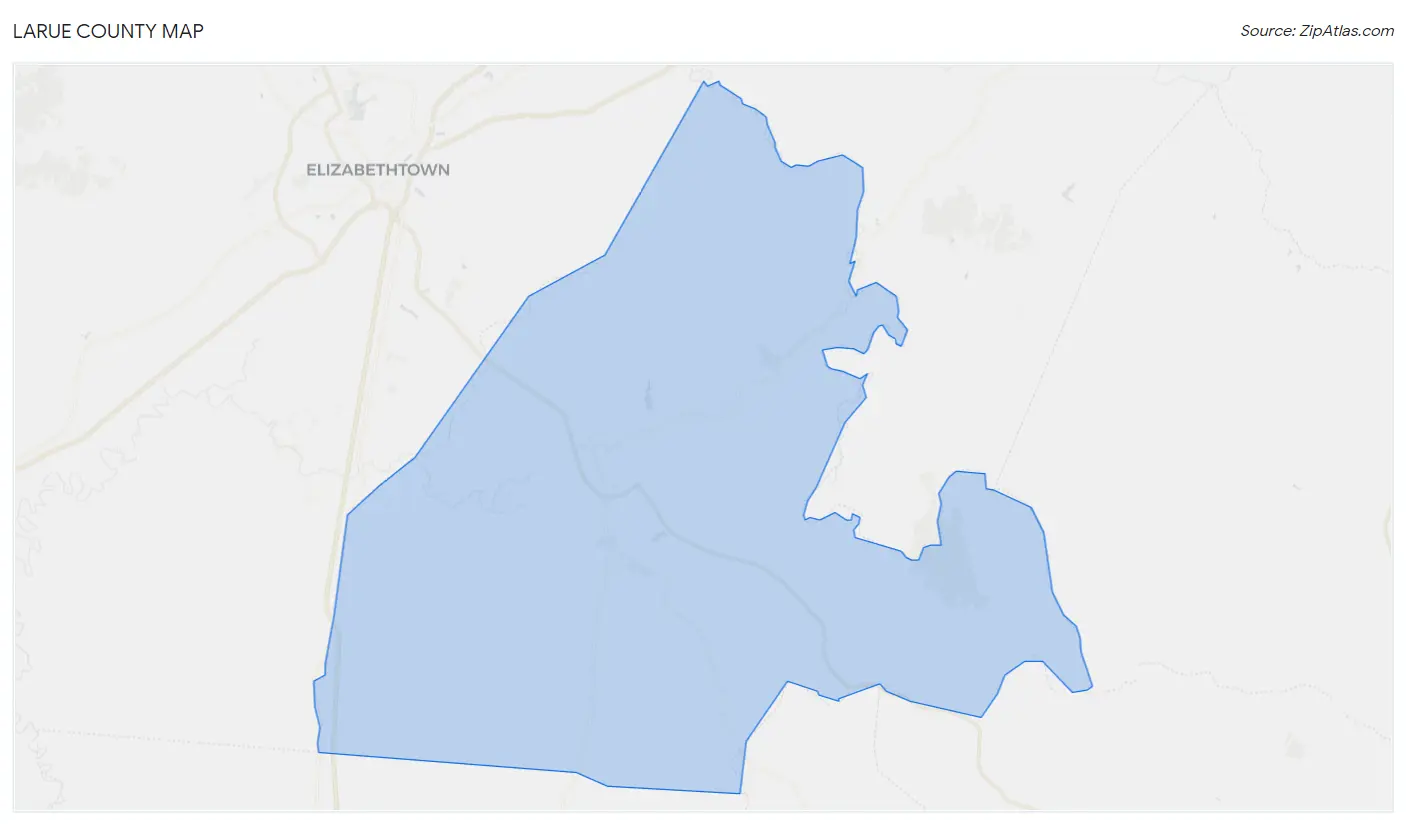
Larue County Map
Larue County Overview
$28,038
PER CAPITA INCOME
$70,302
AVG FAMILY INCOME
$57,867
AVG HOUSEHOLD INCOME
29.4%
WAGE / INCOME GAP [ % ]
70.6¢/ $1
WAGE / INCOME GAP [ $ ]
$11,463
FAMILY INCOME DEFICIT
0.43
INEQUALITY / GINI INDEX
14,902
TOTAL POPULATION
7,360
MALE POPULATION
7,542
FEMALE POPULATION
97.59
MALES / 100 FEMALES
102.47
FEMALES / 100 MALES
41.3
MEDIAN AGE
3.0
AVG FAMILY SIZE
2.5
AVG HOUSEHOLD SIZE
6,665
LABOR FORCE [ PEOPLE ]
55.8%
PERCENT IN LABOR FORCE
2.8%
UNEMPLOYMENT RATE
Larue County Area Codes
Income in Larue County
Income Overview in Larue County
Per Capita Income in Larue County is $28,038, while median incomes of families and households are $70,302 and $57,867 respectively.
| Characteristic | Number | Measure |
| Per Capita Income | 14,902 | $28,038 |
| Median Family Income | 3,988 | $70,302 |
| Mean Family Income | 3,988 | $80,218 |
| Median Household Income | 5,967 | $57,867 |
| Mean Household Income | 5,967 | $69,024 |
| Income Deficit | 3,988 | $11,463 |
| Wage / Income Gap (%) | 14,902 | 29.40% |
| Wage / Income Gap ($) | 14,902 | 70.60¢ per $1 |
| Gini / Inequality Index | 14,902 | 0.43 |
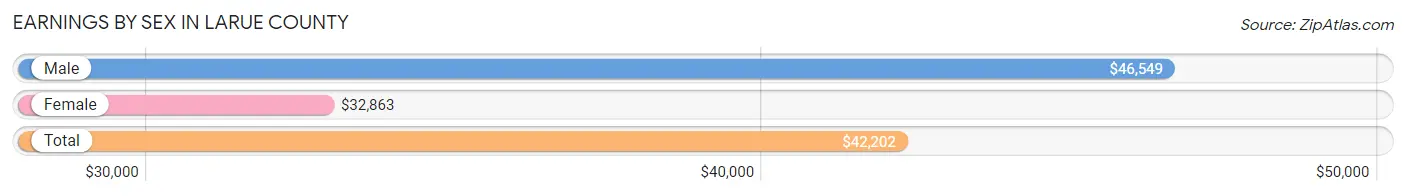
Earnings by Sex in Larue County
Average Earnings in Larue County are $42,202, $46,549 for men and $32,863 for women, a difference of 29.4%.
| Sex | Number | Average Earnings |
| Male | 3,812 (55.0%) | $46,549 |
| Female | 3,116 (45.0%) | $32,863 |
| Total | 6,928 (100.0%) | $42,202 |
Earnings by Sex by Income Bracket in Larue County
The most common earnings brackets in Larue County are $55,000 to $64,999 for men (423 | 11.1%) and $75,000 to $99,999 for women (257 | 8.3%).
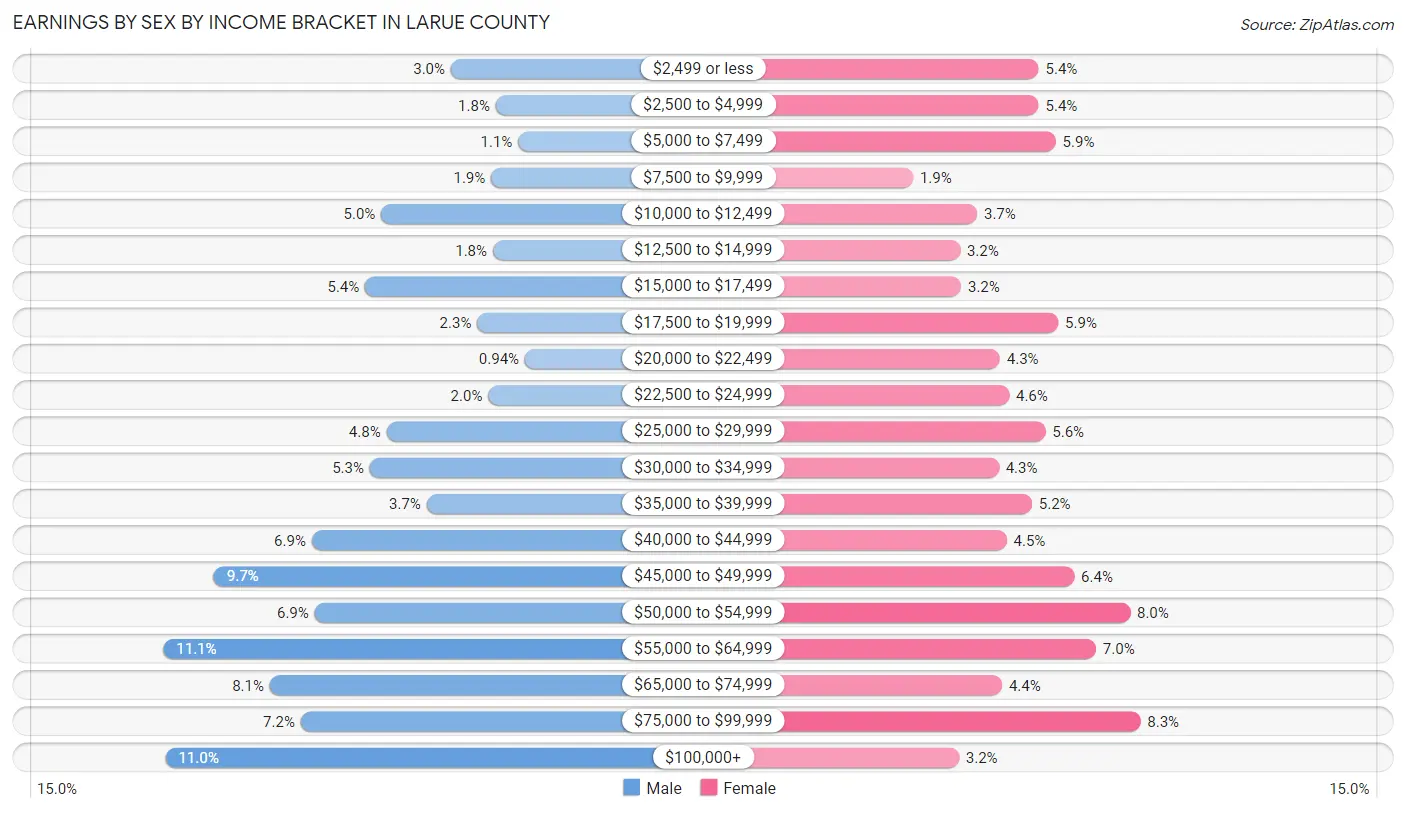
| Income | Male | Female |
| $2,499 or less | 115 (3.0%) | 168 (5.4%) |
| $2,500 to $4,999 | 67 (1.8%) | 168 (5.4%) |
| $5,000 to $7,499 | 43 (1.1%) | 183 (5.9%) |
| $7,500 to $9,999 | 72 (1.9%) | 58 (1.9%) |
| $10,000 to $12,499 | 190 (5.0%) | 114 (3.7%) |
| $12,500 to $14,999 | 70 (1.8%) | 99 (3.2%) |
| $15,000 to $17,499 | 207 (5.4%) | 100 (3.2%) |
| $17,500 to $19,999 | 87 (2.3%) | 185 (5.9%) |
| $20,000 to $22,499 | 36 (0.9%) | 134 (4.3%) |
| $22,500 to $24,999 | 75 (2.0%) | 142 (4.6%) |
| $25,000 to $29,999 | 184 (4.8%) | 174 (5.6%) |
| $30,000 to $34,999 | 202 (5.3%) | 133 (4.3%) |
| $35,000 to $39,999 | 141 (3.7%) | 162 (5.2%) |
| $40,000 to $44,999 | 264 (6.9%) | 140 (4.5%) |
| $45,000 to $49,999 | 369 (9.7%) | 199 (6.4%) |
| $50,000 to $54,999 | 261 (6.9%) | 248 (8.0%) |
| $55,000 to $64,999 | 423 (11.1%) | 218 (7.0%) |
| $65,000 to $74,999 | 309 (8.1%) | 136 (4.4%) |
| $75,000 to $99,999 | 276 (7.2%) | 257 (8.3%) |
| $100,000+ | 421 (11.0%) | 98 (3.2%) |
| Total | 3,812 (100.0%) | 3,116 (100.0%) |
Earnings by Sex by Educational Attainment in Larue County
Average earnings in Larue County are $50,876 for men and $38,134 for women, a difference of 25.1%. Men with an educational attainment of graduate degree enjoy the highest average annual earnings of $60,259, while those with less than high school education earn the least with $29,948. Women with an educational attainment of graduate degree earn the most with the average annual earnings of $75,938, while those with high school diploma education have the smallest earnings of $20,506.
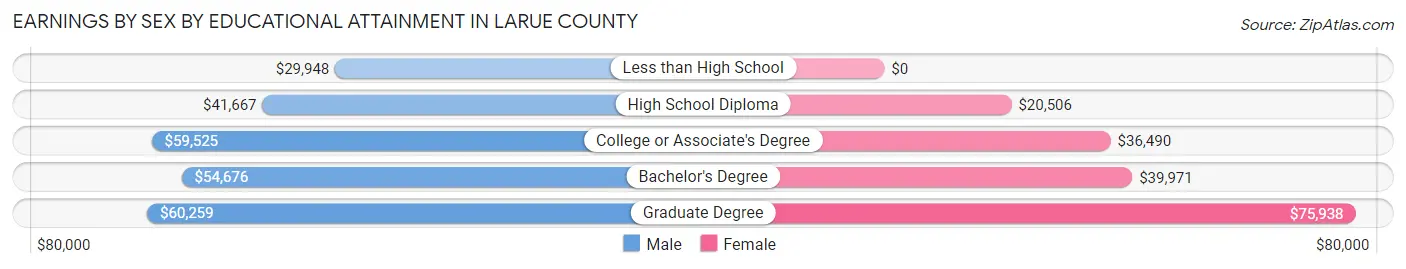
| Educational Attainment | Male Income | Female Income |
| Less than High School | $29,948 | $0 |
| High School Diploma | $41,667 | $20,506 |
| College or Associate's Degree | $59,525 | $36,490 |
| Bachelor's Degree | $54,676 | $39,971 |
| Graduate Degree | $60,259 | $75,938 |
| Total | $50,876 | $38,134 |
Family Income in Larue County
Family Income Brackets in Larue County
According to the Larue County family income data, there are 889 families falling into the $100,000 to $149,999 income range, which is the most common income bracket and makes up 22.3% of all families. Conversely, the $150,000 to $199,999 income bracket is the least frequent group with only 148 families (3.7%) belonging to this category.
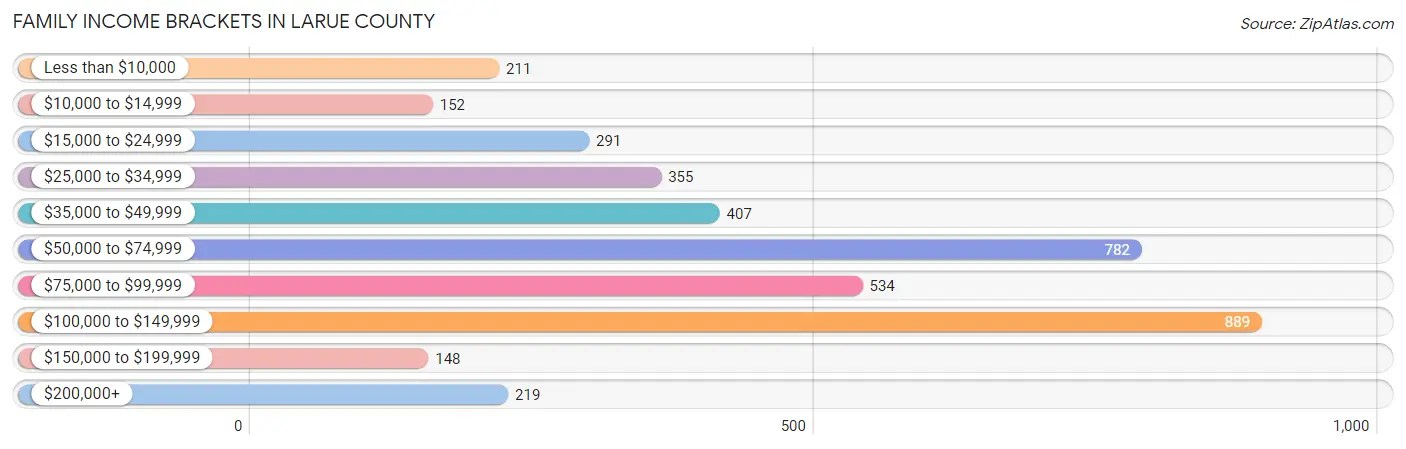
| Income Bracket | # Families | % Families |
| Less than $10,000 | 211 | 5.3% |
| $10,000 to $14,999 | 152 | 3.8% |
| $15,000 to $24,999 | 291 | 7.3% |
| $25,000 to $34,999 | 355 | 8.9% |
| $35,000 to $49,999 | 407 | 10.2% |
| $50,000 to $74,999 | 782 | 19.6% |
| $75,000 to $99,999 | 534 | 13.4% |
| $100,000 to $149,999 | 889 | 22.3% |
| $150,000 to $199,999 | 148 | 3.7% |
| $200,000+ | 219 | 5.5% |
Family Income by Famaliy Size in Larue County
6-person families (90 | 2.3%) account for the highest median family income in Larue County with $113,393 per family, while 2-person families (1,759 | 44.1%) have the highest median income of $31,625 per family member.
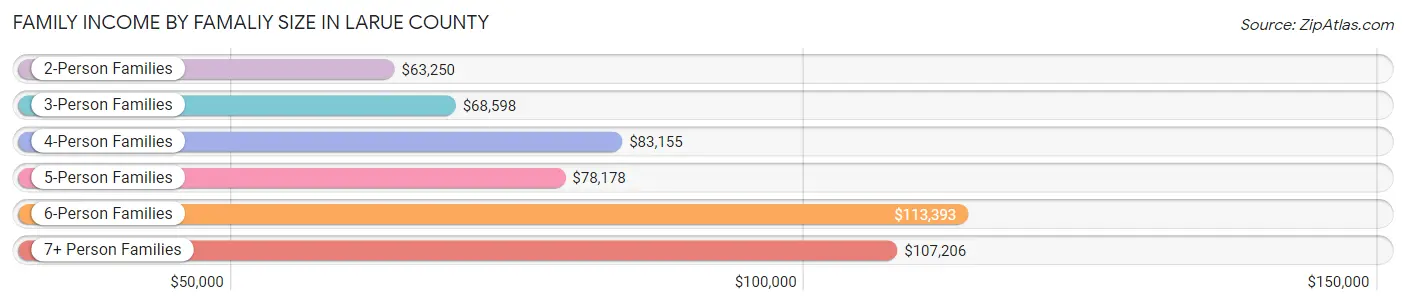
| Income Bracket | # Families | Median Income |
| 2-Person Families | 1,759 (44.1%) | $63,250 |
| 3-Person Families | 1,130 (28.3%) | $68,598 |
| 4-Person Families | 563 (14.1%) | $83,155 |
| 5-Person Families | 416 (10.4%) | $78,178 |
| 6-Person Families | 90 (2.3%) | $113,393 |
| 7+ Person Families | 30 (0.7%) | $107,206 |
| Total | 3,988 (100.0%) | $70,302 |
Family Income by Number of Earners in Larue County
The median family income in Larue County is $70,302, with families comprising 3+ earners (353) having the highest median family income of $124,306, while families with no earners (793) have the lowest median family income of $32,757, accounting for 8.8% and 19.9% of families, respectively.
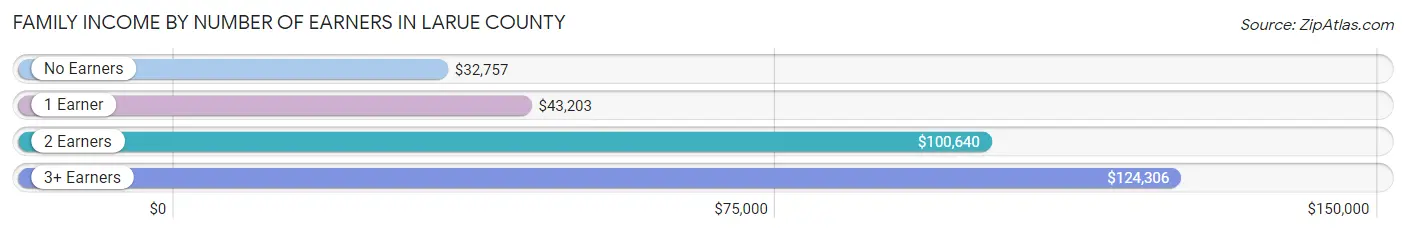
| Number of Earners | # Families | Median Income |
| No Earners | 793 (19.9%) | $32,757 |
| 1 Earner | 1,286 (32.3%) | $43,203 |
| 2 Earners | 1,556 (39.0%) | $100,640 |
| 3+ Earners | 353 (8.8%) | $124,306 |
| Total | 3,988 (100.0%) | $70,302 |
Household Income in Larue County
Household Income Brackets in Larue County
With 1,134 households falling in the category, the $50,000 to $74,999 income range is the most frequent in Larue County, accounting for 19.0% of all households. In contrast, only 227 households (3.8%) fall into the $150,000 to $199,999 income bracket, making it the least populous group.
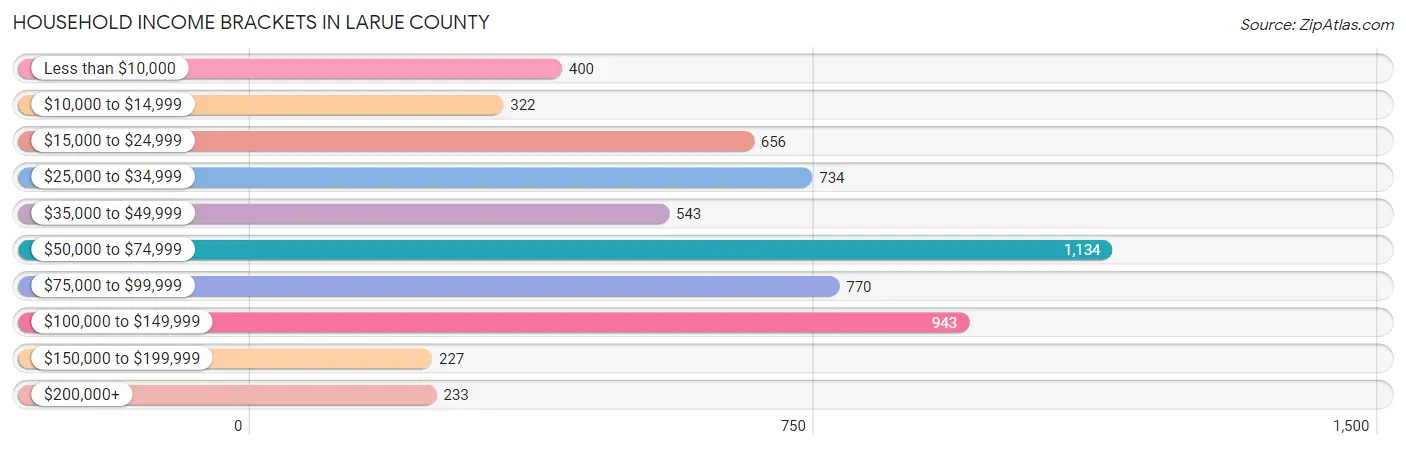
| Income Bracket | # Households | % Households |
| Less than $10,000 | 400 | 6.7% |
| $10,000 to $14,999 | 322 | 5.4% |
| $15,000 to $24,999 | 656 | 11.0% |
| $25,000 to $34,999 | 734 | 12.3% |
| $35,000 to $49,999 | 543 | 9.1% |
| $50,000 to $74,999 | 1,134 | 19.0% |
| $75,000 to $99,999 | 770 | 12.9% |
| $100,000 to $149,999 | 943 | 15.8% |
| $150,000 to $199,999 | 227 | 3.8% |
| $200,000+ | 233 | 3.9% |
Household Income by Householder Age in Larue County
The median household income in Larue County is $57,867, with the highest median household income of $70,814 found in the 25 to 44 years age bracket for the primary householder. A total of 1,902 households (31.9%) fall into this category. Meanwhile, the 65+ years age bracket for the primary householder has the lowest median household income of $39,803, with 1,673 households (28.0%) in this group.
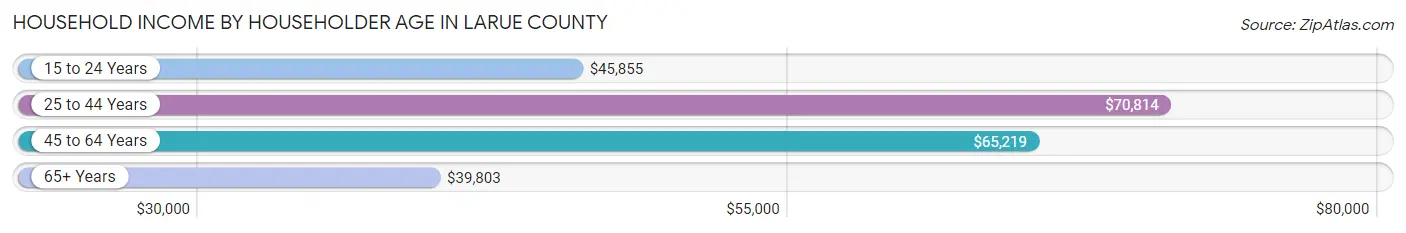
| Income Bracket | # Households | Median Income |
| 15 to 24 Years | 166 (2.8%) | $45,855 |
| 25 to 44 Years | 1,902 (31.9%) | $70,814 |
| 45 to 64 Years | 2,226 (37.3%) | $65,219 |
| 65+ Years | 1,673 (28.0%) | $39,803 |
| Total | 5,967 (100.0%) | $57,867 |
Poverty in Larue County
Income Below Poverty by Sex and Age in Larue County
With 15.8% poverty level for males and 21.7% for females among the residents of Larue County, under 5 year old males and 5 year old females are the most vulnerable to poverty, with 133 males (34.3%) and 48 females (52.7%) in their respective age groups living below the poverty level.
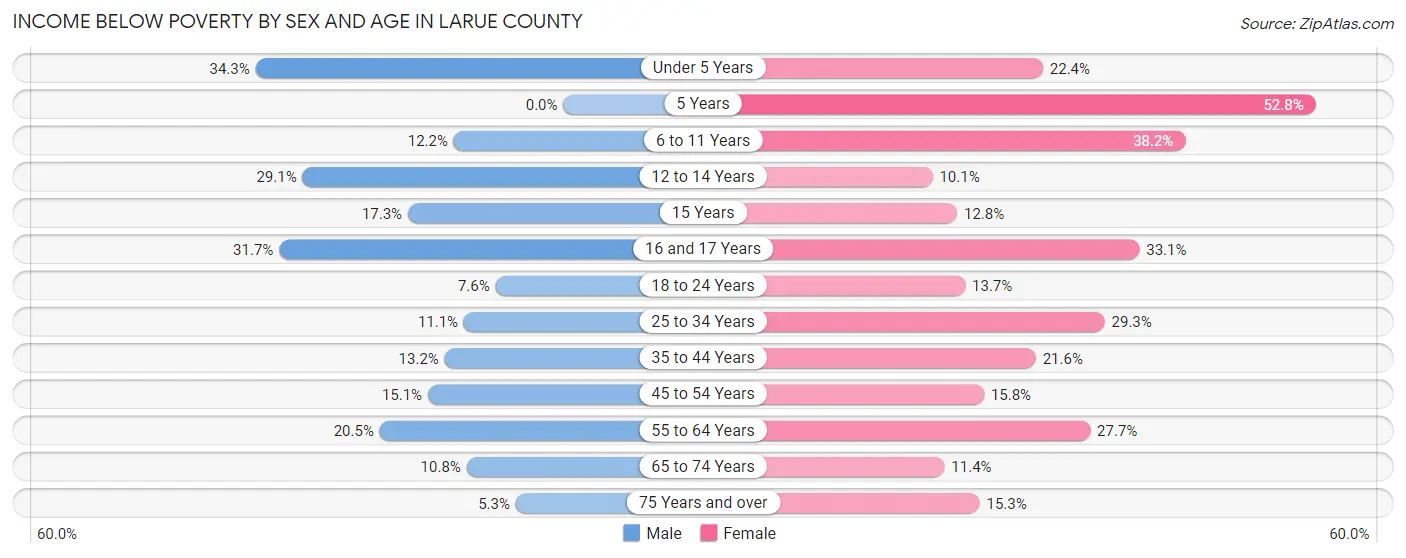
| Age Bracket | Male | Female |
| Under 5 Years | 133 (34.3%) | 88 (22.4%) |
| 5 Years | 0 (0.0%) | 48 (52.7%) |
| 6 to 11 Years | 60 (12.2%) | 195 (38.2%) |
| 12 to 14 Years | 140 (29.0%) | 39 (10.1%) |
| 15 Years | 9 (17.3%) | 14 (12.8%) |
| 16 and 17 Years | 75 (31.7%) | 54 (33.1%) |
| 18 to 24 Years | 42 (7.5%) | 71 (13.7%) |
| 25 to 34 Years | 102 (11.1%) | 252 (29.3%) |
| 35 to 44 Years | 120 (13.2%) | 197 (21.6%) |
| 45 to 54 Years | 128 (15.1%) | 155 (15.8%) |
| 55 to 64 Years | 220 (20.4%) | 341 (27.7%) |
| 65 to 74 Years | 84 (10.8%) | 91 (11.4%) |
| 75 Years and over | 21 (5.3%) | 81 (15.3%) |
| Total | 1,134 (15.8%) | 1,626 (21.7%) |
Income Above Poverty by Sex and Age in Larue County
According to the poverty statistics in Larue County, males aged 5 years and females aged 12 to 14 years are the age groups that are most secure financially, with 100.0% of males and 89.9% of females in these age groups living above the poverty line.
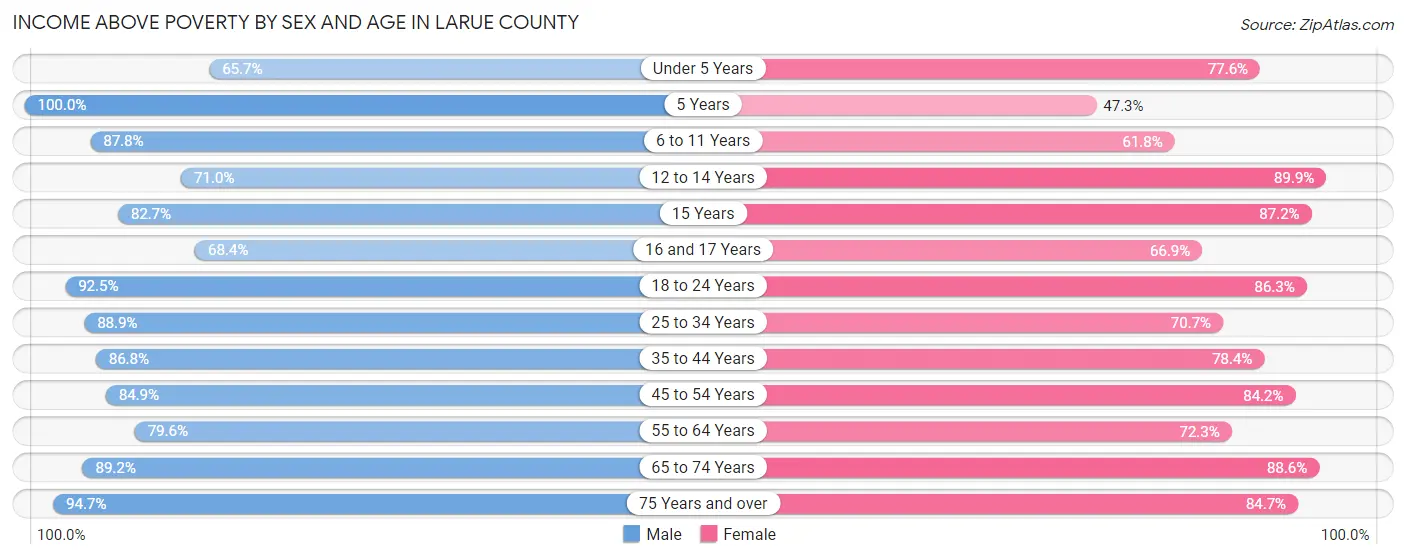
| Age Bracket | Male | Female |
| Under 5 Years | 255 (65.7%) | 305 (77.6%) |
| 5 Years | 35 (100.0%) | 43 (47.2%) |
| 6 to 11 Years | 432 (87.8%) | 315 (61.8%) |
| 12 to 14 Years | 342 (71.0%) | 347 (89.9%) |
| 15 Years | 43 (82.7%) | 95 (87.2%) |
| 16 and 17 Years | 162 (68.3%) | 109 (66.9%) |
| 18 to 24 Years | 514 (92.4%) | 446 (86.3%) |
| 25 to 34 Years | 819 (88.9%) | 609 (70.7%) |
| 35 to 44 Years | 788 (86.8%) | 715 (78.4%) |
| 45 to 54 Years | 721 (84.9%) | 824 (84.2%) |
| 55 to 64 Years | 856 (79.5%) | 892 (72.3%) |
| 65 to 74 Years | 696 (89.2%) | 705 (88.6%) |
| 75 Years and over | 375 (94.7%) | 447 (84.7%) |
| Total | 6,038 (84.2%) | 5,852 (78.3%) |
Income Below Poverty Among Married-Couple Families in Larue County
The poverty statistics for married-couple families in Larue County show that 6.4% or 197 of the total 3,083 families live below the poverty line. Families with 3 or 4 children have the highest poverty rate of 15.6%, comprising of 55 families. On the other hand, families with no children have the lowest poverty rate of 4.4%, which includes 76 families.
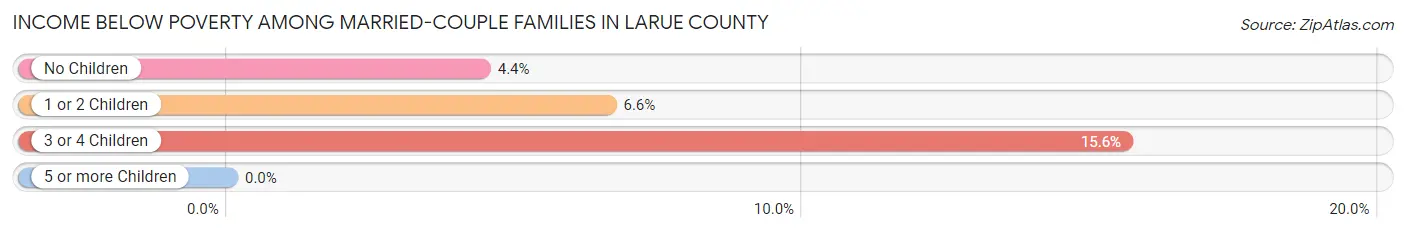
| Children | Above Poverty | Below Poverty |
| No Children | 1,652 (95.6%) | 76 (4.4%) |
| 1 or 2 Children | 936 (93.4%) | 66 (6.6%) |
| 3 or 4 Children | 298 (84.4%) | 55 (15.6%) |
| 5 or more Children | 0 (0.0%) | 0 (0.0%) |
| Total | 2,886 (93.6%) | 197 (6.4%) |
Income Below Poverty Among Single-Parent Households in Larue County
According to the poverty data in Larue County, 13.8% or 44 single-father households and 60.9% or 357 single-mother households are living below the poverty line. Among single-father households, those with 1 or 2 children have the highest poverty rate, with 41 households (20.3%) experiencing poverty. Likewise, among single-mother households, those with 3 or 4 children have the highest poverty rate, with 65 households (100.0%) falling below the poverty line.
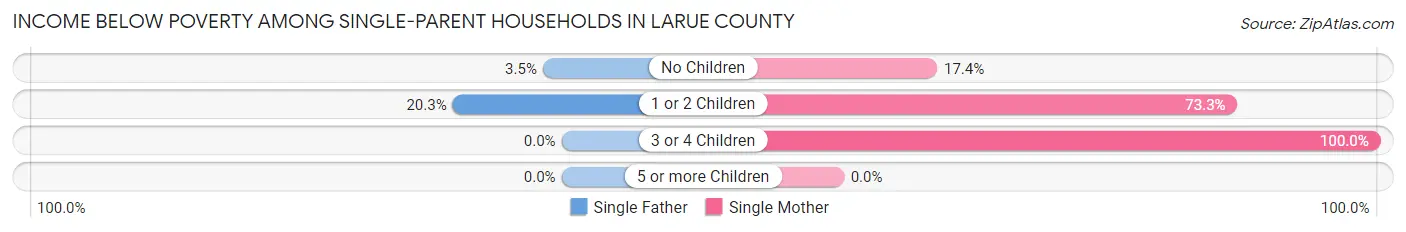
| Children | Single Father | Single Mother |
| No Children | 3 (3.5%) | 28 (17.4%) |
| 1 or 2 Children | 41 (20.3%) | 264 (73.3%) |
| 3 or 4 Children | 0 (0.0%) | 65 (100.0%) |
| 5 or more Children | 0 (0.0%) | 0 (0.0%) |
| Total | 44 (13.8%) | 357 (60.9%) |
Income Below Poverty Among Married-Couple vs Single-Parent Households in Larue County
The poverty data for Larue County shows that 197 of the married-couple family households (6.4%) and 401 of the single-parent households (44.3%) are living below the poverty level. Within the married-couple family households, those with 3 or 4 children have the highest poverty rate, with 55 households (15.6%) falling below the poverty line. Among the single-parent households, those with 3 or 4 children have the highest poverty rate, with 65 household (67.7%) living below poverty.
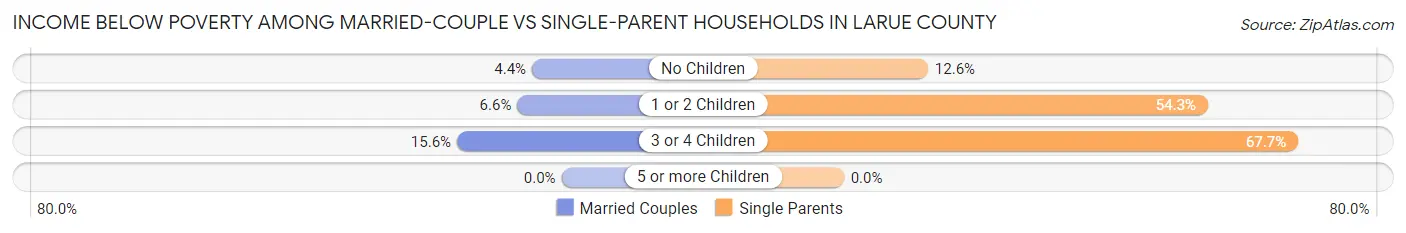
| Children | Married-Couple Families | Single-Parent Households |
| No Children | 76 (4.4%) | 31 (12.6%) |
| 1 or 2 Children | 66 (6.6%) | 305 (54.3%) |
| 3 or 4 Children | 55 (15.6%) | 65 (67.7%) |
| 5 or more Children | 0 (0.0%) | 0 (0.0%) |
| Total | 197 (6.4%) | 401 (44.3%) |
Race in Larue County
The most populous races in Larue County are White / Caucasian (13,644 | 91.6%), Two or more Races (602 | 4.0%), and Hispanic or Latino (497 | 3.3%).
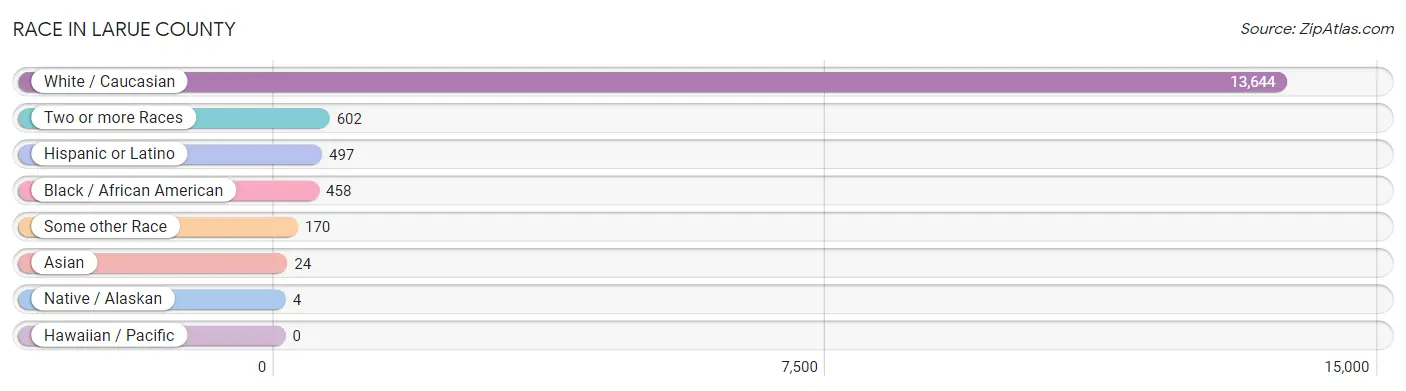
| Race | # Population | % Population |
| Asian | 24 | 0.2% |
| Black / African American | 458 | 3.1% |
| Hawaiian / Pacific | 0 | 0.0% |
| Hispanic or Latino | 497 | 3.3% |
| Native / Alaskan | 4 | 0.0% |
| White / Caucasian | 13,644 | 91.6% |
| Two or more Races | 602 | 4.0% |
| Some other Race | 170 | 1.1% |
| Total | 14,902 | 100.0% |
Ancestry in Larue County
The most populous ancestries reported in Larue County are American (1,845 | 12.4%), Irish (1,656 | 11.1%), English (1,624 | 10.9%), German (1,441 | 9.7%), and Scotch-Irish (349 | 2.3%), together accounting for 46.4% of all Larue County residents.
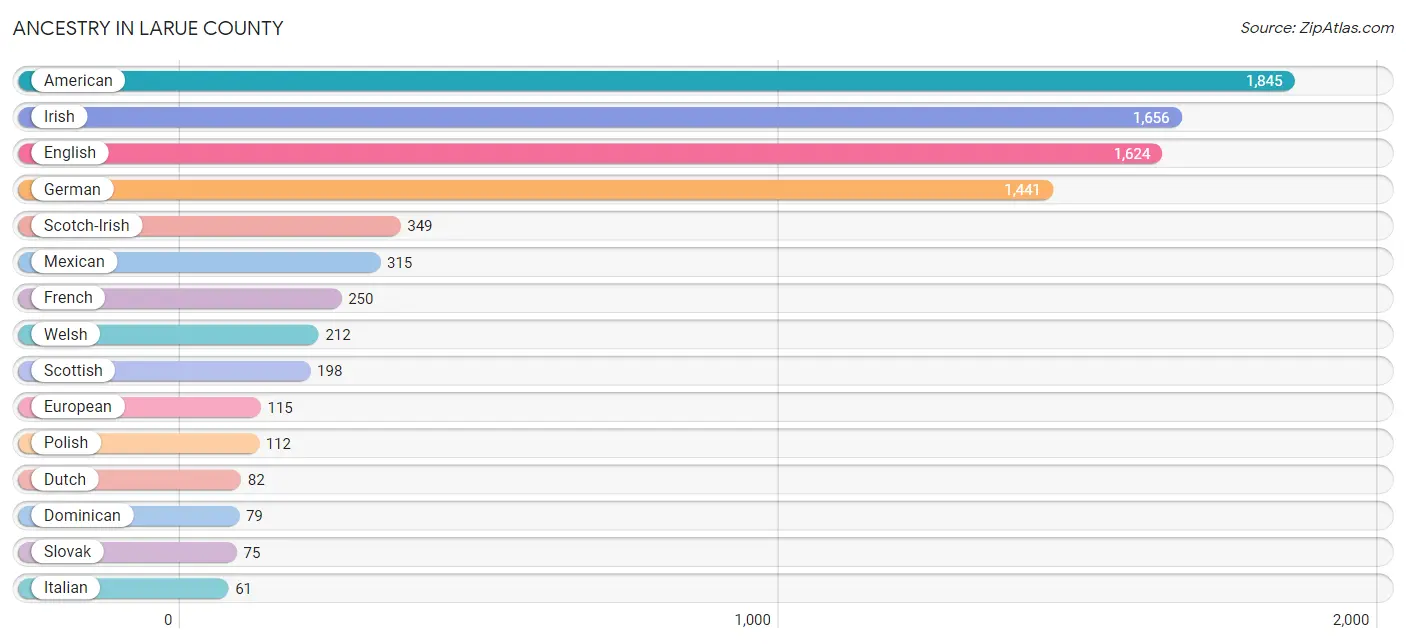
| Ancestry | # Population | % Population |
| African | 9 | 0.1% |
| American | 1,845 | 12.4% |
| Arab | 54 | 0.4% |
| Bhutanese | 32 | 0.2% |
| British | 19 | 0.1% |
| Canadian | 2 | 0.0% |
| Central American | 24 | 0.2% |
| Cherokee | 18 | 0.1% |
| Dominican | 79 | 0.5% |
| Dutch | 82 | 0.5% |
| Eastern European | 48 | 0.3% |
| English | 1,624 | 10.9% |
| European | 115 | 0.8% |
| Finnish | 31 | 0.2% |
| French | 250 | 1.7% |
| French Canadian | 9 | 0.1% |
| German | 1,441 | 9.7% |
| Greek | 43 | 0.3% |
| Guatemalan | 24 | 0.2% |
| Haitian | 24 | 0.2% |
| Indian (Asian) | 24 | 0.2% |
| Irish | 1,656 | 11.1% |
| Iroquois | 3 | 0.0% |
| Italian | 61 | 0.4% |
| Japanese | 7 | 0.1% |
| Lithuanian | 9 | 0.1% |
| Mexican | 315 | 2.1% |
| Moroccan | 53 | 0.4% |
| Norwegian | 29 | 0.2% |
| Osage | 3 | 0.0% |
| Palestinian | 1 | 0.0% |
| Polish | 112 | 0.7% |
| Portuguese | 7 | 0.1% |
| Puerto Rican | 4 | 0.0% |
| Scotch-Irish | 349 | 2.3% |
| Scottish | 198 | 1.3% |
| Slovak | 75 | 0.5% |
| Spaniard | 22 | 0.2% |
| Spanish | 15 | 0.1% |
| Subsaharan African | 9 | 0.1% |
| Swedish | 18 | 0.1% |
| Welsh | 212 | 1.4% | View All 42 Rows |
Immigrants in Larue County
The most numerous immigrant groups reported in Larue County came from Latin America (106 | 0.7%), Central America (58 | 0.4%), Europe (58 | 0.4%), Mexico (58 | 0.4%), and Southern Europe (58 | 0.4%), together accounting for 2.3% of all Larue County residents.
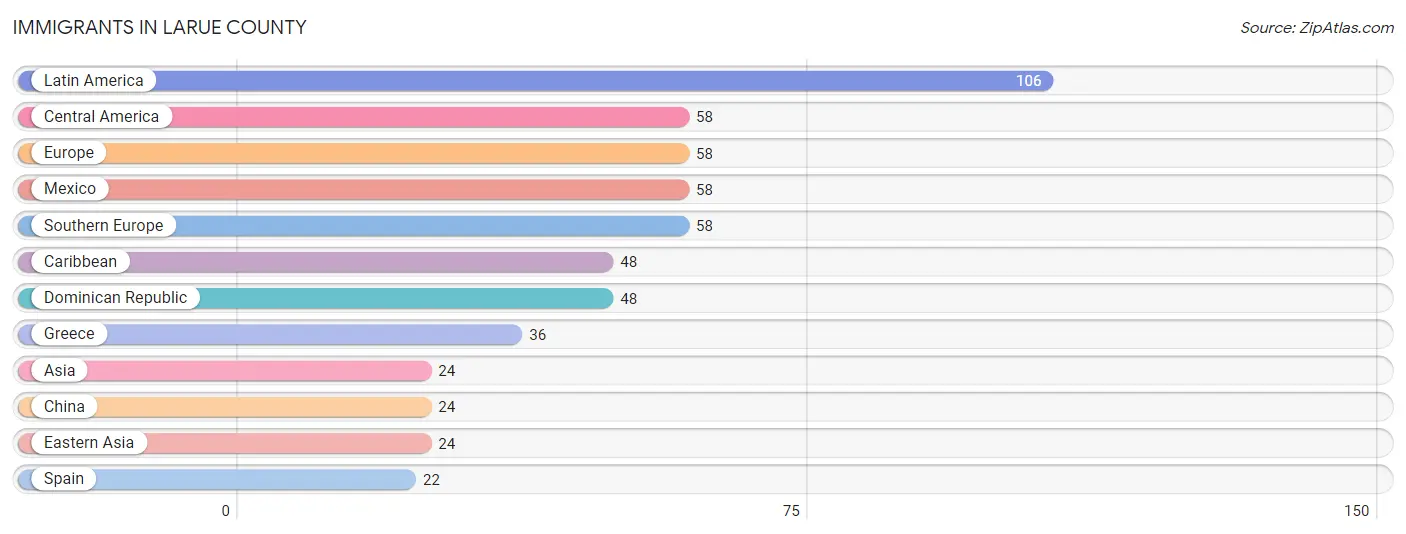
| Immigration Origin | # Population | % Population |
| Asia | 24 | 0.2% |
| Caribbean | 48 | 0.3% |
| Central America | 58 | 0.4% |
| China | 24 | 0.2% |
| Dominican Republic | 48 | 0.3% |
| Eastern Asia | 24 | 0.2% |
| Europe | 58 | 0.4% |
| Greece | 36 | 0.2% |
| Latin America | 106 | 0.7% |
| Mexico | 58 | 0.4% |
| Southern Europe | 58 | 0.4% |
| Spain | 22 | 0.2% | View All 12 Rows |
Sex and Age in Larue County
Sex and Age in Larue County
The most populous age groups in Larue County are 10 to 14 Years (699 | 9.5%) for men and 60 to 64 Years (747 | 9.9%) for women.
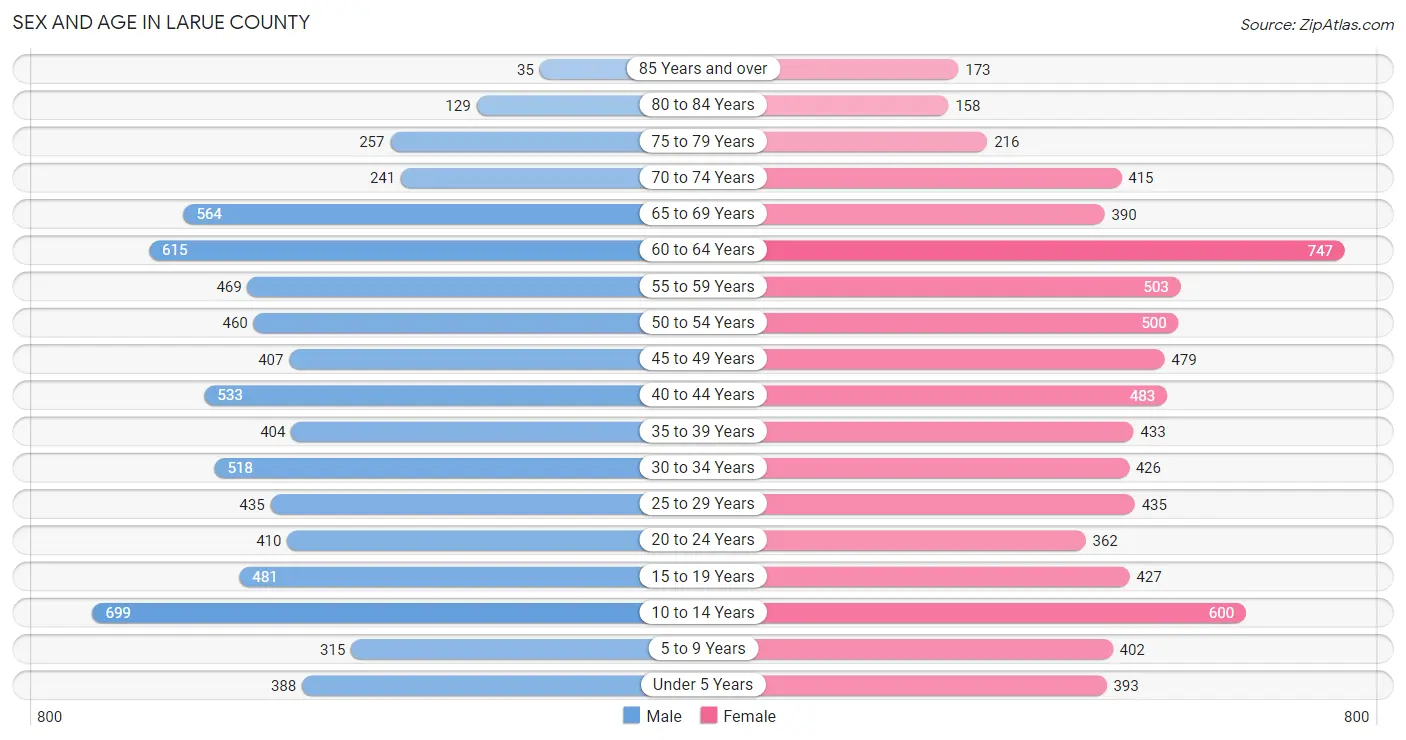
| Age Bracket | Male | Female |
| Under 5 Years | 388 (5.3%) | 393 (5.2%) |
| 5 to 9 Years | 315 (4.3%) | 402 (5.3%) |
| 10 to 14 Years | 699 (9.5%) | 600 (8.0%) |
| 15 to 19 Years | 481 (6.5%) | 427 (5.7%) |
| 20 to 24 Years | 410 (5.6%) | 362 (4.8%) |
| 25 to 29 Years | 435 (5.9%) | 435 (5.8%) |
| 30 to 34 Years | 518 (7.0%) | 426 (5.7%) |
| 35 to 39 Years | 404 (5.5%) | 433 (5.7%) |
| 40 to 44 Years | 533 (7.2%) | 483 (6.4%) |
| 45 to 49 Years | 407 (5.5%) | 479 (6.4%) |
| 50 to 54 Years | 460 (6.2%) | 500 (6.6%) |
| 55 to 59 Years | 469 (6.4%) | 503 (6.7%) |
| 60 to 64 Years | 615 (8.4%) | 747 (9.9%) |
| 65 to 69 Years | 564 (7.7%) | 390 (5.2%) |
| 70 to 74 Years | 241 (3.3%) | 415 (5.5%) |
| 75 to 79 Years | 257 (3.5%) | 216 (2.9%) |
| 80 to 84 Years | 129 (1.8%) | 158 (2.1%) |
| 85 Years and over | 35 (0.5%) | 173 (2.3%) |
| Total | 7,360 (100.0%) | 7,542 (100.0%) |
Families and Households in Larue County
Median Family Size in Larue County
The median family size in Larue County is 3.00 persons per family, with married-couple families (3,083 | 77.3%) accounting for the largest median family size of 3.11 persons per family. On the other hand, single male/father families (319 | 8.0%) represent the smallest median family size with 2.58 persons per family.
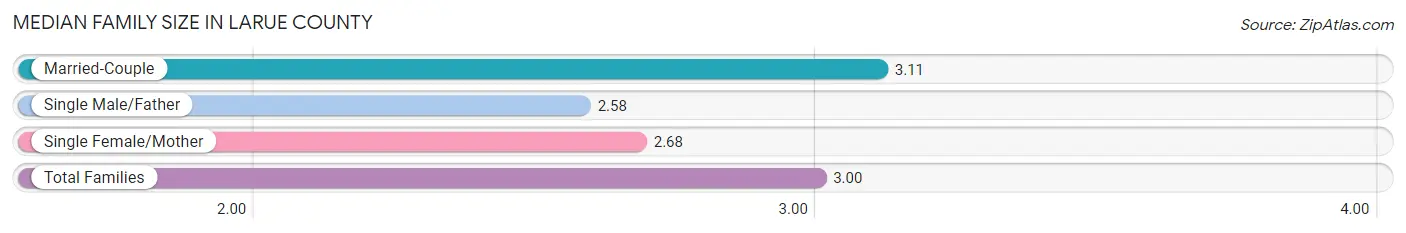
| Family Type | # Families | Family Size |
| Married-Couple | 3,083 (77.3%) | 3.11 |
| Single Male/Father | 319 (8.0%) | 2.58 |
| Single Female/Mother | 586 (14.7%) | 2.68 |
| Total Families | 3,988 (100.0%) | 3.00 |
Median Household Size in Larue County
The median household size in Larue County is 2.46 persons per household, with married-couple households (3,083 | 51.7%) accounting for the largest median household size of 3.13 persons per household. non-family households (1,979 | 33.2%) represent the smallest median household size with 1.22 persons per household.
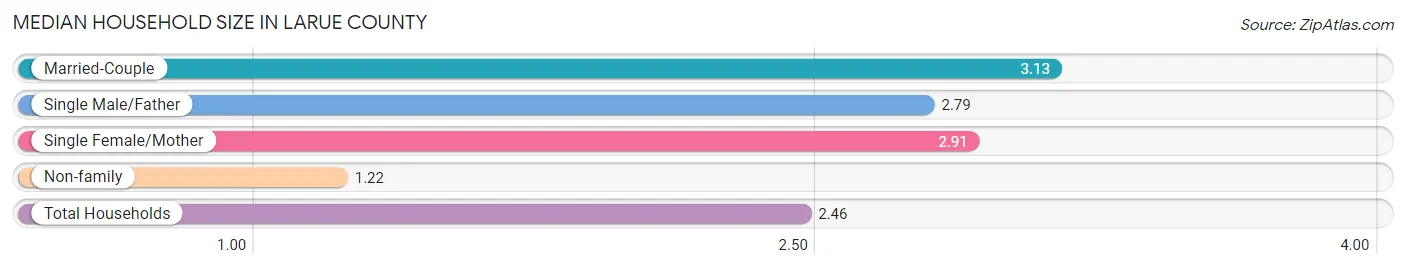
| Household Type | # Households | Household Size |
| Married-Couple | 3,083 (51.7%) | 3.13 |
| Single Male/Father | 319 (5.3%) | 2.79 |
| Single Female/Mother | 586 (9.8%) | 2.91 |
| Non-family | 1,979 (33.2%) | 1.22 |
| Total Households | 5,967 (100.0%) | 2.46 |
Household Size by Marriage Status in Larue County
Out of a total of 5,967 households in Larue County, 3,988 (66.8%) are family households, while 1,979 (33.2%) are nonfamily households. The most numerous type of family households are 2-person households, comprising 1,673, and the most common type of nonfamily households are 1-person households, comprising 1,582.
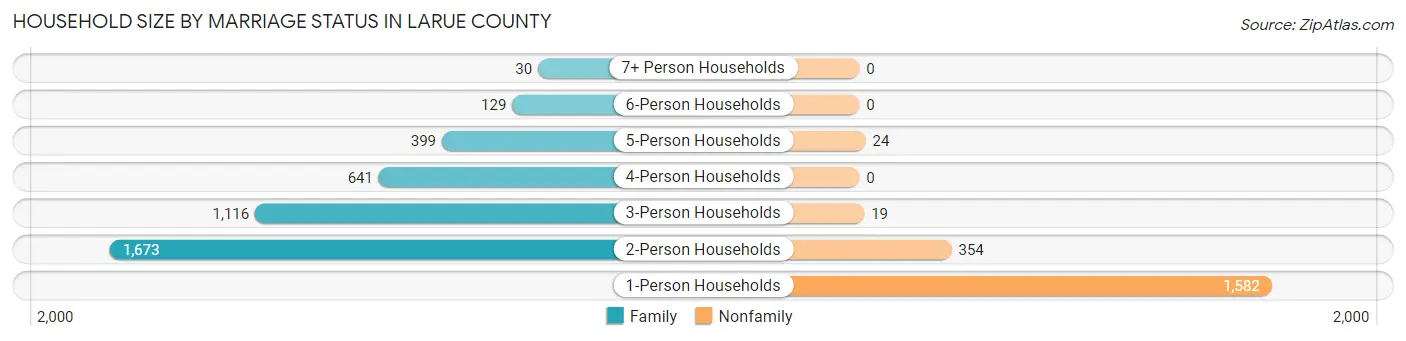
| Household Size | Family Households | Nonfamily Households |
| 1-Person Households | - | 1,582 (26.5%) |
| 2-Person Households | 1,673 (28.0%) | 354 (5.9%) |
| 3-Person Households | 1,116 (18.7%) | 19 (0.3%) |
| 4-Person Households | 641 (10.7%) | 0 (0.0%) |
| 5-Person Households | 399 (6.7%) | 24 (0.4%) |
| 6-Person Households | 129 (2.2%) | 0 (0.0%) |
| 7+ Person Households | 30 (0.5%) | 0 (0.0%) |
| Total | 3,988 (66.8%) | 1,979 (33.2%) |
Female Fertility in Larue County
Fertility by Age in Larue County
Average fertility rate in Larue County is 51.0 births per 1,000 women. Women in the age bracket of 20 to 34 years have the highest fertility rate with 94.0 births per 1,000 women. Women in the age bracket of 20 to 34 years acount for 71.4% of all women with births.
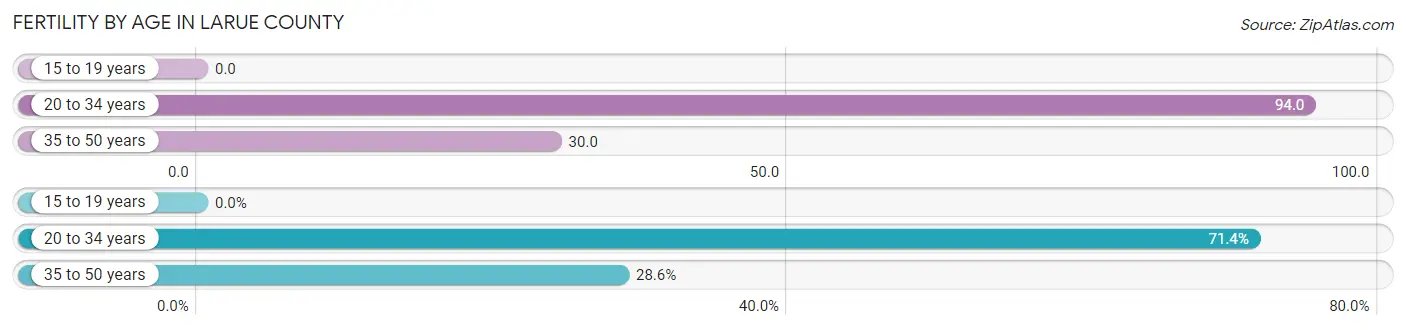
| Age Bracket | Women with Births | Births / 1,000 Women |
| 15 to 19 years | 0 (0.0%) | 0.0 |
| 20 to 34 years | 115 (71.4%) | 94.0 |
| 35 to 50 years | 46 (28.6%) | 30.0 |
| Total | 161 (100.0%) | 51.0 |
Fertility by Age by Marriage Status in Larue County
72.7% of women with births (161) in Larue County are married. The highest percentage of unmarried women with births falls into 35 to 50 years age bracket with 43.5% of them unmarried at the time of birth, while the lowest percentage of unmarried women with births belong to 20 to 34 years age bracket with 20.9% of them unmarried.
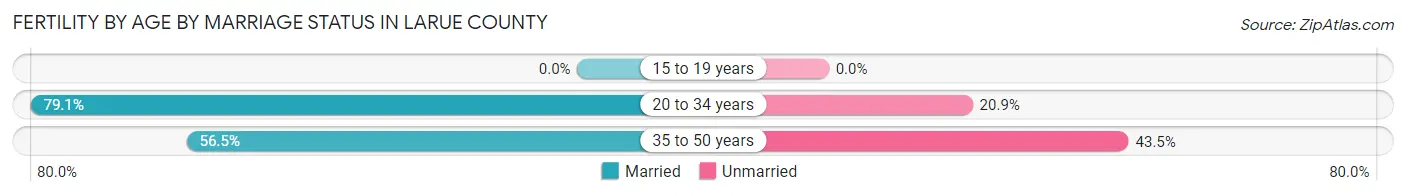
| Age Bracket | Married | Unmarried |
| 15 to 19 years | 0 (0.0%) | 0 (0.0%) |
| 20 to 34 years | 91 (79.1%) | 24 (20.9%) |
| 35 to 50 years | 26 (56.5%) | 20 (43.5%) |
| Total | 117 (72.7%) | 44 (27.3%) |
Fertility by Education in Larue County
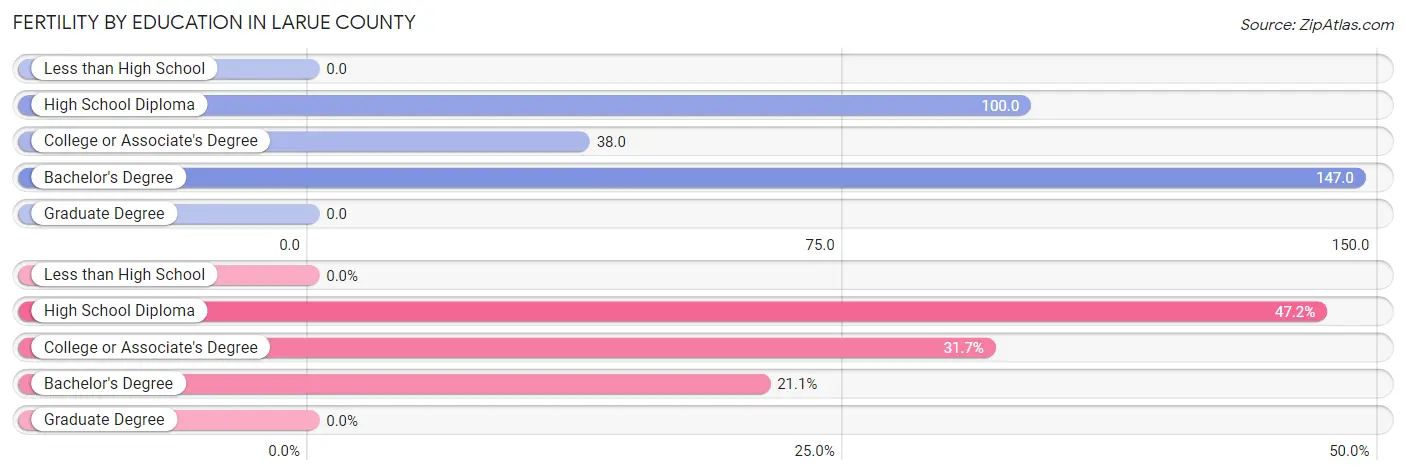
| Educational Attainment | Women with Births | Births / 1,000 Women |
| Less than High School | 0 (0.0%) | 0.0 |
| High School Diploma | 76 (47.2%) | 100.0 |
| College or Associate's Degree | 51 (31.7%) | 38.0 |
| Bachelor's Degree | 34 (21.1%) | 147.0 |
| Graduate Degree | 0 (0.0%) | 0.0 |
| Total | 161 (100.0%) | 51.0 |
Fertility by Education by Marriage Status in Larue County
27.3% of women with births in Larue County are unmarried. Women with the educational attainment of college or associate's degree are most likely to be married with 100.0% of them married at childbirth, while women with the educational attainment of high school diploma are least likely to be married with 57.9% of them unmarried at childbirth.
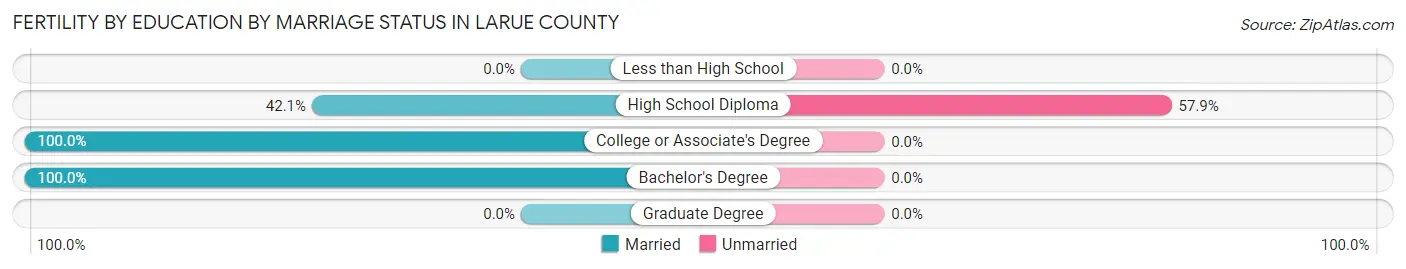
| Educational Attainment | Married | Unmarried |
| Less than High School | 0 (0.0%) | 0 (0.0%) |
| High School Diploma | 32 (42.1%) | 44 (57.9%) |
| College or Associate's Degree | 51 (100.0%) | 0 (0.0%) |
| Bachelor's Degree | 34 (100.0%) | 0 (0.0%) |
| Graduate Degree | 0 (0.0%) | 0 (0.0%) |
| Total | 117 (72.7%) | 44 (27.3%) |
Employment Characteristics in Larue County
Employment by Class of Employer in Larue County
Among the 6,371 employed individuals in Larue County, private company employees (4,571 | 71.8%), not-for-profit organizations (455 | 7.1%), and local government employees (403 | 6.3%) make up the most common classes of employment.
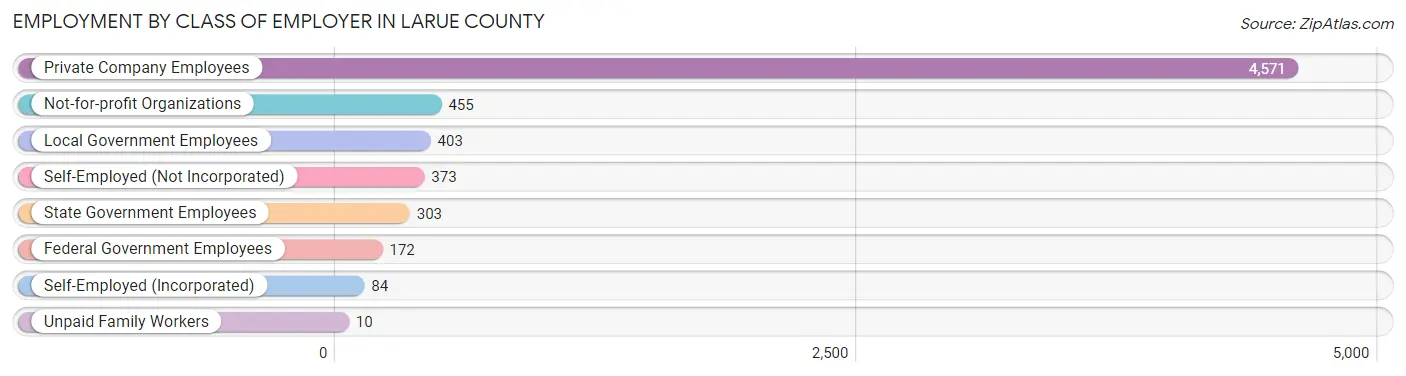
| Employer Class | # Employees | % Employees |
| Private Company Employees | 4,571 | 71.8% |
| Self-Employed (Incorporated) | 84 | 1.3% |
| Self-Employed (Not Incorporated) | 373 | 5.9% |
| Not-for-profit Organizations | 455 | 7.1% |
| Local Government Employees | 403 | 6.3% |
| State Government Employees | 303 | 4.8% |
| Federal Government Employees | 172 | 2.7% |
| Unpaid Family Workers | 10 | 0.2% |
| Total | 6,371 | 100.0% |
Employment Status by Age in Larue County
According to the labor force statistics for Larue County, out of the total population over 16 years of age (11,944), 55.8% or 6,665 individuals are in the labor force, with 2.8% or 187 of them unemployed. The age group with the highest labor force participation rate is 25 to 29 years, with 78.5% or 683 individuals in the labor force. Within the labor force, the 16 to 19 years age range has the highest percentage of unemployed individuals, with 17.0% or 60 of them being unemployed.
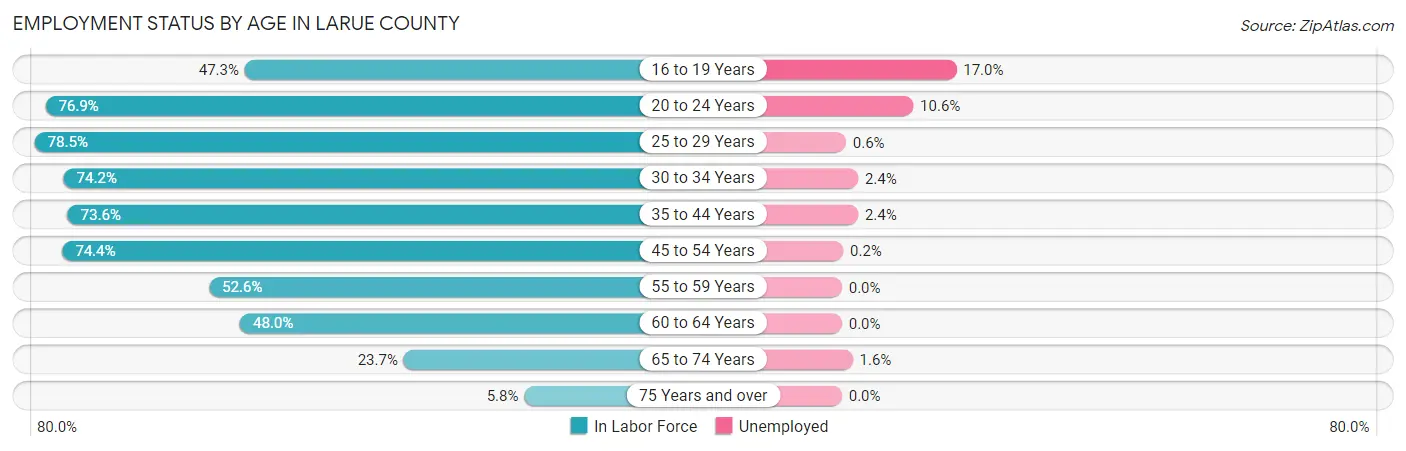
| Age Bracket | In Labor Force | Unemployed |
| 16 to 19 Years | 353 (47.3%) | 60 (17.0%) |
| 20 to 24 Years | 594 (76.9%) | 63 (10.6%) |
| 25 to 29 Years | 683 (78.5%) | 4 (0.6%) |
| 30 to 34 Years | 700 (74.2%) | 17 (2.4%) |
| 35 to 44 Years | 1,364 (73.6%) | 33 (2.4%) |
| 45 to 54 Years | 1,373 (74.4%) | 3 (0.2%) |
| 55 to 59 Years | 511 (52.6%) | 0 (0.0%) |
| 60 to 64 Years | 654 (48.0%) | 0 (0.0%) |
| 65 to 74 Years | 382 (23.7%) | 6 (1.6%) |
| 75 Years and over | 56 (5.8%) | 0 (0.0%) |
| Total | 6,665 (55.8%) | 187 (2.8%) |
Employment Status by Educational Attainment in Larue County
According to labor force statistics for Larue County, 67.3% of individuals (5,281) out of the total population between 25 and 64 years of age (7,847) are in the labor force, with 1.1% or 58 of them being unemployed. The group with the highest labor force participation rate are those with the educational attainment of bachelor's degree or higher, with 94.4% or 1,204 individuals in the labor force. Within the labor force, individuals with high school diploma education have the highest percentage of unemployment, with 2.5% or 46 of them being unemployed.
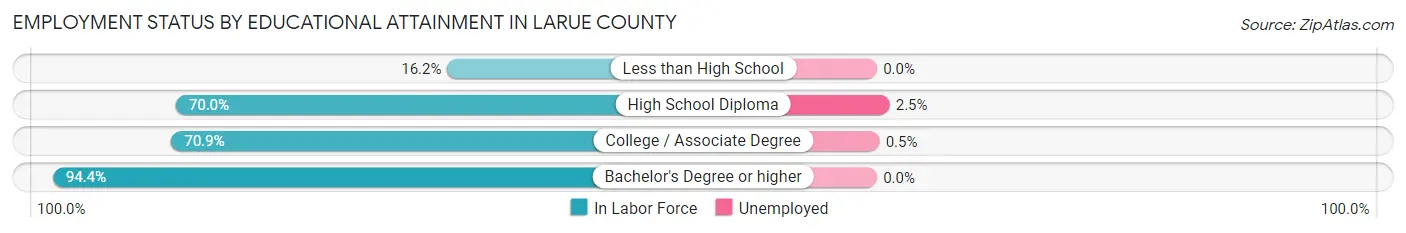
| Educational Attainment | In Labor Force | Unemployed |
| Less than High School | 164 (16.2%) | 0 (0.0%) |
| High School Diploma | 1,852 (70.0%) | 66 (2.5%) |
| College / Associate Degree | 2,065 (70.9%) | 15 (0.5%) |
| Bachelor's Degree or higher | 1,204 (94.4%) | 0 (0.0%) |
| Total | 5,281 (67.3%) | 86 (1.1%) |
Employment Occupations by Sex in Larue County
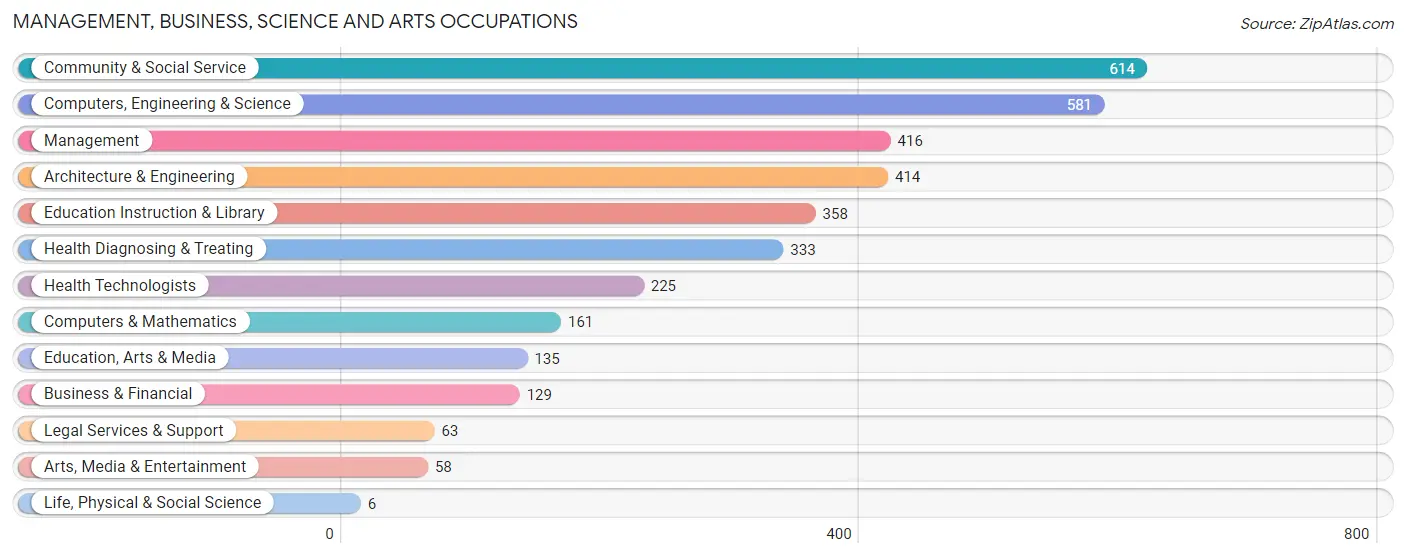
Management, Business, Science and Arts Occupations
The most common Management, Business, Science and Arts occupations in Larue County are Community & Social Service (614 | 9.5%), Computers, Engineering & Science (581 | 9.0%), Management (416 | 6.4%), Architecture & Engineering (414 | 6.4%), and Education Instruction & Library (358 | 5.5%).
Management, Business, Science and Arts Occupations by Sex
Within the Management, Business, Science and Arts occupations in Larue County, the most male-oriented occupations are Life, Physical & Social Science (100.0%), Computers & Mathematics (87.0%), and Computers, Engineering & Science (76.9%), while the most female-oriented occupations are Legal Services & Support (77.8%), Health Diagnosing & Treating (71.5%), and Business & Financial (70.5%).
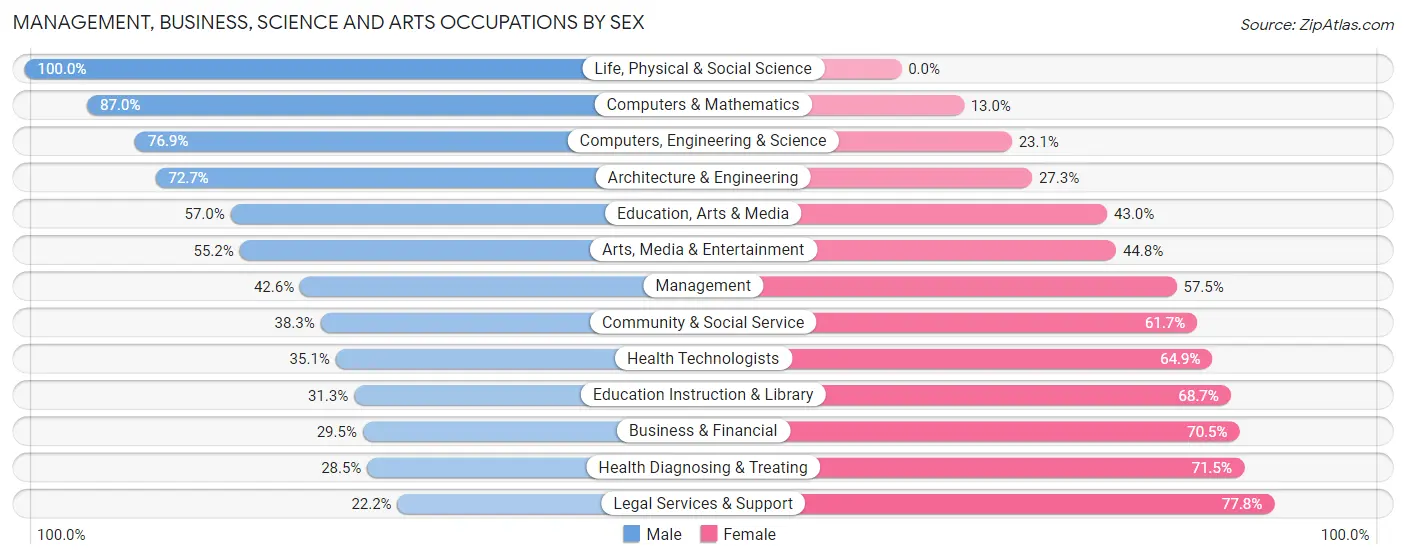
| Occupation | Male | Female |
| Management | 177 (42.5%) | 239 (57.5%) |
| Business & Financial | 38 (29.5%) | 91 (70.5%) |
| Computers, Engineering & Science | 447 (76.9%) | 134 (23.1%) |
| Computers & Mathematics | 140 (87.0%) | 21 (13.0%) |
| Architecture & Engineering | 301 (72.7%) | 113 (27.3%) |
| Life, Physical & Social Science | 6 (100.0%) | 0 (0.0%) |
| Community & Social Service | 235 (38.3%) | 379 (61.7%) |
| Education, Arts & Media | 77 (57.0%) | 58 (43.0%) |
| Legal Services & Support | 14 (22.2%) | 49 (77.8%) |
| Education Instruction & Library | 112 (31.3%) | 246 (68.7%) |
| Arts, Media & Entertainment | 32 (55.2%) | 26 (44.8%) |
| Health Diagnosing & Treating | 95 (28.5%) | 238 (71.5%) |
| Health Technologists | 79 (35.1%) | 146 (64.9%) |
| Total (Category) | 992 (47.8%) | 1,081 (52.1%) |
| Total (Overall) | 3,644 (56.3%) | 2,829 (43.7%) |
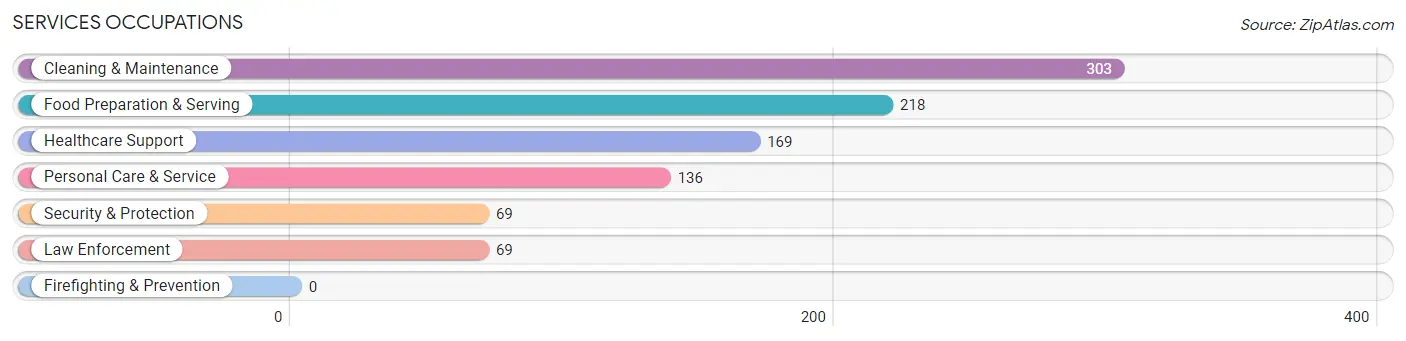
Services Occupations
The most common Services occupations in Larue County are Cleaning & Maintenance (303 | 4.7%), Food Preparation & Serving (218 | 3.4%), Healthcare Support (169 | 2.6%), Personal Care & Service (136 | 2.1%), and Security & Protection (69 | 1.1%).
Services Occupations by Sex
Within the Services occupations in Larue County, the most male-oriented occupations are Security & Protection (73.9%), Law Enforcement (73.9%), and Cleaning & Maintenance (64.0%), while the most female-oriented occupations are Healthcare Support (81.1%), Personal Care & Service (80.1%), and Food Preparation & Serving (57.3%).
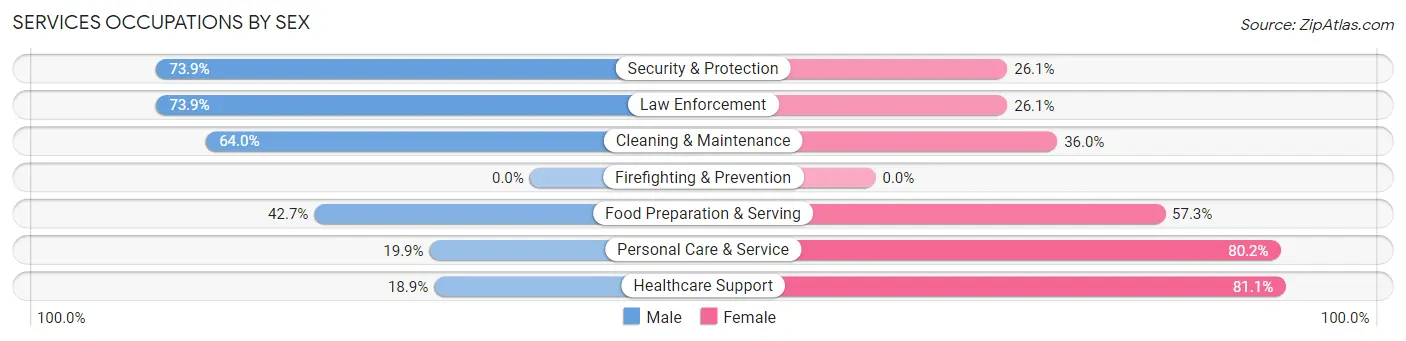
| Occupation | Male | Female |
| Healthcare Support | 32 (18.9%) | 137 (81.1%) |
| Security & Protection | 51 (73.9%) | 18 (26.1%) |
| Firefighting & Prevention | 0 (0.0%) | 0 (0.0%) |
| Law Enforcement | 51 (73.9%) | 18 (26.1%) |
| Food Preparation & Serving | 93 (42.7%) | 125 (57.3%) |
| Cleaning & Maintenance | 194 (64.0%) | 109 (36.0%) |
| Personal Care & Service | 27 (19.9%) | 109 (80.1%) |
| Total (Category) | 397 (44.4%) | 498 (55.6%) |
| Total (Overall) | 3,644 (56.3%) | 2,829 (43.7%) |
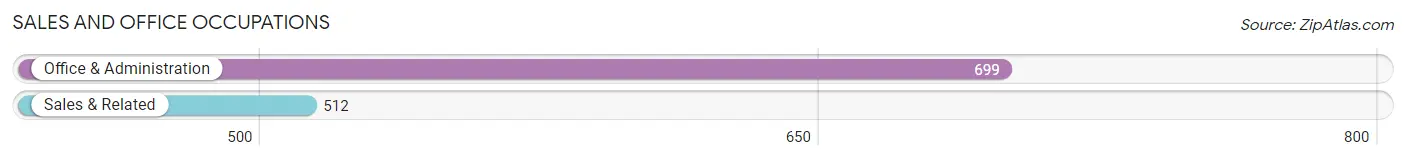
Sales and Office Occupations
The most common Sales and Office occupations in Larue County are Office & Administration (699 | 10.8%), and Sales & Related (512 | 7.9%).
Sales and Office Occupations by Sex
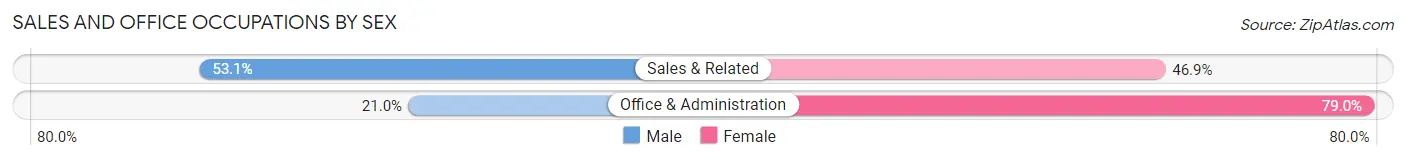
| Occupation | Male | Female |
| Sales & Related | 272 (53.1%) | 240 (46.9%) |
| Office & Administration | 147 (21.0%) | 552 (79.0%) |
| Total (Category) | 419 (34.6%) | 792 (65.4%) |
| Total (Overall) | 3,644 (56.3%) | 2,829 (43.7%) |
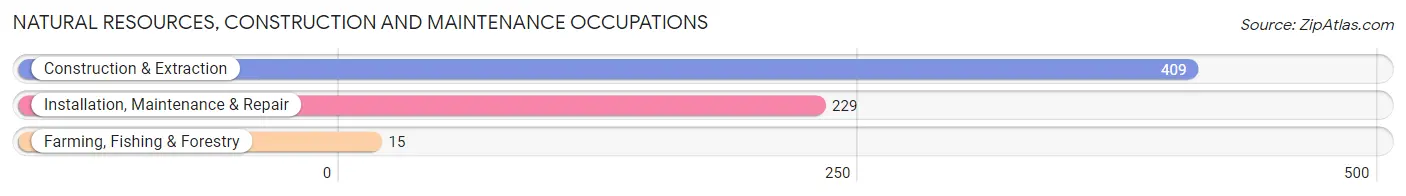
Natural Resources, Construction and Maintenance Occupations
The most common Natural Resources, Construction and Maintenance occupations in Larue County are Construction & Extraction (409 | 6.3%), Installation, Maintenance & Repair (229 | 3.5%), and Farming, Fishing & Forestry (15 | 0.2%).
Natural Resources, Construction and Maintenance Occupations by Sex
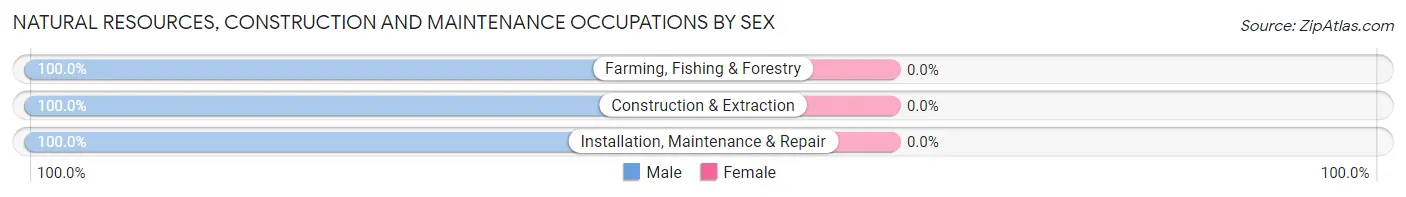
| Occupation | Male | Female |
| Farming, Fishing & Forestry | 15 (100.0%) | 0 (0.0%) |
| Construction & Extraction | 409 (100.0%) | 0 (0.0%) |
| Installation, Maintenance & Repair | 229 (100.0%) | 0 (0.0%) |
| Total (Category) | 653 (100.0%) | 0 (0.0%) |
| Total (Overall) | 3,644 (56.3%) | 2,829 (43.7%) |
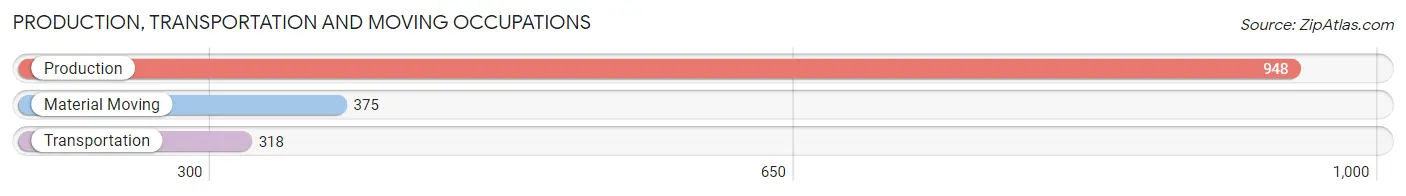
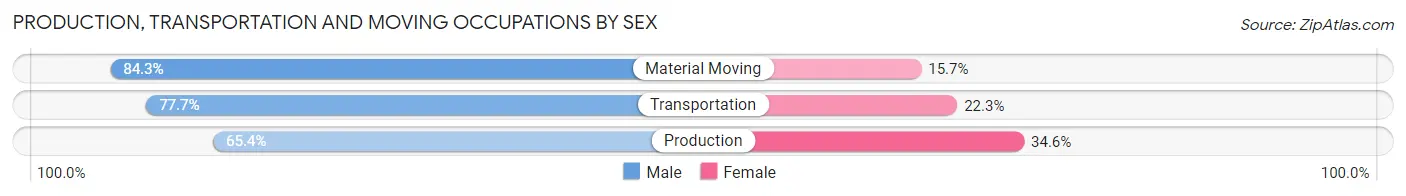
Production, Transportation and Moving Occupations
The most common Production, Transportation and Moving occupations in Larue County are Production (948 | 14.6%), Material Moving (375 | 5.8%), and Transportation (318 | 4.9%).
Production, Transportation and Moving Occupations by Sex
| Occupation | Male | Female |
| Production | 620 (65.4%) | 328 (34.6%) |
| Transportation | 247 (77.7%) | 71 (22.3%) |
| Material Moving | 316 (84.3%) | 59 (15.7%) |
| Total (Category) | 1,183 (72.1%) | 458 (27.9%) |
| Total (Overall) | 3,644 (56.3%) | 2,829 (43.7%) |
Employment Industries by Sex in Larue County
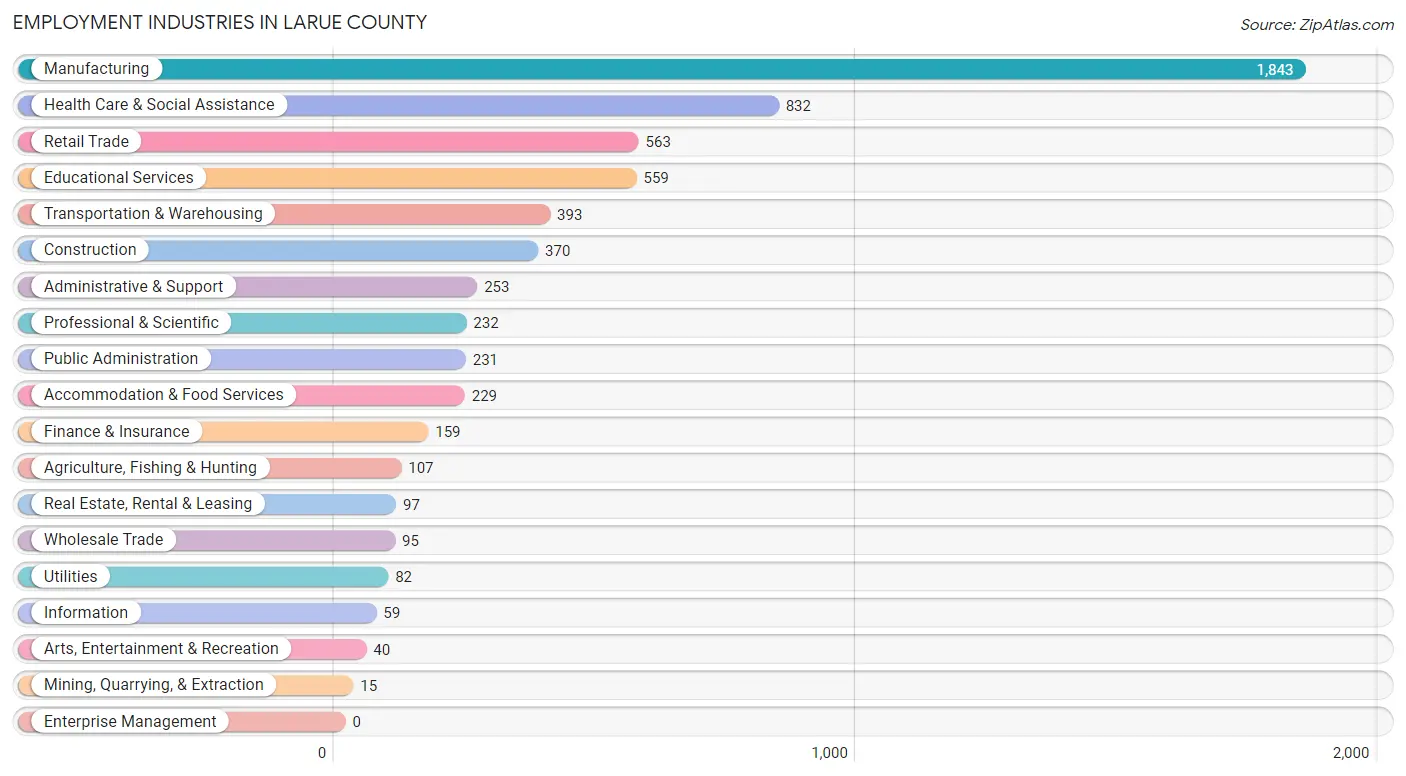
Employment Industries in Larue County
The major employment industries in Larue County include Manufacturing (1,843 | 28.5%), Health Care & Social Assistance (832 | 12.9%), Retail Trade (563 | 8.7%), Educational Services (559 | 8.6%), and Transportation & Warehousing (393 | 6.1%).
Employment Industries by Sex in Larue County
The Larue County industries that see more men than women are Mining, Quarrying, & Extraction (100.0%), Wholesale Trade (100.0%), and Utilities (100.0%), whereas the industries that tend to have a higher number of women are Real Estate, Rental & Leasing (82.5%), Finance & Insurance (73.0%), and Health Care & Social Assistance (72.8%).
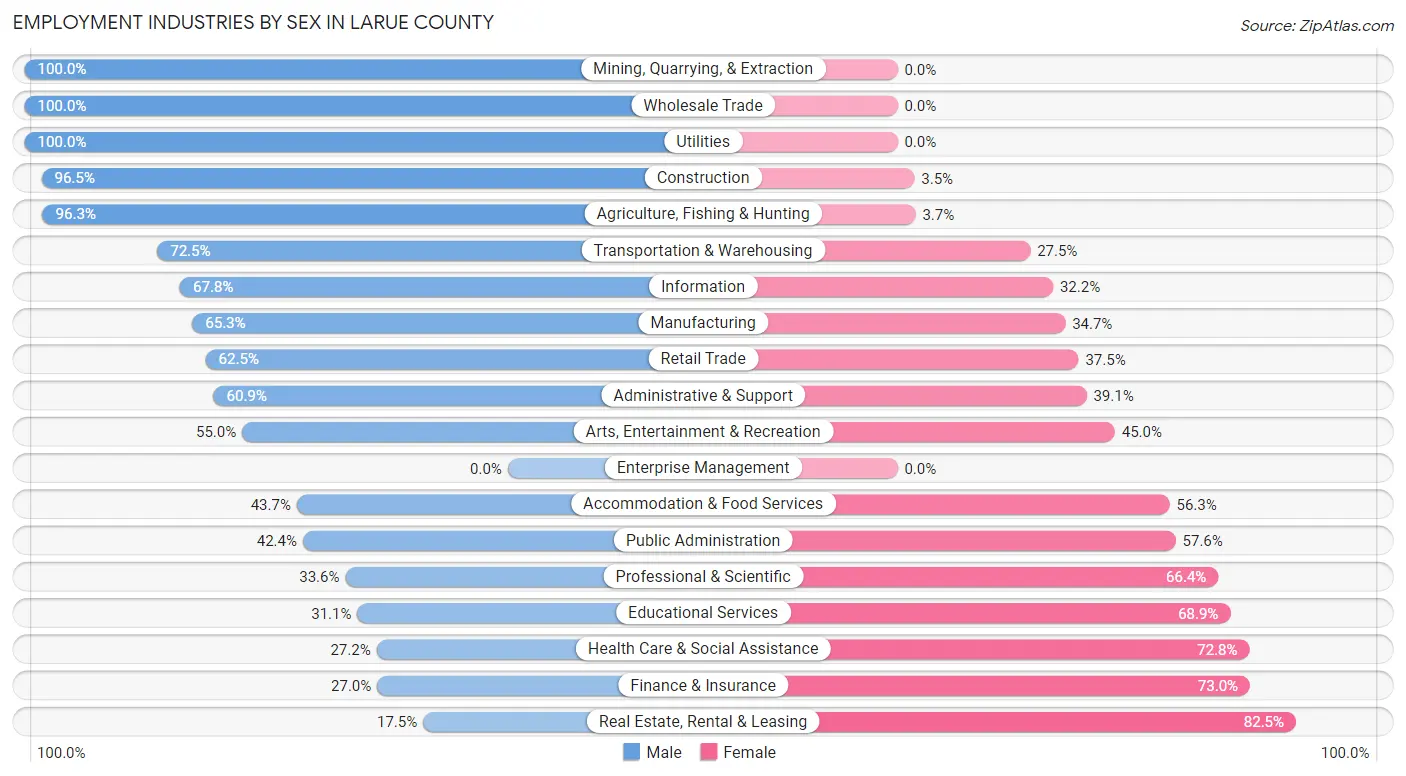
| Industry | Male | Female |
| Agriculture, Fishing & Hunting | 103 (96.3%) | 4 (3.7%) |
| Mining, Quarrying, & Extraction | 15 (100.0%) | 0 (0.0%) |
| Construction | 357 (96.5%) | 13 (3.5%) |
| Manufacturing | 1,203 (65.3%) | 640 (34.7%) |
| Wholesale Trade | 95 (100.0%) | 0 (0.0%) |
| Retail Trade | 352 (62.5%) | 211 (37.5%) |
| Transportation & Warehousing | 285 (72.5%) | 108 (27.5%) |
| Utilities | 82 (100.0%) | 0 (0.0%) |
| Information | 40 (67.8%) | 19 (32.2%) |
| Finance & Insurance | 43 (27.0%) | 116 (73.0%) |
| Real Estate, Rental & Leasing | 17 (17.5%) | 80 (82.5%) |
| Professional & Scientific | 78 (33.6%) | 154 (66.4%) |
| Enterprise Management | 0 (0.0%) | 0 (0.0%) |
| Administrative & Support | 154 (60.9%) | 99 (39.1%) |
| Educational Services | 174 (31.1%) | 385 (68.9%) |
| Health Care & Social Assistance | 226 (27.2%) | 606 (72.8%) |
| Arts, Entertainment & Recreation | 22 (55.0%) | 18 (45.0%) |
| Accommodation & Food Services | 100 (43.7%) | 129 (56.3%) |
| Public Administration | 98 (42.4%) | 133 (57.6%) |
| Total | 3,644 (56.3%) | 2,829 (43.7%) |
Education in Larue County
School Enrollment in Larue County
The most common levels of schooling among the 3,069 students in Larue County are middle school (1,094 | 35.6%), elementary school (655 | 21.3%), and high school (620 | 20.2%).
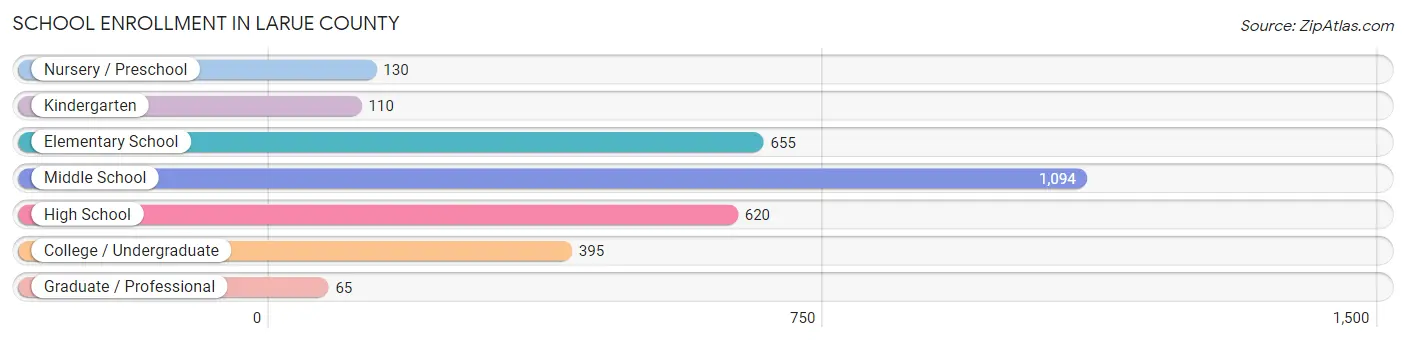
| School Level | # Students | % Students |
| Nursery / Preschool | 130 | 4.2% |
| Kindergarten | 110 | 3.6% |
| Elementary School | 655 | 21.3% |
| Middle School | 1,094 | 35.6% |
| High School | 620 | 20.2% |
| College / Undergraduate | 395 | 12.9% |
| Graduate / Professional | 65 | 2.1% |
| Total | 3,069 | 100.0% |
School Enrollment by Age by Funding Source in Larue County
Out of a total of 3,069 students who are enrolled in schools in Larue County, 377 (12.3%) attend a private institution, while the remaining 2,692 (87.7%) are enrolled in public schools. The age group of 3 to 4 year olds has the highest likelihood of being enrolled in private schools, with 54 (55.1% in the age bracket) enrolled. Conversely, the age group of 15 to 17 year olds has the lowest likelihood of being enrolled in a private school, with 497 (93.1% in the age bracket) attending a public institution.
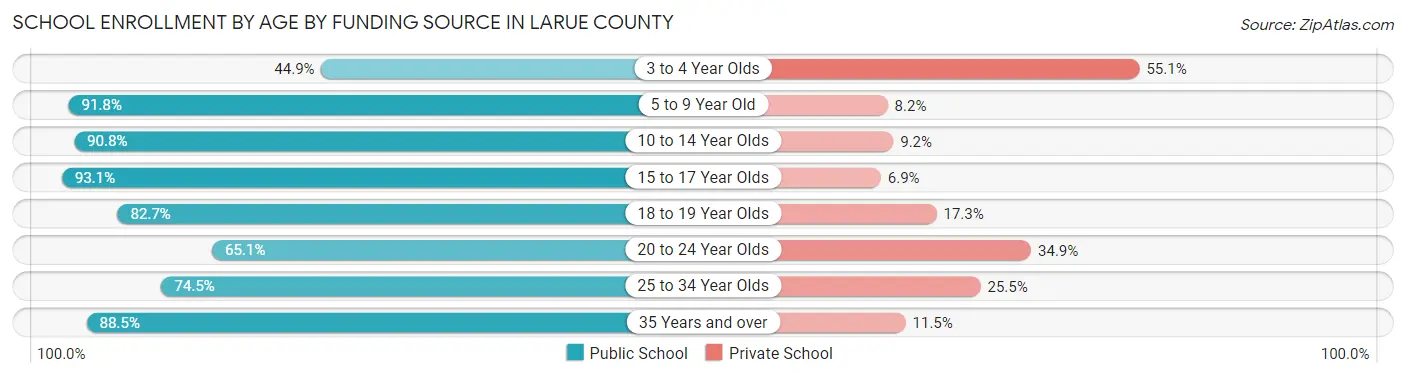
| Age Bracket | Public School | Private School |
| 3 to 4 Year Olds | 44 (44.9%) | 54 (55.1%) |
| 5 to 9 Year Old | 628 (91.8%) | 56 (8.2%) |
| 10 to 14 Year Olds | 1,129 (90.8%) | 115 (9.2%) |
| 15 to 17 Year Olds | 497 (93.1%) | 37 (6.9%) |
| 18 to 19 Year Olds | 153 (82.7%) | 32 (17.3%) |
| 20 to 24 Year Olds | 110 (65.1%) | 59 (34.9%) |
| 25 to 34 Year Olds | 38 (74.5%) | 13 (25.5%) |
| 35 Years and over | 92 (88.5%) | 12 (11.5%) |
| Total | 2,692 (87.7%) | 377 (12.3%) |
Educational Attainment by Field of Study in Larue County
Business (385 | 22.4%), education (286 | 16.7%), science & technology (268 | 15.6%), liberal arts & history (228 | 13.3%), and arts & humanities (144 | 8.4%) are the most common fields of study among 1,716 individuals in Larue County who have obtained a bachelor's degree or higher.
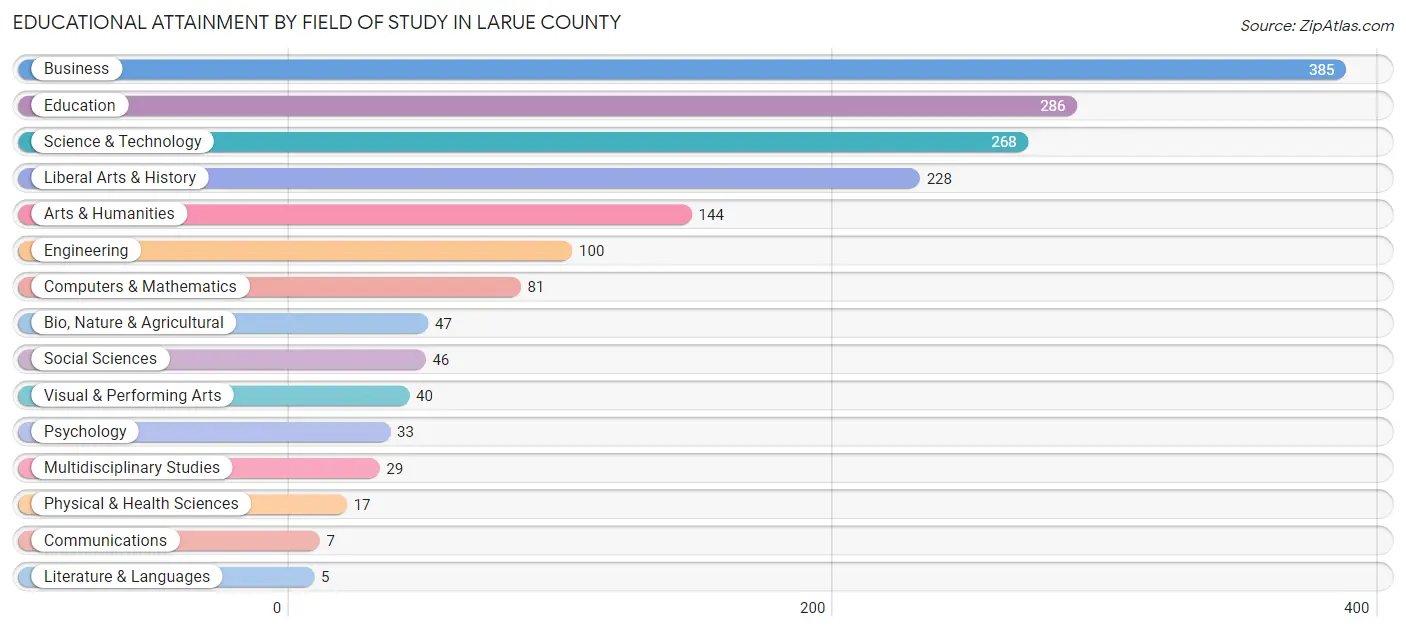
| Field of Study | # Graduates | % Graduates |
| Computers & Mathematics | 81 | 4.7% |
| Bio, Nature & Agricultural | 47 | 2.7% |
| Physical & Health Sciences | 17 | 1.0% |
| Psychology | 33 | 1.9% |
| Social Sciences | 46 | 2.7% |
| Engineering | 100 | 5.8% |
| Multidisciplinary Studies | 29 | 1.7% |
| Science & Technology | 268 | 15.6% |
| Business | 385 | 22.4% |
| Education | 286 | 16.7% |
| Literature & Languages | 5 | 0.3% |
| Liberal Arts & History | 228 | 13.3% |
| Visual & Performing Arts | 40 | 2.3% |
| Communications | 7 | 0.4% |
| Arts & Humanities | 144 | 8.4% |
| Total | 1,716 | 100.0% |
Transportation & Commute in Larue County
Vehicle Availability by Sex in Larue County
The most prevalent vehicle ownership categories in Larue County are males with 2 vehicles (1,109, accounting for 30.9%) and females with 2 vehicles (872, making up 39.8%).
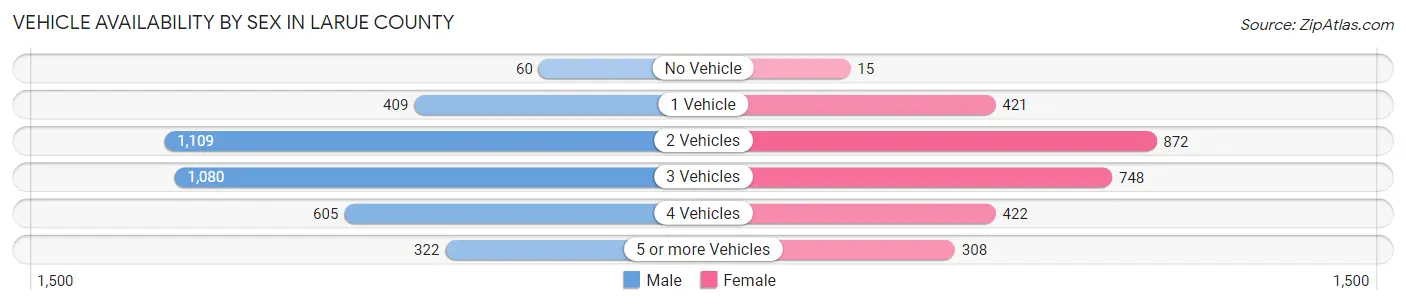
| Vehicles Available | Male | Female |
| No Vehicle | 60 (1.7%) | 15 (0.5%) |
| 1 Vehicle | 409 (11.4%) | 421 (15.1%) |
| 2 Vehicles | 1,109 (30.9%) | 872 (31.3%) |
| 3 Vehicles | 1,080 (30.1%) | 748 (26.9%) |
| 4 Vehicles | 605 (16.9%) | 422 (15.1%) |
| 5 or more Vehicles | 322 (9.0%) | 308 (11.1%) |
| Total | 3,585 (100.0%) | 2,786 (100.0%) |
Commute Time in Larue County
The most frequently occuring commute durations in Larue County are 20 to 24 minutes (1,120 commuters, 18.4%), 30 to 34 minutes (875 commuters, 14.4%), and 25 to 29 minutes (793 commuters, 13.1%).
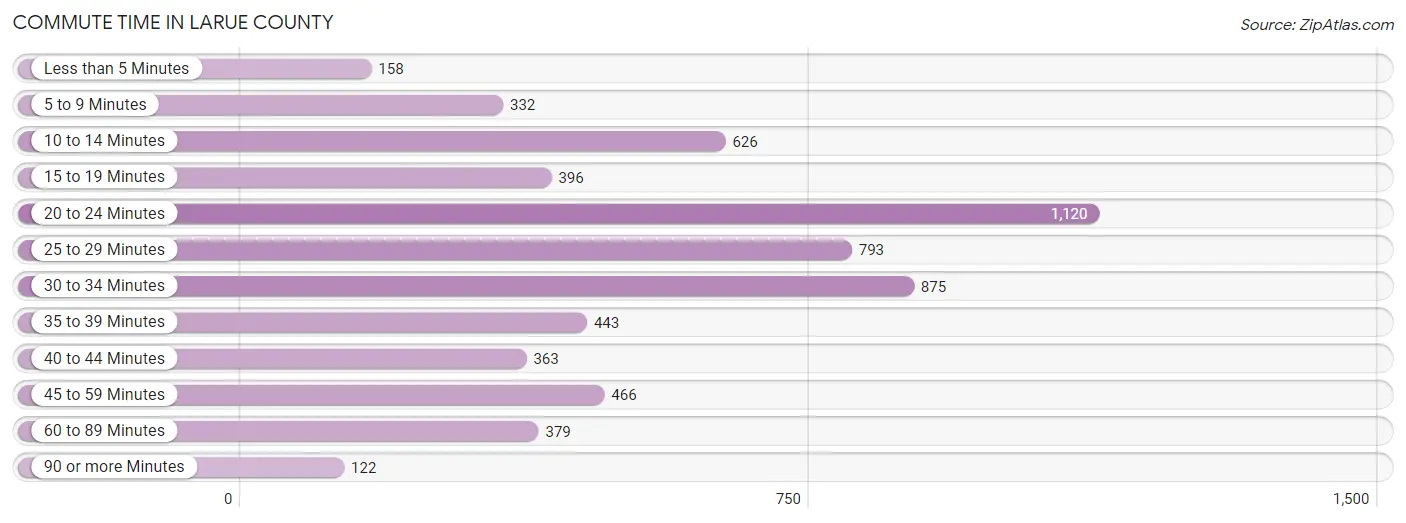
| Commute Time | # Commuters | % Commuters |
| Less than 5 Minutes | 158 | 2.6% |
| 5 to 9 Minutes | 332 | 5.5% |
| 10 to 14 Minutes | 626 | 10.3% |
| 15 to 19 Minutes | 396 | 6.5% |
| 20 to 24 Minutes | 1,120 | 18.4% |
| 25 to 29 Minutes | 793 | 13.1% |
| 30 to 34 Minutes | 875 | 14.4% |
| 35 to 39 Minutes | 443 | 7.3% |
| 40 to 44 Minutes | 363 | 6.0% |
| 45 to 59 Minutes | 466 | 7.7% |
| 60 to 89 Minutes | 379 | 6.2% |
| 90 or more Minutes | 122 | 2.0% |
Commute Time by Sex in Larue County
The most common commute times in Larue County are 30 to 34 minutes (525 commuters, 15.2%) for males and 20 to 24 minutes (597 commuters, 22.8%) for females.
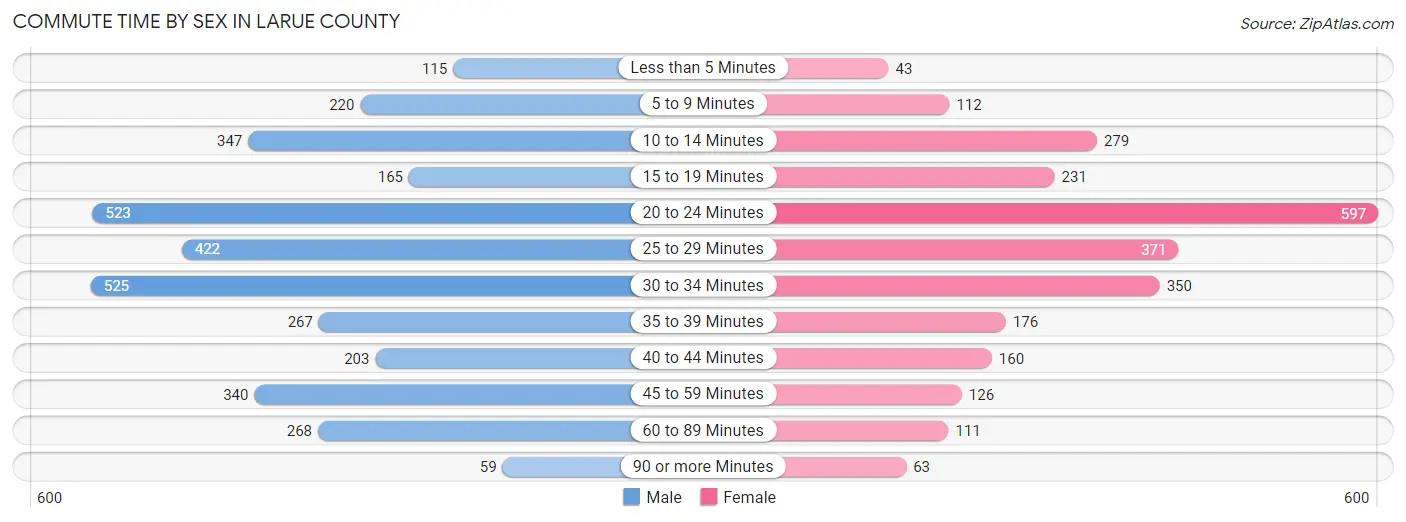
| Commute Time | Male | Female |
| Less than 5 Minutes | 115 (3.3%) | 43 (1.6%) |
| 5 to 9 Minutes | 220 (6.4%) | 112 (4.3%) |
| 10 to 14 Minutes | 347 (10.1%) | 279 (10.6%) |
| 15 to 19 Minutes | 165 (4.8%) | 231 (8.8%) |
| 20 to 24 Minutes | 523 (15.1%) | 597 (22.8%) |
| 25 to 29 Minutes | 422 (12.2%) | 371 (14.2%) |
| 30 to 34 Minutes | 525 (15.2%) | 350 (13.4%) |
| 35 to 39 Minutes | 267 (7.7%) | 176 (6.7%) |
| 40 to 44 Minutes | 203 (5.9%) | 160 (6.1%) |
| 45 to 59 Minutes | 340 (9.8%) | 126 (4.8%) |
| 60 to 89 Minutes | 268 (7.8%) | 111 (4.2%) |
| 90 or more Minutes | 59 (1.7%) | 63 (2.4%) |
Time of Departure to Work by Sex in Larue County
The most frequent times of departure to work in Larue County are 7:00 AM to 7:29 AM (537, 15.5%) for males and 7:00 AM to 7:29 AM (639, 24.4%) for females.
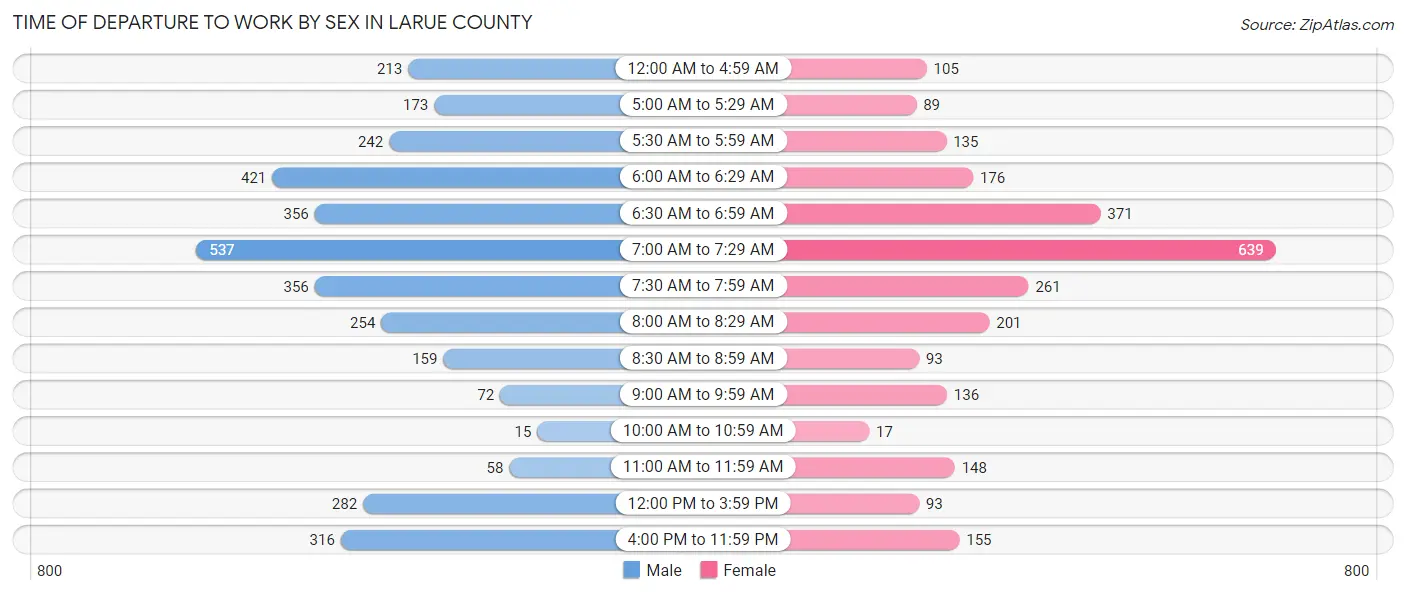
| Time of Departure | Male | Female |
| 12:00 AM to 4:59 AM | 213 (6.2%) | 105 (4.0%) |
| 5:00 AM to 5:29 AM | 173 (5.0%) | 89 (3.4%) |
| 5:30 AM to 5:59 AM | 242 (7.0%) | 135 (5.1%) |
| 6:00 AM to 6:29 AM | 421 (12.2%) | 176 (6.7%) |
| 6:30 AM to 6:59 AM | 356 (10.3%) | 371 (14.2%) |
| 7:00 AM to 7:29 AM | 537 (15.5%) | 639 (24.4%) |
| 7:30 AM to 7:59 AM | 356 (10.3%) | 261 (10.0%) |
| 8:00 AM to 8:29 AM | 254 (7.3%) | 201 (7.7%) |
| 8:30 AM to 8:59 AM | 159 (4.6%) | 93 (3.5%) |
| 9:00 AM to 9:59 AM | 72 (2.1%) | 136 (5.2%) |
| 10:00 AM to 10:59 AM | 15 (0.4%) | 17 (0.6%) |
| 11:00 AM to 11:59 AM | 58 (1.7%) | 148 (5.7%) |
| 12:00 PM to 3:59 PM | 282 (8.2%) | 93 (3.5%) |
| 4:00 PM to 11:59 PM | 316 (9.1%) | 155 (5.9%) |
| Total | 3,454 (100.0%) | 2,619 (100.0%) |
Housing Occupancy in Larue County
Occupancy by Ownership in Larue County
Of the total 5,967 dwellings in Larue County, owner-occupied units account for 4,466 (74.8%), while renter-occupied units make up 1,501 (25.2%).
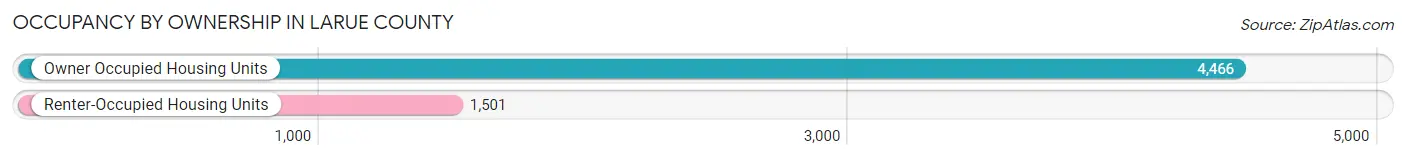
| Occupancy | # Housing Units | % Housing Units |
| Owner Occupied Housing Units | 4,466 | 74.8% |
| Renter-Occupied Housing Units | 1,501 | 25.2% |
| Total Occupied Housing Units | 5,967 | 100.0% |
Occupancy by Household Size in Larue County
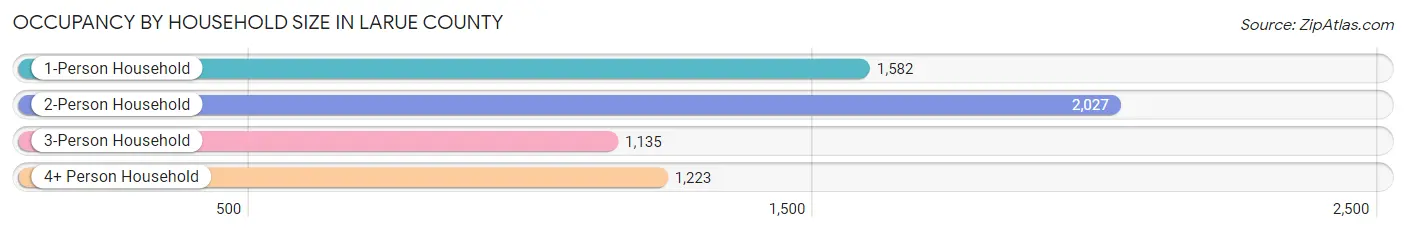
| Household Size | # Housing Units | % Housing Units |
| 1-Person Household | 1,582 | 26.5% |
| 2-Person Household | 2,027 | 34.0% |
| 3-Person Household | 1,135 | 19.0% |
| 4+ Person Household | 1,223 | 20.5% |
| Total Housing Units | 5,967 | 100.0% |
Occupancy by Ownership by Household Size in Larue County
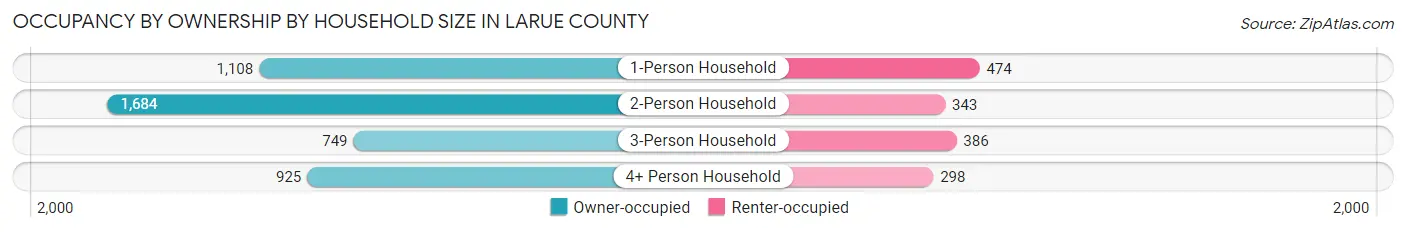
| Household Size | Owner-occupied | Renter-occupied |
| 1-Person Household | 1,108 (70.0%) | 474 (30.0%) |
| 2-Person Household | 1,684 (83.1%) | 343 (16.9%) |
| 3-Person Household | 749 (66.0%) | 386 (34.0%) |
| 4+ Person Household | 925 (75.6%) | 298 (24.4%) |
| Total Housing Units | 4,466 (74.8%) | 1,501 (25.2%) |
Occupancy by Educational Attainment in Larue County
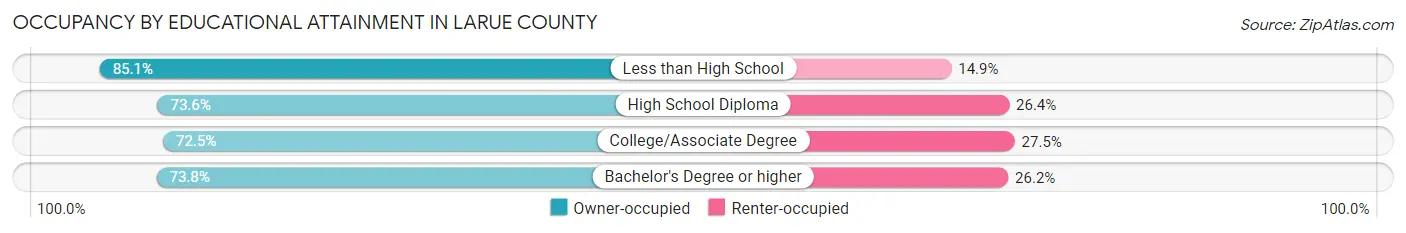
| Household Size | Owner-occupied | Renter-occupied |
| Less than High School | 697 (85.1%) | 122 (14.9%) |
| High School Diploma | 1,489 (73.6%) | 533 (26.4%) |
| College/Associate Degree | 1,572 (72.5%) | 595 (27.5%) |
| Bachelor's Degree or higher | 708 (73.8%) | 251 (26.2%) |
Occupancy by Age of Householder in Larue County
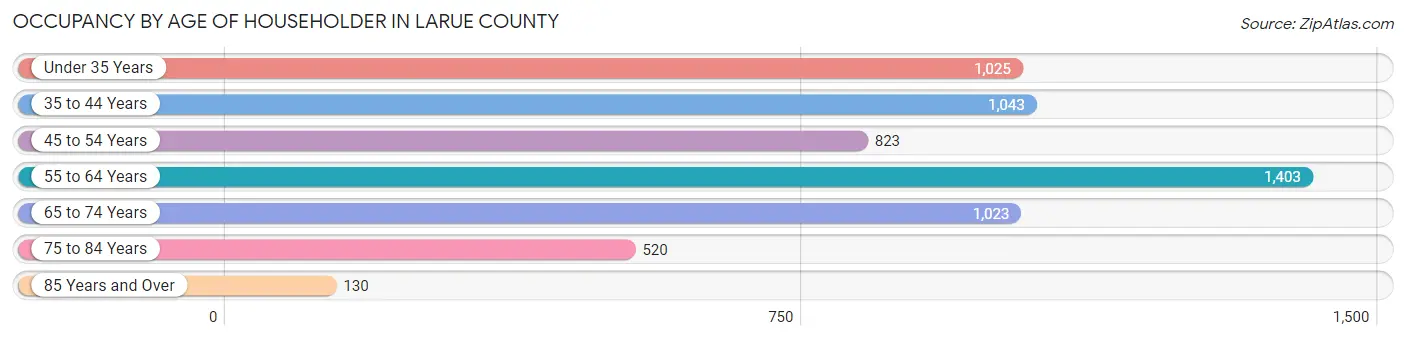
| Age Bracket | # Households | % Households |
| Under 35 Years | 1,025 | 17.2% |
| 35 to 44 Years | 1,043 | 17.5% |
| 45 to 54 Years | 823 | 13.8% |
| 55 to 64 Years | 1,403 | 23.5% |
| 65 to 74 Years | 1,023 | 17.1% |
| 75 to 84 Years | 520 | 8.7% |
| 85 Years and Over | 130 | 2.2% |
| Total | 5,967 | 100.0% |
Housing Finances in Larue County
Median Income by Occupancy in Larue County
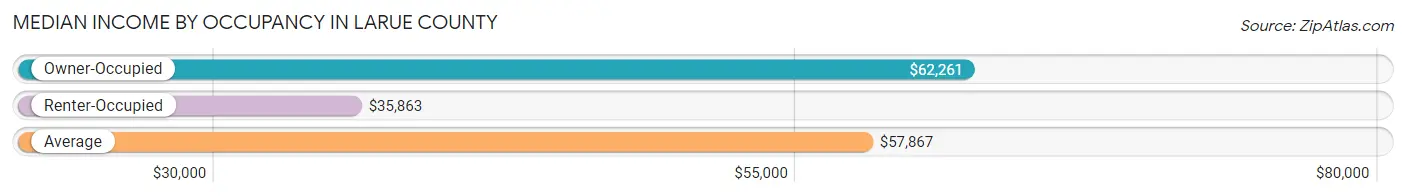
| Occupancy Type | # Households | Median Income |
| Owner-Occupied | 4,466 (74.8%) | $62,261 |
| Renter-Occupied | 1,501 (25.2%) | $35,863 |
| Average | 5,967 (100.0%) | $57,867 |
Occupancy by Householder Income Bracket in Larue County
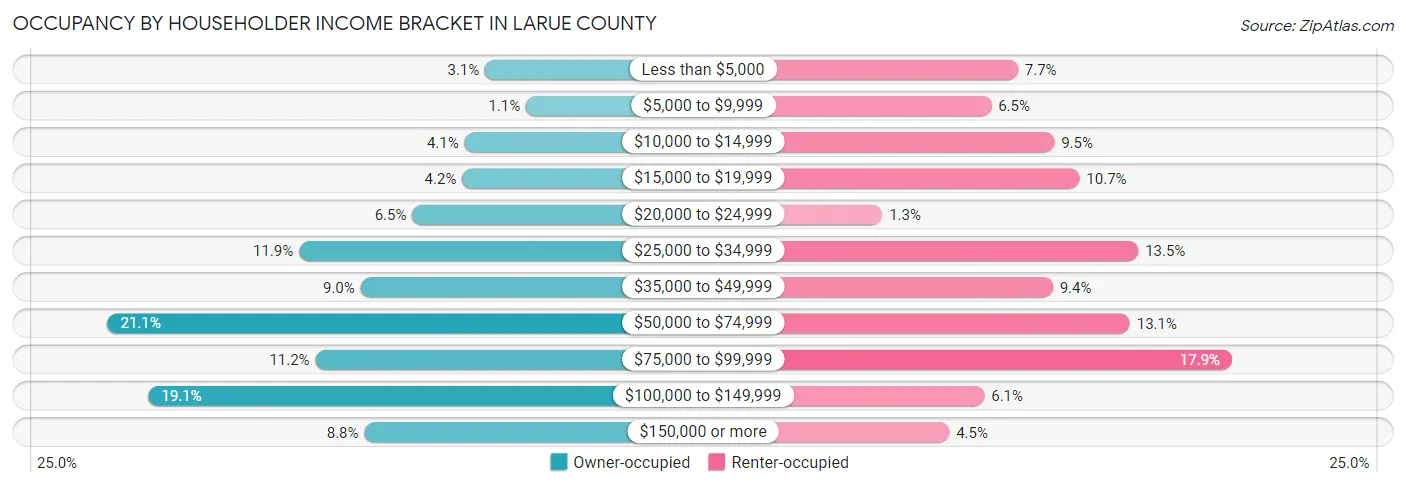
| Income Bracket | Owner-occupied | Renter-occupied |
| Less than $5,000 | 137 (3.1%) | 116 (7.7%) |
| $5,000 to $9,999 | 50 (1.1%) | 97 (6.5%) |
| $10,000 to $14,999 | 181 (4.1%) | 142 (9.5%) |
| $15,000 to $19,999 | 186 (4.2%) | 160 (10.7%) |
| $20,000 to $24,999 | 292 (6.5%) | 19 (1.3%) |
| $25,000 to $34,999 | 533 (11.9%) | 202 (13.5%) |
| $35,000 to $49,999 | 402 (9.0%) | 141 (9.4%) |
| $50,000 to $74,999 | 940 (21.0%) | 196 (13.1%) |
| $75,000 to $99,999 | 498 (11.2%) | 269 (17.9%) |
| $100,000 to $149,999 | 853 (19.1%) | 92 (6.1%) |
| $150,000 or more | 394 (8.8%) | 67 (4.5%) |
| Total | 4,466 (100.0%) | 1,501 (100.0%) |
Monthly Housing Cost Tiers in Larue County
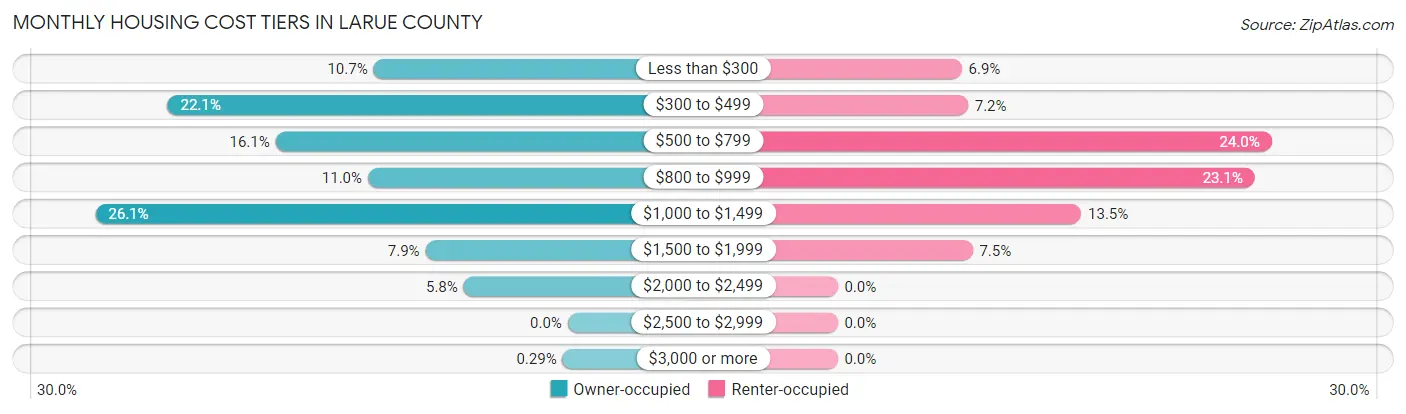
| Monthly Cost | Owner-occupied | Renter-occupied |
| Less than $300 | 479 (10.7%) | 103 (6.9%) |
| $300 to $499 | 987 (22.1%) | 108 (7.2%) |
| $500 to $799 | 721 (16.1%) | 360 (24.0%) |
| $800 to $999 | 493 (11.0%) | 346 (23.1%) |
| $1,000 to $1,499 | 1,165 (26.1%) | 202 (13.5%) |
| $1,500 to $1,999 | 351 (7.9%) | 112 (7.5%) |
| $2,000 to $2,499 | 257 (5.8%) | 0 (0.0%) |
| $2,500 to $2,999 | 0 (0.0%) | 0 (0.0%) |
| $3,000 or more | 13 (0.3%) | 0 (0.0%) |
| Total | 4,466 (100.0%) | 1,501 (100.0%) |
Physical Housing Characteristics in Larue County
Housing Structures in Larue County
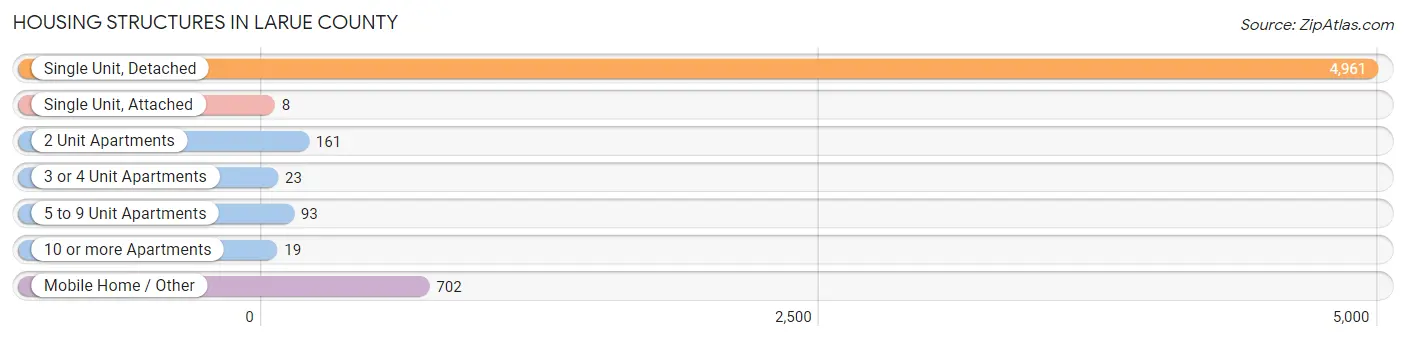
| Structure Type | # Housing Units | % Housing Units |
| Single Unit, Detached | 4,961 | 83.1% |
| Single Unit, Attached | 8 | 0.1% |
| 2 Unit Apartments | 161 | 2.7% |
| 3 or 4 Unit Apartments | 23 | 0.4% |
| 5 to 9 Unit Apartments | 93 | 1.6% |
| 10 or more Apartments | 19 | 0.3% |
| Mobile Home / Other | 702 | 11.8% |
| Total | 5,967 | 100.0% |
Housing Structures by Occupancy in Larue County
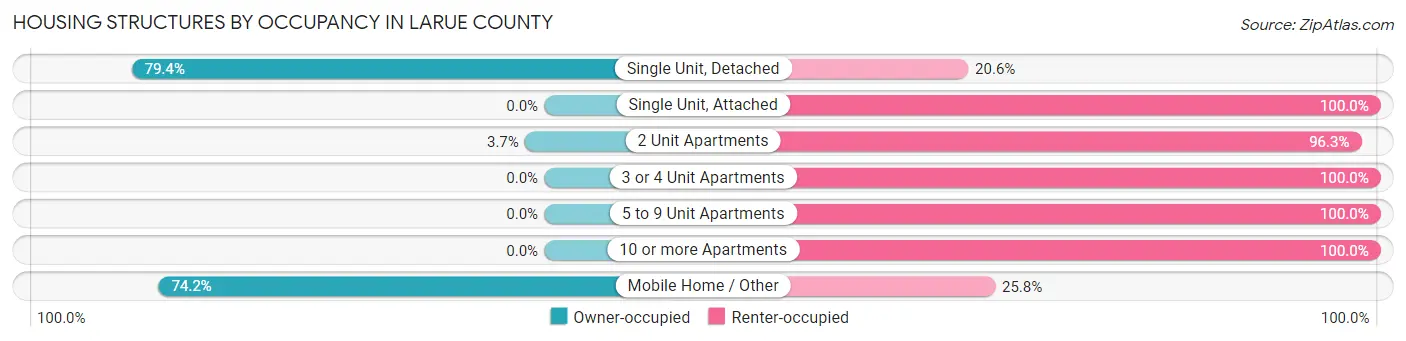
| Structure Type | Owner-occupied | Renter-occupied |
| Single Unit, Detached | 3,939 (79.4%) | 1,022 (20.6%) |
| Single Unit, Attached | 0 (0.0%) | 8 (100.0%) |
| 2 Unit Apartments | 6 (3.7%) | 155 (96.3%) |
| 3 or 4 Unit Apartments | 0 (0.0%) | 23 (100.0%) |
| 5 to 9 Unit Apartments | 0 (0.0%) | 93 (100.0%) |
| 10 or more Apartments | 0 (0.0%) | 19 (100.0%) |
| Mobile Home / Other | 521 (74.2%) | 181 (25.8%) |
| Total | 4,466 (74.8%) | 1,501 (25.2%) |
Housing Structures by Number of Rooms in Larue County
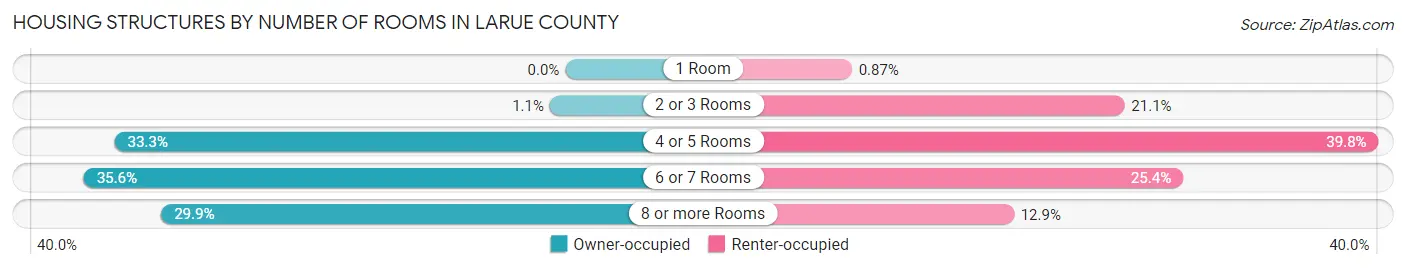
| Number of Rooms | Owner-occupied | Renter-occupied |
| 1 Room | 0 (0.0%) | 13 (0.9%) |
| 2 or 3 Rooms | 51 (1.1%) | 316 (21.0%) |
| 4 or 5 Rooms | 1,489 (33.3%) | 598 (39.8%) |
| 6 or 7 Rooms | 1,591 (35.6%) | 381 (25.4%) |
| 8 or more Rooms | 1,335 (29.9%) | 193 (12.9%) |
| Total | 4,466 (100.0%) | 1,501 (100.0%) |
Housing Structure by Heating Type in Larue County
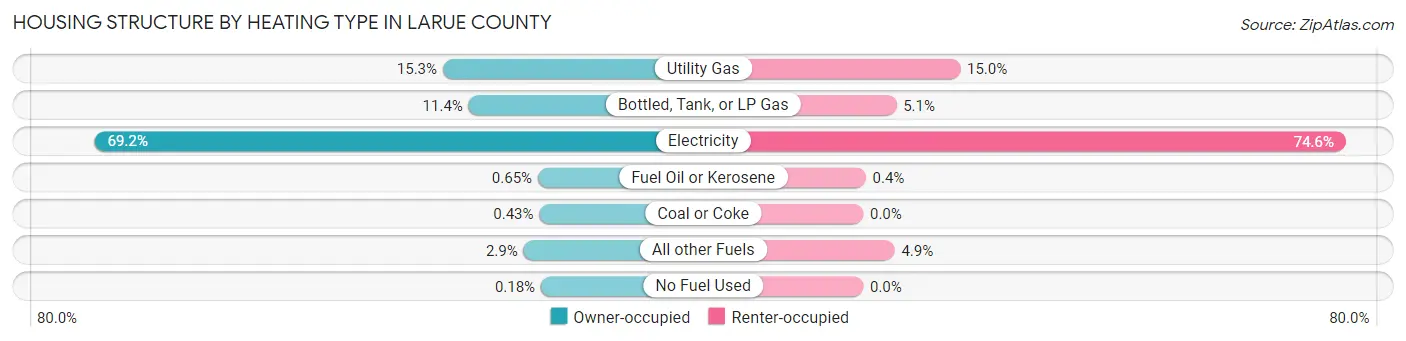
| Heating Type | Owner-occupied | Renter-occupied |
| Utility Gas | 685 (15.3%) | 225 (15.0%) |
| Bottled, Tank, or LP Gas | 507 (11.4%) | 77 (5.1%) |
| Electricity | 3,090 (69.2%) | 1,120 (74.6%) |
| Fuel Oil or Kerosene | 29 (0.6%) | 6 (0.4%) |
| Coal or Coke | 19 (0.4%) | 0 (0.0%) |
| All other Fuels | 128 (2.9%) | 73 (4.9%) |
| No Fuel Used | 8 (0.2%) | 0 (0.0%) |
| Total | 4,466 (100.0%) | 1,501 (100.0%) |
Household Vehicle Usage in Larue County
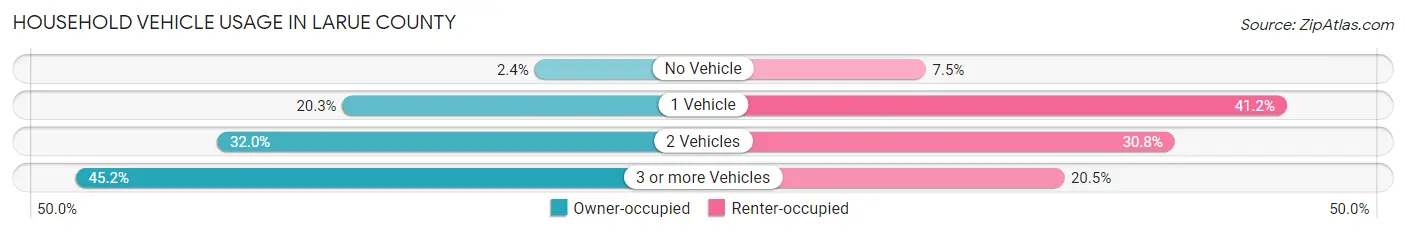
| Vehicles per Household | Owner-occupied | Renter-occupied |
| No Vehicle | 107 (2.4%) | 113 (7.5%) |
| 1 Vehicle | 908 (20.3%) | 619 (41.2%) |
| 2 Vehicles | 1,431 (32.0%) | 462 (30.8%) |
| 3 or more Vehicles | 2,020 (45.2%) | 307 (20.4%) |
| Total | 4,466 (100.0%) | 1,501 (100.0%) |
Real Estate & Mortgages in Larue County
Real Estate and Mortgage Overview in Larue County
| Characteristic | Without Mortgage | With Mortgage |
| Housing Units | 1,954 | 2,512 |
| Median Property Value | $161,900 | $165,200 |
| Median Household Income | $46,858 | $281 |
| Monthly Housing Costs | $383 | $13 |
| Real Estate Taxes | $894 | $79 |
Property Value by Mortgage Status in Larue County
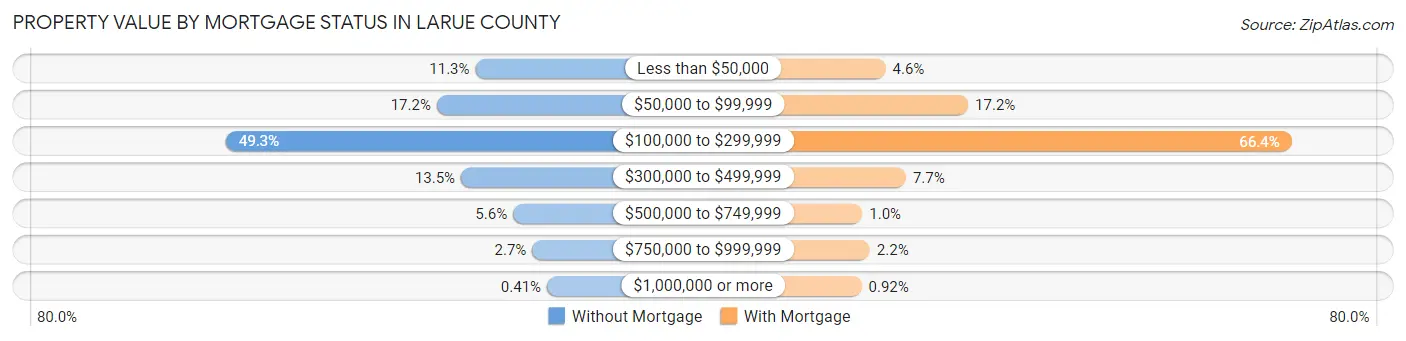
| Property Value | Without Mortgage | With Mortgage |
| Less than $50,000 | 221 (11.3%) | 115 (4.6%) |
| $50,000 to $99,999 | 336 (17.2%) | 431 (17.2%) |
| $100,000 to $299,999 | 964 (49.3%) | 1,669 (66.4%) |
| $300,000 to $499,999 | 264 (13.5%) | 193 (7.7%) |
| $500,000 to $749,999 | 109 (5.6%) | 26 (1.0%) |
| $750,000 to $999,999 | 52 (2.7%) | 55 (2.2%) |
| $1,000,000 or more | 8 (0.4%) | 23 (0.9%) |
| Total | 1,954 (100.0%) | 2,512 (100.0%) |
Household Income by Mortgage Status in Larue County
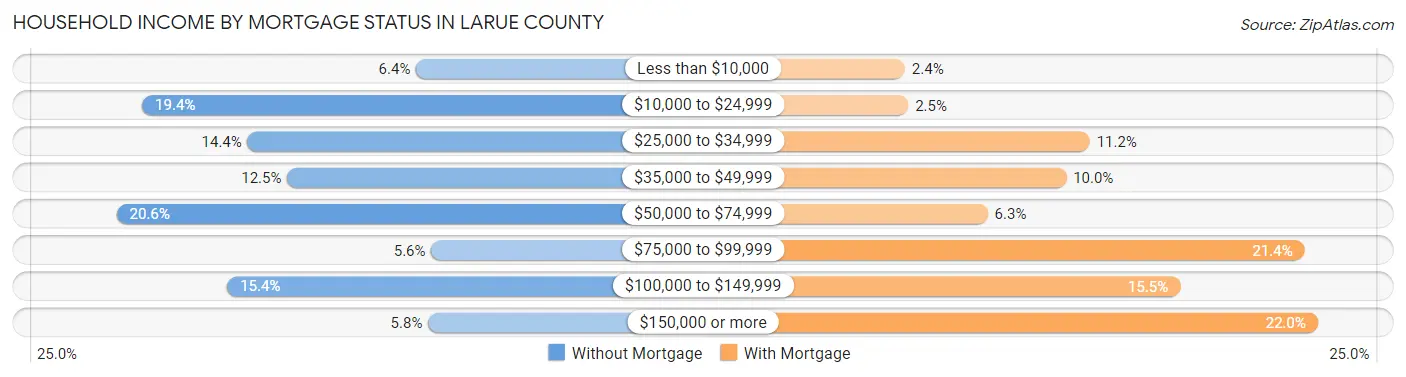
| Household Income | Without Mortgage | With Mortgage |
| Less than $10,000 | 124 (6.4%) | 59 (2.4%) |
| $10,000 to $24,999 | 379 (19.4%) | 63 (2.5%) |
| $25,000 to $34,999 | 281 (14.4%) | 280 (11.2%) |
| $35,000 to $49,999 | 244 (12.5%) | 252 (10.0%) |
| $50,000 to $74,999 | 403 (20.6%) | 158 (6.3%) |
| $75,000 to $99,999 | 110 (5.6%) | 537 (21.4%) |
| $100,000 to $149,999 | 300 (15.3%) | 388 (15.4%) |
| $150,000 or more | 113 (5.8%) | 553 (22.0%) |
| Total | 1,954 (100.0%) | 2,512 (100.0%) |
Property Value to Household Income Ratio in Larue County
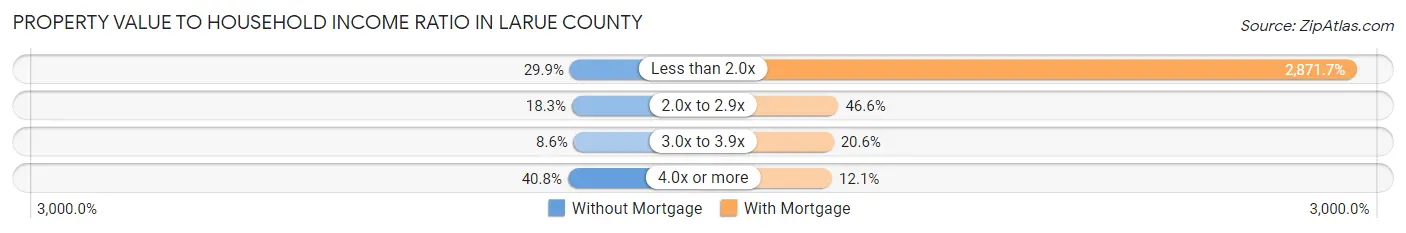
| Value-to-Income Ratio | Without Mortgage | With Mortgage |
| Less than 2.0x | 585 (29.9%) | 72,136 (2,871.7%) |
| 2.0x to 2.9x | 357 (18.3%) | 1,171 (46.6%) |
| 3.0x to 3.9x | 168 (8.6%) | 518 (20.6%) |
| 4.0x or more | 798 (40.8%) | 305 (12.1%) |
| Total | 1,954 (100.0%) | 2,512 (100.0%) |
Real Estate Taxes by Mortgage Status in Larue County
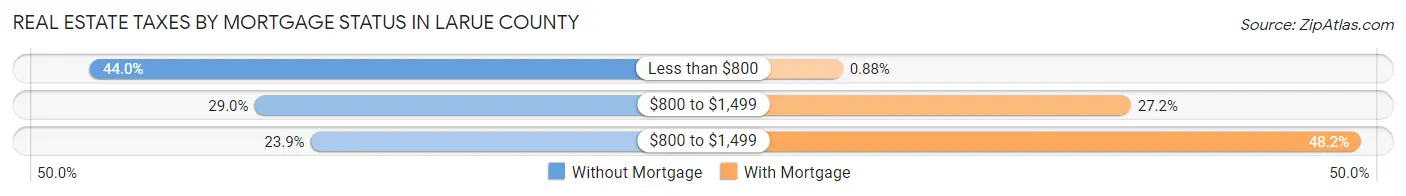
| Property Taxes | Without Mortgage | With Mortgage |
| Less than $800 | 860 (44.0%) | 22 (0.9%) |
| $800 to $1,499 | 567 (29.0%) | 683 (27.2%) |
| $800 to $1,499 | 467 (23.9%) | 1,211 (48.2%) |
| Total | 1,954 (100.0%) | 2,512 (100.0%) |
Health & Disability in Larue County
Health Insurance Coverage by Age in Larue County
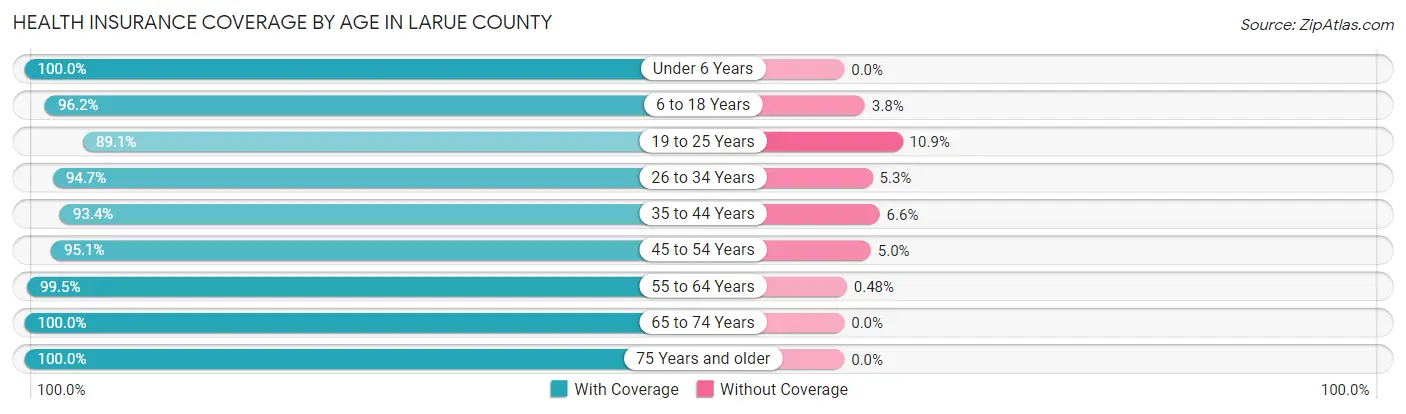
| Age Bracket | With Coverage | Without Coverage |
| Under 6 Years | 907 (100.0%) | 0 (0.0%) |
| 6 to 18 Years | 2,453 (96.2%) | 98 (3.8%) |
| 19 to 25 Years | 1,130 (89.1%) | 138 (10.9%) |
| 26 to 34 Years | 1,400 (94.7%) | 78 (5.3%) |
| 35 to 44 Years | 1,700 (93.4%) | 120 (6.6%) |
| 45 to 54 Years | 1,729 (95.1%) | 90 (5.0%) |
| 55 to 64 Years | 2,298 (99.5%) | 11 (0.5%) |
| 65 to 74 Years | 1,576 (100.0%) | 0 (0.0%) |
| 75 Years and older | 924 (100.0%) | 0 (0.0%) |
| Total | 14,117 (96.4%) | 535 (3.6%) |
Health Insurance Coverage by Citizenship Status in Larue County
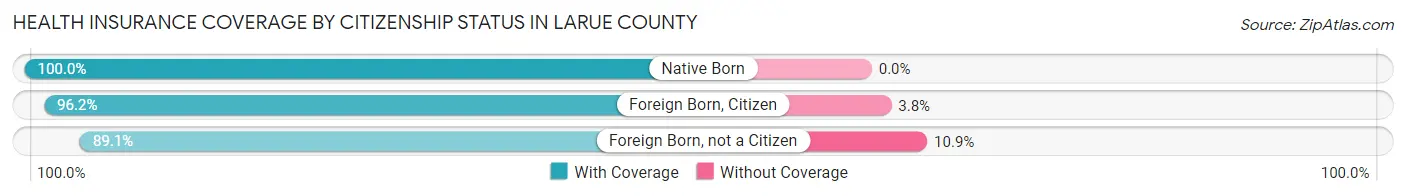
| Citizenship Status | With Coverage | Without Coverage |
| Native Born | 907 (100.0%) | 0 (0.0%) |
| Foreign Born, Citizen | 2,453 (96.2%) | 98 (3.8%) |
| Foreign Born, not a Citizen | 1,130 (89.1%) | 138 (10.9%) |
Health Insurance Coverage by Household Income in Larue County
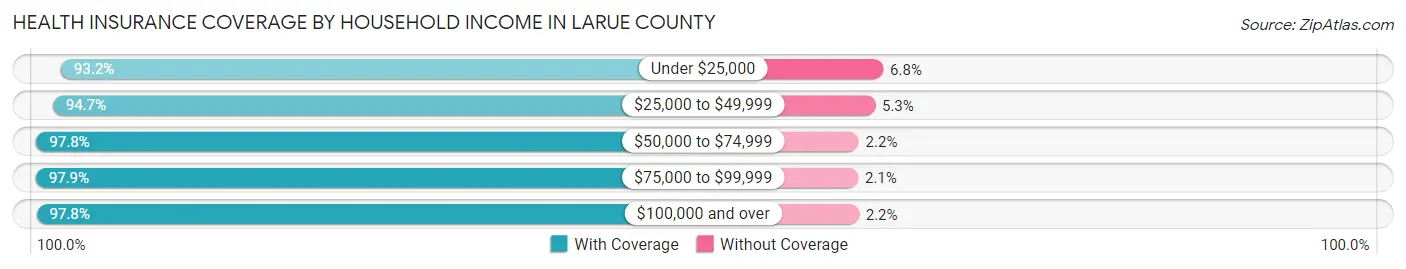
| Household Income | With Coverage | Without Coverage |
| Under $25,000 | 2,506 (93.2%) | 183 (6.8%) |
| $25,000 to $49,999 | 2,596 (94.7%) | 145 (5.3%) |
| $50,000 to $74,999 | 2,549 (97.8%) | 58 (2.2%) |
| $75,000 to $99,999 | 2,269 (97.9%) | 49 (2.1%) |
| $100,000 and over | 4,196 (97.8%) | 96 (2.2%) |
Public vs Private Health Insurance Coverage by Age in Larue County
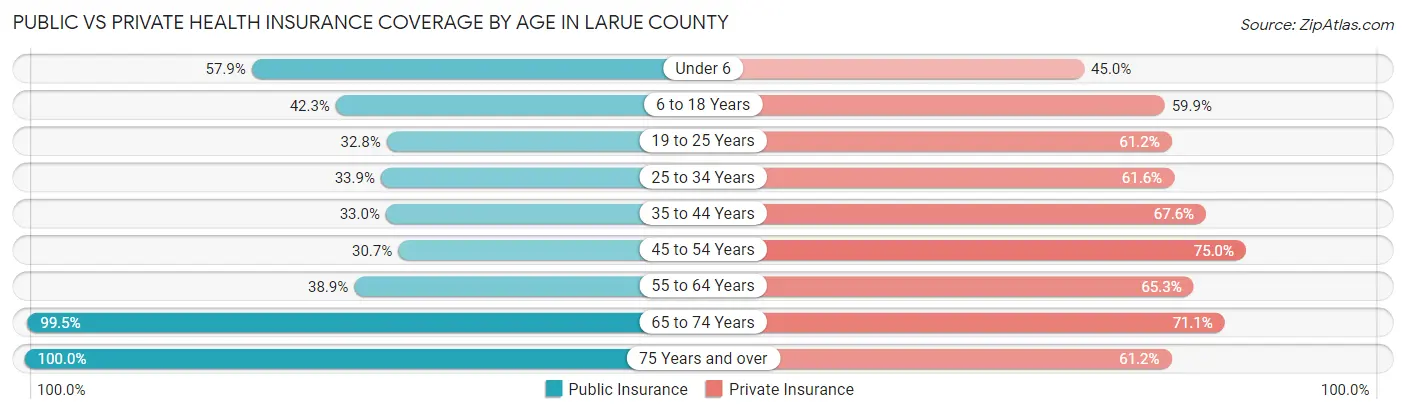
| Age Bracket | Public Insurance | Private Insurance |
| Under 6 | 525 (57.9%) | 408 (45.0%) |
| 6 to 18 Years | 1,078 (42.3%) | 1,529 (59.9%) |
| 19 to 25 Years | 416 (32.8%) | 776 (61.2%) |
| 25 to 34 Years | 501 (33.9%) | 911 (61.6%) |
| 35 to 44 Years | 600 (33.0%) | 1,230 (67.6%) |
| 45 to 54 Years | 558 (30.7%) | 1,364 (75.0%) |
| 55 to 64 Years | 897 (38.9%) | 1,507 (65.3%) |
| 65 to 74 Years | 1,568 (99.5%) | 1,120 (71.1%) |
| 75 Years and over | 924 (100.0%) | 565 (61.2%) |
| Total | 7,067 (48.2%) | 9,410 (64.2%) |
Disability Status by Sex by Age in Larue County
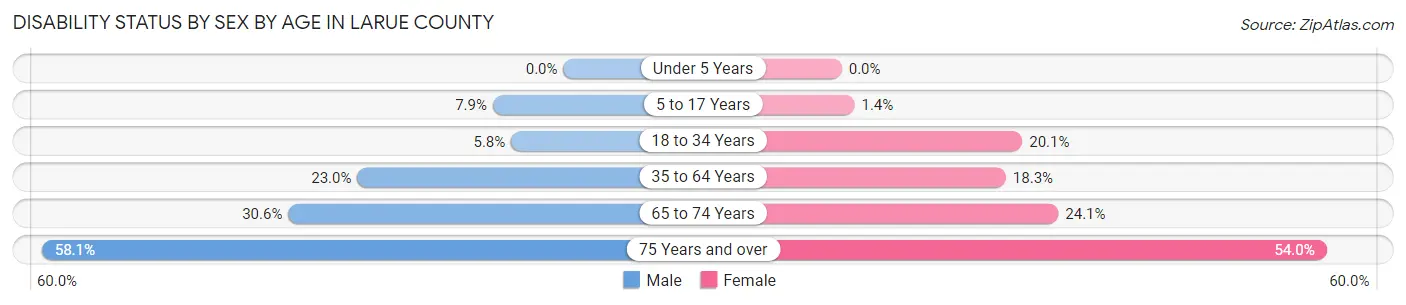
| Age Bracket | Male | Female |
| Under 5 Years | 0 (0.0%) | 0 (0.0%) |
| 5 to 17 Years | 102 (7.9%) | 18 (1.4%) |
| 18 to 34 Years | 86 (5.8%) | 277 (20.1%) |
| 35 to 64 Years | 648 (23.0%) | 571 (18.3%) |
| 65 to 74 Years | 239 (30.6%) | 192 (24.1%) |
| 75 Years and over | 230 (58.1%) | 285 (54.0%) |
Disability Class by Sex by Age in Larue County
Disability Class: Hearing Difficulty
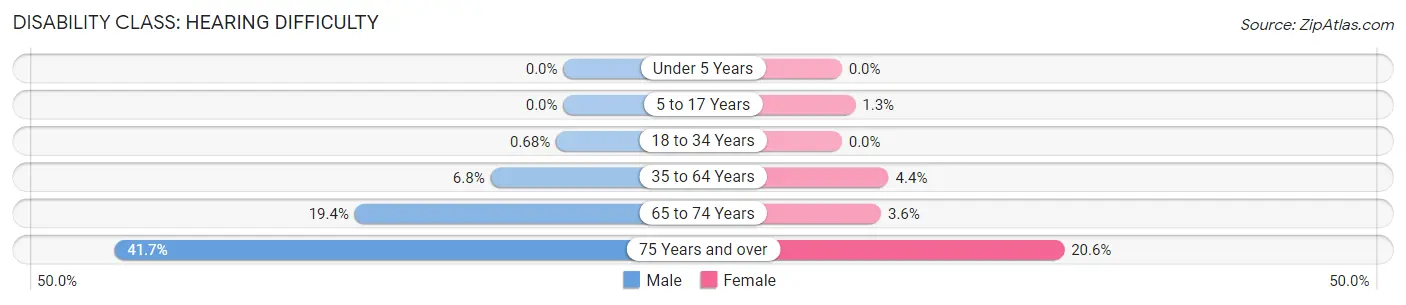
| Age Bracket | Male | Female |
| Under 5 Years | 0 (0.0%) | 0 (0.0%) |
| 5 to 17 Years | 0 (0.0%) | 16 (1.3%) |
| 18 to 34 Years | 10 (0.7%) | 0 (0.0%) |
| 35 to 64 Years | 191 (6.8%) | 136 (4.3%) |
| 65 to 74 Years | 151 (19.4%) | 29 (3.6%) |
| 75 Years and over | 165 (41.7%) | 109 (20.6%) |
Disability Class: Vision Difficulty
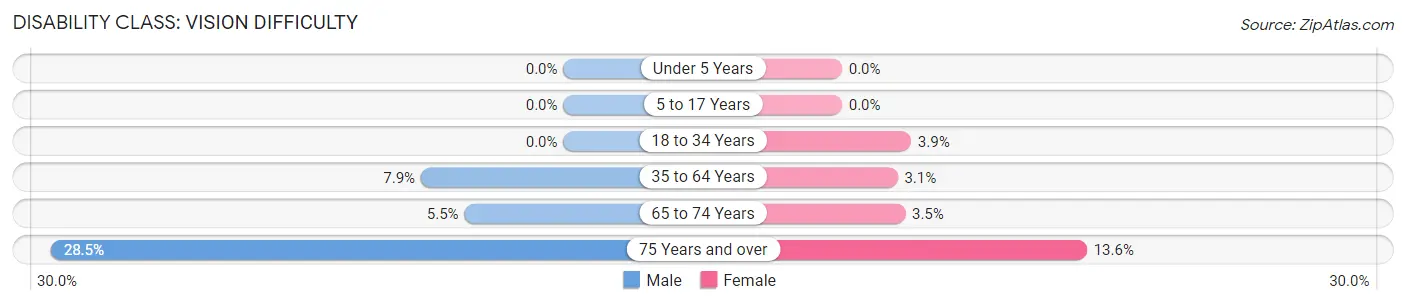
| Age Bracket | Male | Female |
| Under 5 Years | 0 (0.0%) | 0 (0.0%) |
| 5 to 17 Years | 0 (0.0%) | 0 (0.0%) |
| 18 to 34 Years | 0 (0.0%) | 53 (3.8%) |
| 35 to 64 Years | 224 (7.9%) | 97 (3.1%) |
| 65 to 74 Years | 43 (5.5%) | 28 (3.5%) |
| 75 Years and over | 113 (28.5%) | 72 (13.6%) |
Disability Class: Cognitive Difficulty
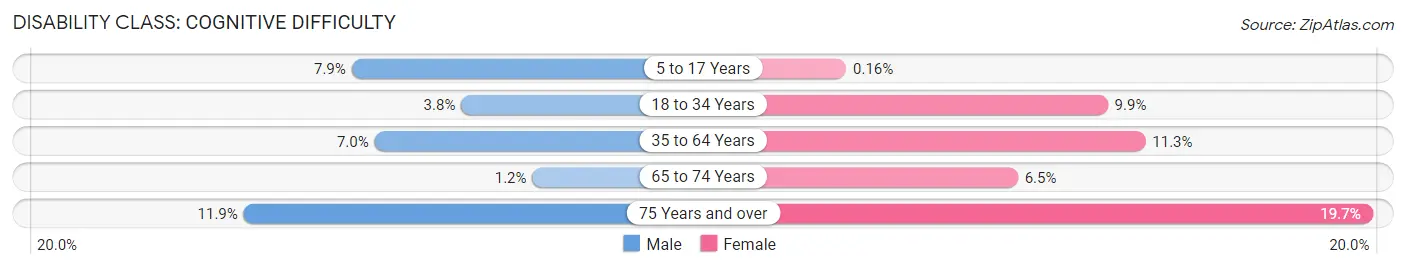
| Age Bracket | Male | Female |
| 5 to 17 Years | 102 (7.9%) | 2 (0.2%) |
| 18 to 34 Years | 56 (3.8%) | 136 (9.9%) |
| 35 to 64 Years | 198 (7.0%) | 352 (11.3%) |
| 65 to 74 Years | 9 (1.1%) | 52 (6.5%) |
| 75 Years and over | 47 (11.9%) | 104 (19.7%) |
Disability Class: Ambulatory Difficulty
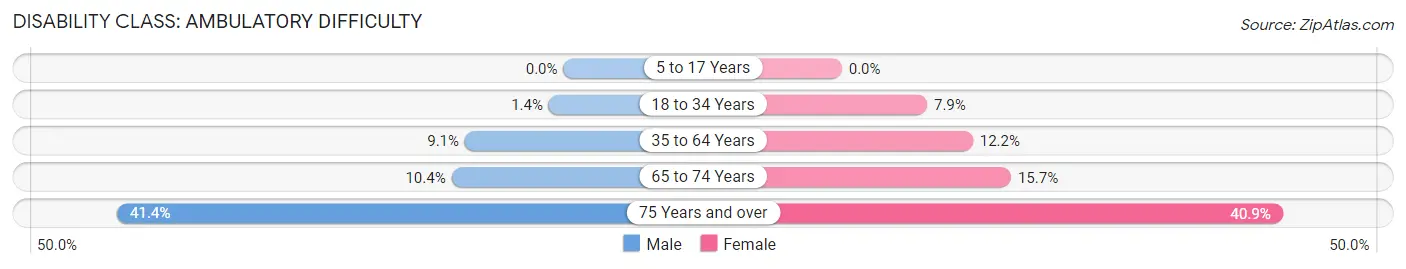
| Age Bracket | Male | Female |
| 5 to 17 Years | 0 (0.0%) | 0 (0.0%) |
| 18 to 34 Years | 20 (1.3%) | 109 (7.9%) |
| 35 to 64 Years | 258 (9.1%) | 380 (12.2%) |
| 65 to 74 Years | 81 (10.4%) | 125 (15.7%) |
| 75 Years and over | 164 (41.4%) | 216 (40.9%) |
Disability Class: Self-Care Difficulty
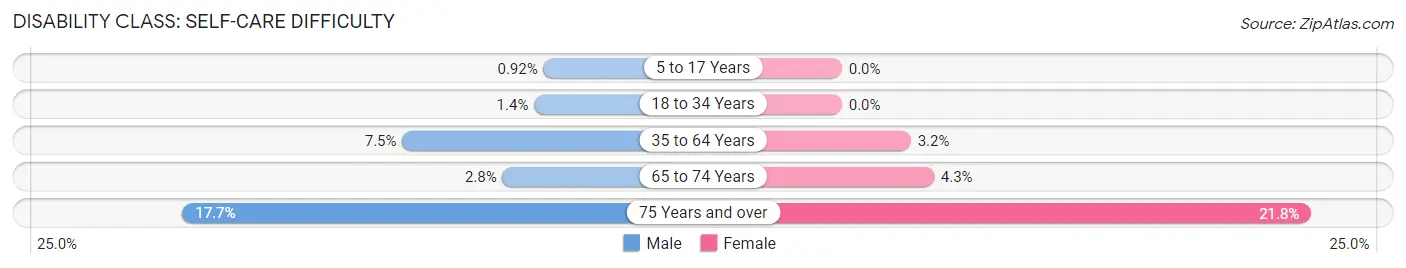
| Age Bracket | Male | Female |
| 5 to 17 Years | 12 (0.9%) | 0 (0.0%) |
| 18 to 34 Years | 20 (1.3%) | 0 (0.0%) |
| 35 to 64 Years | 211 (7.5%) | 100 (3.2%) |
| 65 to 74 Years | 22 (2.8%) | 34 (4.3%) |
| 75 Years and over | 70 (17.7%) | 115 (21.8%) |
Technology Access in Larue County
Computing Device Access in Larue County
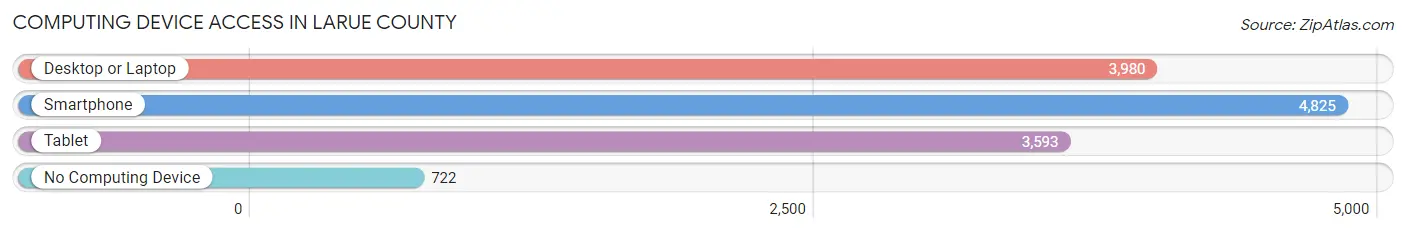
| Device Type | # Households | % Households |
| Desktop or Laptop | 3,980 | 66.7% |
| Smartphone | 4,825 | 80.9% |
| Tablet | 3,593 | 60.2% |
| No Computing Device | 722 | 12.1% |
| Total | 5,967 | 100.0% |
Internet Access in Larue County
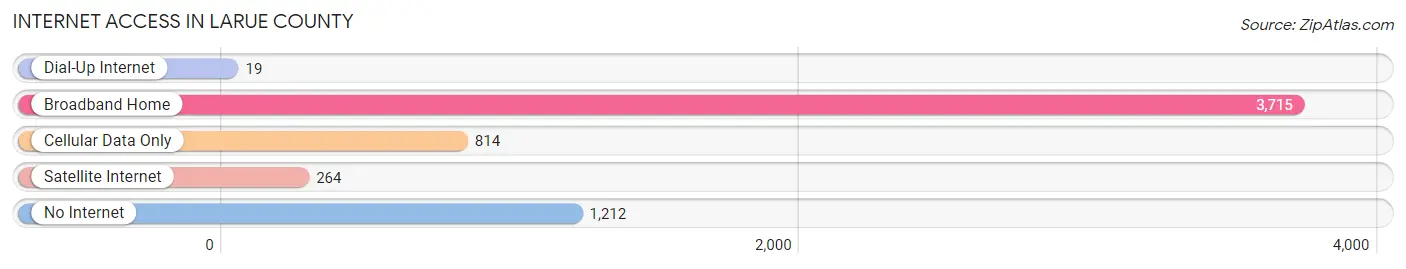
| Internet Type | # Households | % Households |
| Dial-Up Internet | 19 | 0.3% |
| Broadband Home | 3,715 | 62.3% |
| Cellular Data Only | 814 | 13.6% |
| Satellite Internet | 264 | 4.4% |
| No Internet | 1,212 | 20.3% |
| Total | 5,967 | 100.0% |
Larue County Summary
Larue County is located in the central region of Kentucky, and is part of the Elizabethtown-Fort Knox Metropolitan Statistical Area. The county was established in 1843 and is named after Revolutionary War hero, General Marquis de LaRue. The county seat is Hodgenville, which is also the birthplace of Abraham Lincoln. The county has a total area of 286 square miles, of which 284 square miles is land and 2 square miles is water. As of the 2010 census, the population was 14,193.
Geography
Larue County is located in the central region of Kentucky, and is part of the Elizabethtown-Fort Knox Metropolitan Statistical Area. The county is bordered by Hardin County to the north, Nelson County to the east, Marion County to the south, and Hart County to the west. The county has a total area of 286 square miles, of which 284 square miles is land and 2 square miles is water. The terrain is mostly rolling hills, with some flat areas in the northern part of the county. The highest point in the county is located in the northern part of the county, at an elevation of 890 feet. The county is drained by the Rolling Fork River, which flows through the county from north to south.
Economy
The economy of Larue County is largely based on agriculture. The county is home to several large farms, which produce a variety of crops, including corn, soybeans, wheat, hay, and tobacco. The county also has a thriving livestock industry, with cattle, hogs, and poultry being the main animals raised. The county is also home to several manufacturing companies, including a furniture factory, a plastics factory, and a metal fabrication plant.
Demographics
As of the 2010 census, the population of Larue County was 14,193. The racial makeup of the county was 95.3% White, 2.3% African American, 0.3% Native American, 0.3% Asian, 0.2% Pacific Islander, 0.7% from other races, and 0.9% from two or more races. Hispanic or Latino of any race were 1.7% of the population.
The median income for a household in the county was $37,945, and the median income for a family was $45,945. The per capita income for the county was $18,845. About 11.3% of families and 14.2% of the population were below the poverty line, including 18.2% of those under age 18 and 11.7% of those age 65 or over.
Education
Larue County is served by the Larue County School District, which consists of five elementary schools, two middle schools, and one high school. The county also has several private schools, including a Catholic school and a Christian school. The county is also home to a branch of Elizabethtown Community and Technical College.
Conclusion
Larue County is a rural county located in the central region of Kentucky. The county is home to a variety of industries, including agriculture, manufacturing, and retail. The county has a population of 14,193, and is served by the Larue County School District, as well as several private schools. The county is also home to a branch of Elizabethtown Community and Technical College.
Common Questions
What is Per Capita Income in Larue County?
Per Capita income in Larue County is $28,038.
What is the Median Family Income in Larue County?
Median Family Income in Larue County is $70,302.
What is the Median Household income in Larue County?
Median Household Income in Larue County is $57,867.
What is Income or Wage Gap in Larue County?
Income or Wage Gap in Larue County is 29.4%.
Women in Larue County earn 70.6 cents for every dollar earned by a man.
What is Family Income Deficit in Larue County?
Family Income Deficit in Larue County is $11,463.
Families that are below poverty line in Larue County earn $11,463 less on average than the poverty threshold level.
What is Inequality or Gini Index in Larue County?
Inequality or Gini Index in Larue County is 0.43.
What is the Total Population of Larue County?
Total Population of Larue County is 14,902.
What is the Total Male Population of Larue County?
Total Male Population of Larue County is 7,360.
What is the Total Female Population of Larue County?
Total Female Population of Larue County is 7,542.
What is the Ratio of Males per 100 Females in Larue County?
There are 97.59 Males per 100 Females in Larue County.
What is the Ratio of Females per 100 Males in Larue County?
There are 102.47 Females per 100 Males in Larue County.
What is the Median Population Age in Larue County?
Median Population Age in Larue County is 41.3 Years.
What is the Average Family Size in Larue County
Average Family Size in Larue County is 3.0 People.
What is the Average Household Size in Larue County
Average Household Size in Larue County is 2.5 People.
How Large is the Labor Force in Larue County?
There are 6,665 People in the Labor Forcein in Larue County.
What is the Percentage of People in the Labor Force in Larue County?
55.8% of People are in the Labor Force in Larue County.
What is the Unemployment Rate in Larue County?
Unemployment Rate in Larue County is 2.8%.