Knox County, KY Map & Demographics
Knox County Map
Knox County Overview
$20,658
PER CAPITA INCOME
$45,147
AVG FAMILY INCOME
$34,254
AVG HOUSEHOLD INCOME
41.1%
WAGE / INCOME GAP [ % ]
58.9¢/ $1
WAGE / INCOME GAP [ $ ]
$12,715
FAMILY INCOME DEFICIT
0.52
INEQUALITY / GINI INDEX
30,207
TOTAL POPULATION
14,686
MALE POPULATION
15,521
FEMALE POPULATION
94.62
MALES / 100 FEMALES
105.69
FEMALES / 100 MALES
40.1
MEDIAN AGE
3.3
AVG FAMILY SIZE
2.6
AVG HOUSEHOLD SIZE
10,129
LABOR FORCE [ PEOPLE ]
42.7%
PERCENT IN LABOR FORCE
8.9%
UNEMPLOYMENT RATE
Knox County Area Codes
Income in Knox County
Income Overview in Knox County
Per Capita Income in Knox County is $20,658, while median incomes of families and households are $45,147 and $34,254 respectively.
| Characteristic | Number | Measure |
| Per Capita Income | 30,207 | $20,658 |
| Median Family Income | 7,456 | $45,147 |
| Mean Family Income | 7,456 | $61,268 |
| Median Household Income | 11,229 | $34,254 |
| Mean Household Income | 11,229 | $52,729 |
| Income Deficit | 7,456 | $12,715 |
| Wage / Income Gap (%) | 30,207 | 41.07% |
| Wage / Income Gap ($) | 30,207 | 58.93¢ per $1 |
| Gini / Inequality Index | 30,207 | 0.52 |
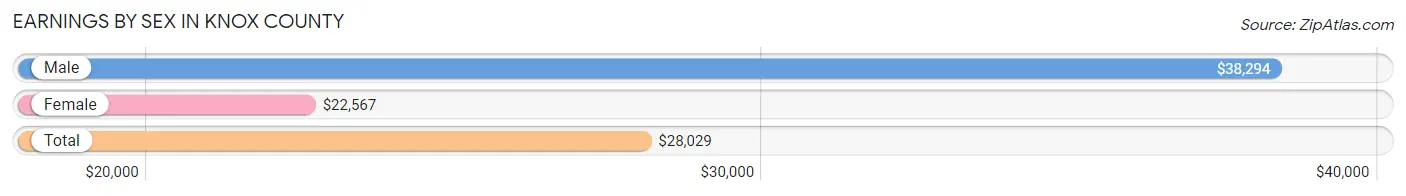
Earnings by Sex in Knox County
Average Earnings in Knox County are $28,029, $38,294 for men and $22,567 for women, a difference of 41.1%.
| Sex | Number | Average Earnings |
| Male | 5,342 (49.1%) | $38,294 |
| Female | 5,538 (50.9%) | $22,567 |
| Total | 10,880 (100.0%) | $28,029 |
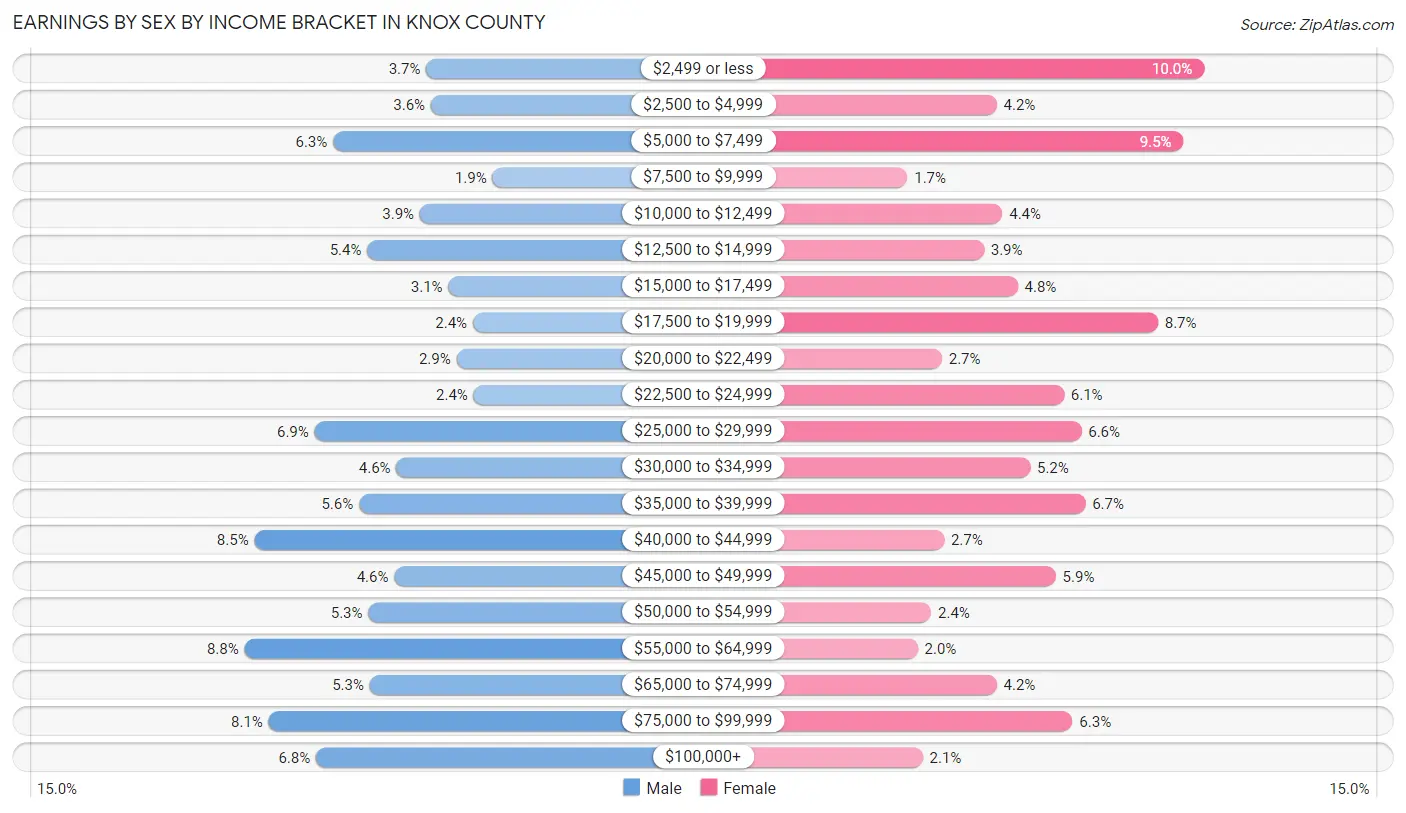
Earnings by Sex by Income Bracket in Knox County
The most common earnings brackets in Knox County are $55,000 to $64,999 for men (471 | 8.8%) and $2,499 or less for women (556 | 10.0%).
| Income | Male | Female |
| $2,499 or less | 198 (3.7%) | 556 (10.0%) |
| $2,500 to $4,999 | 191 (3.6%) | 233 (4.2%) |
| $5,000 to $7,499 | 338 (6.3%) | 524 (9.5%) |
| $7,500 to $9,999 | 99 (1.8%) | 94 (1.7%) |
| $10,000 to $12,499 | 208 (3.9%) | 242 (4.4%) |
| $12,500 to $14,999 | 287 (5.4%) | 213 (3.8%) |
| $15,000 to $17,499 | 165 (3.1%) | 266 (4.8%) |
| $17,500 to $19,999 | 128 (2.4%) | 484 (8.7%) |
| $20,000 to $22,499 | 153 (2.9%) | 148 (2.7%) |
| $22,500 to $24,999 | 127 (2.4%) | 338 (6.1%) |
| $25,000 to $29,999 | 366 (6.9%) | 365 (6.6%) |
| $30,000 to $34,999 | 243 (4.5%) | 285 (5.1%) |
| $35,000 to $39,999 | 299 (5.6%) | 371 (6.7%) |
| $40,000 to $44,999 | 456 (8.5%) | 151 (2.7%) |
| $45,000 to $49,999 | 246 (4.6%) | 325 (5.9%) |
| $50,000 to $54,999 | 285 (5.3%) | 131 (2.4%) |
| $55,000 to $64,999 | 471 (8.8%) | 110 (2.0%) |
| $65,000 to $74,999 | 283 (5.3%) | 233 (4.2%) |
| $75,000 to $99,999 | 435 (8.1%) | 351 (6.3%) |
| $100,000+ | 364 (6.8%) | 118 (2.1%) |
| Total | 5,342 (100.0%) | 5,538 (100.0%) |
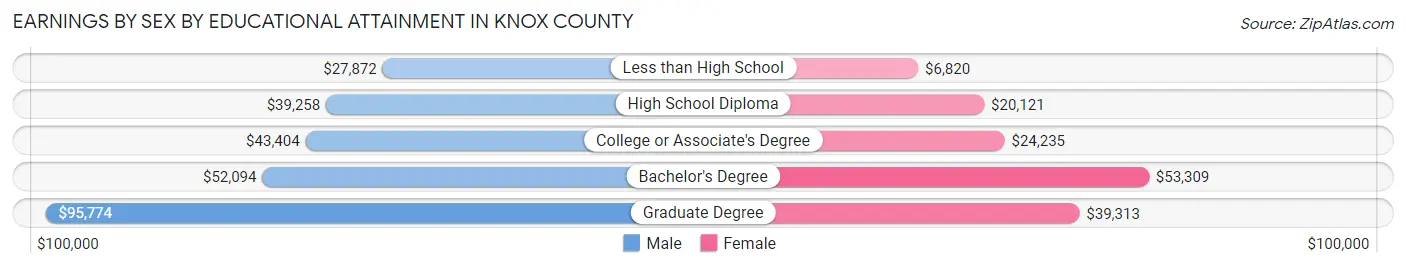
Earnings by Sex by Educational Attainment in Knox County
Average earnings in Knox County are $43,525 for men and $25,547 for women, a difference of 41.3%. Men with an educational attainment of graduate degree enjoy the highest average annual earnings of $95,774, while those with less than high school education earn the least with $27,872. Women with an educational attainment of bachelor's degree earn the most with the average annual earnings of $53,309, while those with less than high school education have the smallest earnings of $6,820.
| Educational Attainment | Male Income | Female Income |
| Less than High School | $27,872 | $6,820 |
| High School Diploma | $39,258 | $20,121 |
| College or Associate's Degree | $43,404 | $24,235 |
| Bachelor's Degree | $52,094 | $53,309 |
| Graduate Degree | $95,774 | $39,313 |
| Total | $43,525 | $25,547 |
Family Income in Knox County
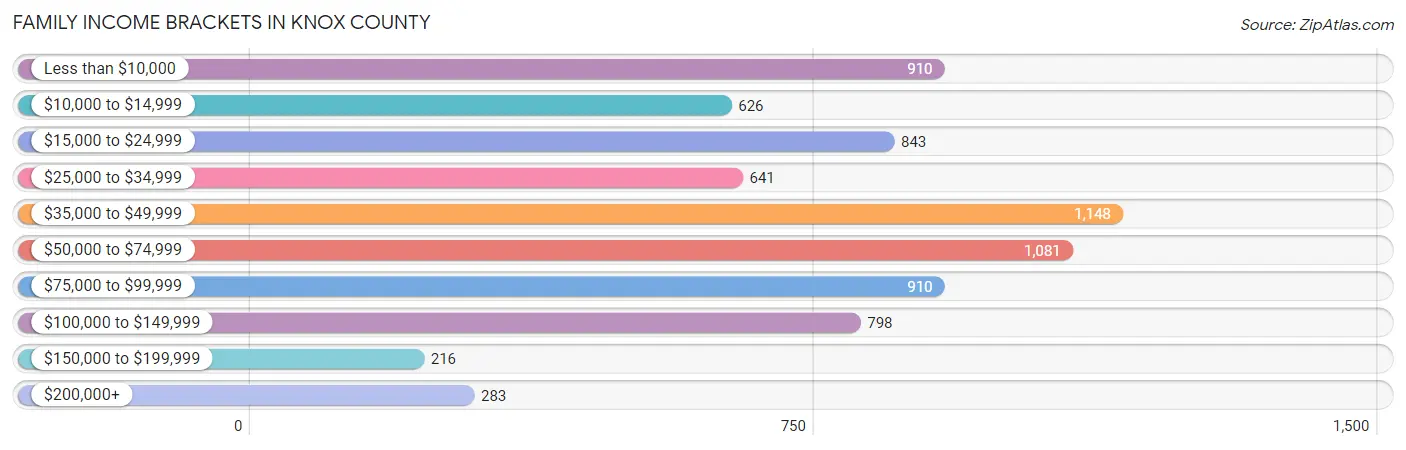
Family Income Brackets in Knox County
According to the Knox County family income data, there are 1,148 families falling into the $35,000 to $49,999 income range, which is the most common income bracket and makes up 15.4% of all families. Conversely, the $150,000 to $199,999 income bracket is the least frequent group with only 216 families (2.9%) belonging to this category.
| Income Bracket | # Families | % Families |
| Less than $10,000 | 910 | 12.2% |
| $10,000 to $14,999 | 626 | 8.4% |
| $15,000 to $24,999 | 843 | 11.3% |
| $25,000 to $34,999 | 641 | 8.6% |
| $35,000 to $49,999 | 1,148 | 15.4% |
| $50,000 to $74,999 | 1,081 | 14.5% |
| $75,000 to $99,999 | 910 | 12.2% |
| $100,000 to $149,999 | 798 | 10.7% |
| $150,000 to $199,999 | 216 | 2.9% |
| $200,000+ | 283 | 3.8% |
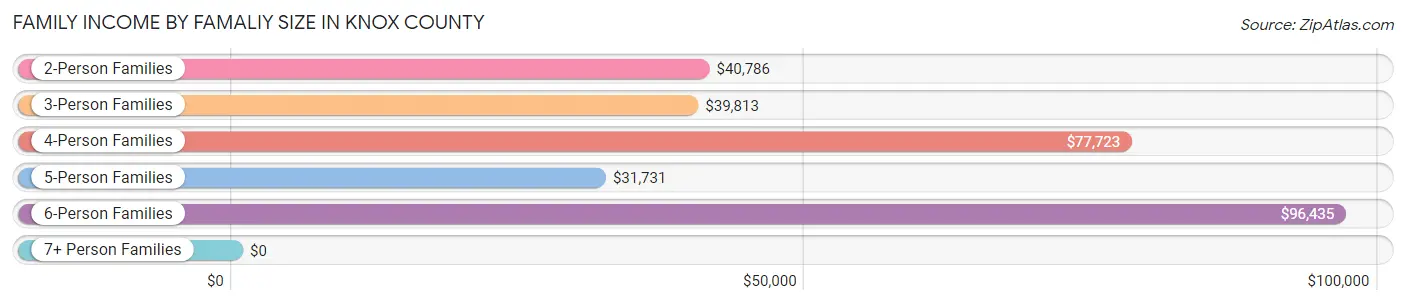
Family Income by Famaliy Size in Knox County
6-person families (183 | 2.5%) account for the highest median family income in Knox County with $96,435 per family, while 2-person families (3,293 | 44.2%) have the highest median income of $20,393 per family member.
| Income Bracket | # Families | Median Income |
| 2-Person Families | 3,293 (44.2%) | $40,786 |
| 3-Person Families | 2,194 (29.4%) | $39,813 |
| 4-Person Families | 1,125 (15.1%) | $77,723 |
| 5-Person Families | 596 (8.0%) | $31,731 |
| 6-Person Families | 183 (2.5%) | $96,435 |
| 7+ Person Families | 65 (0.9%) | $0 |
| Total | 7,456 (100.0%) | $45,147 |
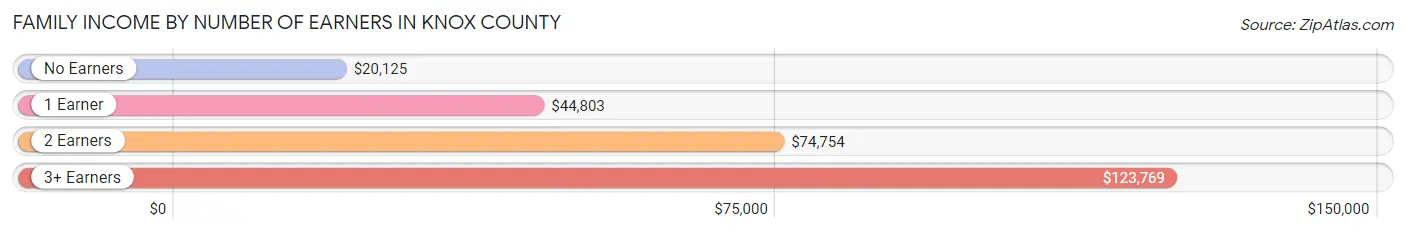
Family Income by Number of Earners in Knox County
The median family income in Knox County is $45,147, with families comprising 3+ earners (634) having the highest median family income of $123,769, while families with no earners (2,668) have the lowest median family income of $20,125, accounting for 8.5% and 35.8% of families, respectively.
| Number of Earners | # Families | Median Income |
| No Earners | 2,668 (35.8%) | $20,125 |
| 1 Earner | 2,069 (27.8%) | $44,803 |
| 2 Earners | 2,085 (28.0%) | $74,754 |
| 3+ Earners | 634 (8.5%) | $123,769 |
| Total | 7,456 (100.0%) | $45,147 |
Household Income in Knox County
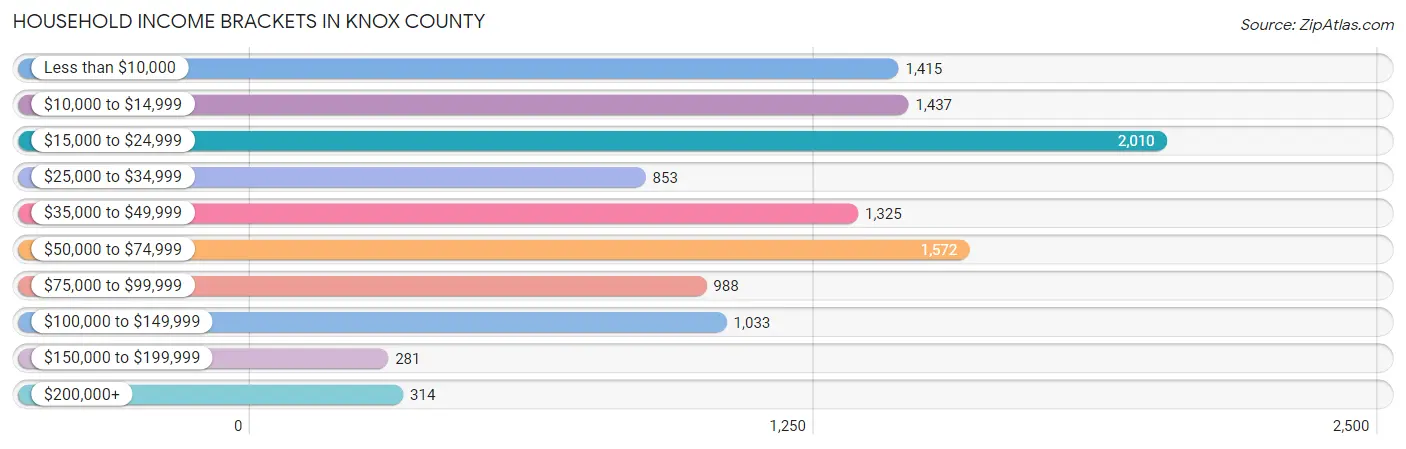
Household Income Brackets in Knox County
With 2,010 households falling in the category, the $15,000 to $24,999 income range is the most frequent in Knox County, accounting for 17.9% of all households. In contrast, only 281 households (2.5%) fall into the $150,000 to $199,999 income bracket, making it the least populous group.
| Income Bracket | # Households | % Households |
| Less than $10,000 | 1,415 | 12.6% |
| $10,000 to $14,999 | 1,437 | 12.8% |
| $15,000 to $24,999 | 2,010 | 17.9% |
| $25,000 to $34,999 | 853 | 7.6% |
| $35,000 to $49,999 | 1,325 | 11.8% |
| $50,000 to $74,999 | 1,572 | 14.0% |
| $75,000 to $99,999 | 988 | 8.8% |
| $100,000 to $149,999 | 1,033 | 9.2% |
| $150,000 to $199,999 | 281 | 2.5% |
| $200,000+ | 314 | 2.8% |
Household Income by Householder Age in Knox County
The median household income in Knox County is $34,254, with the highest median household income of $43,036 found in the 15 to 24 years age bracket for the primary householder. A total of 308 households (2.7%) fall into this category. Meanwhile, the 65+ years age bracket for the primary householder has the lowest median household income of $29,759, with 3,332 households (29.7%) in this group.
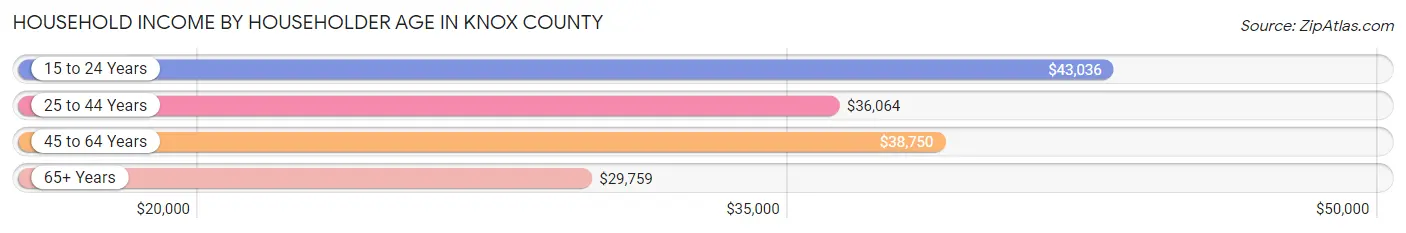
| Income Bracket | # Households | Median Income |
| 15 to 24 Years | 308 (2.7%) | $43,036 |
| 25 to 44 Years | 3,025 (26.9%) | $36,064 |
| 45 to 64 Years | 4,564 (40.6%) | $38,750 |
| 65+ Years | 3,332 (29.7%) | $29,759 |
| Total | 11,229 (100.0%) | $34,254 |
Poverty in Knox County
Income Below Poverty by Sex and Age in Knox County
With 30.6% poverty level for males and 37.3% for females among the residents of Knox County, 5 year old males and under 5 year old females are the most vulnerable to poverty, with 99 males (76.1%) and 604 females (68.6%) in their respective age groups living below the poverty level.
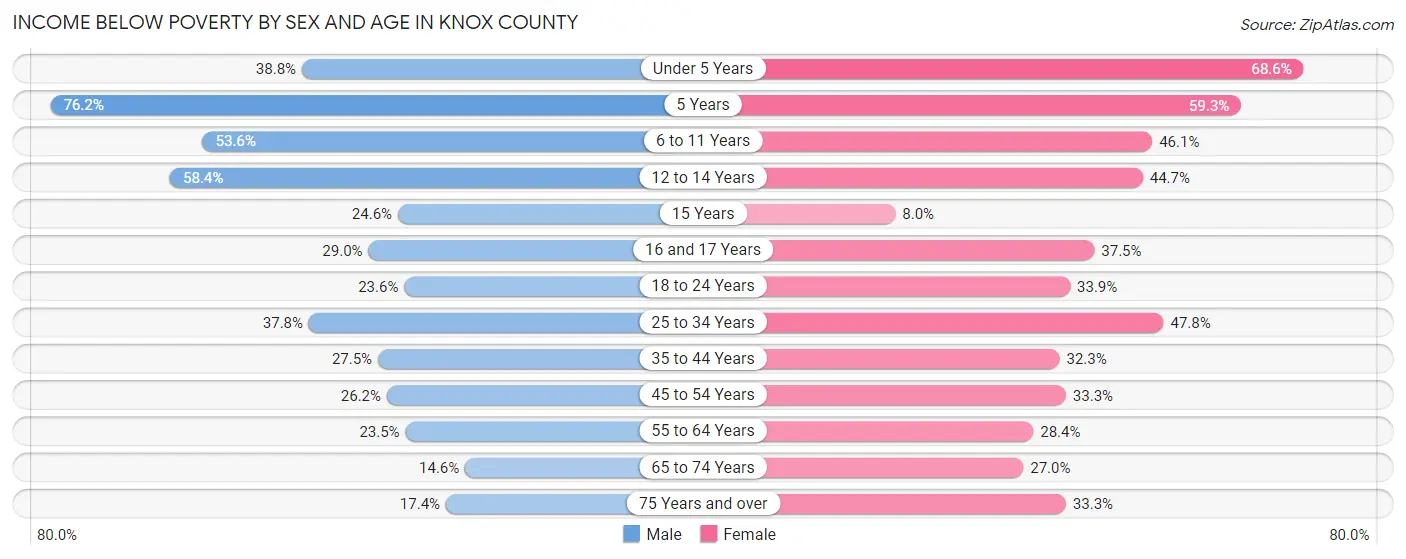
| Age Bracket | Male | Female |
| Under 5 Years | 387 (38.8%) | 604 (68.6%) |
| 5 Years | 99 (76.1%) | 118 (59.3%) |
| 6 to 11 Years | 730 (53.6%) | 710 (46.1%) |
| 12 to 14 Years | 247 (58.4%) | 139 (44.7%) |
| 15 Years | 72 (24.6%) | 21 (8.0%) |
| 16 and 17 Years | 88 (28.9%) | 120 (37.5%) |
| 18 to 24 Years | 311 (23.6%) | 378 (33.9%) |
| 25 to 34 Years | 721 (37.8%) | 903 (47.8%) |
| 35 to 44 Years | 462 (27.5%) | 575 (32.3%) |
| 45 to 54 Years | 503 (26.2%) | 654 (33.3%) |
| 55 to 64 Years | 430 (23.4%) | 604 (28.4%) |
| 65 to 74 Years | 197 (14.6%) | 429 (27.0%) |
| 75 Years and over | 142 (17.4%) | 386 (33.3%) |
| Total | 4,389 (30.6%) | 5,641 (37.3%) |
Income Above Poverty by Sex and Age in Knox County
According to the poverty statistics in Knox County, males aged 65 to 74 years and females aged 15 years are the age groups that are most secure financially, with 85.4% of males and 92.0% of females in these age groups living above the poverty line.
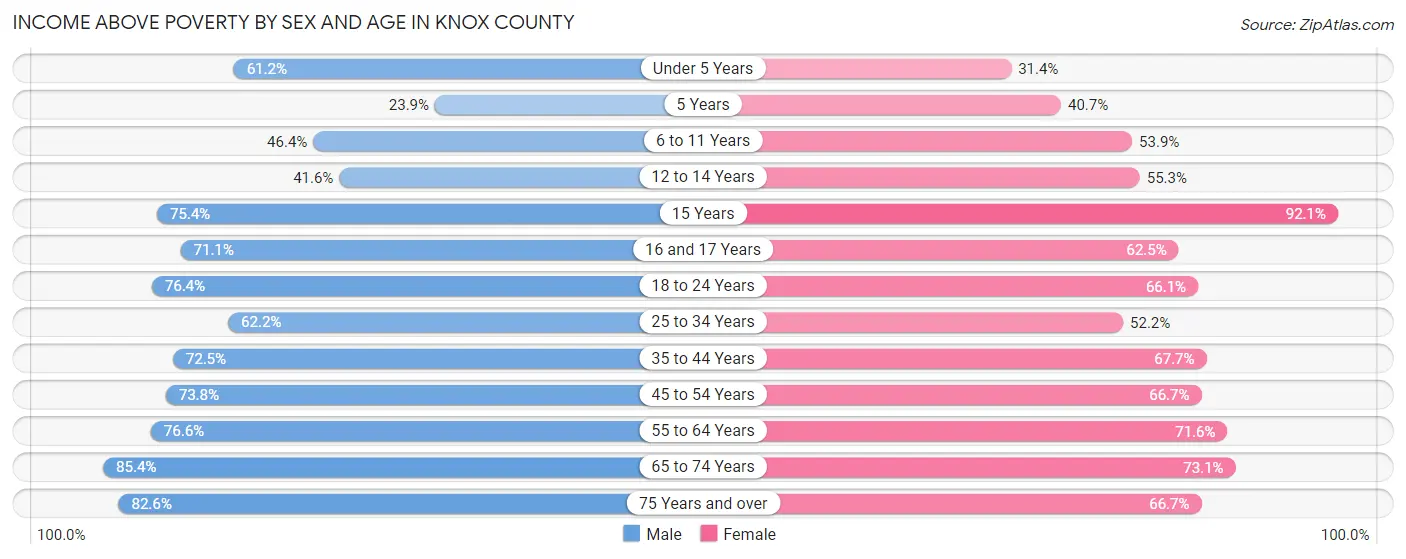
| Age Bracket | Male | Female |
| Under 5 Years | 610 (61.2%) | 277 (31.4%) |
| 5 Years | 31 (23.8%) | 81 (40.7%) |
| 6 to 11 Years | 633 (46.4%) | 830 (53.9%) |
| 12 to 14 Years | 176 (41.6%) | 172 (55.3%) |
| 15 Years | 221 (75.4%) | 243 (92.0%) |
| 16 and 17 Years | 216 (71.1%) | 200 (62.5%) |
| 18 to 24 Years | 1,005 (76.4%) | 737 (66.1%) |
| 25 to 34 Years | 1,187 (62.2%) | 987 (52.2%) |
| 35 to 44 Years | 1,216 (72.5%) | 1,203 (67.7%) |
| 45 to 54 Years | 1,416 (73.8%) | 1,311 (66.7%) |
| 55 to 64 Years | 1,404 (76.5%) | 1,520 (71.6%) |
| 65 to 74 Years | 1,153 (85.4%) | 1,163 (73.1%) |
| 75 Years and over | 672 (82.6%) | 774 (66.7%) |
| Total | 9,940 (69.4%) | 9,498 (62.7%) |
Income Below Poverty Among Married-Couple Families in Knox County
The poverty statistics for married-couple families in Knox County show that 17.1% or 856 of the total 5,022 families live below the poverty line. Families with 5 or more children have the highest poverty rate of 100.0%, comprising of 47 families. On the other hand, families with no children have the lowest poverty rate of 11.7%, which includes 338 families.
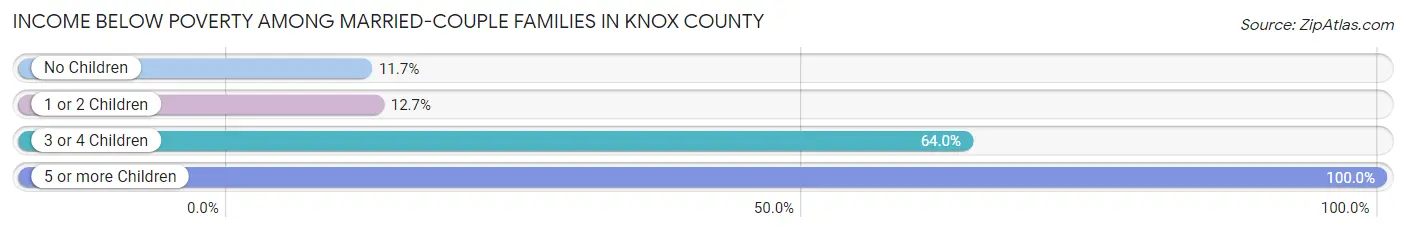
| Children | Above Poverty | Below Poverty |
| No Children | 2,562 (88.3%) | 338 (11.7%) |
| 1 or 2 Children | 1,458 (87.3%) | 212 (12.7%) |
| 3 or 4 Children | 146 (36.0%) | 259 (63.9%) |
| 5 or more Children | 0 (0.0%) | 47 (100.0%) |
| Total | 4,166 (83.0%) | 856 (17.1%) |
Income Below Poverty Among Single-Parent Households in Knox County
According to the poverty data in Knox County, 31.5% or 248 single-father households and 66.8% or 1,100 single-mother households are living below the poverty line. Among single-father households, those with no children have the highest poverty rate, with 121 households (33.1%) experiencing poverty. Likewise, among single-mother households, those with 3 or 4 children have the highest poverty rate, with 84 households (100.0%) falling below the poverty line.
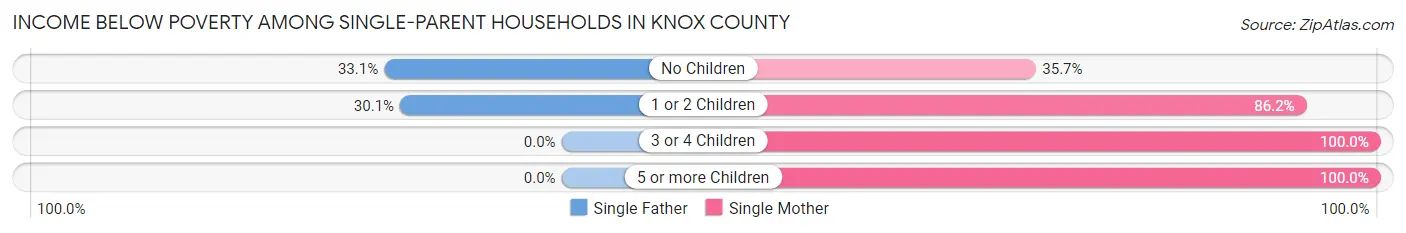
| Children | Single Father | Single Mother |
| No Children | 121 (33.1%) | 235 (35.7%) |
| 1 or 2 Children | 127 (30.1%) | 767 (86.2%) |
| 3 or 4 Children | 0 (0.0%) | 84 (100.0%) |
| 5 or more Children | 0 (0.0%) | 14 (100.0%) |
| Total | 248 (31.5%) | 1,100 (66.8%) |
Income Below Poverty Among Married-Couple vs Single-Parent Households in Knox County
The poverty data for Knox County shows that 856 of the married-couple family households (17.1%) and 1,348 of the single-parent households (55.4%) are living below the poverty level. Within the married-couple family households, those with 5 or more children have the highest poverty rate, with 47 households (100.0%) falling below the poverty line. Among the single-parent households, those with 3 or 4 children have the highest poverty rate, with 84 household (100.0%) living below poverty.
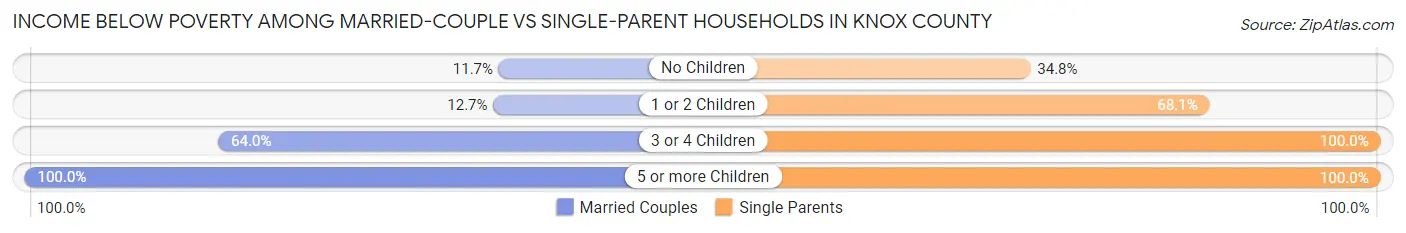
| Children | Married-Couple Families | Single-Parent Households |
| No Children | 338 (11.7%) | 356 (34.8%) |
| 1 or 2 Children | 212 (12.7%) | 894 (68.1%) |
| 3 or 4 Children | 259 (63.9%) | 84 (100.0%) |
| 5 or more Children | 47 (100.0%) | 14 (100.0%) |
| Total | 856 (17.1%) | 1,348 (55.4%) |
Race in Knox County
The most populous races in Knox County are White / Caucasian (28,973 | 95.9%), Two or more Races (892 | 2.9%), and Hispanic or Latino (449 | 1.5%).
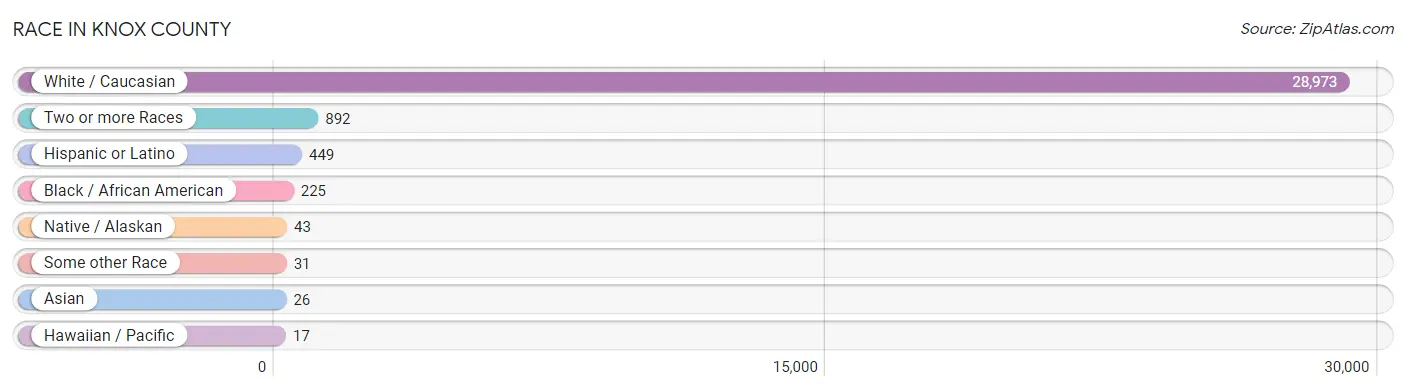
| Race | # Population | % Population |
| Asian | 26 | 0.1% |
| Black / African American | 225 | 0.7% |
| Hawaiian / Pacific | 17 | 0.1% |
| Hispanic or Latino | 449 | 1.5% |
| Native / Alaskan | 43 | 0.1% |
| White / Caucasian | 28,973 | 95.9% |
| Two or more Races | 892 | 2.9% |
| Some other Race | 31 | 0.1% |
| Total | 30,207 | 100.0% |
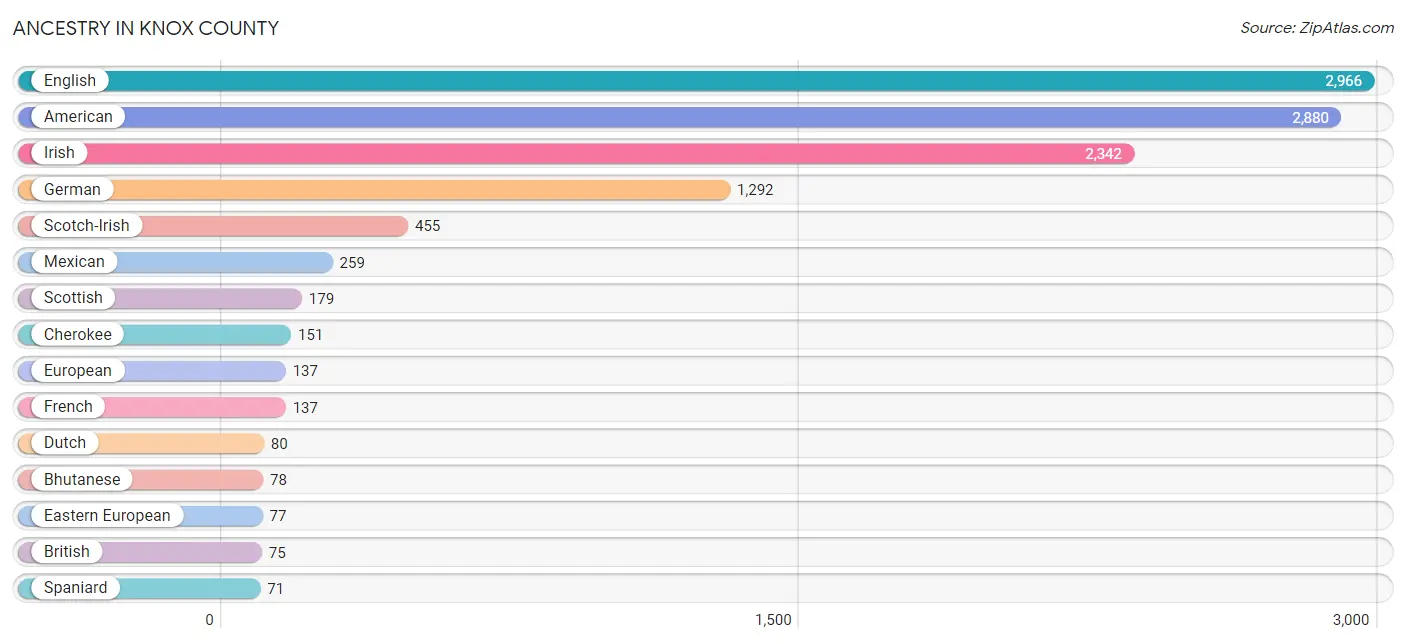
Ancestry in Knox County
The most populous ancestries reported in Knox County are English (2,966 | 9.8%), American (2,880 | 9.5%), Irish (2,342 | 7.7%), German (1,292 | 4.3%), and Scotch-Irish (455 | 1.5%), together accounting for 32.9% of all Knox County residents.
| Ancestry | # Population | % Population |
| African | 20 | 0.1% |
| American | 2,880 | 9.5% |
| Arab | 10 | 0.0% |
| Bhutanese | 78 | 0.3% |
| Blackfeet | 16 | 0.1% |
| British | 75 | 0.3% |
| Canadian | 8 | 0.0% |
| Central American | 9 | 0.0% |
| Cherokee | 151 | 0.5% |
| Choctaw | 36 | 0.1% |
| Czech | 15 | 0.1% |
| Czechoslovakian | 5 | 0.0% |
| Dutch | 80 | 0.3% |
| Eastern European | 77 | 0.3% |
| English | 2,966 | 9.8% |
| European | 137 | 0.4% |
| French | 137 | 0.4% |
| French Canadian | 8 | 0.0% |
| German | 1,292 | 4.3% |
| Guatemalan | 9 | 0.0% |
| Hungarian | 18 | 0.1% |
| Irish | 2,342 | 7.7% |
| Italian | 58 | 0.2% |
| Japanese | 26 | 0.1% |
| Korean | 12 | 0.0% |
| Mexican | 259 | 0.9% |
| Mexican American Indian | 7 | 0.0% |
| Northern European | 7 | 0.0% |
| Norwegian | 16 | 0.1% |
| Osage | 5 | 0.0% |
| Peruvian | 23 | 0.1% |
| Polish | 18 | 0.1% |
| Romanian | 31 | 0.1% |
| Scandinavian | 10 | 0.0% |
| Scotch-Irish | 455 | 1.5% |
| Scottish | 179 | 0.6% |
| Slovak | 29 | 0.1% |
| South African | 25 | 0.1% |
| South American | 23 | 0.1% |
| Spaniard | 71 | 0.2% |
| Subsaharan African | 45 | 0.2% |
| Swedish | 6 | 0.0% |
| Swiss | 11 | 0.0% |
| Welsh | 13 | 0.0% |
| Yugoslavian | 30 | 0.1% | View All 45 Rows |
Immigrants in Knox County
The most numerous immigrant groups reported in Knox County came from Latin America (61 | 0.2%), Canada (55 | 0.2%), Asia (43 | 0.1%), South Eastern Asia (43 | 0.1%), and Europe (41 | 0.1%), together accounting for 0.8% of all Knox County residents.
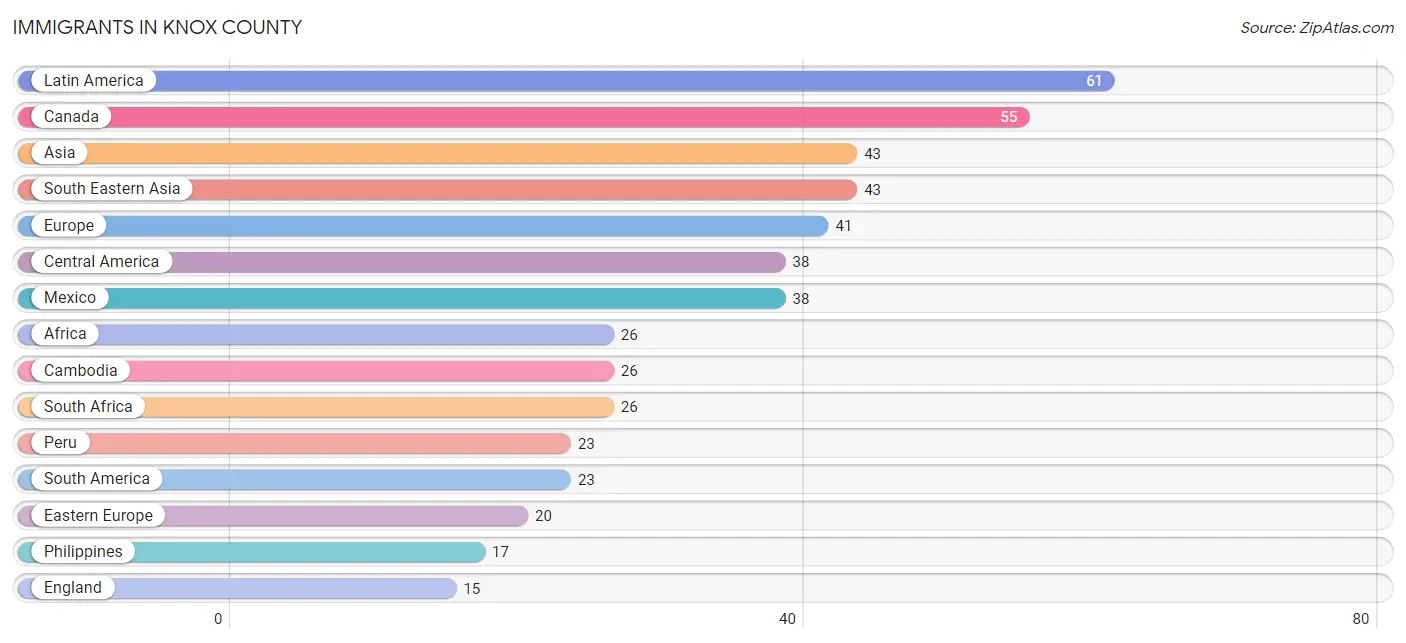
| Immigration Origin | # Population | % Population |
| Africa | 26 | 0.1% |
| Asia | 43 | 0.1% |
| Bosnia and Herzegovina | 9 | 0.0% |
| Cambodia | 26 | 0.1% |
| Canada | 55 | 0.2% |
| Central America | 38 | 0.1% |
| Eastern Europe | 20 | 0.1% |
| England | 15 | 0.1% |
| Europe | 41 | 0.1% |
| Latin America | 61 | 0.2% |
| Mexico | 38 | 0.1% |
| Northern Europe | 15 | 0.1% |
| Peru | 23 | 0.1% |
| Philippines | 17 | 0.1% |
| Romania | 10 | 0.0% |
| South Africa | 26 | 0.1% |
| South America | 23 | 0.1% |
| South Eastern Asia | 43 | 0.1% |
| Southern Europe | 6 | 0.0% |
| Spain | 6 | 0.0% |
| Ukraine | 1 | 0.0% | View All 21 Rows |
Sex and Age in Knox County
Sex and Age in Knox County
The most populous age groups in Knox County are 20 to 24 Years (1,073 | 7.3%) for men and 40 to 44 Years (1,102 | 7.1%) for women.
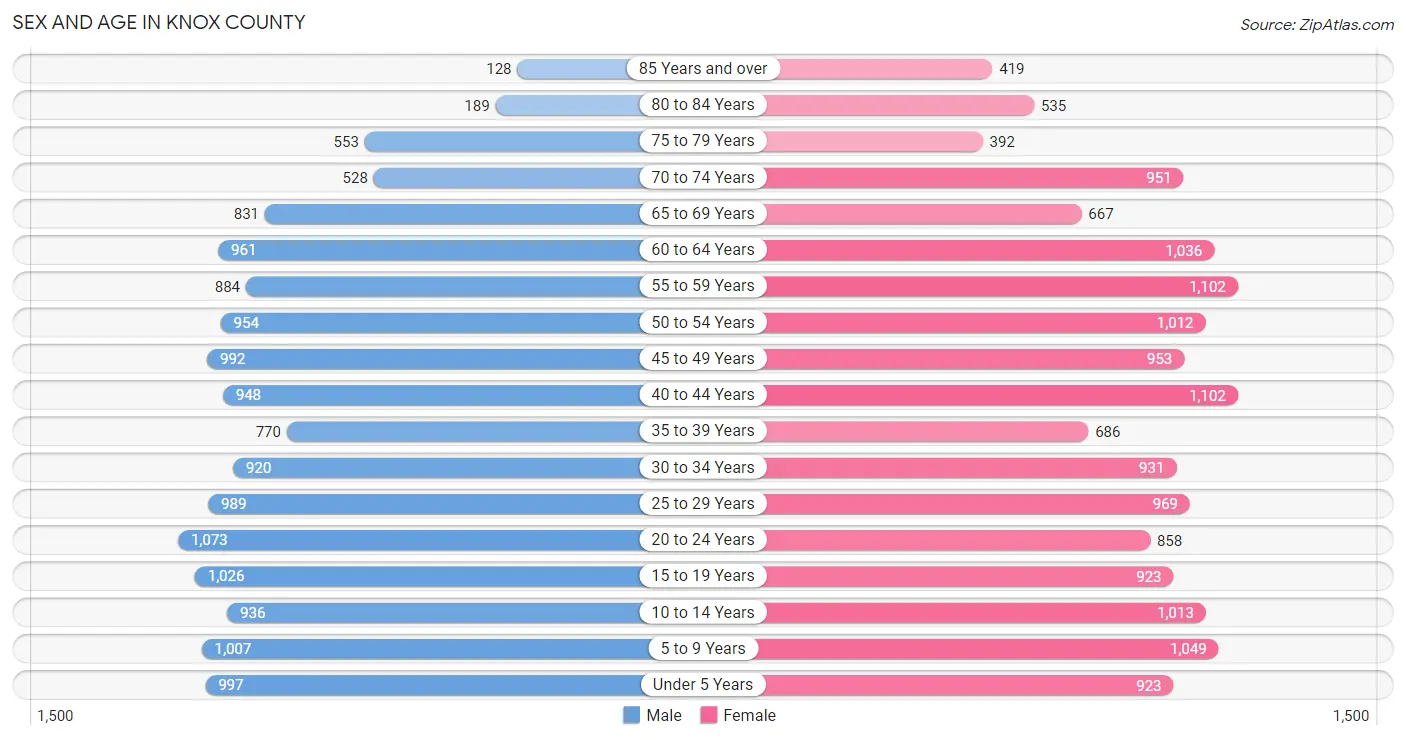
| Age Bracket | Male | Female |
| Under 5 Years | 997 (6.8%) | 923 (5.9%) |
| 5 to 9 Years | 1,007 (6.9%) | 1,049 (6.8%) |
| 10 to 14 Years | 936 (6.4%) | 1,013 (6.5%) |
| 15 to 19 Years | 1,026 (7.0%) | 923 (5.9%) |
| 20 to 24 Years | 1,073 (7.3%) | 858 (5.5%) |
| 25 to 29 Years | 989 (6.7%) | 969 (6.2%) |
| 30 to 34 Years | 920 (6.3%) | 931 (6.0%) |
| 35 to 39 Years | 770 (5.2%) | 686 (4.4%) |
| 40 to 44 Years | 948 (6.5%) | 1,102 (7.1%) |
| 45 to 49 Years | 992 (6.8%) | 953 (6.1%) |
| 50 to 54 Years | 954 (6.5%) | 1,012 (6.5%) |
| 55 to 59 Years | 884 (6.0%) | 1,102 (7.1%) |
| 60 to 64 Years | 961 (6.5%) | 1,036 (6.7%) |
| 65 to 69 Years | 831 (5.7%) | 667 (4.3%) |
| 70 to 74 Years | 528 (3.6%) | 951 (6.1%) |
| 75 to 79 Years | 553 (3.8%) | 392 (2.5%) |
| 80 to 84 Years | 189 (1.3%) | 535 (3.5%) |
| 85 Years and over | 128 (0.9%) | 419 (2.7%) |
| Total | 14,686 (100.0%) | 15,521 (100.0%) |
Families and Households in Knox County
Median Family Size in Knox County
The median family size in Knox County is 3.32 persons per family, with married-couple families (5,022 | 67.4%) accounting for the largest median family size of 3.43 persons per family. On the other hand, single female/mother families (1,646 | 22.1%) represent the smallest median family size with 2.97 persons per family.
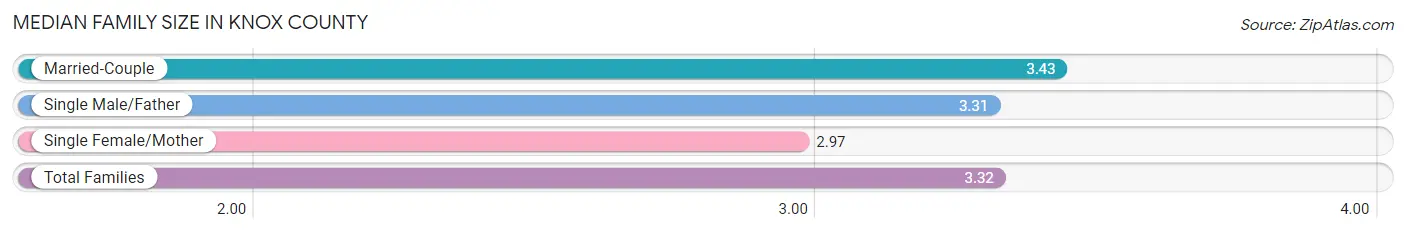
| Family Type | # Families | Family Size |
| Married-Couple | 5,022 (67.4%) | 3.43 |
| Single Male/Father | 788 (10.6%) | 3.31 |
| Single Female/Mother | 1,646 (22.1%) | 2.97 |
| Total Families | 7,456 (100.0%) | 3.32 |
Median Household Size in Knox County
The median household size in Knox County is 2.63 persons per household, with married-couple households (5,022 | 44.7%) accounting for the largest median household size of 3.46 persons per household. non-family households (3,773 | 33.6%) represent the smallest median household size with 1.14 persons per household.
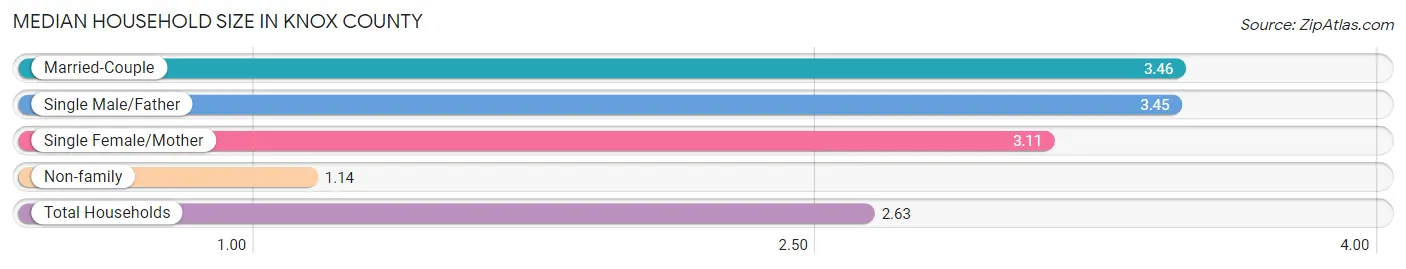
| Household Type | # Households | Household Size |
| Married-Couple | 5,022 (44.7%) | 3.46 |
| Single Male/Father | 788 (7.0%) | 3.45 |
| Single Female/Mother | 1,646 (14.7%) | 3.11 |
| Non-family | 3,773 (33.6%) | 1.14 |
| Total Households | 11,229 (100.0%) | 2.63 |
Household Size by Marriage Status in Knox County
Out of a total of 11,229 households in Knox County, 7,456 (66.4%) are family households, while 3,773 (33.6%) are nonfamily households. The most numerous type of family households are 2-person households, comprising 3,057, and the most common type of nonfamily households are 1-person households, comprising 3,376.
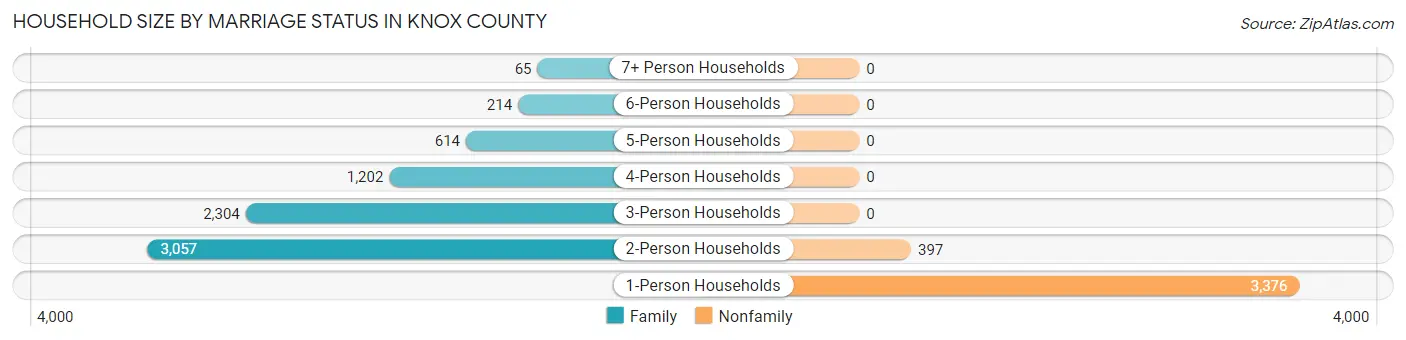
| Household Size | Family Households | Nonfamily Households |
| 1-Person Households | - | 3,376 (30.1%) |
| 2-Person Households | 3,057 (27.2%) | 397 (3.5%) |
| 3-Person Households | 2,304 (20.5%) | 0 (0.0%) |
| 4-Person Households | 1,202 (10.7%) | 0 (0.0%) |
| 5-Person Households | 614 (5.5%) | 0 (0.0%) |
| 6-Person Households | 214 (1.9%) | 0 (0.0%) |
| 7+ Person Households | 65 (0.6%) | 0 (0.0%) |
| Total | 7,456 (66.4%) | 3,773 (33.6%) |
Female Fertility in Knox County
Fertility by Age in Knox County
Average fertility rate in Knox County is 47.0 births per 1,000 women. Women in the age bracket of 20 to 34 years have the highest fertility rate with 83.0 births per 1,000 women. Women in the age bracket of 20 to 34 years acount for 72.6% of all women with births.
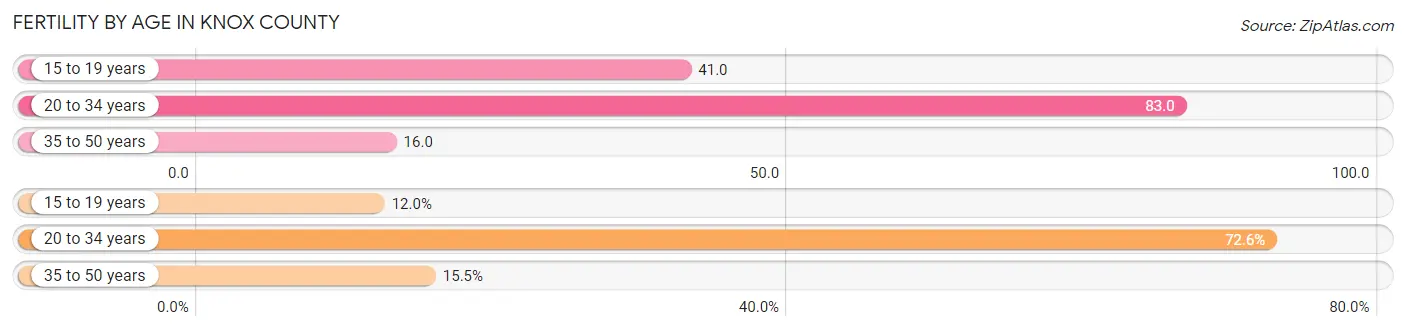
| Age Bracket | Women with Births | Births / 1,000 Women |
| 15 to 19 years | 38 (12.0%) | 41.0 |
| 20 to 34 years | 230 (72.6%) | 83.0 |
| 35 to 50 years | 49 (15.5%) | 16.0 |
| Total | 317 (100.0%) | 47.0 |
Fertility by Age by Marriage Status in Knox County
62.5% of women with births (317) in Knox County are married. The highest percentage of unmarried women with births falls into 15 to 19 years age bracket with 78.9% of them unmarried at the time of birth, while the lowest percentage of unmarried women with births belong to 35 to 50 years age bracket with 0.0% of them unmarried.
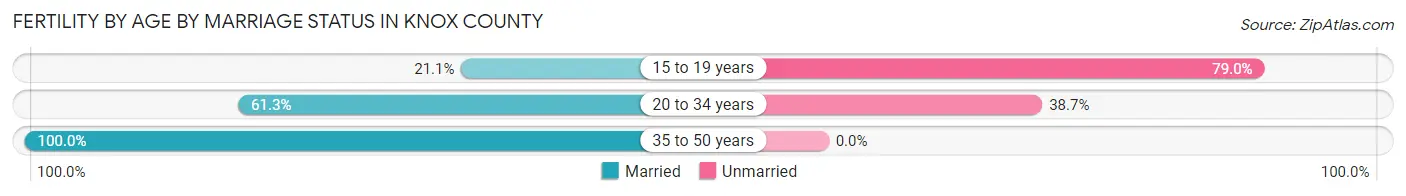
| Age Bracket | Married | Unmarried |
| 15 to 19 years | 8 (21.0%) | 30 (78.9%) |
| 20 to 34 years | 141 (61.3%) | 89 (38.7%) |
| 35 to 50 years | 49 (100.0%) | 0 (0.0%) |
| Total | 198 (62.5%) | 119 (37.5%) |
Fertility by Education in Knox County
Average fertility rate in Knox County is 47.0 births per 1,000 women. Women with the education attainment of graduate degree have the highest fertility rate of 77.0 births per 1,000 women, while women with the education attainment of bachelor's degree have the lowest fertility at 36.0 births per 1,000 women. Women with the education attainment of college or associate's degree represent 32.5% of all women with births.
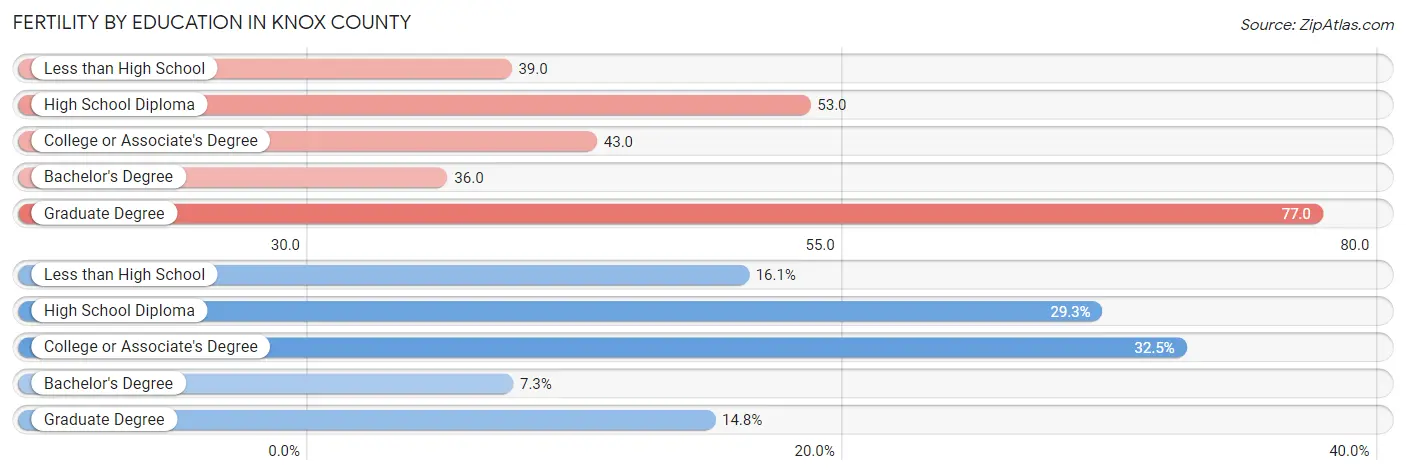
| Educational Attainment | Women with Births | Births / 1,000 Women |
| Less than High School | 51 (16.1%) | 39.0 |
| High School Diploma | 93 (29.3%) | 53.0 |
| College or Associate's Degree | 103 (32.5%) | 43.0 |
| Bachelor's Degree | 23 (7.3%) | 36.0 |
| Graduate Degree | 47 (14.8%) | 77.0 |
| Total | 317 (100.0%) | 47.0 |
Fertility by Education by Marriage Status in Knox County
37.5% of women with births in Knox County are unmarried. Women with the educational attainment of bachelor's degree are most likely to be married with 100.0% of them married at childbirth, while women with the educational attainment of high school diploma are least likely to be married with 62.4% of them unmarried at childbirth.
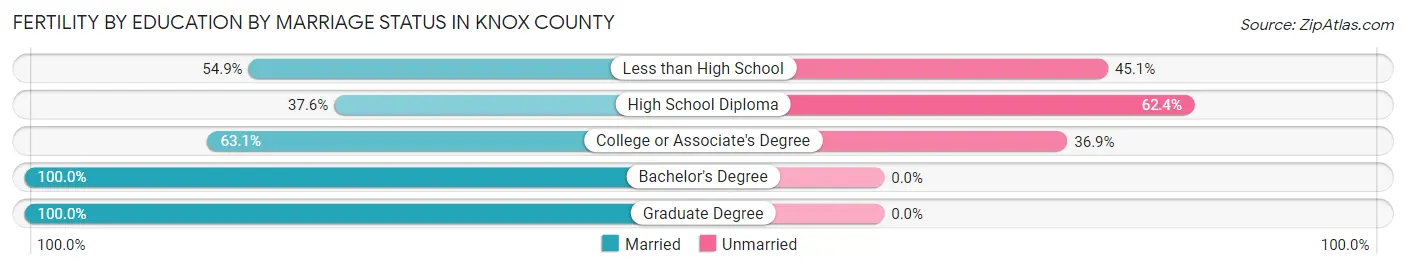
| Educational Attainment | Married | Unmarried |
| Less than High School | 28 (54.9%) | 23 (45.1%) |
| High School Diploma | 35 (37.6%) | 58 (62.4%) |
| College or Associate's Degree | 65 (63.1%) | 38 (36.9%) |
| Bachelor's Degree | 23 (100.0%) | 0 (0.0%) |
| Graduate Degree | 47 (100.0%) | 0 (0.0%) |
| Total | 198 (62.5%) | 119 (37.5%) |
Employment Characteristics in Knox County
Employment by Class of Employer in Knox County
Among the 8,941 employed individuals in Knox County, private company employees (5,421 | 60.6%), not-for-profit organizations (1,196 | 13.4%), and state government employees (633 | 7.1%) make up the most common classes of employment.
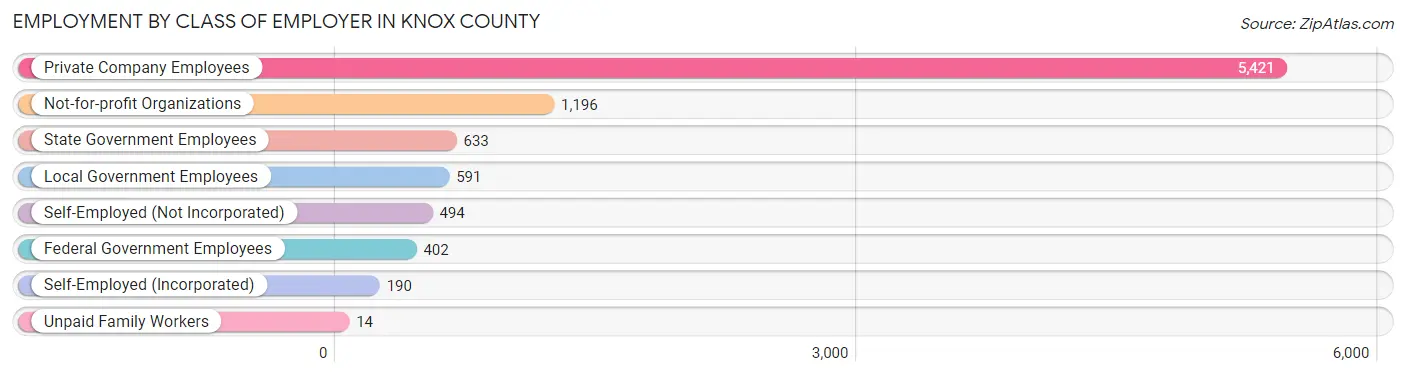
| Employer Class | # Employees | % Employees |
| Private Company Employees | 5,421 | 60.6% |
| Self-Employed (Incorporated) | 190 | 2.1% |
| Self-Employed (Not Incorporated) | 494 | 5.5% |
| Not-for-profit Organizations | 1,196 | 13.4% |
| Local Government Employees | 591 | 6.6% |
| State Government Employees | 633 | 7.1% |
| Federal Government Employees | 402 | 4.5% |
| Unpaid Family Workers | 14 | 0.2% |
| Total | 8,941 | 100.0% |
Employment Status by Age in Knox County
According to the labor force statistics for Knox County, out of the total population over 16 years of age (23,722), 42.7% or 10,129 individuals are in the labor force, with 8.9% or 901 of them unemployed. The age group with the highest labor force participation rate is 25 to 29 years, with 69.4% or 1,359 individuals in the labor force. Within the labor force, the 16 to 19 years age range has the highest percentage of unemployed individuals, with 35.0% or 147 of them being unemployed.
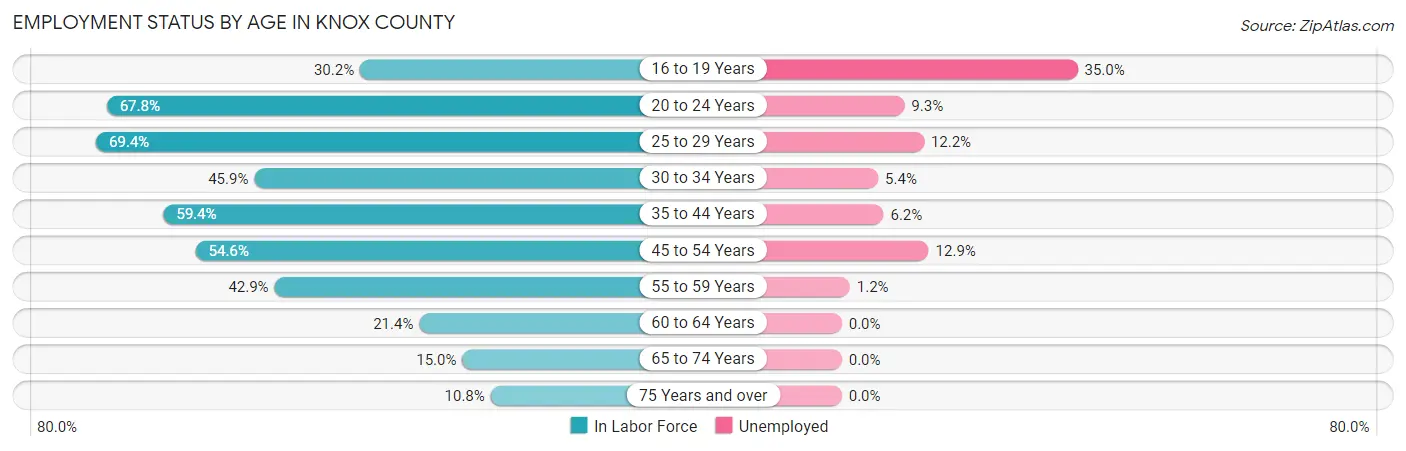
| Age Bracket | In Labor Force | Unemployed |
| 16 to 19 Years | 419 (30.2%) | 147 (35.0%) |
| 20 to 24 Years | 1,309 (67.8%) | 122 (9.3%) |
| 25 to 29 Years | 1,359 (69.4%) | 166 (12.2%) |
| 30 to 34 Years | 850 (45.9%) | 46 (5.4%) |
| 35 to 44 Years | 2,083 (59.4%) | 129 (6.2%) |
| 45 to 54 Years | 2,135 (54.6%) | 275 (12.9%) |
| 55 to 59 Years | 852 (42.9%) | 10 (1.2%) |
| 60 to 64 Years | 427 (21.4%) | 0 (0.0%) |
| 65 to 74 Years | 447 (15.0%) | 0 (0.0%) |
| 75 Years and over | 239 (10.8%) | 0 (0.0%) |
| Total | 10,129 (42.7%) | 901 (8.9%) |
Employment Status by Educational Attainment in Knox County
According to labor force statistics for Knox County, 50.7% of individuals (7,711) out of the total population between 25 and 64 years of age (15,209) are in the labor force, with 8.2% or 632 of them being unemployed. The group with the highest labor force participation rate are those with the educational attainment of bachelor's degree or higher, with 77.0% or 2,104 individuals in the labor force. Within the labor force, individuals with less than high school education have the highest percentage of unemployment, with 20.1% or 120 of them being unemployed.
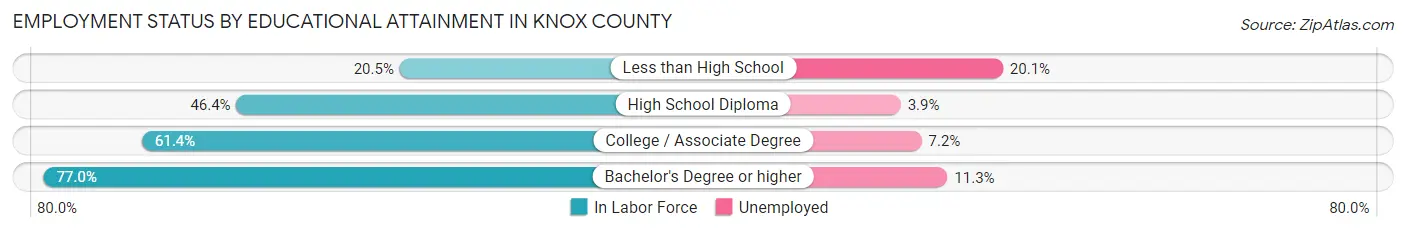
| Educational Attainment | In Labor Force | Unemployed |
| Less than High School | 597 (20.5%) | 585 (20.1%) |
| High School Diploma | 2,691 (46.4%) | 226 (3.9%) |
| College / Associate Degree | 2,314 (61.4%) | 271 (7.2%) |
| Bachelor's Degree or higher | 2,104 (77.0%) | 309 (11.3%) |
| Total | 7,711 (50.7%) | 1,247 (8.2%) |
Employment Occupations by Sex in Knox County
Management, Business, Science and Arts Occupations
The most common Management, Business, Science and Arts occupations in Knox County are Community & Social Service (1,092 | 11.8%), Health Diagnosing & Treating (676 | 7.3%), Education Instruction & Library (616 | 6.7%), Management (502 | 5.4%), and Health Technologists (469 | 5.1%).

Management, Business, Science and Arts Occupations by Sex
Within the Management, Business, Science and Arts occupations in Knox County, the most male-oriented occupations are Architecture & Engineering (100.0%), Life, Physical & Social Science (100.0%), and Business & Financial (70.7%), while the most female-oriented occupations are Arts, Media & Entertainment (88.3%), Health Technologists (80.8%), and Health Diagnosing & Treating (76.8%).
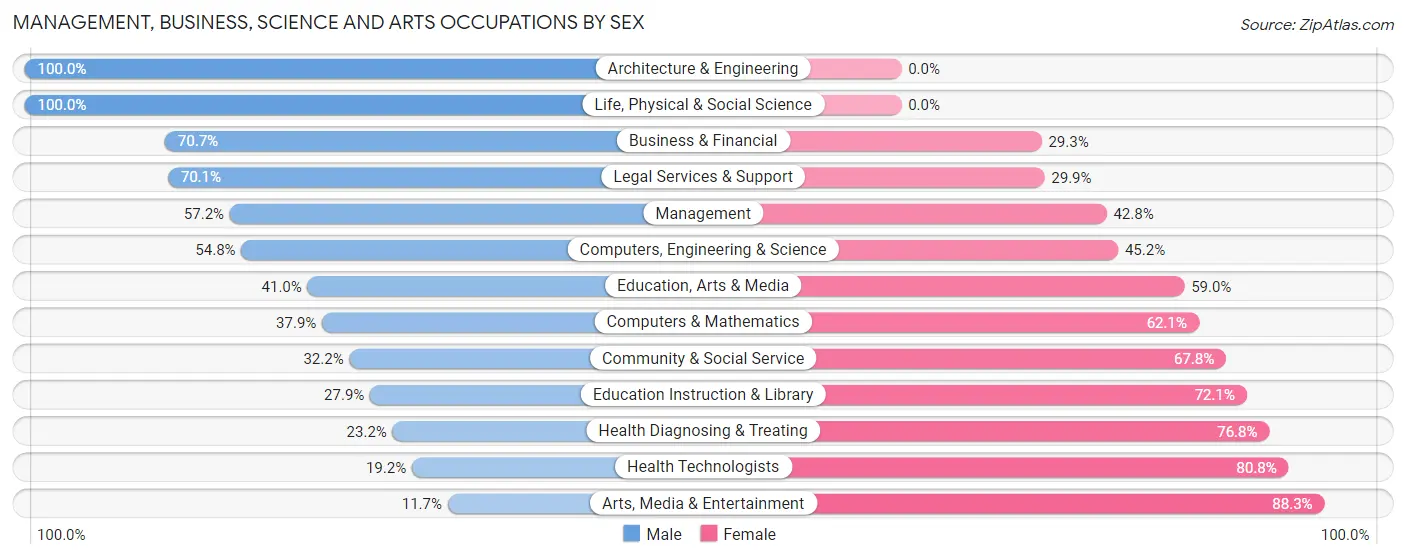
| Occupation | Male | Female |
| Management | 287 (57.2%) | 215 (42.8%) |
| Business & Financial | 203 (70.7%) | 84 (29.3%) |
| Computers, Engineering & Science | 109 (54.8%) | 90 (45.2%) |
| Computers & Mathematics | 55 (37.9%) | 90 (62.1%) |
| Architecture & Engineering | 39 (100.0%) | 0 (0.0%) |
| Life, Physical & Social Science | 15 (100.0%) | 0 (0.0%) |
| Community & Social Service | 352 (32.2%) | 740 (67.8%) |
| Education, Arts & Media | 111 (41.0%) | 160 (59.0%) |
| Legal Services & Support | 54 (70.1%) | 23 (29.9%) |
| Education Instruction & Library | 172 (27.9%) | 444 (72.1%) |
| Arts, Media & Entertainment | 15 (11.7%) | 113 (88.3%) |
| Health Diagnosing & Treating | 157 (23.2%) | 519 (76.8%) |
| Health Technologists | 90 (19.2%) | 379 (80.8%) |
| Total (Category) | 1,108 (40.2%) | 1,648 (59.8%) |
| Total (Overall) | 4,829 (52.4%) | 4,392 (47.6%) |
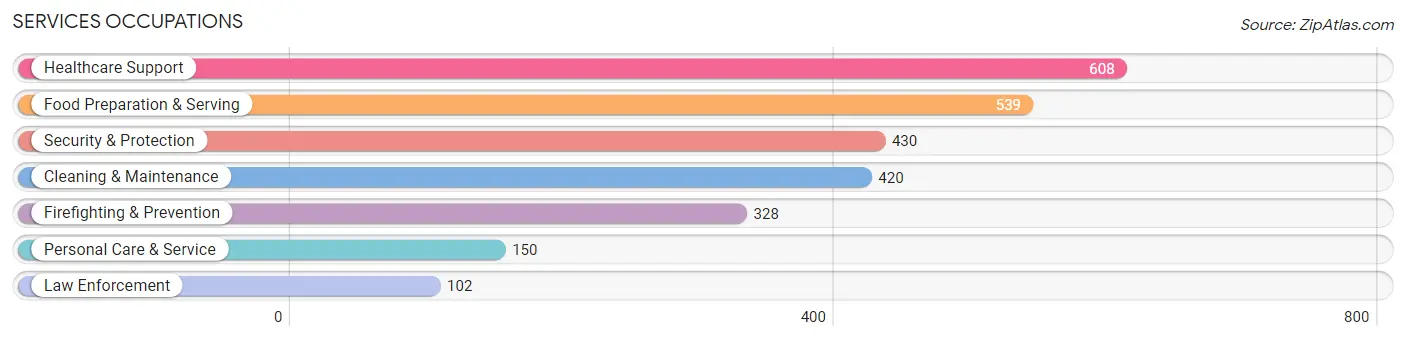
Services Occupations
The most common Services occupations in Knox County are Healthcare Support (608 | 6.6%), Food Preparation & Serving (539 | 5.9%), Security & Protection (430 | 4.7%), Cleaning & Maintenance (420 | 4.5%), and Firefighting & Prevention (328 | 3.6%).
Services Occupations by Sex
Within the Services occupations in Knox County, the most male-oriented occupations are Firefighting & Prevention (95.7%), Security & Protection (89.5%), and Law Enforcement (69.6%), while the most female-oriented occupations are Personal Care & Service (89.3%), Healthcare Support (71.7%), and Cleaning & Maintenance (60.2%).
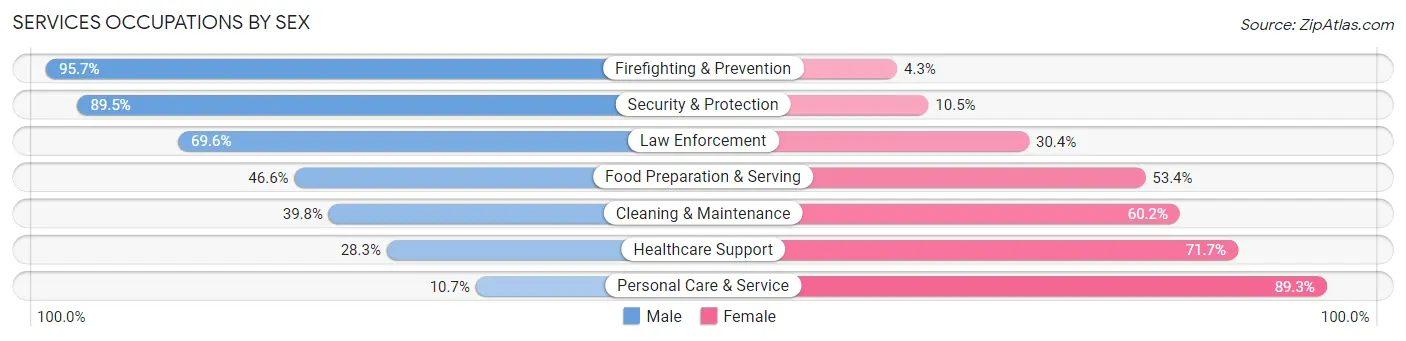
| Occupation | Male | Female |
| Healthcare Support | 172 (28.3%) | 436 (71.7%) |
| Security & Protection | 385 (89.5%) | 45 (10.5%) |
| Firefighting & Prevention | 314 (95.7%) | 14 (4.3%) |
| Law Enforcement | 71 (69.6%) | 31 (30.4%) |
| Food Preparation & Serving | 251 (46.6%) | 288 (53.4%) |
| Cleaning & Maintenance | 167 (39.8%) | 253 (60.2%) |
| Personal Care & Service | 16 (10.7%) | 134 (89.3%) |
| Total (Category) | 991 (46.2%) | 1,156 (53.8%) |
| Total (Overall) | 4,829 (52.4%) | 4,392 (47.6%) |
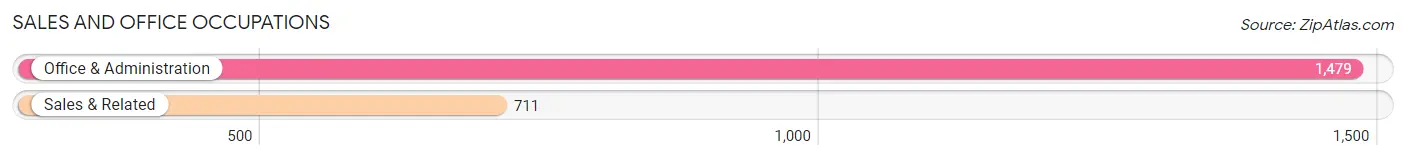
Sales and Office Occupations
The most common Sales and Office occupations in Knox County are Office & Administration (1,479 | 16.0%), and Sales & Related (711 | 7.7%).
Sales and Office Occupations by Sex
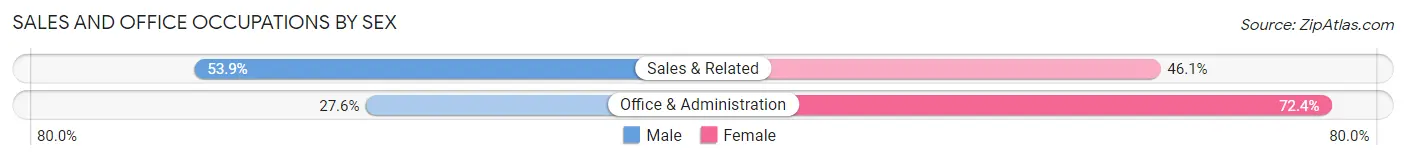
| Occupation | Male | Female |
| Sales & Related | 383 (53.9%) | 328 (46.1%) |
| Office & Administration | 408 (27.6%) | 1,071 (72.4%) |
| Total (Category) | 791 (36.1%) | 1,399 (63.9%) |
| Total (Overall) | 4,829 (52.4%) | 4,392 (47.6%) |
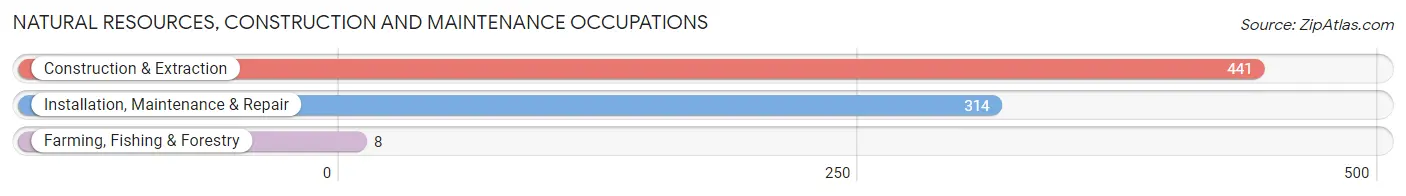
Natural Resources, Construction and Maintenance Occupations
The most common Natural Resources, Construction and Maintenance occupations in Knox County are Construction & Extraction (441 | 4.8%), Installation, Maintenance & Repair (314 | 3.4%), and Farming, Fishing & Forestry (8 | 0.1%).
Natural Resources, Construction and Maintenance Occupations by Sex
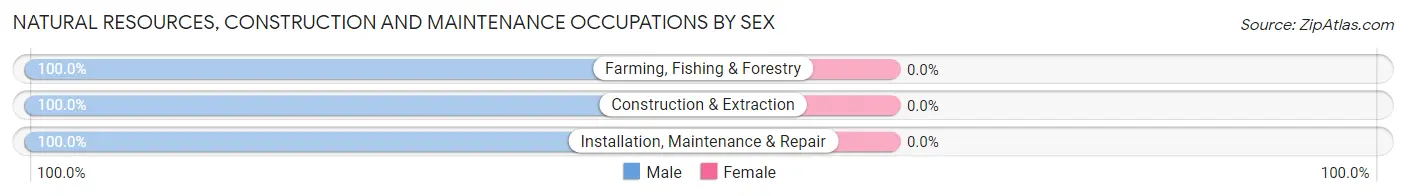
| Occupation | Male | Female |
| Farming, Fishing & Forestry | 8 (100.0%) | 0 (0.0%) |
| Construction & Extraction | 441 (100.0%) | 0 (0.0%) |
| Installation, Maintenance & Repair | 314 (100.0%) | 0 (0.0%) |
| Total (Category) | 763 (100.0%) | 0 (0.0%) |
| Total (Overall) | 4,829 (52.4%) | 4,392 (47.6%) |
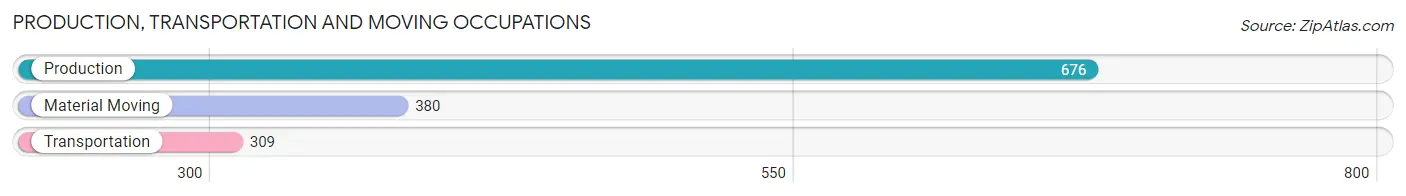
Production, Transportation and Moving Occupations
The most common Production, Transportation and Moving occupations in Knox County are Production (676 | 7.3%), Material Moving (380 | 4.1%), and Transportation (309 | 3.4%).
Production, Transportation and Moving Occupations by Sex
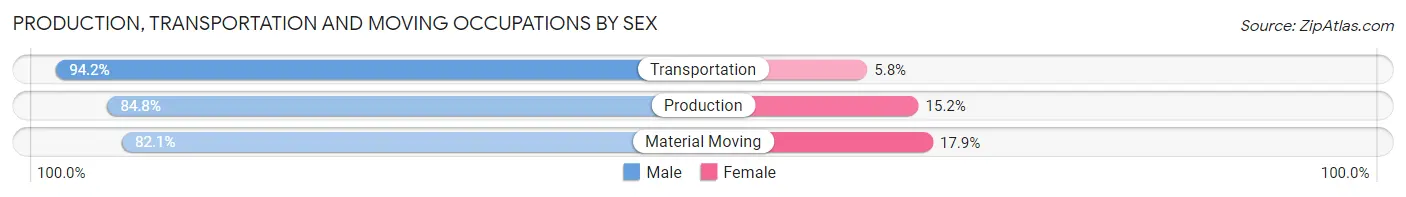
| Occupation | Male | Female |
| Production | 573 (84.8%) | 103 (15.2%) |
| Transportation | 291 (94.2%) | 18 (5.8%) |
| Material Moving | 312 (82.1%) | 68 (17.9%) |
| Total (Category) | 1,176 (86.2%) | 189 (13.9%) |
| Total (Overall) | 4,829 (52.4%) | 4,392 (47.6%) |
Employment Industries by Sex in Knox County
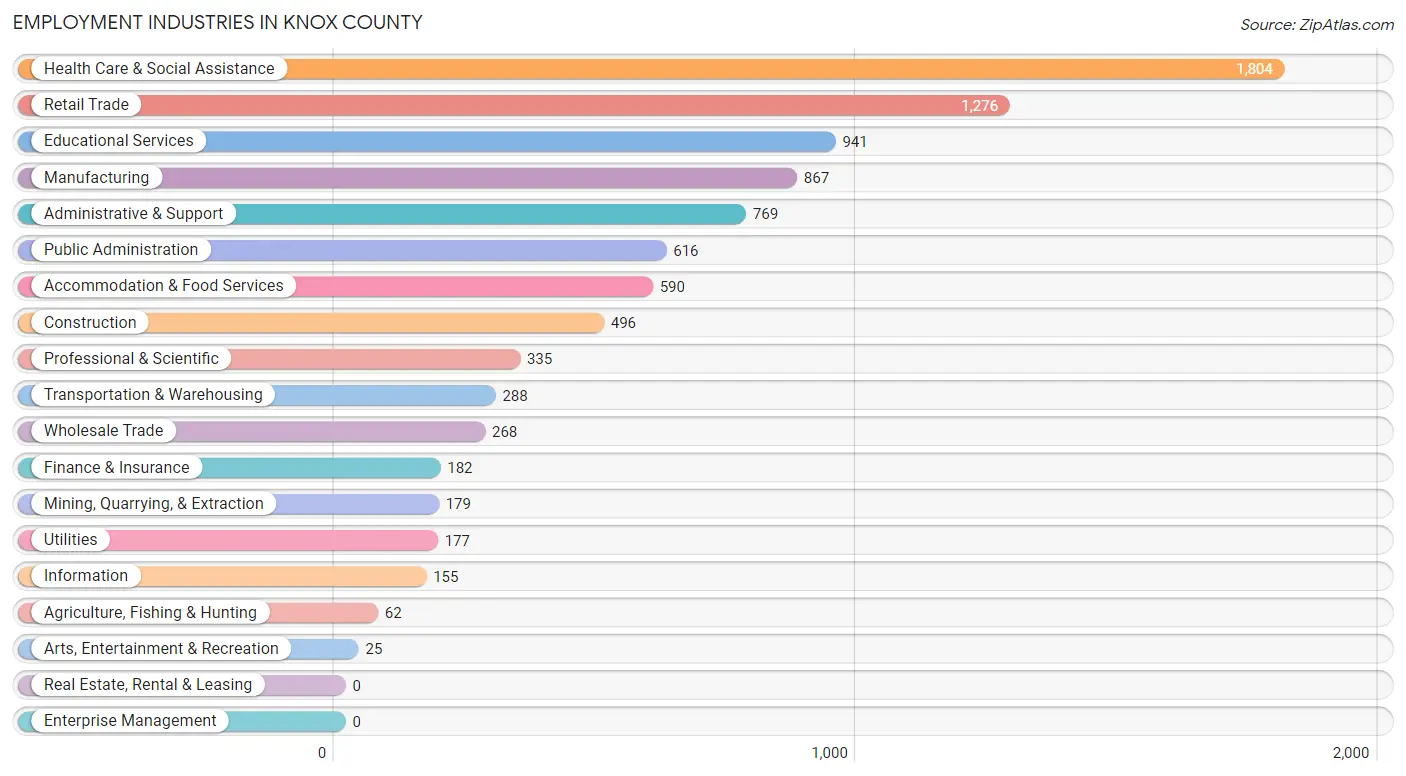
Employment Industries in Knox County
The major employment industries in Knox County include Health Care & Social Assistance (1,804 | 19.6%), Retail Trade (1,276 | 13.8%), Educational Services (941 | 10.2%), Manufacturing (867 | 9.4%), and Administrative & Support (769 | 8.3%).
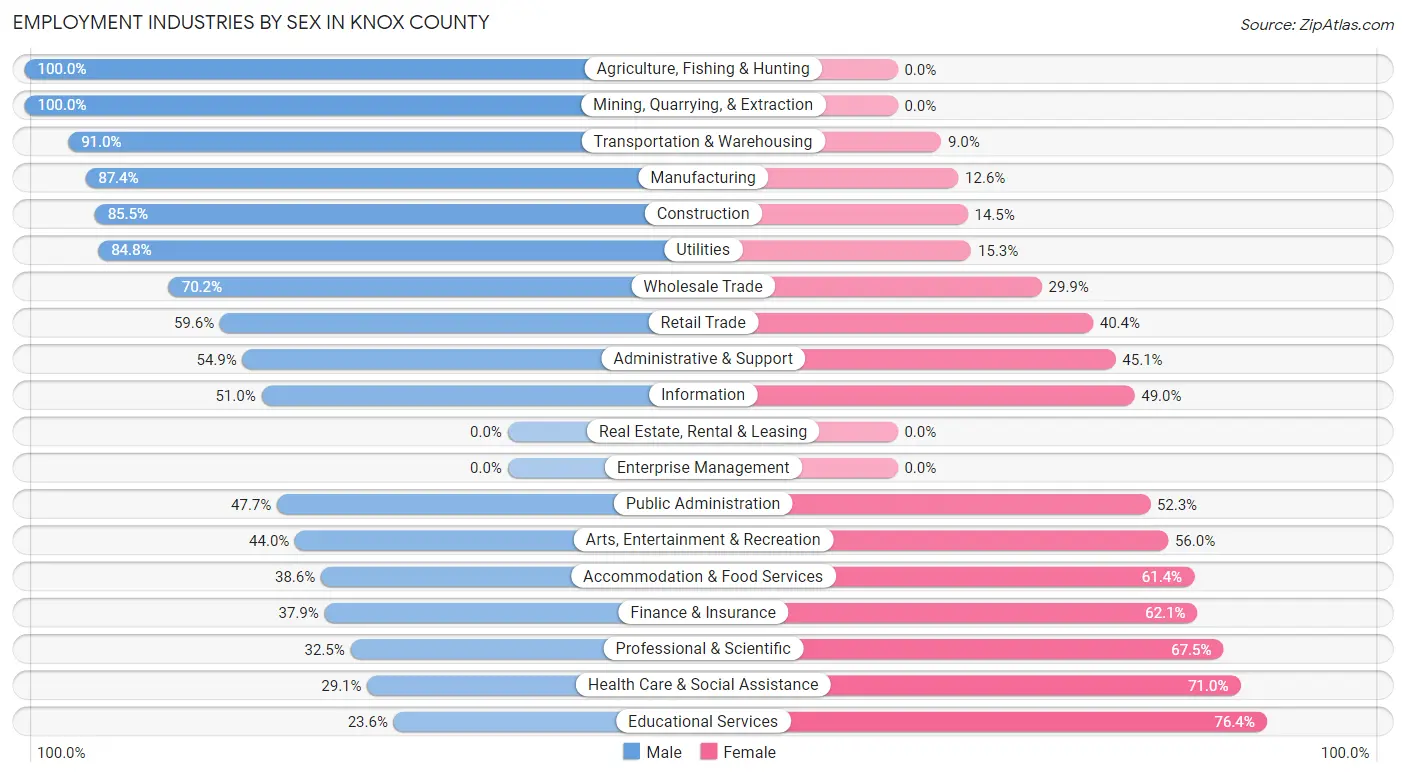
Employment Industries by Sex in Knox County
The Knox County industries that see more men than women are Agriculture, Fishing & Hunting (100.0%), Mining, Quarrying, & Extraction (100.0%), and Transportation & Warehousing (91.0%), whereas the industries that tend to have a higher number of women are Educational Services (76.4%), Health Care & Social Assistance (71.0%), and Professional & Scientific (67.5%).
| Industry | Male | Female |
| Agriculture, Fishing & Hunting | 62 (100.0%) | 0 (0.0%) |
| Mining, Quarrying, & Extraction | 179 (100.0%) | 0 (0.0%) |
| Construction | 424 (85.5%) | 72 (14.5%) |
| Manufacturing | 758 (87.4%) | 109 (12.6%) |
| Wholesale Trade | 188 (70.2%) | 80 (29.8%) |
| Retail Trade | 760 (59.6%) | 516 (40.4%) |
| Transportation & Warehousing | 262 (91.0%) | 26 (9.0%) |
| Utilities | 150 (84.8%) | 27 (15.2%) |
| Information | 79 (51.0%) | 76 (49.0%) |
| Finance & Insurance | 69 (37.9%) | 113 (62.1%) |
| Real Estate, Rental & Leasing | 0 (0.0%) | 0 (0.0%) |
| Professional & Scientific | 109 (32.5%) | 226 (67.5%) |
| Enterprise Management | 0 (0.0%) | 0 (0.0%) |
| Administrative & Support | 422 (54.9%) | 347 (45.1%) |
| Educational Services | 222 (23.6%) | 719 (76.4%) |
| Health Care & Social Assistance | 524 (29.0%) | 1,280 (71.0%) |
| Arts, Entertainment & Recreation | 11 (44.0%) | 14 (56.0%) |
| Accommodation & Food Services | 228 (38.6%) | 362 (61.4%) |
| Public Administration | 294 (47.7%) | 322 (52.3%) |
| Total | 4,829 (52.4%) | 4,392 (47.6%) |
Education in Knox County
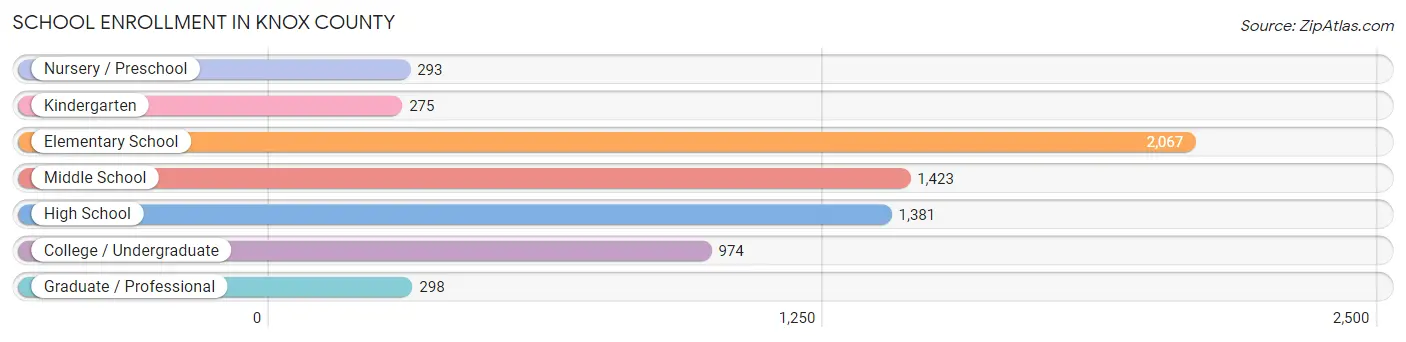
School Enrollment in Knox County
The most common levels of schooling among the 6,711 students in Knox County are elementary school (2,067 | 30.8%), middle school (1,423 | 21.2%), and high school (1,381 | 20.6%).
| School Level | # Students | % Students |
| Nursery / Preschool | 293 | 4.4% |
| Kindergarten | 275 | 4.1% |
| Elementary School | 2,067 | 30.8% |
| Middle School | 1,423 | 21.2% |
| High School | 1,381 | 20.6% |
| College / Undergraduate | 974 | 14.5% |
| Graduate / Professional | 298 | 4.4% |
| Total | 6,711 | 100.0% |
School Enrollment by Age by Funding Source in Knox County
Out of a total of 6,711 students who are enrolled in schools in Knox County, 718 (10.7%) attend a private institution, while the remaining 5,993 (89.3%) are enrolled in public schools. The age group of 18 to 19 year olds has the highest likelihood of being enrolled in private schools, with 203 (44.3% in the age bracket) enrolled. Conversely, the age group of 3 to 4 year olds has the lowest likelihood of being enrolled in a private school, with 214 (100.0% in the age bracket) attending a public institution.
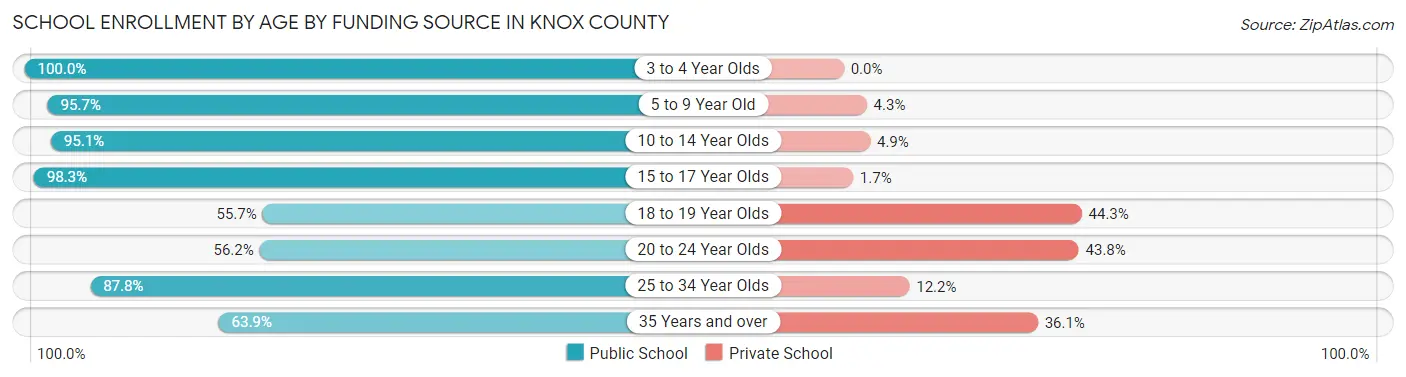
| Age Bracket | Public School | Private School |
| 3 to 4 Year Olds | 214 (100.0%) | 0 (0.0%) |
| 5 to 9 Year Old | 1,832 (95.7%) | 82 (4.3%) |
| 10 to 14 Year Olds | 1,782 (95.1%) | 92 (4.9%) |
| 15 to 17 Year Olds | 1,142 (98.3%) | 20 (1.7%) |
| 18 to 19 Year Olds | 255 (55.7%) | 203 (44.3%) |
| 20 to 24 Year Olds | 266 (56.2%) | 207 (43.8%) |
| 25 to 34 Year Olds | 395 (87.8%) | 55 (12.2%) |
| 35 Years and over | 106 (63.9%) | 60 (36.1%) |
| Total | 5,993 (89.3%) | 718 (10.7%) |
Educational Attainment by Field of Study in Knox County
Education (927 | 25.7%), business (859 | 23.8%), science & technology (511 | 14.1%), arts & humanities (329 | 9.1%), and bio, nature & agricultural (263 | 7.3%) are the most common fields of study among 3,613 individuals in Knox County who have obtained a bachelor's degree or higher.
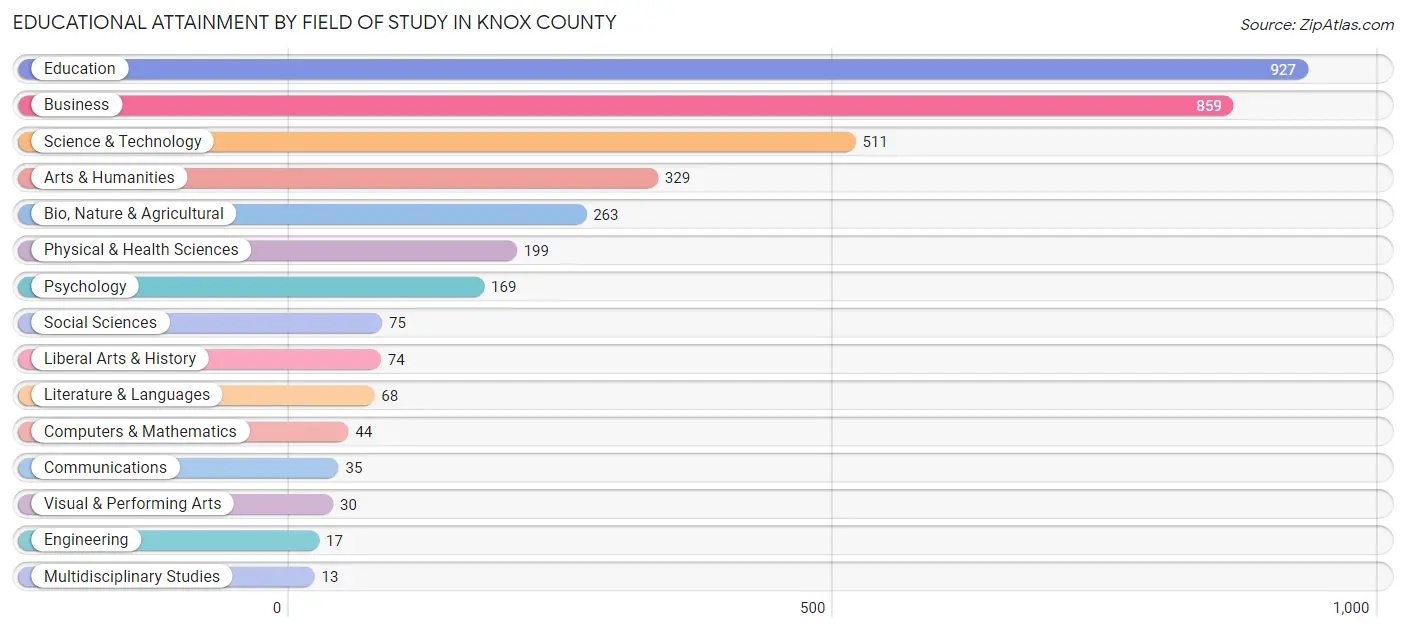
| Field of Study | # Graduates | % Graduates |
| Computers & Mathematics | 44 | 1.2% |
| Bio, Nature & Agricultural | 263 | 7.3% |
| Physical & Health Sciences | 199 | 5.5% |
| Psychology | 169 | 4.7% |
| Social Sciences | 75 | 2.1% |
| Engineering | 17 | 0.5% |
| Multidisciplinary Studies | 13 | 0.4% |
| Science & Technology | 511 | 14.1% |
| Business | 859 | 23.8% |
| Education | 927 | 25.7% |
| Literature & Languages | 68 | 1.9% |
| Liberal Arts & History | 74 | 2.1% |
| Visual & Performing Arts | 30 | 0.8% |
| Communications | 35 | 1.0% |
| Arts & Humanities | 329 | 9.1% |
| Total | 3,613 | 100.0% |
Transportation & Commute in Knox County
Vehicle Availability by Sex in Knox County
The most prevalent vehicle ownership categories in Knox County are males with 2 vehicles (1,508, accounting for 32.1%) and females with 2 vehicles (1,239, making up 35.7%).
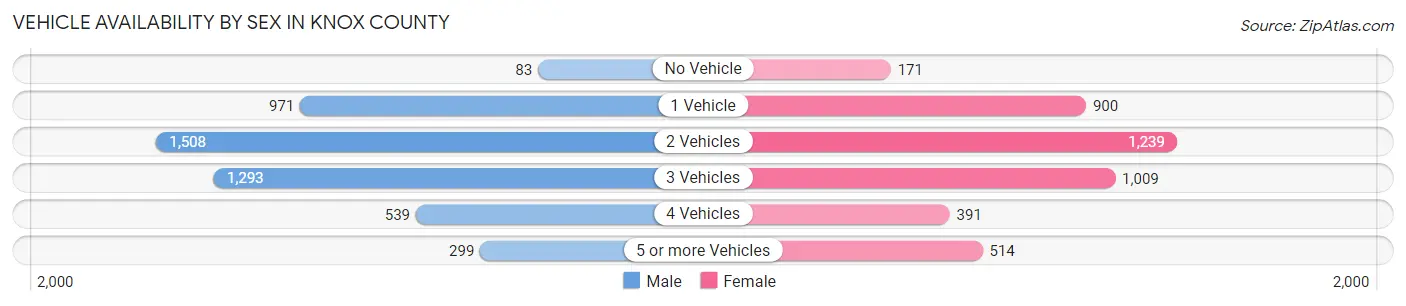
| Vehicles Available | Male | Female |
| No Vehicle | 83 (1.8%) | 171 (4.1%) |
| 1 Vehicle | 971 (20.7%) | 900 (21.3%) |
| 2 Vehicles | 1,508 (32.1%) | 1,239 (29.3%) |
| 3 Vehicles | 1,293 (27.6%) | 1,009 (23.9%) |
| 4 Vehicles | 539 (11.5%) | 391 (9.3%) |
| 5 or more Vehicles | 299 (6.4%) | 514 (12.2%) |
| Total | 4,693 (100.0%) | 4,224 (100.0%) |
Commute Time in Knox County
The most frequently occuring commute durations in Knox County are 5 to 9 minutes (1,469 commuters, 17.7%), 10 to 14 minutes (1,437 commuters, 17.3%), and 30 to 34 minutes (1,285 commuters, 15.5%).
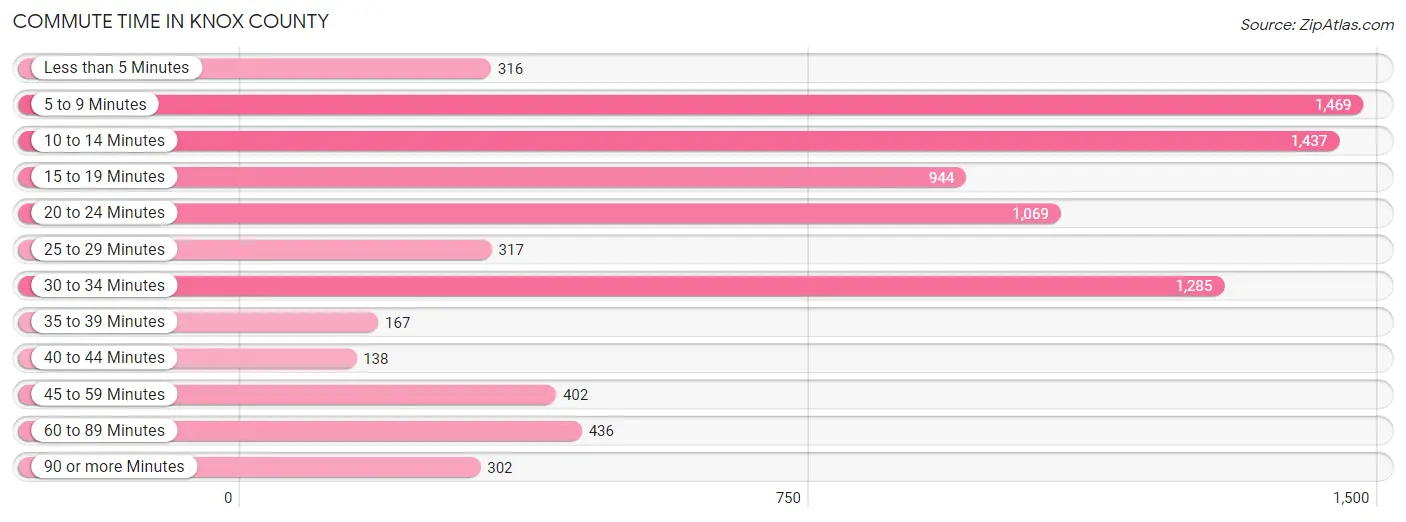
| Commute Time | # Commuters | % Commuters |
| Less than 5 Minutes | 316 | 3.8% |
| 5 to 9 Minutes | 1,469 | 17.7% |
| 10 to 14 Minutes | 1,437 | 17.3% |
| 15 to 19 Minutes | 944 | 11.4% |
| 20 to 24 Minutes | 1,069 | 12.9% |
| 25 to 29 Minutes | 317 | 3.8% |
| 30 to 34 Minutes | 1,285 | 15.5% |
| 35 to 39 Minutes | 167 | 2.0% |
| 40 to 44 Minutes | 138 | 1.7% |
| 45 to 59 Minutes | 402 | 4.9% |
| 60 to 89 Minutes | 436 | 5.3% |
| 90 or more Minutes | 302 | 3.6% |
Commute Time by Sex in Knox County
The most common commute times in Knox County are 30 to 34 minutes (813 commuters, 18.2%) for males and 5 to 9 minutes (844 commuters, 22.2%) for females.
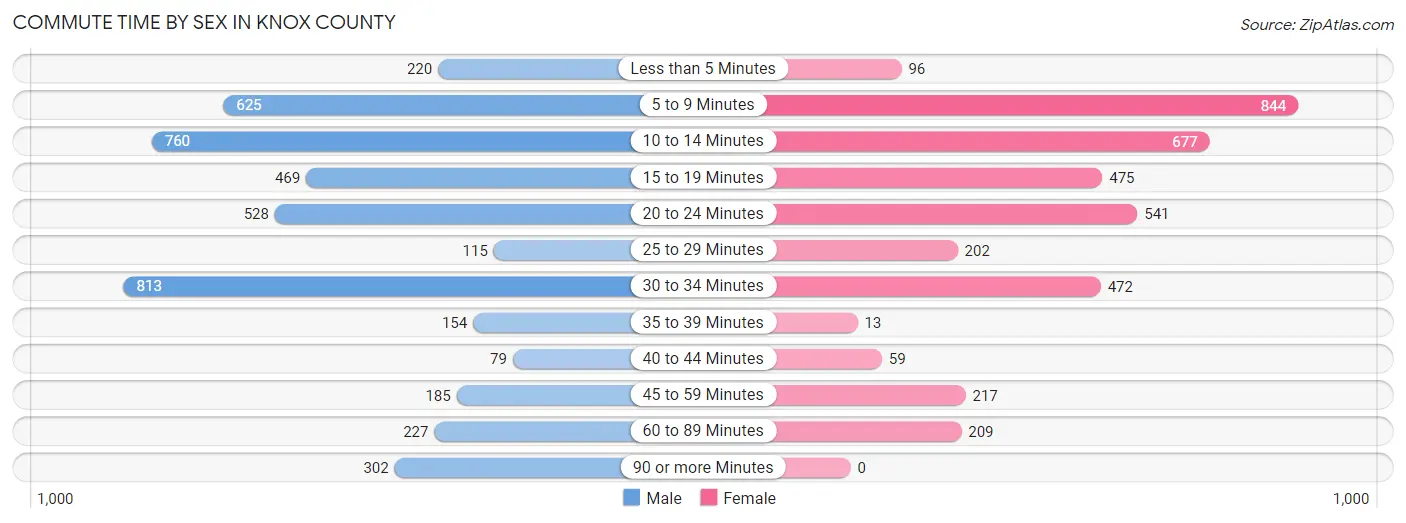
| Commute Time | Male | Female |
| Less than 5 Minutes | 220 (4.9%) | 96 (2.5%) |
| 5 to 9 Minutes | 625 (14.0%) | 844 (22.2%) |
| 10 to 14 Minutes | 760 (17.0%) | 677 (17.8%) |
| 15 to 19 Minutes | 469 (10.5%) | 475 (12.5%) |
| 20 to 24 Minutes | 528 (11.8%) | 541 (14.2%) |
| 25 to 29 Minutes | 115 (2.6%) | 202 (5.3%) |
| 30 to 34 Minutes | 813 (18.2%) | 472 (12.4%) |
| 35 to 39 Minutes | 154 (3.4%) | 13 (0.3%) |
| 40 to 44 Minutes | 79 (1.8%) | 59 (1.5%) |
| 45 to 59 Minutes | 185 (4.1%) | 217 (5.7%) |
| 60 to 89 Minutes | 227 (5.1%) | 209 (5.5%) |
| 90 or more Minutes | 302 (6.8%) | 0 (0.0%) |
Time of Departure to Work by Sex in Knox County
The most frequent times of departure to work in Knox County are 7:00 AM to 7:29 AM (852, 19.0%) for males and 7:00 AM to 7:29 AM (1,073, 28.2%) for females.
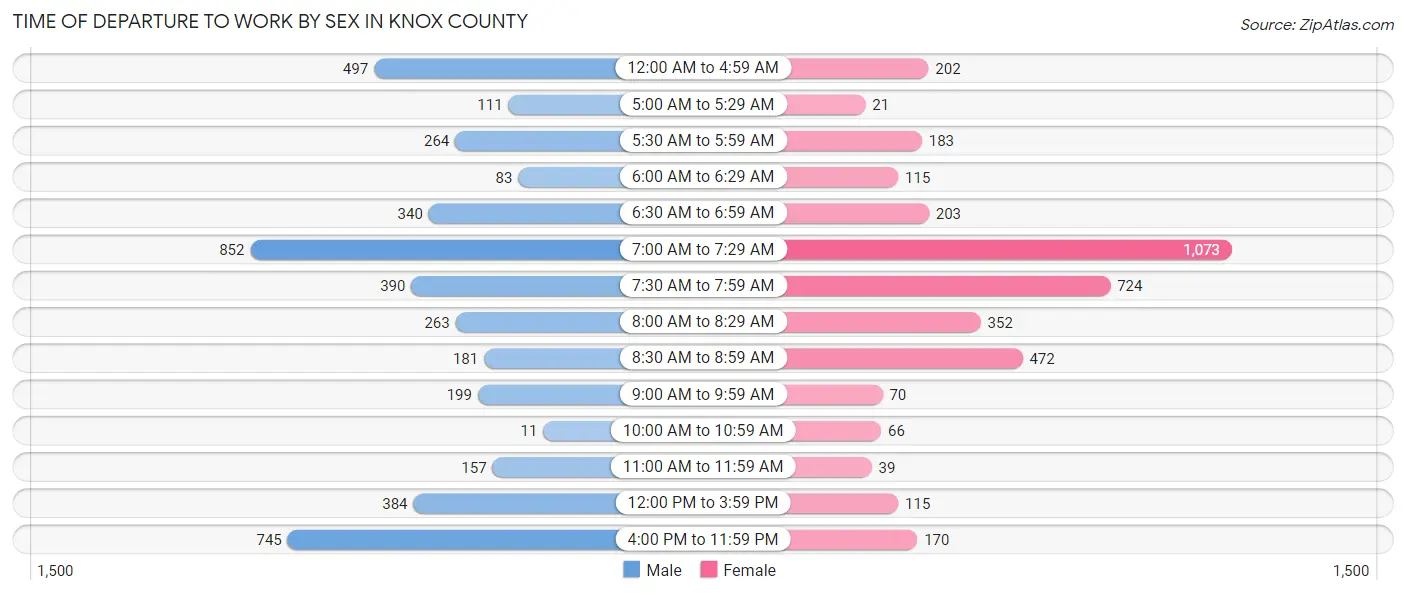
| Time of Departure | Male | Female |
| 12:00 AM to 4:59 AM | 497 (11.1%) | 202 (5.3%) |
| 5:00 AM to 5:29 AM | 111 (2.5%) | 21 (0.5%) |
| 5:30 AM to 5:59 AM | 264 (5.9%) | 183 (4.8%) |
| 6:00 AM to 6:29 AM | 83 (1.8%) | 115 (3.0%) |
| 6:30 AM to 6:59 AM | 340 (7.6%) | 203 (5.3%) |
| 7:00 AM to 7:29 AM | 852 (19.0%) | 1,073 (28.2%) |
| 7:30 AM to 7:59 AM | 390 (8.7%) | 724 (19.0%) |
| 8:00 AM to 8:29 AM | 263 (5.9%) | 352 (9.2%) |
| 8:30 AM to 8:59 AM | 181 (4.0%) | 472 (12.4%) |
| 9:00 AM to 9:59 AM | 199 (4.4%) | 70 (1.8%) |
| 10:00 AM to 10:59 AM | 11 (0.3%) | 66 (1.7%) |
| 11:00 AM to 11:59 AM | 157 (3.5%) | 39 (1.0%) |
| 12:00 PM to 3:59 PM | 384 (8.6%) | 115 (3.0%) |
| 4:00 PM to 11:59 PM | 745 (16.6%) | 170 (4.5%) |
| Total | 4,477 (100.0%) | 3,805 (100.0%) |
Housing Occupancy in Knox County
Occupancy by Ownership in Knox County
Of the total 11,229 dwellings in Knox County, owner-occupied units account for 7,181 (63.9%), while renter-occupied units make up 4,048 (36.0%).
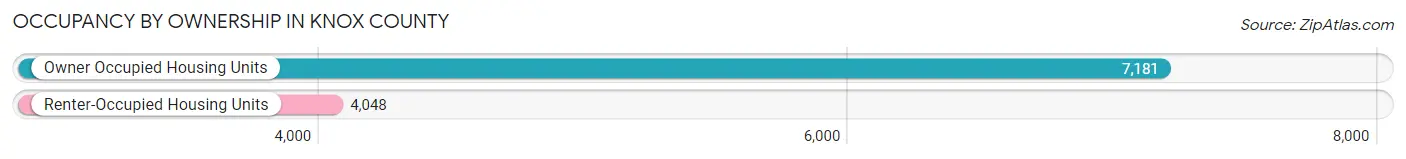
| Occupancy | # Housing Units | % Housing Units |
| Owner Occupied Housing Units | 7,181 | 63.9% |
| Renter-Occupied Housing Units | 4,048 | 36.0% |
| Total Occupied Housing Units | 11,229 | 100.0% |
Occupancy by Household Size in Knox County
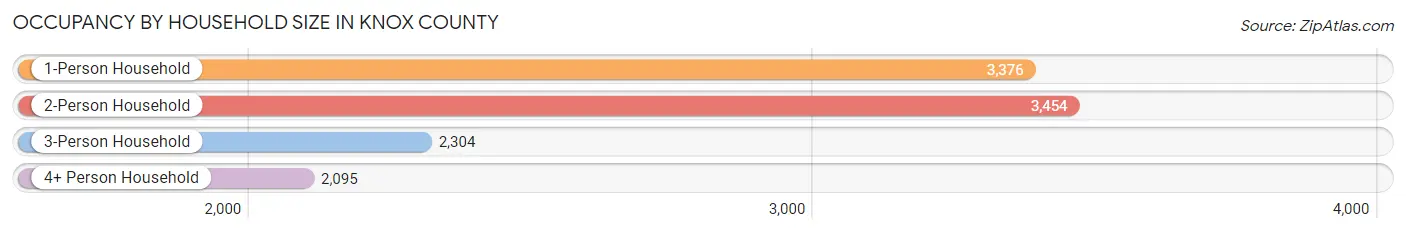
| Household Size | # Housing Units | % Housing Units |
| 1-Person Household | 3,376 | 30.1% |
| 2-Person Household | 3,454 | 30.8% |
| 3-Person Household | 2,304 | 20.5% |
| 4+ Person Household | 2,095 | 18.7% |
| Total Housing Units | 11,229 | 100.0% |
Occupancy by Ownership by Household Size in Knox County
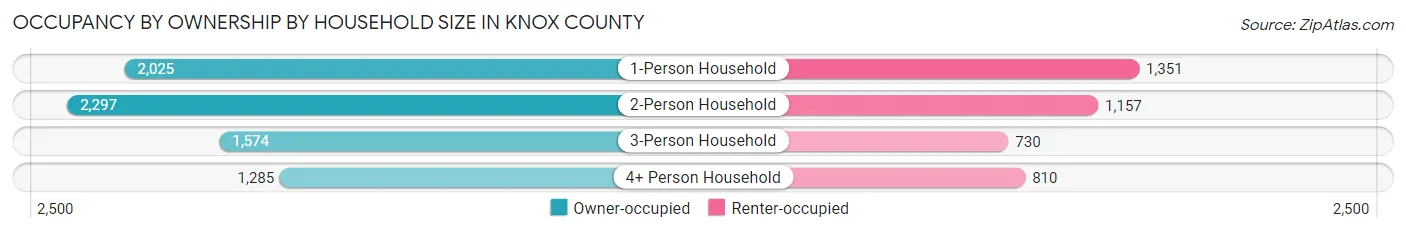
| Household Size | Owner-occupied | Renter-occupied |
| 1-Person Household | 2,025 (60.0%) | 1,351 (40.0%) |
| 2-Person Household | 2,297 (66.5%) | 1,157 (33.5%) |
| 3-Person Household | 1,574 (68.3%) | 730 (31.7%) |
| 4+ Person Household | 1,285 (61.3%) | 810 (38.7%) |
| Total Housing Units | 7,181 (63.9%) | 4,048 (36.0%) |
Occupancy by Educational Attainment in Knox County
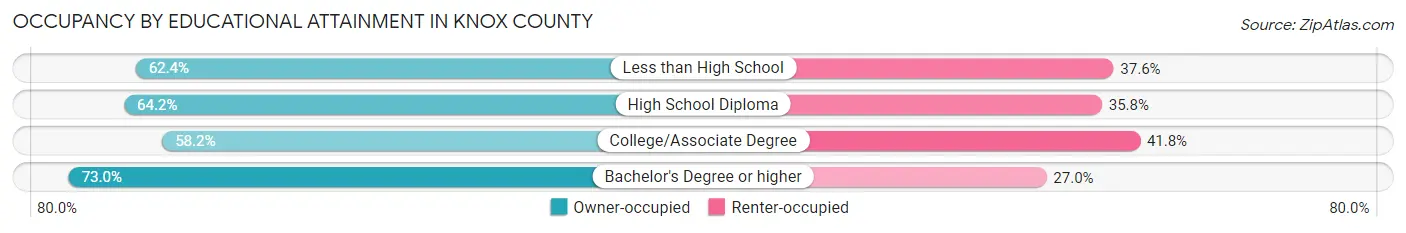
| Household Size | Owner-occupied | Renter-occupied |
| Less than High School | 1,392 (62.4%) | 840 (37.6%) |
| High School Diploma | 2,558 (64.2%) | 1,426 (35.8%) |
| College/Associate Degree | 1,679 (58.2%) | 1,208 (41.8%) |
| Bachelor's Degree or higher | 1,552 (73.0%) | 574 (27.0%) |
Occupancy by Age of Householder in Knox County
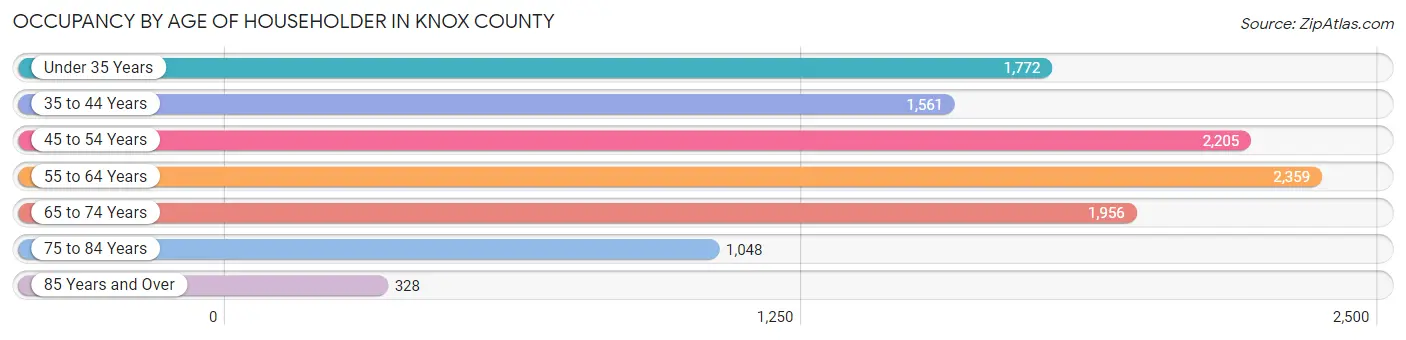
| Age Bracket | # Households | % Households |
| Under 35 Years | 1,772 | 15.8% |
| 35 to 44 Years | 1,561 | 13.9% |
| 45 to 54 Years | 2,205 | 19.6% |
| 55 to 64 Years | 2,359 | 21.0% |
| 65 to 74 Years | 1,956 | 17.4% |
| 75 to 84 Years | 1,048 | 9.3% |
| 85 Years and Over | 328 | 2.9% |
| Total | 11,229 | 100.0% |
Housing Finances in Knox County
Median Income by Occupancy in Knox County
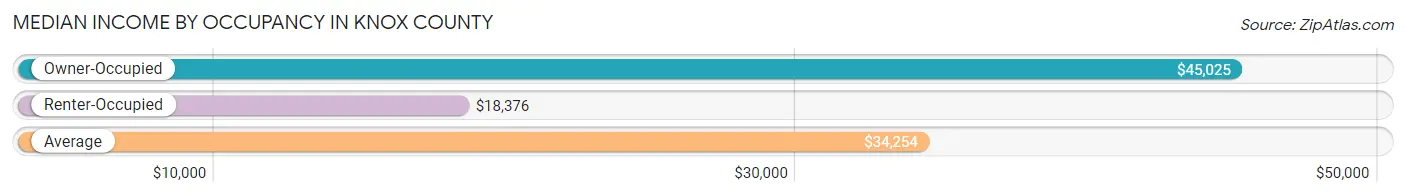
| Occupancy Type | # Households | Median Income |
| Owner-Occupied | 7,181 (63.9%) | $45,025 |
| Renter-Occupied | 4,048 (36.0%) | $18,376 |
| Average | 11,229 (100.0%) | $34,254 |
Occupancy by Householder Income Bracket in Knox County
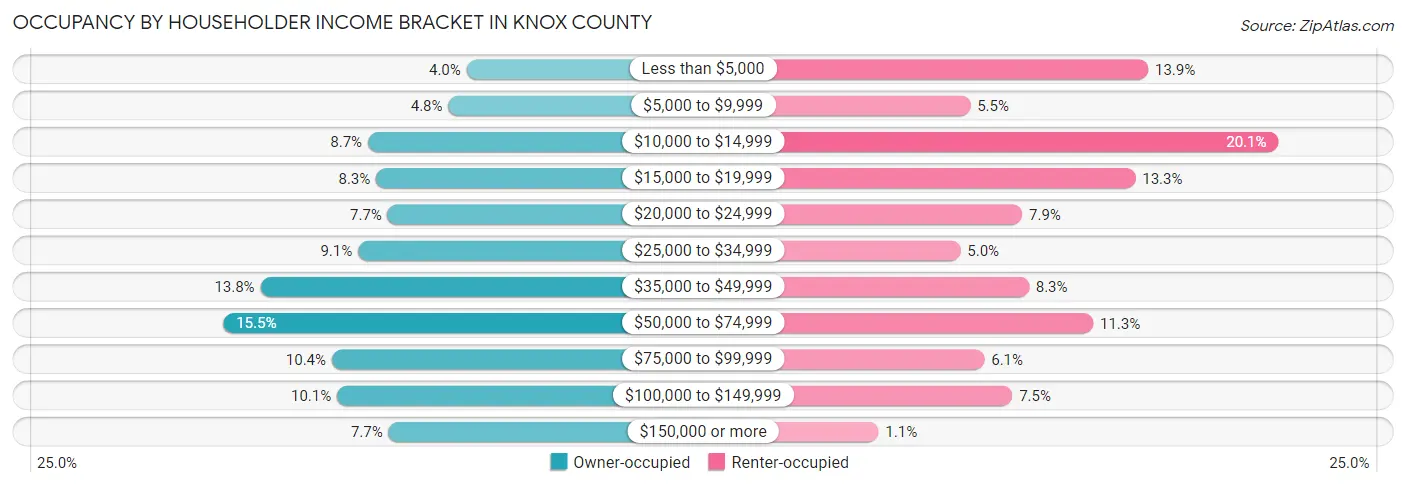
| Income Bracket | Owner-occupied | Renter-occupied |
| Less than $5,000 | 284 (4.0%) | 564 (13.9%) |
| $5,000 to $9,999 | 346 (4.8%) | 221 (5.5%) |
| $10,000 to $14,999 | 621 (8.6%) | 815 (20.1%) |
| $15,000 to $19,999 | 593 (8.3%) | 539 (13.3%) |
| $20,000 to $24,999 | 554 (7.7%) | 321 (7.9%) |
| $25,000 to $34,999 | 655 (9.1%) | 202 (5.0%) |
| $35,000 to $49,999 | 989 (13.8%) | 334 (8.3%) |
| $50,000 to $74,999 | 1,116 (15.5%) | 458 (11.3%) |
| $75,000 to $99,999 | 745 (10.4%) | 248 (6.1%) |
| $100,000 to $149,999 | 727 (10.1%) | 302 (7.5%) |
| $150,000 or more | 551 (7.7%) | 44 (1.1%) |
| Total | 7,181 (100.0%) | 4,048 (100.0%) |
Monthly Housing Cost Tiers in Knox County
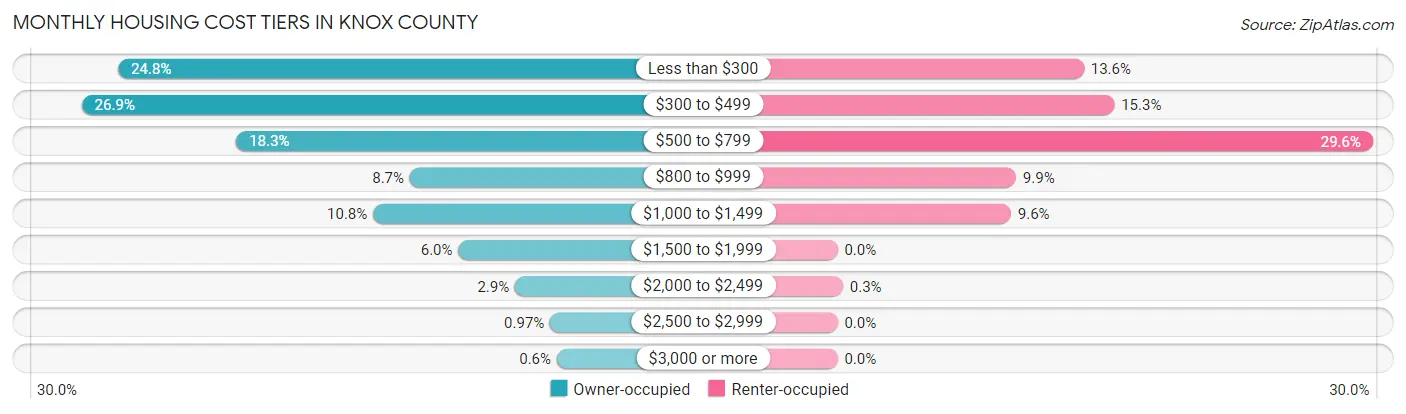
| Monthly Cost | Owner-occupied | Renter-occupied |
| Less than $300 | 1,784 (24.8%) | 551 (13.6%) |
| $300 to $499 | 1,928 (26.9%) | 619 (15.3%) |
| $500 to $799 | 1,315 (18.3%) | 1,197 (29.6%) |
| $800 to $999 | 626 (8.7%) | 399 (9.9%) |
| $1,000 to $1,499 | 772 (10.7%) | 388 (9.6%) |
| $1,500 to $1,999 | 434 (6.0%) | 0 (0.0%) |
| $2,000 to $2,499 | 209 (2.9%) | 12 (0.3%) |
| $2,500 to $2,999 | 70 (1.0%) | 0 (0.0%) |
| $3,000 or more | 43 (0.6%) | 0 (0.0%) |
| Total | 7,181 (100.0%) | 4,048 (100.0%) |
Physical Housing Characteristics in Knox County
Housing Structures in Knox County
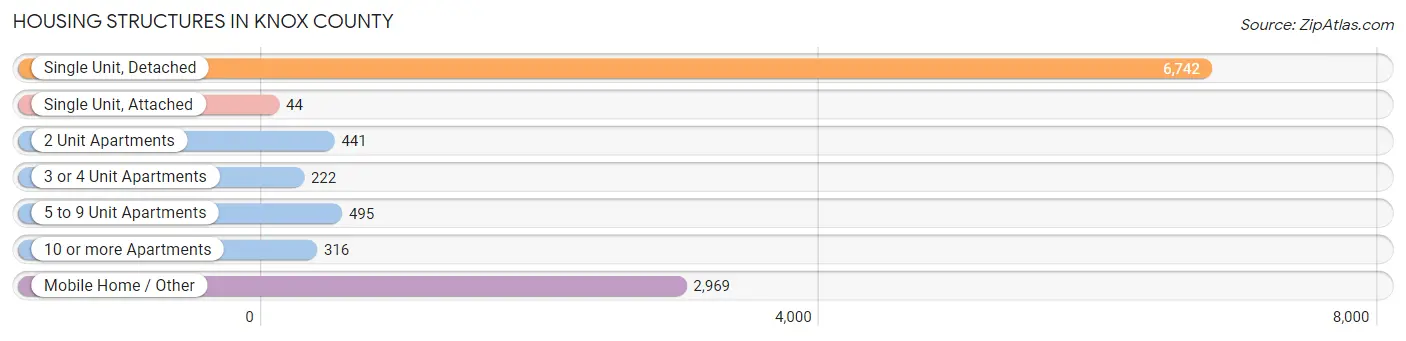
| Structure Type | # Housing Units | % Housing Units |
| Single Unit, Detached | 6,742 | 60.0% |
| Single Unit, Attached | 44 | 0.4% |
| 2 Unit Apartments | 441 | 3.9% |
| 3 or 4 Unit Apartments | 222 | 2.0% |
| 5 to 9 Unit Apartments | 495 | 4.4% |
| 10 or more Apartments | 316 | 2.8% |
| Mobile Home / Other | 2,969 | 26.4% |
| Total | 11,229 | 100.0% |
Housing Structures by Occupancy in Knox County
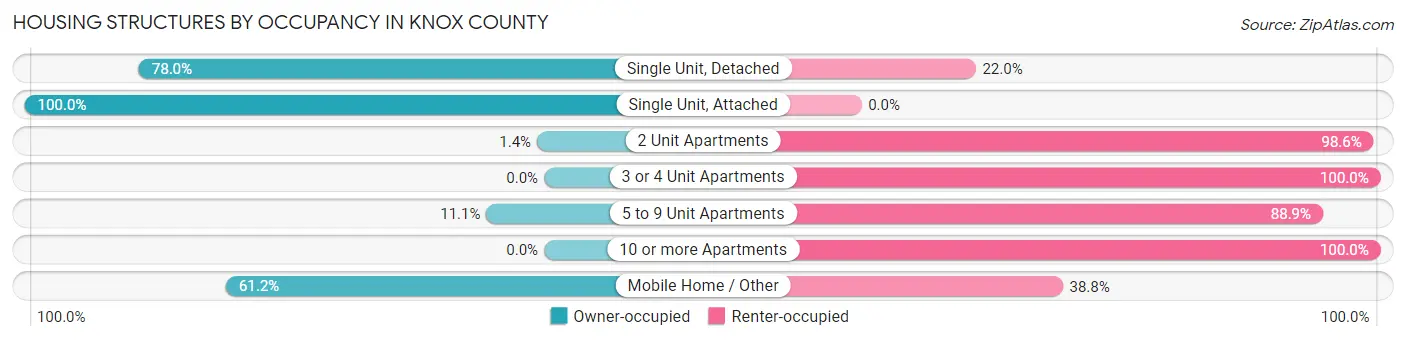
| Structure Type | Owner-occupied | Renter-occupied |
| Single Unit, Detached | 5,258 (78.0%) | 1,484 (22.0%) |
| Single Unit, Attached | 44 (100.0%) | 0 (0.0%) |
| 2 Unit Apartments | 6 (1.4%) | 435 (98.6%) |
| 3 or 4 Unit Apartments | 0 (0.0%) | 222 (100.0%) |
| 5 to 9 Unit Apartments | 55 (11.1%) | 440 (88.9%) |
| 10 or more Apartments | 0 (0.0%) | 316 (100.0%) |
| Mobile Home / Other | 1,818 (61.2%) | 1,151 (38.8%) |
| Total | 7,181 (63.9%) | 4,048 (36.0%) |
Housing Structures by Number of Rooms in Knox County
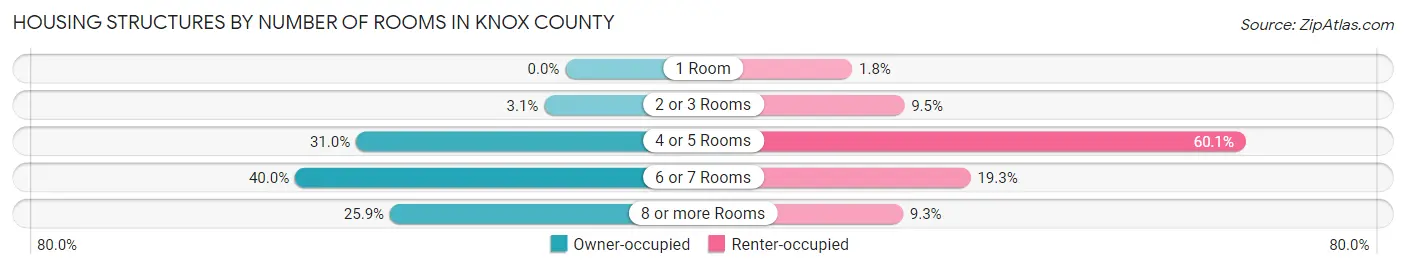
| Number of Rooms | Owner-occupied | Renter-occupied |
| 1 Room | 0 (0.0%) | 73 (1.8%) |
| 2 or 3 Rooms | 223 (3.1%) | 385 (9.5%) |
| 4 or 5 Rooms | 2,223 (31.0%) | 2,431 (60.1%) |
| 6 or 7 Rooms | 2,872 (40.0%) | 782 (19.3%) |
| 8 or more Rooms | 1,863 (25.9%) | 377 (9.3%) |
| Total | 7,181 (100.0%) | 4,048 (100.0%) |
Housing Structure by Heating Type in Knox County
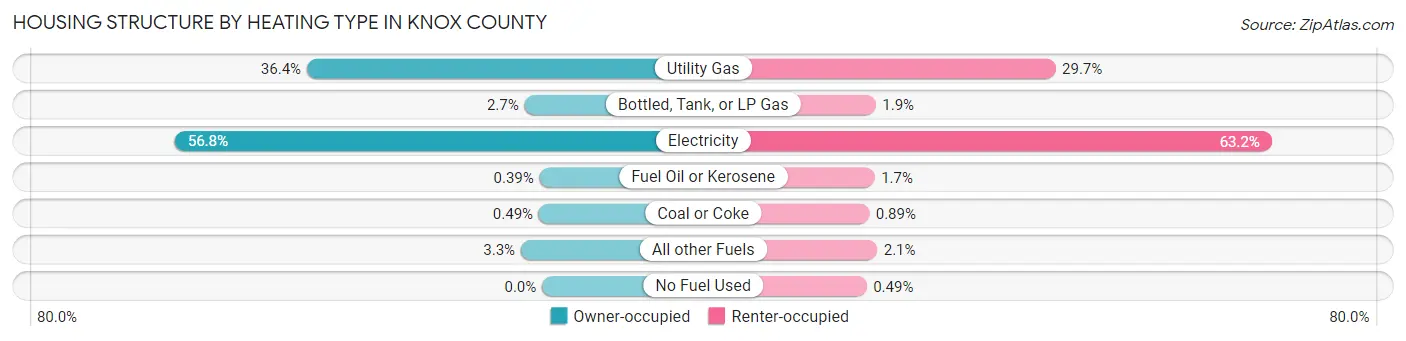
| Heating Type | Owner-occupied | Renter-occupied |
| Utility Gas | 2,611 (36.4%) | 1,202 (29.7%) |
| Bottled, Tank, or LP Gas | 195 (2.7%) | 77 (1.9%) |
| Electricity | 4,077 (56.8%) | 2,557 (63.2%) |
| Fuel Oil or Kerosene | 28 (0.4%) | 70 (1.7%) |
| Coal or Coke | 35 (0.5%) | 36 (0.9%) |
| All other Fuels | 235 (3.3%) | 86 (2.1%) |
| No Fuel Used | 0 (0.0%) | 20 (0.5%) |
| Total | 7,181 (100.0%) | 4,048 (100.0%) |
Household Vehicle Usage in Knox County
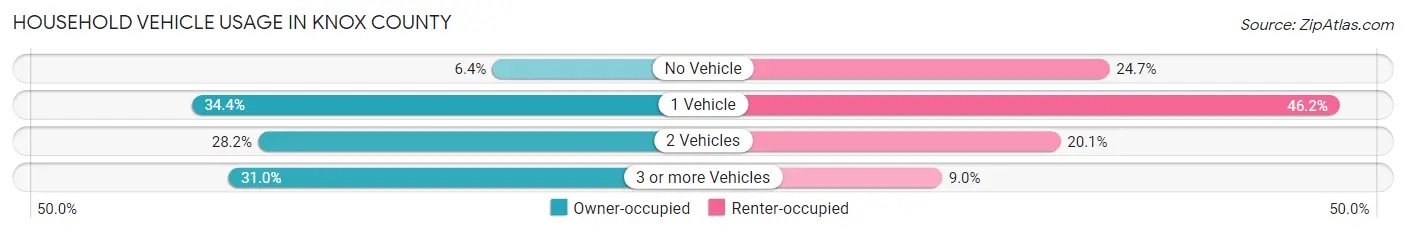
| Vehicles per Household | Owner-occupied | Renter-occupied |
| No Vehicle | 456 (6.4%) | 999 (24.7%) |
| 1 Vehicle | 2,472 (34.4%) | 1,869 (46.2%) |
| 2 Vehicles | 2,027 (28.2%) | 814 (20.1%) |
| 3 or more Vehicles | 2,226 (31.0%) | 366 (9.0%) |
| Total | 7,181 (100.0%) | 4,048 (100.0%) |
Real Estate & Mortgages in Knox County
Real Estate and Mortgage Overview in Knox County
| Characteristic | Without Mortgage | With Mortgage |
| Housing Units | 4,367 | 2,814 |
| Median Property Value | $79,300 | $147,200 |
| Median Household Income | $33,906 | $394 |
| Monthly Housing Costs | $350 | $41 |
| Real Estate Taxes | $584 | $39 |
Property Value by Mortgage Status in Knox County
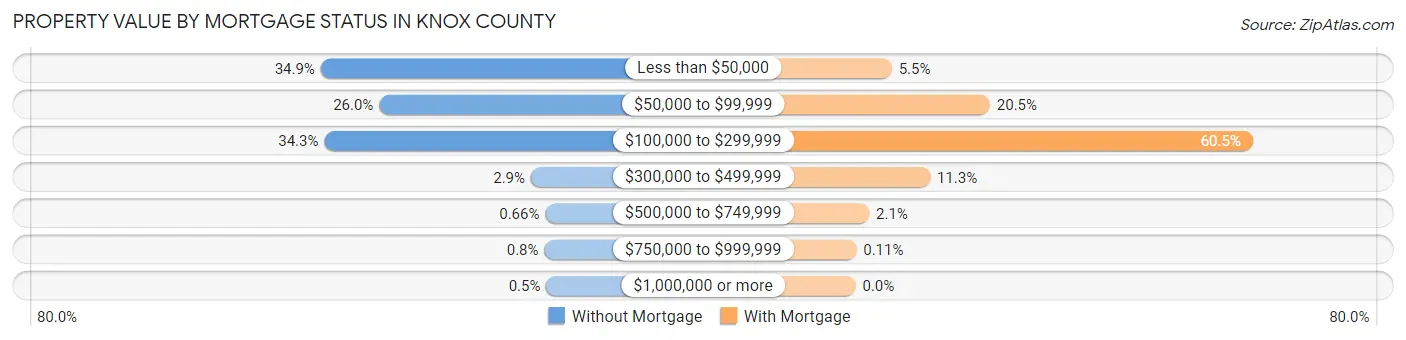
| Property Value | Without Mortgage | With Mortgage |
| Less than $50,000 | 1,523 (34.9%) | 155 (5.5%) |
| $50,000 to $99,999 | 1,134 (26.0%) | 576 (20.5%) |
| $100,000 to $299,999 | 1,499 (34.3%) | 1,703 (60.5%) |
| $300,000 to $499,999 | 125 (2.9%) | 319 (11.3%) |
| $500,000 to $749,999 | 29 (0.7%) | 58 (2.1%) |
| $750,000 to $999,999 | 35 (0.8%) | 3 (0.1%) |
| $1,000,000 or more | 22 (0.5%) | 0 (0.0%) |
| Total | 4,367 (100.0%) | 2,814 (100.0%) |
Household Income by Mortgage Status in Knox County
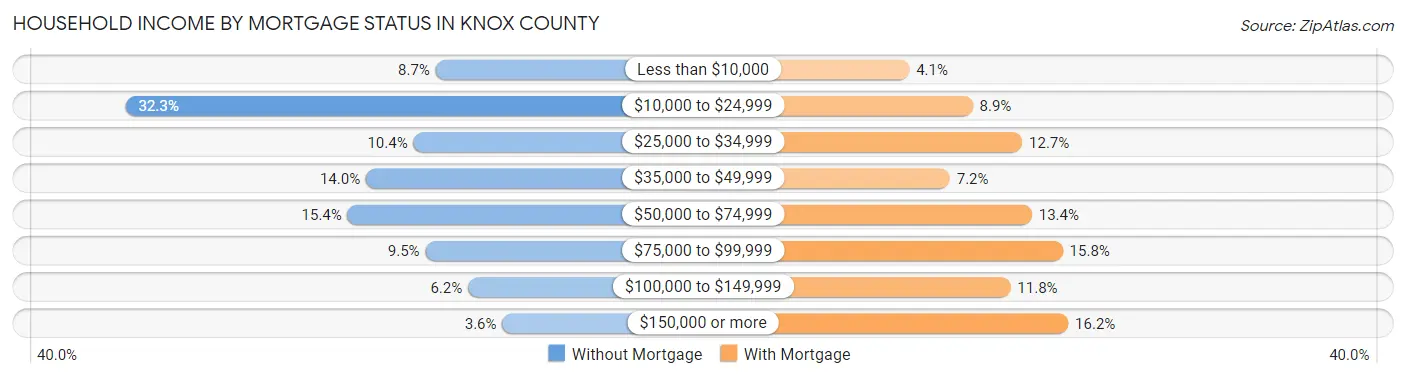
| Household Income | Without Mortgage | With Mortgage |
| Less than $10,000 | 379 (8.7%) | 115 (4.1%) |
| $10,000 to $24,999 | 1,411 (32.3%) | 251 (8.9%) |
| $25,000 to $34,999 | 453 (10.4%) | 357 (12.7%) |
| $35,000 to $49,999 | 611 (14.0%) | 202 (7.2%) |
| $50,000 to $74,999 | 672 (15.4%) | 378 (13.4%) |
| $75,000 to $99,999 | 413 (9.5%) | 444 (15.8%) |
| $100,000 to $149,999 | 271 (6.2%) | 332 (11.8%) |
| $150,000 or more | 157 (3.6%) | 456 (16.2%) |
| Total | 4,367 (100.0%) | 2,814 (100.0%) |
Property Value to Household Income Ratio in Knox County
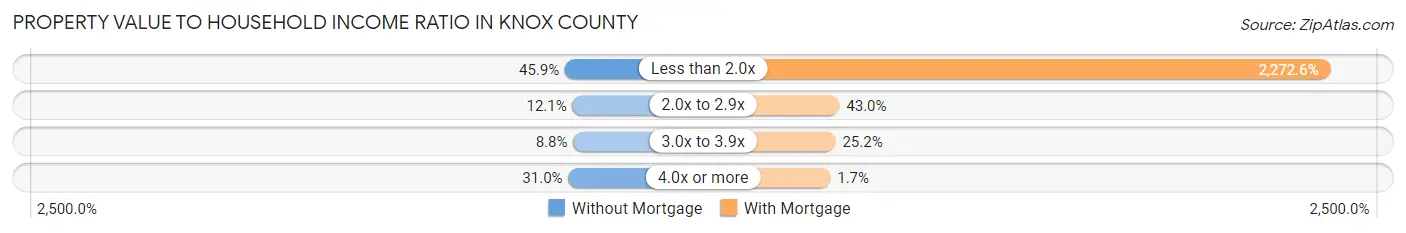
| Value-to-Income Ratio | Without Mortgage | With Mortgage |
| Less than 2.0x | 2,003 (45.9%) | 63,950 (2,272.6%) |
| 2.0x to 2.9x | 530 (12.1%) | 1,209 (43.0%) |
| 3.0x to 3.9x | 385 (8.8%) | 710 (25.2%) |
| 4.0x or more | 1,352 (31.0%) | 47 (1.7%) |
| Total | 4,367 (100.0%) | 2,814 (100.0%) |
Real Estate Taxes by Mortgage Status in Knox County
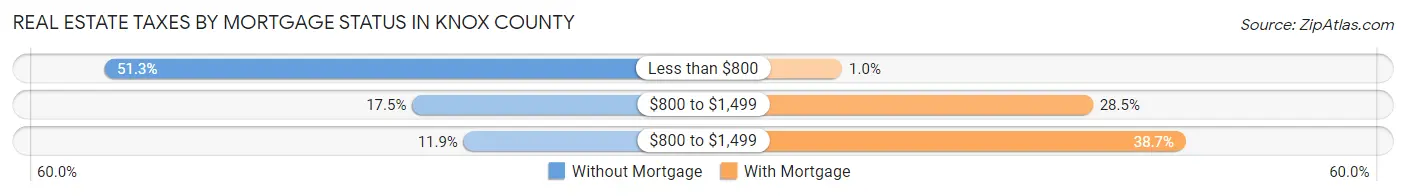
| Property Taxes | Without Mortgage | With Mortgage |
| Less than $800 | 2,240 (51.3%) | 28 (1.0%) |
| $800 to $1,499 | 765 (17.5%) | 801 (28.5%) |
| $800 to $1,499 | 519 (11.9%) | 1,088 (38.7%) |
| Total | 4,367 (100.0%) | 2,814 (100.0%) |
Health & Disability in Knox County
Health Insurance Coverage by Age in Knox County
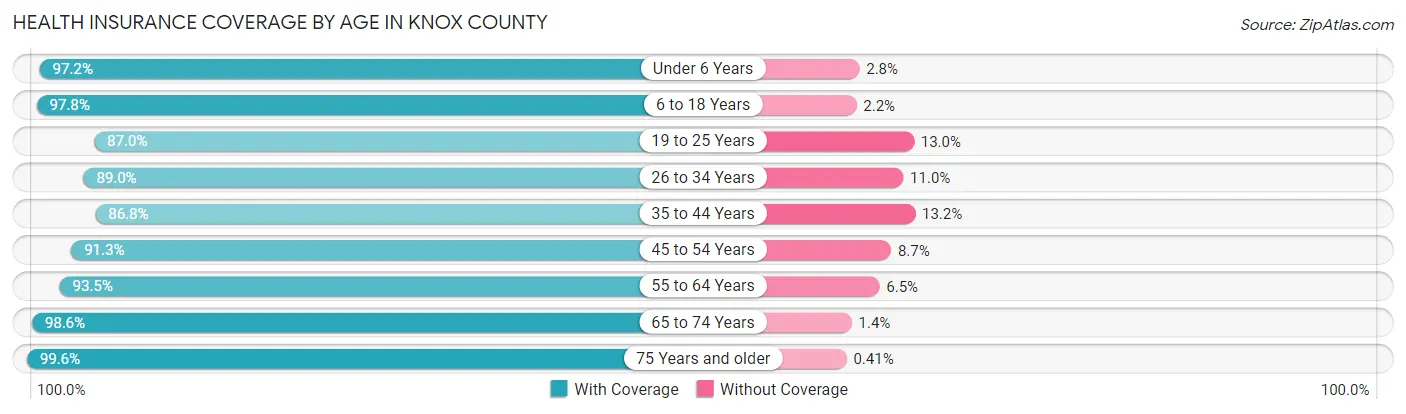
| Age Bracket | With Coverage | Without Coverage |
| Under 6 Years | 2,198 (97.2%) | 63 (2.8%) |
| 6 to 18 Years | 5,062 (97.8%) | 116 (2.2%) |
| 19 to 25 Years | 2,485 (87.0%) | 370 (13.0%) |
| 26 to 34 Years | 2,910 (89.0%) | 359 (11.0%) |
| 35 to 44 Years | 3,000 (86.8%) | 456 (13.2%) |
| 45 to 54 Years | 3,546 (91.3%) | 338 (8.7%) |
| 55 to 64 Years | 3,699 (93.5%) | 259 (6.5%) |
| 65 to 74 Years | 2,902 (98.6%) | 40 (1.4%) |
| 75 Years and older | 1,966 (99.6%) | 8 (0.4%) |
| Total | 27,768 (93.2%) | 2,009 (6.8%) |
Health Insurance Coverage by Citizenship Status in Knox County
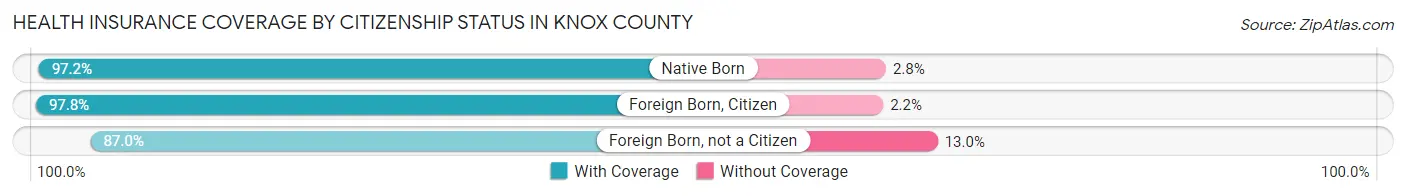
| Citizenship Status | With Coverage | Without Coverage |
| Native Born | 2,198 (97.2%) | 63 (2.8%) |
| Foreign Born, Citizen | 5,062 (97.8%) | 116 (2.2%) |
| Foreign Born, not a Citizen | 2,485 (87.0%) | 370 (13.0%) |
Health Insurance Coverage by Household Income in Knox County
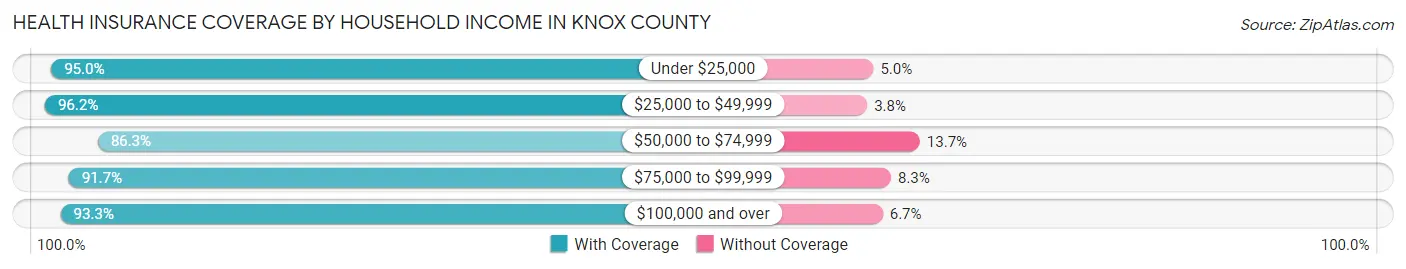
| Household Income | With Coverage | Without Coverage |
| Under $25,000 | 10,114 (95.0%) | 532 (5.0%) |
| $25,000 to $49,999 | 5,593 (96.2%) | 223 (3.8%) |
| $50,000 to $74,999 | 3,829 (86.3%) | 608 (13.7%) |
| $75,000 to $99,999 | 2,721 (91.7%) | 246 (8.3%) |
| $100,000 and over | 5,274 (93.3%) | 381 (6.7%) |
Public vs Private Health Insurance Coverage by Age in Knox County
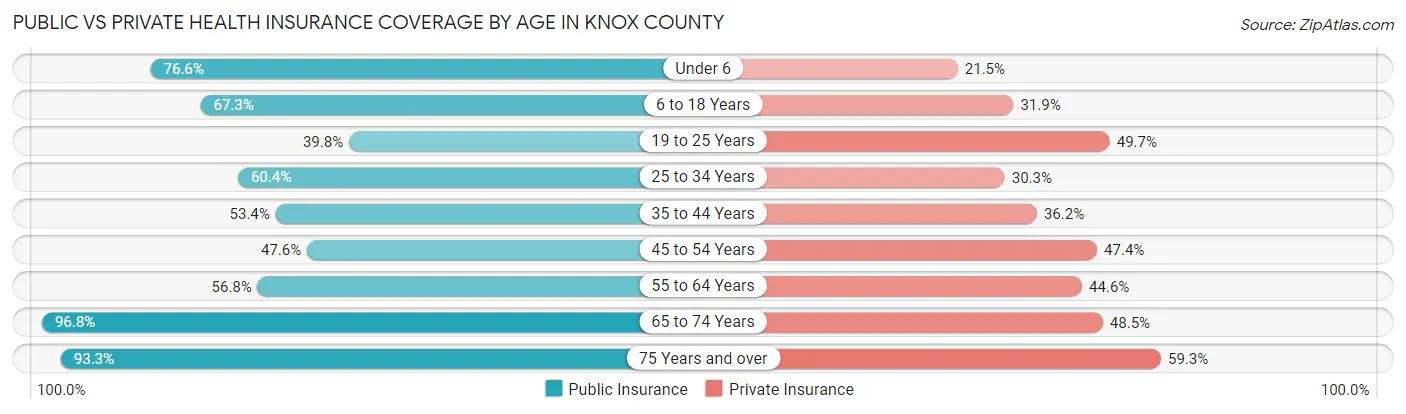
| Age Bracket | Public Insurance | Private Insurance |
| Under 6 | 1,732 (76.6%) | 487 (21.5%) |
| 6 to 18 Years | 3,487 (67.3%) | 1,650 (31.9%) |
| 19 to 25 Years | 1,136 (39.8%) | 1,420 (49.7%) |
| 25 to 34 Years | 1,974 (60.4%) | 989 (30.2%) |
| 35 to 44 Years | 1,846 (53.4%) | 1,252 (36.2%) |
| 45 to 54 Years | 1,848 (47.6%) | 1,841 (47.4%) |
| 55 to 64 Years | 2,246 (56.8%) | 1,766 (44.6%) |
| 65 to 74 Years | 2,847 (96.8%) | 1,426 (48.5%) |
| 75 Years and over | 1,841 (93.3%) | 1,170 (59.3%) |
| Total | 18,957 (63.7%) | 12,001 (40.3%) |
Disability Status by Sex by Age in Knox County
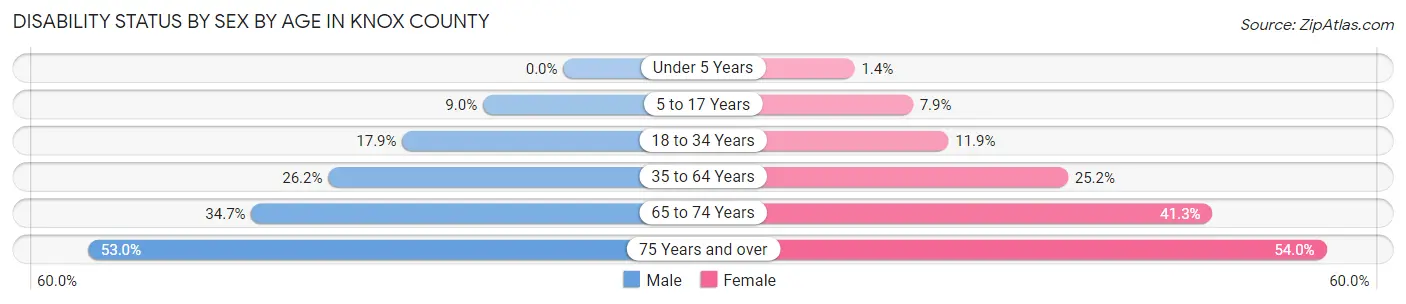
| Age Bracket | Male | Female |
| Under 5 Years | 0 (0.0%) | 13 (1.4%) |
| 5 to 17 Years | 227 (8.9%) | 209 (7.9%) |
| 18 to 34 Years | 608 (17.9%) | 364 (11.9%) |
| 35 to 64 Years | 1,422 (26.2%) | 1,477 (25.2%) |
| 65 to 74 Years | 469 (34.7%) | 657 (41.3%) |
| 75 Years and over | 431 (52.9%) | 626 (54.0%) |
Disability Class by Sex by Age in Knox County
Disability Class: Hearing Difficulty
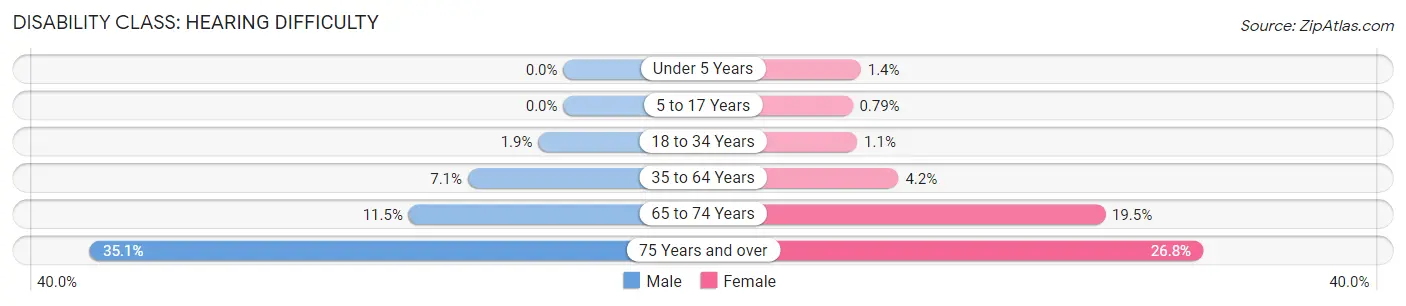
| Age Bracket | Male | Female |
| Under 5 Years | 0 (0.0%) | 13 (1.4%) |
| 5 to 17 Years | 0 (0.0%) | 21 (0.8%) |
| 18 to 34 Years | 63 (1.9%) | 35 (1.1%) |
| 35 to 64 Years | 385 (7.1%) | 247 (4.2%) |
| 65 to 74 Years | 155 (11.5%) | 311 (19.5%) |
| 75 Years and over | 286 (35.1%) | 311 (26.8%) |
Disability Class: Vision Difficulty
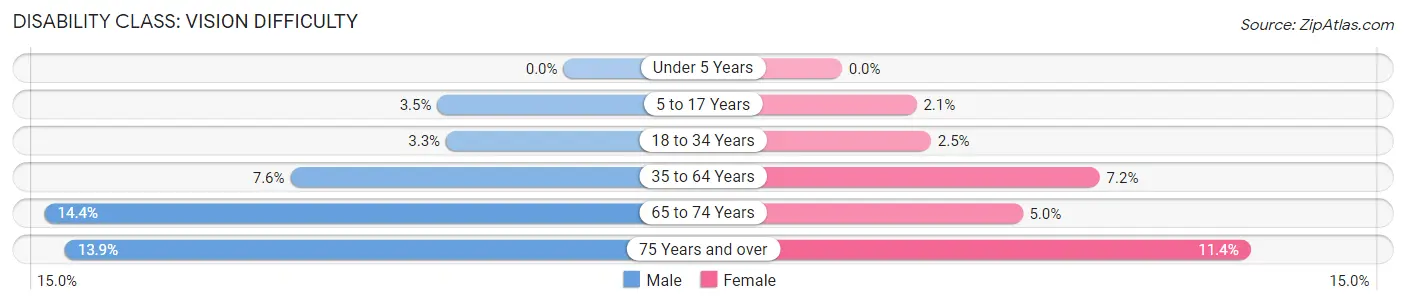
| Age Bracket | Male | Female |
| Under 5 Years | 0 (0.0%) | 0 (0.0%) |
| 5 to 17 Years | 89 (3.5%) | 55 (2.1%) |
| 18 to 34 Years | 111 (3.3%) | 76 (2.5%) |
| 35 to 64 Years | 413 (7.6%) | 421 (7.2%) |
| 65 to 74 Years | 195 (14.4%) | 80 (5.0%) |
| 75 Years and over | 113 (13.9%) | 132 (11.4%) |
Disability Class: Cognitive Difficulty
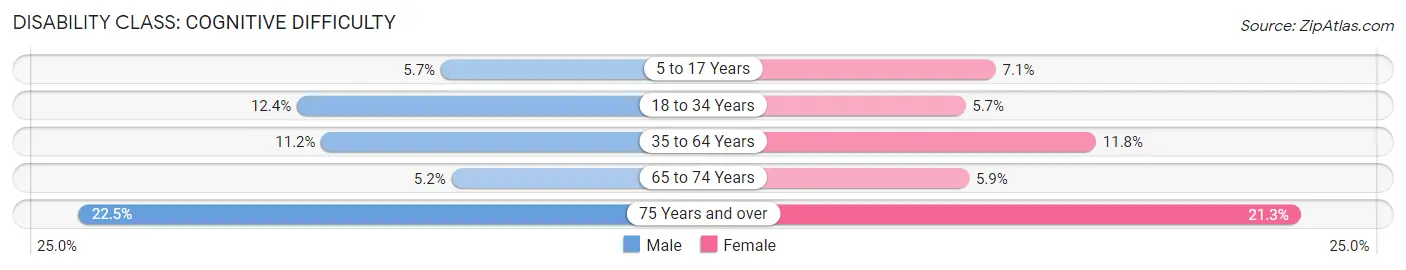
| Age Bracket | Male | Female |
| 5 to 17 Years | 144 (5.7%) | 189 (7.1%) |
| 18 to 34 Years | 419 (12.4%) | 176 (5.7%) |
| 35 to 64 Years | 610 (11.2%) | 692 (11.8%) |
| 65 to 74 Years | 70 (5.2%) | 94 (5.9%) |
| 75 Years and over | 183 (22.5%) | 247 (21.3%) |
Disability Class: Ambulatory Difficulty
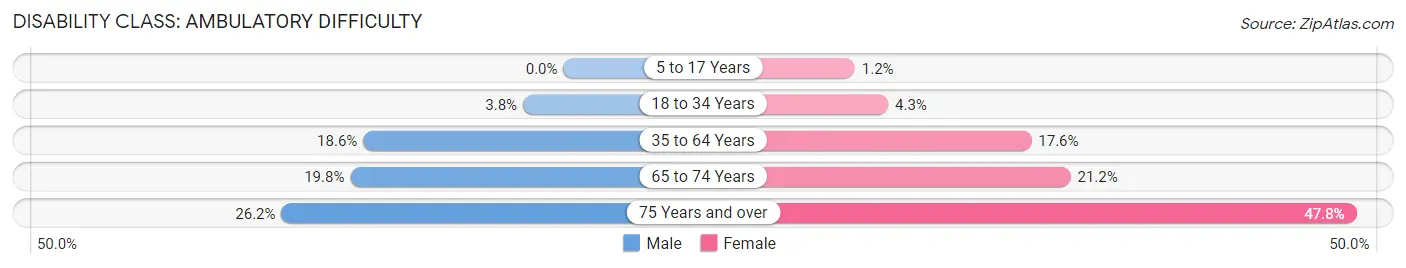
| Age Bracket | Male | Female |
| 5 to 17 Years | 0 (0.0%) | 32 (1.2%) |
| 18 to 34 Years | 127 (3.7%) | 132 (4.3%) |
| 35 to 64 Years | 1,009 (18.6%) | 1,032 (17.6%) |
| 65 to 74 Years | 267 (19.8%) | 338 (21.2%) |
| 75 Years and over | 213 (26.2%) | 554 (47.8%) |
Disability Class: Self-Care Difficulty
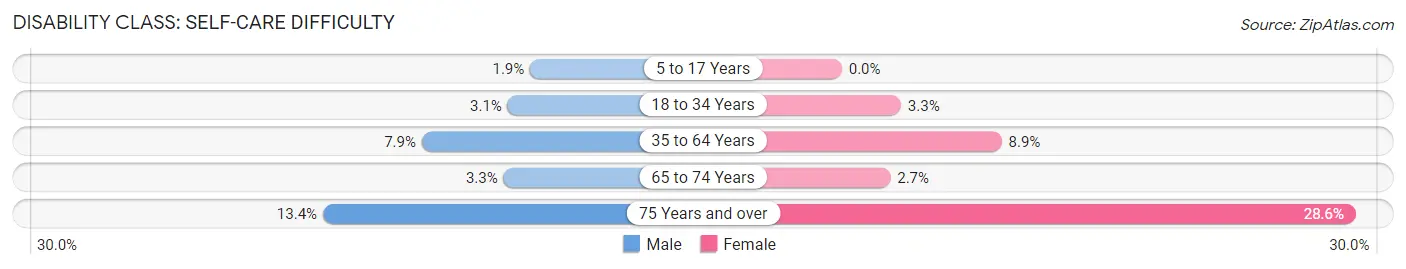
| Age Bracket | Male | Female |
| 5 to 17 Years | 47 (1.8%) | 0 (0.0%) |
| 18 to 34 Years | 105 (3.1%) | 101 (3.3%) |
| 35 to 64 Years | 428 (7.9%) | 522 (8.9%) |
| 65 to 74 Years | 45 (3.3%) | 43 (2.7%) |
| 75 Years and over | 109 (13.4%) | 332 (28.6%) |
Technology Access in Knox County
Computing Device Access in Knox County
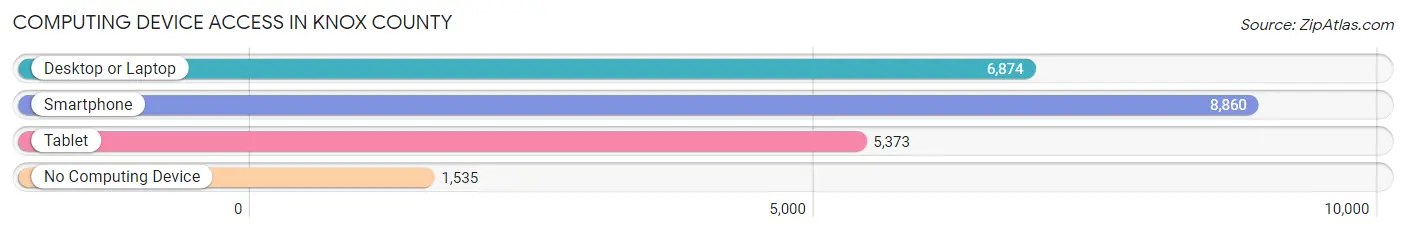
| Device Type | # Households | % Households |
| Desktop or Laptop | 6,874 | 61.2% |
| Smartphone | 8,860 | 78.9% |
| Tablet | 5,373 | 47.8% |
| No Computing Device | 1,535 | 13.7% |
| Total | 11,229 | 100.0% |
Internet Access in Knox County
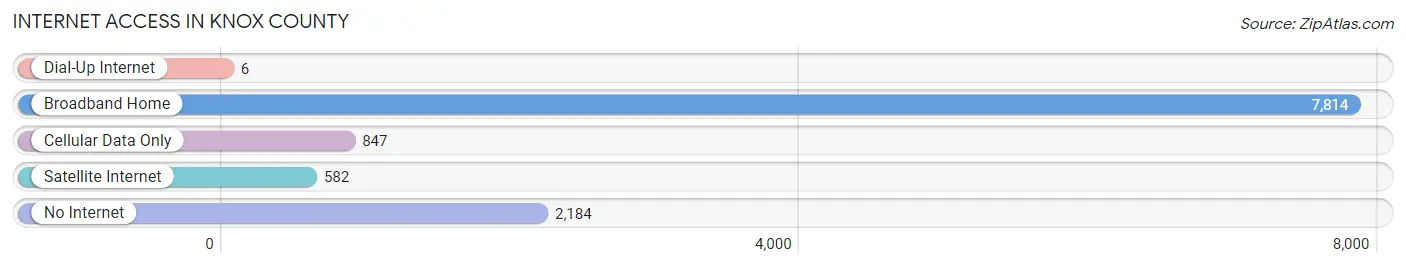
| Internet Type | # Households | % Households |
| Dial-Up Internet | 6 | 0.1% |
| Broadband Home | 7,814 | 69.6% |
| Cellular Data Only | 847 | 7.5% |
| Satellite Internet | 582 | 5.2% |
| No Internet | 2,184 | 19.5% |
| Total | 11,229 | 100.0% |
Knox County Summary
Knox County, Kentucky is located in the southeastern corner of the state, and is bordered by the states of Tennessee and Virginia. It is part of the Appalachian region of the United States, and is known for its rolling hills and lush forests. The county seat is Barbourville, and the county is home to approximately 31,000 people.
History
Knox County was formed in 1799 from parts of Lincoln and Fayette counties. It was named for General Henry Knox, who served as the first Secretary of War under President George Washington. The county was originally part of the Cherokee Nation, and the first settlers arrived in the area in the late 1700s.
The county was an important part of the Underground Railroad, and many escaped slaves found refuge in the area. During the Civil War, Knox County was a major supplier of saltpeter, which was used to make gunpowder.
Geography
Knox County is located in the Appalachian Mountains, and is characterized by rolling hills and lush forests. The county is home to the Cumberland Gap National Historical Park, which is a major tourist attraction. The county is also home to the Big South Fork National River and Recreation Area, which is a popular destination for hikers, campers, and other outdoor enthusiasts.
The county is divided into two distinct regions: the Cumberland Plateau and the Bluegrass Region. The Cumberland Plateau is characterized by steep hills and deep valleys, while the Bluegrass Region is characterized by rolling hills and fertile farmland.
Economy
The economy of Knox County is largely based on agriculture and tourism. The county is home to several large farms, which produce a variety of crops, including corn, soybeans, and tobacco. The county is also home to several wineries, which produce a variety of wines.
Tourism is an important part of the economy, as the county is home to several popular attractions, including the Cumberland Gap National Historical Park, the Big South Fork National River and Recreation Area, and the Kentucky Coal Mining Museum.
Demographics
As of the 2010 census, the population of Knox County was 31,883. The racial makeup of the county was 95.3% White, 2.2% African American, 0.3% Native American, 0.3% Asian, 0.1% Pacific Islander, 0.7% from other races, and 1.2% from two or more races. Hispanic or Latino of any race were 1.7% of the population.
The median income for a household in the county was $30,945, and the median income for a family was $37,945. The per capita income for the county was $17,845. About 17.2% of families and 21.2% of the population were below the poverty line, including 28.2% of those under age 18 and 16.2% of those age 65 or over.
Knox County is a rural county with a rich history and a diverse economy. The county is home to several popular attractions, and is a popular destination for outdoor enthusiasts. The county is also home to several large farms, which produce a variety of crops. The county has a population of approximately 31,000 people, and the median income for a household is $30,945.
Common Questions
What is Per Capita Income in Knox County?
Per Capita income in Knox County is $20,658.
What is the Median Family Income in Knox County?
Median Family Income in Knox County is $45,147.
What is the Median Household income in Knox County?
Median Household Income in Knox County is $34,254.
What is Income or Wage Gap in Knox County?
Income or Wage Gap in Knox County is 41.1%.
Women in Knox County earn 58.9 cents for every dollar earned by a man.
What is Family Income Deficit in Knox County?
Family Income Deficit in Knox County is $12,715.
Families that are below poverty line in Knox County earn $12,715 less on average than the poverty threshold level.
What is Inequality or Gini Index in Knox County?
Inequality or Gini Index in Knox County is 0.52.
What is the Total Population of Knox County?
Total Population of Knox County is 30,207.
What is the Total Male Population of Knox County?
Total Male Population of Knox County is 14,686.
What is the Total Female Population of Knox County?
Total Female Population of Knox County is 15,521.
What is the Ratio of Males per 100 Females in Knox County?
There are 94.62 Males per 100 Females in Knox County.
What is the Ratio of Females per 100 Males in Knox County?
There are 105.69 Females per 100 Males in Knox County.
What is the Median Population Age in Knox County?
Median Population Age in Knox County is 40.1 Years.
What is the Average Family Size in Knox County
Average Family Size in Knox County is 3.3 People.
What is the Average Household Size in Knox County
Average Household Size in Knox County is 2.6 People.
How Large is the Labor Force in Knox County?
There are 10,129 People in the Labor Forcein in Knox County.
What is the Percentage of People in the Labor Force in Knox County?
42.7% of People are in the Labor Force in Knox County.
What is the Unemployment Rate in Knox County?
Unemployment Rate in Knox County is 8.9%.