Knott County, KY Map & Demographics
Knott County Map
Knott County Overview
$20,536
PER CAPITA INCOME
$45,572
AVG FAMILY INCOME
$38,336
AVG HOUSEHOLD INCOME
6.3%
WAGE / INCOME GAP [ % ]
93.7¢/ $1
WAGE / INCOME GAP [ $ ]
$11,414
FAMILY INCOME DEFICIT
0.46
INEQUALITY / GINI INDEX
14,282
TOTAL POPULATION
7,100
MALE POPULATION
7,182
FEMALE POPULATION
98.86
MALES / 100 FEMALES
101.15
FEMALES / 100 MALES
44.2
MEDIAN AGE
3.0
AVG FAMILY SIZE
2.5
AVG HOUSEHOLD SIZE
4,718
LABOR FORCE [ PEOPLE ]
40.0%
PERCENT IN LABOR FORCE
10.6%
UNEMPLOYMENT RATE
Knott County Area Codes
Income in Knott County
Income Overview in Knott County
Per Capita Income in Knott County is $20,536, while median incomes of families and households are $45,572 and $38,336 respectively.
| Characteristic | Number | Measure |
| Per Capita Income | 14,282 | $20,536 |
| Median Family Income | 3,796 | $45,572 |
| Mean Family Income | 3,796 | $59,826 |
| Median Household Income | 5,563 | $38,336 |
| Mean Household Income | 5,563 | $51,962 |
| Income Deficit | 3,796 | $11,414 |
| Wage / Income Gap (%) | 14,282 | 6.25% |
| Wage / Income Gap ($) | 14,282 | 93.75¢ per $1 |
| Gini / Inequality Index | 14,282 | 0.46 |
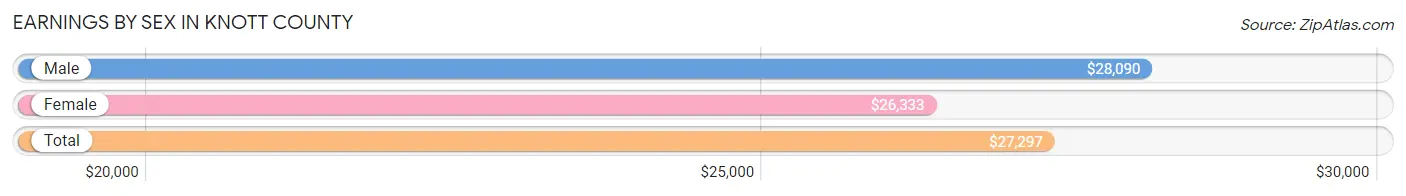
Earnings by Sex in Knott County
Average Earnings in Knott County are $27,297, $28,090 for men and $26,333 for women, a difference of 6.2%.
| Sex | Number | Average Earnings |
| Male | 2,602 (51.9%) | $28,090 |
| Female | 2,414 (48.1%) | $26,333 |
| Total | 5,016 (100.0%) | $27,297 |
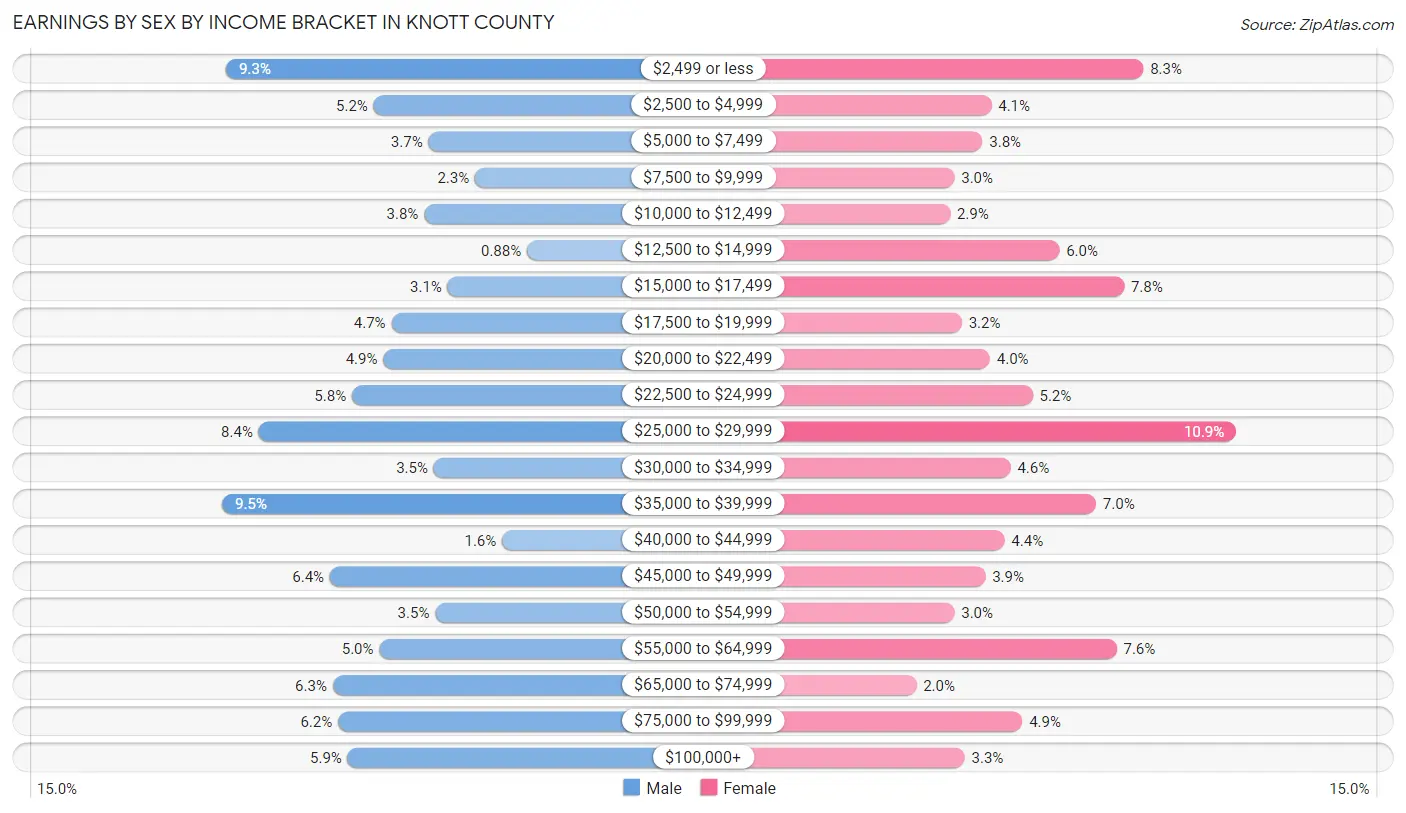
Earnings by Sex by Income Bracket in Knott County
The most common earnings brackets in Knott County are $35,000 to $39,999 for men (246 | 9.5%) and $25,000 to $29,999 for women (264 | 10.9%).
| Income | Male | Female |
| $2,499 or less | 243 (9.3%) | 201 (8.3%) |
| $2,500 to $4,999 | 135 (5.2%) | 98 (4.1%) |
| $5,000 to $7,499 | 95 (3.6%) | 92 (3.8%) |
| $7,500 to $9,999 | 61 (2.3%) | 73 (3.0%) |
| $10,000 to $12,499 | 98 (3.8%) | 70 (2.9%) |
| $12,500 to $14,999 | 23 (0.9%) | 144 (6.0%) |
| $15,000 to $17,499 | 81 (3.1%) | 188 (7.8%) |
| $17,500 to $19,999 | 122 (4.7%) | 78 (3.2%) |
| $20,000 to $22,499 | 128 (4.9%) | 97 (4.0%) |
| $22,500 to $24,999 | 151 (5.8%) | 126 (5.2%) |
| $25,000 to $29,999 | 219 (8.4%) | 264 (10.9%) |
| $30,000 to $34,999 | 91 (3.5%) | 111 (4.6%) |
| $35,000 to $39,999 | 246 (9.5%) | 169 (7.0%) |
| $40,000 to $44,999 | 41 (1.6%) | 107 (4.4%) |
| $45,000 to $49,999 | 167 (6.4%) | 94 (3.9%) |
| $50,000 to $54,999 | 90 (3.5%) | 73 (3.0%) |
| $55,000 to $64,999 | 131 (5.0%) | 183 (7.6%) |
| $65,000 to $74,999 | 165 (6.3%) | 47 (1.9%) |
| $75,000 to $99,999 | 161 (6.2%) | 119 (4.9%) |
| $100,000+ | 154 (5.9%) | 80 (3.3%) |
| Total | 2,602 (100.0%) | 2,414 (100.0%) |
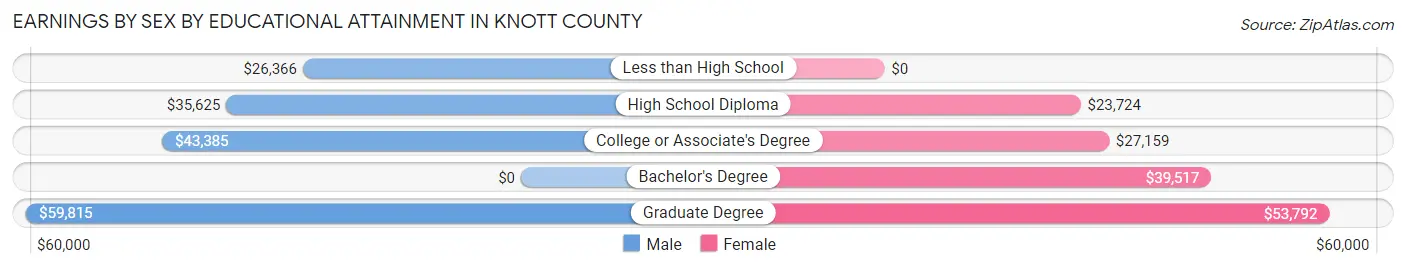
Earnings by Sex by Educational Attainment in Knott County
Average earnings in Knott County are $37,151 for men and $31,923 for women, a difference of 14.1%. Men with an educational attainment of graduate degree enjoy the highest average annual earnings of $59,815, while those with less than high school education earn the least with $26,366. Women with an educational attainment of graduate degree earn the most with the average annual earnings of $53,792, while those with high school diploma education have the smallest earnings of $23,724.
| Educational Attainment | Male Income | Female Income |
| Less than High School | $26,366 | $0 |
| High School Diploma | $35,625 | $23,724 |
| College or Associate's Degree | $43,385 | $27,159 |
| Bachelor's Degree | - | - |
| Graduate Degree | $59,815 | $53,792 |
| Total | $37,151 | $31,923 |
Family Income in Knott County
Family Income Brackets in Knott County
According to the Knott County family income data, there are 630 families falling into the $50,000 to $74,999 income range, which is the most common income bracket and makes up 16.6% of all families. Conversely, the $200,000+ income bracket is the least frequent group with only 72 families (1.9%) belonging to this category.
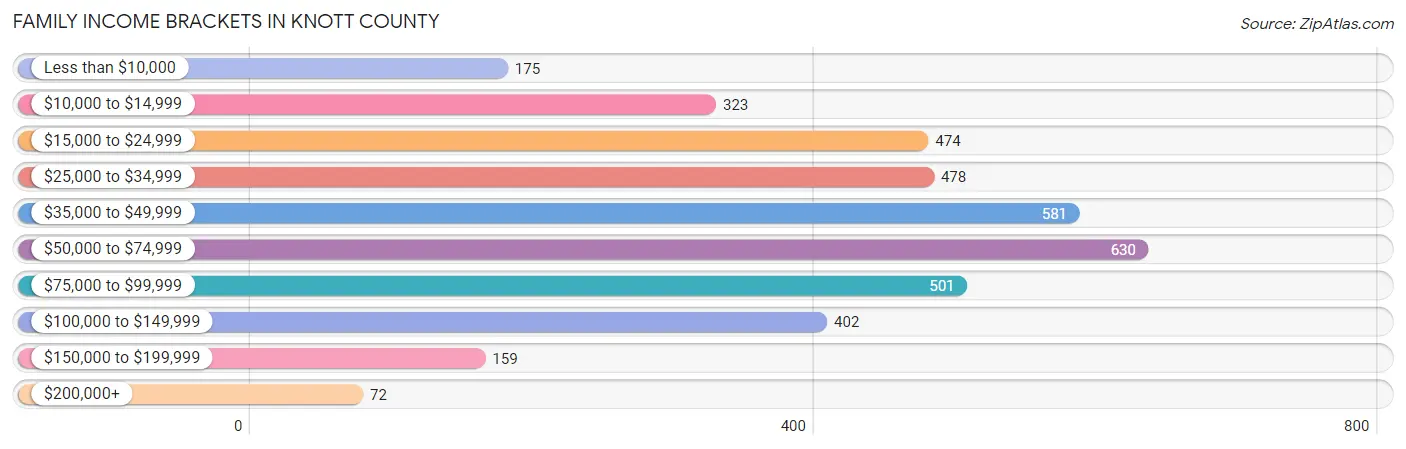
| Income Bracket | # Families | % Families |
| Less than $10,000 | 175 | 4.6% |
| $10,000 to $14,999 | 323 | 8.5% |
| $15,000 to $24,999 | 474 | 12.5% |
| $25,000 to $34,999 | 478 | 12.6% |
| $35,000 to $49,999 | 581 | 15.3% |
| $50,000 to $74,999 | 630 | 16.6% |
| $75,000 to $99,999 | 501 | 13.2% |
| $100,000 to $149,999 | 402 | 10.6% |
| $150,000 to $199,999 | 159 | 4.2% |
| $200,000+ | 72 | 1.9% |
Family Income by Famaliy Size in Knott County
4-person families (590 | 15.5%) account for the highest median family income in Knott County with $80,133 per family, while 2-person families (1,859 | 49.0%) have the highest median income of $20,254 per family member.
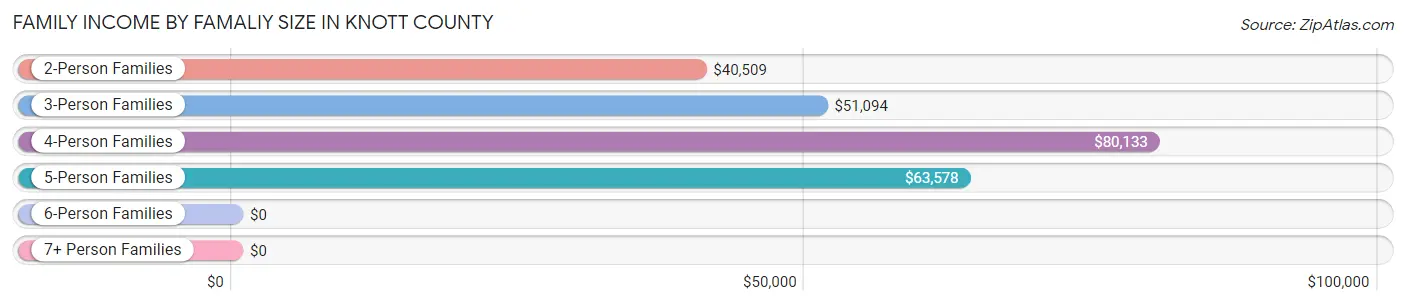
| Income Bracket | # Families | Median Income |
| 2-Person Families | 1,859 (49.0%) | $40,509 |
| 3-Person Families | 717 (18.9%) | $51,094 |
| 4-Person Families | 590 (15.5%) | $80,133 |
| 5-Person Families | 422 (11.1%) | $63,578 |
| 6-Person Families | 190 (5.0%) | $0 |
| 7+ Person Families | 18 (0.5%) | $0 |
| Total | 3,796 (100.0%) | $45,572 |
Family Income by Number of Earners in Knott County
The median family income in Knott County is $45,572, with families comprising 3+ earners (185) having the highest median family income of $112,679, while families with no earners (1,278) have the lowest median family income of $24,195, accounting for 4.9% and 33.7% of families, respectively.
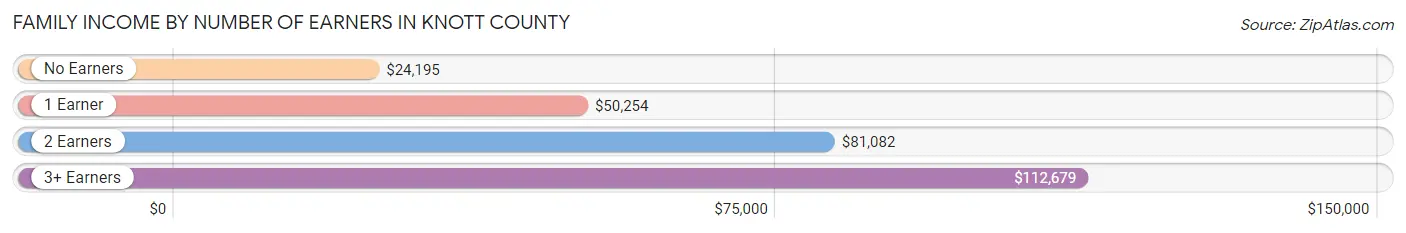
| Number of Earners | # Families | Median Income |
| No Earners | 1,278 (33.7%) | $24,195 |
| 1 Earner | 1,326 (34.9%) | $50,254 |
| 2 Earners | 1,007 (26.5%) | $81,082 |
| 3+ Earners | 185 (4.9%) | $112,679 |
| Total | 3,796 (100.0%) | $45,572 |
Household Income in Knott County
Household Income Brackets in Knott County
With 857 households falling in the category, the $25,000 to $34,999 income range is the most frequent in Knott County, accounting for 15.4% of all households. In contrast, only 78 households (1.4%) fall into the $200,000+ income bracket, making it the least populous group.
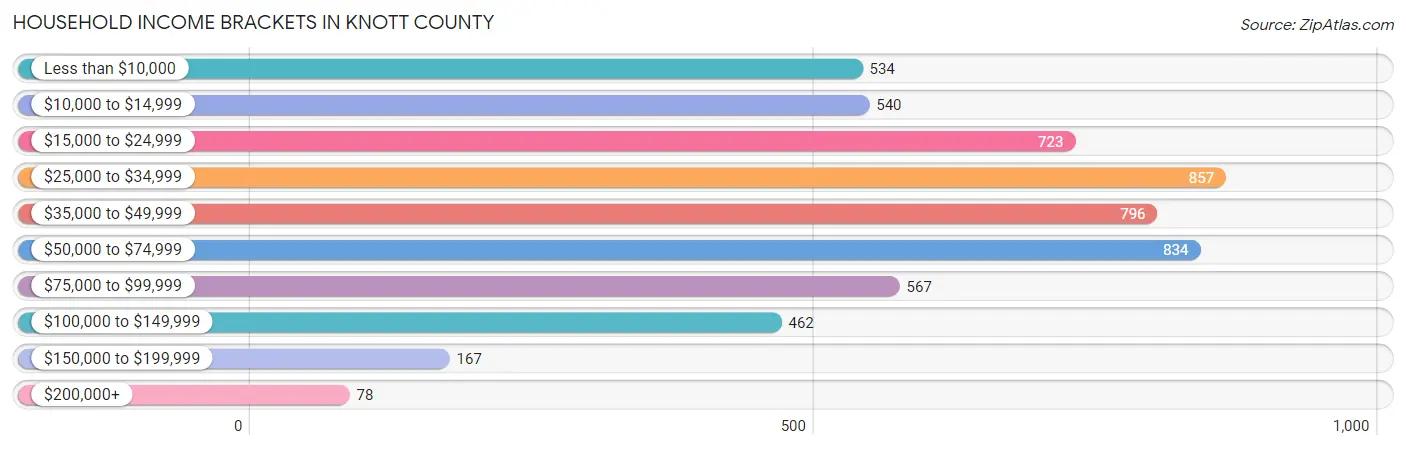
| Income Bracket | # Households | % Households |
| Less than $10,000 | 534 | 9.6% |
| $10,000 to $14,999 | 540 | 9.7% |
| $15,000 to $24,999 | 723 | 13.0% |
| $25,000 to $34,999 | 857 | 15.4% |
| $35,000 to $49,999 | 796 | 14.3% |
| $50,000 to $74,999 | 834 | 15.0% |
| $75,000 to $99,999 | 567 | 10.2% |
| $100,000 to $149,999 | 462 | 8.3% |
| $150,000 to $199,999 | 167 | 3.0% |
| $200,000+ | 78 | 1.4% |
Household Income by Householder Age in Knott County
The median household income in Knott County is $38,336, with the highest median household income of $47,107 found in the 25 to 44 years age bracket for the primary householder. A total of 1,283 households (23.1%) fall into this category. Meanwhile, the 15 to 24 years age bracket for the primary householder has the lowest median household income of $28,750, with 125 households (2.2%) in this group.
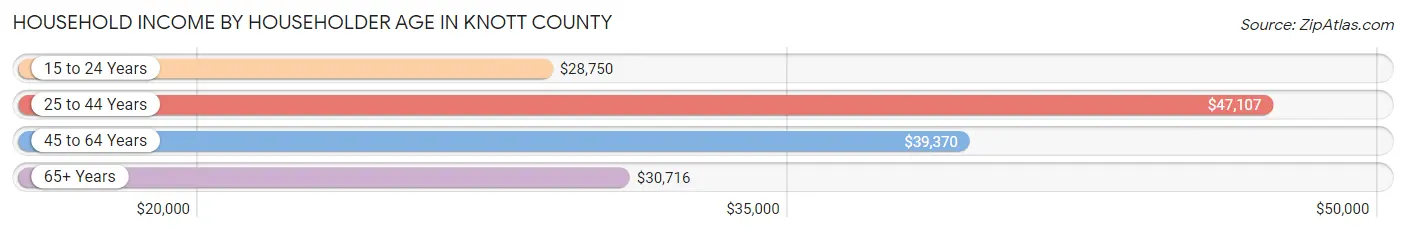
| Income Bracket | # Households | Median Income |
| 15 to 24 Years | 125 (2.2%) | $28,750 |
| 25 to 44 Years | 1,283 (23.1%) | $47,107 |
| 45 to 64 Years | 2,312 (41.6%) | $39,370 |
| 65+ Years | 1,843 (33.1%) | $30,716 |
| Total | 5,563 (100.0%) | $38,336 |
Poverty in Knott County
Income Below Poverty by Sex and Age in Knott County
With 26.4% poverty level for males and 29.0% for females among the residents of Knott County, 5 year old males and 5 year old females are the most vulnerable to poverty, with 66 males (64.7%) and 57 females (85.1%) in their respective age groups living below the poverty level.
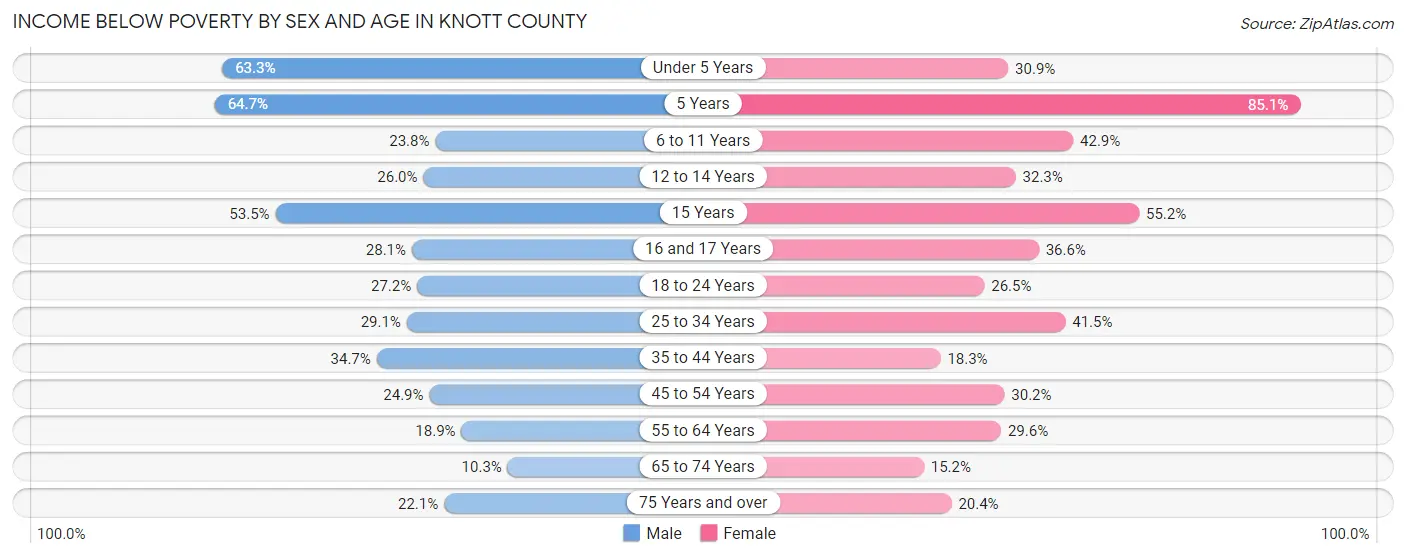
| Age Bracket | Male | Female |
| Under 5 Years | 214 (63.3%) | 105 (30.9%) |
| 5 Years | 66 (64.7%) | 57 (85.1%) |
| 6 to 11 Years | 135 (23.8%) | 216 (42.9%) |
| 12 to 14 Years | 33 (26.0%) | 70 (32.3%) |
| 15 Years | 31 (53.4%) | 48 (55.2%) |
| 16 and 17 Years | 63 (28.1%) | 53 (36.5%) |
| 18 to 24 Years | 161 (27.2%) | 123 (26.5%) |
| 25 to 34 Years | 212 (29.1%) | 317 (41.5%) |
| 35 to 44 Years | 261 (34.7%) | 143 (18.3%) |
| 45 to 54 Years | 245 (24.9%) | 287 (30.2%) |
| 55 to 64 Years | 206 (18.9%) | 325 (29.5%) |
| 65 to 74 Years | 90 (10.3%) | 133 (15.2%) |
| 75 Years and over | 89 (22.1%) | 115 (20.3%) |
| Total | 1,806 (26.4%) | 1,992 (29.0%) |
Income Above Poverty by Sex and Age in Knott County
According to the poverty statistics in Knott County, males aged 65 to 74 years and females aged 65 to 74 years are the age groups that are most secure financially, with 89.7% of males and 84.8% of females in these age groups living above the poverty line.
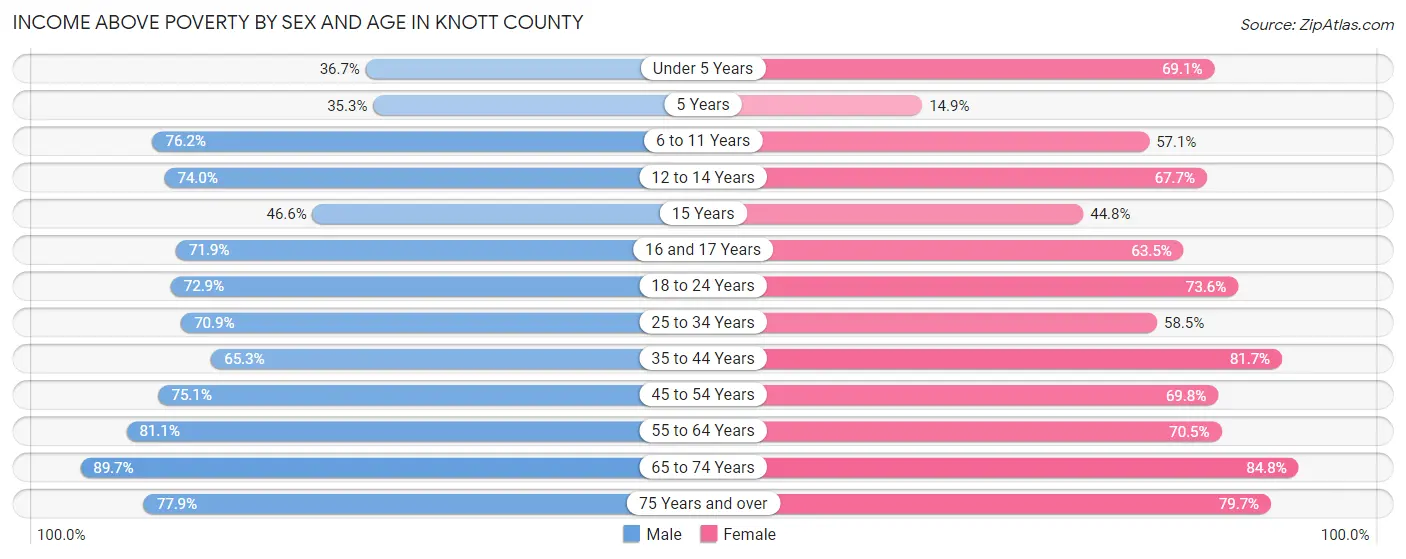
| Age Bracket | Male | Female |
| Under 5 Years | 124 (36.7%) | 235 (69.1%) |
| 5 Years | 36 (35.3%) | 10 (14.9%) |
| 6 to 11 Years | 433 (76.2%) | 287 (57.1%) |
| 12 to 14 Years | 94 (74.0%) | 147 (67.7%) |
| 15 Years | 27 (46.6%) | 39 (44.8%) |
| 16 and 17 Years | 161 (71.9%) | 92 (63.4%) |
| 18 to 24 Years | 432 (72.9%) | 342 (73.6%) |
| 25 to 34 Years | 517 (70.9%) | 447 (58.5%) |
| 35 to 44 Years | 492 (65.3%) | 638 (81.7%) |
| 45 to 54 Years | 740 (75.1%) | 664 (69.8%) |
| 55 to 64 Years | 883 (81.1%) | 775 (70.5%) |
| 65 to 74 Years | 780 (89.7%) | 741 (84.8%) |
| 75 Years and over | 313 (77.9%) | 450 (79.6%) |
| Total | 5,032 (73.6%) | 4,867 (71.0%) |
Income Below Poverty Among Married-Couple Families in Knott County
The poverty statistics for married-couple families in Knott County show that 11.8% or 313 of the total 2,649 families live below the poverty line. Families with 3 or 4 children have the highest poverty rate of 50.6%, comprising of 79 families. On the other hand, families with 5 or more children have the lowest poverty rate of 0.0%, which includes 0 families.
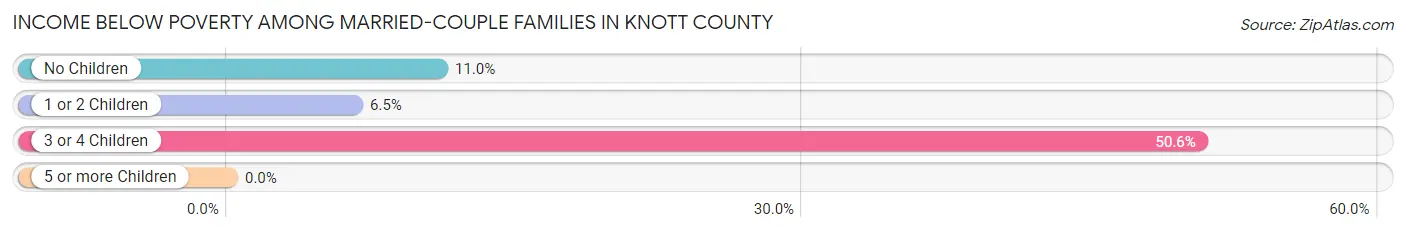
| Children | Above Poverty | Below Poverty |
| No Children | 1,445 (89.0%) | 178 (11.0%) |
| 1 or 2 Children | 802 (93.5%) | 56 (6.5%) |
| 3 or 4 Children | 77 (49.4%) | 79 (50.6%) |
| 5 or more Children | 12 (100.0%) | 0 (0.0%) |
| Total | 2,336 (88.2%) | 313 (11.8%) |
Income Below Poverty Among Single-Parent Households in Knott County
According to the poverty data in Knott County, 27.2% or 77 single-father households and 50.3% or 435 single-mother households are living below the poverty line. Among single-father households, those with 3 or 4 children have the highest poverty rate, with 23 households (65.7%) experiencing poverty. Likewise, among single-mother households, those with 5 or more children have the highest poverty rate, with 58 households (100.0%) falling below the poverty line.
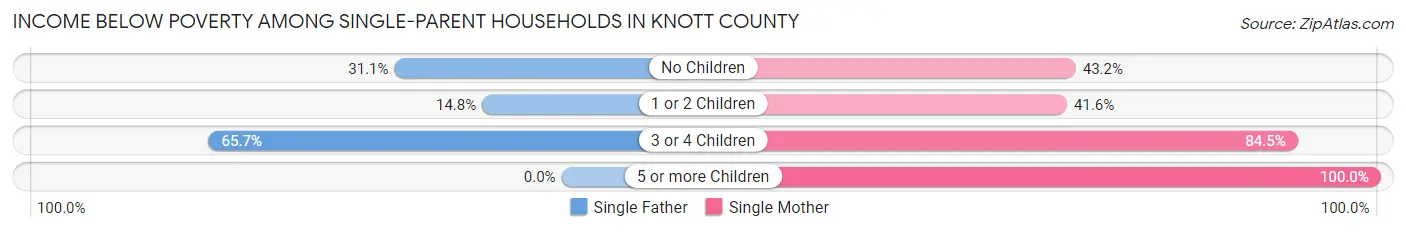
| Children | Single Father | Single Mother |
| No Children | 33 (31.1%) | 147 (43.2%) |
| 1 or 2 Children | 21 (14.8%) | 159 (41.6%) |
| 3 or 4 Children | 23 (65.7%) | 71 (84.5%) |
| 5 or more Children | 0 (0.0%) | 58 (100.0%) |
| Total | 77 (27.2%) | 435 (50.3%) |
Income Below Poverty Among Married-Couple vs Single-Parent Households in Knott County
The poverty data for Knott County shows that 313 of the married-couple family households (11.8%) and 512 of the single-parent households (44.6%) are living below the poverty level. Within the married-couple family households, those with 3 or 4 children have the highest poverty rate, with 79 households (50.6%) falling below the poverty line. Among the single-parent households, those with 5 or more children have the highest poverty rate, with 58 household (100.0%) living below poverty.
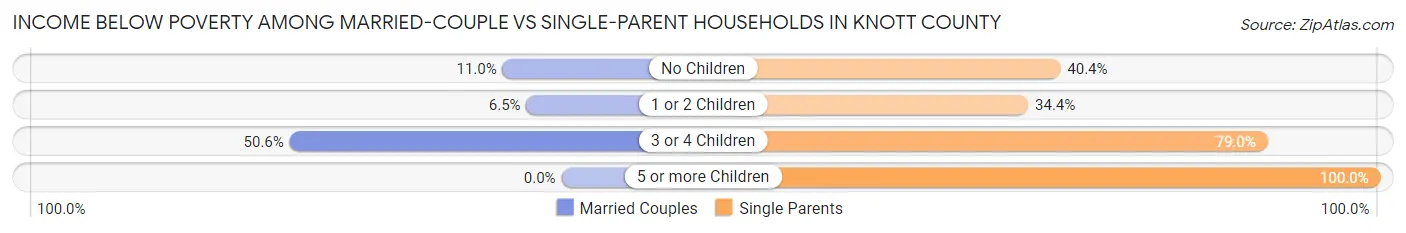
| Children | Married-Couple Families | Single-Parent Households |
| No Children | 178 (11.0%) | 180 (40.4%) |
| 1 or 2 Children | 56 (6.5%) | 180 (34.4%) |
| 3 or 4 Children | 79 (50.6%) | 94 (79.0%) |
| 5 or more Children | 0 (0.0%) | 58 (100.0%) |
| Total | 313 (11.8%) | 512 (44.6%) |
Race in Knott County
The most populous races in Knott County are White / Caucasian (13,800 | 96.6%), Two or more Races (167 | 1.2%), and Black / African American (154 | 1.1%).
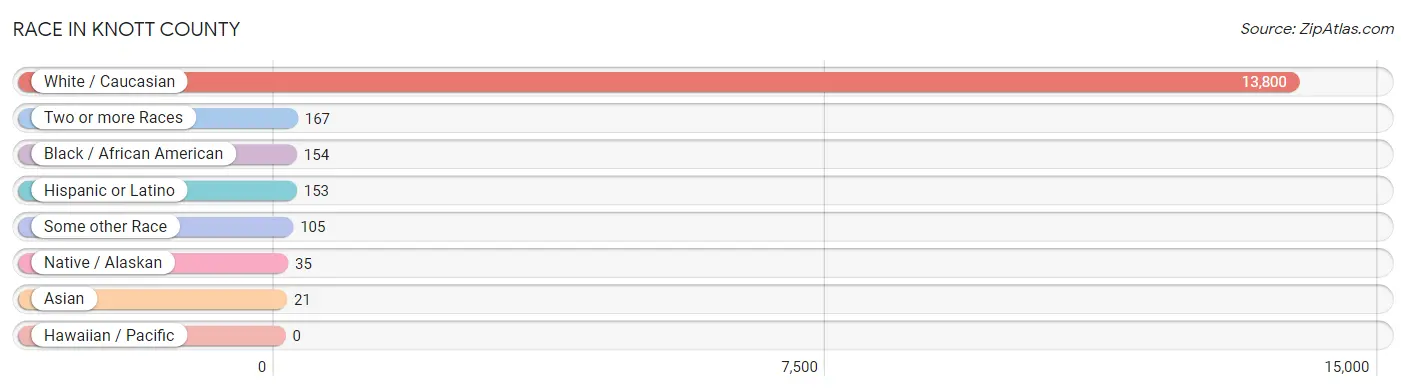
| Race | # Population | % Population |
| Asian | 21 | 0.2% |
| Black / African American | 154 | 1.1% |
| Hawaiian / Pacific | 0 | 0.0% |
| Hispanic or Latino | 153 | 1.1% |
| Native / Alaskan | 35 | 0.3% |
| White / Caucasian | 13,800 | 96.6% |
| Two or more Races | 167 | 1.2% |
| Some other Race | 105 | 0.7% |
| Total | 14,282 | 100.0% |
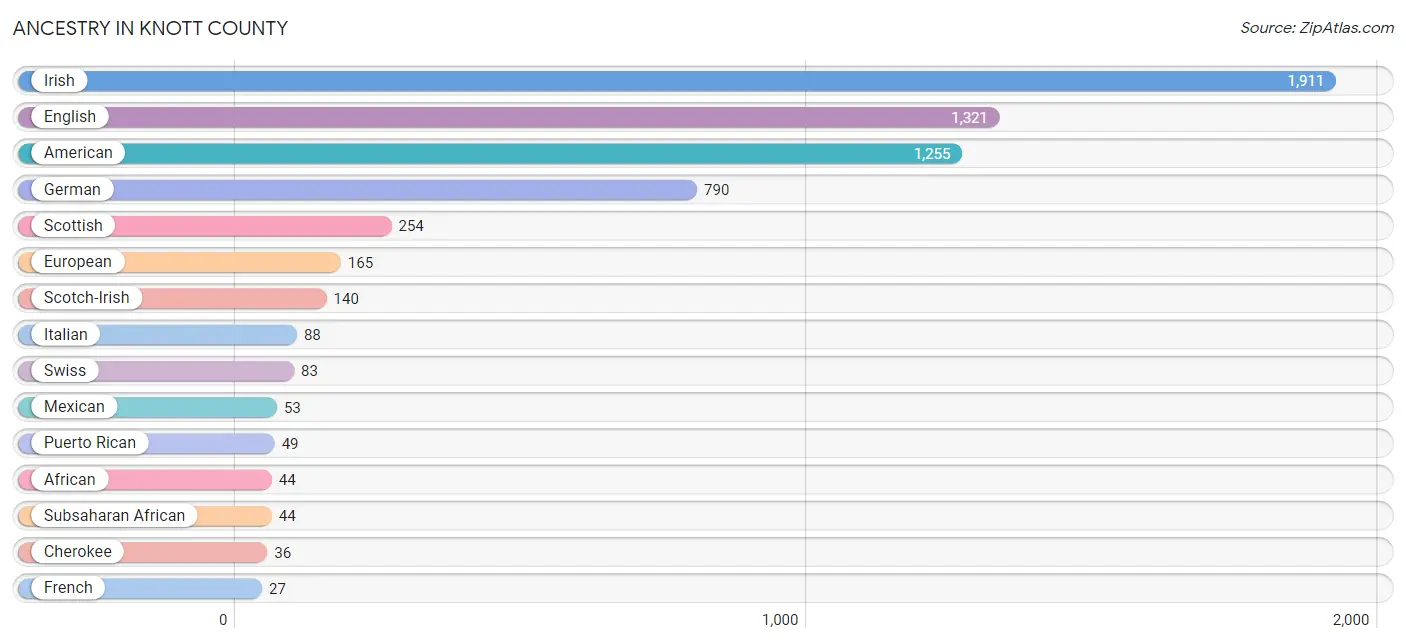
Ancestry in Knott County
The most populous ancestries reported in Knott County are Irish (1,911 | 13.4%), English (1,321 | 9.2%), American (1,255 | 8.8%), German (790 | 5.5%), and Scottish (254 | 1.8%), together accounting for 38.7% of all Knott County residents.
| Ancestry | # Population | % Population |
| African | 44 | 0.3% |
| American | 1,255 | 8.8% |
| Armenian | 3 | 0.0% |
| Blackfeet | 20 | 0.1% |
| British | 24 | 0.2% |
| Burmese | 1 | 0.0% |
| Central American | 11 | 0.1% |
| Central American Indian | 7 | 0.1% |
| Cherokee | 36 | 0.3% |
| Colombian | 13 | 0.1% |
| Dominican | 15 | 0.1% |
| English | 1,321 | 9.2% |
| European | 165 | 1.2% |
| French | 27 | 0.2% |
| German | 790 | 5.5% |
| Greek | 12 | 0.1% |
| Guatemalan | 7 | 0.1% |
| Honduran | 4 | 0.0% |
| Indian (Asian) | 8 | 0.1% |
| Irish | 1,911 | 13.4% |
| Italian | 88 | 0.6% |
| Korean | 12 | 0.1% |
| Mexican | 53 | 0.4% |
| Polish | 21 | 0.2% |
| Puerto Rican | 49 | 0.3% |
| Scandinavian | 6 | 0.0% |
| Scotch-Irish | 140 | 1.0% |
| Scottish | 254 | 1.8% |
| South American | 24 | 0.2% |
| Subsaharan African | 44 | 0.3% |
| Swiss | 83 | 0.6% |
| Venezuelan | 11 | 0.1% |
| Welsh | 16 | 0.1% | View All 33 Rows |
Immigrants in Knott County
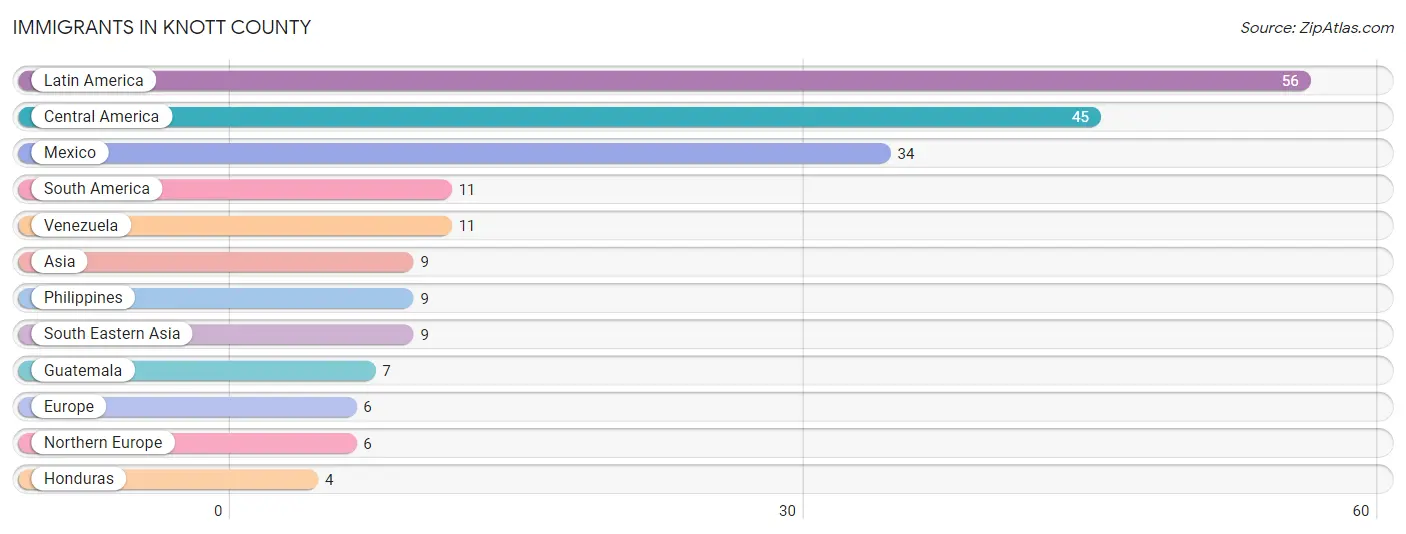
The most numerous immigrant groups reported in Knott County came from Latin America (56 | 0.4%), Central America (45 | 0.3%), Mexico (34 | 0.2%), South America (11 | 0.1%), and Venezuela (11 | 0.1%), together accounting for 1.1% of all Knott County residents.
| Immigration Origin | # Population | % Population |
| Asia | 9 | 0.1% |
| Central America | 45 | 0.3% |
| Europe | 6 | 0.0% |
| Guatemala | 7 | 0.1% |
| Honduras | 4 | 0.0% |
| Latin America | 56 | 0.4% |
| Mexico | 34 | 0.2% |
| Northern Europe | 6 | 0.0% |
| Philippines | 9 | 0.1% |
| South America | 11 | 0.1% |
| South Eastern Asia | 9 | 0.1% |
| Venezuela | 11 | 0.1% | View All 12 Rows |
Sex and Age in Knott County
Sex and Age in Knott County
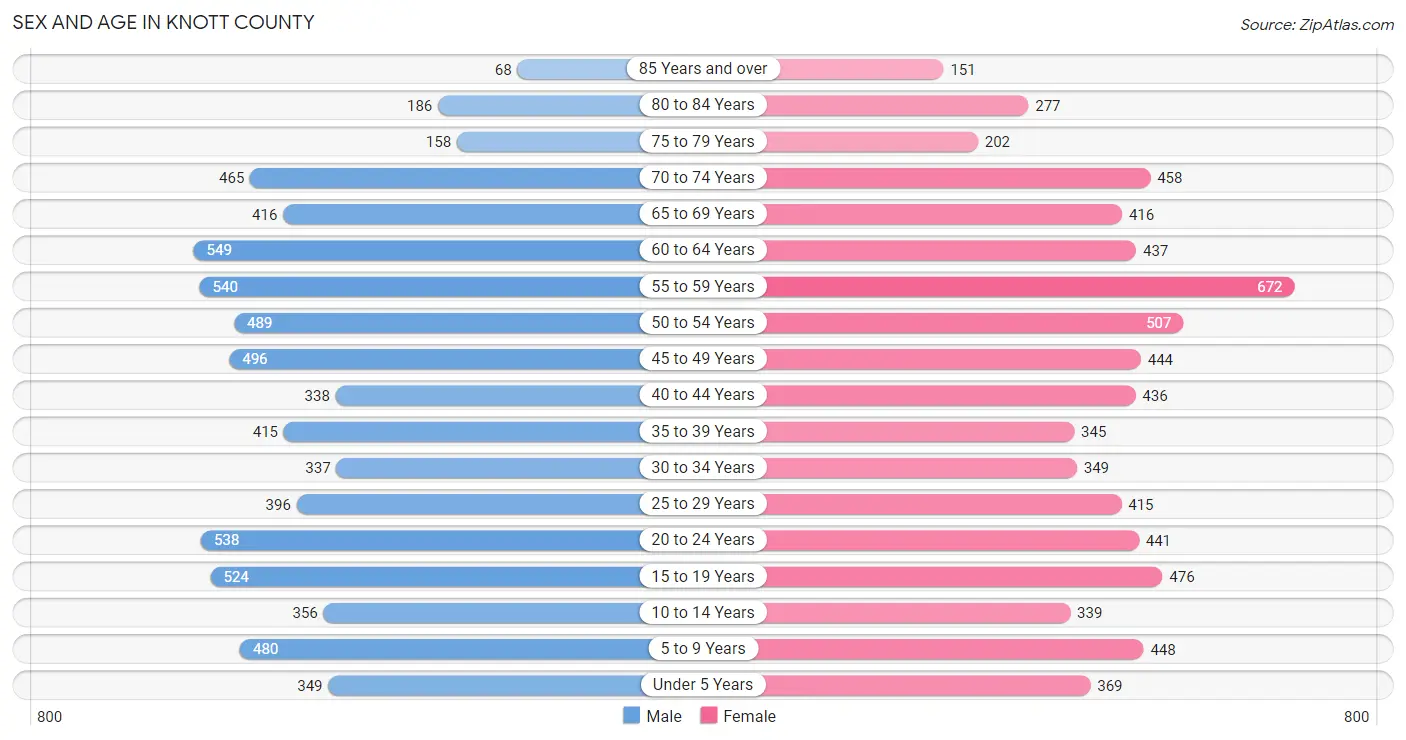
The most populous age groups in Knott County are 60 to 64 Years (549 | 7.7%) for men and 55 to 59 Years (672 | 9.4%) for women.
| Age Bracket | Male | Female |
| Under 5 Years | 349 (4.9%) | 369 (5.1%) |
| 5 to 9 Years | 480 (6.8%) | 448 (6.2%) |
| 10 to 14 Years | 356 (5.0%) | 339 (4.7%) |
| 15 to 19 Years | 524 (7.4%) | 476 (6.6%) |
| 20 to 24 Years | 538 (7.6%) | 441 (6.1%) |
| 25 to 29 Years | 396 (5.6%) | 415 (5.8%) |
| 30 to 34 Years | 337 (4.8%) | 349 (4.9%) |
| 35 to 39 Years | 415 (5.9%) | 345 (4.8%) |
| 40 to 44 Years | 338 (4.8%) | 436 (6.1%) |
| 45 to 49 Years | 496 (7.0%) | 444 (6.2%) |
| 50 to 54 Years | 489 (6.9%) | 507 (7.1%) |
| 55 to 59 Years | 540 (7.6%) | 672 (9.4%) |
| 60 to 64 Years | 549 (7.7%) | 437 (6.1%) |
| 65 to 69 Years | 416 (5.9%) | 416 (5.8%) |
| 70 to 74 Years | 465 (6.6%) | 458 (6.4%) |
| 75 to 79 Years | 158 (2.2%) | 202 (2.8%) |
| 80 to 84 Years | 186 (2.6%) | 277 (3.9%) |
| 85 Years and over | 68 (1.0%) | 151 (2.1%) |
| Total | 7,100 (100.0%) | 7,182 (100.0%) |
Families and Households in Knott County
Median Family Size in Knott County
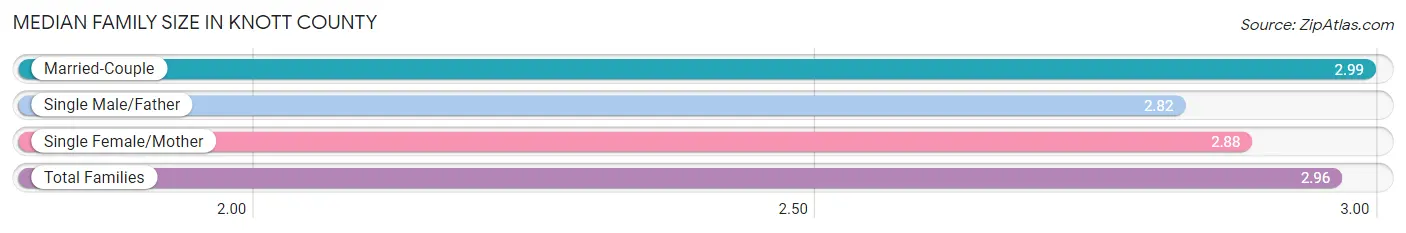
The median family size in Knott County is 2.96 persons per family, with married-couple families (2,649 | 69.8%) accounting for the largest median family size of 2.99 persons per family. On the other hand, single male/father families (283 | 7.5%) represent the smallest median family size with 2.82 persons per family.
| Family Type | # Families | Family Size |
| Married-Couple | 2,649 (69.8%) | 2.99 |
| Single Male/Father | 283 (7.5%) | 2.82 |
| Single Female/Mother | 864 (22.8%) | 2.88 |
| Total Families | 3,796 (100.0%) | 2.96 |
Median Household Size in Knott County
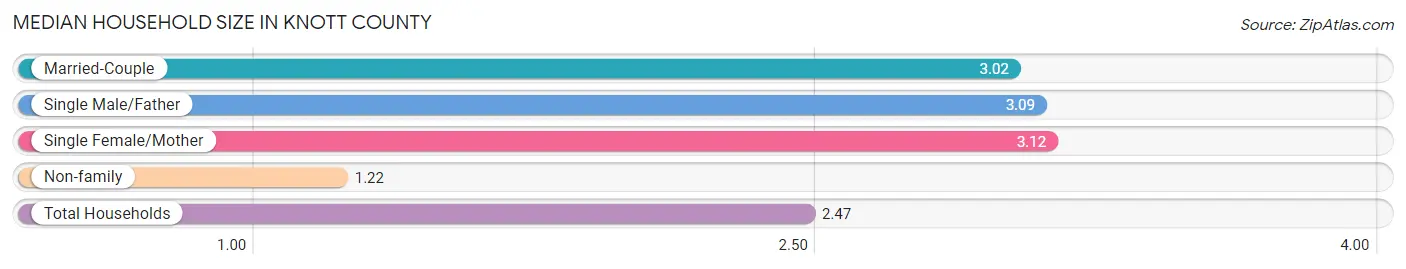
The median household size in Knott County is 2.47 persons per household, with single female/mother households (864 | 15.5%) accounting for the largest median household size of 3.12 persons per household. non-family households (1,767 | 31.8%) represent the smallest median household size with 1.22 persons per household.
| Household Type | # Households | Household Size |
| Married-Couple | 2,649 (47.6%) | 3.02 |
| Single Male/Father | 283 (5.1%) | 3.09 |
| Single Female/Mother | 864 (15.5%) | 3.12 |
| Non-family | 1,767 (31.8%) | 1.22 |
| Total Households | 5,563 (100.0%) | 2.47 |
Household Size by Marriage Status in Knott County
Out of a total of 5,563 households in Knott County, 3,796 (68.2%) are family households, while 1,767 (31.8%) are nonfamily households. The most numerous type of family households are 2-person households, comprising 1,772, and the most common type of nonfamily households are 1-person households, comprising 1,474.
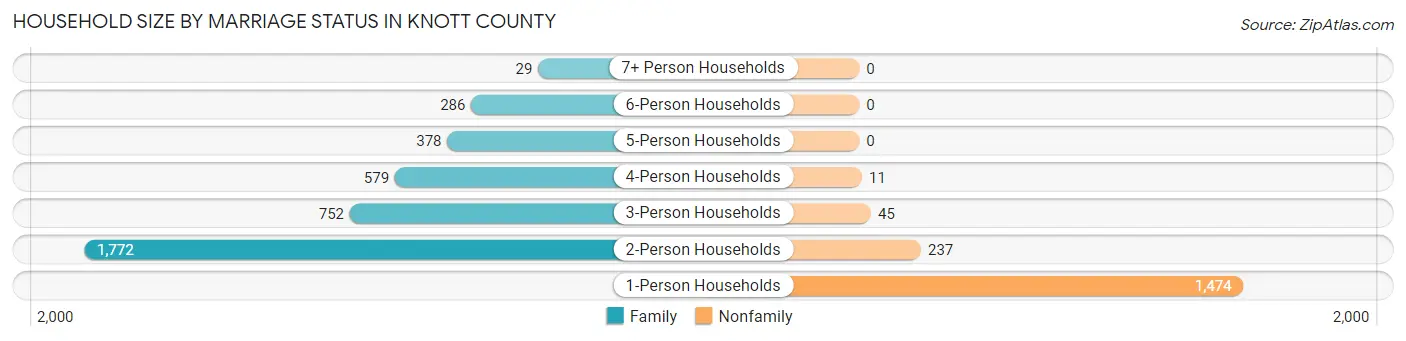
| Household Size | Family Households | Nonfamily Households |
| 1-Person Households | - | 1,474 (26.5%) |
| 2-Person Households | 1,772 (31.9%) | 237 (4.3%) |
| 3-Person Households | 752 (13.5%) | 45 (0.8%) |
| 4-Person Households | 579 (10.4%) | 11 (0.2%) |
| 5-Person Households | 378 (6.8%) | 0 (0.0%) |
| 6-Person Households | 286 (5.1%) | 0 (0.0%) |
| 7+ Person Households | 29 (0.5%) | 0 (0.0%) |
| Total | 3,796 (68.2%) | 1,767 (31.8%) |
Female Fertility in Knott County
Fertility by Age in Knott County
Average fertility rate in Knott County is 44.0 births per 1,000 women. Women in the age bracket of 20 to 34 years have the highest fertility rate with 100.0 births per 1,000 women. Women in the age bracket of 20 to 34 years acount for 88.3% of all women with births.
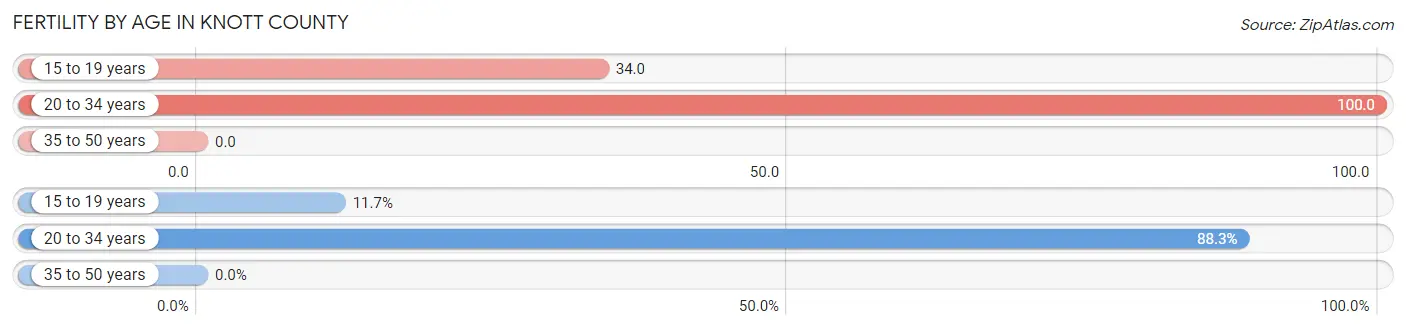
| Age Bracket | Women with Births | Births / 1,000 Women |
| 15 to 19 years | 16 (11.7%) | 34.0 |
| 20 to 34 years | 121 (88.3%) | 100.0 |
| 35 to 50 years | 0 (0.0%) | 0.0 |
| Total | 137 (100.0%) | 44.0 |
Fertility by Age by Marriage Status in Knott County
50.4% of women with births (137) in Knott County are married. The highest percentage of unmarried women with births falls into 15 to 19 years age bracket with 100.0% of them unmarried at the time of birth, while the lowest percentage of unmarried women with births belong to 20 to 34 years age bracket with 43.0% of them unmarried.
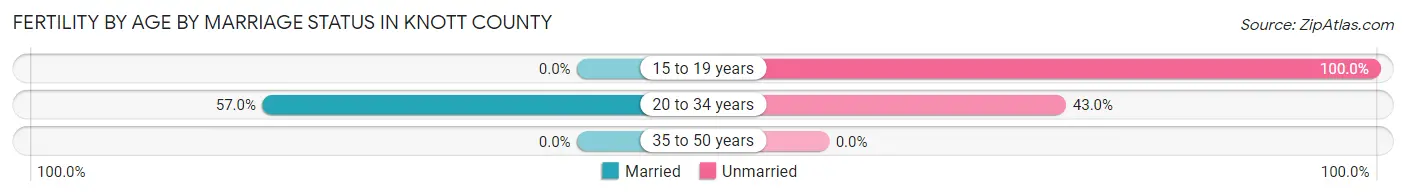
| Age Bracket | Married | Unmarried |
| 15 to 19 years | 0 (0.0%) | 16 (100.0%) |
| 20 to 34 years | 69 (57.0%) | 52 (43.0%) |
| 35 to 50 years | 0 (0.0%) | 0 (0.0%) |
| Total | 69 (50.4%) | 68 (49.6%) |
Fertility by Education in Knott County
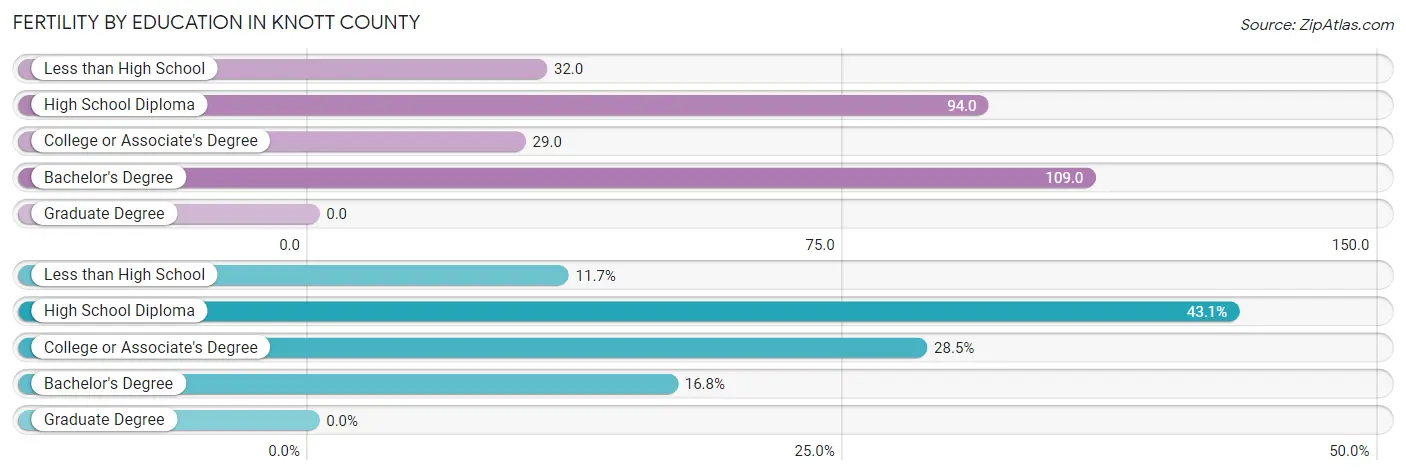
| Educational Attainment | Women with Births | Births / 1,000 Women |
| Less than High School | 16 (11.7%) | 32.0 |
| High School Diploma | 59 (43.1%) | 94.0 |
| College or Associate's Degree | 39 (28.5%) | 29.0 |
| Bachelor's Degree | 23 (16.8%) | 109.0 |
| Graduate Degree | 0 (0.0%) | 0.0 |
| Total | 137 (100.0%) | 44.0 |
Fertility by Education by Marriage Status in Knott County
49.6% of women with births in Knott County are unmarried. Women with the educational attainment of bachelor's degree are most likely to be married with 100.0% of them married at childbirth, while women with the educational attainment of less than high school are least likely to be married with 100.0% of them unmarried at childbirth.
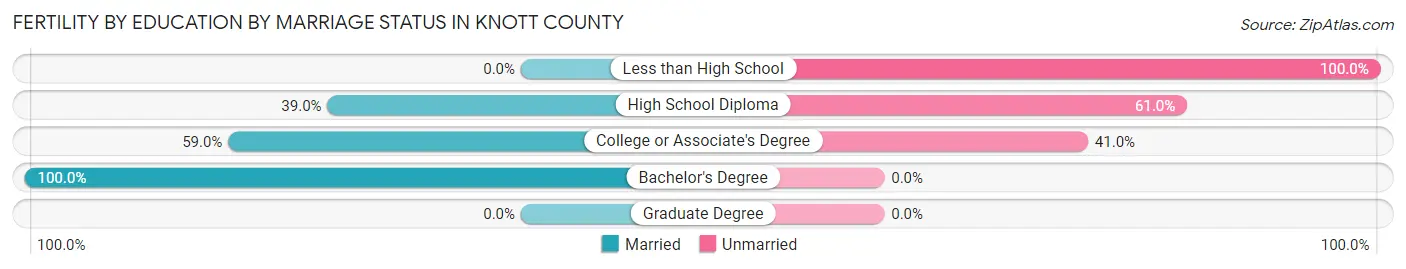
| Educational Attainment | Married | Unmarried |
| Less than High School | 0 (0.0%) | 16 (100.0%) |
| High School Diploma | 23 (39.0%) | 36 (61.0%) |
| College or Associate's Degree | 23 (59.0%) | 16 (41.0%) |
| Bachelor's Degree | 23 (100.0%) | 0 (0.0%) |
| Graduate Degree | 0 (0.0%) | 0 (0.0%) |
| Total | 69 (50.4%) | 68 (49.6%) |
Employment Characteristics in Knott County
Employment by Class of Employer in Knott County
Among the 4,104 employed individuals in Knott County, private company employees (2,414 | 58.8%), not-for-profit organizations (562 | 13.7%), and state government employees (453 | 11.0%) make up the most common classes of employment.
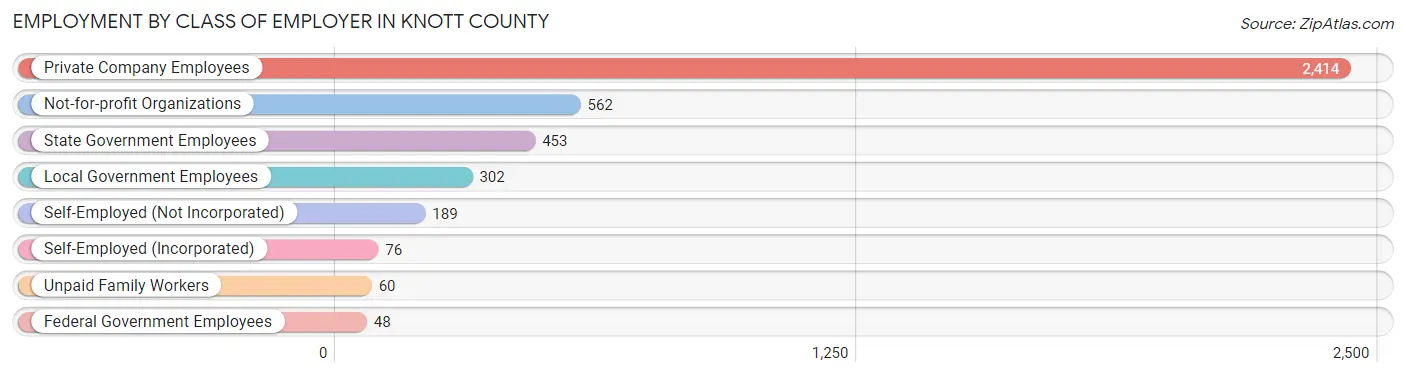
| Employer Class | # Employees | % Employees |
| Private Company Employees | 2,414 | 58.8% |
| Self-Employed (Incorporated) | 76 | 1.8% |
| Self-Employed (Not Incorporated) | 189 | 4.6% |
| Not-for-profit Organizations | 562 | 13.7% |
| Local Government Employees | 302 | 7.4% |
| State Government Employees | 453 | 11.0% |
| Federal Government Employees | 48 | 1.2% |
| Unpaid Family Workers | 60 | 1.5% |
| Total | 4,104 | 100.0% |
Employment Status by Age in Knott County
According to the labor force statistics for Knott County, out of the total population over 16 years of age (11,795), 40.0% or 4,718 individuals are in the labor force, with 10.6% or 500 of them unemployed. The age group with the highest labor force participation rate is 30 to 34 years, with 75.8% or 520 individuals in the labor force. Within the labor force, the 20 to 24 years age range has the highest percentage of unemployed individuals, with 20.7% or 109 of them being unemployed.
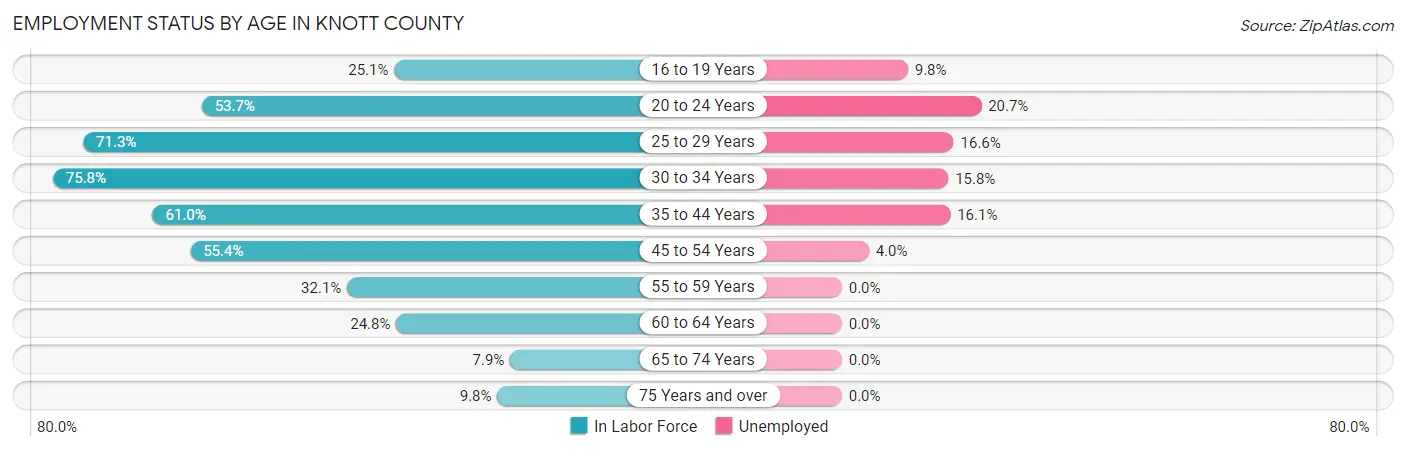
| Age Bracket | In Labor Force | Unemployed |
| 16 to 19 Years | 214 (25.1%) | 21 (9.8%) |
| 20 to 24 Years | 526 (53.7%) | 109 (20.7%) |
| 25 to 29 Years | 578 (71.3%) | 96 (16.6%) |
| 30 to 34 Years | 520 (75.8%) | 82 (15.8%) |
| 35 to 44 Years | 936 (61.0%) | 151 (16.1%) |
| 45 to 54 Years | 1,073 (55.4%) | 43 (4.0%) |
| 55 to 59 Years | 389 (32.1%) | 0 (0.0%) |
| 60 to 64 Years | 245 (24.8%) | 0 (0.0%) |
| 65 to 74 Years | 139 (7.9%) | 0 (0.0%) |
| 75 Years and over | 102 (9.8%) | 0 (0.0%) |
| Total | 4,718 (40.0%) | 500 (10.6%) |
Employment Status by Educational Attainment in Knott County
According to labor force statistics for Knott County, 52.2% of individuals (3,740) out of the total population between 25 and 64 years of age (7,165) are in the labor force, with 9.9% or 370 of them being unemployed. The group with the highest labor force participation rate are those with the educational attainment of bachelor's degree or higher, with 79.8% or 1,045 individuals in the labor force. Within the labor force, individuals with high school diploma education have the highest percentage of unemployment, with 17.2% or 154 of them being unemployed.
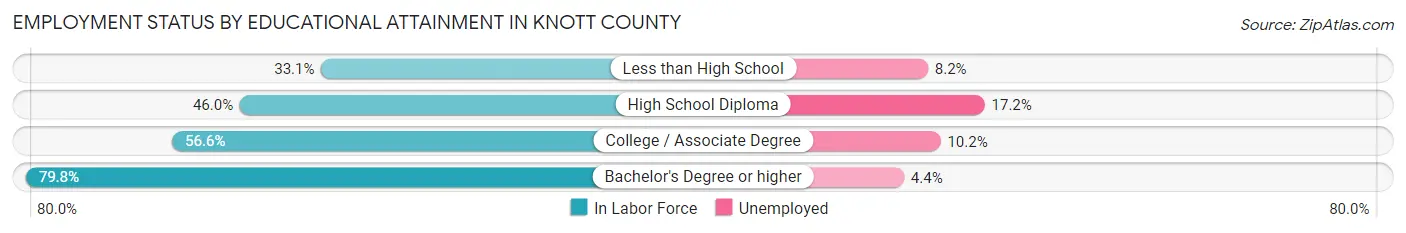
| Educational Attainment | In Labor Force | Unemployed |
| Less than High School | 585 (33.1%) | 145 (8.2%) |
| High School Diploma | 894 (46.0%) | 334 (17.2%) |
| College / Associate Degree | 1,214 (56.6%) | 219 (10.2%) |
| Bachelor's Degree or higher | 1,045 (79.8%) | 58 (4.4%) |
| Total | 3,740 (52.2%) | 709 (9.9%) |
Employment Occupations by Sex in Knott County
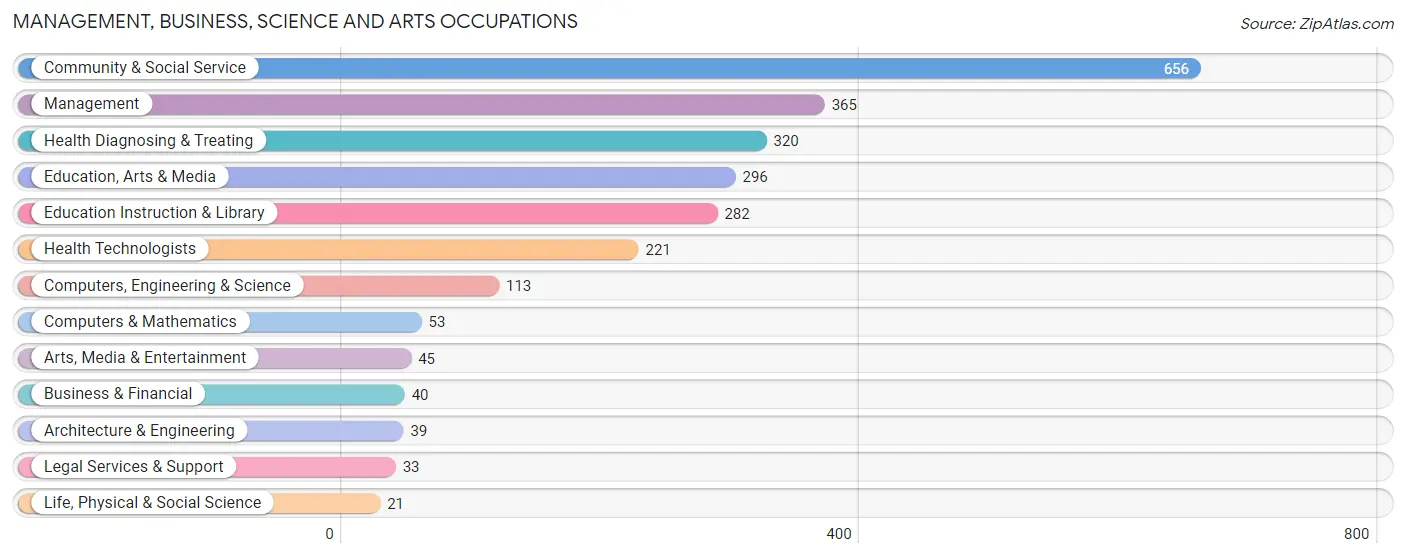
Management, Business, Science and Arts Occupations
The most common Management, Business, Science and Arts occupations in Knott County are Community & Social Service (656 | 15.5%), Management (365 | 8.6%), Health Diagnosing & Treating (320 | 7.6%), Education, Arts & Media (296 | 7.0%), and Education Instruction & Library (282 | 6.7%).
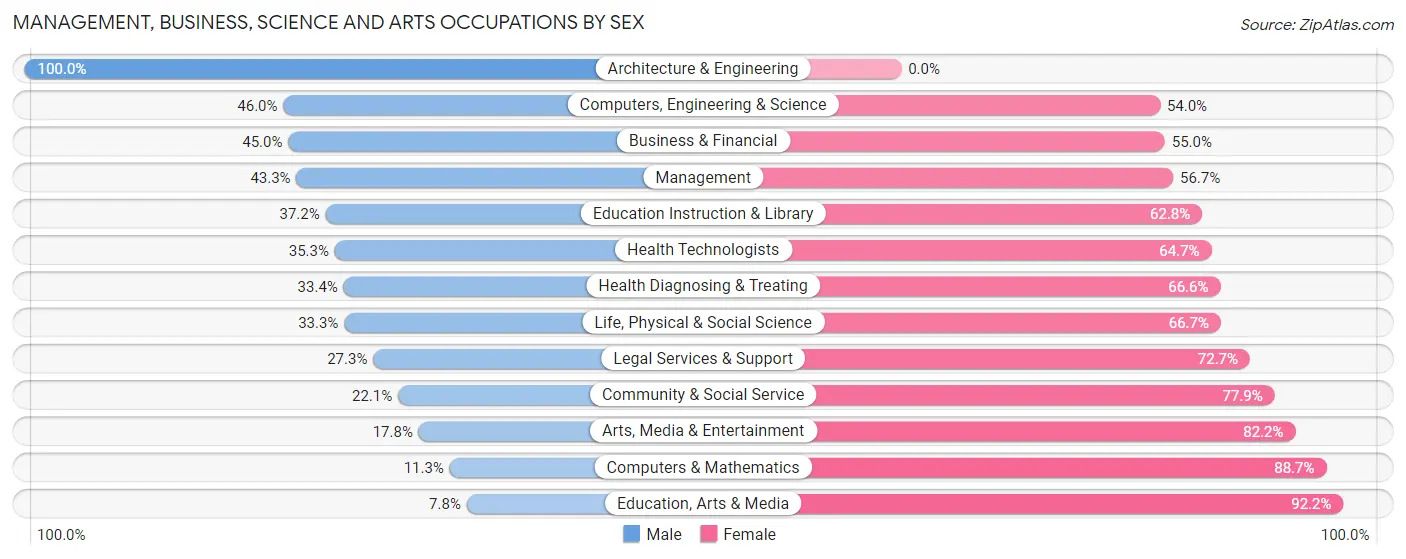
Management, Business, Science and Arts Occupations by Sex
Within the Management, Business, Science and Arts occupations in Knott County, the most male-oriented occupations are Architecture & Engineering (100.0%), Computers, Engineering & Science (46.0%), and Business & Financial (45.0%), while the most female-oriented occupations are Education, Arts & Media (92.2%), Computers & Mathematics (88.7%), and Arts, Media & Entertainment (82.2%).
| Occupation | Male | Female |
| Management | 158 (43.3%) | 207 (56.7%) |
| Business & Financial | 18 (45.0%) | 22 (55.0%) |
| Computers, Engineering & Science | 52 (46.0%) | 61 (54.0%) |
| Computers & Mathematics | 6 (11.3%) | 47 (88.7%) |
| Architecture & Engineering | 39 (100.0%) | 0 (0.0%) |
| Life, Physical & Social Science | 7 (33.3%) | 14 (66.7%) |
| Community & Social Service | 145 (22.1%) | 511 (77.9%) |
| Education, Arts & Media | 23 (7.8%) | 273 (92.2%) |
| Legal Services & Support | 9 (27.3%) | 24 (72.7%) |
| Education Instruction & Library | 105 (37.2%) | 177 (62.8%) |
| Arts, Media & Entertainment | 8 (17.8%) | 37 (82.2%) |
| Health Diagnosing & Treating | 107 (33.4%) | 213 (66.6%) |
| Health Technologists | 78 (35.3%) | 143 (64.7%) |
| Total (Category) | 480 (32.1%) | 1,014 (67.9%) |
| Total (Overall) | 2,159 (51.2%) | 2,060 (48.8%) |
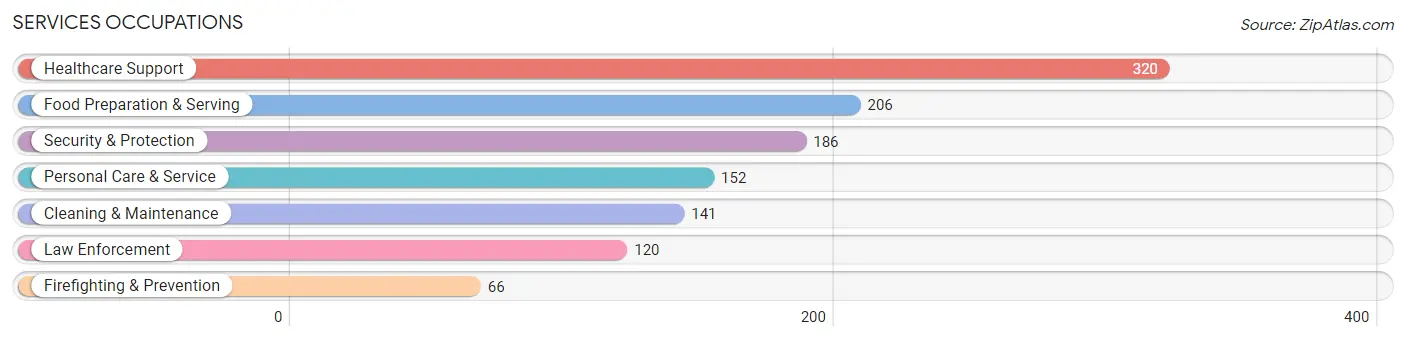
Services Occupations
The most common Services occupations in Knott County are Healthcare Support (320 | 7.6%), Food Preparation & Serving (206 | 4.9%), Security & Protection (186 | 4.4%), Personal Care & Service (152 | 3.6%), and Cleaning & Maintenance (141 | 3.3%).
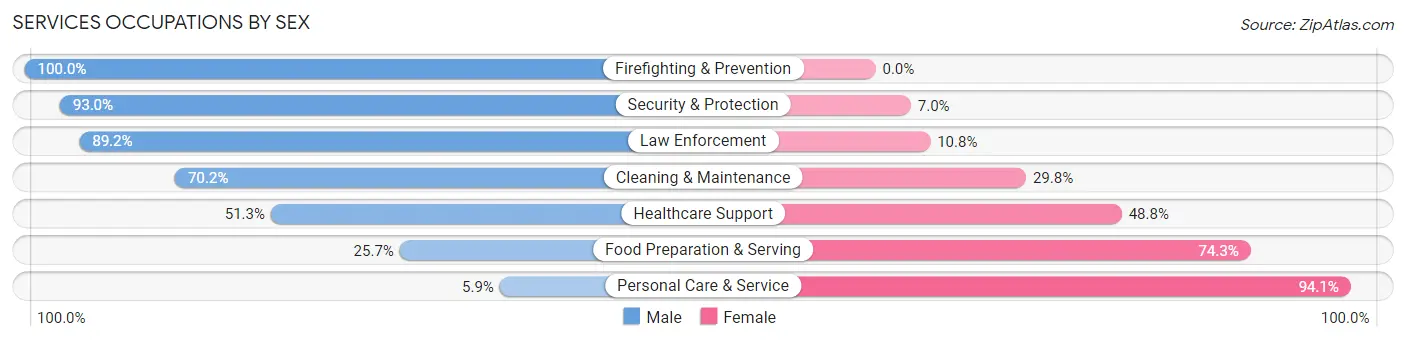
Services Occupations by Sex
Within the Services occupations in Knott County, the most male-oriented occupations are Firefighting & Prevention (100.0%), Security & Protection (93.0%), and Law Enforcement (89.2%), while the most female-oriented occupations are Personal Care & Service (94.1%), Food Preparation & Serving (74.3%), and Healthcare Support (48.7%).
| Occupation | Male | Female |
| Healthcare Support | 164 (51.2%) | 156 (48.7%) |
| Security & Protection | 173 (93.0%) | 13 (7.0%) |
| Firefighting & Prevention | 66 (100.0%) | 0 (0.0%) |
| Law Enforcement | 107 (89.2%) | 13 (10.8%) |
| Food Preparation & Serving | 53 (25.7%) | 153 (74.3%) |
| Cleaning & Maintenance | 99 (70.2%) | 42 (29.8%) |
| Personal Care & Service | 9 (5.9%) | 143 (94.1%) |
| Total (Category) | 498 (49.5%) | 507 (50.4%) |
| Total (Overall) | 2,159 (51.2%) | 2,060 (48.8%) |
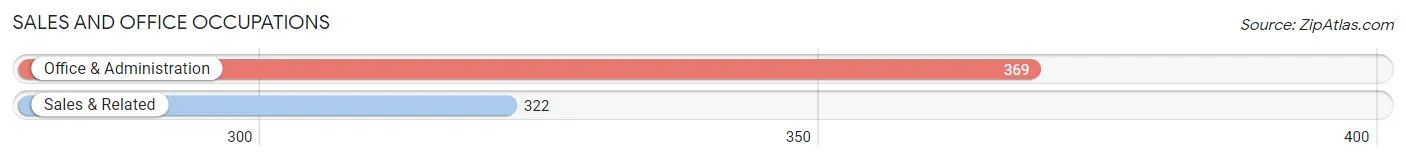
Sales and Office Occupations
The most common Sales and Office occupations in Knott County are Office & Administration (369 | 8.7%), and Sales & Related (322 | 7.6%).
Sales and Office Occupations by Sex
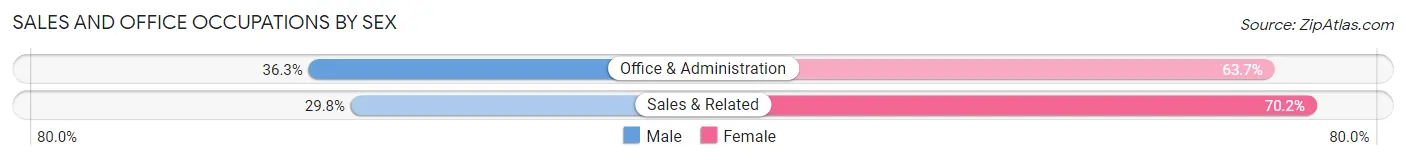
| Occupation | Male | Female |
| Sales & Related | 96 (29.8%) | 226 (70.2%) |
| Office & Administration | 134 (36.3%) | 235 (63.7%) |
| Total (Category) | 230 (33.3%) | 461 (66.7%) |
| Total (Overall) | 2,159 (51.2%) | 2,060 (48.8%) |
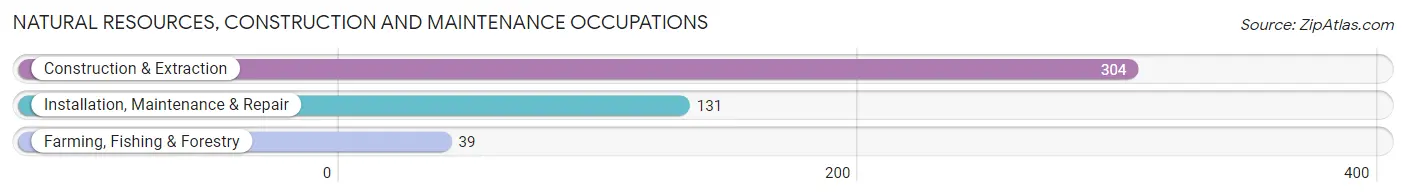
Natural Resources, Construction and Maintenance Occupations
The most common Natural Resources, Construction and Maintenance occupations in Knott County are Construction & Extraction (304 | 7.2%), Installation, Maintenance & Repair (131 | 3.1%), and Farming, Fishing & Forestry (39 | 0.9%).
Natural Resources, Construction and Maintenance Occupations by Sex
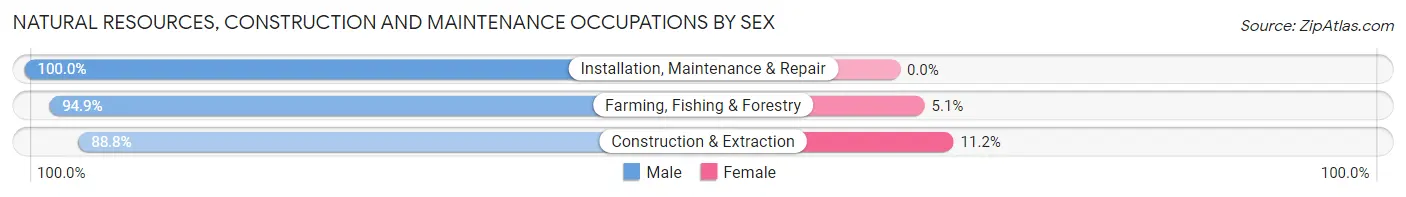
| Occupation | Male | Female |
| Farming, Fishing & Forestry | 37 (94.9%) | 2 (5.1%) |
| Construction & Extraction | 270 (88.8%) | 34 (11.2%) |
| Installation, Maintenance & Repair | 131 (100.0%) | 0 (0.0%) |
| Total (Category) | 438 (92.4%) | 36 (7.6%) |
| Total (Overall) | 2,159 (51.2%) | 2,060 (48.8%) |
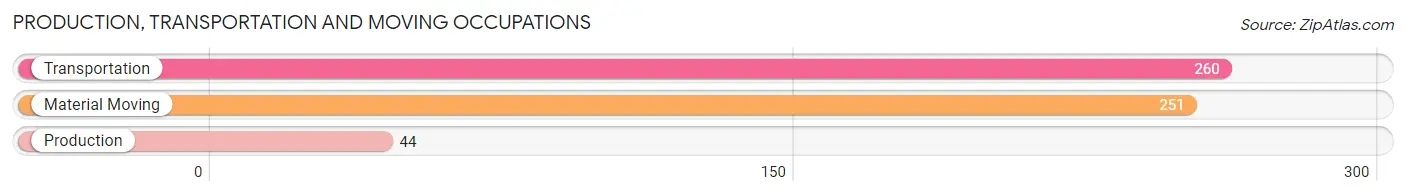
Production, Transportation and Moving Occupations
The most common Production, Transportation and Moving occupations in Knott County are Transportation (260 | 6.2%), Material Moving (251 | 5.9%), and Production (44 | 1.0%).
Production, Transportation and Moving Occupations by Sex
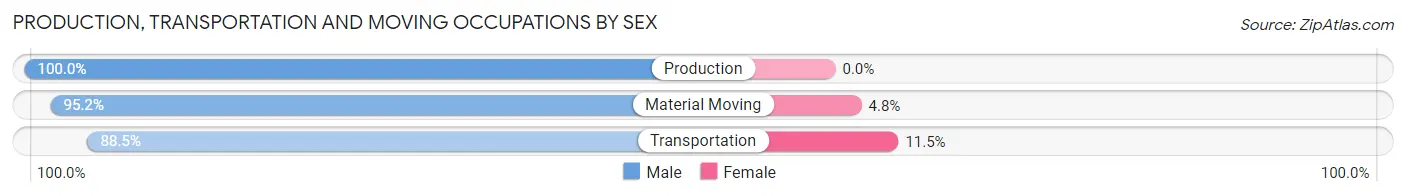
| Occupation | Male | Female |
| Production | 44 (100.0%) | 0 (0.0%) |
| Transportation | 230 (88.5%) | 30 (11.5%) |
| Material Moving | 239 (95.2%) | 12 (4.8%) |
| Total (Category) | 513 (92.4%) | 42 (7.6%) |
| Total (Overall) | 2,159 (51.2%) | 2,060 (48.8%) |
Employment Industries by Sex in Knott County
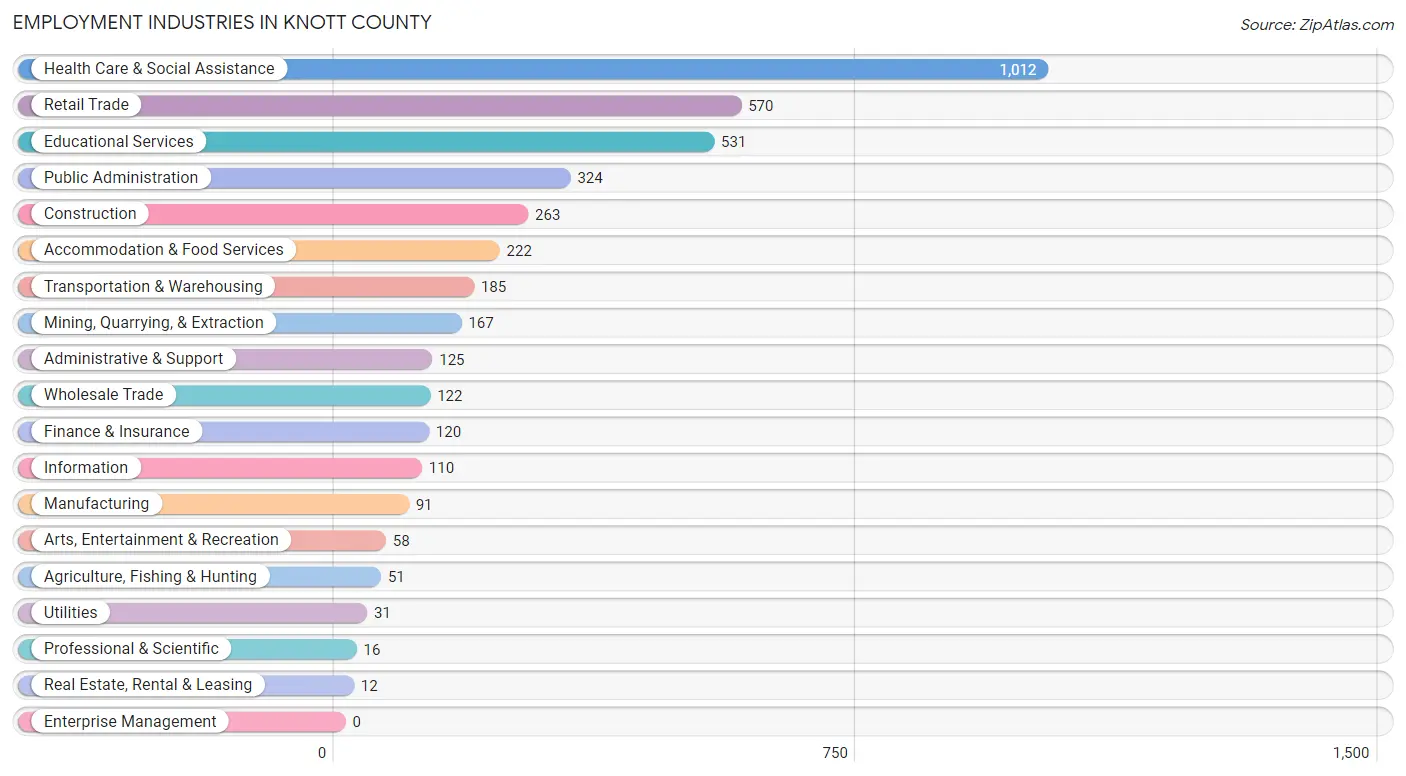
Employment Industries in Knott County
The major employment industries in Knott County include Health Care & Social Assistance (1,012 | 24.0%), Retail Trade (570 | 13.5%), Educational Services (531 | 12.6%), Public Administration (324 | 7.7%), and Construction (263 | 6.2%).
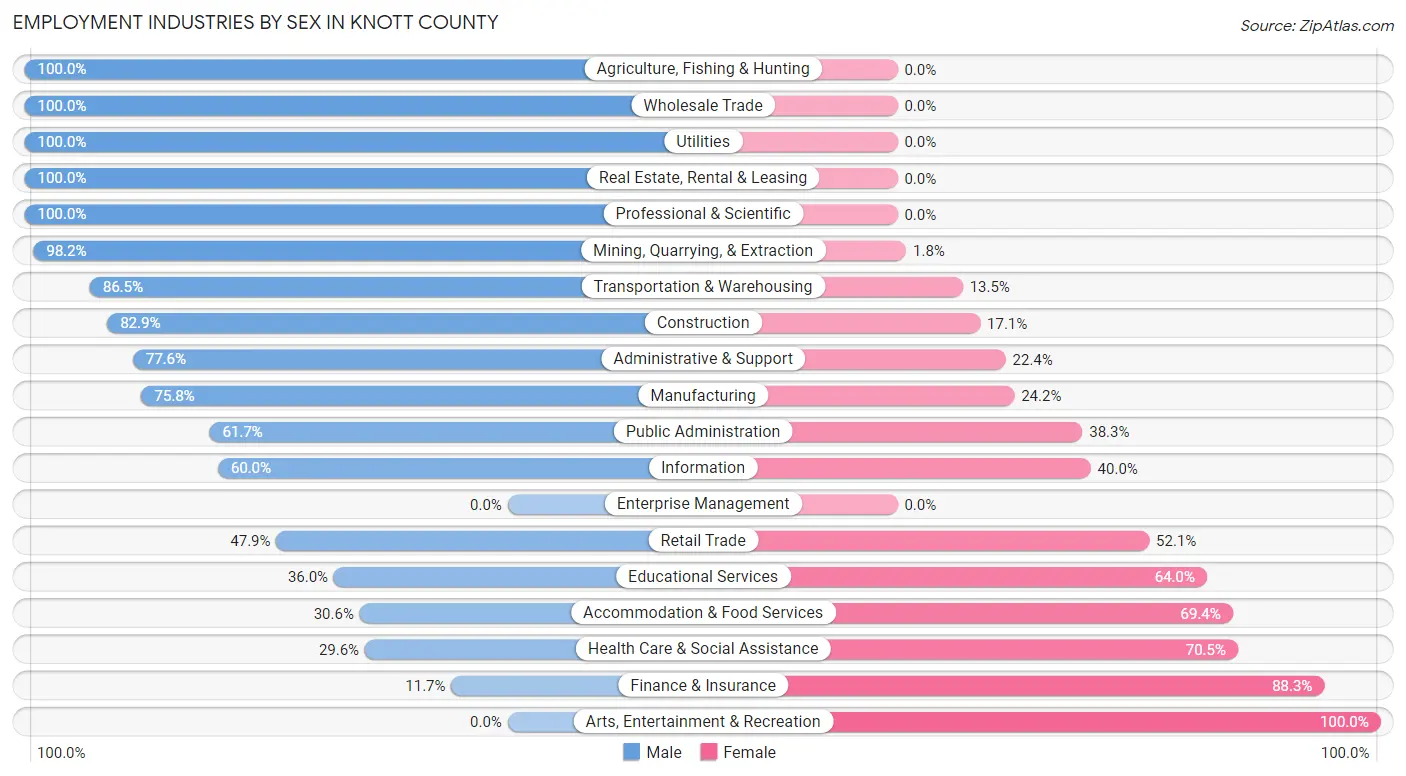
Employment Industries by Sex in Knott County
The Knott County industries that see more men than women are Agriculture, Fishing & Hunting (100.0%), Wholesale Trade (100.0%), and Utilities (100.0%), whereas the industries that tend to have a higher number of women are Arts, Entertainment & Recreation (100.0%), Finance & Insurance (88.3%), and Health Care & Social Assistance (70.5%).
| Industry | Male | Female |
| Agriculture, Fishing & Hunting | 51 (100.0%) | 0 (0.0%) |
| Mining, Quarrying, & Extraction | 164 (98.2%) | 3 (1.8%) |
| Construction | 218 (82.9%) | 45 (17.1%) |
| Manufacturing | 69 (75.8%) | 22 (24.2%) |
| Wholesale Trade | 122 (100.0%) | 0 (0.0%) |
| Retail Trade | 273 (47.9%) | 297 (52.1%) |
| Transportation & Warehousing | 160 (86.5%) | 25 (13.5%) |
| Utilities | 31 (100.0%) | 0 (0.0%) |
| Information | 66 (60.0%) | 44 (40.0%) |
| Finance & Insurance | 14 (11.7%) | 106 (88.3%) |
| Real Estate, Rental & Leasing | 12 (100.0%) | 0 (0.0%) |
| Professional & Scientific | 16 (100.0%) | 0 (0.0%) |
| Enterprise Management | 0 (0.0%) | 0 (0.0%) |
| Administrative & Support | 97 (77.6%) | 28 (22.4%) |
| Educational Services | 191 (36.0%) | 340 (64.0%) |
| Health Care & Social Assistance | 299 (29.5%) | 713 (70.5%) |
| Arts, Entertainment & Recreation | 0 (0.0%) | 58 (100.0%) |
| Accommodation & Food Services | 68 (30.6%) | 154 (69.4%) |
| Public Administration | 200 (61.7%) | 124 (38.3%) |
| Total | 2,159 (51.2%) | 2,060 (48.8%) |
Education in Knott County
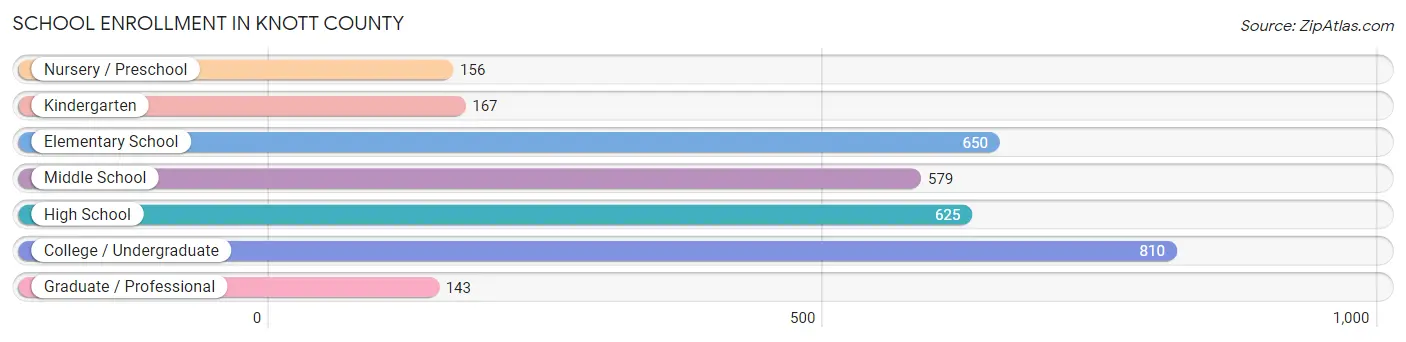
School Enrollment in Knott County
The most common levels of schooling among the 3,130 students in Knott County are college / undergraduate (810 | 25.9%), elementary school (650 | 20.8%), and high school (625 | 20.0%).
| School Level | # Students | % Students |
| Nursery / Preschool | 156 | 5.0% |
| Kindergarten | 167 | 5.3% |
| Elementary School | 650 | 20.8% |
| Middle School | 579 | 18.5% |
| High School | 625 | 20.0% |
| College / Undergraduate | 810 | 25.9% |
| Graduate / Professional | 143 | 4.6% |
| Total | 3,130 | 100.0% |
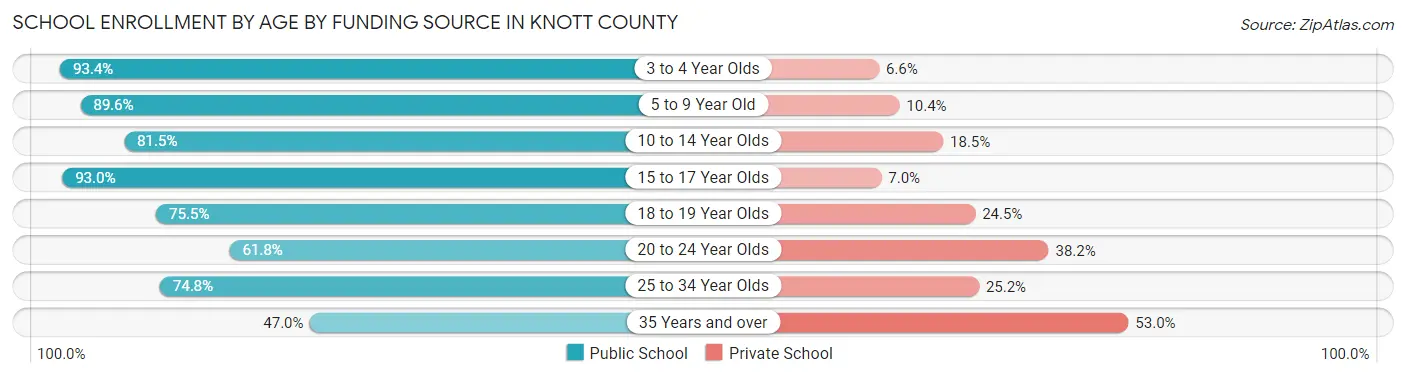
School Enrollment by Age by Funding Source in Knott County
Out of a total of 3,130 students who are enrolled in schools in Knott County, 604 (19.3%) attend a private institution, while the remaining 2,526 (80.7%) are enrolled in public schools. The age group of 35 years and over has the highest likelihood of being enrolled in private schools, with 61 (53.0% in the age bracket) enrolled. Conversely, the age group of 3 to 4 year olds has the lowest likelihood of being enrolled in a private school, with 85 (93.4% in the age bracket) attending a public institution.
| Age Bracket | Public School | Private School |
| 3 to 4 Year Olds | 85 (93.4%) | 6 (6.6%) |
| 5 to 9 Year Old | 708 (89.6%) | 82 (10.4%) |
| 10 to 14 Year Olds | 563 (81.5%) | 128 (18.5%) |
| 15 to 17 Year Olds | 477 (93.0%) | 36 (7.0%) |
| 18 to 19 Year Olds | 265 (75.5%) | 86 (24.5%) |
| 20 to 24 Year Olds | 282 (61.8%) | 174 (38.2%) |
| 25 to 34 Year Olds | 92 (74.8%) | 31 (25.2%) |
| 35 Years and over | 54 (47.0%) | 61 (53.0%) |
| Total | 2,526 (80.7%) | 604 (19.3%) |
Educational Attainment by Field of Study in Knott County
Education (430 | 23.5%), science & technology (312 | 17.0%), business (247 | 13.5%), arts & humanities (220 | 12.0%), and bio, nature & agricultural (118 | 6.4%) are the most common fields of study among 1,833 individuals in Knott County who have obtained a bachelor's degree or higher.
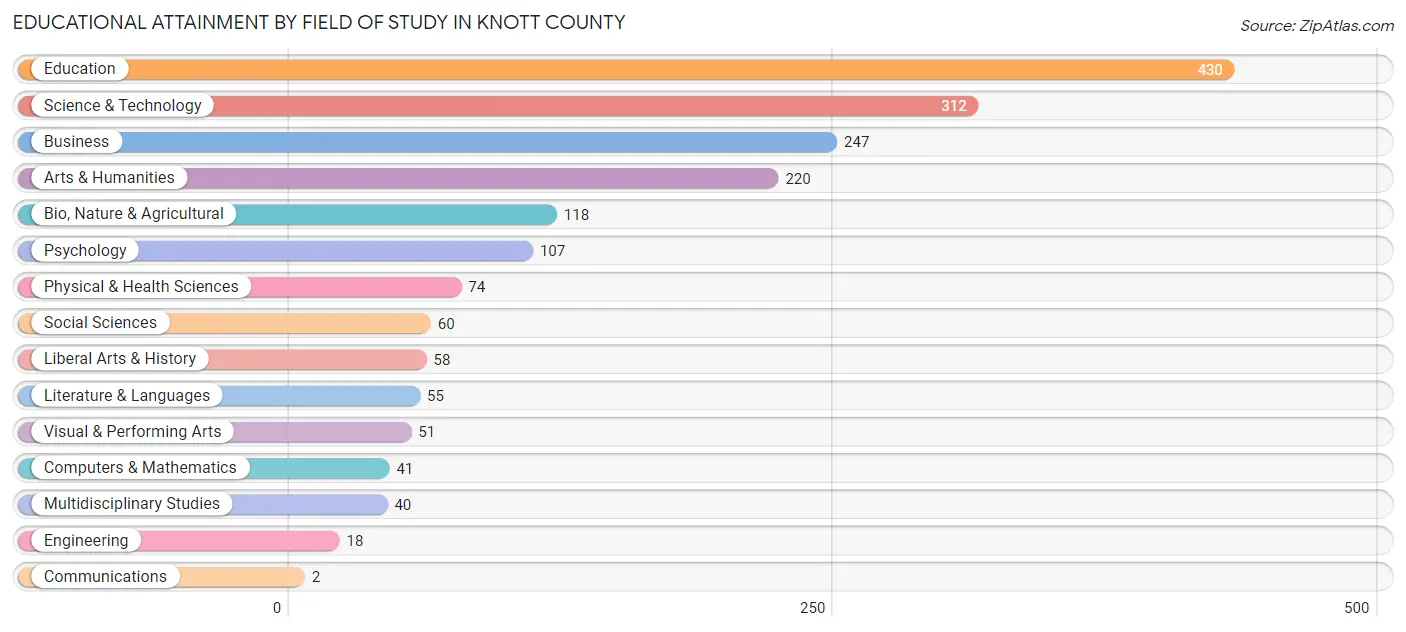
| Field of Study | # Graduates | % Graduates |
| Computers & Mathematics | 41 | 2.2% |
| Bio, Nature & Agricultural | 118 | 6.4% |
| Physical & Health Sciences | 74 | 4.0% |
| Psychology | 107 | 5.8% |
| Social Sciences | 60 | 3.3% |
| Engineering | 18 | 1.0% |
| Multidisciplinary Studies | 40 | 2.2% |
| Science & Technology | 312 | 17.0% |
| Business | 247 | 13.5% |
| Education | 430 | 23.5% |
| Literature & Languages | 55 | 3.0% |
| Liberal Arts & History | 58 | 3.2% |
| Visual & Performing Arts | 51 | 2.8% |
| Communications | 2 | 0.1% |
| Arts & Humanities | 220 | 12.0% |
| Total | 1,833 | 100.0% |
Transportation & Commute in Knott County
Vehicle Availability by Sex in Knott County
The most prevalent vehicle ownership categories in Knott County are males with 2 vehicles (1,023, accounting for 50.0%) and females with 2 vehicles (959, making up 52.7%).
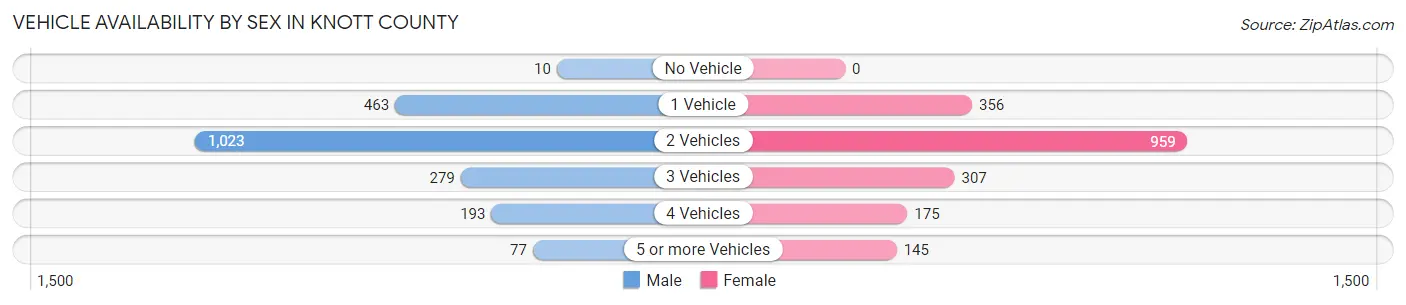
| Vehicles Available | Male | Female |
| No Vehicle | 10 (0.5%) | 0 (0.0%) |
| 1 Vehicle | 463 (22.6%) | 356 (18.3%) |
| 2 Vehicles | 1,023 (50.0%) | 959 (49.4%) |
| 3 Vehicles | 279 (13.6%) | 307 (15.8%) |
| 4 Vehicles | 193 (9.4%) | 175 (9.0%) |
| 5 or more Vehicles | 77 (3.8%) | 145 (7.5%) |
| Total | 2,045 (100.0%) | 1,942 (100.0%) |
Commute Time in Knott County
The most frequently occuring commute durations in Knott County are 30 to 34 minutes (603 commuters, 15.7%), 10 to 14 minutes (570 commuters, 14.9%), and 15 to 19 minutes (518 commuters, 13.5%).
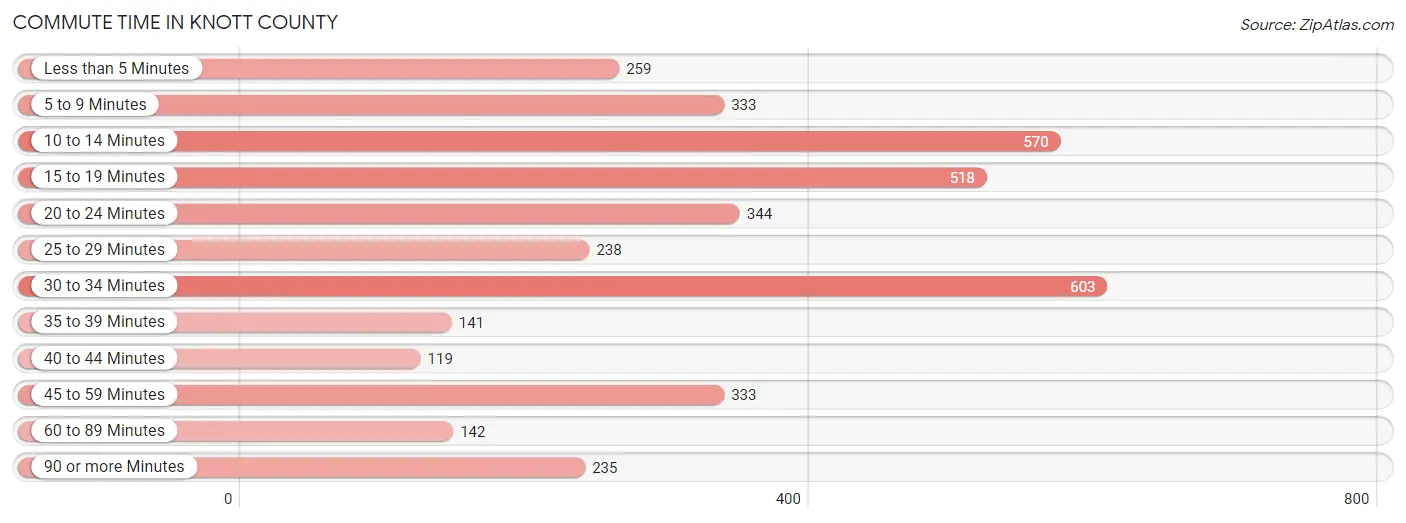
| Commute Time | # Commuters | % Commuters |
| Less than 5 Minutes | 259 | 6.8% |
| 5 to 9 Minutes | 333 | 8.7% |
| 10 to 14 Minutes | 570 | 14.9% |
| 15 to 19 Minutes | 518 | 13.5% |
| 20 to 24 Minutes | 344 | 9.0% |
| 25 to 29 Minutes | 238 | 6.2% |
| 30 to 34 Minutes | 603 | 15.7% |
| 35 to 39 Minutes | 141 | 3.7% |
| 40 to 44 Minutes | 119 | 3.1% |
| 45 to 59 Minutes | 333 | 8.7% |
| 60 to 89 Minutes | 142 | 3.7% |
| 90 or more Minutes | 235 | 6.1% |
Commute Time by Sex in Knott County
The most common commute times in Knott County are 30 to 34 minutes (316 commuters, 16.1%) for males and 15 to 19 minutes (386 commuters, 20.7%) for females.
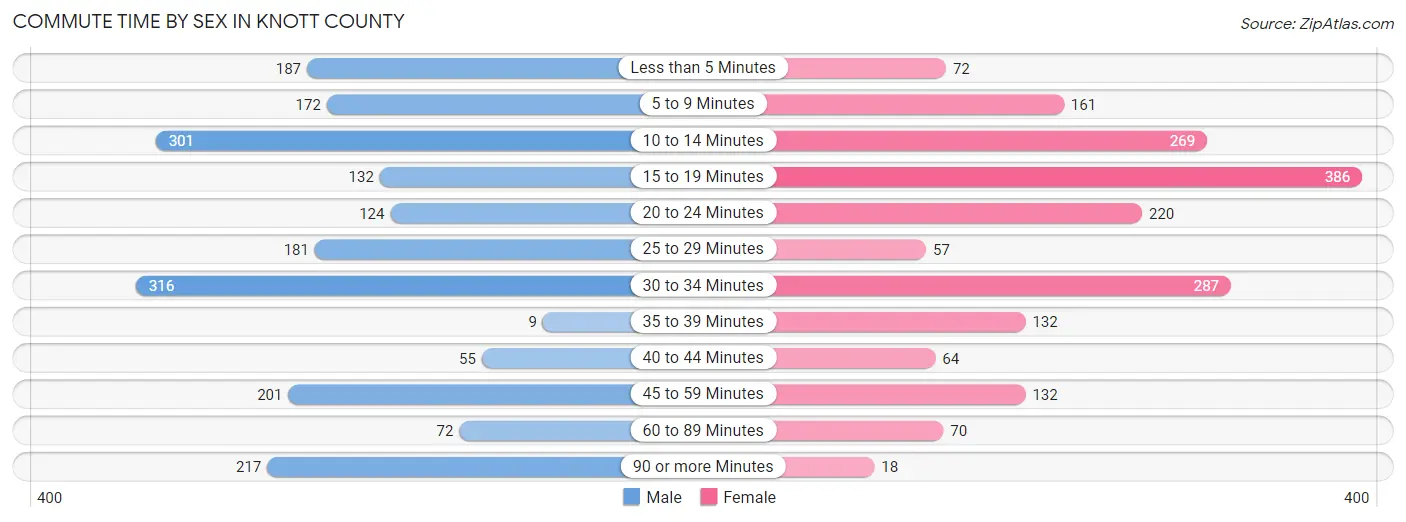
| Commute Time | Male | Female |
| Less than 5 Minutes | 187 (9.5%) | 72 (3.8%) |
| 5 to 9 Minutes | 172 (8.7%) | 161 (8.6%) |
| 10 to 14 Minutes | 301 (15.3%) | 269 (14.4%) |
| 15 to 19 Minutes | 132 (6.7%) | 386 (20.7%) |
| 20 to 24 Minutes | 124 (6.3%) | 220 (11.8%) |
| 25 to 29 Minutes | 181 (9.2%) | 57 (3.0%) |
| 30 to 34 Minutes | 316 (16.1%) | 287 (15.4%) |
| 35 to 39 Minutes | 9 (0.5%) | 132 (7.1%) |
| 40 to 44 Minutes | 55 (2.8%) | 64 (3.4%) |
| 45 to 59 Minutes | 201 (10.2%) | 132 (7.1%) |
| 60 to 89 Minutes | 72 (3.7%) | 70 (3.7%) |
| 90 or more Minutes | 217 (11.0%) | 18 (1.0%) |
Time of Departure to Work by Sex in Knott County
The most frequent times of departure to work in Knott County are 4:00 PM to 11:59 PM (279, 14.2%) for males and 7:00 AM to 7:29 AM (371, 19.9%) for females.
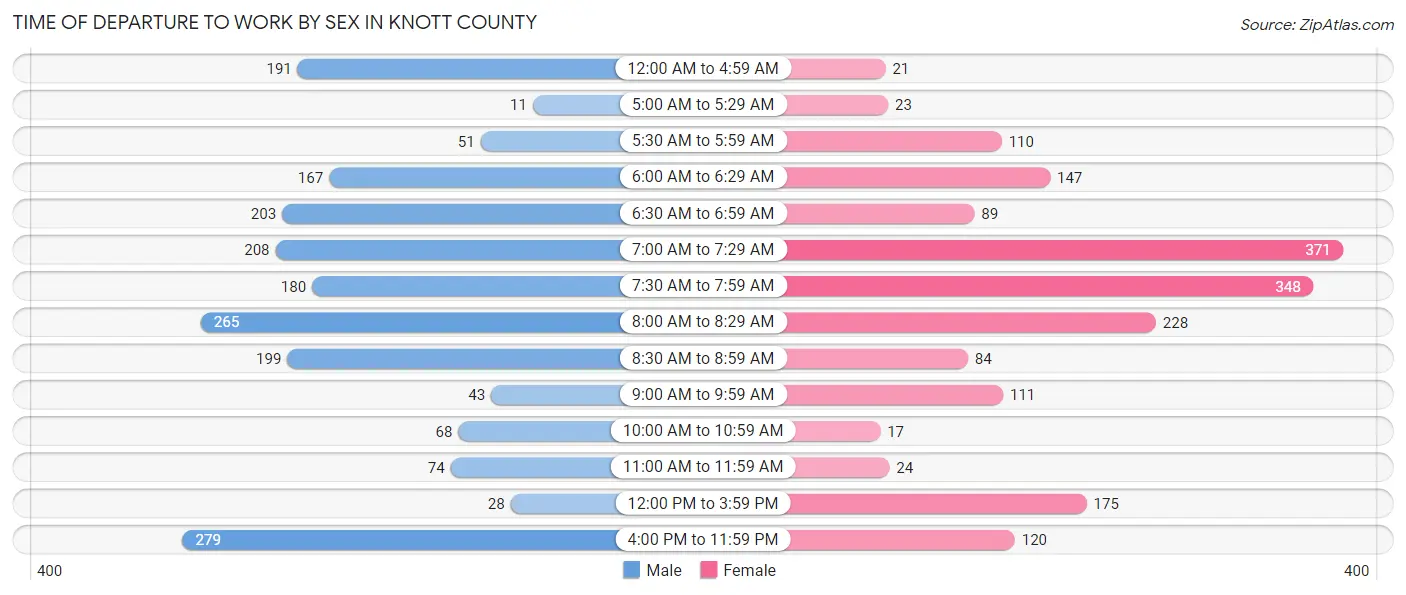
| Time of Departure | Male | Female |
| 12:00 AM to 4:59 AM | 191 (9.7%) | 21 (1.1%) |
| 5:00 AM to 5:29 AM | 11 (0.6%) | 23 (1.2%) |
| 5:30 AM to 5:59 AM | 51 (2.6%) | 110 (5.9%) |
| 6:00 AM to 6:29 AM | 167 (8.5%) | 147 (7.9%) |
| 6:30 AM to 6:59 AM | 203 (10.3%) | 89 (4.8%) |
| 7:00 AM to 7:29 AM | 208 (10.6%) | 371 (19.9%) |
| 7:30 AM to 7:59 AM | 180 (9.1%) | 348 (18.6%) |
| 8:00 AM to 8:29 AM | 265 (13.5%) | 228 (12.2%) |
| 8:30 AM to 8:59 AM | 199 (10.1%) | 84 (4.5%) |
| 9:00 AM to 9:59 AM | 43 (2.2%) | 111 (5.9%) |
| 10:00 AM to 10:59 AM | 68 (3.5%) | 17 (0.9%) |
| 11:00 AM to 11:59 AM | 74 (3.8%) | 24 (1.3%) |
| 12:00 PM to 3:59 PM | 28 (1.4%) | 175 (9.4%) |
| 4:00 PM to 11:59 PM | 279 (14.2%) | 120 (6.4%) |
| Total | 1,967 (100.0%) | 1,868 (100.0%) |
Housing Occupancy in Knott County
Occupancy by Ownership in Knott County
Of the total 5,563 dwellings in Knott County, owner-occupied units account for 4,037 (72.6%), while renter-occupied units make up 1,526 (27.4%).
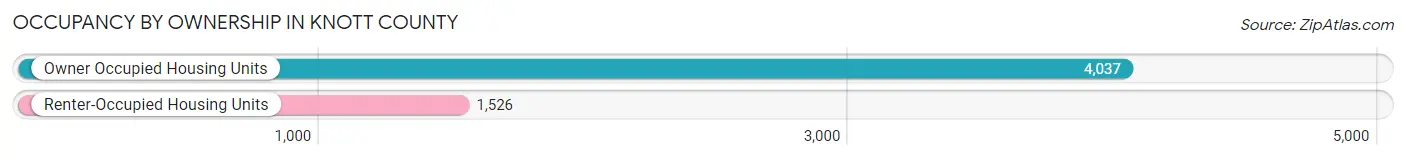
| Occupancy | # Housing Units | % Housing Units |
| Owner Occupied Housing Units | 4,037 | 72.6% |
| Renter-Occupied Housing Units | 1,526 | 27.4% |
| Total Occupied Housing Units | 5,563 | 100.0% |
Occupancy by Household Size in Knott County
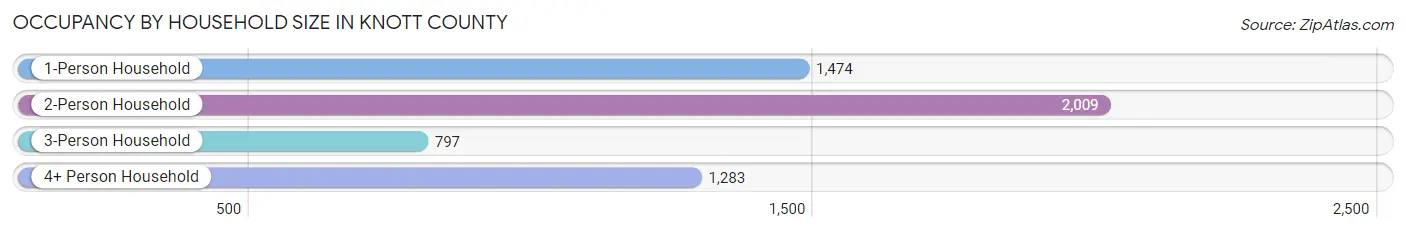
| Household Size | # Housing Units | % Housing Units |
| 1-Person Household | 1,474 | 26.5% |
| 2-Person Household | 2,009 | 36.1% |
| 3-Person Household | 797 | 14.3% |
| 4+ Person Household | 1,283 | 23.1% |
| Total Housing Units | 5,563 | 100.0% |
Occupancy by Ownership by Household Size in Knott County
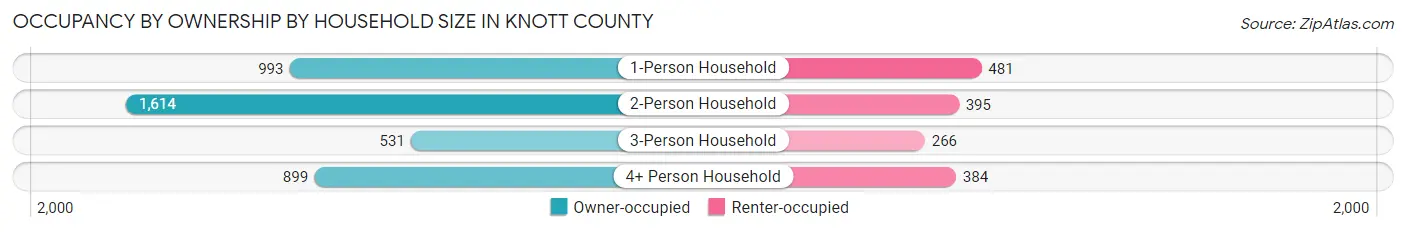
| Household Size | Owner-occupied | Renter-occupied |
| 1-Person Household | 993 (67.4%) | 481 (32.6%) |
| 2-Person Household | 1,614 (80.3%) | 395 (19.7%) |
| 3-Person Household | 531 (66.6%) | 266 (33.4%) |
| 4+ Person Household | 899 (70.1%) | 384 (29.9%) |
| Total Housing Units | 4,037 (72.6%) | 1,526 (27.4%) |
Occupancy by Educational Attainment in Knott County
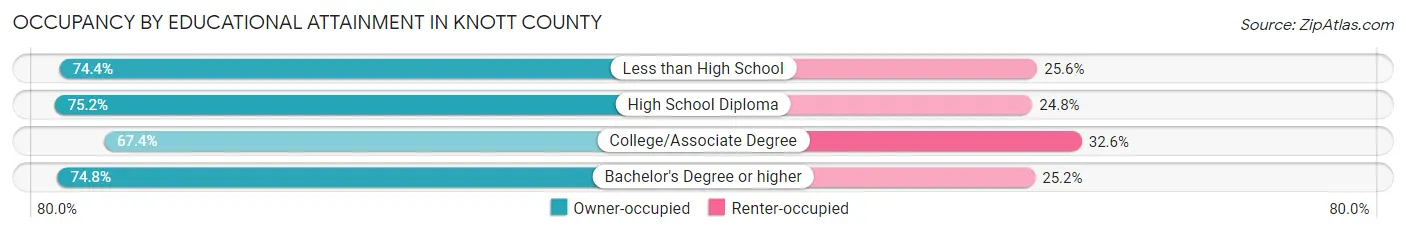
| Household Size | Owner-occupied | Renter-occupied |
| Less than High School | 1,002 (74.4%) | 344 (25.6%) |
| High School Diploma | 1,202 (75.2%) | 396 (24.8%) |
| College/Associate Degree | 1,140 (67.4%) | 552 (32.6%) |
| Bachelor's Degree or higher | 693 (74.8%) | 234 (25.2%) |
Occupancy by Age of Householder in Knott County
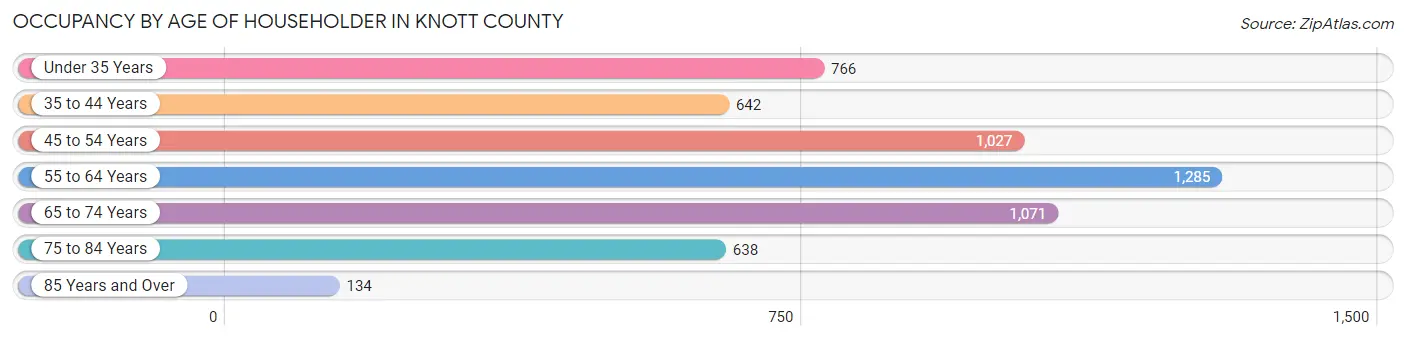
| Age Bracket | # Households | % Households |
| Under 35 Years | 766 | 13.8% |
| 35 to 44 Years | 642 | 11.5% |
| 45 to 54 Years | 1,027 | 18.5% |
| 55 to 64 Years | 1,285 | 23.1% |
| 65 to 74 Years | 1,071 | 19.3% |
| 75 to 84 Years | 638 | 11.5% |
| 85 Years and Over | 134 | 2.4% |
| Total | 5,563 | 100.0% |
Housing Finances in Knott County
Median Income by Occupancy in Knott County
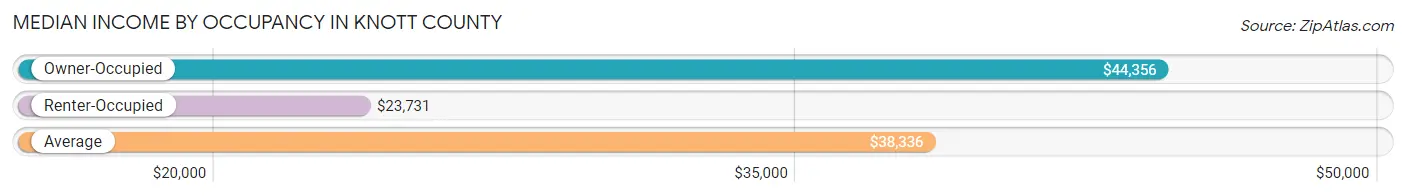
| Occupancy Type | # Households | Median Income |
| Owner-Occupied | 4,037 (72.6%) | $44,356 |
| Renter-Occupied | 1,526 (27.4%) | $23,731 |
| Average | 5,563 (100.0%) | $38,336 |
Occupancy by Householder Income Bracket in Knott County
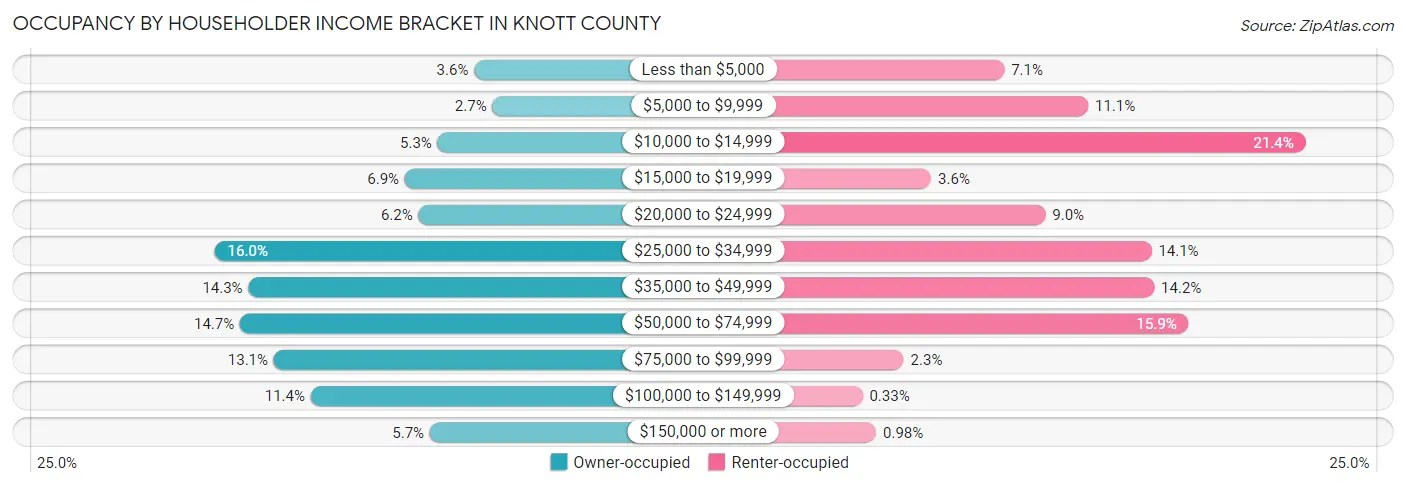
| Income Bracket | Owner-occupied | Renter-occupied |
| Less than $5,000 | 145 (3.6%) | 108 (7.1%) |
| $5,000 to $9,999 | 110 (2.7%) | 169 (11.1%) |
| $10,000 to $14,999 | 215 (5.3%) | 327 (21.4%) |
| $15,000 to $19,999 | 278 (6.9%) | 55 (3.6%) |
| $20,000 to $24,999 | 252 (6.2%) | 138 (9.0%) |
| $25,000 to $34,999 | 644 (16.0%) | 215 (14.1%) |
| $35,000 to $49,999 | 579 (14.3%) | 217 (14.2%) |
| $50,000 to $74,999 | 595 (14.7%) | 242 (15.9%) |
| $75,000 to $99,999 | 530 (13.1%) | 35 (2.3%) |
| $100,000 to $149,999 | 459 (11.4%) | 5 (0.3%) |
| $150,000 or more | 230 (5.7%) | 15 (1.0%) |
| Total | 4,037 (100.0%) | 1,526 (100.0%) |
Monthly Housing Cost Tiers in Knott County
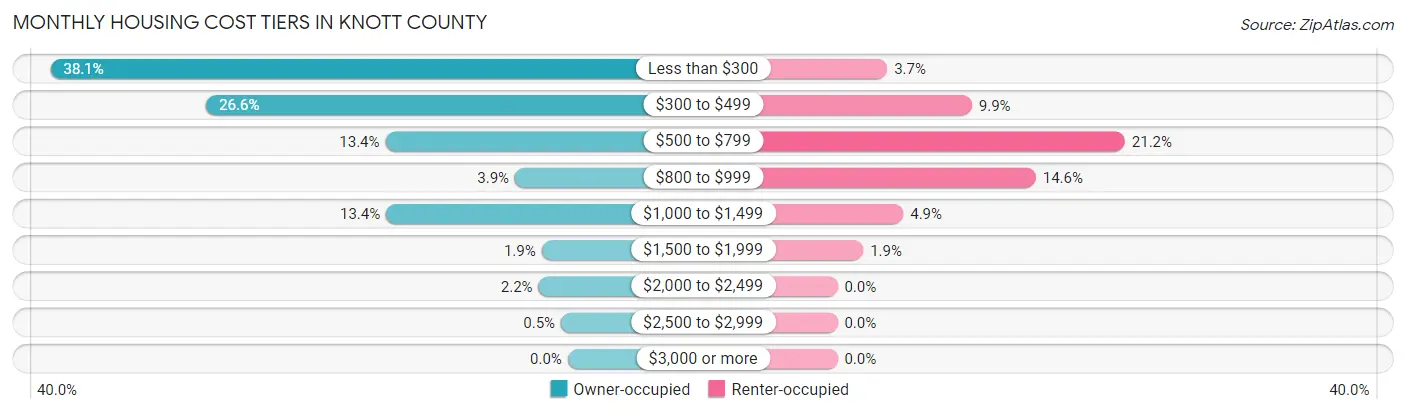
| Monthly Cost | Owner-occupied | Renter-occupied |
| Less than $300 | 1,538 (38.1%) | 56 (3.7%) |
| $300 to $499 | 1,075 (26.6%) | 151 (9.9%) |
| $500 to $799 | 542 (13.4%) | 323 (21.2%) |
| $800 to $999 | 157 (3.9%) | 223 (14.6%) |
| $1,000 to $1,499 | 540 (13.4%) | 74 (4.9%) |
| $1,500 to $1,999 | 78 (1.9%) | 29 (1.9%) |
| $2,000 to $2,499 | 87 (2.2%) | 0 (0.0%) |
| $2,500 to $2,999 | 20 (0.5%) | 0 (0.0%) |
| $3,000 or more | 0 (0.0%) | 0 (0.0%) |
| Total | 4,037 (100.0%) | 1,526 (100.0%) |
Physical Housing Characteristics in Knott County
Housing Structures in Knott County
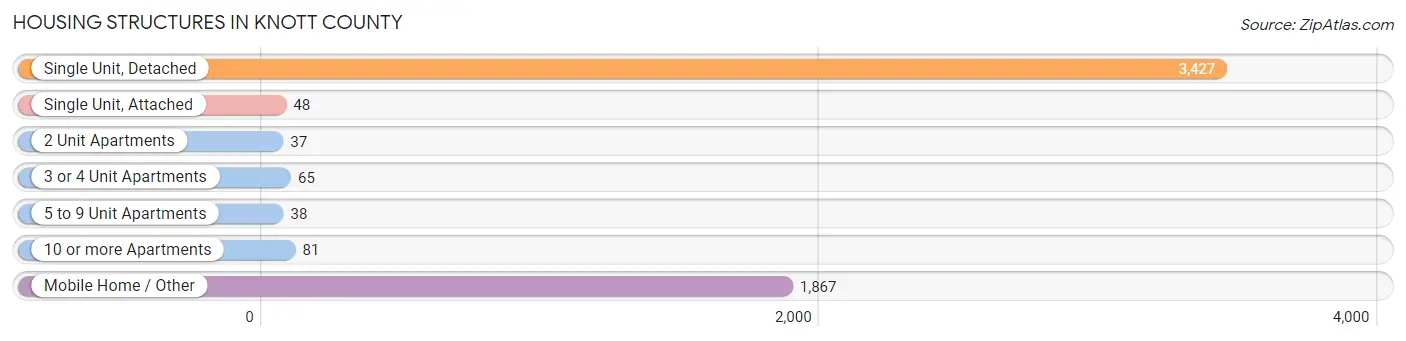
| Structure Type | # Housing Units | % Housing Units |
| Single Unit, Detached | 3,427 | 61.6% |
| Single Unit, Attached | 48 | 0.9% |
| 2 Unit Apartments | 37 | 0.7% |
| 3 or 4 Unit Apartments | 65 | 1.2% |
| 5 to 9 Unit Apartments | 38 | 0.7% |
| 10 or more Apartments | 81 | 1.5% |
| Mobile Home / Other | 1,867 | 33.6% |
| Total | 5,563 | 100.0% |
Housing Structures by Occupancy in Knott County
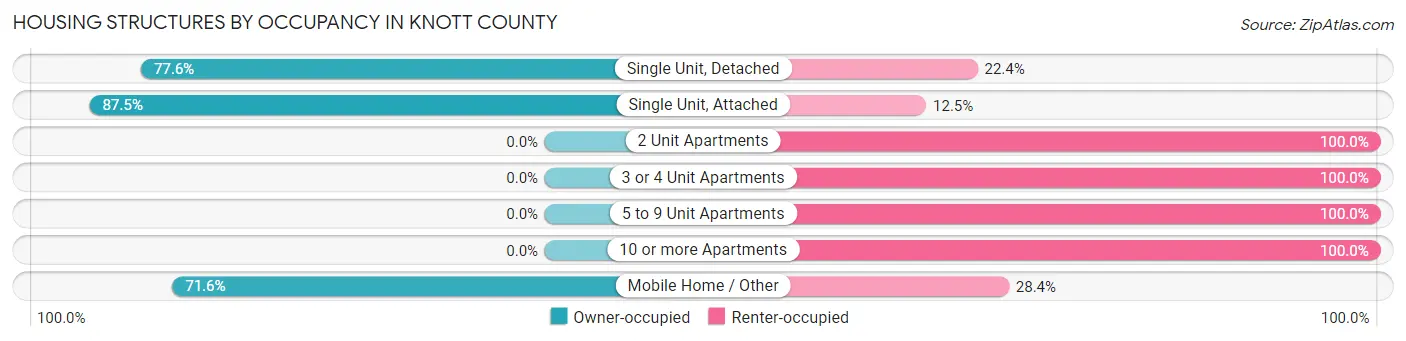
| Structure Type | Owner-occupied | Renter-occupied |
| Single Unit, Detached | 2,659 (77.6%) | 768 (22.4%) |
| Single Unit, Attached | 42 (87.5%) | 6 (12.5%) |
| 2 Unit Apartments | 0 (0.0%) | 37 (100.0%) |
| 3 or 4 Unit Apartments | 0 (0.0%) | 65 (100.0%) |
| 5 to 9 Unit Apartments | 0 (0.0%) | 38 (100.0%) |
| 10 or more Apartments | 0 (0.0%) | 81 (100.0%) |
| Mobile Home / Other | 1,336 (71.6%) | 531 (28.4%) |
| Total | 4,037 (72.6%) | 1,526 (27.4%) |
Housing Structures by Number of Rooms in Knott County
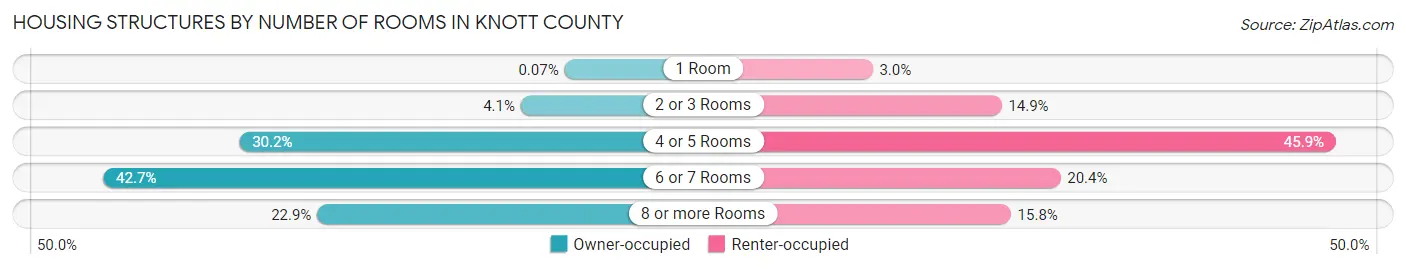
| Number of Rooms | Owner-occupied | Renter-occupied |
| 1 Room | 3 (0.1%) | 46 (3.0%) |
| 2 or 3 Rooms | 166 (4.1%) | 228 (14.9%) |
| 4 or 5 Rooms | 1,217 (30.1%) | 700 (45.9%) |
| 6 or 7 Rooms | 1,725 (42.7%) | 311 (20.4%) |
| 8 or more Rooms | 926 (22.9%) | 241 (15.8%) |
| Total | 4,037 (100.0%) | 1,526 (100.0%) |
Housing Structure by Heating Type in Knott County
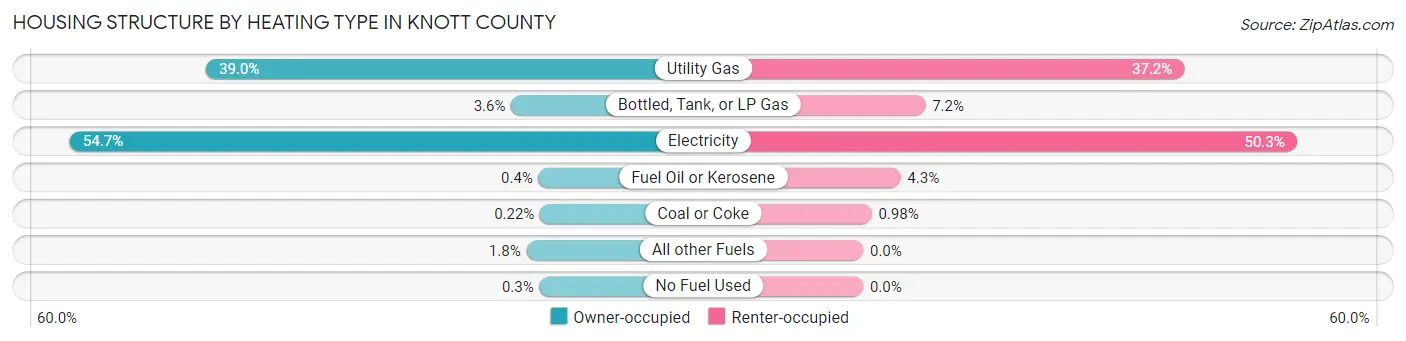
| Heating Type | Owner-occupied | Renter-occupied |
| Utility Gas | 1,573 (39.0%) | 568 (37.2%) |
| Bottled, Tank, or LP Gas | 144 (3.6%) | 110 (7.2%) |
| Electricity | 2,210 (54.7%) | 767 (50.3%) |
| Fuel Oil or Kerosene | 16 (0.4%) | 66 (4.3%) |
| Coal or Coke | 9 (0.2%) | 15 (1.0%) |
| All other Fuels | 73 (1.8%) | 0 (0.0%) |
| No Fuel Used | 12 (0.3%) | 0 (0.0%) |
| Total | 4,037 (100.0%) | 1,526 (100.0%) |
Household Vehicle Usage in Knott County
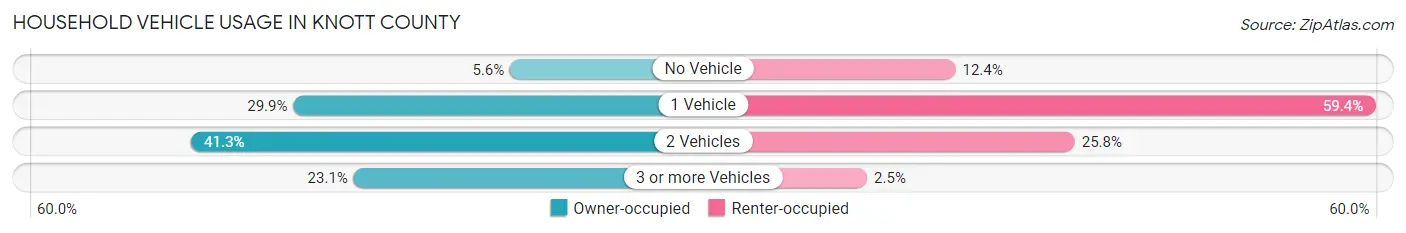
| Vehicles per Household | Owner-occupied | Renter-occupied |
| No Vehicle | 227 (5.6%) | 189 (12.4%) |
| 1 Vehicle | 1,207 (29.9%) | 906 (59.4%) |
| 2 Vehicles | 1,669 (41.3%) | 393 (25.8%) |
| 3 or more Vehicles | 934 (23.1%) | 38 (2.5%) |
| Total | 4,037 (100.0%) | 1,526 (100.0%) |
Real Estate & Mortgages in Knott County
Real Estate and Mortgage Overview in Knott County
| Characteristic | Without Mortgage | With Mortgage |
| Housing Units | 2,920 | 1,117 |
| Median Property Value | $50,700 | $127,900 |
| Median Household Income | $38,659 | $178 |
| Monthly Housing Costs | $295 | $0 |
| Real Estate Taxes | $421 | $106 |
Property Value by Mortgage Status in Knott County
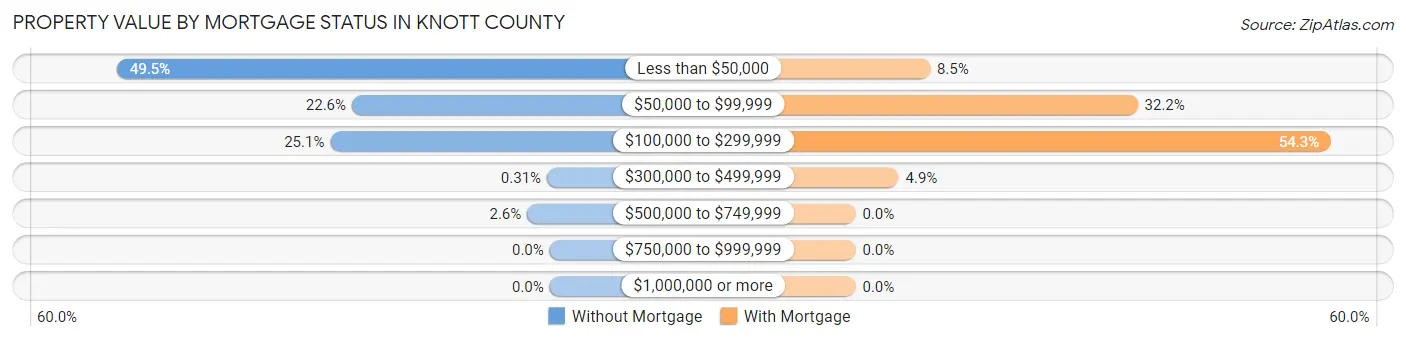
| Property Value | Without Mortgage | With Mortgage |
| Less than $50,000 | 1,444 (49.4%) | 95 (8.5%) |
| $50,000 to $99,999 | 660 (22.6%) | 360 (32.2%) |
| $100,000 to $299,999 | 732 (25.1%) | 607 (54.3%) |
| $300,000 to $499,999 | 9 (0.3%) | 55 (4.9%) |
| $500,000 to $749,999 | 75 (2.6%) | 0 (0.0%) |
| $750,000 to $999,999 | 0 (0.0%) | 0 (0.0%) |
| $1,000,000 or more | 0 (0.0%) | 0 (0.0%) |
| Total | 2,920 (100.0%) | 1,117 (100.0%) |
Household Income by Mortgage Status in Knott County
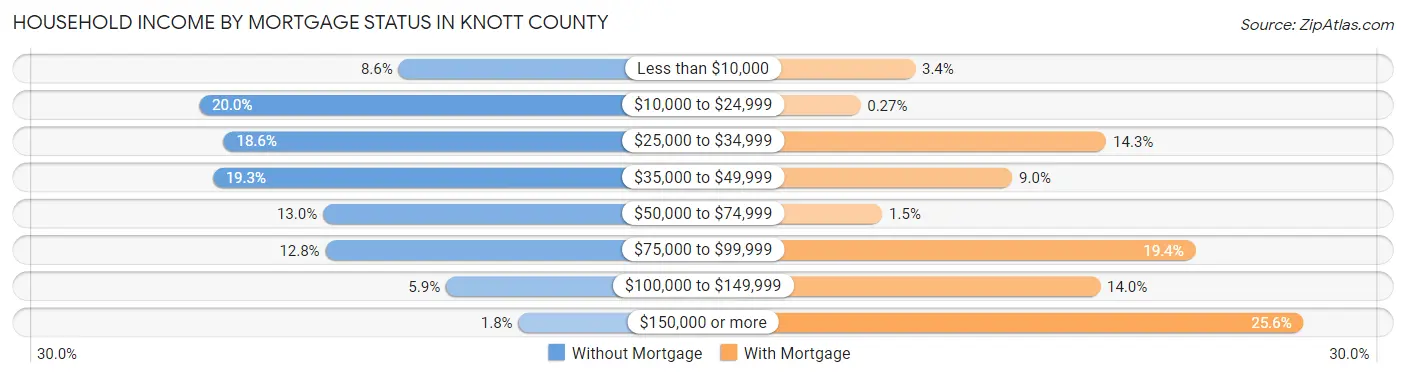
| Household Income | Without Mortgage | With Mortgage |
| Less than $10,000 | 252 (8.6%) | 38 (3.4%) |
| $10,000 to $24,999 | 585 (20.0%) | 3 (0.3%) |
| $25,000 to $34,999 | 544 (18.6%) | 160 (14.3%) |
| $35,000 to $49,999 | 562 (19.3%) | 100 (8.9%) |
| $50,000 to $74,999 | 378 (13.0%) | 17 (1.5%) |
| $75,000 to $99,999 | 374 (12.8%) | 217 (19.4%) |
| $100,000 to $149,999 | 173 (5.9%) | 156 (14.0%) |
| $150,000 or more | 52 (1.8%) | 286 (25.6%) |
| Total | 2,920 (100.0%) | 1,117 (100.0%) |
Property Value to Household Income Ratio in Knott County
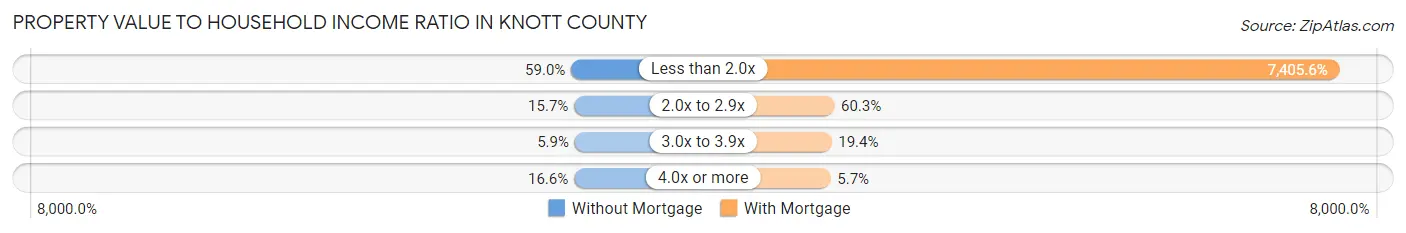
| Value-to-Income Ratio | Without Mortgage | With Mortgage |
| Less than 2.0x | 1,722 (59.0%) | 82,721 (7,405.6%) |
| 2.0x to 2.9x | 459 (15.7%) | 673 (60.3%) |
| 3.0x to 3.9x | 173 (5.9%) | 217 (19.4%) |
| 4.0x or more | 486 (16.6%) | 64 (5.7%) |
| Total | 2,920 (100.0%) | 1,117 (100.0%) |
Real Estate Taxes by Mortgage Status in Knott County
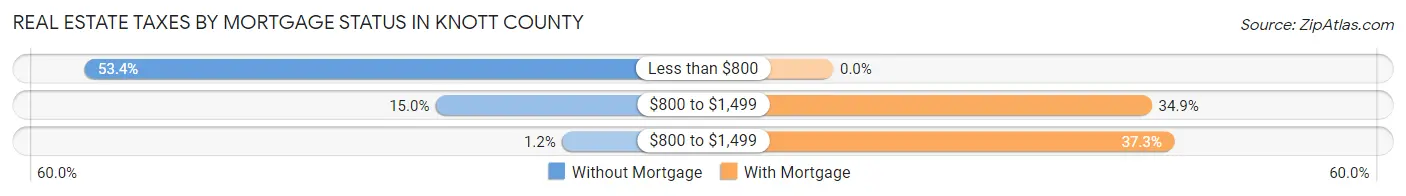
| Property Taxes | Without Mortgage | With Mortgage |
| Less than $800 | 1,559 (53.4%) | 0 (0.0%) |
| $800 to $1,499 | 438 (15.0%) | 390 (34.9%) |
| $800 to $1,499 | 34 (1.2%) | 417 (37.3%) |
| Total | 2,920 (100.0%) | 1,117 (100.0%) |
Health & Disability in Knott County
Health Insurance Coverage by Age in Knott County
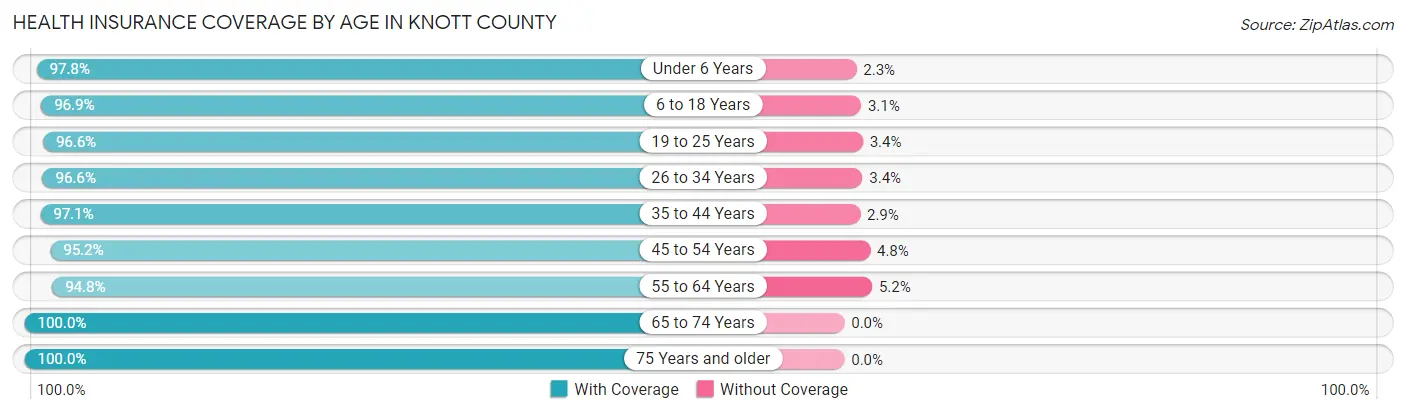
| Age Bracket | With Coverage | Without Coverage |
| Under 6 Years | 867 (97.8%) | 20 (2.2%) |
| 6 to 18 Years | 2,087 (96.9%) | 67 (3.1%) |
| 19 to 25 Years | 1,437 (96.6%) | 51 (3.4%) |
| 26 to 34 Years | 1,238 (96.6%) | 43 (3.4%) |
| 35 to 44 Years | 1,489 (97.1%) | 45 (2.9%) |
| 45 to 54 Years | 1,843 (95.2%) | 93 (4.8%) |
| 55 to 64 Years | 2,076 (94.8%) | 113 (5.2%) |
| 65 to 74 Years | 1,744 (100.0%) | 0 (0.0%) |
| 75 Years and older | 967 (100.0%) | 0 (0.0%) |
| Total | 13,748 (97.0%) | 432 (3.0%) |
Health Insurance Coverage by Citizenship Status in Knott County
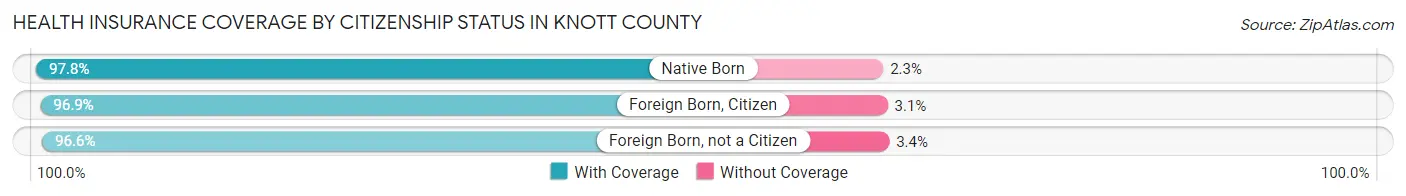
| Citizenship Status | With Coverage | Without Coverage |
| Native Born | 867 (97.8%) | 20 (2.2%) |
| Foreign Born, Citizen | 2,087 (96.9%) | 67 (3.1%) |
| Foreign Born, not a Citizen | 1,437 (96.6%) | 51 (3.4%) |
Health Insurance Coverage by Household Income in Knott County
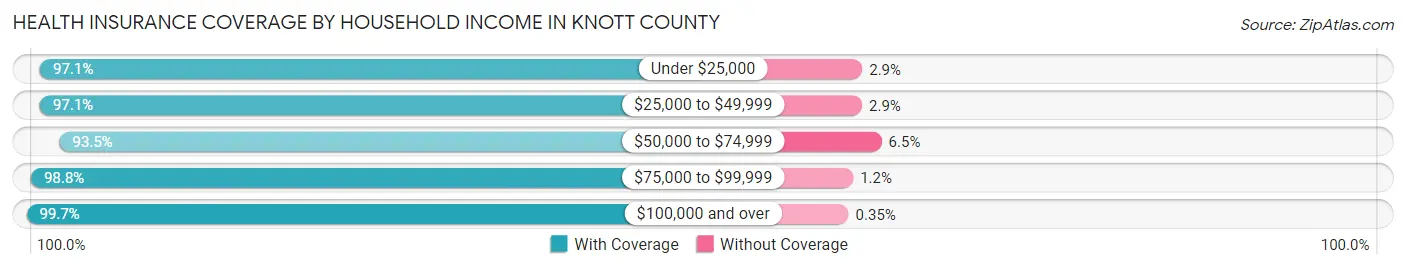
| Household Income | With Coverage | Without Coverage |
| Under $25,000 | 3,510 (97.1%) | 105 (2.9%) |
| $25,000 to $49,999 | 3,856 (97.1%) | 114 (2.9%) |
| $50,000 to $74,999 | 2,176 (93.5%) | 152 (6.5%) |
| $75,000 to $99,999 | 1,815 (98.8%) | 22 (1.2%) |
| $100,000 and over | 1,971 (99.7%) | 7 (0.4%) |
Public vs Private Health Insurance Coverage by Age in Knott County
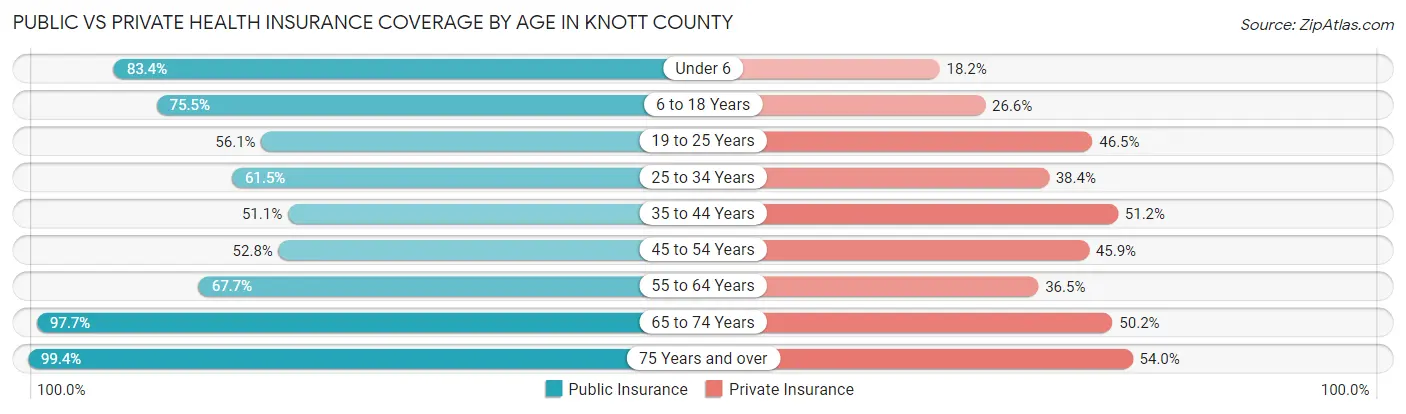
| Age Bracket | Public Insurance | Private Insurance |
| Under 6 | 740 (83.4%) | 161 (18.1%) |
| 6 to 18 Years | 1,626 (75.5%) | 573 (26.6%) |
| 19 to 25 Years | 834 (56.0%) | 692 (46.5%) |
| 25 to 34 Years | 788 (61.5%) | 492 (38.4%) |
| 35 to 44 Years | 784 (51.1%) | 786 (51.2%) |
| 45 to 54 Years | 1,023 (52.8%) | 888 (45.9%) |
| 55 to 64 Years | 1,481 (67.7%) | 798 (36.5%) |
| 65 to 74 Years | 1,704 (97.7%) | 876 (50.2%) |
| 75 Years and over | 961 (99.4%) | 522 (54.0%) |
| Total | 9,941 (70.1%) | 5,788 (40.8%) |
Disability Status by Sex by Age in Knott County
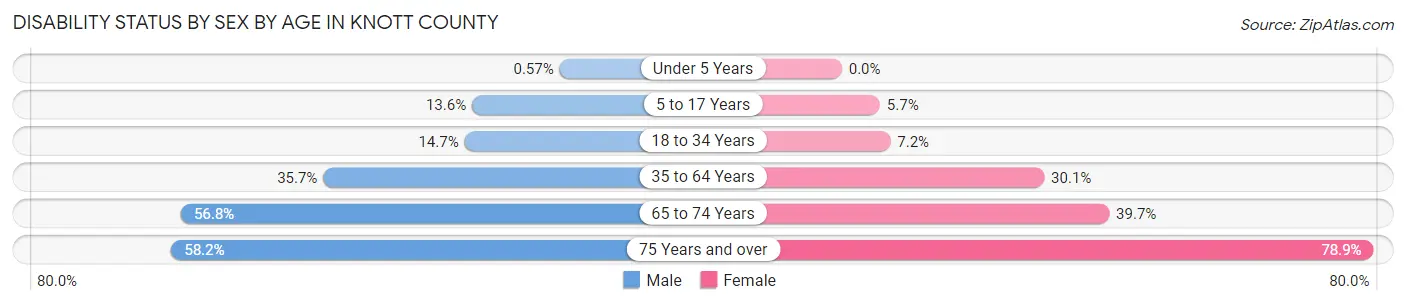
| Age Bracket | Male | Female |
| Under 5 Years | 2 (0.6%) | 0 (0.0%) |
| 5 to 17 Years | 151 (13.6%) | 58 (5.7%) |
| 18 to 34 Years | 222 (14.7%) | 104 (7.2%) |
| 35 to 64 Years | 1,008 (35.7%) | 851 (30.0%) |
| 65 to 74 Years | 494 (56.8%) | 347 (39.7%) |
| 75 Years and over | 234 (58.2%) | 446 (78.9%) |
Disability Class by Sex by Age in Knott County
Disability Class: Hearing Difficulty
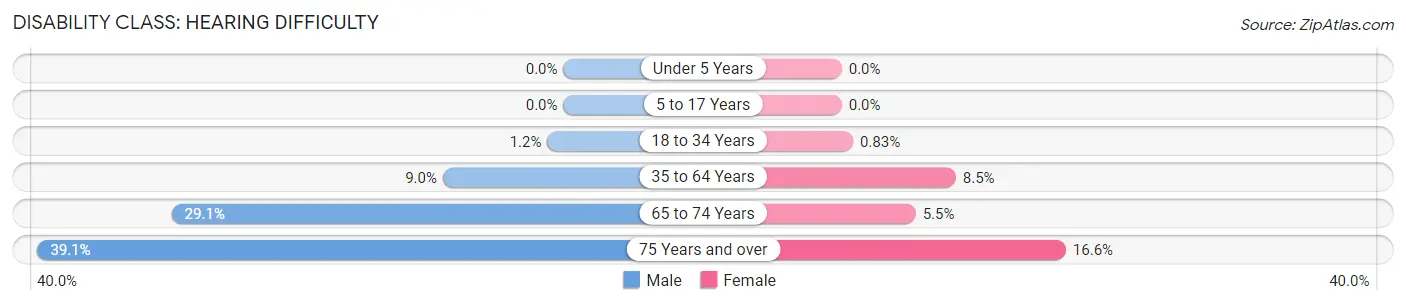
| Age Bracket | Male | Female |
| Under 5 Years | 0 (0.0%) | 0 (0.0%) |
| 5 to 17 Years | 0 (0.0%) | 0 (0.0%) |
| 18 to 34 Years | 18 (1.2%) | 12 (0.8%) |
| 35 to 64 Years | 253 (8.9%) | 240 (8.5%) |
| 65 to 74 Years | 253 (29.1%) | 48 (5.5%) |
| 75 Years and over | 157 (39.1%) | 94 (16.6%) |
Disability Class: Vision Difficulty
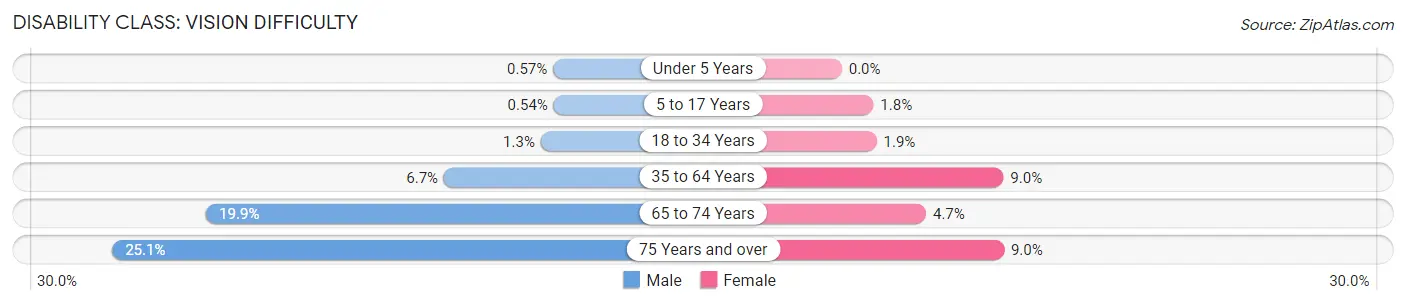
| Age Bracket | Male | Female |
| Under 5 Years | 2 (0.6%) | 0 (0.0%) |
| 5 to 17 Years | 6 (0.5%) | 18 (1.8%) |
| 18 to 34 Years | 19 (1.3%) | 28 (1.9%) |
| 35 to 64 Years | 188 (6.7%) | 255 (9.0%) |
| 65 to 74 Years | 173 (19.9%) | 41 (4.7%) |
| 75 Years and over | 101 (25.1%) | 51 (9.0%) |
Disability Class: Cognitive Difficulty
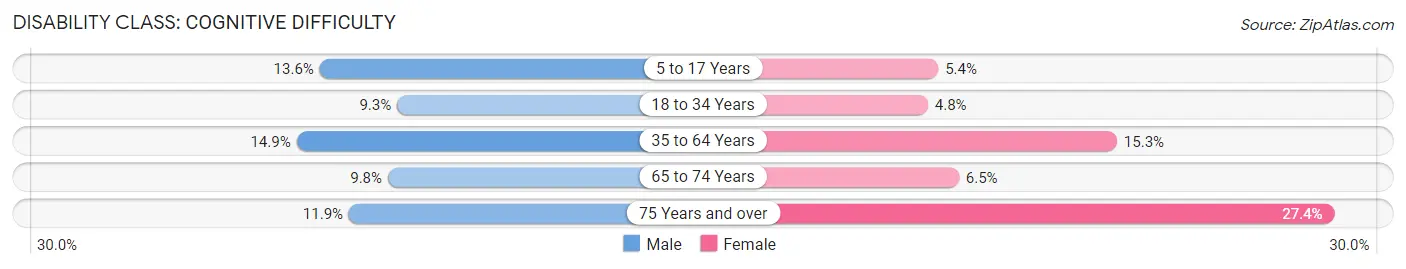
| Age Bracket | Male | Female |
| 5 to 17 Years | 151 (13.6%) | 55 (5.4%) |
| 18 to 34 Years | 140 (9.3%) | 69 (4.8%) |
| 35 to 64 Years | 420 (14.9%) | 434 (15.3%) |
| 65 to 74 Years | 85 (9.8%) | 57 (6.5%) |
| 75 Years and over | 48 (11.9%) | 155 (27.4%) |
Disability Class: Ambulatory Difficulty
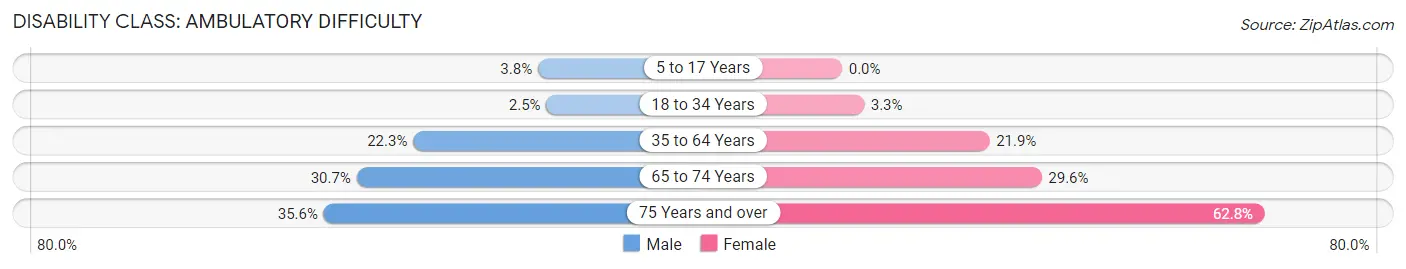
| Age Bracket | Male | Female |
| 5 to 17 Years | 42 (3.8%) | 0 (0.0%) |
| 18 to 34 Years | 38 (2.5%) | 47 (3.3%) |
| 35 to 64 Years | 630 (22.3%) | 620 (21.9%) |
| 65 to 74 Years | 267 (30.7%) | 259 (29.6%) |
| 75 Years and over | 143 (35.6%) | 355 (62.8%) |
Disability Class: Self-Care Difficulty
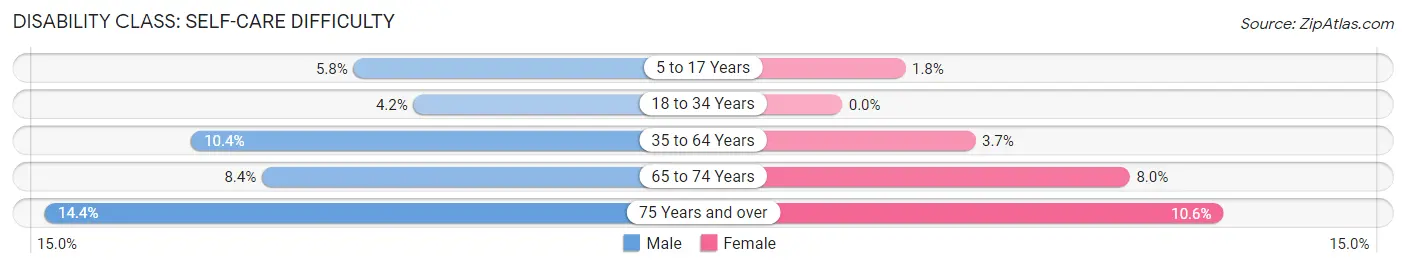
| Age Bracket | Male | Female |
| 5 to 17 Years | 65 (5.8%) | 18 (1.8%) |
| 18 to 34 Years | 63 (4.2%) | 0 (0.0%) |
| 35 to 64 Years | 293 (10.4%) | 105 (3.7%) |
| 65 to 74 Years | 73 (8.4%) | 70 (8.0%) |
| 75 Years and over | 58 (14.4%) | 60 (10.6%) |
Technology Access in Knott County
Computing Device Access in Knott County
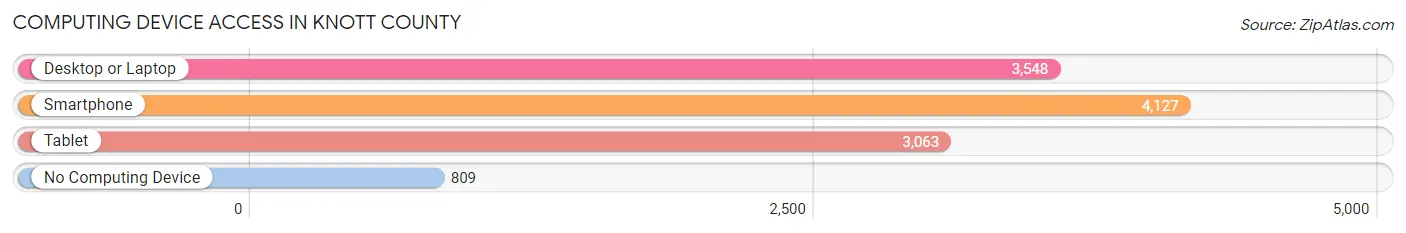
| Device Type | # Households | % Households |
| Desktop or Laptop | 3,548 | 63.8% |
| Smartphone | 4,127 | 74.2% |
| Tablet | 3,063 | 55.1% |
| No Computing Device | 809 | 14.5% |
| Total | 5,563 | 100.0% |
Internet Access in Knott County
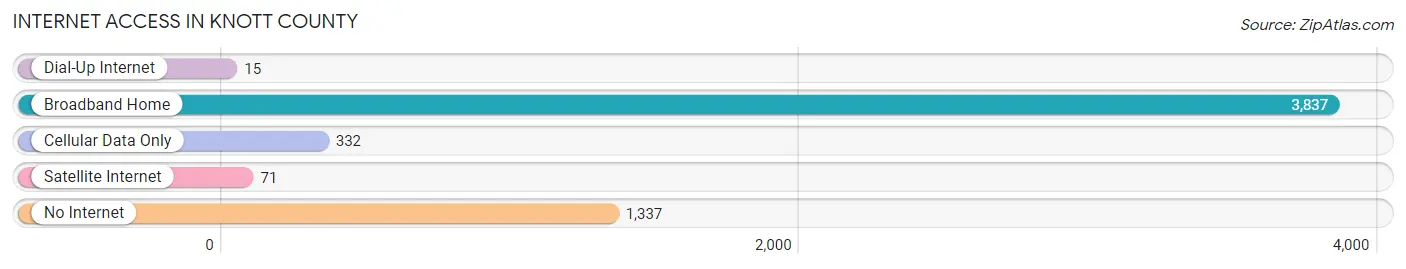
| Internet Type | # Households | % Households |
| Dial-Up Internet | 15 | 0.3% |
| Broadband Home | 3,837 | 69.0% |
| Cellular Data Only | 332 | 6.0% |
| Satellite Internet | 71 | 1.3% |
| No Internet | 1,337 | 24.0% |
| Total | 5,563 | 100.0% |
Knott County Summary
Knott County is located in the eastern part of Kentucky, in the Appalachian Mountains. It is bordered by Breathitt, Floyd, Letcher, Perry, and Leslie counties. The county seat is Hindman, and the county was formed in 1884 from parts of Floyd and Perry counties. The county was named for James Proctor Knott, the Governor of Kentucky from 1883 to 1887.
Knott County has a total area of 437 square miles, of which 435 square miles is land and 2 square miles is water. The terrain is mostly mountainous, with elevations ranging from 800 to 3,000 feet. The highest point in the county is Pine Mountain, at 3,000 feet. The county is drained by the North Fork of the Kentucky River and its tributaries.
As of the 2010 census, the population of Knott County was 16,346, with a population density of 37.3 people per square mile. The median household income was $25,845, and the median family income was $31,917. The per capita income was $14,945. The unemployment rate was 11.2%.
Knott County is home to several industries, including coal mining, timber, and tourism. The county is home to the Kentucky Coal Mining Museum, which is located in the town of Lynch. The museum features exhibits on the history of coal mining in the area, as well as a coal mine tour. The county is also home to the Pine Mountain State Resort Park, which offers camping, hiking, fishing, and other outdoor activities.
Knott County is served by the Knott County School District, which includes seven elementary schools, two middle schools, and one high school. The county is also home to several private schools, including the Knott County Christian Academy and the Knott County Academy.
Knott County is home to several notable people, including former Kentucky Governor James Proctor Knott, former U.S. Senator Wendell Ford, and former U.S. Representative Hal Rogers. The county is also home to the Hindman Settlement School, which was founded in 1902 to provide educational opportunities for the children of the Appalachian Mountains.
Knott County is a rural county with a rich history and culture. It is home to a variety of industries, including coal mining, timber, and tourism. The county is served by a strong school system, and is home to several notable people. Knott County is a great place to live, work, and raise a family.
Common Questions
What is Per Capita Income in Knott County?
Per Capita income in Knott County is $20,536.
What is the Median Family Income in Knott County?
Median Family Income in Knott County is $45,572.
What is the Median Household income in Knott County?
Median Household Income in Knott County is $38,336.
What is Income or Wage Gap in Knott County?
Income or Wage Gap in Knott County is 6.3%.
Women in Knott County earn 93.7 cents for every dollar earned by a man.
What is Family Income Deficit in Knott County?
Family Income Deficit in Knott County is $11,414.
Families that are below poverty line in Knott County earn $11,414 less on average than the poverty threshold level.
What is Inequality or Gini Index in Knott County?
Inequality or Gini Index in Knott County is 0.46.
What is the Total Population of Knott County?
Total Population of Knott County is 14,282.
What is the Total Male Population of Knott County?
Total Male Population of Knott County is 7,100.
What is the Total Female Population of Knott County?
Total Female Population of Knott County is 7,182.
What is the Ratio of Males per 100 Females in Knott County?
There are 98.86 Males per 100 Females in Knott County.
What is the Ratio of Females per 100 Males in Knott County?
There are 101.15 Females per 100 Males in Knott County.
What is the Median Population Age in Knott County?
Median Population Age in Knott County is 44.2 Years.
What is the Average Family Size in Knott County
Average Family Size in Knott County is 3.0 People.
What is the Average Household Size in Knott County
Average Household Size in Knott County is 2.5 People.
How Large is the Labor Force in Knott County?
There are 4,718 People in the Labor Forcein in Knott County.
What is the Percentage of People in the Labor Force in Knott County?
40.0% of People are in the Labor Force in Knott County.
What is the Unemployment Rate in Knott County?
Unemployment Rate in Knott County is 10.6%.