Johnson County, KY Map & Demographics
Johnson County Overview
$22,931
PER CAPITA INCOME
$56,656
AVG FAMILY INCOME
$44,231
AVG HOUSEHOLD INCOME
41.2%
WAGE / INCOME GAP [ % ]
58.8¢/ $1
WAGE / INCOME GAP [ $ ]
$12,050
FAMILY INCOME DEFICIT
0.46
INEQUALITY / GINI INDEX
22,631
TOTAL POPULATION
11,327
MALE POPULATION
11,304
FEMALE POPULATION
100.20
MALES / 100 FEMALES
99.80
FEMALES / 100 MALES
41.7
MEDIAN AGE
3.0
AVG FAMILY SIZE
2.6
AVG HOUSEHOLD SIZE
8,100
LABOR FORCE [ PEOPLE ]
44.6%
PERCENT IN LABOR FORCE
5.3%
UNEMPLOYMENT RATE
Johnson County Area Codes
Income in Johnson County
Income Overview in Johnson County
Per Capita Income in Johnson County is $22,931, while median incomes of families and households are $56,656 and $44,231 respectively.
| Characteristic | Number | Measure |
| Per Capita Income | 22,631 | $22,931 |
| Median Family Income | 6,276 | $56,656 |
| Mean Family Income | 6,276 | $68,100 |
| Median Household Income | 8,534 | $44,231 |
| Mean Household Income | 8,534 | $59,346 |
| Income Deficit | 6,276 | $12,050 |
| Wage / Income Gap (%) | 22,631 | 41.19% |
| Wage / Income Gap ($) | 22,631 | 58.81¢ per $1 |
| Gini / Inequality Index | 22,631 | 0.46 |
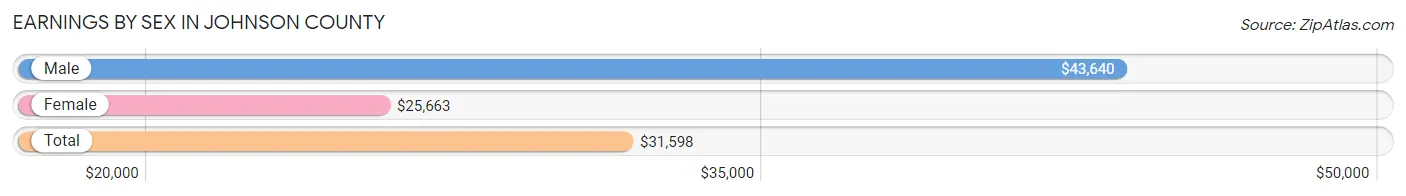
Earnings by Sex in Johnson County
Average Earnings in Johnson County are $31,598, $43,640 for men and $25,663 for women, a difference of 41.2%.
| Sex | Number | Average Earnings |
| Male | 4,517 (52.7%) | $43,640 |
| Female | 4,046 (47.2%) | $25,663 |
| Total | 8,563 (100.0%) | $31,598 |
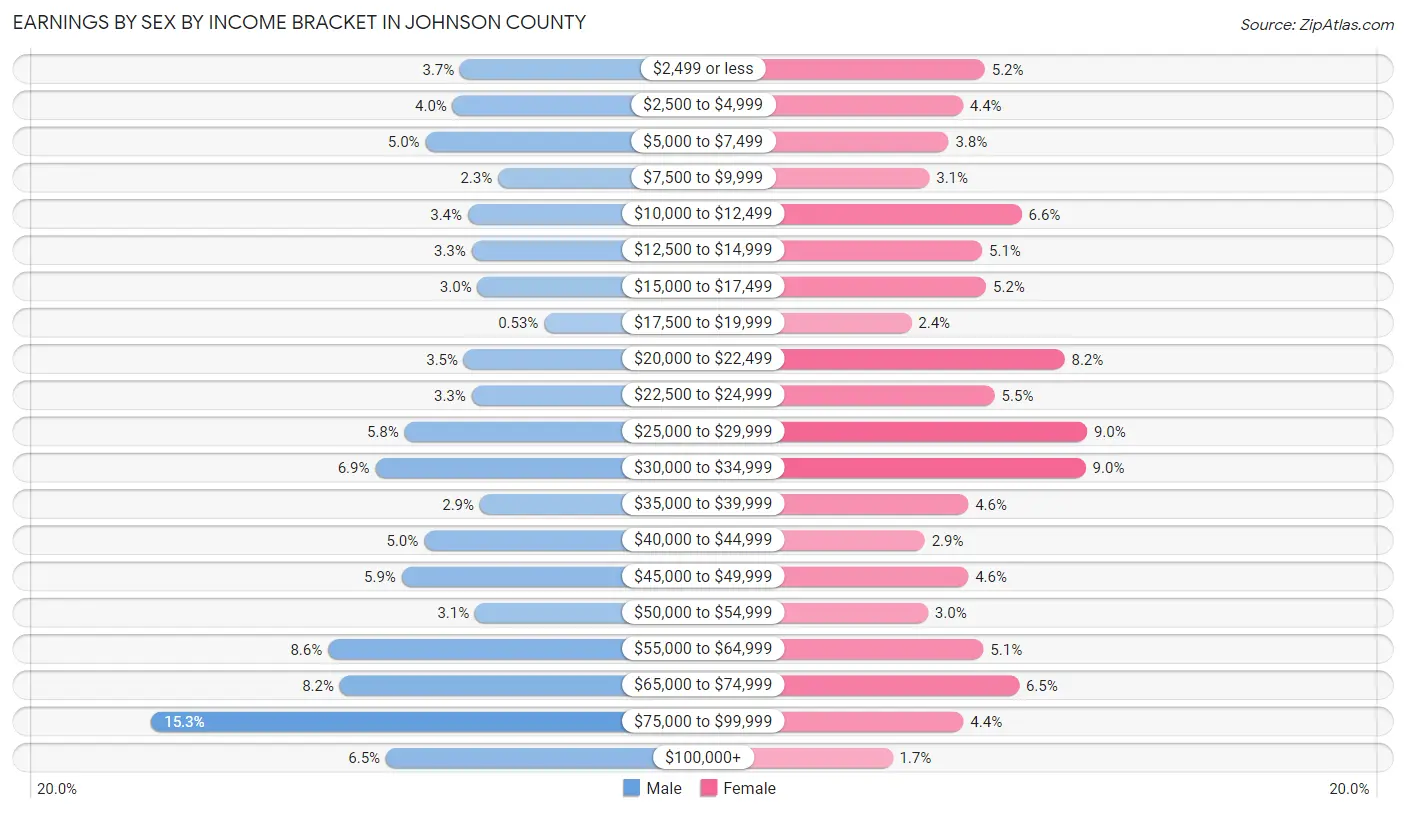
Earnings by Sex by Income Bracket in Johnson County
The most common earnings brackets in Johnson County are $75,000 to $99,999 for men (689 | 15.2%) and $25,000 to $29,999 for women (364 | 9.0%).
| Income | Male | Female |
| $2,499 or less | 166 (3.7%) | 209 (5.2%) |
| $2,500 to $4,999 | 179 (4.0%) | 176 (4.3%) |
| $5,000 to $7,499 | 225 (5.0%) | 154 (3.8%) |
| $7,500 to $9,999 | 102 (2.3%) | 125 (3.1%) |
| $10,000 to $12,499 | 153 (3.4%) | 265 (6.6%) |
| $12,500 to $14,999 | 147 (3.3%) | 205 (5.1%) |
| $15,000 to $17,499 | 137 (3.0%) | 211 (5.2%) |
| $17,500 to $19,999 | 24 (0.5%) | 98 (2.4%) |
| $20,000 to $22,499 | 160 (3.5%) | 330 (8.2%) |
| $22,500 to $24,999 | 147 (3.3%) | 224 (5.5%) |
| $25,000 to $29,999 | 260 (5.8%) | 364 (9.0%) |
| $30,000 to $34,999 | 310 (6.9%) | 362 (8.9%) |
| $35,000 to $39,999 | 133 (2.9%) | 184 (4.5%) |
| $40,000 to $44,999 | 227 (5.0%) | 118 (2.9%) |
| $45,000 to $49,999 | 265 (5.9%) | 184 (4.5%) |
| $50,000 to $54,999 | 141 (3.1%) | 123 (3.0%) |
| $55,000 to $64,999 | 390 (8.6%) | 207 (5.1%) |
| $65,000 to $74,999 | 370 (8.2%) | 261 (6.5%) |
| $75,000 to $99,999 | 689 (15.2%) | 177 (4.4%) |
| $100,000+ | 292 (6.5%) | 69 (1.7%) |
| Total | 4,517 (100.0%) | 4,046 (100.0%) |
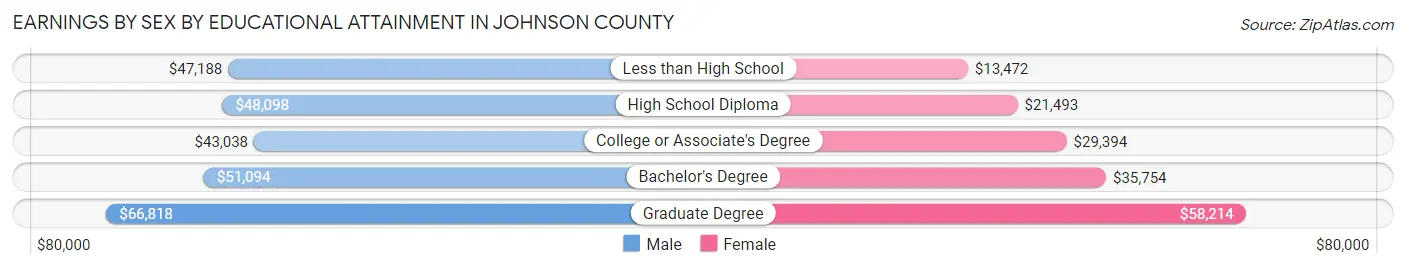
Earnings by Sex by Educational Attainment in Johnson County
Average earnings in Johnson County are $45,897 for men and $28,327 for women, a difference of 38.3%. Men with an educational attainment of graduate degree enjoy the highest average annual earnings of $66,818, while those with college or associate's degree education earn the least with $43,038. Women with an educational attainment of graduate degree earn the most with the average annual earnings of $58,214, while those with less than high school education have the smallest earnings of $13,472.
| Educational Attainment | Male Income | Female Income |
| Less than High School | $47,188 | $13,472 |
| High School Diploma | $48,098 | $21,493 |
| College or Associate's Degree | $43,038 | $29,394 |
| Bachelor's Degree | $51,094 | $35,754 |
| Graduate Degree | $66,818 | $58,214 |
| Total | $45,897 | $28,327 |
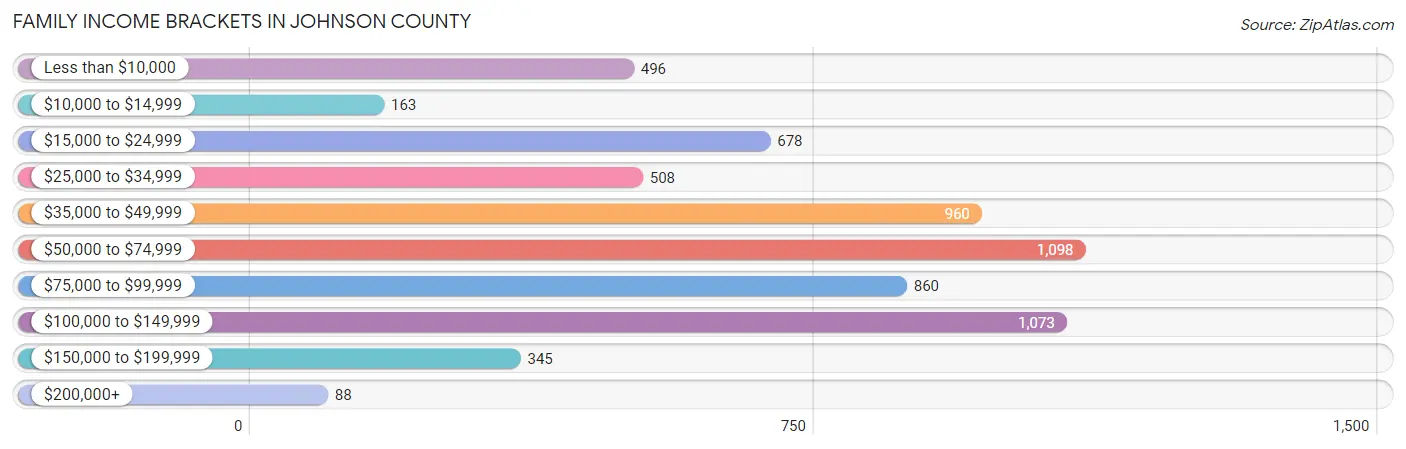
Family Income in Johnson County
Family Income Brackets in Johnson County
According to the Johnson County family income data, there are 1,098 families falling into the $50,000 to $74,999 income range, which is the most common income bracket and makes up 17.5% of all families. Conversely, the $200,000+ income bracket is the least frequent group with only 88 families (1.4%) belonging to this category.
| Income Bracket | # Families | % Families |
| Less than $10,000 | 496 | 7.9% |
| $10,000 to $14,999 | 163 | 2.6% |
| $15,000 to $24,999 | 678 | 10.8% |
| $25,000 to $34,999 | 508 | 8.1% |
| $35,000 to $49,999 | 960 | 15.3% |
| $50,000 to $74,999 | 1,098 | 17.5% |
| $75,000 to $99,999 | 860 | 13.7% |
| $100,000 to $149,999 | 1,073 | 17.1% |
| $150,000 to $199,999 | 345 | 5.5% |
| $200,000+ | 88 | 1.4% |
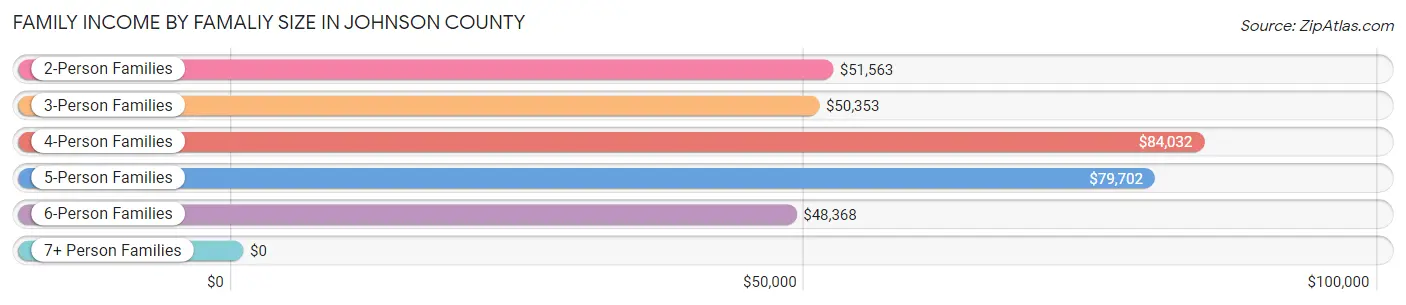
Family Income by Famaliy Size in Johnson County
4-person families (1,128 | 18.0%) account for the highest median family income in Johnson County with $84,032 per family, while 2-person families (3,220 | 51.3%) have the highest median income of $25,782 per family member.
| Income Bracket | # Families | Median Income |
| 2-Person Families | 3,220 (51.3%) | $51,563 |
| 3-Person Families | 1,189 (19.0%) | $50,353 |
| 4-Person Families | 1,128 (18.0%) | $84,032 |
| 5-Person Families | 543 (8.6%) | $79,702 |
| 6-Person Families | 163 (2.6%) | $48,368 |
| 7+ Person Families | 33 (0.5%) | $0 |
| Total | 6,276 (100.0%) | $56,656 |
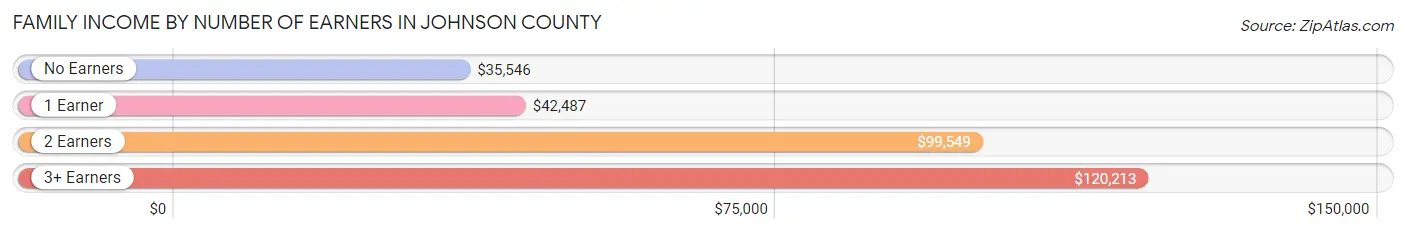
Family Income by Number of Earners in Johnson County
The median family income in Johnson County is $56,656, with families comprising 3+ earners (402) having the highest median family income of $120,213, while families with no earners (1,961) have the lowest median family income of $35,546, accounting for 6.4% and 31.2% of families, respectively.
| Number of Earners | # Families | Median Income |
| No Earners | 1,961 (31.2%) | $35,546 |
| 1 Earner | 1,819 (29.0%) | $42,487 |
| 2 Earners | 2,094 (33.4%) | $99,549 |
| 3+ Earners | 402 (6.4%) | $120,213 |
| Total | 6,276 (100.0%) | $56,656 |
Household Income in Johnson County
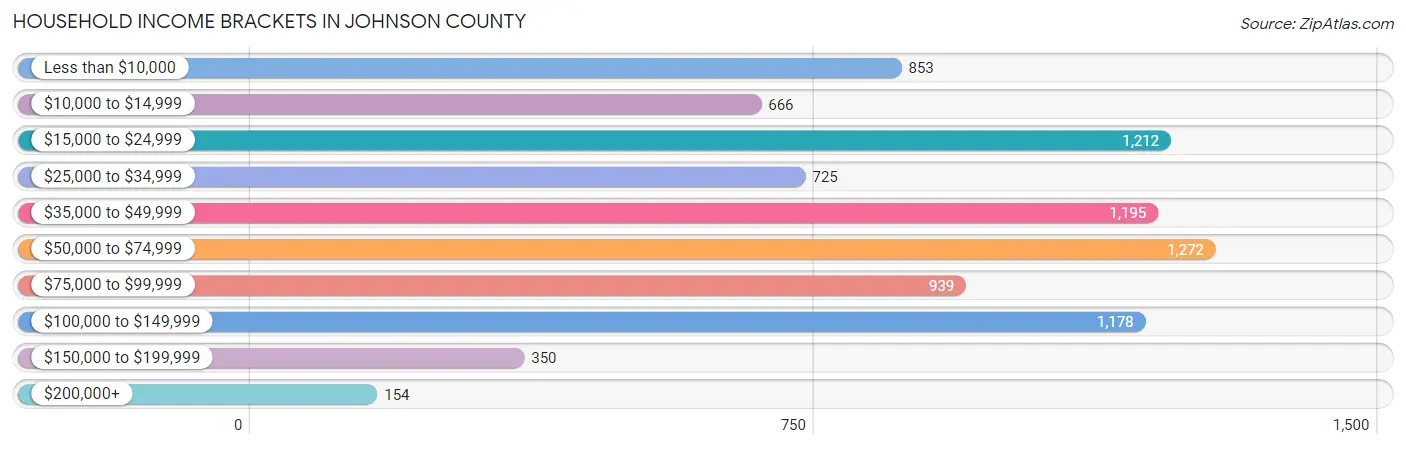
Household Income Brackets in Johnson County
With 1,272 households falling in the category, the $50,000 to $74,999 income range is the most frequent in Johnson County, accounting for 14.9% of all households. In contrast, only 154 households (1.8%) fall into the $200,000+ income bracket, making it the least populous group.
| Income Bracket | # Households | % Households |
| Less than $10,000 | 853 | 10.0% |
| $10,000 to $14,999 | 666 | 7.8% |
| $15,000 to $24,999 | 1,212 | 14.2% |
| $25,000 to $34,999 | 725 | 8.5% |
| $35,000 to $49,999 | 1,195 | 14.0% |
| $50,000 to $74,999 | 1,272 | 14.9% |
| $75,000 to $99,999 | 939 | 11.0% |
| $100,000 to $149,999 | 1,178 | 13.8% |
| $150,000 to $199,999 | 350 | 4.1% |
| $200,000+ | 154 | 1.8% |
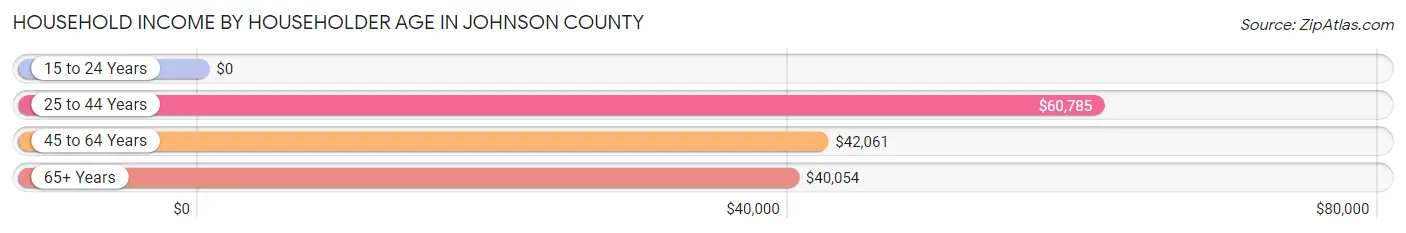
Household Income by Householder Age in Johnson County
The median household income in Johnson County is $44,231, with the highest median household income of $60,785 found in the 25 to 44 years age bracket for the primary householder. A total of 2,103 households (24.6%) fall into this category. Meanwhile, the 15 to 24 years age bracket for the primary householder has the lowest median household income of $0, with 518 households (6.1%) in this group.
| Income Bracket | # Households | Median Income |
| 15 to 24 Years | 518 (6.1%) | $0 |
| 25 to 44 Years | 2,103 (24.6%) | $60,785 |
| 45 to 64 Years | 3,526 (41.3%) | $42,061 |
| 65+ Years | 2,387 (28.0%) | $40,054 |
| Total | 8,534 (100.0%) | $44,231 |
Poverty in Johnson County
Income Below Poverty by Sex and Age in Johnson County
With 18.6% poverty level for males and 24.1% for females among the residents of Johnson County, under 5 year old males and 35 to 44 year old females are the most vulnerable to poverty, with 216 males (33.8%) and 631 females (43.9%) in their respective age groups living below the poverty level.
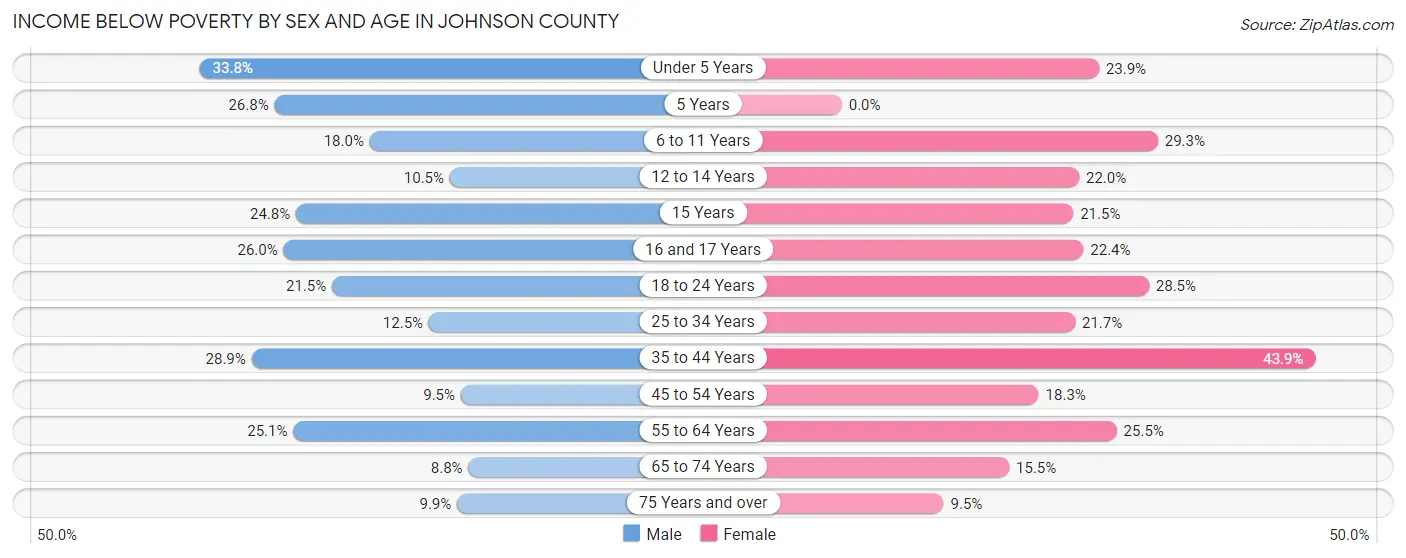
| Age Bracket | Male | Female |
| Under 5 Years | 216 (33.8%) | 131 (23.9%) |
| 5 Years | 85 (26.8%) | 0 (0.0%) |
| 6 to 11 Years | 138 (18.0%) | 266 (29.3%) |
| 12 to 14 Years | 44 (10.5%) | 83 (22.0%) |
| 15 Years | 65 (24.8%) | 29 (21.5%) |
| 16 and 17 Years | 60 (26.0%) | 63 (22.4%) |
| 18 to 24 Years | 187 (21.5%) | 214 (28.5%) |
| 25 to 34 Years | 141 (12.5%) | 268 (21.6%) |
| 35 to 44 Years | 412 (28.9%) | 631 (43.9%) |
| 45 to 54 Years | 140 (9.5%) | 283 (18.3%) |
| 55 to 64 Years | 388 (25.1%) | 422 (25.5%) |
| 65 to 74 Years | 112 (8.8%) | 205 (15.5%) |
| 75 Years and over | 65 (9.9%) | 80 (9.5%) |
| Total | 2,053 (18.6%) | 2,675 (24.1%) |
Income Above Poverty by Sex and Age in Johnson County
According to the poverty statistics in Johnson County, males aged 65 to 74 years and females aged 5 years are the age groups that are most secure financially, with 91.2% of males and 100.0% of females in these age groups living above the poverty line.
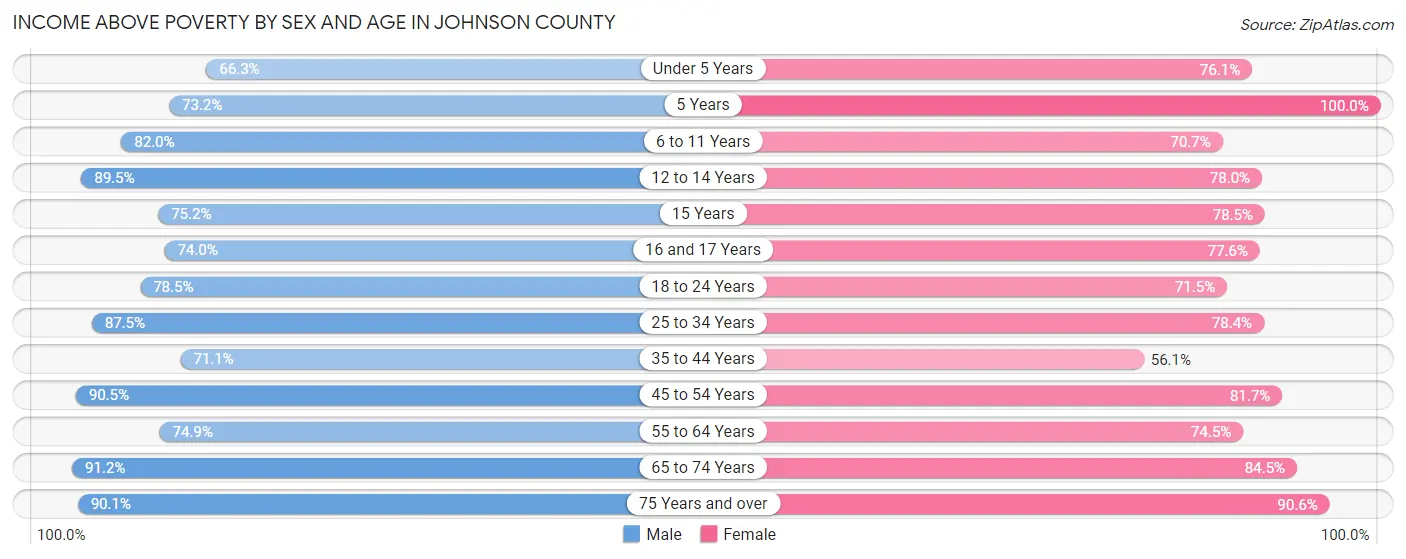
| Age Bracket | Male | Female |
| Under 5 Years | 424 (66.2%) | 418 (76.1%) |
| 5 Years | 232 (73.2%) | 35 (100.0%) |
| 6 to 11 Years | 630 (82.0%) | 641 (70.7%) |
| 12 to 14 Years | 374 (89.5%) | 294 (78.0%) |
| 15 Years | 197 (75.2%) | 106 (78.5%) |
| 16 and 17 Years | 171 (74.0%) | 218 (77.6%) |
| 18 to 24 Years | 684 (78.5%) | 537 (71.5%) |
| 25 to 34 Years | 989 (87.5%) | 970 (78.3%) |
| 35 to 44 Years | 1,012 (71.1%) | 805 (56.1%) |
| 45 to 54 Years | 1,332 (90.5%) | 1,266 (81.7%) |
| 55 to 64 Years | 1,160 (74.9%) | 1,232 (74.5%) |
| 65 to 74 Years | 1,159 (91.2%) | 1,115 (84.5%) |
| 75 Years and over | 594 (90.1%) | 767 (90.5%) |
| Total | 8,958 (81.4%) | 8,404 (75.9%) |
Income Below Poverty Among Married-Couple Families in Johnson County
The poverty statistics for married-couple families in Johnson County show that 9.5% or 456 of the total 4,794 families live below the poverty line. Families with 3 or 4 children have the highest poverty rate of 14.0%, comprising of 44 families. On the other hand, families with 5 or more children have the lowest poverty rate of 0.0%, which includes 0 families.
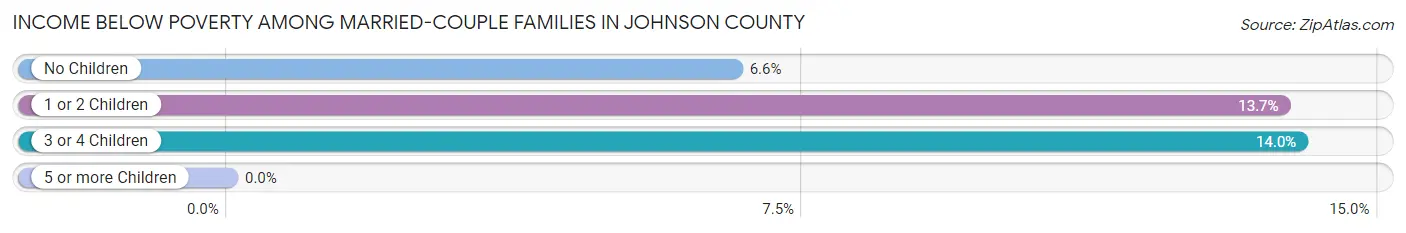
| Children | Above Poverty | Below Poverty |
| No Children | 2,650 (93.4%) | 187 (6.6%) |
| 1 or 2 Children | 1,413 (86.3%) | 225 (13.7%) |
| 3 or 4 Children | 271 (86.0%) | 44 (14.0%) |
| 5 or more Children | 4 (100.0%) | 0 (0.0%) |
| Total | 4,338 (90.5%) | 456 (9.5%) |
Income Below Poverty Among Single-Parent Households in Johnson County
According to the poverty data in Johnson County, 26.0% or 95 single-father households and 43.1% or 481 single-mother households are living below the poverty line. Among single-father households, those with 1 or 2 children have the highest poverty rate, with 34 households (31.5%) experiencing poverty. Likewise, among single-mother households, those with 3 or 4 children have the highest poverty rate, with 58 households (87.9%) falling below the poverty line.
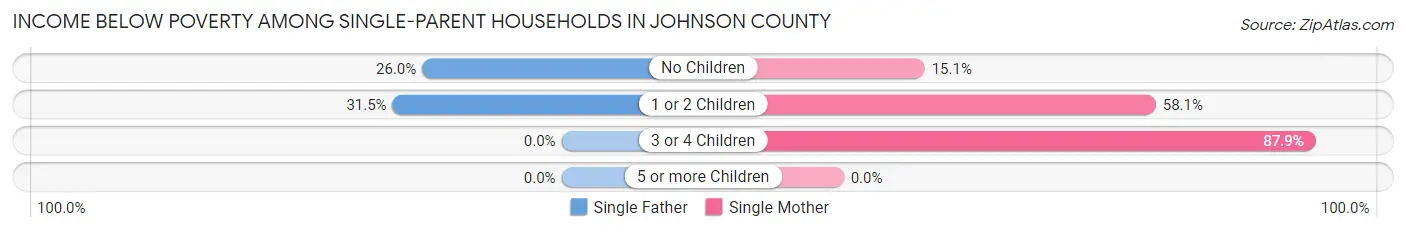
| Children | Single Father | Single Mother |
| No Children | 61 (26.0%) | 66 (15.1%) |
| 1 or 2 Children | 34 (31.5%) | 357 (58.1%) |
| 3 or 4 Children | 0 (0.0%) | 58 (87.9%) |
| 5 or more Children | 0 (0.0%) | 0 (0.0%) |
| Total | 95 (26.0%) | 481 (43.1%) |
Income Below Poverty Among Married-Couple vs Single-Parent Households in Johnson County
The poverty data for Johnson County shows that 456 of the married-couple family households (9.5%) and 576 of the single-parent households (38.9%) are living below the poverty level. Within the married-couple family households, those with 3 or 4 children have the highest poverty rate, with 44 households (14.0%) falling below the poverty line. Among the single-parent households, those with 3 or 4 children have the highest poverty rate, with 58 household (65.9%) living below poverty.
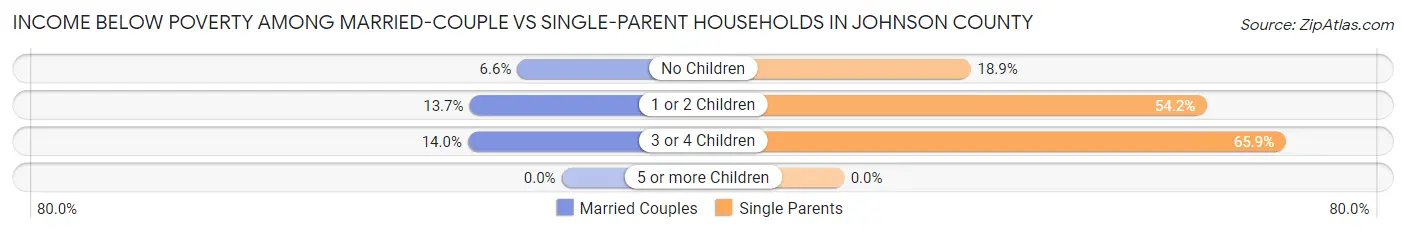
| Children | Married-Couple Families | Single-Parent Households |
| No Children | 187 (6.6%) | 127 (18.9%) |
| 1 or 2 Children | 225 (13.7%) | 391 (54.2%) |
| 3 or 4 Children | 44 (14.0%) | 58 (65.9%) |
| 5 or more Children | 0 (0.0%) | 0 (0.0%) |
| Total | 456 (9.5%) | 576 (38.9%) |
Race in Johnson County
The most populous races in Johnson County are White / Caucasian (21,837 | 96.5%), Two or more Races (384 | 1.7%), and Asian (269 | 1.2%).
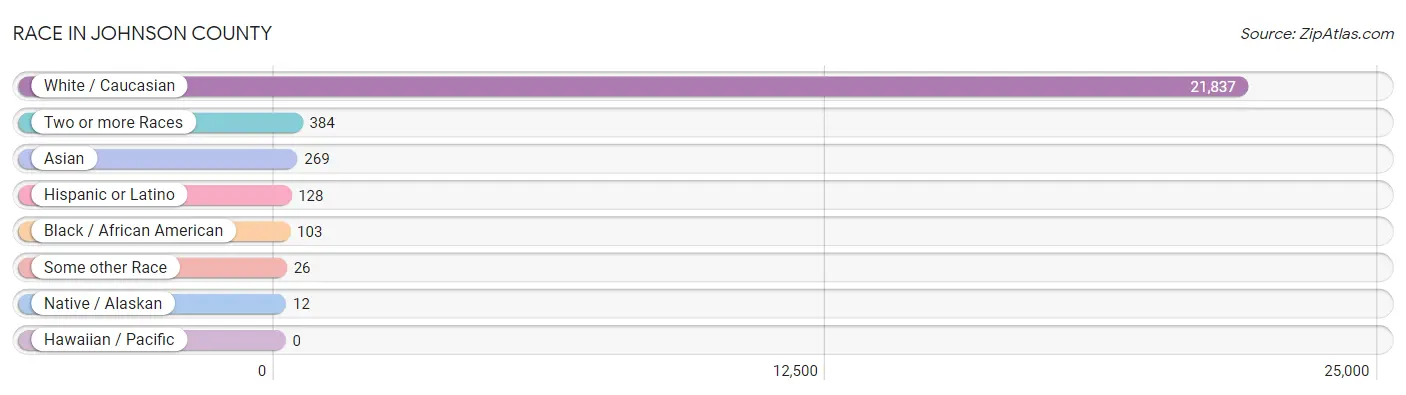
| Race | # Population | % Population |
| Asian | 269 | 1.2% |
| Black / African American | 103 | 0.5% |
| Hawaiian / Pacific | 0 | 0.0% |
| Hispanic or Latino | 128 | 0.6% |
| Native / Alaskan | 12 | 0.1% |
| White / Caucasian | 21,837 | 96.5% |
| Two or more Races | 384 | 1.7% |
| Some other Race | 26 | 0.1% |
| Total | 22,631 | 100.0% |
Ancestry in Johnson County
The most populous ancestries reported in Johnson County are American (6,991 | 30.9%), English (2,543 | 11.2%), Irish (2,248 | 9.9%), German (1,740 | 7.7%), and Scotch-Irish (314 | 1.4%), together accounting for 61.1% of all Johnson County residents.
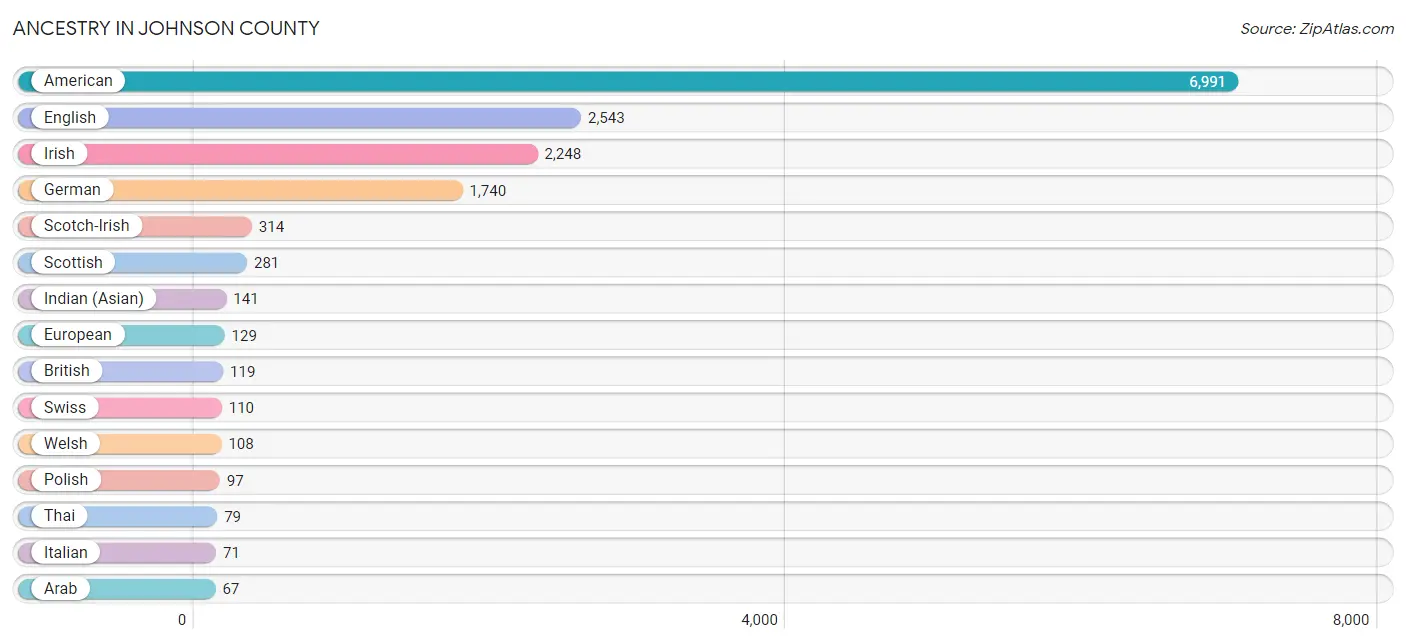
| Ancestry | # Population | % Population |
| American | 6,991 | 30.9% |
| Arab | 67 | 0.3% |
| Bahamian | 25 | 0.1% |
| Blackfeet | 22 | 0.1% |
| British | 119 | 0.5% |
| Central American | 40 | 0.2% |
| Cherokee | 37 | 0.2% |
| Choctaw | 12 | 0.1% |
| Costa Rican | 34 | 0.2% |
| Dutch | 15 | 0.1% |
| English | 2,543 | 11.2% |
| European | 129 | 0.6% |
| French | 52 | 0.2% |
| German | 1,740 | 7.7% |
| Honduran | 6 | 0.0% |
| Icelander | 29 | 0.1% |
| Indian (Asian) | 141 | 0.6% |
| Irish | 2,248 | 9.9% |
| Italian | 71 | 0.3% |
| Laotian | 49 | 0.2% |
| Maltese | 20 | 0.1% |
| Mexican | 54 | 0.2% |
| Nigerian | 9 | 0.0% |
| Polish | 97 | 0.4% |
| Puerto Rican | 13 | 0.1% |
| Russian | 25 | 0.1% |
| Scotch-Irish | 314 | 1.4% |
| Scottish | 281 | 1.2% |
| Sioux | 8 | 0.0% |
| South American | 21 | 0.1% |
| Subsaharan African | 9 | 0.0% |
| Swiss | 110 | 0.5% |
| Thai | 79 | 0.4% |
| Venezuelan | 21 | 0.1% |
| Welsh | 108 | 0.5% | View All 35 Rows |
Immigrants in Johnson County
The most numerous immigrant groups reported in Johnson County came from Asia (192 | 0.9%), Latin America (98 | 0.4%), Bangladesh (79 | 0.4%), South Central Asia (79 | 0.4%), and China (55 | 0.2%), together accounting for 2.2% of all Johnson County residents.
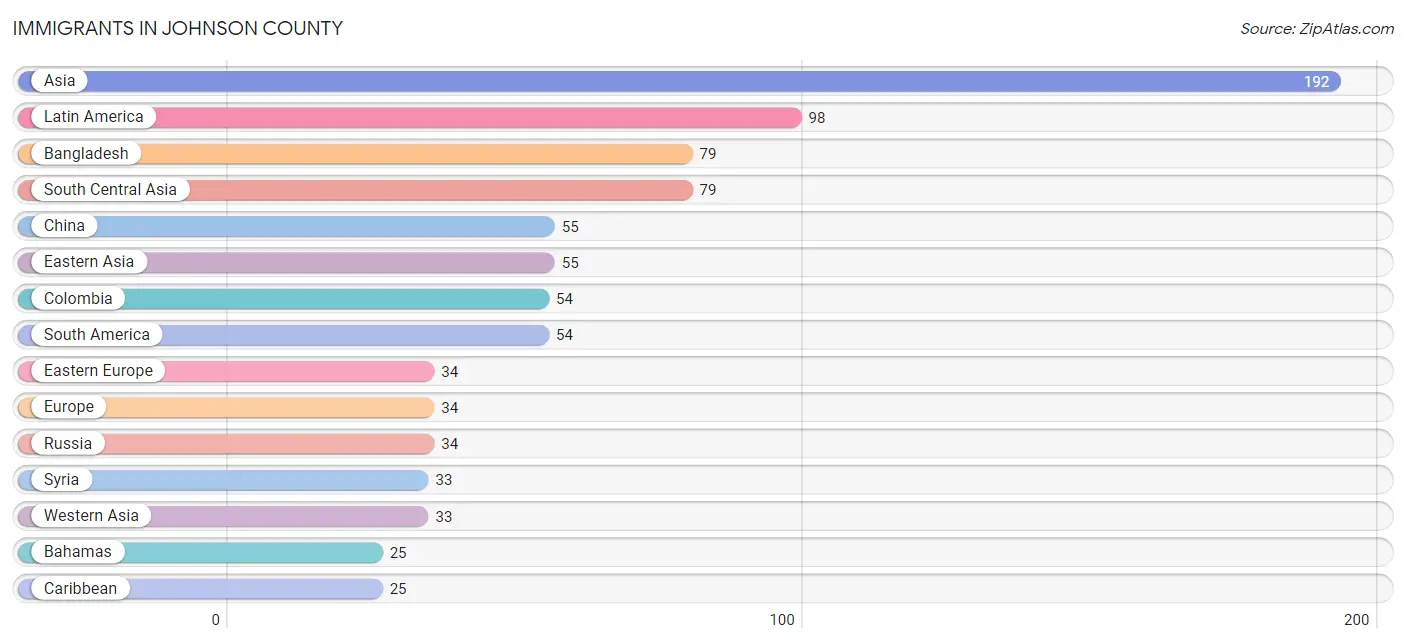
| Immigration Origin | # Population | % Population |
| Asia | 192 | 0.9% |
| Bahamas | 25 | 0.1% |
| Bangladesh | 79 | 0.4% |
| Caribbean | 25 | 0.1% |
| Central America | 19 | 0.1% |
| China | 55 | 0.2% |
| Colombia | 54 | 0.2% |
| Costa Rica | 13 | 0.1% |
| Eastern Asia | 55 | 0.2% |
| Eastern Europe | 34 | 0.2% |
| Europe | 34 | 0.2% |
| Honduras | 6 | 0.0% |
| Indonesia | 25 | 0.1% |
| Latin America | 98 | 0.4% |
| Russia | 34 | 0.2% |
| South America | 54 | 0.2% |
| South Central Asia | 79 | 0.4% |
| South Eastern Asia | 25 | 0.1% |
| Syria | 33 | 0.2% |
| Western Asia | 33 | 0.2% | View All 20 Rows |
Sex and Age in Johnson County
Sex and Age in Johnson County
The most populous age groups in Johnson County are 65 to 69 Years (882 | 7.8%) for men and 55 to 59 Years (854 | 7.5%) for women.
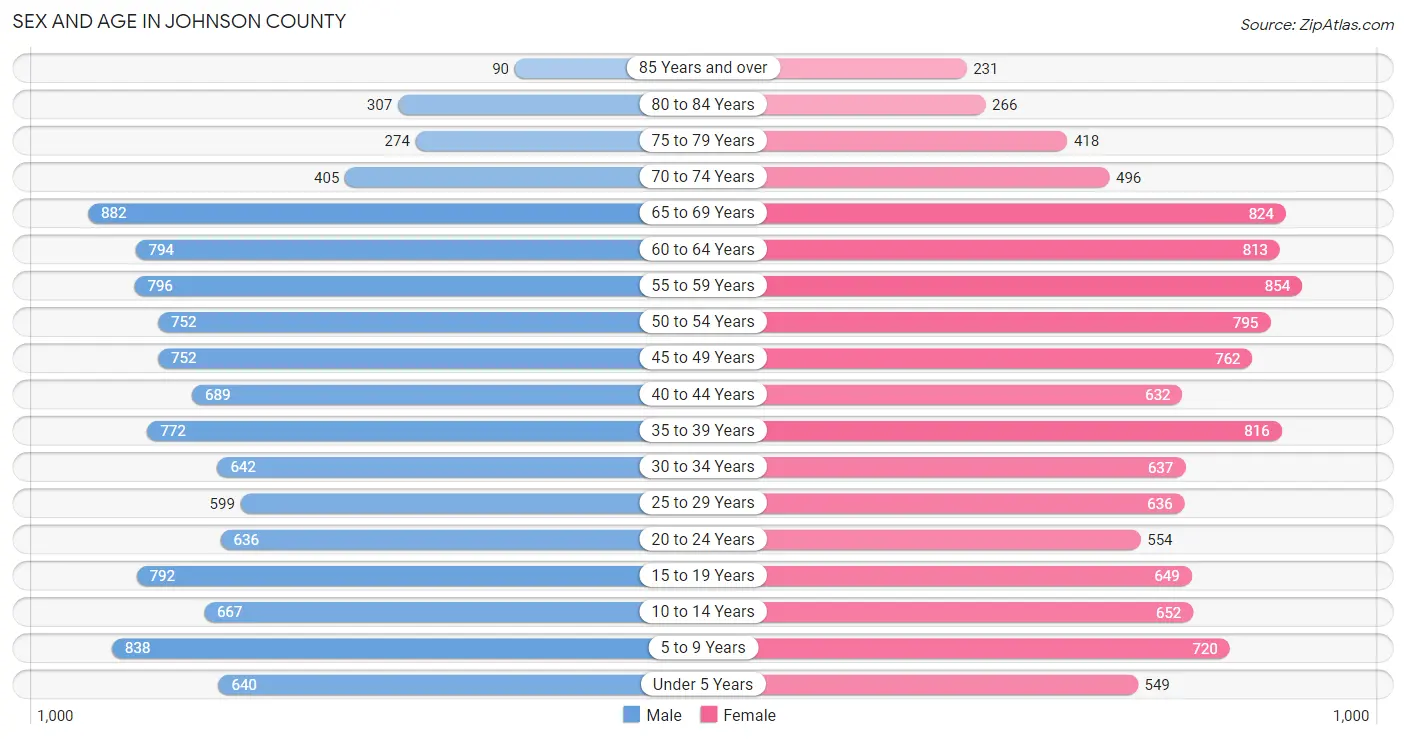
| Age Bracket | Male | Female |
| Under 5 Years | 640 (5.7%) | 549 (4.9%) |
| 5 to 9 Years | 838 (7.4%) | 720 (6.4%) |
| 10 to 14 Years | 667 (5.9%) | 652 (5.8%) |
| 15 to 19 Years | 792 (7.0%) | 649 (5.7%) |
| 20 to 24 Years | 636 (5.6%) | 554 (4.9%) |
| 25 to 29 Years | 599 (5.3%) | 636 (5.6%) |
| 30 to 34 Years | 642 (5.7%) | 637 (5.6%) |
| 35 to 39 Years | 772 (6.8%) | 816 (7.2%) |
| 40 to 44 Years | 689 (6.1%) | 632 (5.6%) |
| 45 to 49 Years | 752 (6.6%) | 762 (6.7%) |
| 50 to 54 Years | 752 (6.6%) | 795 (7.0%) |
| 55 to 59 Years | 796 (7.0%) | 854 (7.5%) |
| 60 to 64 Years | 794 (7.0%) | 813 (7.2%) |
| 65 to 69 Years | 882 (7.8%) | 824 (7.3%) |
| 70 to 74 Years | 405 (3.6%) | 496 (4.4%) |
| 75 to 79 Years | 274 (2.4%) | 418 (3.7%) |
| 80 to 84 Years | 307 (2.7%) | 266 (2.4%) |
| 85 Years and over | 90 (0.8%) | 231 (2.0%) |
| Total | 11,327 (100.0%) | 11,304 (100.0%) |
Families and Households in Johnson County
Median Family Size in Johnson County
The median family size in Johnson County is 3.01 persons per family, with married-couple families (4,794 | 76.4%) accounting for the largest median family size of 3.12 persons per family. On the other hand, single female/mother families (1,117 | 17.8%) represent the smallest median family size with 2.62 persons per family.
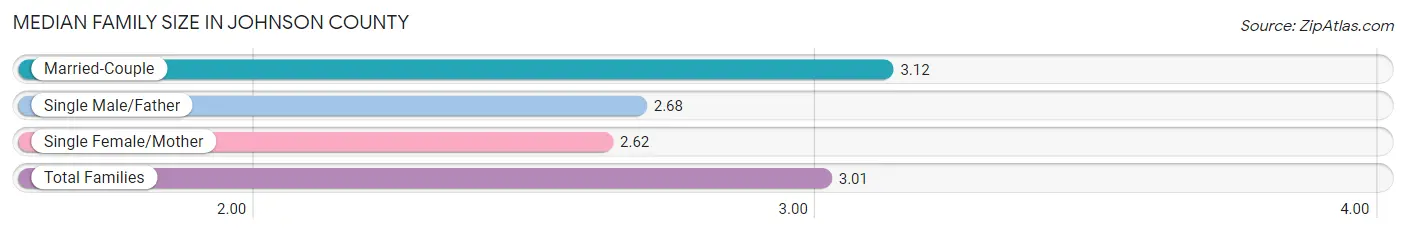
| Family Type | # Families | Family Size |
| Married-Couple | 4,794 (76.4%) | 3.12 |
| Single Male/Father | 365 (5.8%) | 2.68 |
| Single Female/Mother | 1,117 (17.8%) | 2.62 |
| Total Families | 6,276 (100.0%) | 3.01 |
Median Household Size in Johnson County
The median household size in Johnson County is 2.59 persons per household, with married-couple households (4,794 | 56.2%) accounting for the largest median household size of 3.15 persons per household. non-family households (2,258 | 26.5%) represent the smallest median household size with 1.20 persons per household.
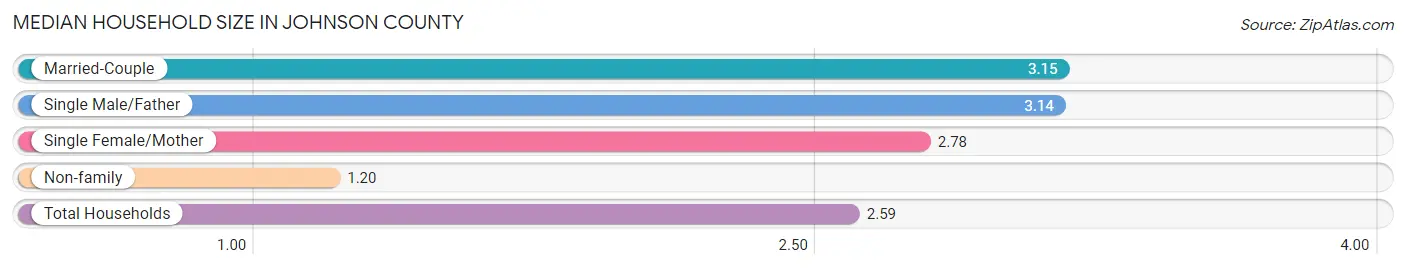
| Household Type | # Households | Household Size |
| Married-Couple | 4,794 (56.2%) | 3.15 |
| Single Male/Father | 365 (4.3%) | 3.14 |
| Single Female/Mother | 1,117 (13.1%) | 2.78 |
| Non-family | 2,258 (26.5%) | 1.20 |
| Total Households | 8,534 (100.0%) | 2.59 |
Household Size by Marriage Status in Johnson County
Out of a total of 8,534 households in Johnson County, 6,276 (73.5%) are family households, while 2,258 (26.5%) are nonfamily households. The most numerous type of family households are 2-person households, comprising 3,079, and the most common type of nonfamily households are 1-person households, comprising 1,948.
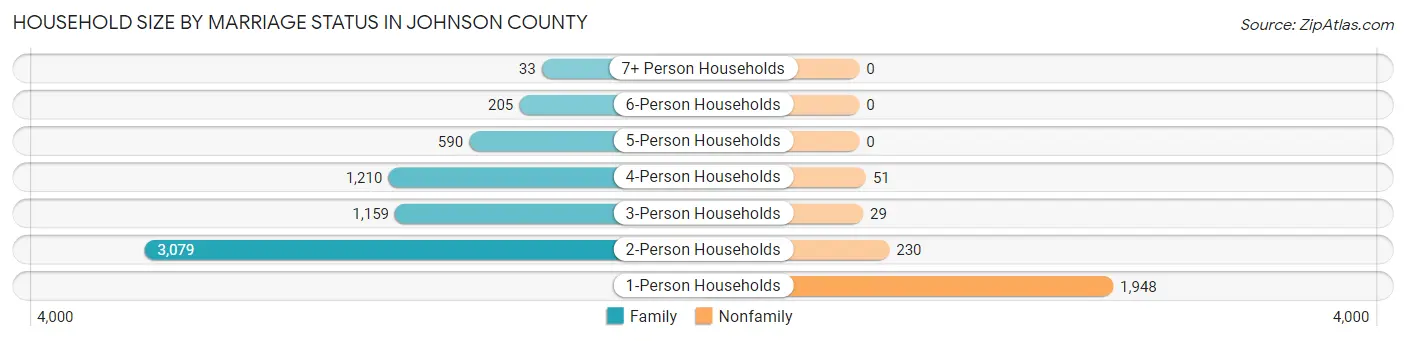
| Household Size | Family Households | Nonfamily Households |
| 1-Person Households | - | 1,948 (22.8%) |
| 2-Person Households | 3,079 (36.1%) | 230 (2.7%) |
| 3-Person Households | 1,159 (13.6%) | 29 (0.3%) |
| 4-Person Households | 1,210 (14.2%) | 51 (0.6%) |
| 5-Person Households | 590 (6.9%) | 0 (0.0%) |
| 6-Person Households | 205 (2.4%) | 0 (0.0%) |
| 7+ Person Households | 33 (0.4%) | 0 (0.0%) |
| Total | 6,276 (73.5%) | 2,258 (26.5%) |
Female Fertility in Johnson County
Fertility by Age in Johnson County
Average fertility rate in Johnson County is 43.0 births per 1,000 women. Women in the age bracket of 20 to 34 years have the highest fertility rate with 92.0 births per 1,000 women. Women in the age bracket of 20 to 34 years acount for 80.4% of all women with births.
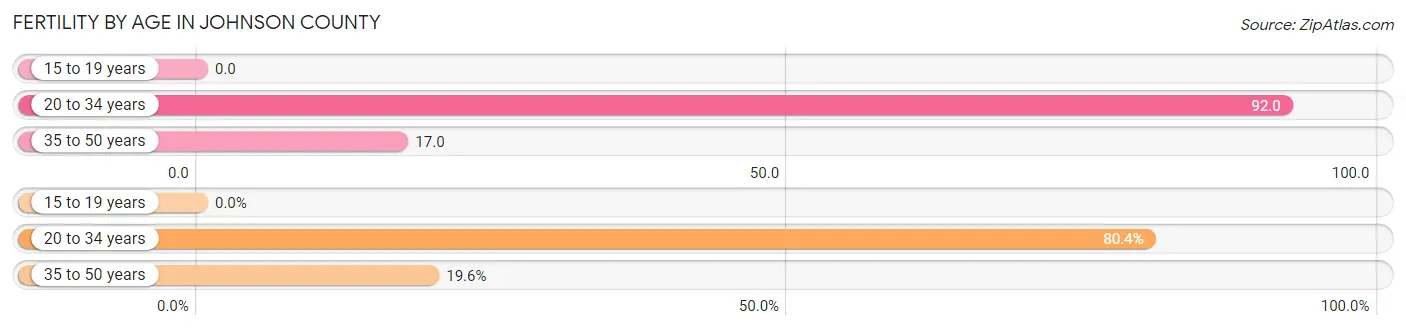
| Age Bracket | Women with Births | Births / 1,000 Women |
| 15 to 19 years | 0 (0.0%) | 0.0 |
| 20 to 34 years | 168 (80.4%) | 92.0 |
| 35 to 50 years | 41 (19.6%) | 17.0 |
| Total | 209 (100.0%) | 43.0 |
Fertility by Age by Marriage Status in Johnson County
67.5% of women with births (209) in Johnson County are married. The highest percentage of unmarried women with births falls into 20 to 34 years age bracket with 40.5% of them unmarried at the time of birth, while the lowest percentage of unmarried women with births belong to 35 to 50 years age bracket with 0.0% of them unmarried.
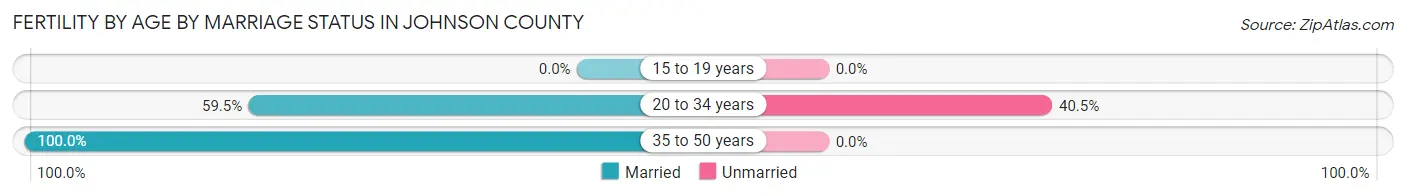
| Age Bracket | Married | Unmarried |
| 15 to 19 years | 0 (0.0%) | 0 (0.0%) |
| 20 to 34 years | 100 (59.5%) | 68 (40.5%) |
| 35 to 50 years | 41 (100.0%) | 0 (0.0%) |
| Total | 141 (67.5%) | 68 (32.5%) |
Fertility by Education in Johnson County
Average fertility rate in Johnson County is 43.0 births per 1,000 women. Women with the education attainment of bachelor's degree have the highest fertility rate of 103.0 births per 1,000 women, while women with the education attainment of college or associate's degree have the lowest fertility at 13.0 births per 1,000 women. Women with the education attainment of high school diploma represent 54.1% of all women with births.
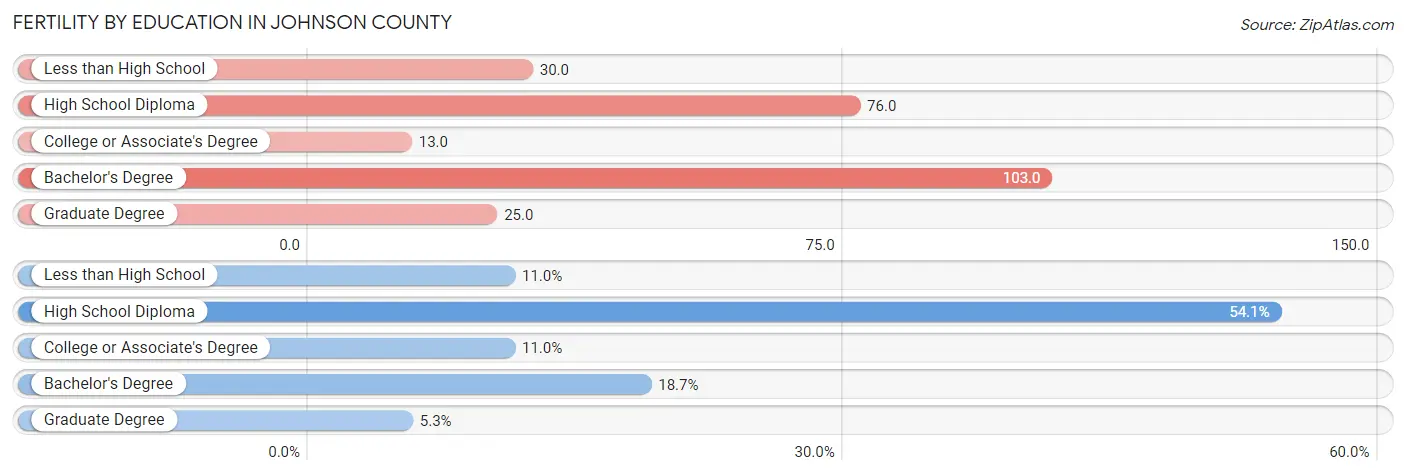
| Educational Attainment | Women with Births | Births / 1,000 Women |
| Less than High School | 23 (11.0%) | 30.0 |
| High School Diploma | 113 (54.1%) | 76.0 |
| College or Associate's Degree | 23 (11.0%) | 13.0 |
| Bachelor's Degree | 39 (18.7%) | 103.0 |
| Graduate Degree | 11 (5.3%) | 25.0 |
| Total | 209 (100.0%) | 43.0 |
Fertility by Education by Marriage Status in Johnson County
32.5% of women with births in Johnson County are unmarried. Women with the educational attainment of less than high school are most likely to be married with 100.0% of them married at childbirth, while women with the educational attainment of high school diploma are least likely to be married with 53.1% of them unmarried at childbirth.
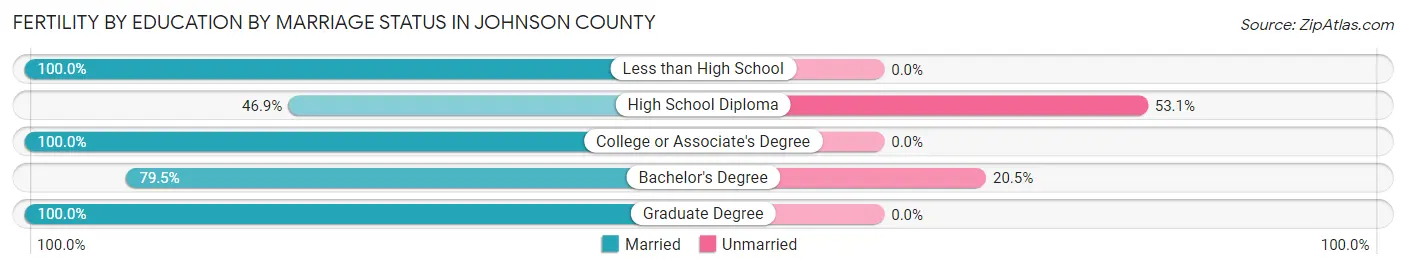
| Educational Attainment | Married | Unmarried |
| Less than High School | 23 (100.0%) | 0 (0.0%) |
| High School Diploma | 53 (46.9%) | 60 (53.1%) |
| College or Associate's Degree | 23 (100.0%) | 0 (0.0%) |
| Bachelor's Degree | 31 (79.5%) | 8 (20.5%) |
| Graduate Degree | 11 (100.0%) | 0 (0.0%) |
| Total | 141 (67.5%) | 68 (32.5%) |
Employment Characteristics in Johnson County
Employment by Class of Employer in Johnson County
Among the 7,168 employed individuals in Johnson County, private company employees (4,525 | 63.1%), local government employees (801 | 11.2%), and state government employees (692 | 9.7%) make up the most common classes of employment.
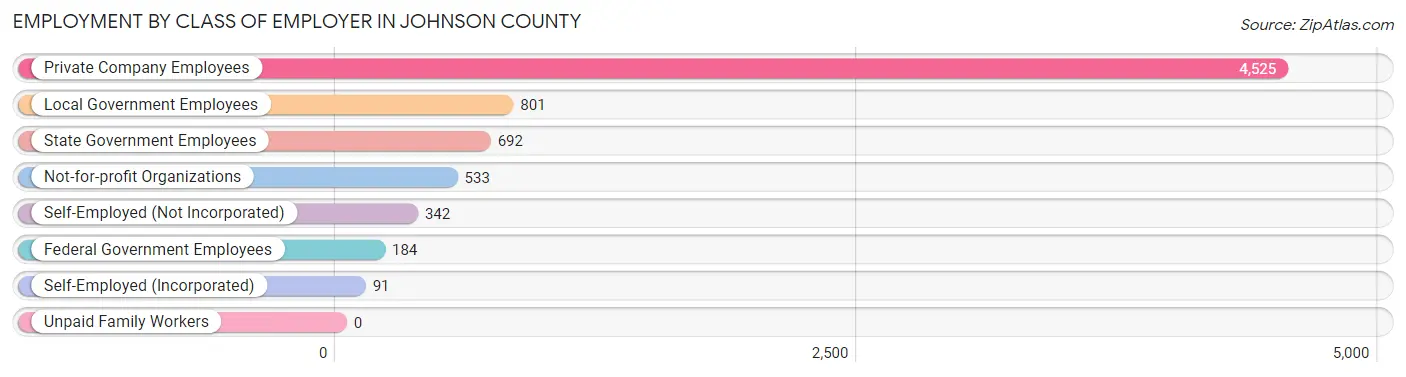
| Employer Class | # Employees | % Employees |
| Private Company Employees | 4,525 | 63.1% |
| Self-Employed (Incorporated) | 91 | 1.3% |
| Self-Employed (Not Incorporated) | 342 | 4.8% |
| Not-for-profit Organizations | 533 | 7.4% |
| Local Government Employees | 801 | 11.2% |
| State Government Employees | 692 | 9.7% |
| Federal Government Employees | 184 | 2.6% |
| Unpaid Family Workers | 0 | 0.0% |
| Total | 7,168 | 100.0% |
Employment Status by Age in Johnson County
According to the labor force statistics for Johnson County, out of the total population over 16 years of age (18,162), 44.6% or 8,100 individuals are in the labor force, with 5.3% or 429 of them unemployed. The age group with the highest labor force participation rate is 30 to 34 years, with 77.8% or 995 individuals in the labor force. Within the labor force, the 30 to 34 years age range has the highest percentage of unemployed individuals, with 20.1% or 200 of them being unemployed.
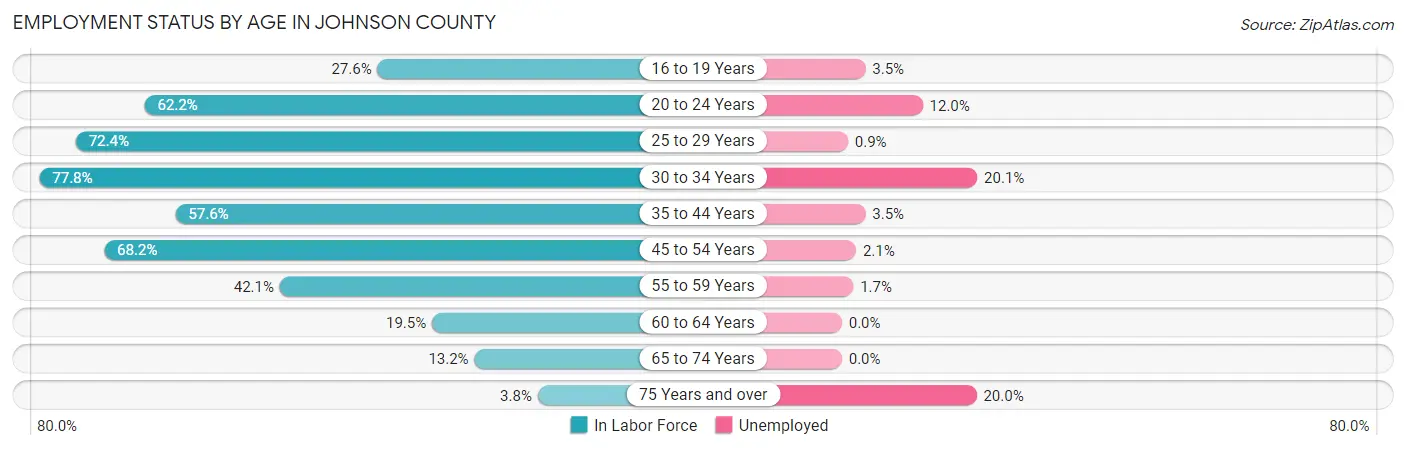
| Age Bracket | In Labor Force | Unemployed |
| 16 to 19 Years | 286 (27.6%) | 10 (3.5%) |
| 20 to 24 Years | 740 (62.2%) | 89 (12.0%) |
| 25 to 29 Years | 894 (72.4%) | 8 (0.9%) |
| 30 to 34 Years | 995 (77.8%) | 200 (20.1%) |
| 35 to 44 Years | 1,676 (57.6%) | 59 (3.5%) |
| 45 to 54 Years | 2,088 (68.2%) | 44 (2.1%) |
| 55 to 59 Years | 695 (42.1%) | 12 (1.7%) |
| 60 to 64 Years | 313 (19.5%) | 0 (0.0%) |
| 65 to 74 Years | 344 (13.2%) | 0 (0.0%) |
| 75 Years and over | 60 (3.8%) | 12 (20.0%) |
| Total | 8,100 (44.6%) | 429 (5.3%) |
Employment Status by Educational Attainment in Johnson County
According to labor force statistics for Johnson County, 56.8% of individuals (6,669) out of the total population between 25 and 64 years of age (11,741) are in the labor force, with 4.8% or 320 of them being unemployed. The group with the highest labor force participation rate are those with the educational attainment of bachelor's degree or higher, with 87.0% or 1,672 individuals in the labor force. Within the labor force, individuals with college / associate degree education have the highest percentage of unemployment, with 7.3% or 191 of them being unemployed.
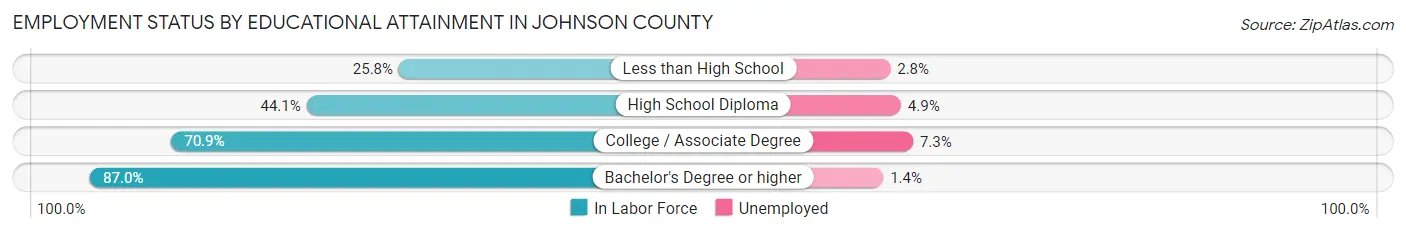
| Educational Attainment | In Labor Force | Unemployed |
| Less than High School | 462 (25.8%) | 50 (2.8%) |
| High School Diploma | 1,913 (44.1%) | 213 (4.9%) |
| College / Associate Degree | 2,618 (70.9%) | 270 (7.3%) |
| Bachelor's Degree or higher | 1,672 (87.0%) | 27 (1.4%) |
| Total | 6,669 (56.8%) | 564 (4.8%) |
Employment Occupations by Sex in Johnson County
Management, Business, Science and Arts Occupations
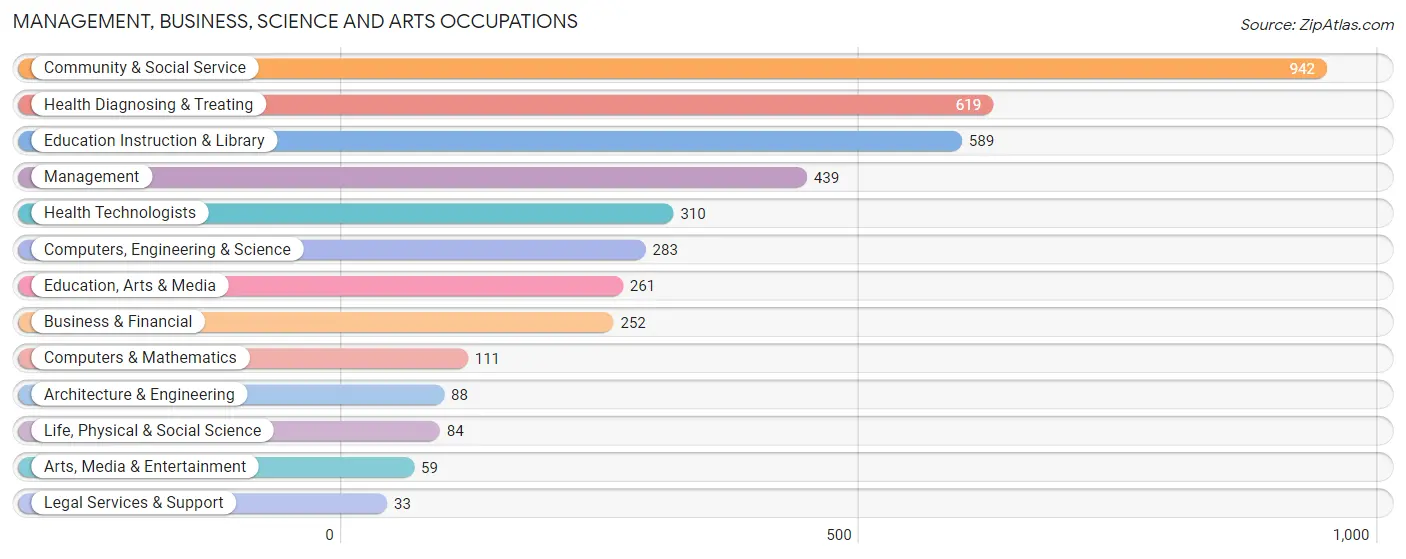
The most common Management, Business, Science and Arts occupations in Johnson County are Community & Social Service (942 | 12.3%), Health Diagnosing & Treating (619 | 8.1%), Education Instruction & Library (589 | 7.7%), Management (439 | 5.7%), and Health Technologists (310 | 4.1%).
Management, Business, Science and Arts Occupations by Sex
Within the Management, Business, Science and Arts occupations in Johnson County, the most male-oriented occupations are Computers & Mathematics (100.0%), Computers, Engineering & Science (60.1%), and Education, Arts & Media (57.9%), while the most female-oriented occupations are Health Technologists (89.3%), Health Diagnosing & Treating (78.5%), and Education Instruction & Library (67.9%).
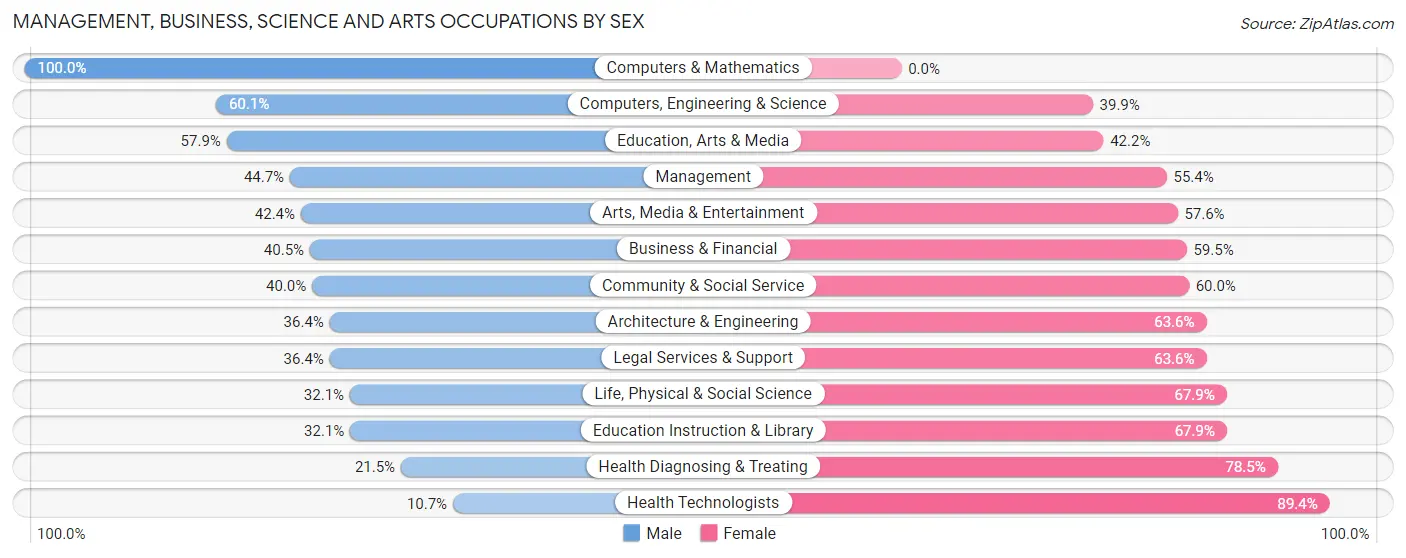
| Occupation | Male | Female |
| Management | 196 (44.7%) | 243 (55.3%) |
| Business & Financial | 102 (40.5%) | 150 (59.5%) |
| Computers, Engineering & Science | 170 (60.1%) | 113 (39.9%) |
| Computers & Mathematics | 111 (100.0%) | 0 (0.0%) |
| Architecture & Engineering | 32 (36.4%) | 56 (63.6%) |
| Life, Physical & Social Science | 27 (32.1%) | 57 (67.9%) |
| Community & Social Service | 377 (40.0%) | 565 (60.0%) |
| Education, Arts & Media | 151 (57.9%) | 110 (42.1%) |
| Legal Services & Support | 12 (36.4%) | 21 (63.6%) |
| Education Instruction & Library | 189 (32.1%) | 400 (67.9%) |
| Arts, Media & Entertainment | 25 (42.4%) | 34 (57.6%) |
| Health Diagnosing & Treating | 133 (21.5%) | 486 (78.5%) |
| Health Technologists | 33 (10.6%) | 277 (89.3%) |
| Total (Category) | 978 (38.6%) | 1,557 (61.4%) |
| Total (Overall) | 4,009 (52.3%) | 3,653 (47.7%) |
Services Occupations
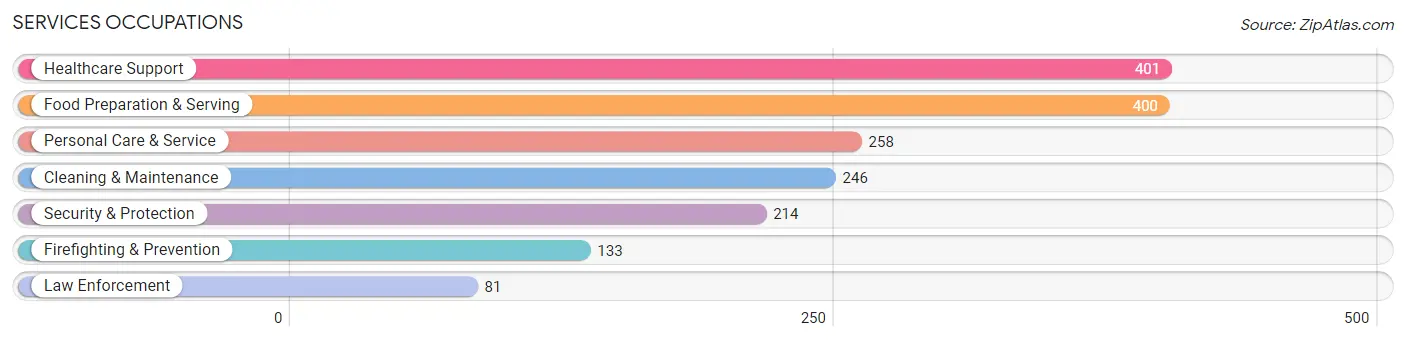
The most common Services occupations in Johnson County are Healthcare Support (401 | 5.2%), Food Preparation & Serving (400 | 5.2%), Personal Care & Service (258 | 3.4%), Cleaning & Maintenance (246 | 3.2%), and Security & Protection (214 | 2.8%).
Services Occupations by Sex
Within the Services occupations in Johnson County, the most male-oriented occupations are Security & Protection (100.0%), Firefighting & Prevention (100.0%), and Law Enforcement (100.0%), while the most female-oriented occupations are Healthcare Support (95.8%), Personal Care & Service (78.7%), and Cleaning & Maintenance (59.4%).
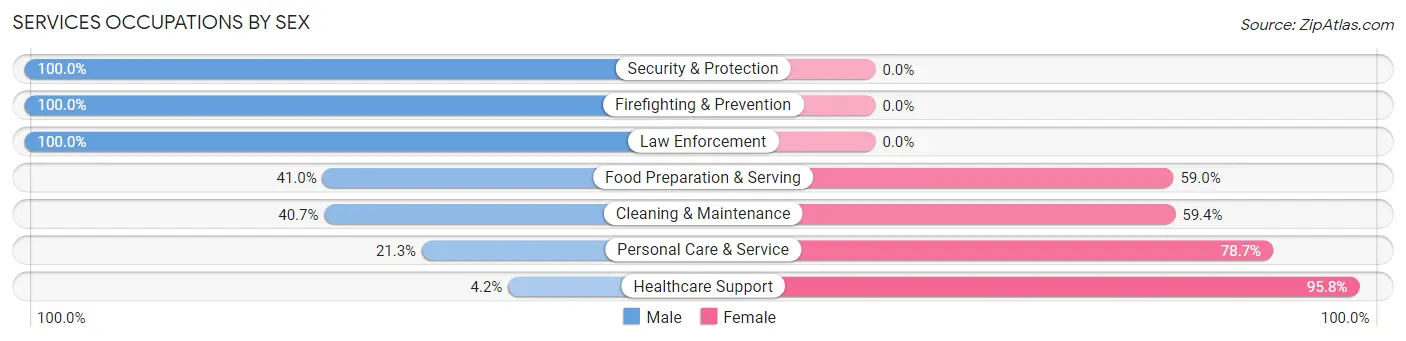
| Occupation | Male | Female |
| Healthcare Support | 17 (4.2%) | 384 (95.8%) |
| Security & Protection | 214 (100.0%) | 0 (0.0%) |
| Firefighting & Prevention | 133 (100.0%) | 0 (0.0%) |
| Law Enforcement | 81 (100.0%) | 0 (0.0%) |
| Food Preparation & Serving | 164 (41.0%) | 236 (59.0%) |
| Cleaning & Maintenance | 100 (40.6%) | 146 (59.4%) |
| Personal Care & Service | 55 (21.3%) | 203 (78.7%) |
| Total (Category) | 550 (36.2%) | 969 (63.8%) |
| Total (Overall) | 4,009 (52.3%) | 3,653 (47.7%) |
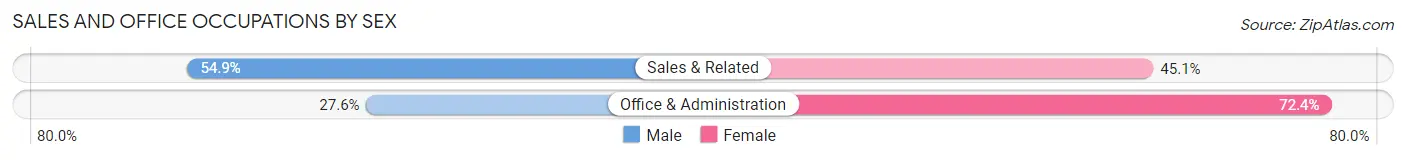
Sales and Office Occupations
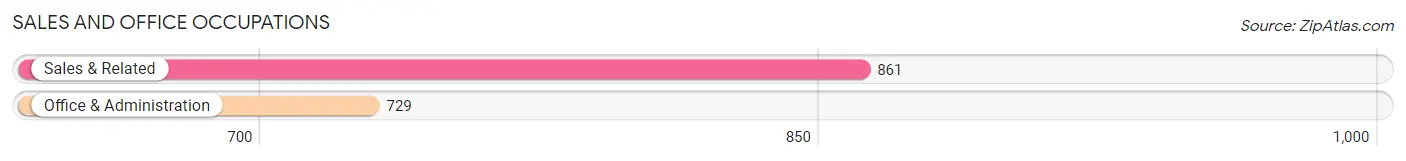
The most common Sales and Office occupations in Johnson County are Sales & Related (861 | 11.2%), and Office & Administration (729 | 9.5%).
Sales and Office Occupations by Sex
| Occupation | Male | Female |
| Sales & Related | 473 (54.9%) | 388 (45.1%) |
| Office & Administration | 201 (27.6%) | 528 (72.4%) |
| Total (Category) | 674 (42.4%) | 916 (57.6%) |
| Total (Overall) | 4,009 (52.3%) | 3,653 (47.7%) |
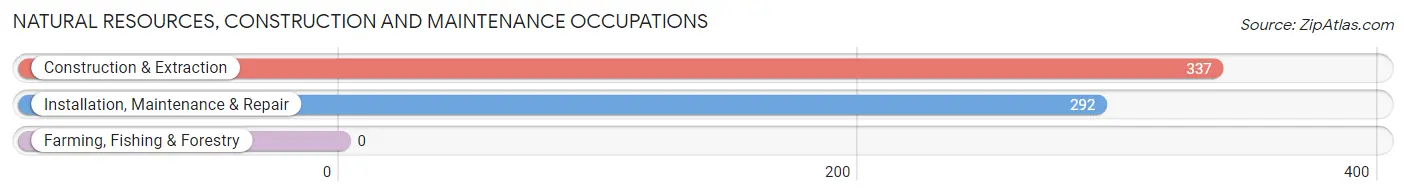
Natural Resources, Construction and Maintenance Occupations
The most common Natural Resources, Construction and Maintenance occupations in Johnson County are Construction & Extraction (337 | 4.4%), and Installation, Maintenance & Repair (292 | 3.8%).
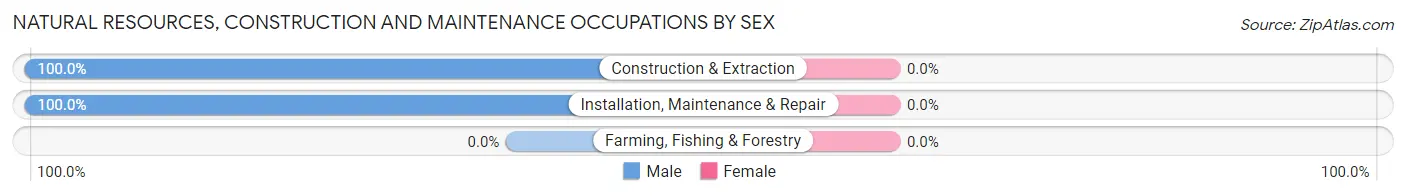
Natural Resources, Construction and Maintenance Occupations by Sex
| Occupation | Male | Female |
| Farming, Fishing & Forestry | 0 (0.0%) | 0 (0.0%) |
| Construction & Extraction | 337 (100.0%) | 0 (0.0%) |
| Installation, Maintenance & Repair | 292 (100.0%) | 0 (0.0%) |
| Total (Category) | 629 (100.0%) | 0 (0.0%) |
| Total (Overall) | 4,009 (52.3%) | 3,653 (47.7%) |
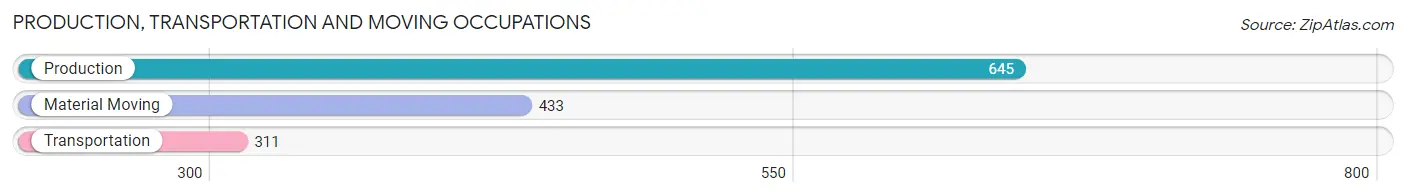
Production, Transportation and Moving Occupations
The most common Production, Transportation and Moving occupations in Johnson County are Production (645 | 8.4%), Material Moving (433 | 5.7%), and Transportation (311 | 4.1%).
Production, Transportation and Moving Occupations by Sex
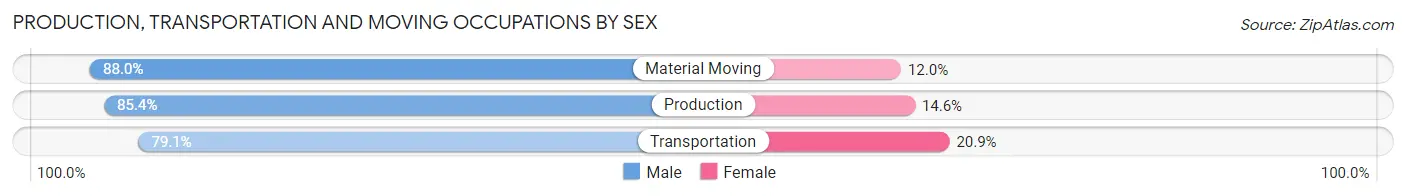
| Occupation | Male | Female |
| Production | 551 (85.4%) | 94 (14.6%) |
| Transportation | 246 (79.1%) | 65 (20.9%) |
| Material Moving | 381 (88.0%) | 52 (12.0%) |
| Total (Category) | 1,178 (84.8%) | 211 (15.2%) |
| Total (Overall) | 4,009 (52.3%) | 3,653 (47.7%) |
Employment Industries by Sex in Johnson County
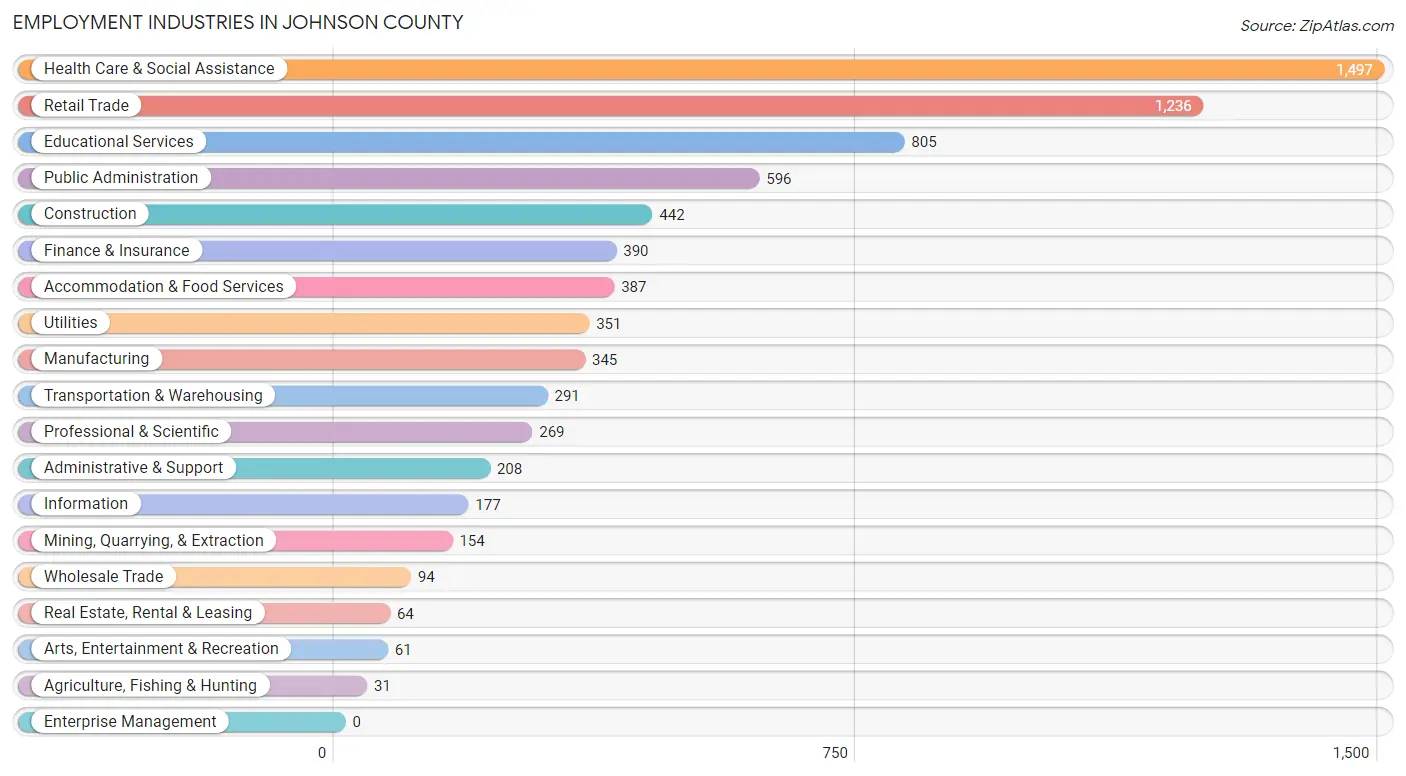
Employment Industries in Johnson County
The major employment industries in Johnson County include Health Care & Social Assistance (1,497 | 19.5%), Retail Trade (1,236 | 16.1%), Educational Services (805 | 10.5%), Public Administration (596 | 7.8%), and Construction (442 | 5.8%).
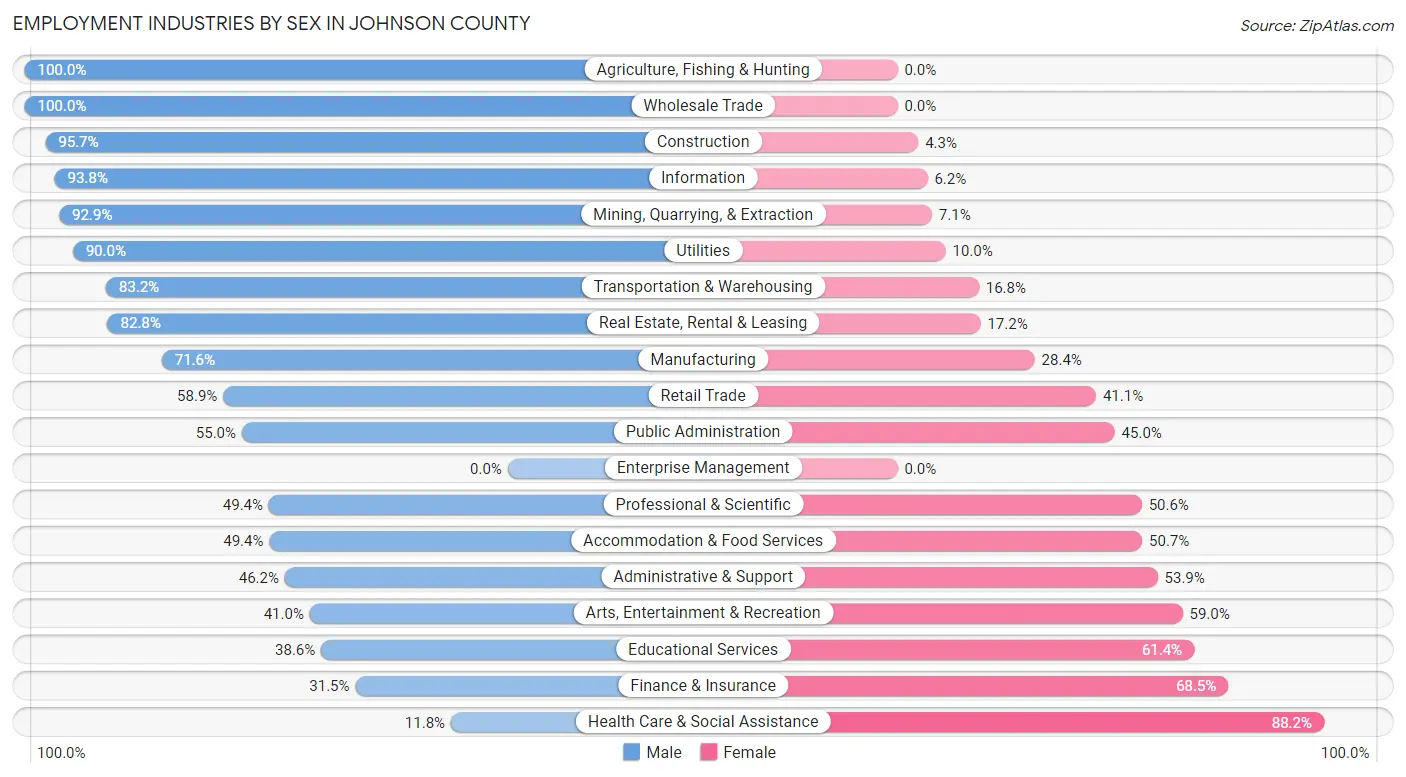
Employment Industries by Sex in Johnson County
The Johnson County industries that see more men than women are Agriculture, Fishing & Hunting (100.0%), Wholesale Trade (100.0%), and Construction (95.7%), whereas the industries that tend to have a higher number of women are Health Care & Social Assistance (88.2%), Finance & Insurance (68.5%), and Educational Services (61.4%).
| Industry | Male | Female |
| Agriculture, Fishing & Hunting | 31 (100.0%) | 0 (0.0%) |
| Mining, Quarrying, & Extraction | 143 (92.9%) | 11 (7.1%) |
| Construction | 423 (95.7%) | 19 (4.3%) |
| Manufacturing | 247 (71.6%) | 98 (28.4%) |
| Wholesale Trade | 94 (100.0%) | 0 (0.0%) |
| Retail Trade | 728 (58.9%) | 508 (41.1%) |
| Transportation & Warehousing | 242 (83.2%) | 49 (16.8%) |
| Utilities | 316 (90.0%) | 35 (10.0%) |
| Information | 166 (93.8%) | 11 (6.2%) |
| Finance & Insurance | 123 (31.5%) | 267 (68.5%) |
| Real Estate, Rental & Leasing | 53 (82.8%) | 11 (17.2%) |
| Professional & Scientific | 133 (49.4%) | 136 (50.6%) |
| Enterprise Management | 0 (0.0%) | 0 (0.0%) |
| Administrative & Support | 96 (46.2%) | 112 (53.8%) |
| Educational Services | 311 (38.6%) | 494 (61.4%) |
| Health Care & Social Assistance | 176 (11.8%) | 1,321 (88.2%) |
| Arts, Entertainment & Recreation | 25 (41.0%) | 36 (59.0%) |
| Accommodation & Food Services | 191 (49.3%) | 196 (50.6%) |
| Public Administration | 328 (55.0%) | 268 (45.0%) |
| Total | 4,009 (52.3%) | 3,653 (47.7%) |
Education in Johnson County
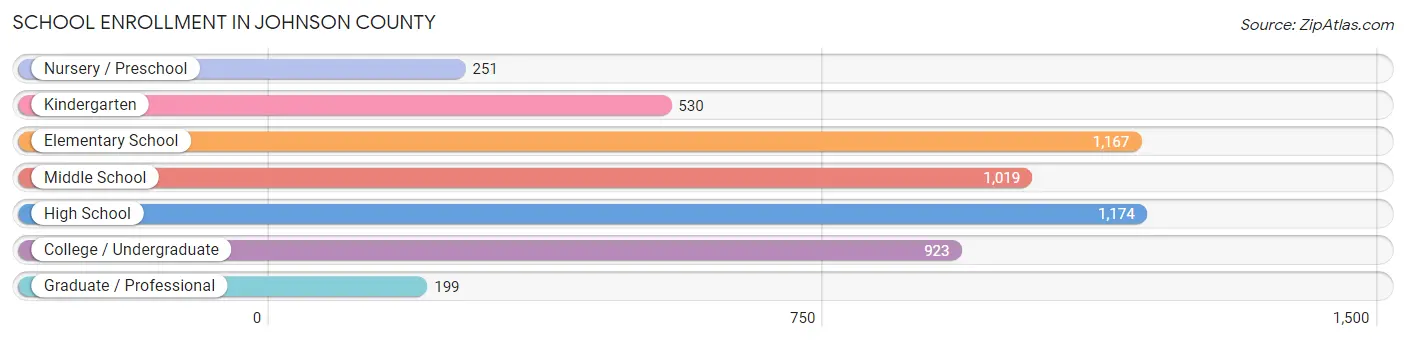
School Enrollment in Johnson County
The most common levels of schooling among the 5,263 students in Johnson County are high school (1,174 | 22.3%), elementary school (1,167 | 22.2%), and middle school (1,019 | 19.4%).
| School Level | # Students | % Students |
| Nursery / Preschool | 251 | 4.8% |
| Kindergarten | 530 | 10.1% |
| Elementary School | 1,167 | 22.2% |
| Middle School | 1,019 | 19.4% |
| High School | 1,174 | 22.3% |
| College / Undergraduate | 923 | 17.5% |
| Graduate / Professional | 199 | 3.8% |
| Total | 5,263 | 100.0% |
School Enrollment by Age by Funding Source in Johnson County
Out of a total of 5,263 students who are enrolled in schools in Johnson County, 579 (11.0%) attend a private institution, while the remaining 4,684 (89.0%) are enrolled in public schools. The age group of 25 to 34 year olds has the highest likelihood of being enrolled in private schools, with 90 (35.6% in the age bracket) enrolled. Conversely, the age group of 18 to 19 year olds has the lowest likelihood of being enrolled in a private school, with 418 (100.0% in the age bracket) attending a public institution.
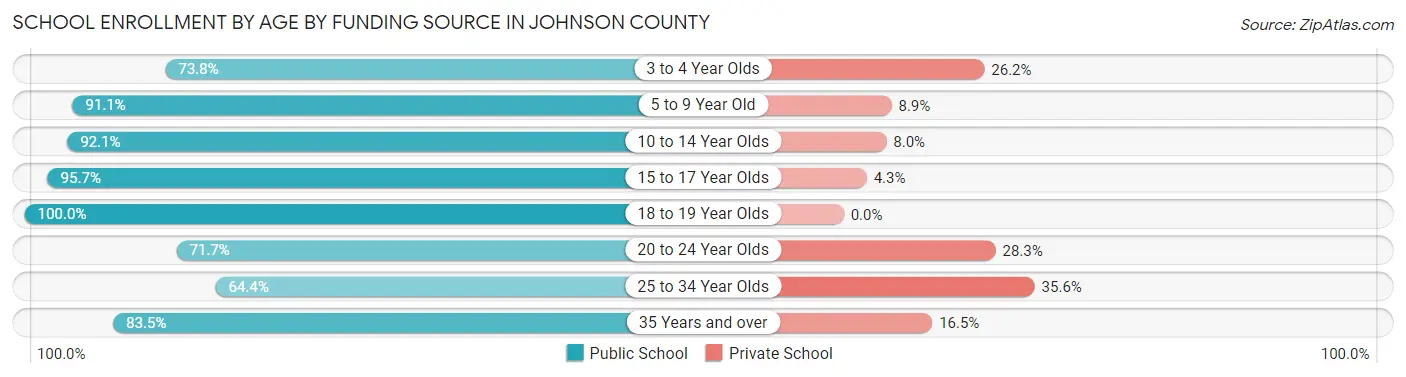
| Age Bracket | Public School | Private School |
| 3 to 4 Year Olds | 107 (73.8%) | 38 (26.2%) |
| 5 to 9 Year Old | 1,370 (91.1%) | 134 (8.9%) |
| 10 to 14 Year Olds | 1,170 (92.0%) | 101 (8.0%) |
| 15 to 17 Year Olds | 890 (95.7%) | 40 (4.3%) |
| 18 to 19 Year Olds | 418 (100.0%) | 0 (0.0%) |
| 20 to 24 Year Olds | 332 (71.7%) | 131 (28.3%) |
| 25 to 34 Year Olds | 163 (64.4%) | 90 (35.6%) |
| 35 Years and over | 233 (83.5%) | 46 (16.5%) |
| Total | 4,684 (89.0%) | 579 (11.0%) |
Educational Attainment by Field of Study in Johnson County
Education (445 | 17.5%), business (415 | 16.4%), science & technology (385 | 15.2%), arts & humanities (282 | 11.1%), and bio, nature & agricultural (159 | 6.3%) are the most common fields of study among 2,538 individuals in Johnson County who have obtained a bachelor's degree or higher.
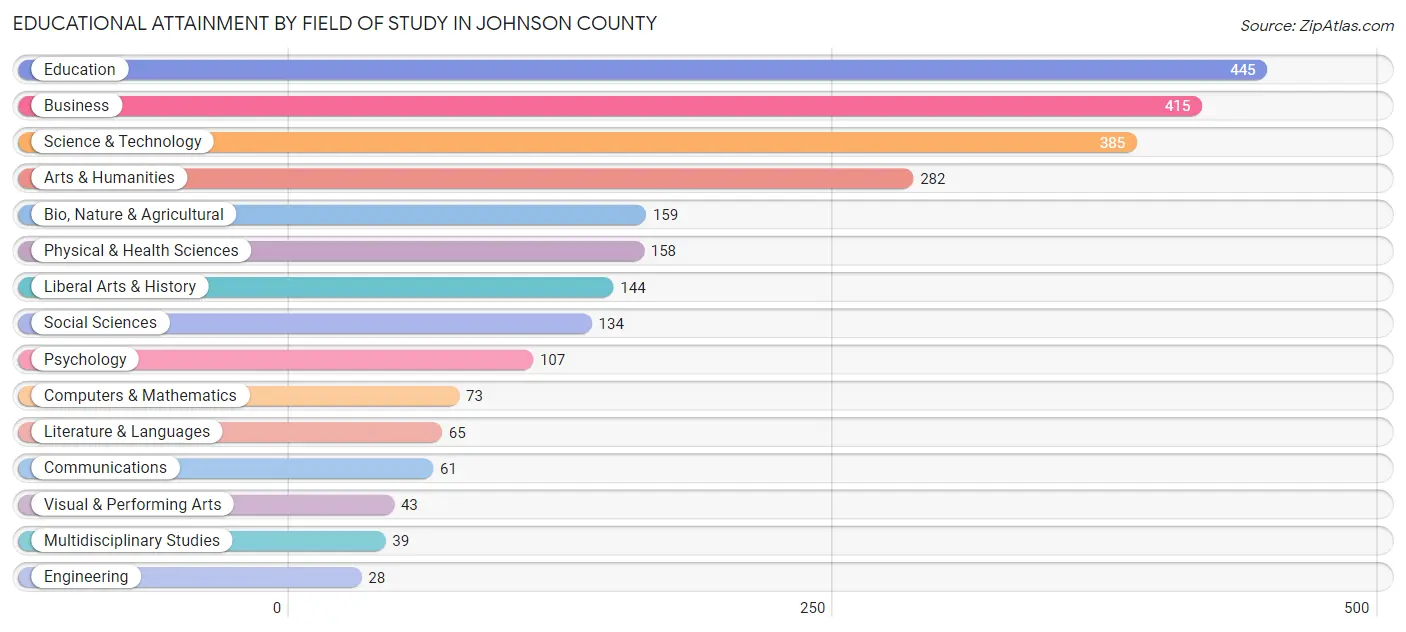
| Field of Study | # Graduates | % Graduates |
| Computers & Mathematics | 73 | 2.9% |
| Bio, Nature & Agricultural | 159 | 6.3% |
| Physical & Health Sciences | 158 | 6.2% |
| Psychology | 107 | 4.2% |
| Social Sciences | 134 | 5.3% |
| Engineering | 28 | 1.1% |
| Multidisciplinary Studies | 39 | 1.5% |
| Science & Technology | 385 | 15.2% |
| Business | 415 | 16.4% |
| Education | 445 | 17.5% |
| Literature & Languages | 65 | 2.6% |
| Liberal Arts & History | 144 | 5.7% |
| Visual & Performing Arts | 43 | 1.7% |
| Communications | 61 | 2.4% |
| Arts & Humanities | 282 | 11.1% |
| Total | 2,538 | 100.0% |
Transportation & Commute in Johnson County
Vehicle Availability by Sex in Johnson County
The most prevalent vehicle ownership categories in Johnson County are males with 2 vehicles (1,841, accounting for 47.6%) and females with 2 vehicles (1,763, making up 56.0%).
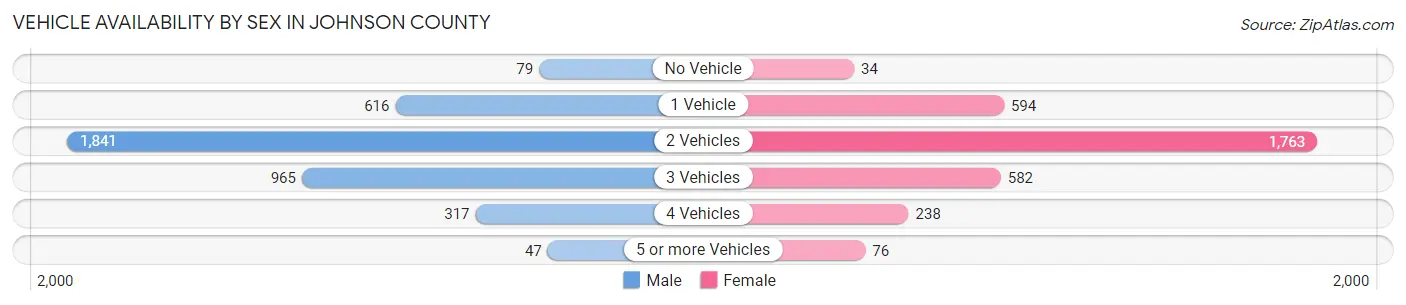
| Vehicles Available | Male | Female |
| No Vehicle | 79 (2.0%) | 34 (1.0%) |
| 1 Vehicle | 616 (15.9%) | 594 (18.1%) |
| 2 Vehicles | 1,841 (47.6%) | 1,763 (53.6%) |
| 3 Vehicles | 965 (25.0%) | 582 (17.7%) |
| 4 Vehicles | 317 (8.2%) | 238 (7.2%) |
| 5 or more Vehicles | 47 (1.2%) | 76 (2.3%) |
| Total | 3,865 (100.0%) | 3,287 (100.0%) |
Commute Time in Johnson County
The most frequently occuring commute durations in Johnson County are 15 to 19 minutes (1,391 commuters, 20.8%), 20 to 24 minutes (1,047 commuters, 15.7%), and 10 to 14 minutes (1,014 commuters, 15.2%).
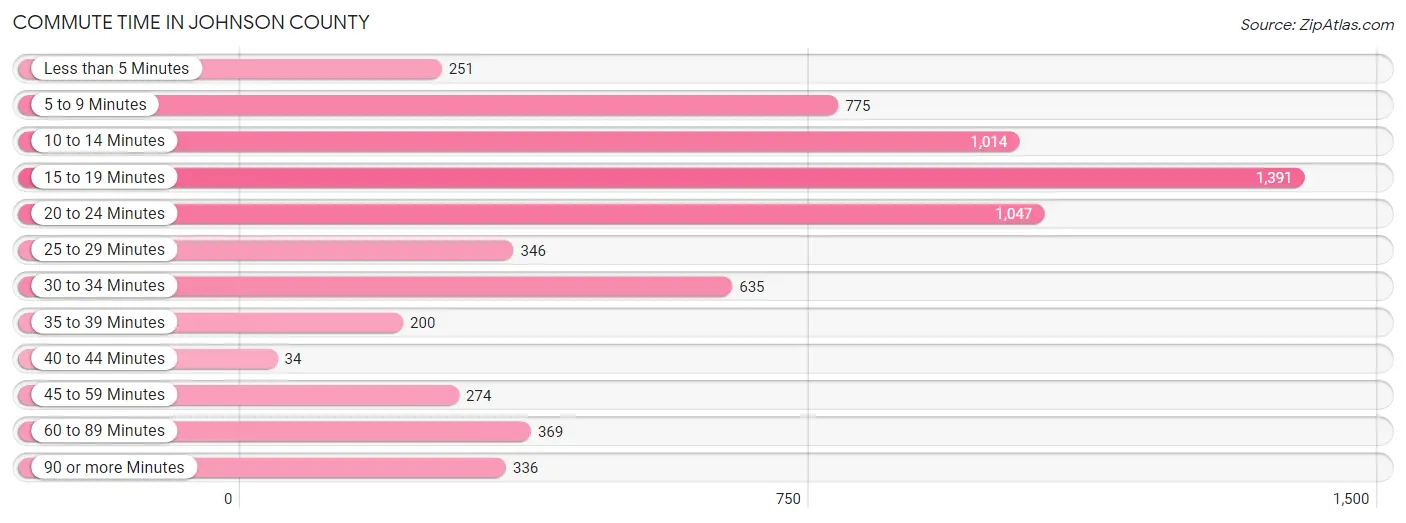
| Commute Time | # Commuters | % Commuters |
| Less than 5 Minutes | 251 | 3.8% |
| 5 to 9 Minutes | 775 | 11.6% |
| 10 to 14 Minutes | 1,014 | 15.2% |
| 15 to 19 Minutes | 1,391 | 20.8% |
| 20 to 24 Minutes | 1,047 | 15.7% |
| 25 to 29 Minutes | 346 | 5.2% |
| 30 to 34 Minutes | 635 | 9.5% |
| 35 to 39 Minutes | 200 | 3.0% |
| 40 to 44 Minutes | 34 | 0.5% |
| 45 to 59 Minutes | 274 | 4.1% |
| 60 to 89 Minutes | 369 | 5.5% |
| 90 or more Minutes | 336 | 5.0% |
Commute Time by Sex in Johnson County
The most common commute times in Johnson County are 15 to 19 minutes (621 commuters, 16.7%) for males and 15 to 19 minutes (770 commuters, 26.1%) for females.
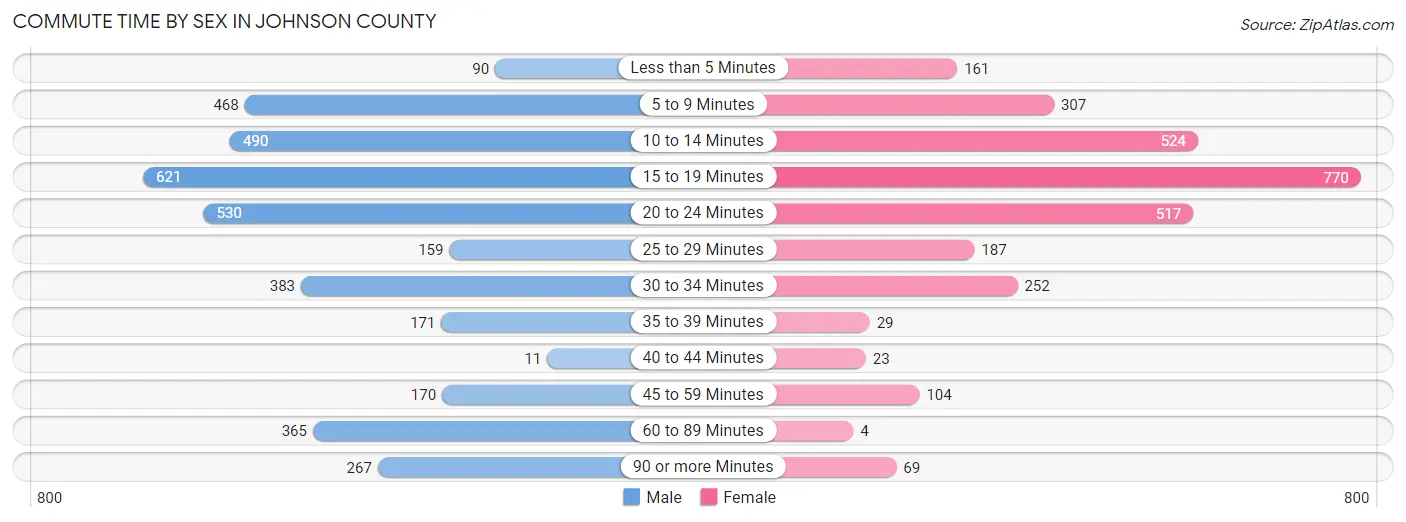
| Commute Time | Male | Female |
| Less than 5 Minutes | 90 (2.4%) | 161 (5.5%) |
| 5 to 9 Minutes | 468 (12.6%) | 307 (10.4%) |
| 10 to 14 Minutes | 490 (13.2%) | 524 (17.8%) |
| 15 to 19 Minutes | 621 (16.7%) | 770 (26.1%) |
| 20 to 24 Minutes | 530 (14.2%) | 517 (17.5%) |
| 25 to 29 Minutes | 159 (4.3%) | 187 (6.4%) |
| 30 to 34 Minutes | 383 (10.3%) | 252 (8.6%) |
| 35 to 39 Minutes | 171 (4.6%) | 29 (1.0%) |
| 40 to 44 Minutes | 11 (0.3%) | 23 (0.8%) |
| 45 to 59 Minutes | 170 (4.6%) | 104 (3.5%) |
| 60 to 89 Minutes | 365 (9.8%) | 4 (0.1%) |
| 90 or more Minutes | 267 (7.2%) | 69 (2.3%) |
Time of Departure to Work by Sex in Johnson County
The most frequent times of departure to work in Johnson County are 7:30 AM to 7:59 AM (580, 15.6%) for males and 7:30 AM to 7:59 AM (687, 23.3%) for females.
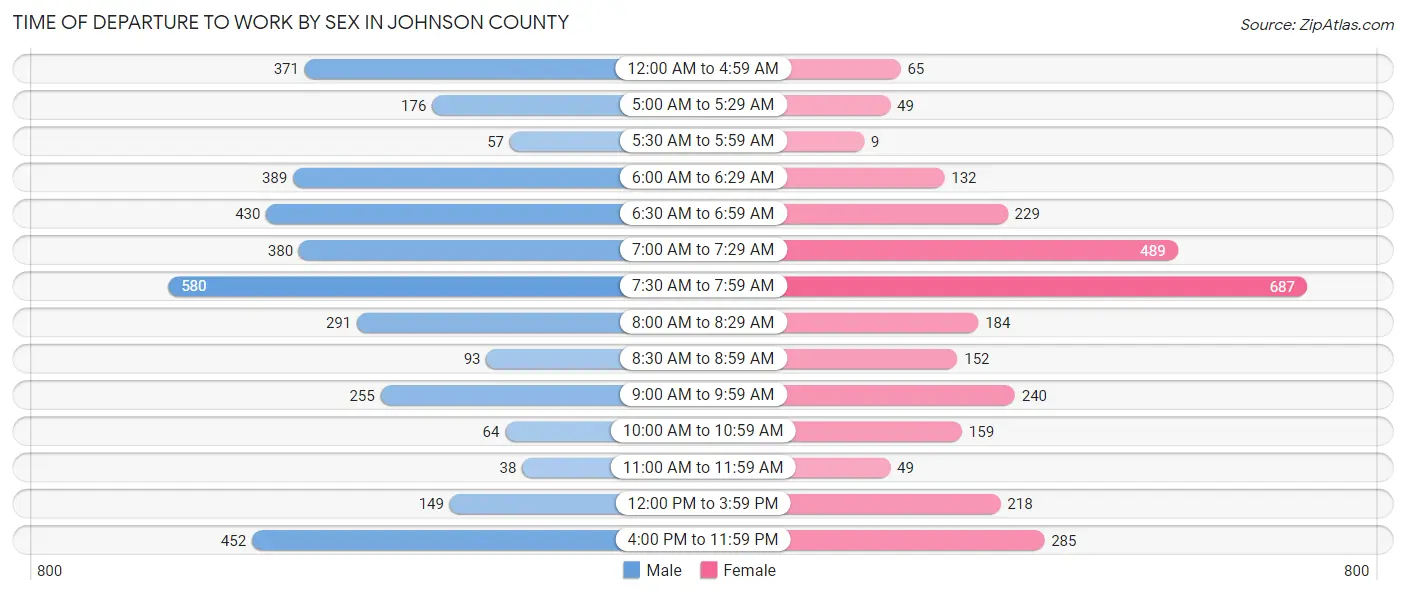
| Time of Departure | Male | Female |
| 12:00 AM to 4:59 AM | 371 (10.0%) | 65 (2.2%) |
| 5:00 AM to 5:29 AM | 176 (4.7%) | 49 (1.7%) |
| 5:30 AM to 5:59 AM | 57 (1.5%) | 9 (0.3%) |
| 6:00 AM to 6:29 AM | 389 (10.4%) | 132 (4.5%) |
| 6:30 AM to 6:59 AM | 430 (11.5%) | 229 (7.8%) |
| 7:00 AM to 7:29 AM | 380 (10.2%) | 489 (16.6%) |
| 7:30 AM to 7:59 AM | 580 (15.6%) | 687 (23.3%) |
| 8:00 AM to 8:29 AM | 291 (7.8%) | 184 (6.2%) |
| 8:30 AM to 8:59 AM | 93 (2.5%) | 152 (5.2%) |
| 9:00 AM to 9:59 AM | 255 (6.9%) | 240 (8.1%) |
| 10:00 AM to 10:59 AM | 64 (1.7%) | 159 (5.4%) |
| 11:00 AM to 11:59 AM | 38 (1.0%) | 49 (1.7%) |
| 12:00 PM to 3:59 PM | 149 (4.0%) | 218 (7.4%) |
| 4:00 PM to 11:59 PM | 452 (12.1%) | 285 (9.7%) |
| Total | 3,725 (100.0%) | 2,947 (100.0%) |
Housing Occupancy in Johnson County
Occupancy by Ownership in Johnson County
Of the total 8,534 dwellings in Johnson County, owner-occupied units account for 5,911 (69.3%), while renter-occupied units make up 2,623 (30.7%).
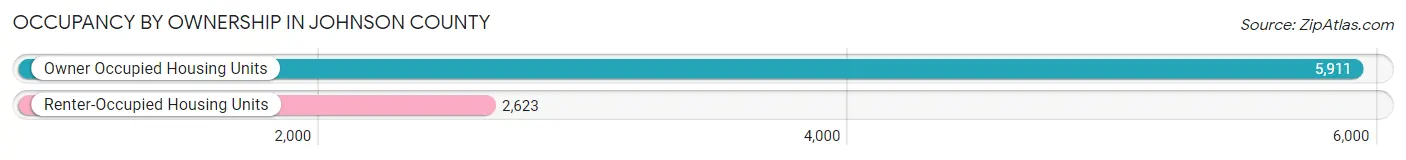
| Occupancy | # Housing Units | % Housing Units |
| Owner Occupied Housing Units | 5,911 | 69.3% |
| Renter-Occupied Housing Units | 2,623 | 30.7% |
| Total Occupied Housing Units | 8,534 | 100.0% |
Occupancy by Household Size in Johnson County
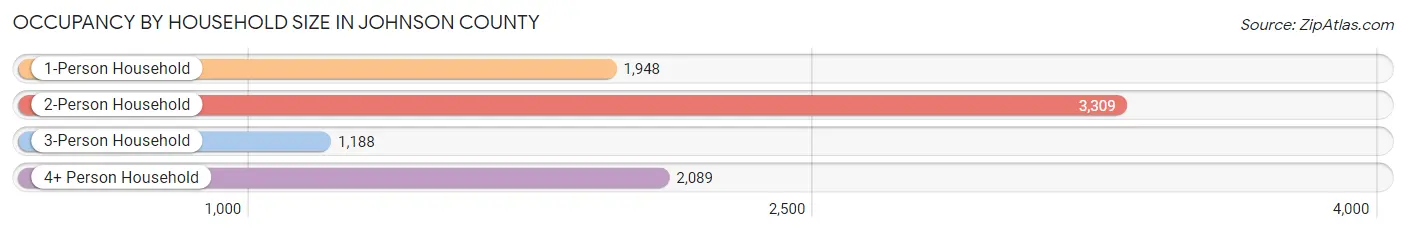
| Household Size | # Housing Units | % Housing Units |
| 1-Person Household | 1,948 | 22.8% |
| 2-Person Household | 3,309 | 38.8% |
| 3-Person Household | 1,188 | 13.9% |
| 4+ Person Household | 2,089 | 24.5% |
| Total Housing Units | 8,534 | 100.0% |
Occupancy by Ownership by Household Size in Johnson County
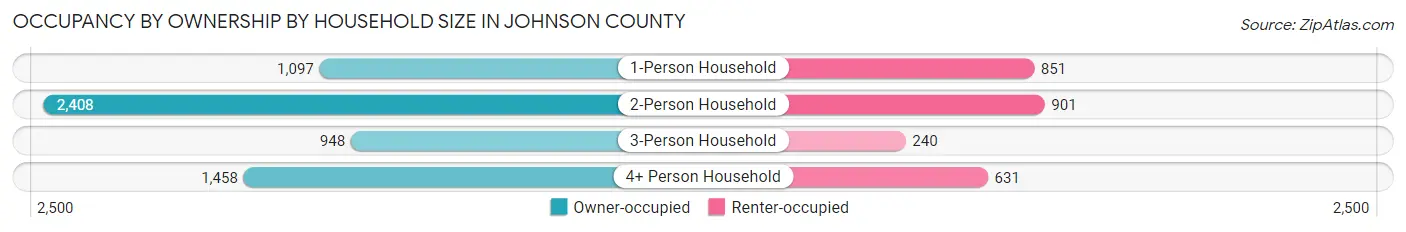
| Household Size | Owner-occupied | Renter-occupied |
| 1-Person Household | 1,097 (56.3%) | 851 (43.7%) |
| 2-Person Household | 2,408 (72.8%) | 901 (27.2%) |
| 3-Person Household | 948 (79.8%) | 240 (20.2%) |
| 4+ Person Household | 1,458 (69.8%) | 631 (30.2%) |
| Total Housing Units | 5,911 (69.3%) | 2,623 (30.7%) |
Occupancy by Educational Attainment in Johnson County
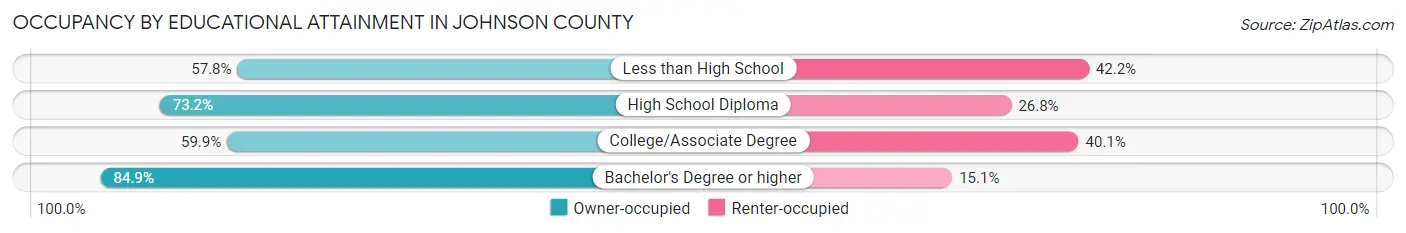
| Household Size | Owner-occupied | Renter-occupied |
| Less than High School | 625 (57.8%) | 456 (42.2%) |
| High School Diploma | 2,677 (73.2%) | 981 (26.8%) |
| College/Associate Degree | 1,466 (59.9%) | 983 (40.1%) |
| Bachelor's Degree or higher | 1,143 (84.9%) | 203 (15.1%) |
Occupancy by Age of Householder in Johnson County
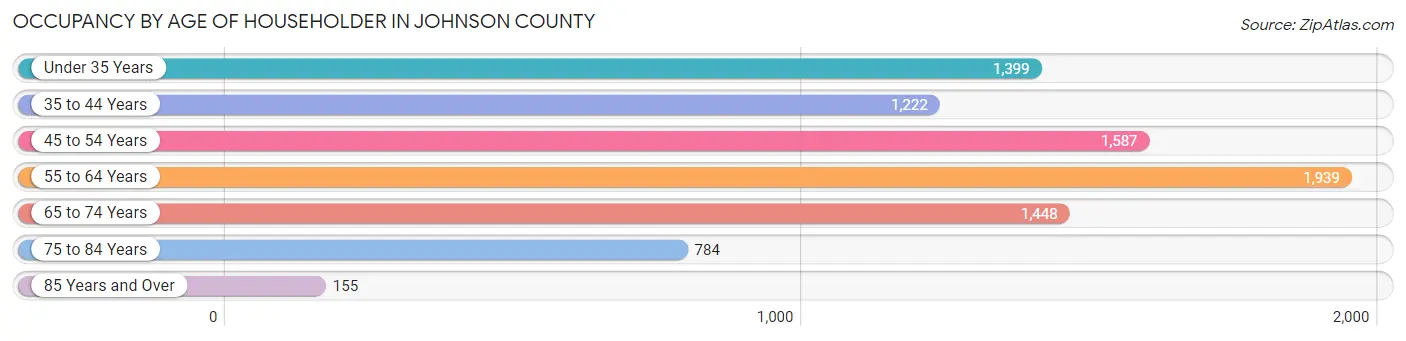
| Age Bracket | # Households | % Households |
| Under 35 Years | 1,399 | 16.4% |
| 35 to 44 Years | 1,222 | 14.3% |
| 45 to 54 Years | 1,587 | 18.6% |
| 55 to 64 Years | 1,939 | 22.7% |
| 65 to 74 Years | 1,448 | 17.0% |
| 75 to 84 Years | 784 | 9.2% |
| 85 Years and Over | 155 | 1.8% |
| Total | 8,534 | 100.0% |
Housing Finances in Johnson County
Median Income by Occupancy in Johnson County
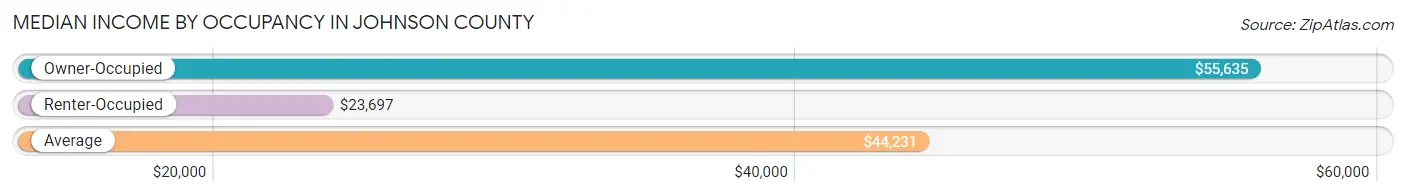
| Occupancy Type | # Households | Median Income |
| Owner-Occupied | 5,911 (69.3%) | $55,635 |
| Renter-Occupied | 2,623 (30.7%) | $23,697 |
| Average | 8,534 (100.0%) | $44,231 |
Occupancy by Householder Income Bracket in Johnson County
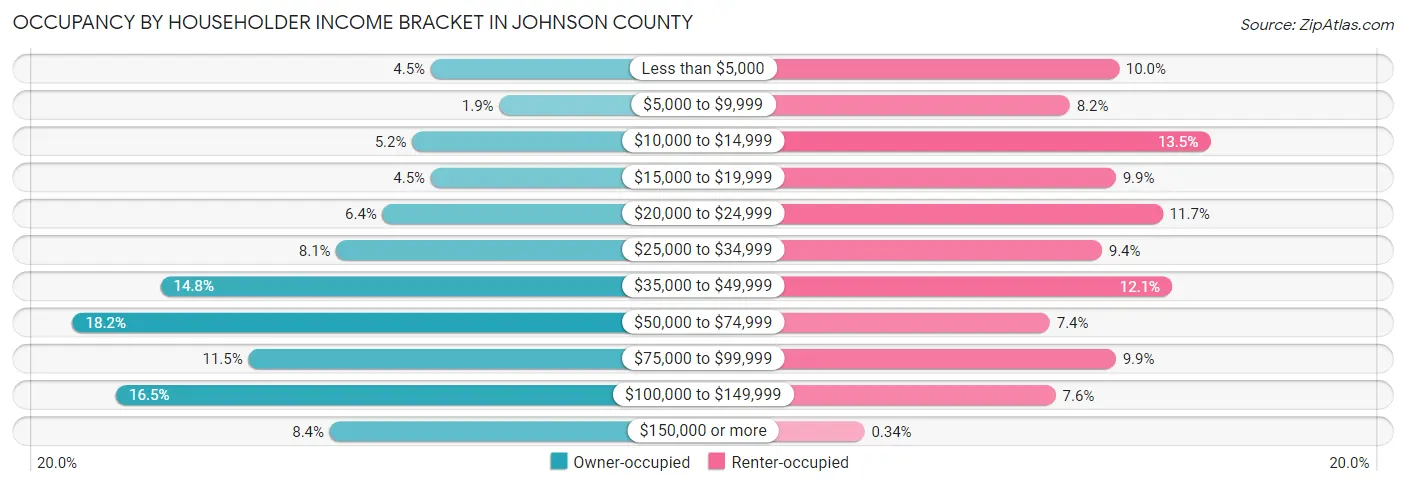
| Income Bracket | Owner-occupied | Renter-occupied |
| Less than $5,000 | 267 (4.5%) | 263 (10.0%) |
| $5,000 to $9,999 | 113 (1.9%) | 214 (8.2%) |
| $10,000 to $14,999 | 309 (5.2%) | 354 (13.5%) |
| $15,000 to $19,999 | 267 (4.5%) | 260 (9.9%) |
| $20,000 to $24,999 | 376 (6.4%) | 307 (11.7%) |
| $25,000 to $34,999 | 480 (8.1%) | 246 (9.4%) |
| $35,000 to $49,999 | 876 (14.8%) | 316 (12.0%) |
| $50,000 to $74,999 | 1,074 (18.2%) | 194 (7.4%) |
| $75,000 to $99,999 | 678 (11.5%) | 260 (9.9%) |
| $100,000 to $149,999 | 976 (16.5%) | 200 (7.6%) |
| $150,000 or more | 495 (8.4%) | 9 (0.3%) |
| Total | 5,911 (100.0%) | 2,623 (100.0%) |
Monthly Housing Cost Tiers in Johnson County
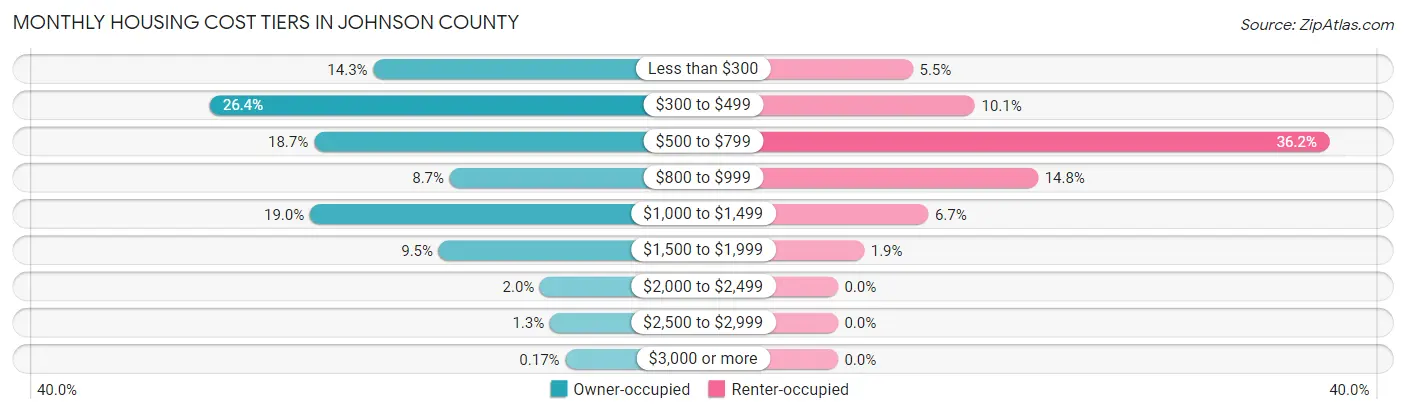
| Monthly Cost | Owner-occupied | Renter-occupied |
| Less than $300 | 846 (14.3%) | 145 (5.5%) |
| $300 to $499 | 1,558 (26.4%) | 265 (10.1%) |
| $500 to $799 | 1,104 (18.7%) | 949 (36.2%) |
| $800 to $999 | 513 (8.7%) | 387 (14.7%) |
| $1,000 to $1,499 | 1,122 (19.0%) | 175 (6.7%) |
| $1,500 to $1,999 | 561 (9.5%) | 51 (1.9%) |
| $2,000 to $2,499 | 120 (2.0%) | 0 (0.0%) |
| $2,500 to $2,999 | 77 (1.3%) | 0 (0.0%) |
| $3,000 or more | 10 (0.2%) | 0 (0.0%) |
| Total | 5,911 (100.0%) | 2,623 (100.0%) |
Physical Housing Characteristics in Johnson County
Housing Structures in Johnson County
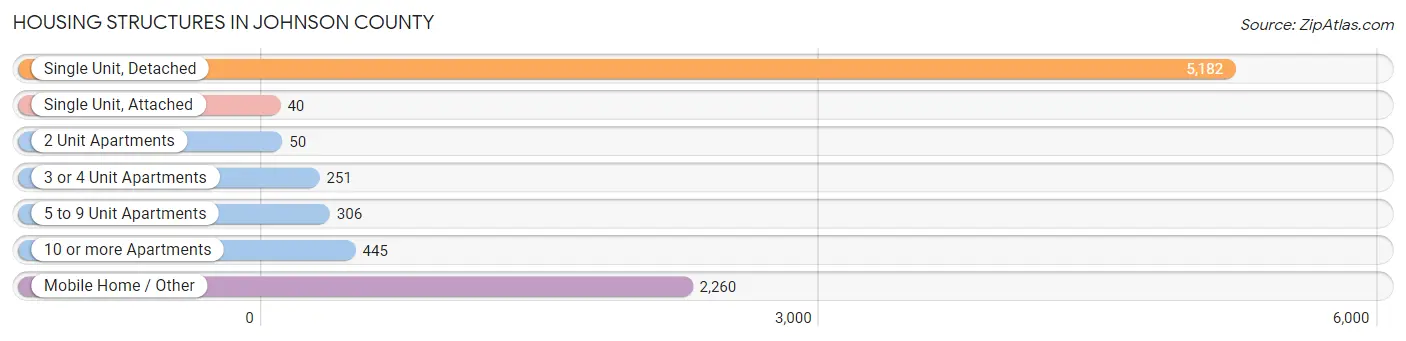
| Structure Type | # Housing Units | % Housing Units |
| Single Unit, Detached | 5,182 | 60.7% |
| Single Unit, Attached | 40 | 0.5% |
| 2 Unit Apartments | 50 | 0.6% |
| 3 or 4 Unit Apartments | 251 | 2.9% |
| 5 to 9 Unit Apartments | 306 | 3.6% |
| 10 or more Apartments | 445 | 5.2% |
| Mobile Home / Other | 2,260 | 26.5% |
| Total | 8,534 | 100.0% |
Housing Structures by Occupancy in Johnson County
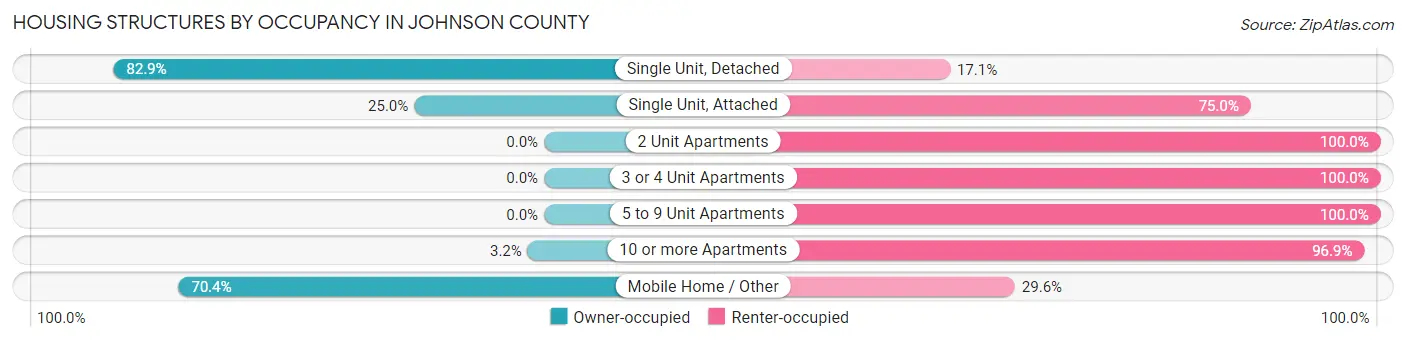
| Structure Type | Owner-occupied | Renter-occupied |
| Single Unit, Detached | 4,296 (82.9%) | 886 (17.1%) |
| Single Unit, Attached | 10 (25.0%) | 30 (75.0%) |
| 2 Unit Apartments | 0 (0.0%) | 50 (100.0%) |
| 3 or 4 Unit Apartments | 0 (0.0%) | 251 (100.0%) |
| 5 to 9 Unit Apartments | 0 (0.0%) | 306 (100.0%) |
| 10 or more Apartments | 14 (3.2%) | 431 (96.9%) |
| Mobile Home / Other | 1,591 (70.4%) | 669 (29.6%) |
| Total | 5,911 (69.3%) | 2,623 (30.7%) |
Housing Structures by Number of Rooms in Johnson County
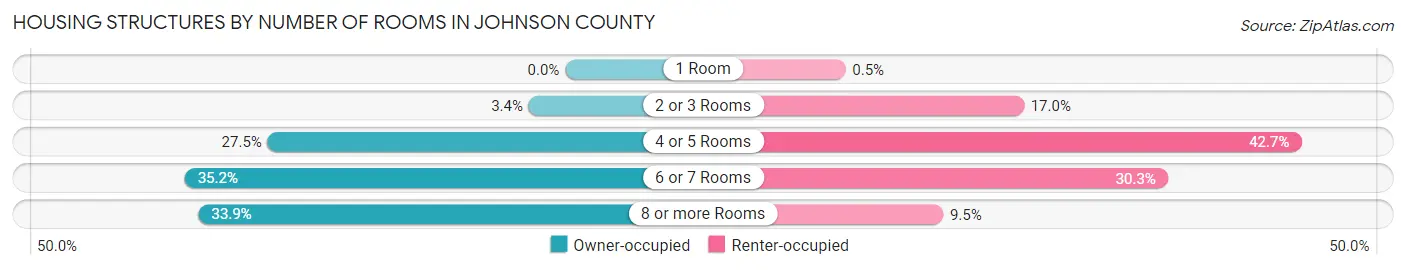
| Number of Rooms | Owner-occupied | Renter-occupied |
| 1 Room | 0 (0.0%) | 13 (0.5%) |
| 2 or 3 Rooms | 199 (3.4%) | 446 (17.0%) |
| 4 or 5 Rooms | 1,627 (27.5%) | 1,119 (42.7%) |
| 6 or 7 Rooms | 2,080 (35.2%) | 795 (30.3%) |
| 8 or more Rooms | 2,005 (33.9%) | 250 (9.5%) |
| Total | 5,911 (100.0%) | 2,623 (100.0%) |
Housing Structure by Heating Type in Johnson County
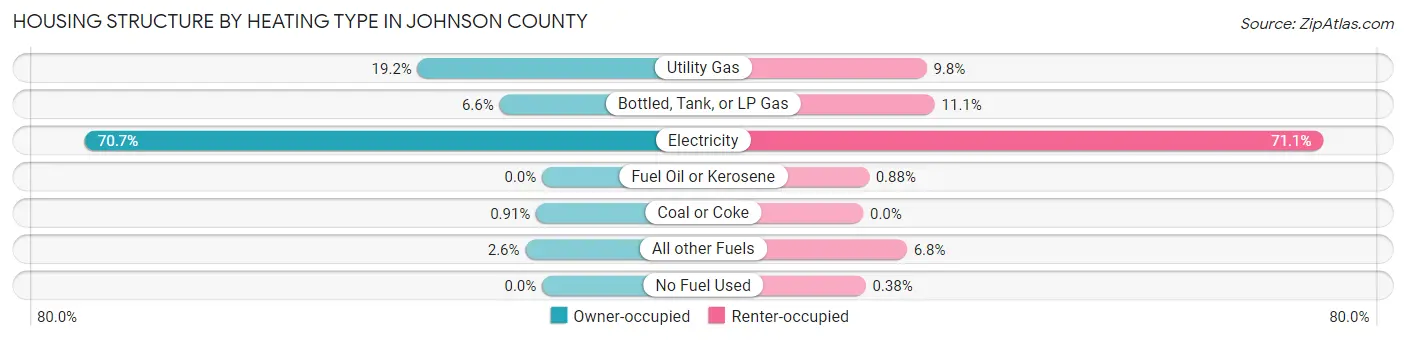
| Heating Type | Owner-occupied | Renter-occupied |
| Utility Gas | 1,137 (19.2%) | 257 (9.8%) |
| Bottled, Tank, or LP Gas | 389 (6.6%) | 290 (11.1%) |
| Electricity | 4,178 (70.7%) | 1,866 (71.1%) |
| Fuel Oil or Kerosene | 0 (0.0%) | 23 (0.9%) |
| Coal or Coke | 54 (0.9%) | 0 (0.0%) |
| All other Fuels | 153 (2.6%) | 177 (6.8%) |
| No Fuel Used | 0 (0.0%) | 10 (0.4%) |
| Total | 5,911 (100.0%) | 2,623 (100.0%) |
Household Vehicle Usage in Johnson County
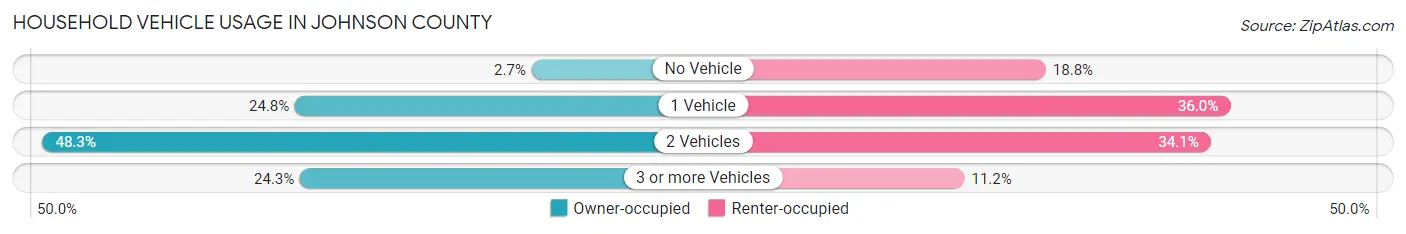
| Vehicles per Household | Owner-occupied | Renter-occupied |
| No Vehicle | 157 (2.7%) | 492 (18.8%) |
| 1 Vehicle | 1,463 (24.7%) | 943 (35.9%) |
| 2 Vehicles | 2,856 (48.3%) | 895 (34.1%) |
| 3 or more Vehicles | 1,435 (24.3%) | 293 (11.2%) |
| Total | 5,911 (100.0%) | 2,623 (100.0%) |
Real Estate & Mortgages in Johnson County
Real Estate and Mortgage Overview in Johnson County
| Characteristic | Without Mortgage | With Mortgage |
| Housing Units | 3,240 | 2,671 |
| Median Property Value | $89,200 | $152,400 |
| Median Household Income | $42,615 | $265 |
| Monthly Housing Costs | $413 | $10 |
| Real Estate Taxes | $553 | $145 |
Property Value by Mortgage Status in Johnson County
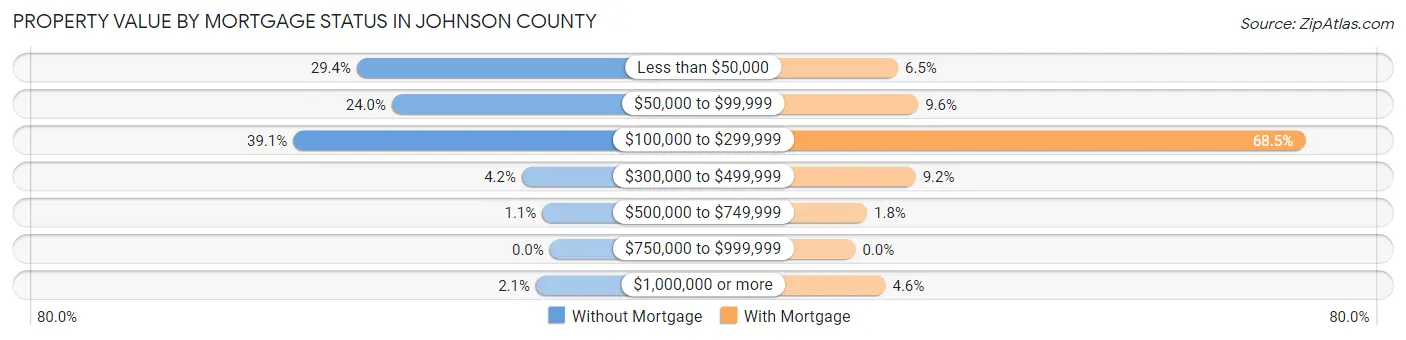
| Property Value | Without Mortgage | With Mortgage |
| Less than $50,000 | 952 (29.4%) | 173 (6.5%) |
| $50,000 to $99,999 | 779 (24.0%) | 255 (9.6%) |
| $100,000 to $299,999 | 1,267 (39.1%) | 1,829 (68.5%) |
| $300,000 to $499,999 | 137 (4.2%) | 245 (9.2%) |
| $500,000 to $749,999 | 37 (1.1%) | 47 (1.8%) |
| $750,000 to $999,999 | 0 (0.0%) | 0 (0.0%) |
| $1,000,000 or more | 68 (2.1%) | 122 (4.6%) |
| Total | 3,240 (100.0%) | 2,671 (100.0%) |
Household Income by Mortgage Status in Johnson County
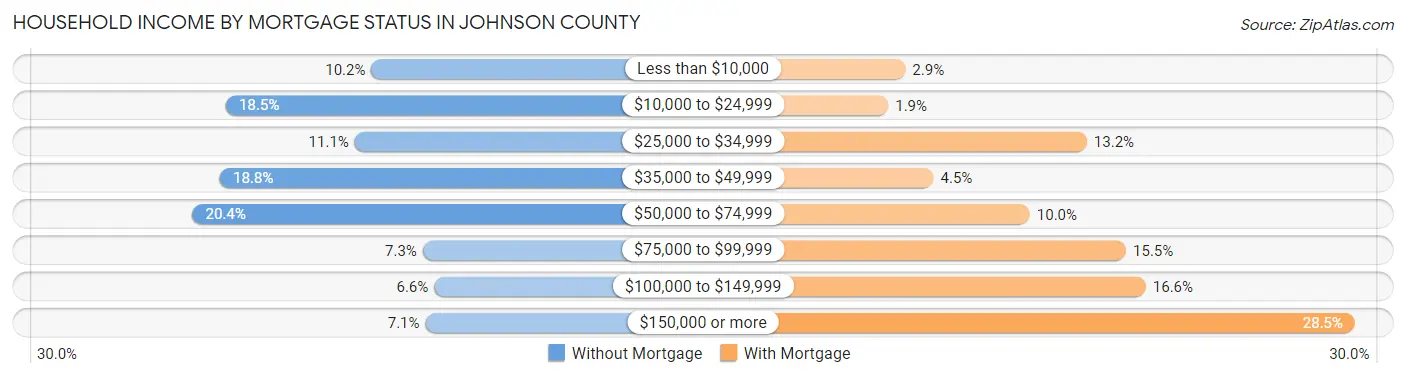
| Household Income | Without Mortgage | With Mortgage |
| Less than $10,000 | 330 (10.2%) | 76 (2.9%) |
| $10,000 to $24,999 | 599 (18.5%) | 50 (1.9%) |
| $25,000 to $34,999 | 361 (11.1%) | 353 (13.2%) |
| $35,000 to $49,999 | 610 (18.8%) | 119 (4.5%) |
| $50,000 to $74,999 | 661 (20.4%) | 266 (10.0%) |
| $75,000 to $99,999 | 235 (7.2%) | 413 (15.5%) |
| $100,000 to $149,999 | 214 (6.6%) | 443 (16.6%) |
| $150,000 or more | 230 (7.1%) | 762 (28.5%) |
| Total | 3,240 (100.0%) | 2,671 (100.0%) |
Property Value to Household Income Ratio in Johnson County
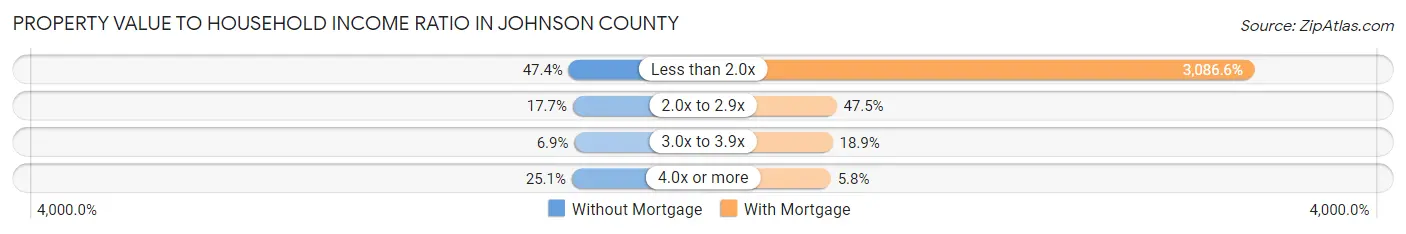
| Value-to-Income Ratio | Without Mortgage | With Mortgage |
| Less than 2.0x | 1,537 (47.4%) | 82,444 (3,086.6%) |
| 2.0x to 2.9x | 574 (17.7%) | 1,269 (47.5%) |
| 3.0x to 3.9x | 222 (6.9%) | 505 (18.9%) |
| 4.0x or more | 814 (25.1%) | 154 (5.8%) |
| Total | 3,240 (100.0%) | 2,671 (100.0%) |
Real Estate Taxes by Mortgage Status in Johnson County
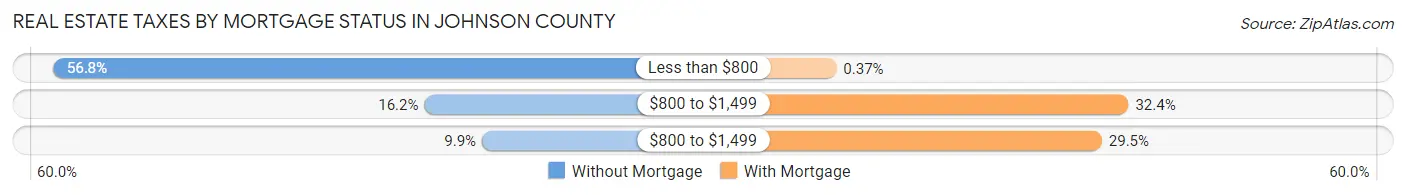
| Property Taxes | Without Mortgage | With Mortgage |
| Less than $800 | 1,840 (56.8%) | 10 (0.4%) |
| $800 to $1,499 | 525 (16.2%) | 865 (32.4%) |
| $800 to $1,499 | 320 (9.9%) | 787 (29.5%) |
| Total | 3,240 (100.0%) | 2,671 (100.0%) |
Health & Disability in Johnson County
Health Insurance Coverage by Age in Johnson County
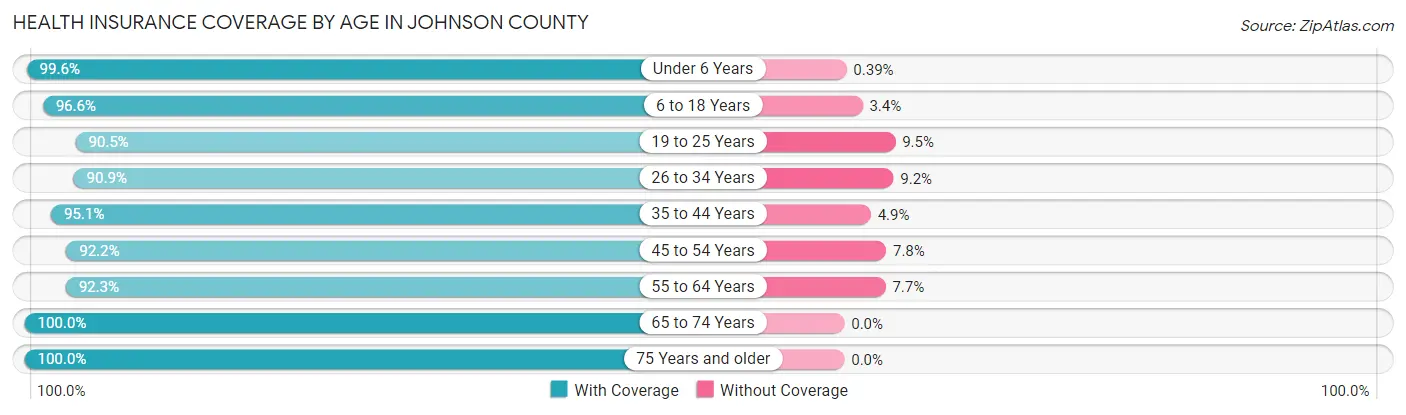
| Age Bracket | With Coverage | Without Coverage |
| Under 6 Years | 1,535 (99.6%) | 6 (0.4%) |
| 6 to 18 Years | 3,511 (96.6%) | 123 (3.4%) |
| 19 to 25 Years | 1,488 (90.5%) | 156 (9.5%) |
| 26 to 34 Years | 1,947 (90.8%) | 196 (9.1%) |
| 35 to 44 Years | 2,719 (95.1%) | 141 (4.9%) |
| 45 to 54 Years | 2,786 (92.2%) | 235 (7.8%) |
| 55 to 64 Years | 2,956 (92.3%) | 246 (7.7%) |
| 65 to 74 Years | 2,591 (100.0%) | 0 (0.0%) |
| 75 Years and older | 1,506 (100.0%) | 0 (0.0%) |
| Total | 21,039 (95.0%) | 1,103 (5.0%) |
Health Insurance Coverage by Citizenship Status in Johnson County
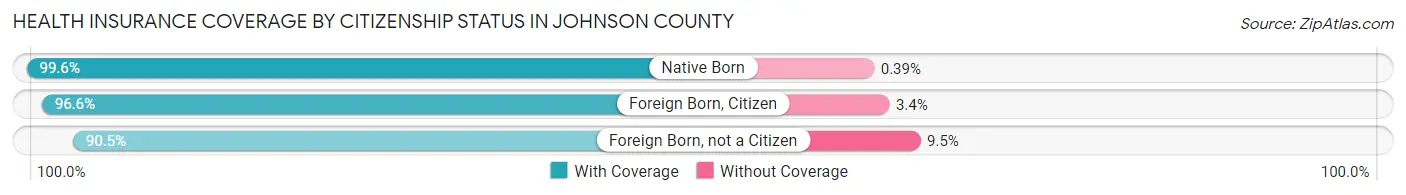
| Citizenship Status | With Coverage | Without Coverage |
| Native Born | 1,535 (99.6%) | 6 (0.4%) |
| Foreign Born, Citizen | 3,511 (96.6%) | 123 (3.4%) |
| Foreign Born, not a Citizen | 1,488 (90.5%) | 156 (9.5%) |
Health Insurance Coverage by Household Income in Johnson County
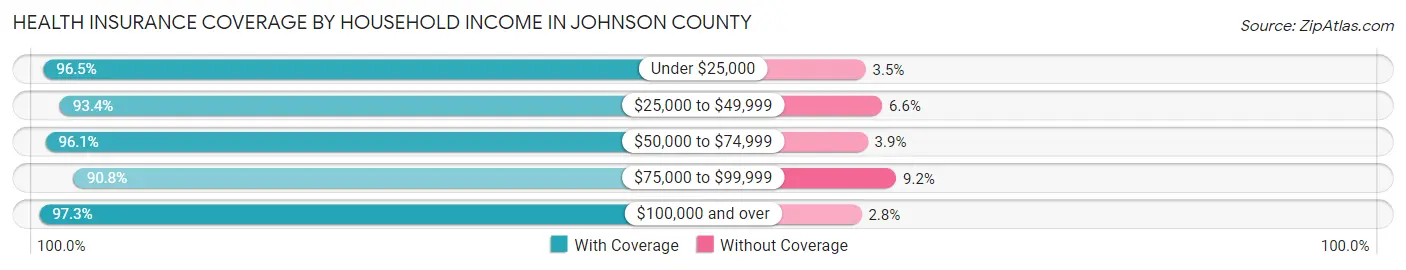
| Household Income | With Coverage | Without Coverage |
| Under $25,000 | 5,123 (96.5%) | 187 (3.5%) |
| $25,000 to $49,999 | 4,784 (93.4%) | 339 (6.6%) |
| $50,000 to $74,999 | 3,192 (96.1%) | 130 (3.9%) |
| $75,000 to $99,999 | 2,666 (90.8%) | 271 (9.2%) |
| $100,000 and over | 5,225 (97.3%) | 148 (2.8%) |
Public vs Private Health Insurance Coverage by Age in Johnson County
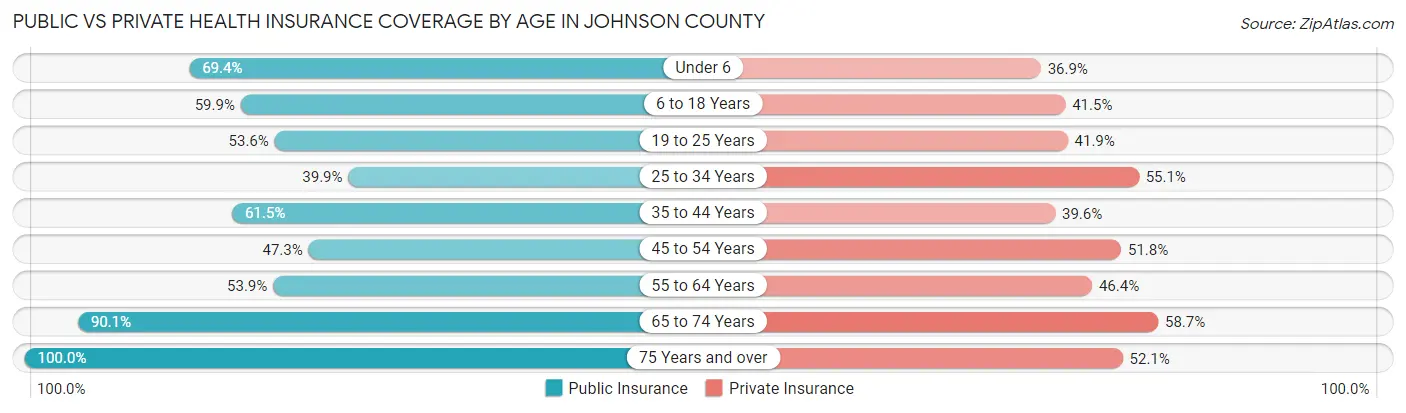
| Age Bracket | Public Insurance | Private Insurance |
| Under 6 | 1,070 (69.4%) | 569 (36.9%) |
| 6 to 18 Years | 2,176 (59.9%) | 1,507 (41.5%) |
| 19 to 25 Years | 881 (53.6%) | 689 (41.9%) |
| 25 to 34 Years | 855 (39.9%) | 1,181 (55.1%) |
| 35 to 44 Years | 1,759 (61.5%) | 1,132 (39.6%) |
| 45 to 54 Years | 1,429 (47.3%) | 1,566 (51.8%) |
| 55 to 64 Years | 1,725 (53.9%) | 1,487 (46.4%) |
| 65 to 74 Years | 2,335 (90.1%) | 1,521 (58.7%) |
| 75 Years and over | 1,506 (100.0%) | 785 (52.1%) |
| Total | 13,736 (62.0%) | 10,437 (47.1%) |
Disability Status by Sex by Age in Johnson County
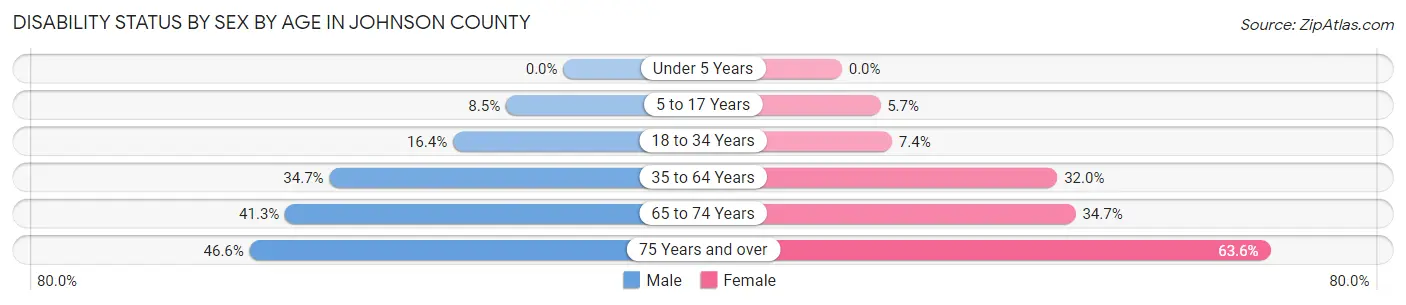
| Age Bracket | Male | Female |
| Under 5 Years | 0 (0.0%) | 0 (0.0%) |
| 5 to 17 Years | 170 (8.5%) | 102 (5.7%) |
| 18 to 34 Years | 328 (16.4%) | 148 (7.4%) |
| 35 to 64 Years | 1,544 (34.7%) | 1,484 (32.0%) |
| 65 to 74 Years | 525 (41.3%) | 458 (34.7%) |
| 75 Years and over | 307 (46.6%) | 539 (63.6%) |
Disability Class by Sex by Age in Johnson County
Disability Class: Hearing Difficulty
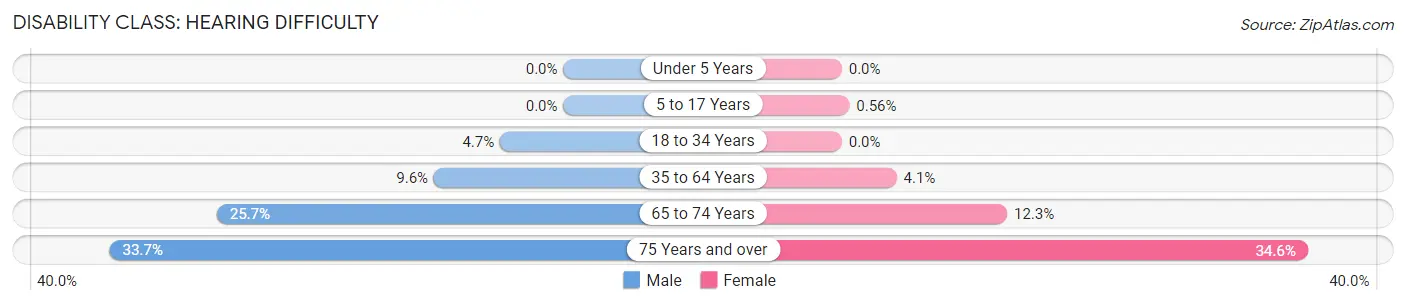
| Age Bracket | Male | Female |
| Under 5 Years | 0 (0.0%) | 0 (0.0%) |
| 5 to 17 Years | 0 (0.0%) | 10 (0.6%) |
| 18 to 34 Years | 94 (4.7%) | 0 (0.0%) |
| 35 to 64 Years | 427 (9.6%) | 189 (4.1%) |
| 65 to 74 Years | 327 (25.7%) | 162 (12.3%) |
| 75 Years and over | 222 (33.7%) | 293 (34.6%) |
Disability Class: Vision Difficulty
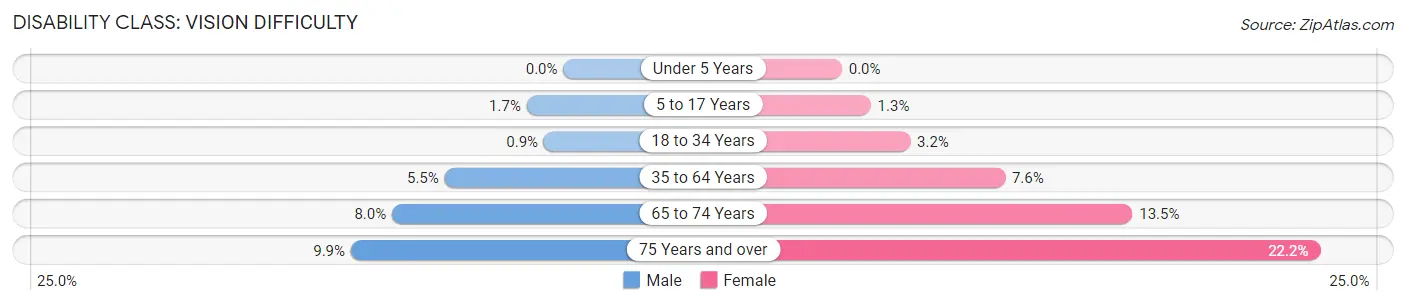
| Age Bracket | Male | Female |
| Under 5 Years | 0 (0.0%) | 0 (0.0%) |
| 5 to 17 Years | 34 (1.7%) | 24 (1.3%) |
| 18 to 34 Years | 18 (0.9%) | 63 (3.2%) |
| 35 to 64 Years | 245 (5.5%) | 351 (7.6%) |
| 65 to 74 Years | 101 (8.0%) | 178 (13.5%) |
| 75 Years and over | 65 (9.9%) | 188 (22.2%) |
Disability Class: Cognitive Difficulty
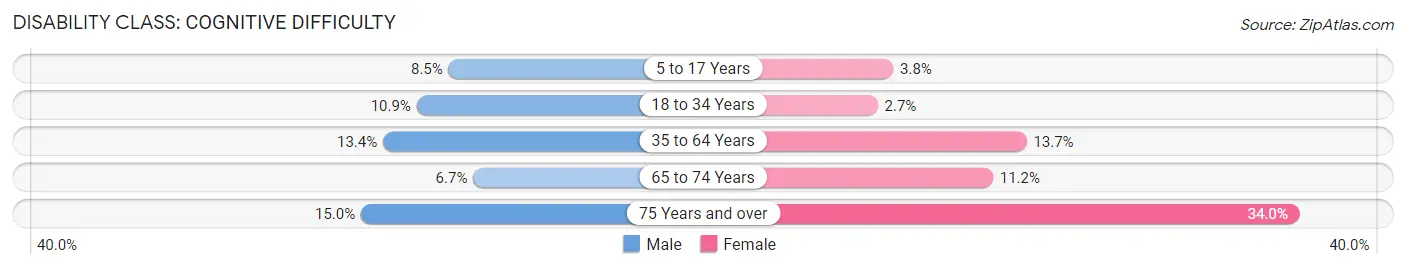
| Age Bracket | Male | Female |
| 5 to 17 Years | 170 (8.5%) | 68 (3.8%) |
| 18 to 34 Years | 218 (10.9%) | 53 (2.7%) |
| 35 to 64 Years | 595 (13.4%) | 636 (13.7%) |
| 65 to 74 Years | 85 (6.7%) | 148 (11.2%) |
| 75 Years and over | 99 (15.0%) | 288 (34.0%) |
Disability Class: Ambulatory Difficulty
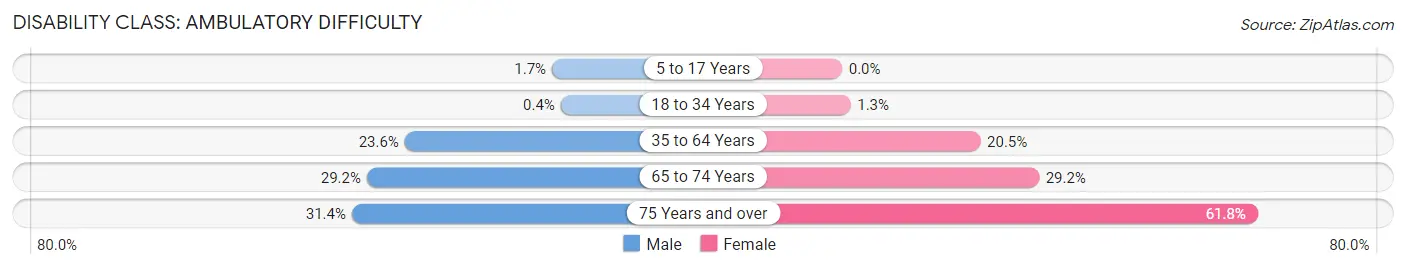
| Age Bracket | Male | Female |
| 5 to 17 Years | 34 (1.7%) | 0 (0.0%) |
| 18 to 34 Years | 8 (0.4%) | 25 (1.3%) |
| 35 to 64 Years | 1,047 (23.6%) | 953 (20.5%) |
| 65 to 74 Years | 371 (29.2%) | 386 (29.2%) |
| 75 Years and over | 207 (31.4%) | 523 (61.8%) |
Disability Class: Self-Care Difficulty
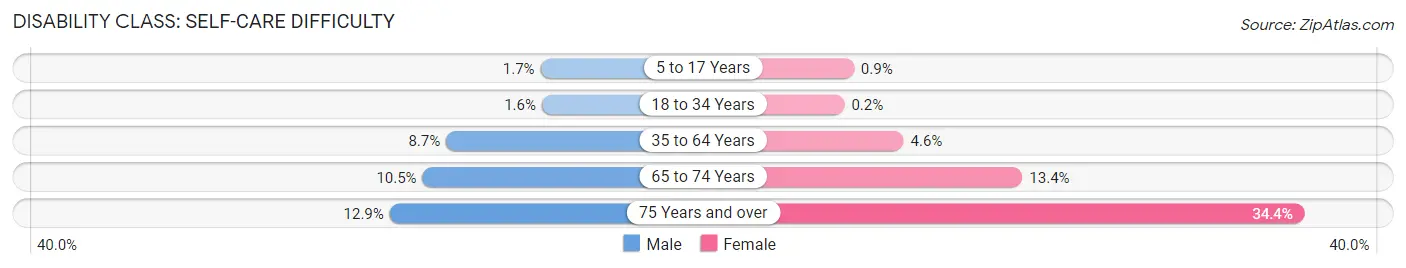
| Age Bracket | Male | Female |
| 5 to 17 Years | 34 (1.7%) | 16 (0.9%) |
| 18 to 34 Years | 32 (1.6%) | 4 (0.2%) |
| 35 to 64 Years | 387 (8.7%) | 213 (4.6%) |
| 65 to 74 Years | 133 (10.5%) | 177 (13.4%) |
| 75 Years and over | 85 (12.9%) | 291 (34.4%) |
Technology Access in Johnson County
Computing Device Access in Johnson County
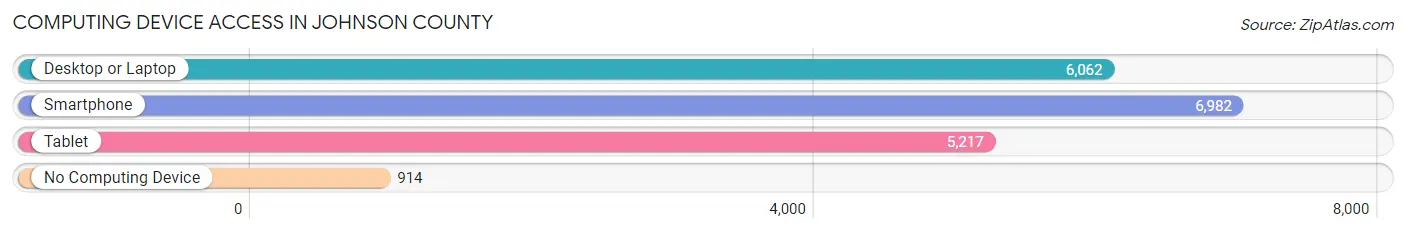
| Device Type | # Households | % Households |
| Desktop or Laptop | 6,062 | 71.0% |
| Smartphone | 6,982 | 81.8% |
| Tablet | 5,217 | 61.1% |
| No Computing Device | 914 | 10.7% |
| Total | 8,534 | 100.0% |
Internet Access in Johnson County
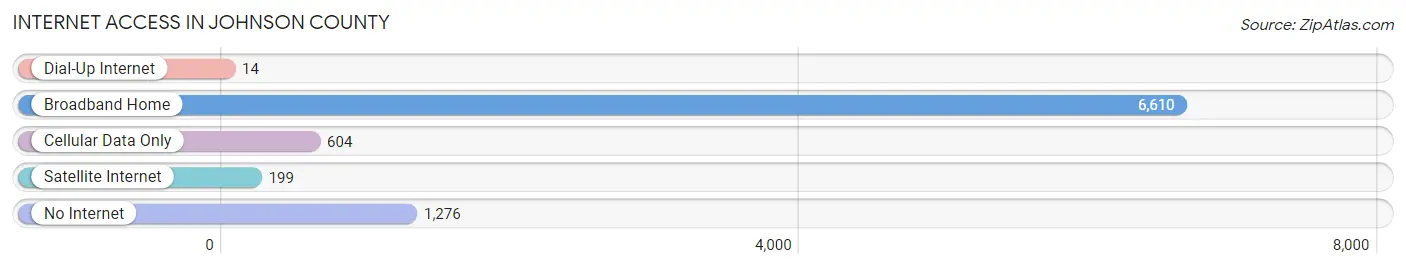
| Internet Type | # Households | % Households |
| Dial-Up Internet | 14 | 0.2% |
| Broadband Home | 6,610 | 77.4% |
| Cellular Data Only | 604 | 7.1% |
| Satellite Internet | 199 | 2.3% |
| No Internet | 1,276 | 14.9% |
| Total | 8,534 | 100.0% |
Johnson County Summary
Johnson County is located in the eastern part of Kentucky, in the foothills of the Appalachian Mountains. It is bordered by Magoffin County to the north, Floyd County to the east, Lawrence County to the south, and Morgan County to the west. The county seat is Paintsville, and the county was formed in 1843 from parts of Floyd, Lawrence, and Morgan counties.
Geography
Johnson County is located in the Eastern Coal Field region of Kentucky. The county is mostly mountainous, with the highest point being the summit of Big Blaine Mountain at 2,890 feet. The county is drained by the Levisa Fork of the Big Sandy River, which flows through the county from north to south. The county is also home to several large lakes, including Fishtrap Lake, Dewey Lake, and Paintsville Lake.
The county has a total area of 437 square miles, of which 434 square miles is land and 3 square miles is water.
Demographics
As of the 2010 census, Johnson County had a population of 23,356. The racial makeup of the county was 97.2% White, 0.9% Black or African American, 0.2% Native American, 0.2% Asian, 0.2% from other races, and 1.3% from two or more races. 1.3% of the population were Hispanic or Latino of any race.
The median household income in Johnson County was $30,945, and the median family income was $37,917. The per capita income was $16,845. About 17.2% of the population was below the poverty line.
Economy
The economy of Johnson County is largely based on agriculture and mining. The county is home to several large coal mines, and the county is the second-largest coal producer in Kentucky. The county also produces timber, livestock, and tobacco.
The county is home to several large employers, including the Johnson County Board of Education, the Johnson County Health Department, and the Johnson County Sheriff's Office. The county is also home to several small businesses, including restaurants, retail stores, and service providers.
Conclusion
Johnson County is a rural county located in the eastern part of Kentucky. It is home to a diverse economy, with a focus on agriculture and mining. The county has a population of 23,356, and the median household income is $30,945. The county is home to several large employers, as well as small businesses.
Common Questions
What is Per Capita Income in Johnson County?
Per Capita income in Johnson County is $22,931.
What is the Median Family Income in Johnson County?
Median Family Income in Johnson County is $56,656.
What is the Median Household income in Johnson County?
Median Household Income in Johnson County is $44,231.
What is Income or Wage Gap in Johnson County?
Income or Wage Gap in Johnson County is 41.2%.
Women in Johnson County earn 58.8 cents for every dollar earned by a man.
What is Family Income Deficit in Johnson County?
Family Income Deficit in Johnson County is $12,050.
Families that are below poverty line in Johnson County earn $12,050 less on average than the poverty threshold level.
What is Inequality or Gini Index in Johnson County?
Inequality or Gini Index in Johnson County is 0.46.
What is the Total Population of Johnson County?
Total Population of Johnson County is 22,631.
What is the Total Male Population of Johnson County?
Total Male Population of Johnson County is 11,327.
What is the Total Female Population of Johnson County?
Total Female Population of Johnson County is 11,304.
What is the Ratio of Males per 100 Females in Johnson County?
There are 100.20 Males per 100 Females in Johnson County.
What is the Ratio of Females per 100 Males in Johnson County?
There are 99.80 Females per 100 Males in Johnson County.
What is the Median Population Age in Johnson County?
Median Population Age in Johnson County is 41.7 Years.
What is the Average Family Size in Johnson County
Average Family Size in Johnson County is 3.0 People.
What is the Average Household Size in Johnson County
Average Household Size in Johnson County is 2.6 People.
How Large is the Labor Force in Johnson County?
There are 8,100 People in the Labor Forcein in Johnson County.
What is the Percentage of People in the Labor Force in Johnson County?
44.6% of People are in the Labor Force in Johnson County.
What is the Unemployment Rate in Johnson County?
Unemployment Rate in Johnson County is 5.3%.