Jackson County, KY Map & Demographics
Jackson County Map
Jackson County Overview
$21,876
PER CAPITA INCOME
$52,113
AVG FAMILY INCOME
$38,516
AVG HOUSEHOLD INCOME
32.8%
WAGE / INCOME GAP [ % ]
67.2¢/ $1
WAGE / INCOME GAP [ $ ]
$7,614
FAMILY INCOME DEFICIT
0.43
INEQUALITY / GINI INDEX
13,002
TOTAL POPULATION
6,507
MALE POPULATION
6,495
FEMALE POPULATION
100.18
MALES / 100 FEMALES
99.82
FEMALES / 100 MALES
40.9
MEDIAN AGE
3.0
AVG FAMILY SIZE
2.5
AVG HOUSEHOLD SIZE
4,601
LABOR FORCE [ PEOPLE ]
44.0%
PERCENT IN LABOR FORCE
6.0%
UNEMPLOYMENT RATE
Income in Jackson County
Income Overview in Jackson County
Per Capita Income in Jackson County is $21,876, while median incomes of families and households are $52,113 and $38,516 respectively.
| Characteristic | Number | Measure |
| Per Capita Income | 13,002 | $21,876 |
| Median Family Income | 3,575 | $52,113 |
| Mean Family Income | 3,575 | $61,512 |
| Median Household Income | 5,154 | $38,516 |
| Mean Household Income | 5,154 | $52,075 |
| Income Deficit | 3,575 | $7,614 |
| Wage / Income Gap (%) | 13,002 | 32.77% |
| Wage / Income Gap ($) | 13,002 | 67.23¢ per $1 |
| Gini / Inequality Index | 13,002 | 0.43 |
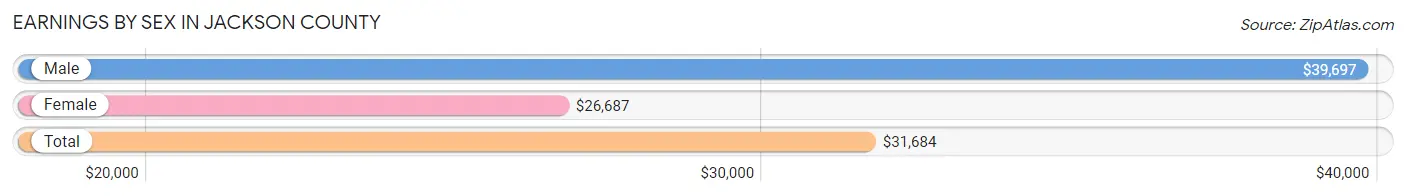
Earnings by Sex in Jackson County
Average Earnings in Jackson County are $31,684, $39,697 for men and $26,687 for women, a difference of 32.8%.
| Sex | Number | Average Earnings |
| Male | 2,745 (55.1%) | $39,697 |
| Female | 2,240 (44.9%) | $26,687 |
| Total | 4,985 (100.0%) | $31,684 |
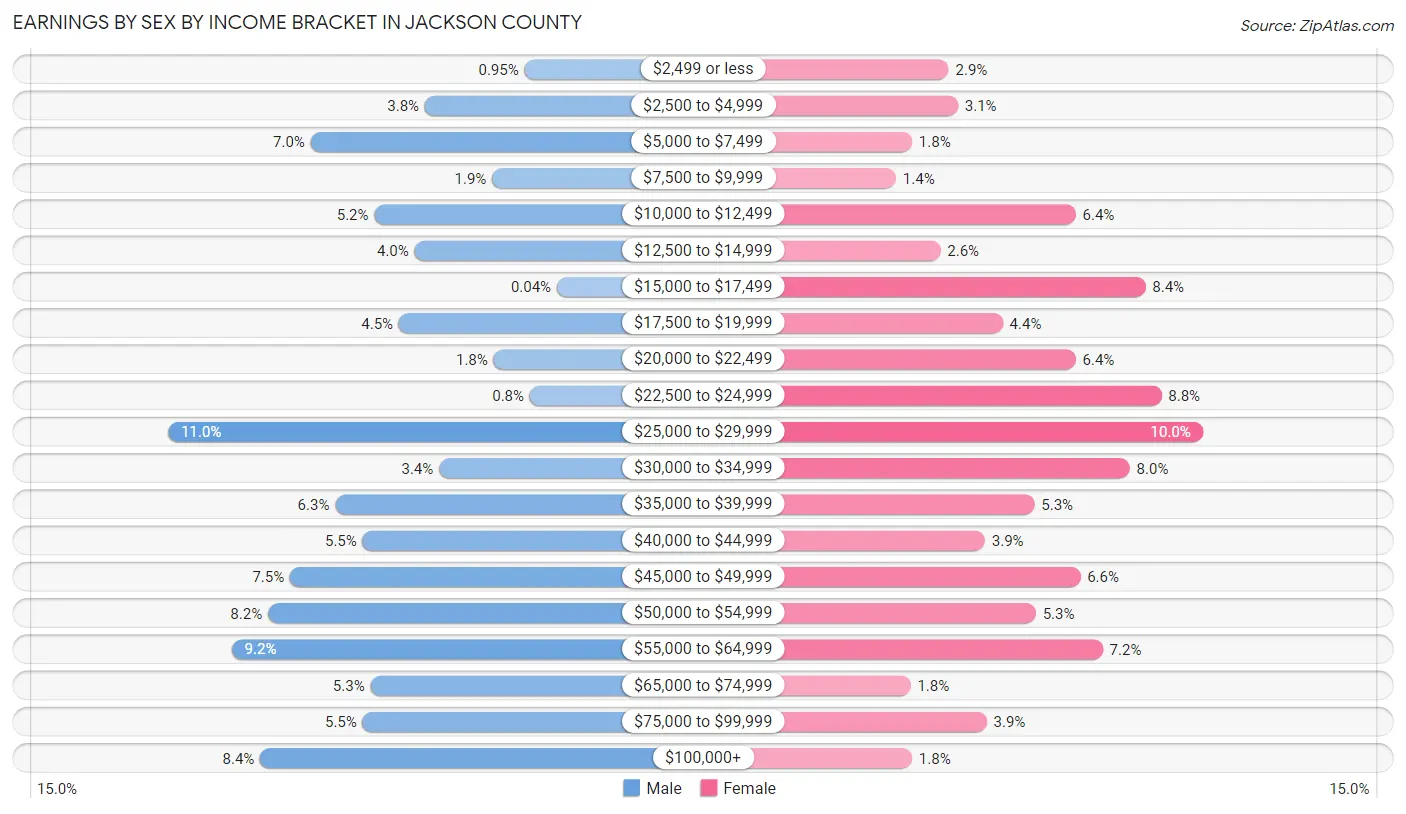
Earnings by Sex by Income Bracket in Jackson County
The most common earnings brackets in Jackson County are $25,000 to $29,999 for men (301 | 11.0%) and $25,000 to $29,999 for women (224 | 10.0%).
| Income | Male | Female |
| $2,499 or less | 26 (0.9%) | 64 (2.9%) |
| $2,500 to $4,999 | 103 (3.7%) | 70 (3.1%) |
| $5,000 to $7,499 | 191 (7.0%) | 41 (1.8%) |
| $7,500 to $9,999 | 51 (1.9%) | 31 (1.4%) |
| $10,000 to $12,499 | 142 (5.2%) | 144 (6.4%) |
| $12,500 to $14,999 | 111 (4.0%) | 59 (2.6%) |
| $15,000 to $17,499 | 1 (0.0%) | 188 (8.4%) |
| $17,500 to $19,999 | 123 (4.5%) | 98 (4.4%) |
| $20,000 to $22,499 | 50 (1.8%) | 144 (6.4%) |
| $22,500 to $24,999 | 22 (0.8%) | 198 (8.8%) |
| $25,000 to $29,999 | 301 (11.0%) | 224 (10.0%) |
| $30,000 to $34,999 | 92 (3.4%) | 178 (8.0%) |
| $35,000 to $39,999 | 172 (6.3%) | 118 (5.3%) |
| $40,000 to $44,999 | 151 (5.5%) | 87 (3.9%) |
| $45,000 to $49,999 | 207 (7.5%) | 147 (6.6%) |
| $50,000 to $54,999 | 224 (8.2%) | 119 (5.3%) |
| $55,000 to $64,999 | 252 (9.2%) | 161 (7.2%) |
| $65,000 to $74,999 | 145 (5.3%) | 40 (1.8%) |
| $75,000 to $99,999 | 151 (5.5%) | 88 (3.9%) |
| $100,000+ | 230 (8.4%) | 41 (1.8%) |
| Total | 2,745 (100.0%) | 2,240 (100.0%) |
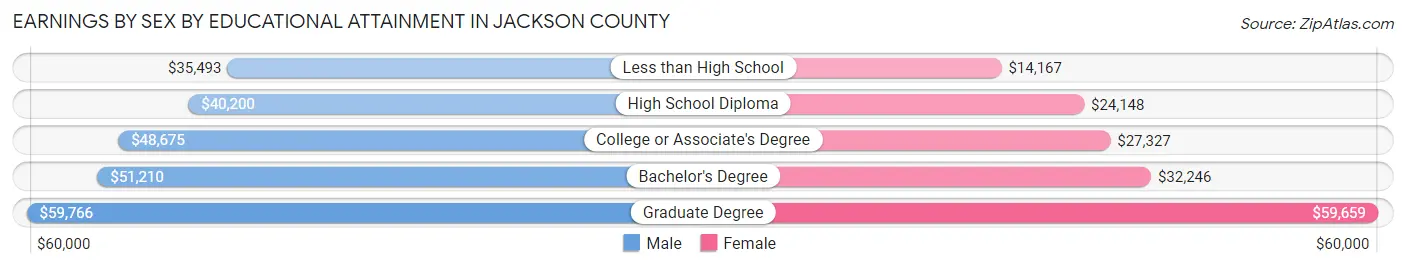
Earnings by Sex by Educational Attainment in Jackson County
Average earnings in Jackson County are $41,054 for men and $28,317 for women, a difference of 31.0%. Men with an educational attainment of graduate degree enjoy the highest average annual earnings of $59,766, while those with less than high school education earn the least with $35,493. Women with an educational attainment of graduate degree earn the most with the average annual earnings of $59,659, while those with less than high school education have the smallest earnings of $14,167.
| Educational Attainment | Male Income | Female Income |
| Less than High School | $35,493 | $14,167 |
| High School Diploma | $40,200 | $24,148 |
| College or Associate's Degree | $48,675 | $27,327 |
| Bachelor's Degree | $51,210 | $32,246 |
| Graduate Degree | $59,766 | $59,659 |
| Total | $41,054 | $28,317 |
Family Income in Jackson County
Family Income Brackets in Jackson County
According to the Jackson County family income data, there are 983 families falling into the $50,000 to $74,999 income range, which is the most common income bracket and makes up 27.5% of all families. Conversely, the $200,000+ income bracket is the least frequent group with only 39 families (1.1%) belonging to this category.
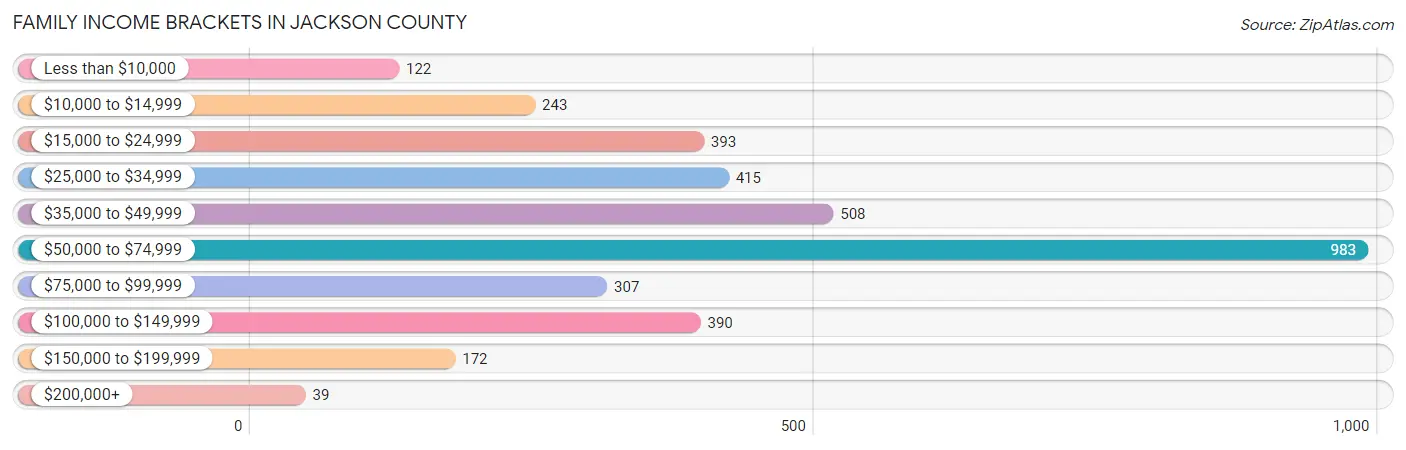
| Income Bracket | # Families | % Families |
| Less than $10,000 | 122 | 3.4% |
| $10,000 to $14,999 | 243 | 6.8% |
| $15,000 to $24,999 | 393 | 11.0% |
| $25,000 to $34,999 | 415 | 11.6% |
| $35,000 to $49,999 | 508 | 14.2% |
| $50,000 to $74,999 | 983 | 27.5% |
| $75,000 to $99,999 | 307 | 8.6% |
| $100,000 to $149,999 | 390 | 10.9% |
| $150,000 to $199,999 | 172 | 4.8% |
| $200,000+ | 39 | 1.1% |
Family Income by Famaliy Size in Jackson County
5-person families (148 | 4.1%) account for the highest median family income in Jackson County with $119,009 per family, while 5-person families (148 | 4.1%) have the highest median income of $23,802 per family member.
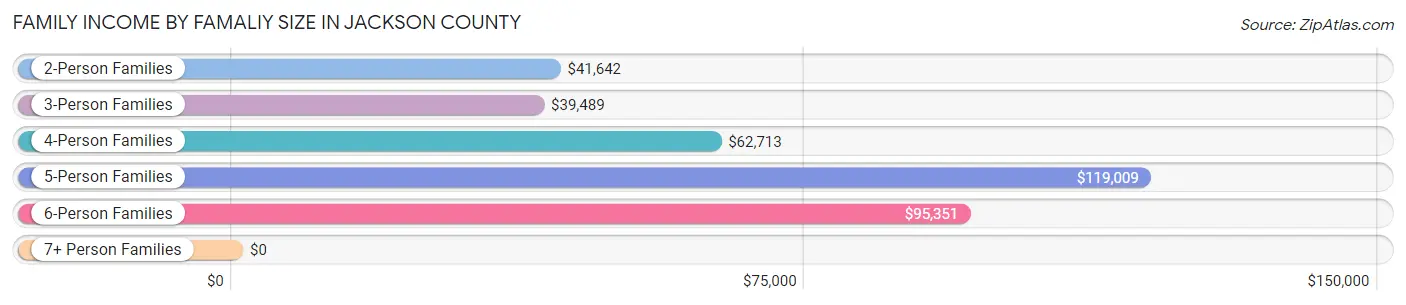
| Income Bracket | # Families | Median Income |
| 2-Person Families | 1,971 (55.1%) | $41,642 |
| 3-Person Families | 873 (24.4%) | $39,489 |
| 4-Person Families | 423 (11.8%) | $62,713 |
| 5-Person Families | 148 (4.1%) | $119,009 |
| 6-Person Families | 134 (3.7%) | $95,351 |
| 7+ Person Families | 26 (0.7%) | $0 |
| Total | 3,575 (100.0%) | $52,113 |
Family Income by Number of Earners in Jackson County
The median family income in Jackson County is $52,113, with families comprising 3+ earners (76) having the highest median family income of $76,250, while families with no earners (1,011) have the lowest median family income of $23,835, accounting for 2.1% and 28.3% of families, respectively.
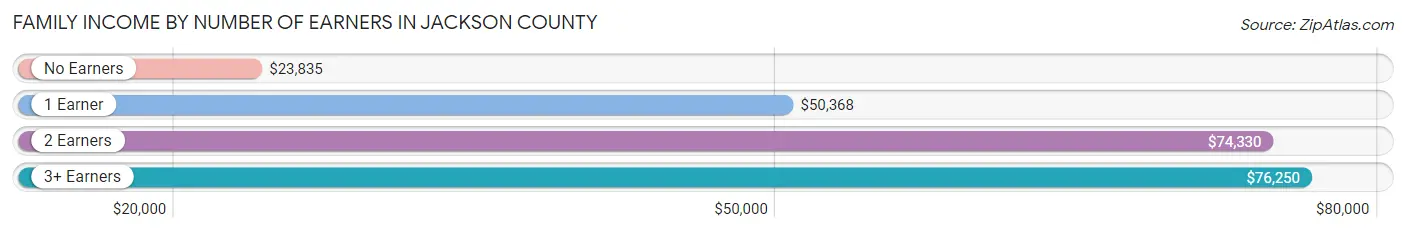
| Number of Earners | # Families | Median Income |
| No Earners | 1,011 (28.3%) | $23,835 |
| 1 Earner | 1,200 (33.6%) | $50,368 |
| 2 Earners | 1,288 (36.0%) | $74,330 |
| 3+ Earners | 76 (2.1%) | $76,250 |
| Total | 3,575 (100.0%) | $52,113 |
Household Income in Jackson County
Household Income Brackets in Jackson County
With 1,227 households falling in the category, the $50,000 to $74,999 income range is the most frequent in Jackson County, accounting for 23.8% of all households. In contrast, only 41 households (0.8%) fall into the $200,000+ income bracket, making it the least populous group.
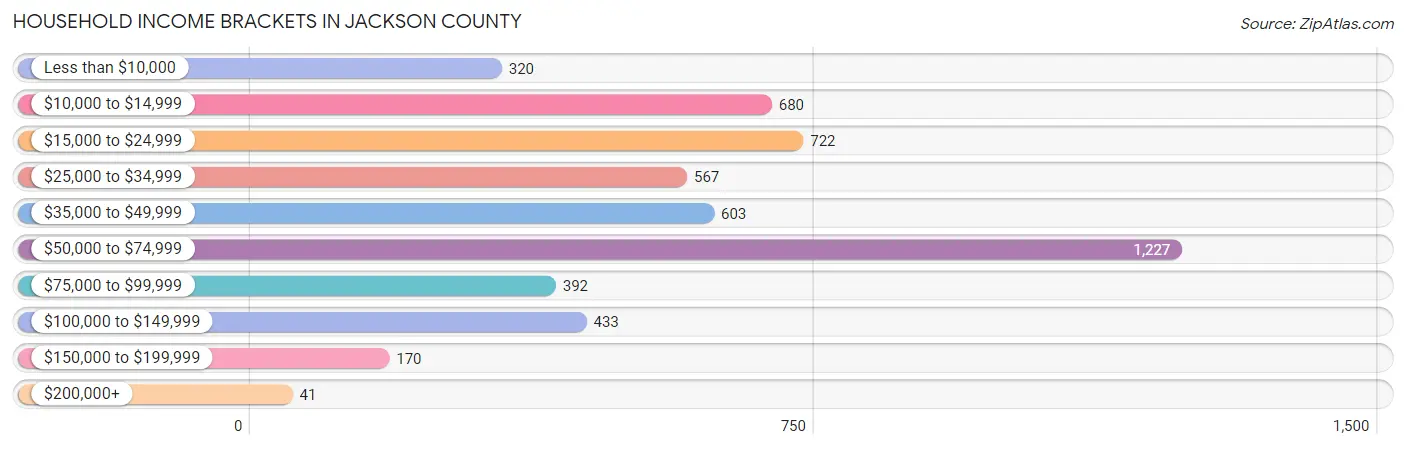
| Income Bracket | # Households | % Households |
| Less than $10,000 | 320 | 6.2% |
| $10,000 to $14,999 | 680 | 13.2% |
| $15,000 to $24,999 | 722 | 14.0% |
| $25,000 to $34,999 | 567 | 11.0% |
| $35,000 to $49,999 | 603 | 11.7% |
| $50,000 to $74,999 | 1,227 | 23.8% |
| $75,000 to $99,999 | 392 | 7.6% |
| $100,000 to $149,999 | 433 | 8.4% |
| $150,000 to $199,999 | 170 | 3.3% |
| $200,000+ | 41 | 0.8% |
Household Income by Householder Age in Jackson County
The median household income in Jackson County is $38,516, with the highest median household income of $66,030 found in the 15 to 24 years age bracket for the primary householder. A total of 225 households (4.4%) fall into this category. Meanwhile, the 65+ years age bracket for the primary householder has the lowest median household income of $24,047, with 1,419 households (27.5%) in this group.
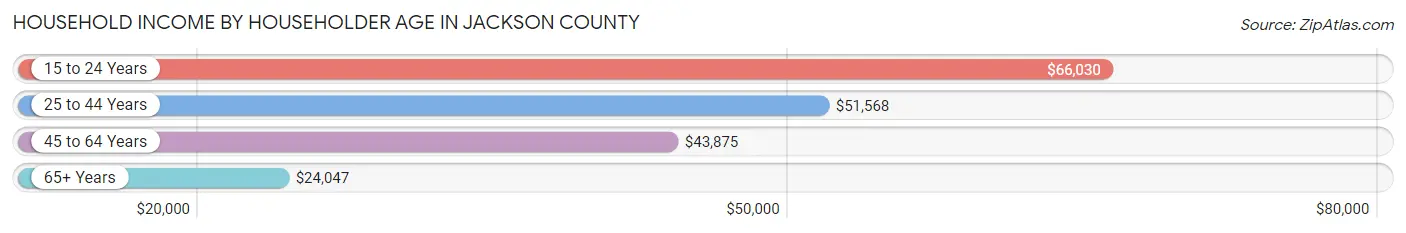
| Income Bracket | # Households | Median Income |
| 15 to 24 Years | 225 (4.4%) | $66,030 |
| 25 to 44 Years | 1,455 (28.2%) | $51,568 |
| 45 to 64 Years | 2,055 (39.9%) | $43,875 |
| 65+ Years | 1,419 (27.5%) | $24,047 |
| Total | 5,154 (100.0%) | $38,516 |
Poverty in Jackson County
Income Below Poverty by Sex and Age in Jackson County
With 21.6% poverty level for males and 23.7% for females among the residents of Jackson County, under 5 year old males and 18 to 24 year old females are the most vulnerable to poverty, with 159 males (38.3%) and 258 females (60.7%) in their respective age groups living below the poverty level.
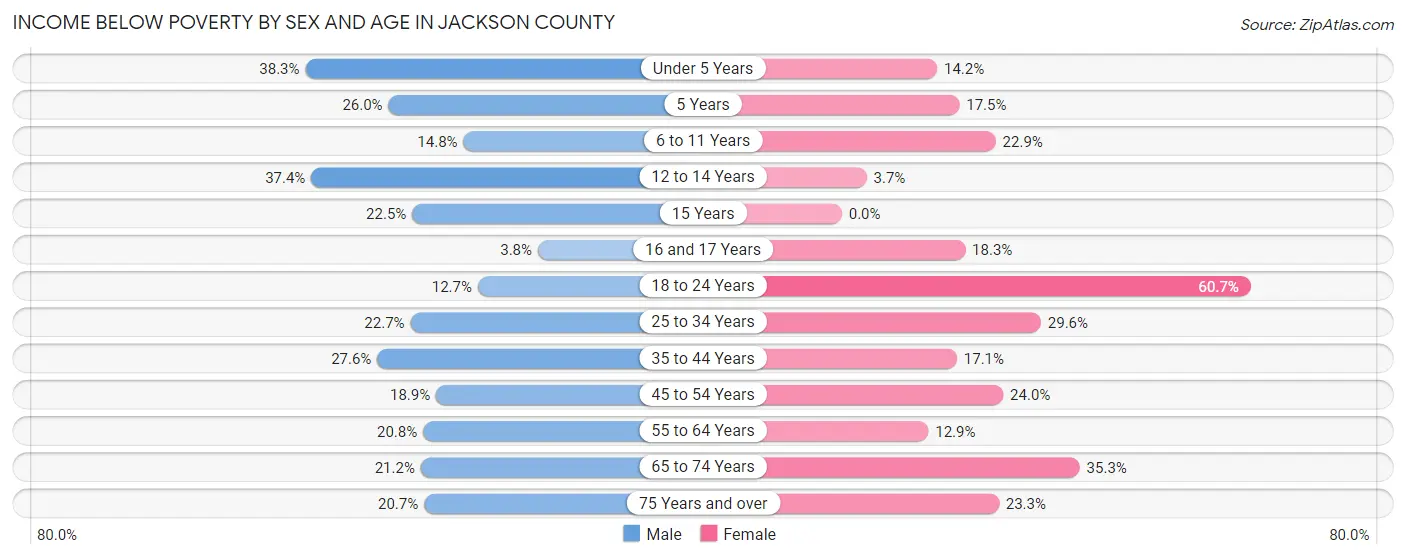
| Age Bracket | Male | Female |
| Under 5 Years | 159 (38.3%) | 45 (14.1%) |
| 5 Years | 20 (26.0%) | 26 (17.4%) |
| 6 to 11 Years | 88 (14.8%) | 69 (22.9%) |
| 12 to 14 Years | 76 (37.4%) | 13 (3.7%) |
| 15 Years | 11 (22.5%) | 0 (0.0%) |
| 16 and 17 Years | 9 (3.8%) | 37 (18.3%) |
| 18 to 24 Years | 65 (12.7%) | 258 (60.7%) |
| 25 to 34 Years | 156 (22.7%) | 214 (29.6%) |
| 35 to 44 Years | 225 (27.6%) | 148 (17.1%) |
| 45 to 54 Years | 165 (18.9%) | 208 (24.0%) |
| 55 to 64 Years | 193 (20.8%) | 120 (12.9%) |
| 65 to 74 Years | 147 (21.2%) | 273 (35.3%) |
| 75 Years and over | 73 (20.7%) | 107 (23.3%) |
| Total | 1,387 (21.6%) | 1,518 (23.7%) |
Income Above Poverty by Sex and Age in Jackson County
According to the poverty statistics in Jackson County, males aged 16 and 17 years and females aged 15 years are the age groups that are most secure financially, with 96.2% of males and 100.0% of females in these age groups living above the poverty line.
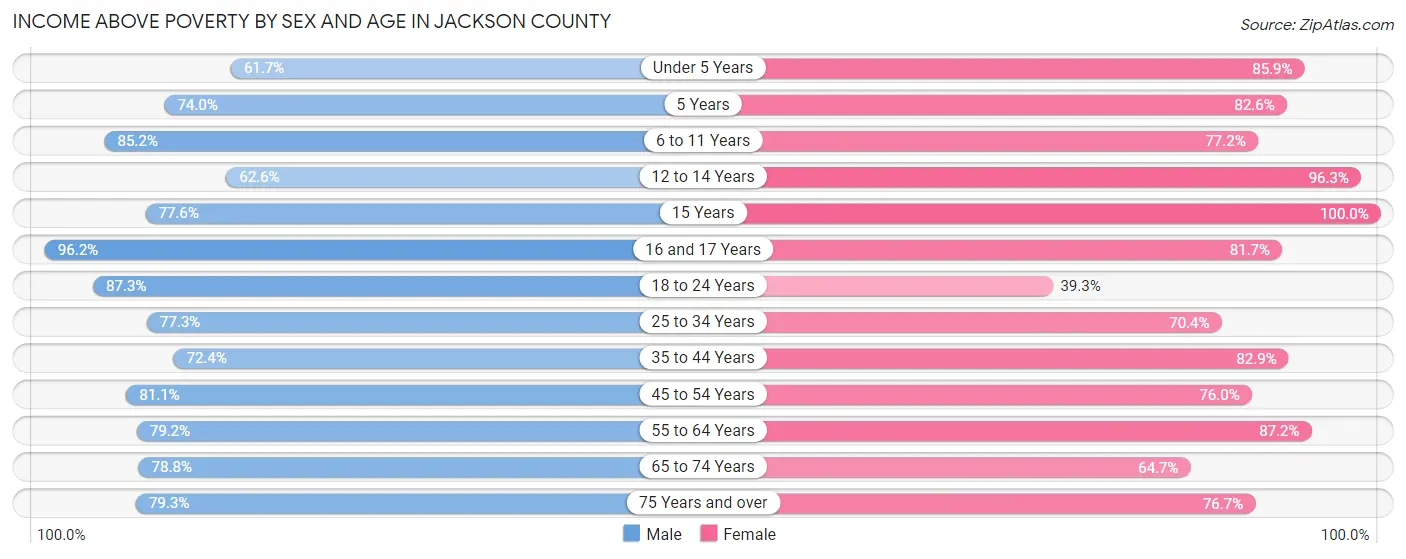
| Age Bracket | Male | Female |
| Under 5 Years | 256 (61.7%) | 273 (85.9%) |
| 5 Years | 57 (74.0%) | 123 (82.6%) |
| 6 to 11 Years | 505 (85.2%) | 233 (77.1%) |
| 12 to 14 Years | 127 (62.6%) | 340 (96.3%) |
| 15 Years | 38 (77.5%) | 23 (100.0%) |
| 16 and 17 Years | 229 (96.2%) | 165 (81.7%) |
| 18 to 24 Years | 447 (87.3%) | 167 (39.3%) |
| 25 to 34 Years | 531 (77.3%) | 510 (70.4%) |
| 35 to 44 Years | 589 (72.4%) | 718 (82.9%) |
| 45 to 54 Years | 708 (81.1%) | 660 (76.0%) |
| 55 to 64 Years | 733 (79.2%) | 814 (87.2%) |
| 65 to 74 Years | 547 (78.8%) | 500 (64.7%) |
| 75 Years and over | 280 (79.3%) | 352 (76.7%) |
| Total | 5,047 (78.4%) | 4,878 (76.3%) |
Income Below Poverty Among Married-Couple Families in Jackson County
The poverty statistics for married-couple families in Jackson County show that 11.7% or 311 of the total 2,654 families live below the poverty line. Families with 5 or more children have the highest poverty rate of 57.7%, comprising of 15 families. On the other hand, families with 1 or 2 children have the lowest poverty rate of 3.9%, which includes 34 families.
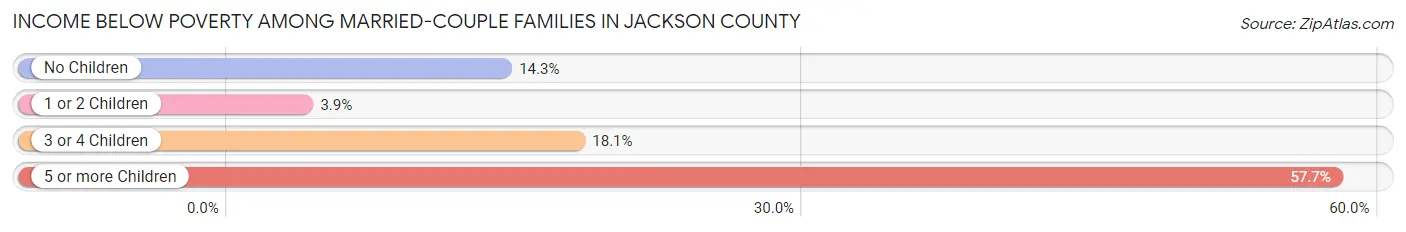
| Children | Above Poverty | Below Poverty |
| No Children | 1,310 (85.7%) | 219 (14.3%) |
| 1 or 2 Children | 828 (96.1%) | 34 (3.9%) |
| 3 or 4 Children | 194 (81.9%) | 43 (18.1%) |
| 5 or more Children | 11 (42.3%) | 15 (57.7%) |
| Total | 2,343 (88.3%) | 311 (11.7%) |
Income Below Poverty Among Single-Parent Households in Jackson County
According to the poverty data in Jackson County, 50.6% or 123 single-father households and 22.9% or 155 single-mother households are living below the poverty line. Among single-father households, those with 1 or 2 children have the highest poverty rate, with 26 households (100.0%) experiencing poverty. Likewise, among single-mother households, those with 3 or 4 children have the highest poverty rate, with 3 households (100.0%) falling below the poverty line.
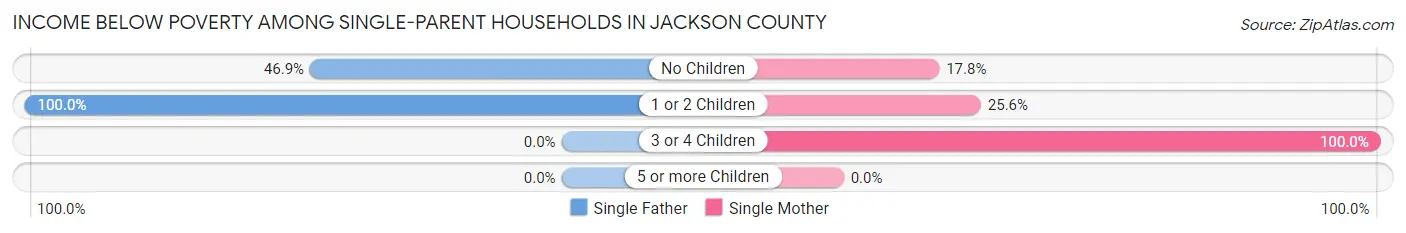
| Children | Single Father | Single Mother |
| No Children | 97 (46.9%) | 47 (17.8%) |
| 1 or 2 Children | 26 (100.0%) | 105 (25.6%) |
| 3 or 4 Children | 0 (0.0%) | 3 (100.0%) |
| 5 or more Children | 0 (0.0%) | 0 (0.0%) |
| Total | 123 (50.6%) | 155 (22.9%) |
Income Below Poverty Among Married-Couple vs Single-Parent Households in Jackson County
The poverty data for Jackson County shows that 311 of the married-couple family households (11.7%) and 278 of the single-parent households (30.2%) are living below the poverty level. Within the married-couple family households, those with 5 or more children have the highest poverty rate, with 15 households (57.7%) falling below the poverty line. Among the single-parent households, those with no children have the highest poverty rate, with 144 household (30.6%) living below poverty.
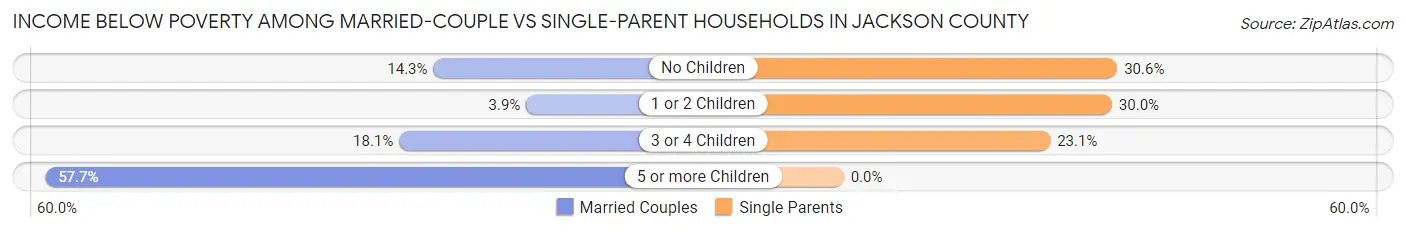
| Children | Married-Couple Families | Single-Parent Households |
| No Children | 219 (14.3%) | 144 (30.6%) |
| 1 or 2 Children | 34 (3.9%) | 131 (30.0%) |
| 3 or 4 Children | 43 (18.1%) | 3 (23.1%) |
| 5 or more Children | 15 (57.7%) | 0 (0.0%) |
| Total | 311 (11.7%) | 278 (30.2%) |
Race in Jackson County
The most populous races in Jackson County are White / Caucasian (12,662 | 97.4%), Two or more Races (259 | 2.0%), and Hispanic or Latino (140 | 1.1%).
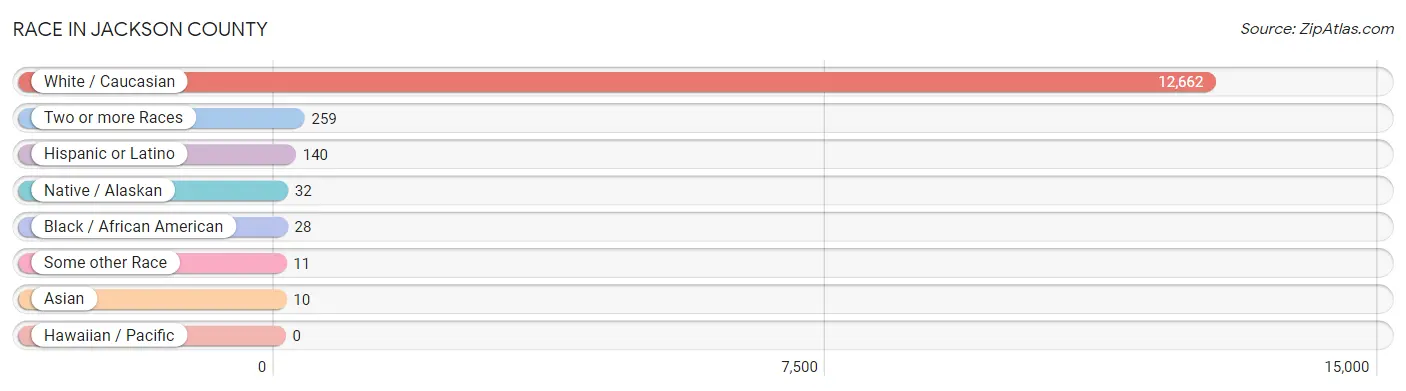
| Race | # Population | % Population |
| Asian | 10 | 0.1% |
| Black / African American | 28 | 0.2% |
| Hawaiian / Pacific | 0 | 0.0% |
| Hispanic or Latino | 140 | 1.1% |
| Native / Alaskan | 32 | 0.3% |
| White / Caucasian | 12,662 | 97.4% |
| Two or more Races | 259 | 2.0% |
| Some other Race | 11 | 0.1% |
| Total | 13,002 | 100.0% |
Ancestry in Jackson County
The most populous ancestries reported in Jackson County are American (3,981 | 30.6%), English (1,581 | 12.2%), Irish (630 | 4.9%), German (584 | 4.5%), and Scottish (179 | 1.4%), together accounting for 53.5% of all Jackson County residents.
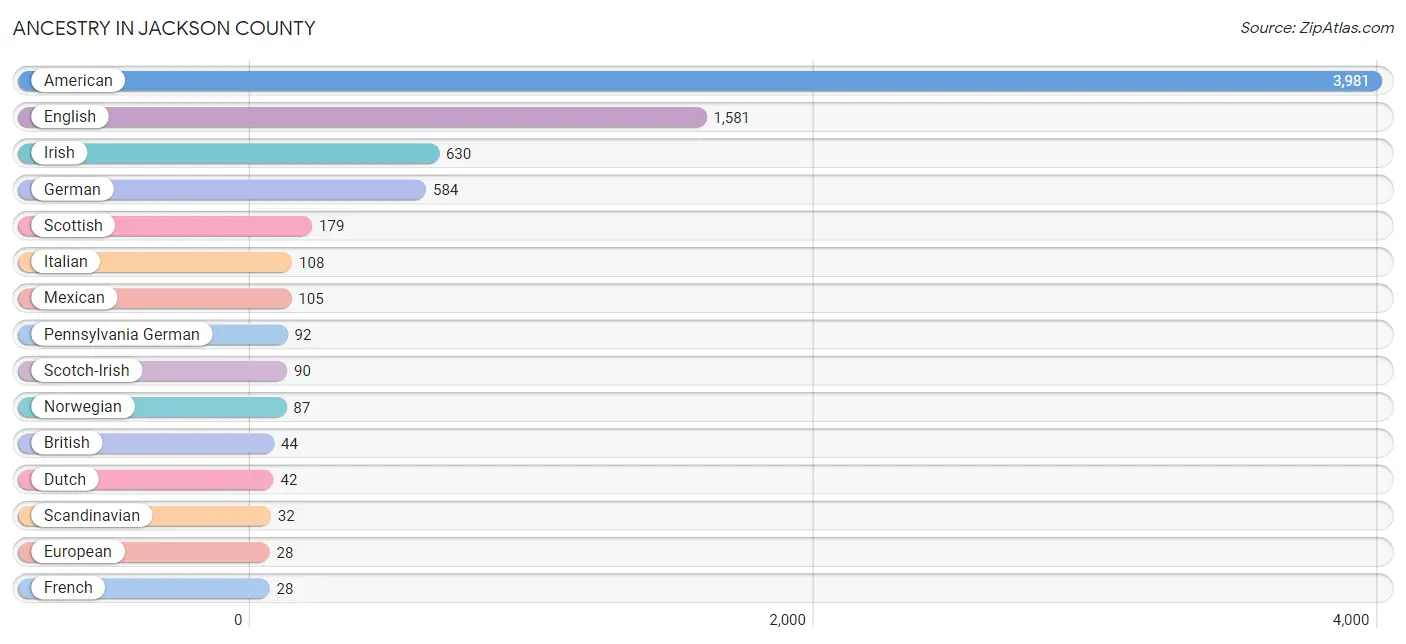
| Ancestry | # Population | % Population |
| American | 3,981 | 30.6% |
| British | 44 | 0.3% |
| Cherokee | 10 | 0.1% |
| Chippewa | 14 | 0.1% |
| Cuban | 21 | 0.2% |
| Dutch | 42 | 0.3% |
| Eastern European | 9 | 0.1% |
| English | 1,581 | 12.2% |
| European | 28 | 0.2% |
| French | 28 | 0.2% |
| German | 584 | 4.5% |
| Greek | 12 | 0.1% |
| Indian (Asian) | 10 | 0.1% |
| Irish | 630 | 4.9% |
| Iroquois | 1 | 0.0% |
| Italian | 108 | 0.8% |
| Mexican | 105 | 0.8% |
| Norwegian | 87 | 0.7% |
| Pennsylvania German | 92 | 0.7% |
| Scandinavian | 32 | 0.3% |
| Scotch-Irish | 90 | 0.7% |
| Scottish | 179 | 1.4% |
| Swedish | 1 | 0.0% |
| Welsh | 8 | 0.1% | View All 24 Rows |
Immigrants in Jackson County
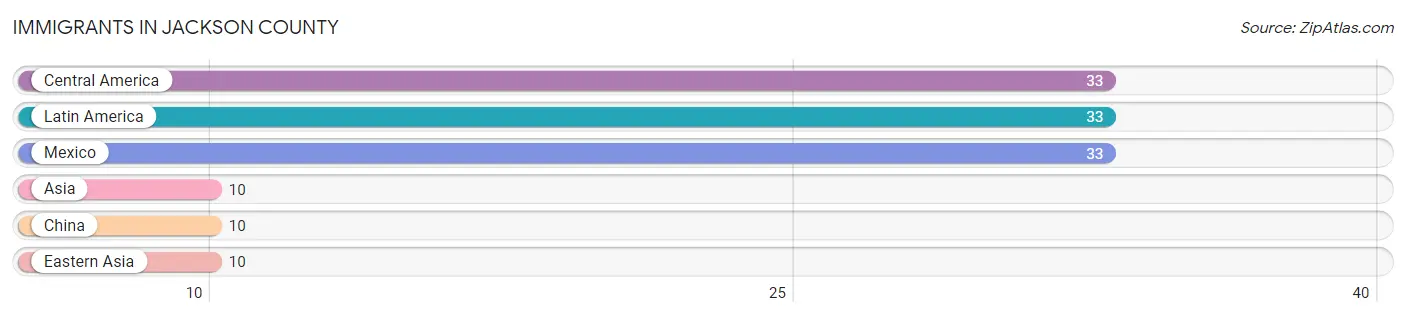
The most numerous immigrant groups reported in Jackson County came from Central America (33 | 0.3%), Latin America (33 | 0.3%), Mexico (33 | 0.3%), Asia (10 | 0.1%), and China (10 | 0.1%), together accounting for 0.9% of all Jackson County residents.
| Immigration Origin | # Population | % Population |
| Asia | 10 | 0.1% |
| Central America | 33 | 0.3% |
| China | 10 | 0.1% |
| Eastern Asia | 10 | 0.1% |
| Latin America | 33 | 0.3% |
| Mexico | 33 | 0.3% | View All 6 Rows |
Sex and Age in Jackson County
Sex and Age in Jackson County
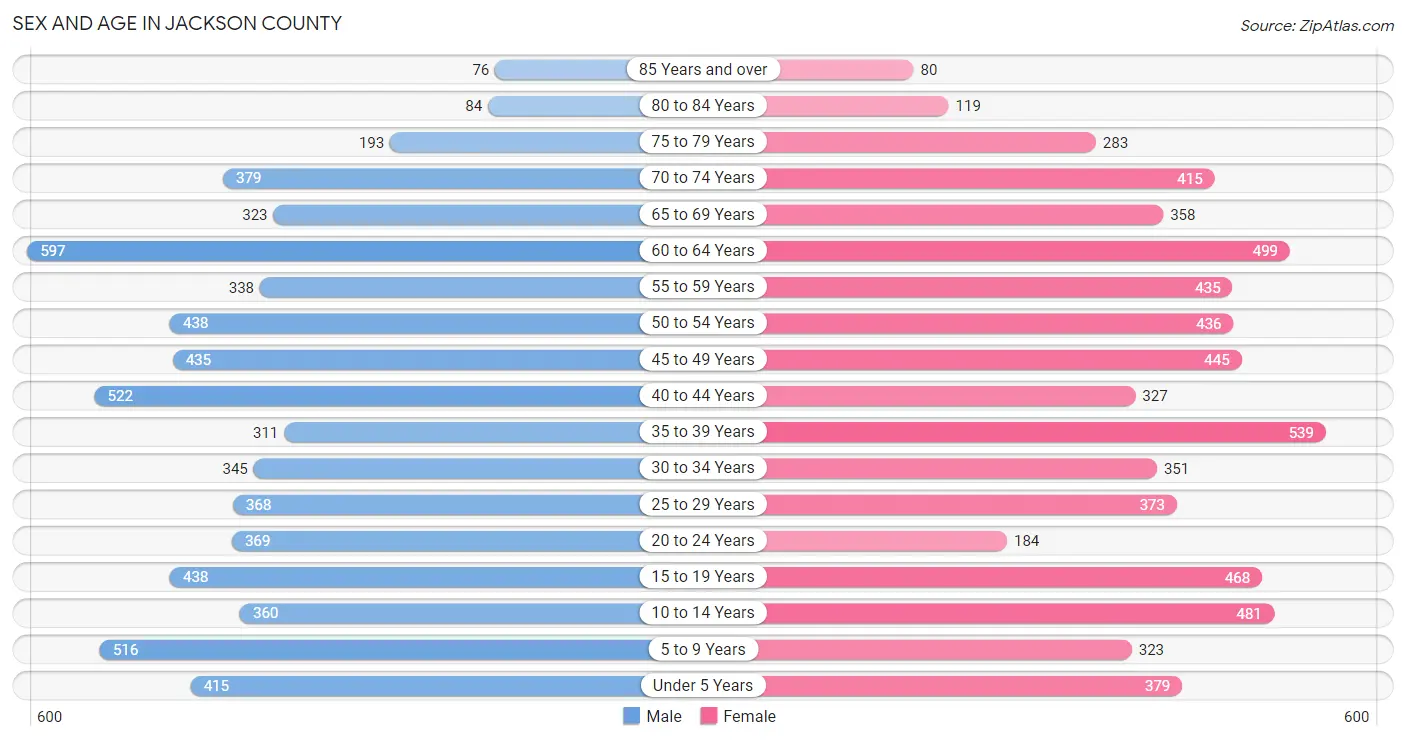
The most populous age groups in Jackson County are 60 to 64 Years (597 | 9.2%) for men and 35 to 39 Years (539 | 8.3%) for women.
| Age Bracket | Male | Female |
| Under 5 Years | 415 (6.4%) | 379 (5.8%) |
| 5 to 9 Years | 516 (7.9%) | 323 (5.0%) |
| 10 to 14 Years | 360 (5.5%) | 481 (7.4%) |
| 15 to 19 Years | 438 (6.7%) | 468 (7.2%) |
| 20 to 24 Years | 369 (5.7%) | 184 (2.8%) |
| 25 to 29 Years | 368 (5.7%) | 373 (5.7%) |
| 30 to 34 Years | 345 (5.3%) | 351 (5.4%) |
| 35 to 39 Years | 311 (4.8%) | 539 (8.3%) |
| 40 to 44 Years | 522 (8.0%) | 327 (5.0%) |
| 45 to 49 Years | 435 (6.7%) | 445 (6.9%) |
| 50 to 54 Years | 438 (6.7%) | 436 (6.7%) |
| 55 to 59 Years | 338 (5.2%) | 435 (6.7%) |
| 60 to 64 Years | 597 (9.2%) | 499 (7.7%) |
| 65 to 69 Years | 323 (5.0%) | 358 (5.5%) |
| 70 to 74 Years | 379 (5.8%) | 415 (6.4%) |
| 75 to 79 Years | 193 (3.0%) | 283 (4.4%) |
| 80 to 84 Years | 84 (1.3%) | 119 (1.8%) |
| 85 Years and over | 76 (1.2%) | 80 (1.2%) |
| Total | 6,507 (100.0%) | 6,495 (100.0%) |
Families and Households in Jackson County
Median Family Size in Jackson County
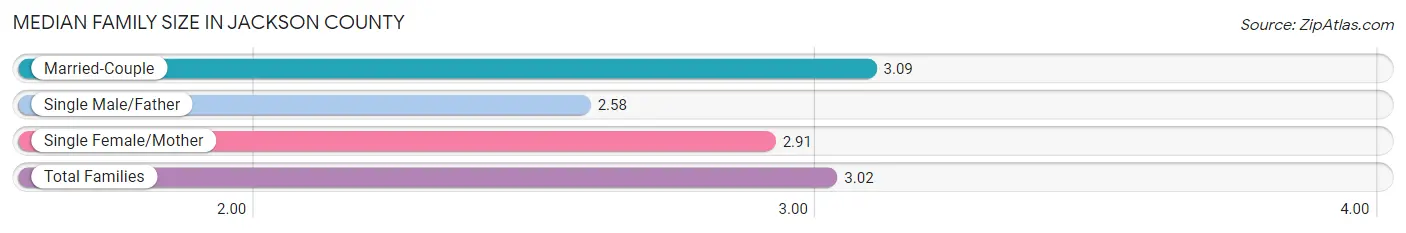
The median family size in Jackson County is 3.02 persons per family, with married-couple families (2,654 | 74.2%) accounting for the largest median family size of 3.09 persons per family. On the other hand, single male/father families (243 | 6.8%) represent the smallest median family size with 2.58 persons per family.
| Family Type | # Families | Family Size |
| Married-Couple | 2,654 (74.2%) | 3.09 |
| Single Male/Father | 243 (6.8%) | 2.58 |
| Single Female/Mother | 678 (19.0%) | 2.91 |
| Total Families | 3,575 (100.0%) | 3.02 |
Median Household Size in Jackson County
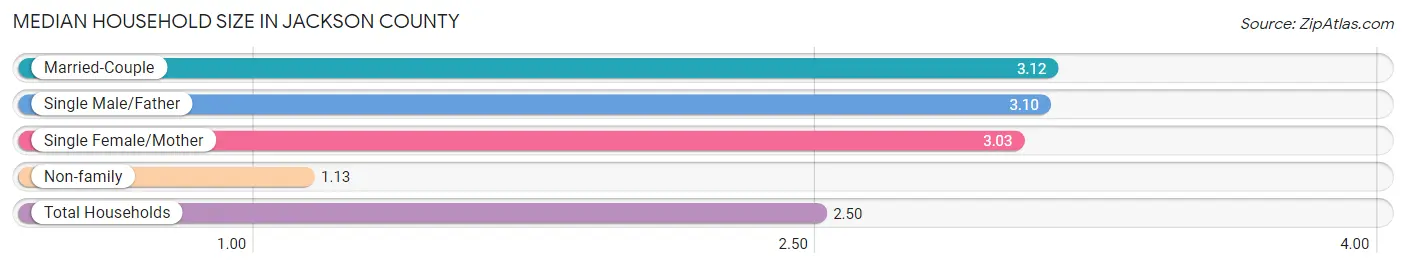
The median household size in Jackson County is 2.50 persons per household, with married-couple households (2,654 | 51.5%) accounting for the largest median household size of 3.12 persons per household. non-family households (1,579 | 30.6%) represent the smallest median household size with 1.13 persons per household.
| Household Type | # Households | Household Size |
| Married-Couple | 2,654 (51.5%) | 3.12 |
| Single Male/Father | 243 (4.7%) | 3.10 |
| Single Female/Mother | 678 (13.2%) | 3.03 |
| Non-family | 1,579 (30.6%) | 1.13 |
| Total Households | 5,154 (100.0%) | 2.50 |
Household Size by Marriage Status in Jackson County
Out of a total of 5,154 households in Jackson County, 3,575 (69.4%) are family households, while 1,579 (30.6%) are nonfamily households. The most numerous type of family households are 2-person households, comprising 1,803, and the most common type of nonfamily households are 1-person households, comprising 1,311.
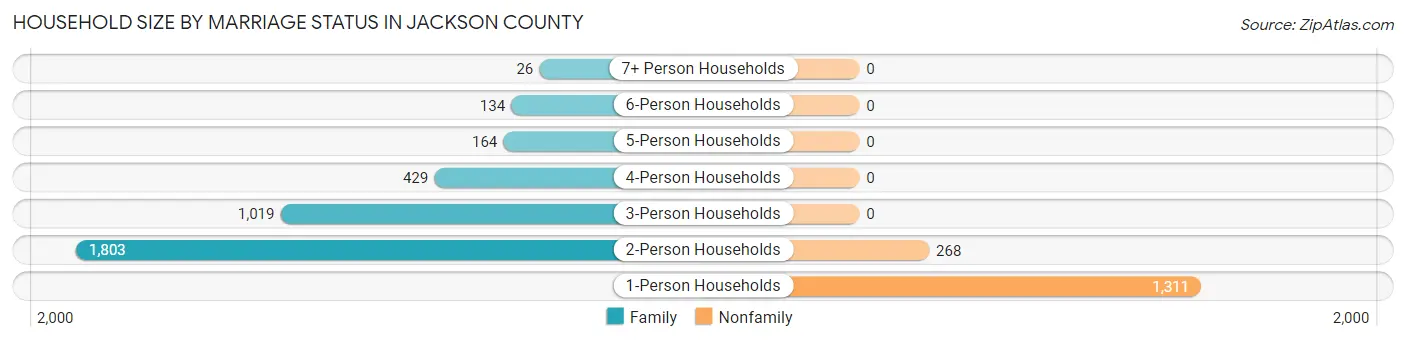
| Household Size | Family Households | Nonfamily Households |
| 1-Person Households | - | 1,311 (25.4%) |
| 2-Person Households | 1,803 (35.0%) | 268 (5.2%) |
| 3-Person Households | 1,019 (19.8%) | 0 (0.0%) |
| 4-Person Households | 429 (8.3%) | 0 (0.0%) |
| 5-Person Households | 164 (3.2%) | 0 (0.0%) |
| 6-Person Households | 134 (2.6%) | 0 (0.0%) |
| 7+ Person Households | 26 (0.5%) | 0 (0.0%) |
| Total | 3,575 (69.4%) | 1,579 (30.6%) |
Female Fertility in Jackson County
Fertility by Age in Jackson County
Average fertility rate in Jackson County is 12.0 births per 1,000 women. Women in the age bracket of 20 to 34 years have the highest fertility rate with 35.0 births per 1,000 women. Women in the age bracket of 20 to 34 years acount for 100.0% of all women with births.
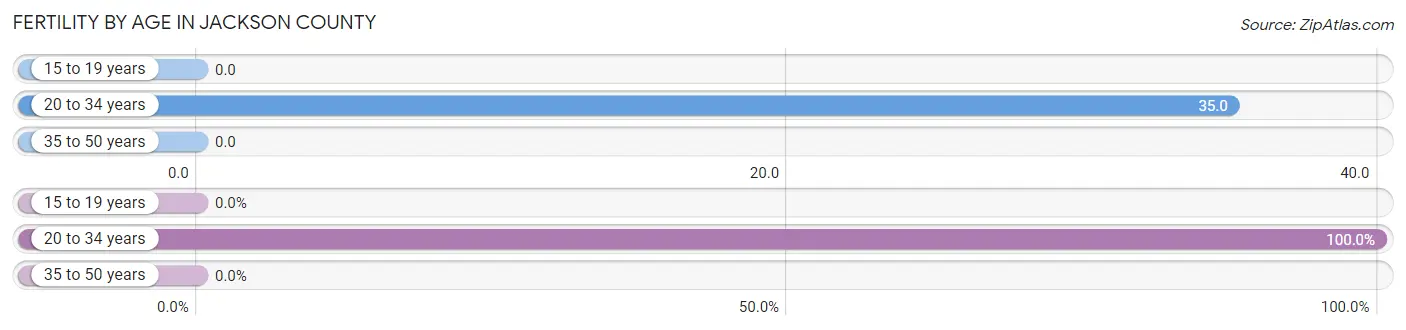
| Age Bracket | Women with Births | Births / 1,000 Women |
| 15 to 19 years | 0 (0.0%) | 0.0 |
| 20 to 34 years | 32 (100.0%) | 35.0 |
| 35 to 50 years | 0 (0.0%) | 0.0 |
| Total | 32 (100.0%) | 12.0 |
Fertility by Age by Marriage Status in Jackson County
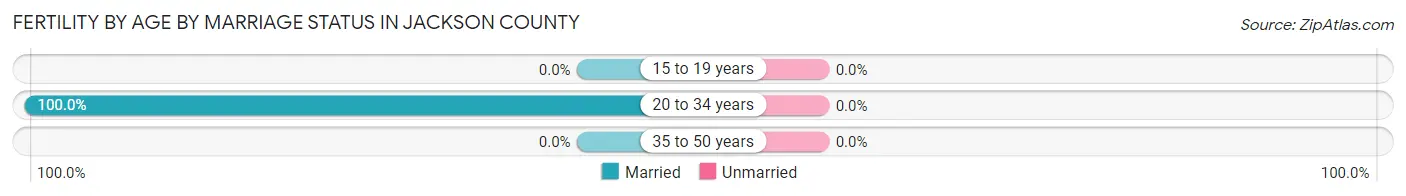
| Age Bracket | Married | Unmarried |
| 15 to 19 years | 0 (0.0%) | 0 (0.0%) |
| 20 to 34 years | 32 (100.0%) | 0 (0.0%) |
| 35 to 50 years | 0 (0.0%) | 0 (0.0%) |
| Total | 32 (100.0%) | 0 (0.0%) |
Fertility by Education in Jackson County
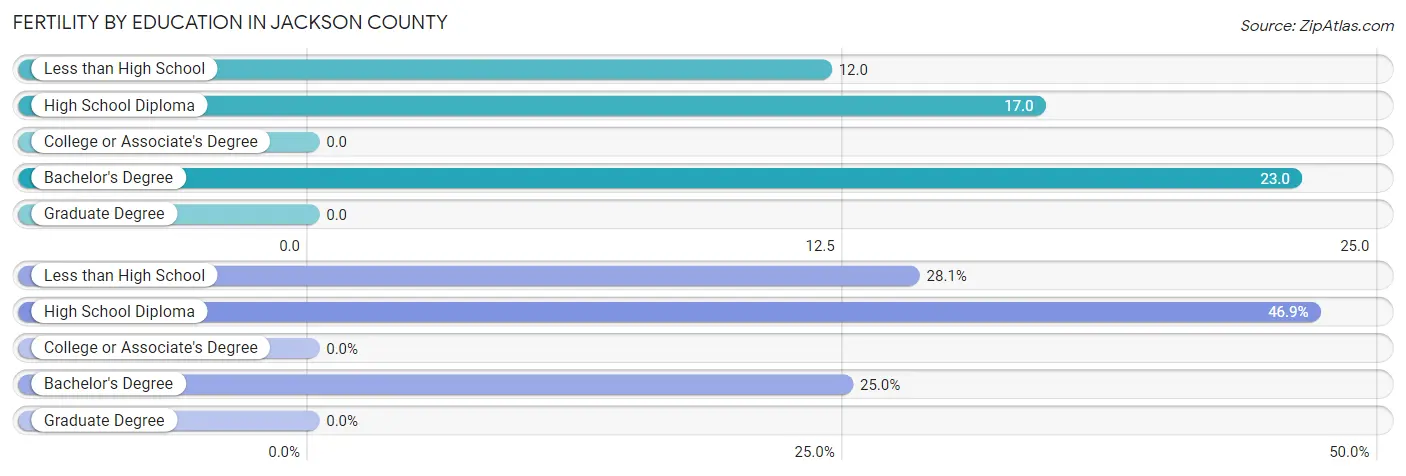
| Educational Attainment | Women with Births | Births / 1,000 Women |
| Less than High School | 9 (28.1%) | 12.0 |
| High School Diploma | 15 (46.9%) | 17.0 |
| College or Associate's Degree | 0 (0.0%) | 0.0 |
| Bachelor's Degree | 8 (25.0%) | 23.0 |
| Graduate Degree | 0 (0.0%) | 0.0 |
| Total | 32 (100.0%) | 12.0 |
Fertility by Education by Marriage Status in Jackson County
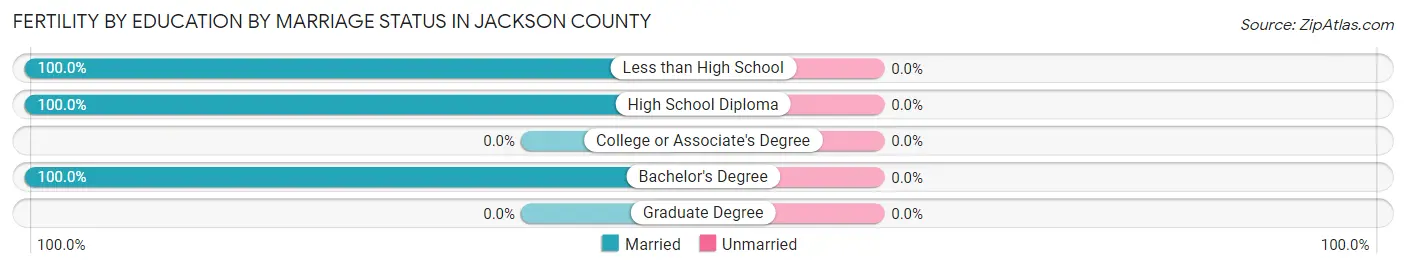
| Educational Attainment | Married | Unmarried |
| Less than High School | 9 (100.0%) | 0 (0.0%) |
| High School Diploma | 15 (100.0%) | 0 (0.0%) |
| College or Associate's Degree | 0 (0.0%) | 0 (0.0%) |
| Bachelor's Degree | 8 (100.0%) | 0 (0.0%) |
| Graduate Degree | 0 (0.0%) | 0 (0.0%) |
| Total | 32 (100.0%) | 0 (0.0%) |
Employment Characteristics in Jackson County
Employment by Class of Employer in Jackson County
Among the 4,274 employed individuals in Jackson County, private company employees (2,834 | 66.3%), local government employees (474 | 11.1%), and federal government employees (370 | 8.7%) make up the most common classes of employment.
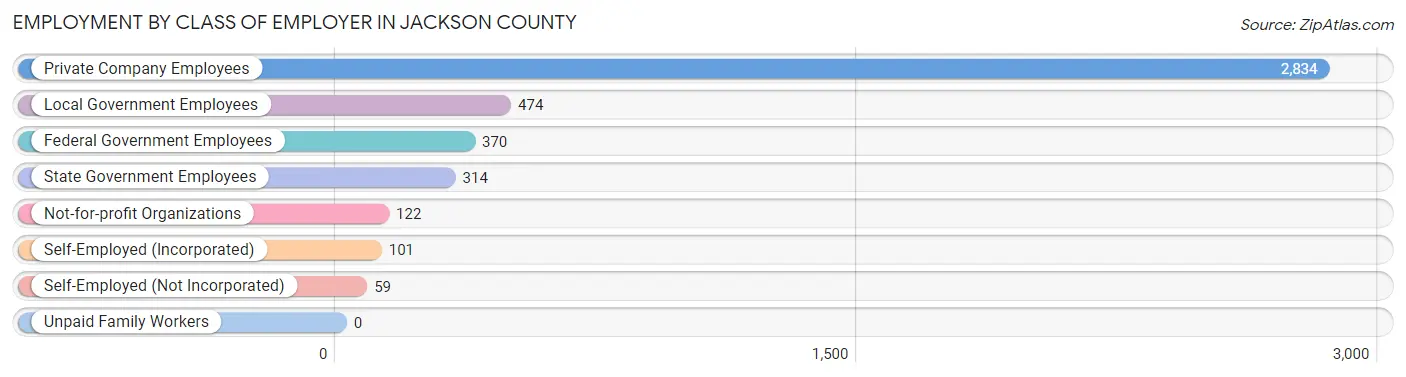
| Employer Class | # Employees | % Employees |
| Private Company Employees | 2,834 | 66.3% |
| Self-Employed (Incorporated) | 101 | 2.4% |
| Self-Employed (Not Incorporated) | 59 | 1.4% |
| Not-for-profit Organizations | 122 | 2.9% |
| Local Government Employees | 474 | 11.1% |
| State Government Employees | 314 | 7.3% |
| Federal Government Employees | 370 | 8.7% |
| Unpaid Family Workers | 0 | 0.0% |
| Total | 4,274 | 100.0% |
Employment Status by Age in Jackson County
According to the labor force statistics for Jackson County, out of the total population over 16 years of age (10,456), 44.0% or 4,601 individuals are in the labor force, with 6.0% or 276 of them unemployed. The age group with the highest labor force participation rate is 20 to 24 years, with 88.2% or 488 individuals in the labor force. Within the labor force, the 25 to 29 years age range has the highest percentage of unemployed individuals, with 16.4% or 79 of them being unemployed.
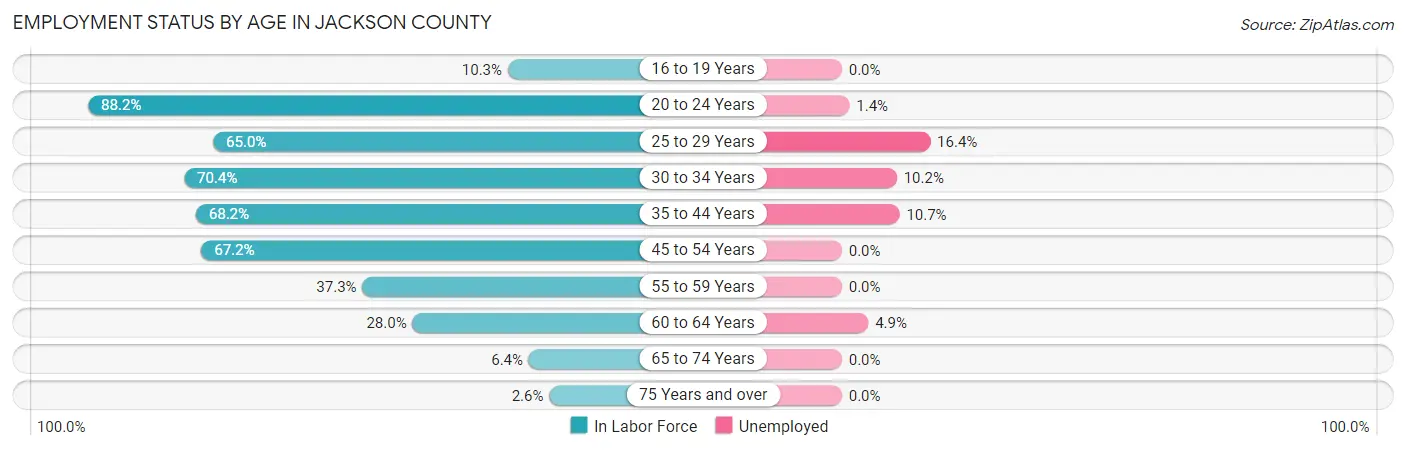
| Age Bracket | In Labor Force | Unemployed |
| 16 to 19 Years | 86 (10.3%) | 0 (0.0%) |
| 20 to 24 Years | 488 (88.2%) | 7 (1.4%) |
| 25 to 29 Years | 482 (65.0%) | 79 (16.4%) |
| 30 to 34 Years | 490 (70.4%) | 50 (10.2%) |
| 35 to 44 Years | 1,159 (68.2%) | 124 (10.7%) |
| 45 to 54 Years | 1,179 (67.2%) | 0 (0.0%) |
| 55 to 59 Years | 288 (37.3%) | 0 (0.0%) |
| 60 to 64 Years | 307 (28.0%) | 15 (4.9%) |
| 65 to 74 Years | 94 (6.4%) | 0 (0.0%) |
| 75 Years and over | 22 (2.6%) | 0 (0.0%) |
| Total | 4,601 (44.0%) | 276 (6.0%) |
Employment Status by Educational Attainment in Jackson County
According to labor force statistics for Jackson County, 57.8% of individuals (3,907) out of the total population between 25 and 64 years of age (6,759) are in the labor force, with 6.9% or 270 of them being unemployed. The group with the highest labor force participation rate are those with the educational attainment of bachelor's degree or higher, with 80.4% or 703 individuals in the labor force. Within the labor force, individuals with high school diploma education have the highest percentage of unemployment, with 8.8% or 161 of them being unemployed.
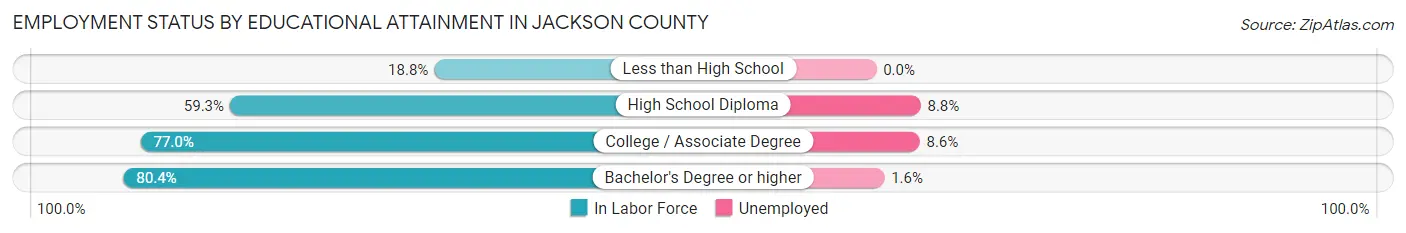
| Educational Attainment | In Labor Force | Unemployed |
| Less than High School | 253 (18.8%) | 0 (0.0%) |
| High School Diploma | 1,833 (59.3%) | 272 (8.8%) |
| College / Associate Degree | 1,113 (77.0%) | 124 (8.6%) |
| Bachelor's Degree or higher | 703 (80.4%) | 14 (1.6%) |
| Total | 3,907 (57.8%) | 466 (6.9%) |
Employment Occupations by Sex in Jackson County
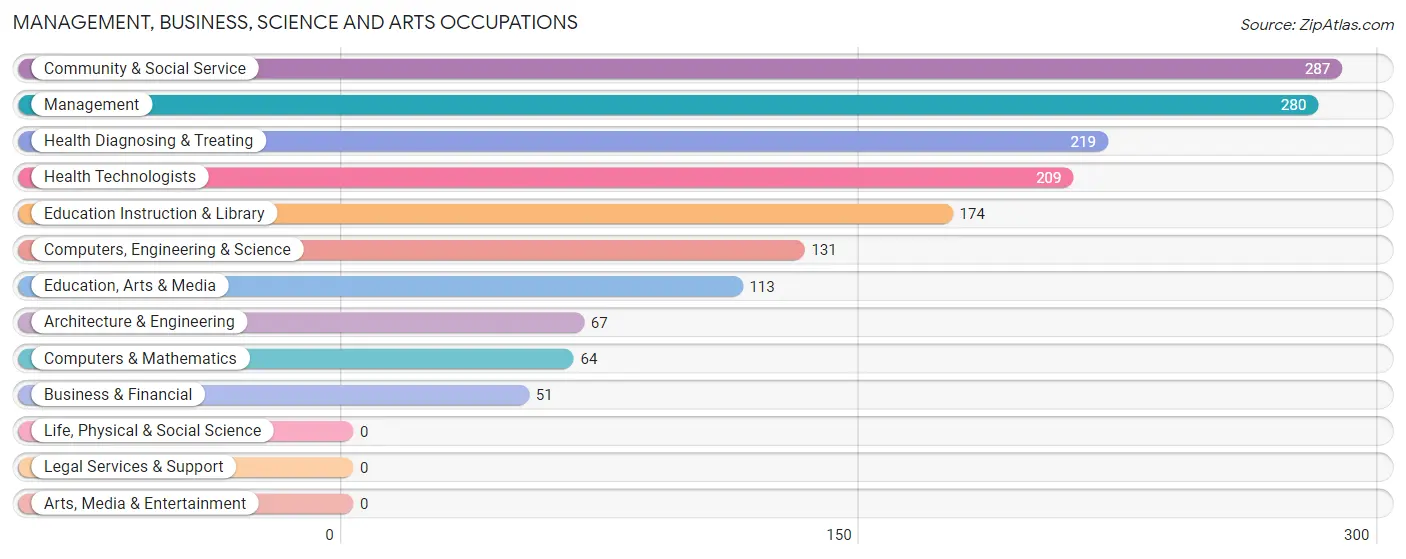
Management, Business, Science and Arts Occupations
The most common Management, Business, Science and Arts occupations in Jackson County are Community & Social Service (287 | 6.6%), Management (280 | 6.5%), Health Diagnosing & Treating (219 | 5.1%), Health Technologists (209 | 4.8%), and Education Instruction & Library (174 | 4.0%).
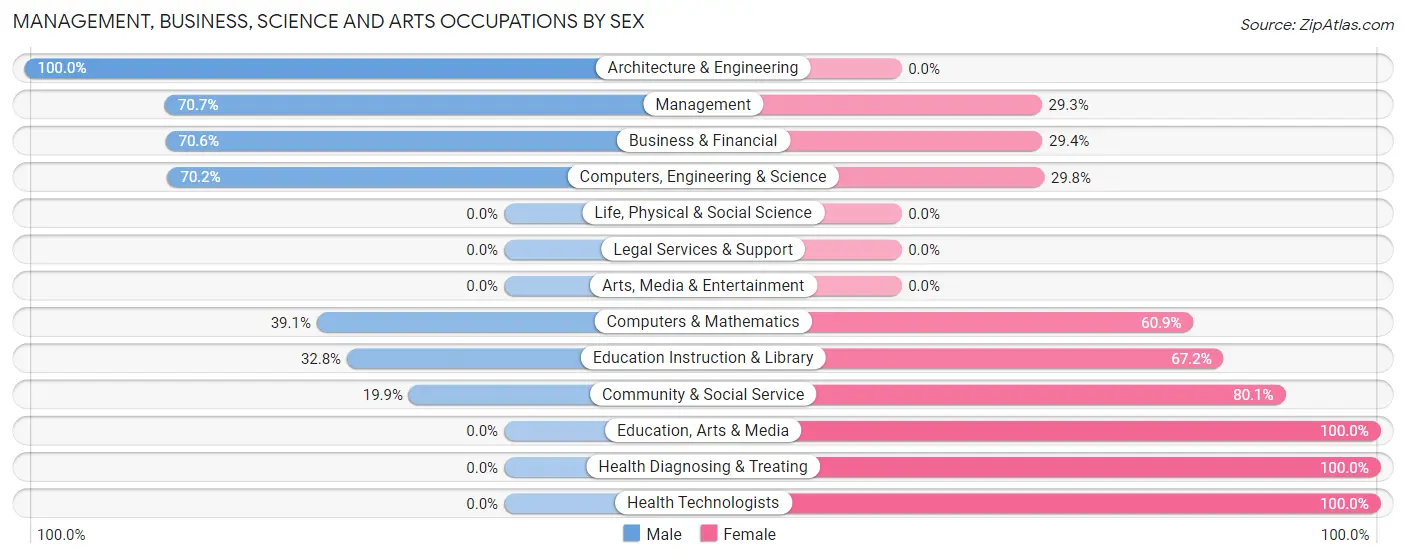
Management, Business, Science and Arts Occupations by Sex
Within the Management, Business, Science and Arts occupations in Jackson County, the most male-oriented occupations are Architecture & Engineering (100.0%), Management (70.7%), and Business & Financial (70.6%), while the most female-oriented occupations are Education, Arts & Media (100.0%), Health Diagnosing & Treating (100.0%), and Health Technologists (100.0%).
| Occupation | Male | Female |
| Management | 198 (70.7%) | 82 (29.3%) |
| Business & Financial | 36 (70.6%) | 15 (29.4%) |
| Computers, Engineering & Science | 92 (70.2%) | 39 (29.8%) |
| Computers & Mathematics | 25 (39.1%) | 39 (60.9%) |
| Architecture & Engineering | 67 (100.0%) | 0 (0.0%) |
| Life, Physical & Social Science | 0 (0.0%) | 0 (0.0%) |
| Community & Social Service | 57 (19.9%) | 230 (80.1%) |
| Education, Arts & Media | 0 (0.0%) | 113 (100.0%) |
| Legal Services & Support | 0 (0.0%) | 0 (0.0%) |
| Education Instruction & Library | 57 (32.8%) | 117 (67.2%) |
| Arts, Media & Entertainment | 0 (0.0%) | 0 (0.0%) |
| Health Diagnosing & Treating | 0 (0.0%) | 219 (100.0%) |
| Health Technologists | 0 (0.0%) | 209 (100.0%) |
| Total (Category) | 383 (39.6%) | 585 (60.4%) |
| Total (Overall) | 2,274 (52.6%) | 2,047 (47.4%) |
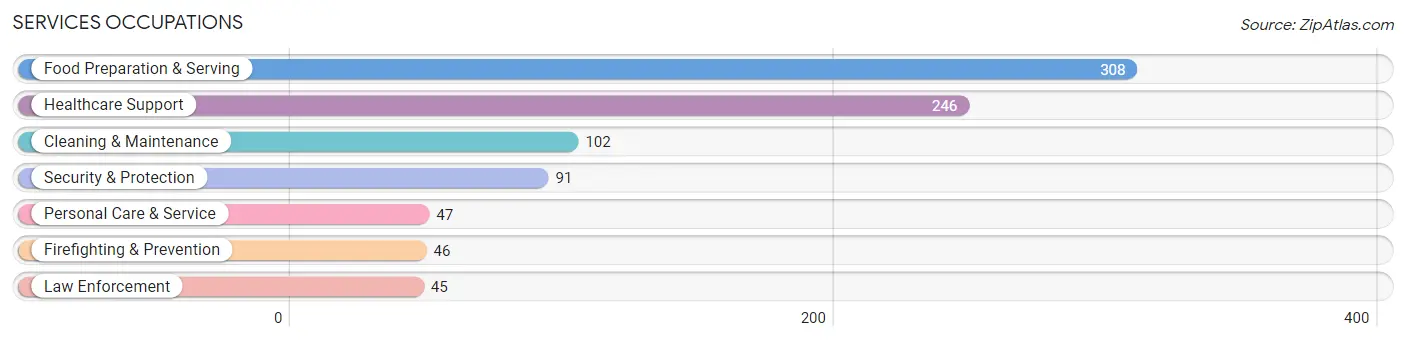
Services Occupations
The most common Services occupations in Jackson County are Food Preparation & Serving (308 | 7.1%), Healthcare Support (246 | 5.7%), Cleaning & Maintenance (102 | 2.4%), Security & Protection (91 | 2.1%), and Personal Care & Service (47 | 1.1%).
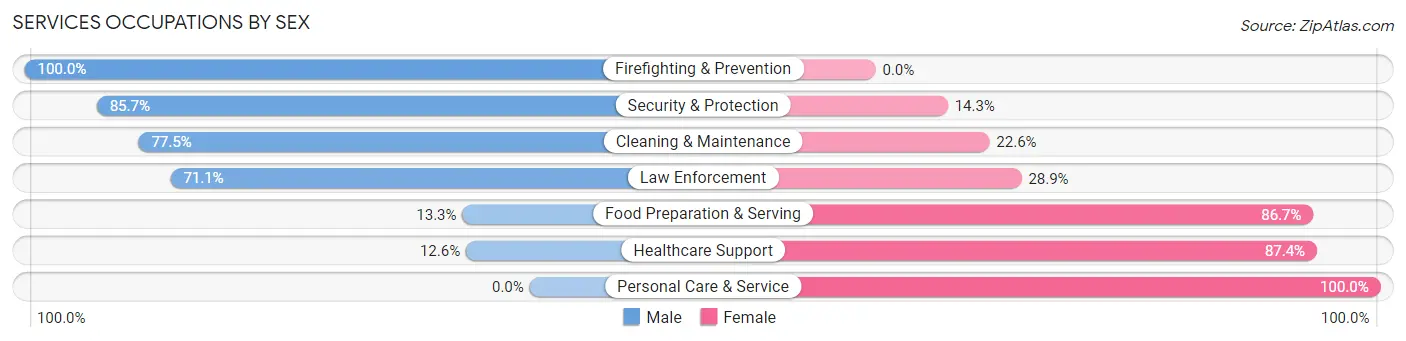
Services Occupations by Sex
Within the Services occupations in Jackson County, the most male-oriented occupations are Firefighting & Prevention (100.0%), Security & Protection (85.7%), and Cleaning & Maintenance (77.4%), while the most female-oriented occupations are Personal Care & Service (100.0%), Healthcare Support (87.4%), and Food Preparation & Serving (86.7%).
| Occupation | Male | Female |
| Healthcare Support | 31 (12.6%) | 215 (87.4%) |
| Security & Protection | 78 (85.7%) | 13 (14.3%) |
| Firefighting & Prevention | 46 (100.0%) | 0 (0.0%) |
| Law Enforcement | 32 (71.1%) | 13 (28.9%) |
| Food Preparation & Serving | 41 (13.3%) | 267 (86.7%) |
| Cleaning & Maintenance | 79 (77.4%) | 23 (22.6%) |
| Personal Care & Service | 0 (0.0%) | 47 (100.0%) |
| Total (Category) | 229 (28.8%) | 565 (71.2%) |
| Total (Overall) | 2,274 (52.6%) | 2,047 (47.4%) |
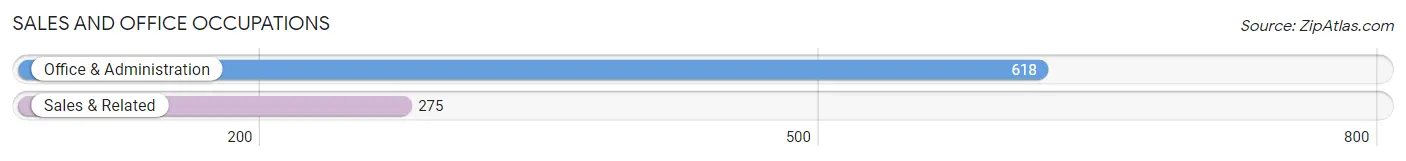
Sales and Office Occupations
The most common Sales and Office occupations in Jackson County are Office & Administration (618 | 14.3%), and Sales & Related (275 | 6.4%).
Sales and Office Occupations by Sex
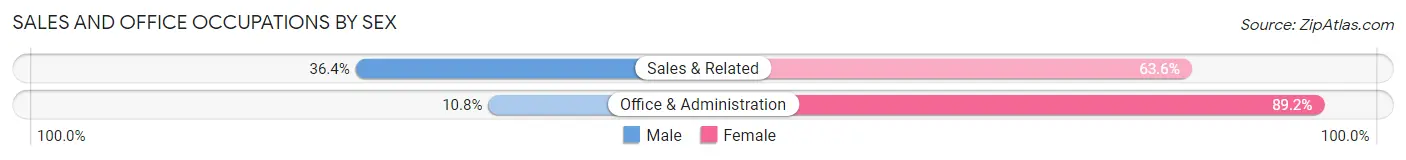
| Occupation | Male | Female |
| Sales & Related | 100 (36.4%) | 175 (63.6%) |
| Office & Administration | 67 (10.8%) | 551 (89.2%) |
| Total (Category) | 167 (18.7%) | 726 (81.3%) |
| Total (Overall) | 2,274 (52.6%) | 2,047 (47.4%) |
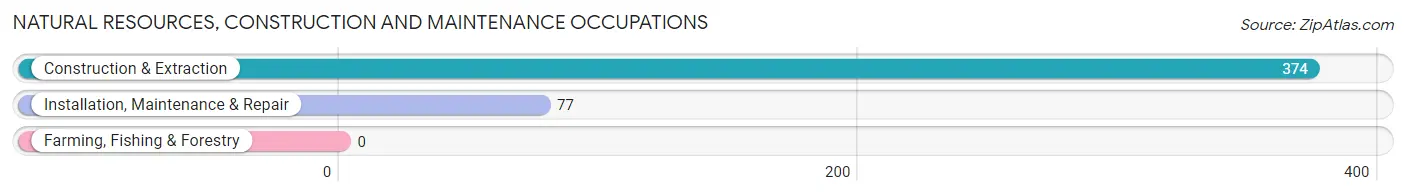
Natural Resources, Construction and Maintenance Occupations
The most common Natural Resources, Construction and Maintenance occupations in Jackson County are Construction & Extraction (374 | 8.7%), and Installation, Maintenance & Repair (77 | 1.8%).
Natural Resources, Construction and Maintenance Occupations by Sex
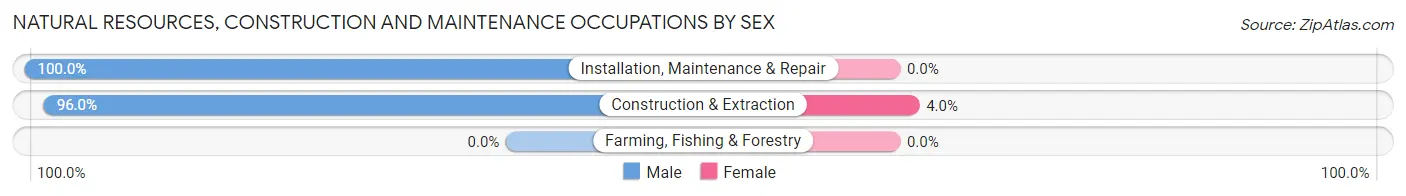
| Occupation | Male | Female |
| Farming, Fishing & Forestry | 0 (0.0%) | 0 (0.0%) |
| Construction & Extraction | 359 (96.0%) | 15 (4.0%) |
| Installation, Maintenance & Repair | 77 (100.0%) | 0 (0.0%) |
| Total (Category) | 436 (96.7%) | 15 (3.3%) |
| Total (Overall) | 2,274 (52.6%) | 2,047 (47.4%) |
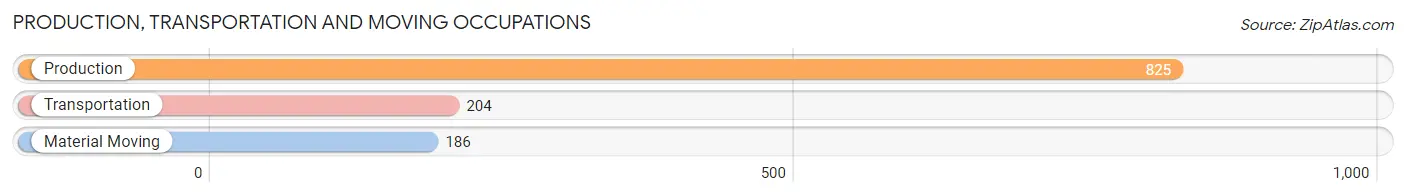
Production, Transportation and Moving Occupations
The most common Production, Transportation and Moving occupations in Jackson County are Production (825 | 19.1%), Transportation (204 | 4.7%), and Material Moving (186 | 4.3%).
Production, Transportation and Moving Occupations by Sex
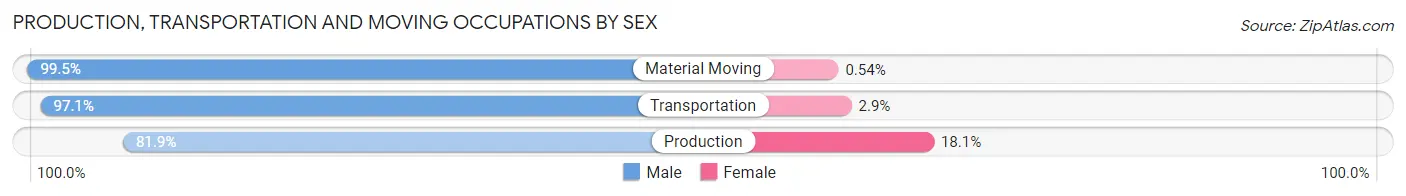
| Occupation | Male | Female |
| Production | 676 (81.9%) | 149 (18.1%) |
| Transportation | 198 (97.1%) | 6 (2.9%) |
| Material Moving | 185 (99.5%) | 1 (0.5%) |
| Total (Category) | 1,059 (87.2%) | 156 (12.8%) |
| Total (Overall) | 2,274 (52.6%) | 2,047 (47.4%) |
Employment Industries by Sex in Jackson County
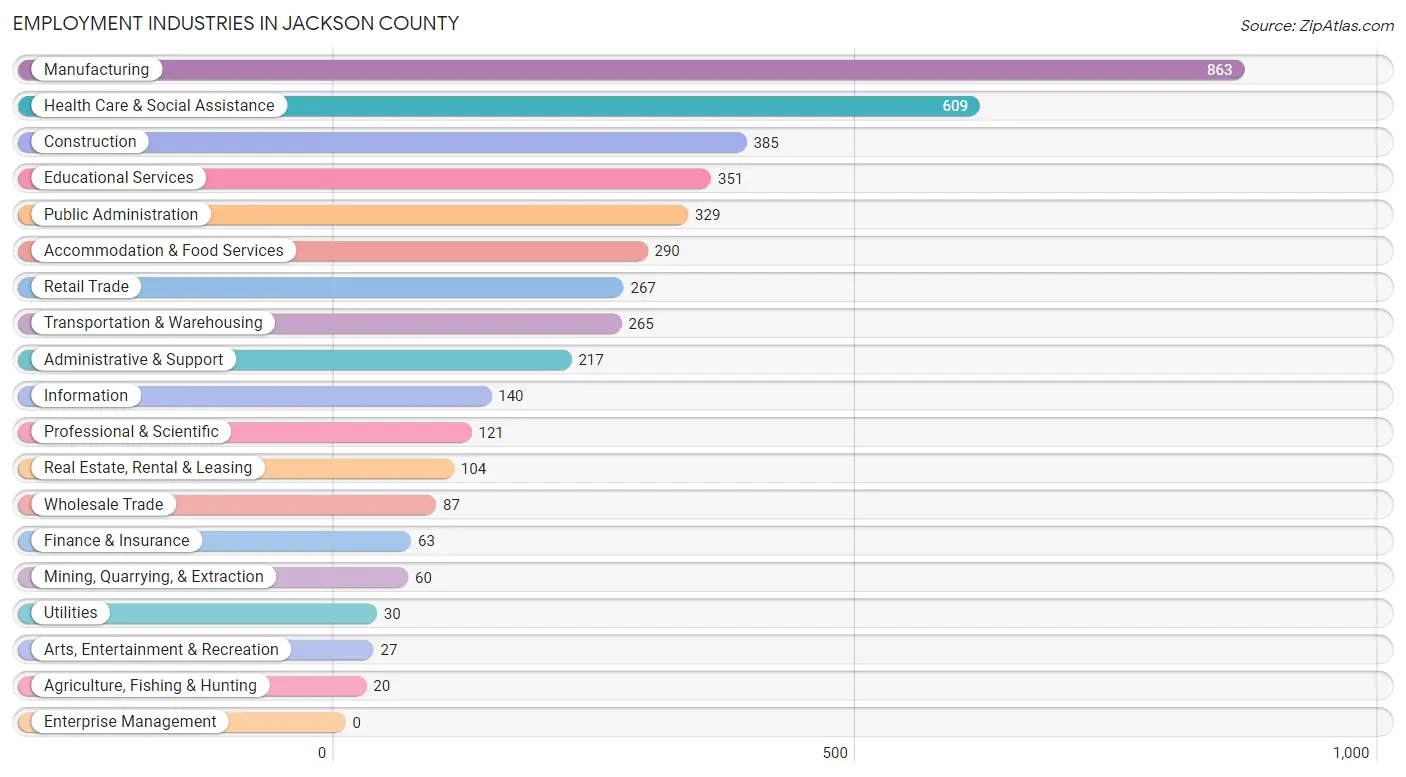
Employment Industries in Jackson County
The major employment industries in Jackson County include Manufacturing (863 | 20.0%), Health Care & Social Assistance (609 | 14.1%), Construction (385 | 8.9%), Educational Services (351 | 8.1%), and Public Administration (329 | 7.6%).
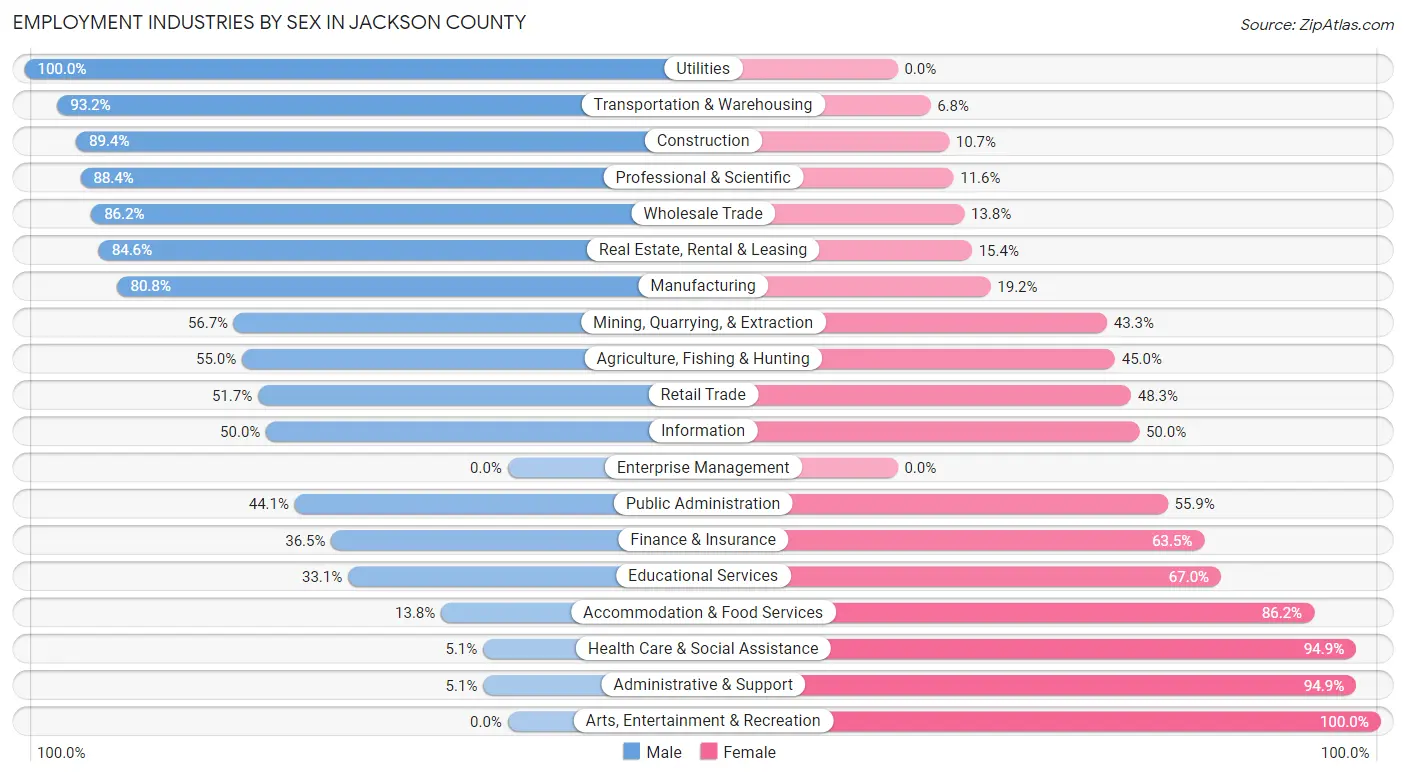
Employment Industries by Sex in Jackson County
The Jackson County industries that see more men than women are Utilities (100.0%), Transportation & Warehousing (93.2%), and Construction (89.3%), whereas the industries that tend to have a higher number of women are Arts, Entertainment & Recreation (100.0%), Administrative & Support (94.9%), and Health Care & Social Assistance (94.9%).
| Industry | Male | Female |
| Agriculture, Fishing & Hunting | 11 (55.0%) | 9 (45.0%) |
| Mining, Quarrying, & Extraction | 34 (56.7%) | 26 (43.3%) |
| Construction | 344 (89.3%) | 41 (10.6%) |
| Manufacturing | 697 (80.8%) | 166 (19.2%) |
| Wholesale Trade | 75 (86.2%) | 12 (13.8%) |
| Retail Trade | 138 (51.7%) | 129 (48.3%) |
| Transportation & Warehousing | 247 (93.2%) | 18 (6.8%) |
| Utilities | 30 (100.0%) | 0 (0.0%) |
| Information | 70 (50.0%) | 70 (50.0%) |
| Finance & Insurance | 23 (36.5%) | 40 (63.5%) |
| Real Estate, Rental & Leasing | 88 (84.6%) | 16 (15.4%) |
| Professional & Scientific | 107 (88.4%) | 14 (11.6%) |
| Enterprise Management | 0 (0.0%) | 0 (0.0%) |
| Administrative & Support | 11 (5.1%) | 206 (94.9%) |
| Educational Services | 116 (33.1%) | 235 (66.9%) |
| Health Care & Social Assistance | 31 (5.1%) | 578 (94.9%) |
| Arts, Entertainment & Recreation | 0 (0.0%) | 27 (100.0%) |
| Accommodation & Food Services | 40 (13.8%) | 250 (86.2%) |
| Public Administration | 145 (44.1%) | 184 (55.9%) |
| Total | 2,274 (52.6%) | 2,047 (47.4%) |
Education in Jackson County
School Enrollment in Jackson County
The most common levels of schooling among the 2,759 students in Jackson County are high school (863 | 31.3%), elementary school (656 | 23.8%), and middle school (574 | 20.8%).
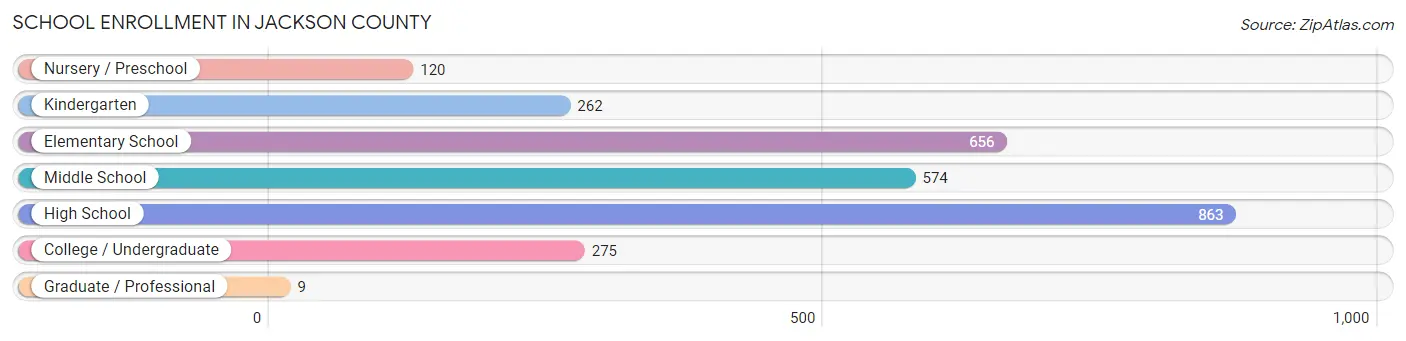
| School Level | # Students | % Students |
| Nursery / Preschool | 120 | 4.3% |
| Kindergarten | 262 | 9.5% |
| Elementary School | 656 | 23.8% |
| Middle School | 574 | 20.8% |
| High School | 863 | 31.3% |
| College / Undergraduate | 275 | 10.0% |
| Graduate / Professional | 9 | 0.3% |
| Total | 2,759 | 100.0% |
School Enrollment by Age by Funding Source in Jackson County
Out of a total of 2,759 students who are enrolled in schools in Jackson County, 248 (9.0%) attend a private institution, while the remaining 2,511 (91.0%) are enrolled in public schools. The age group of 3 to 4 year olds has the highest likelihood of being enrolled in private schools, with 37 (69.8% in the age bracket) enrolled. Conversely, the age group of 15 to 17 year olds has the lowest likelihood of being enrolled in a private school, with 491 (100.0% in the age bracket) attending a public institution.
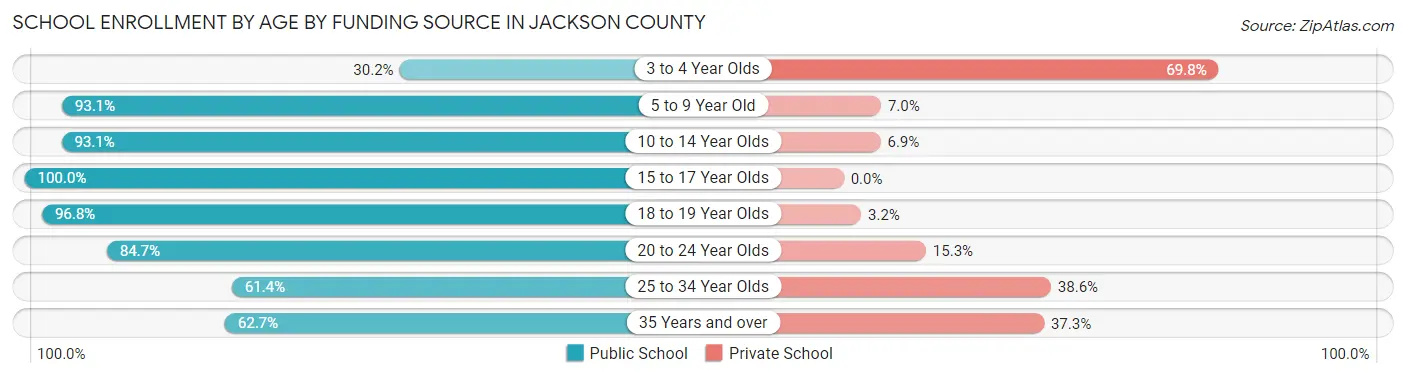
| Age Bracket | Public School | Private School |
| 3 to 4 Year Olds | 16 (30.2%) | 37 (69.8%) |
| 5 to 9 Year Old | 763 (93.0%) | 57 (7.0%) |
| 10 to 14 Year Olds | 759 (93.1%) | 56 (6.9%) |
| 15 to 17 Year Olds | 491 (100.0%) | 0 (0.0%) |
| 18 to 19 Year Olds | 269 (96.8%) | 9 (3.2%) |
| 20 to 24 Year Olds | 94 (84.7%) | 17 (15.3%) |
| 25 to 34 Year Olds | 35 (61.4%) | 22 (38.6%) |
| 35 Years and over | 84 (62.7%) | 50 (37.3%) |
| Total | 2,511 (91.0%) | 248 (9.0%) |
Educational Attainment by Field of Study in Jackson County
Education (239 | 21.3%), business (199 | 17.7%), science & technology (191 | 17.0%), arts & humanities (145 | 12.9%), and computers & mathematics (94 | 8.4%) are the most common fields of study among 1,124 individuals in Jackson County who have obtained a bachelor's degree or higher.
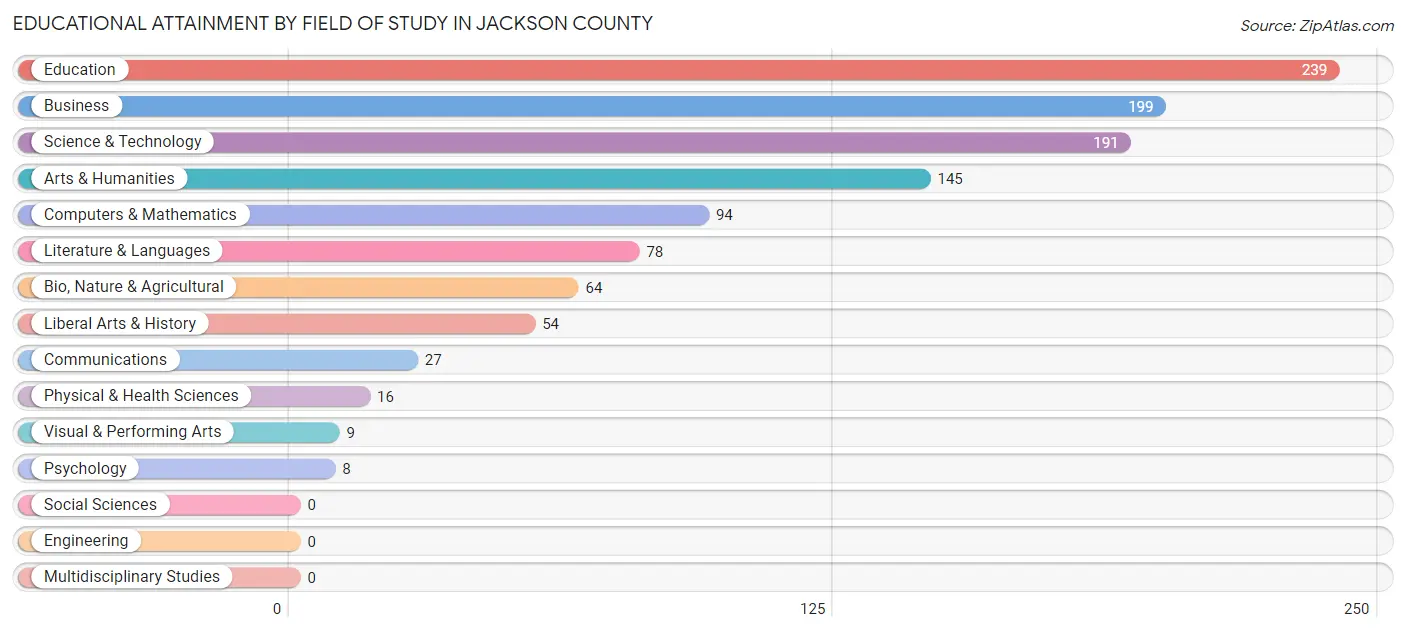
| Field of Study | # Graduates | % Graduates |
| Computers & Mathematics | 94 | 8.4% |
| Bio, Nature & Agricultural | 64 | 5.7% |
| Physical & Health Sciences | 16 | 1.4% |
| Psychology | 8 | 0.7% |
| Social Sciences | 0 | 0.0% |
| Engineering | 0 | 0.0% |
| Multidisciplinary Studies | 0 | 0.0% |
| Science & Technology | 191 | 17.0% |
| Business | 199 | 17.7% |
| Education | 239 | 21.3% |
| Literature & Languages | 78 | 6.9% |
| Liberal Arts & History | 54 | 4.8% |
| Visual & Performing Arts | 9 | 0.8% |
| Communications | 27 | 2.4% |
| Arts & Humanities | 145 | 12.9% |
| Total | 1,124 | 100.0% |
Transportation & Commute in Jackson County
Vehicle Availability by Sex in Jackson County
The most prevalent vehicle ownership categories in Jackson County are males with 2 vehicles (814, accounting for 35.8%) and females with 2 vehicles (594, making up 40.7%).
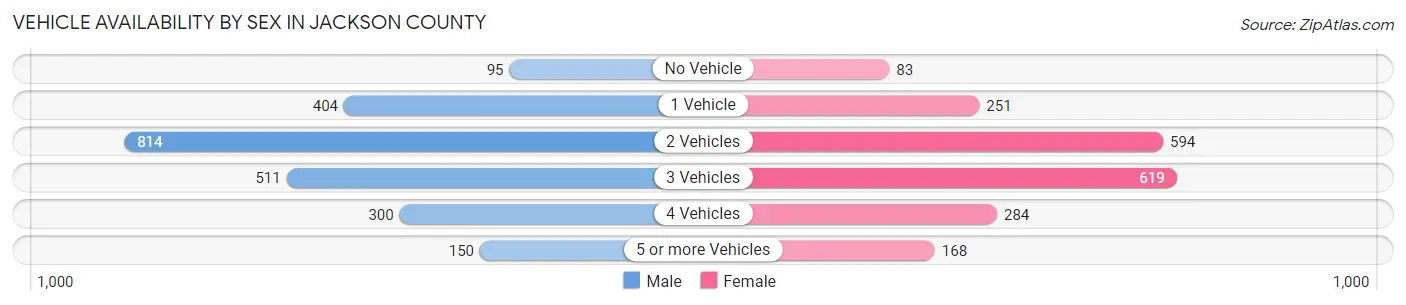
| Vehicles Available | Male | Female |
| No Vehicle | 95 (4.2%) | 83 (4.2%) |
| 1 Vehicle | 404 (17.8%) | 251 (12.6%) |
| 2 Vehicles | 814 (35.8%) | 594 (29.7%) |
| 3 Vehicles | 511 (22.5%) | 619 (31.0%) |
| 4 Vehicles | 300 (13.2%) | 284 (14.2%) |
| 5 or more Vehicles | 150 (6.6%) | 168 (8.4%) |
| Total | 2,274 (100.0%) | 1,999 (100.0%) |
Commute Time in Jackson County
The most frequently occuring commute durations in Jackson County are 30 to 34 minutes (728 commuters, 18.0%), 60 to 89 minutes (658 commuters, 16.3%), and 45 to 59 minutes (485 commuters, 12.0%).
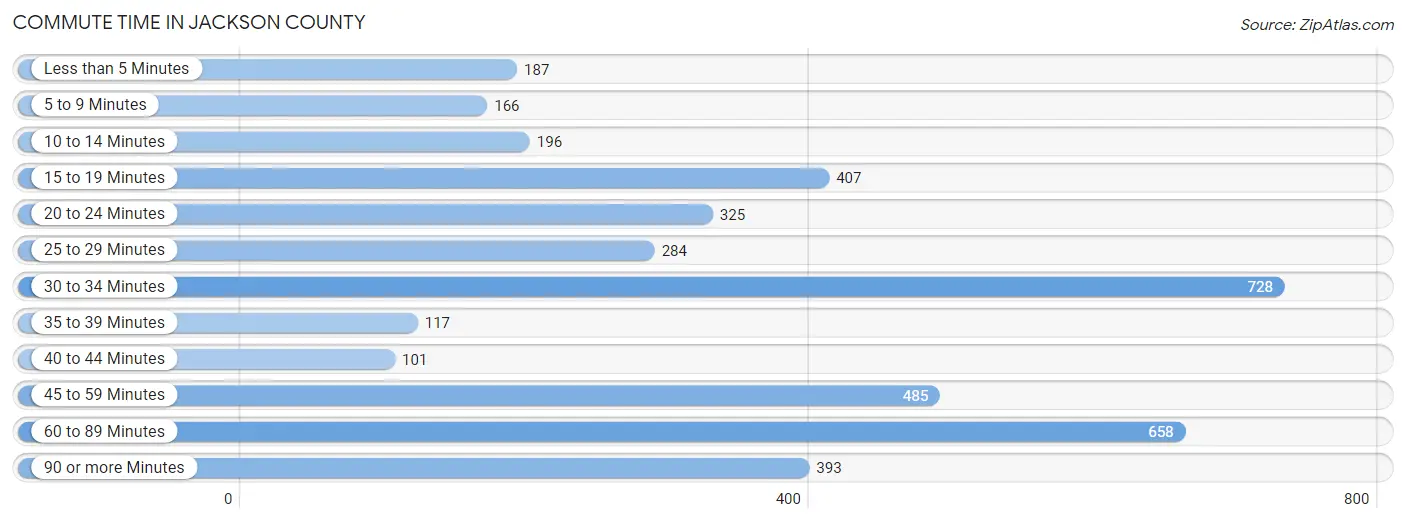
| Commute Time | # Commuters | % Commuters |
| Less than 5 Minutes | 187 | 4.6% |
| 5 to 9 Minutes | 166 | 4.1% |
| 10 to 14 Minutes | 196 | 4.8% |
| 15 to 19 Minutes | 407 | 10.1% |
| 20 to 24 Minutes | 325 | 8.0% |
| 25 to 29 Minutes | 284 | 7.0% |
| 30 to 34 Minutes | 728 | 18.0% |
| 35 to 39 Minutes | 117 | 2.9% |
| 40 to 44 Minutes | 101 | 2.5% |
| 45 to 59 Minutes | 485 | 12.0% |
| 60 to 89 Minutes | 658 | 16.3% |
| 90 or more Minutes | 393 | 9.7% |
Commute Time by Sex in Jackson County
The most common commute times in Jackson County are 45 to 59 minutes (355 commuters, 16.3%) for males and 30 to 34 minutes (388 commuters, 20.7%) for females.
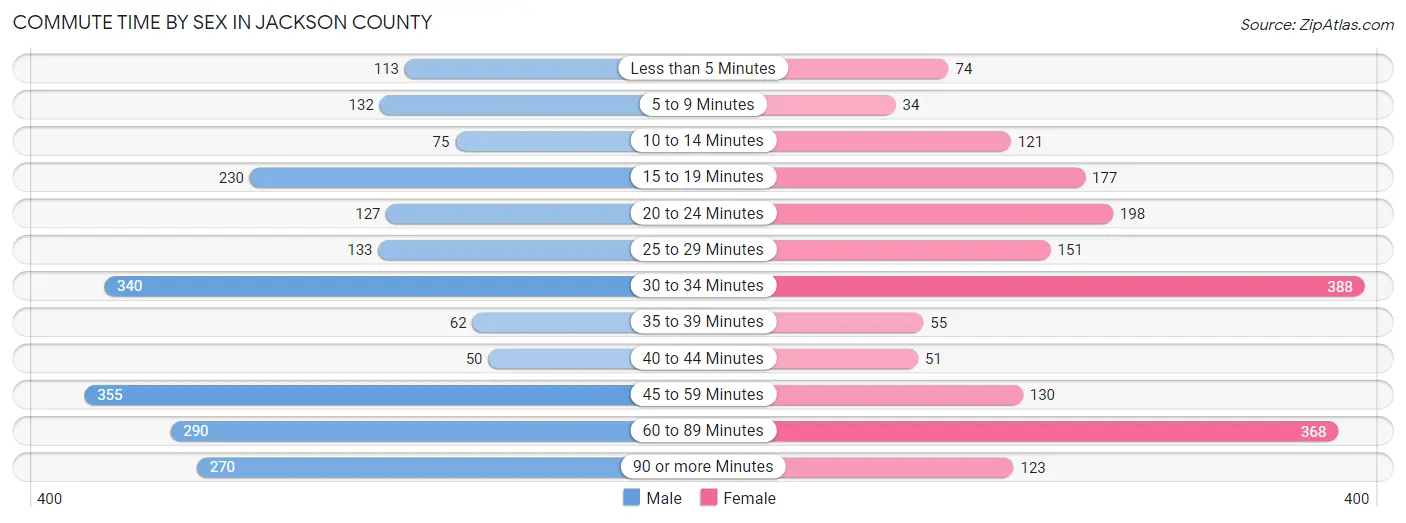
| Commute Time | Male | Female |
| Less than 5 Minutes | 113 (5.2%) | 74 (4.0%) |
| 5 to 9 Minutes | 132 (6.1%) | 34 (1.8%) |
| 10 to 14 Minutes | 75 (3.5%) | 121 (6.5%) |
| 15 to 19 Minutes | 230 (10.6%) | 177 (9.5%) |
| 20 to 24 Minutes | 127 (5.8%) | 198 (10.6%) |
| 25 to 29 Minutes | 133 (6.1%) | 151 (8.1%) |
| 30 to 34 Minutes | 340 (15.6%) | 388 (20.7%) |
| 35 to 39 Minutes | 62 (2.9%) | 55 (2.9%) |
| 40 to 44 Minutes | 50 (2.3%) | 51 (2.7%) |
| 45 to 59 Minutes | 355 (16.3%) | 130 (7.0%) |
| 60 to 89 Minutes | 290 (13.3%) | 368 (19.7%) |
| 90 or more Minutes | 270 (12.4%) | 123 (6.6%) |
Time of Departure to Work by Sex in Jackson County
The most frequent times of departure to work in Jackson County are 4:00 PM to 11:59 PM (323, 14.8%) for males and 6:30 AM to 6:59 AM (424, 22.7%) for females.
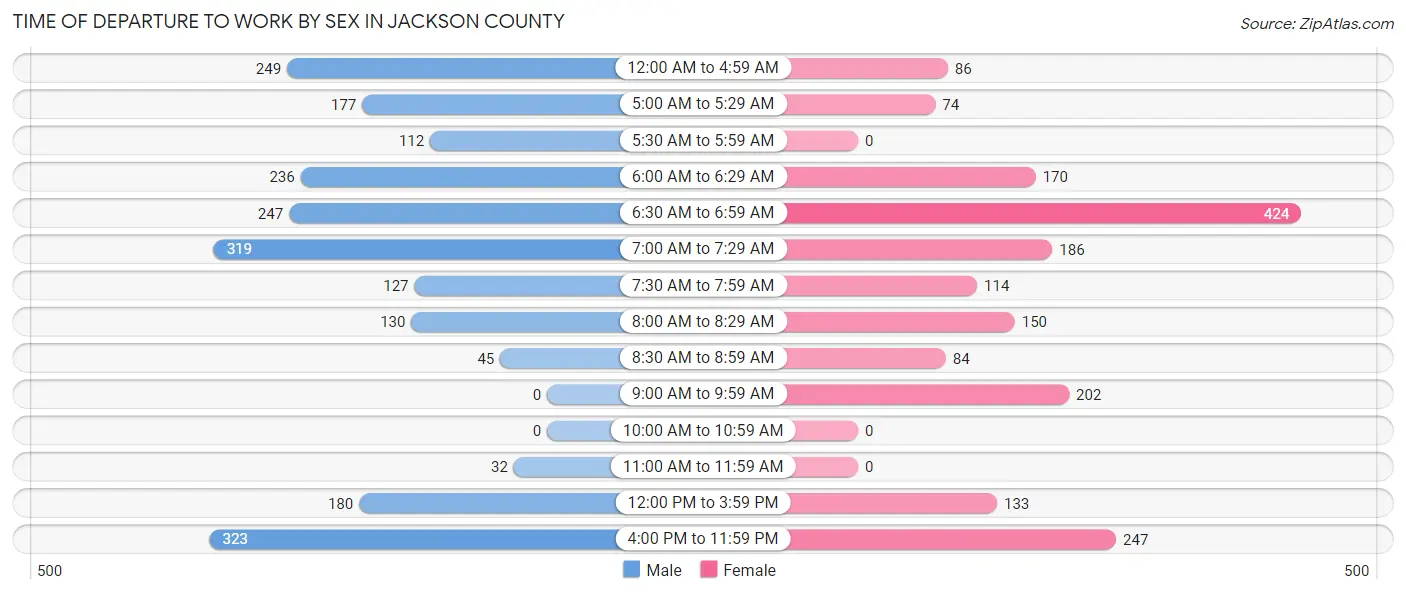
| Time of Departure | Male | Female |
| 12:00 AM to 4:59 AM | 249 (11.4%) | 86 (4.6%) |
| 5:00 AM to 5:29 AM | 177 (8.1%) | 74 (4.0%) |
| 5:30 AM to 5:59 AM | 112 (5.1%) | 0 (0.0%) |
| 6:00 AM to 6:29 AM | 236 (10.8%) | 170 (9.1%) |
| 6:30 AM to 6:59 AM | 247 (11.4%) | 424 (22.7%) |
| 7:00 AM to 7:29 AM | 319 (14.6%) | 186 (10.0%) |
| 7:30 AM to 7:59 AM | 127 (5.8%) | 114 (6.1%) |
| 8:00 AM to 8:29 AM | 130 (6.0%) | 150 (8.0%) |
| 8:30 AM to 8:59 AM | 45 (2.1%) | 84 (4.5%) |
| 9:00 AM to 9:59 AM | 0 (0.0%) | 202 (10.8%) |
| 10:00 AM to 10:59 AM | 0 (0.0%) | 0 (0.0%) |
| 11:00 AM to 11:59 AM | 32 (1.5%) | 0 (0.0%) |
| 12:00 PM to 3:59 PM | 180 (8.3%) | 133 (7.1%) |
| 4:00 PM to 11:59 PM | 323 (14.8%) | 247 (13.2%) |
| Total | 2,177 (100.0%) | 1,870 (100.0%) |
Housing Occupancy in Jackson County
Occupancy by Ownership in Jackson County
Of the total 5,154 dwellings in Jackson County, owner-occupied units account for 4,075 (79.1%), while renter-occupied units make up 1,079 (20.9%).
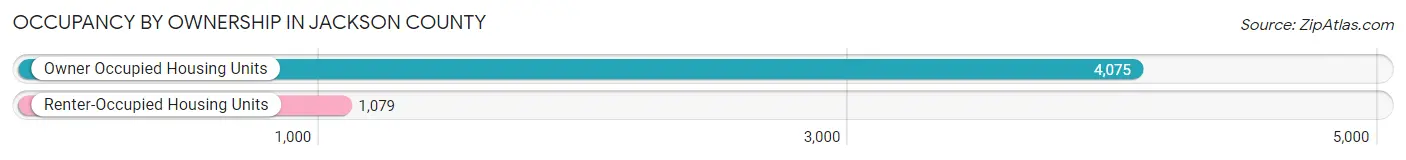
| Occupancy | # Housing Units | % Housing Units |
| Owner Occupied Housing Units | 4,075 | 79.1% |
| Renter-Occupied Housing Units | 1,079 | 20.9% |
| Total Occupied Housing Units | 5,154 | 100.0% |
Occupancy by Household Size in Jackson County
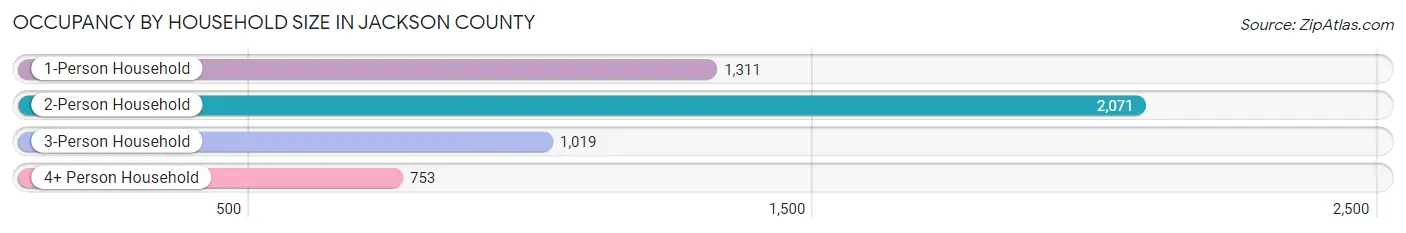
| Household Size | # Housing Units | % Housing Units |
| 1-Person Household | 1,311 | 25.4% |
| 2-Person Household | 2,071 | 40.2% |
| 3-Person Household | 1,019 | 19.8% |
| 4+ Person Household | 753 | 14.6% |
| Total Housing Units | 5,154 | 100.0% |
Occupancy by Ownership by Household Size in Jackson County
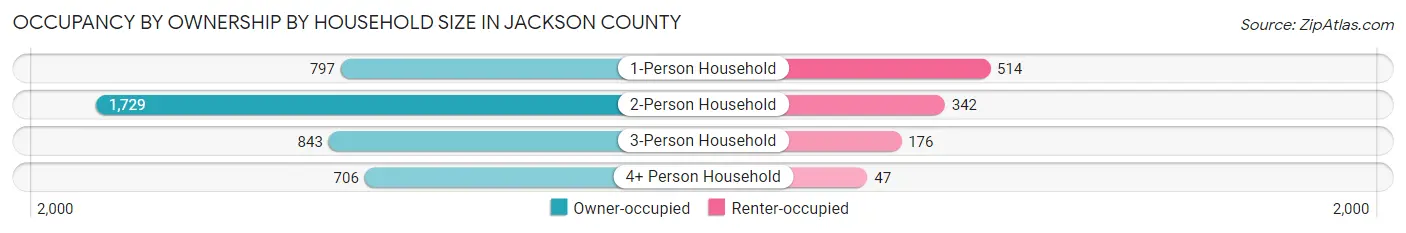
| Household Size | Owner-occupied | Renter-occupied |
| 1-Person Household | 797 (60.8%) | 514 (39.2%) |
| 2-Person Household | 1,729 (83.5%) | 342 (16.5%) |
| 3-Person Household | 843 (82.7%) | 176 (17.3%) |
| 4+ Person Household | 706 (93.8%) | 47 (6.2%) |
| Total Housing Units | 4,075 (79.1%) | 1,079 (20.9%) |
Occupancy by Educational Attainment in Jackson County
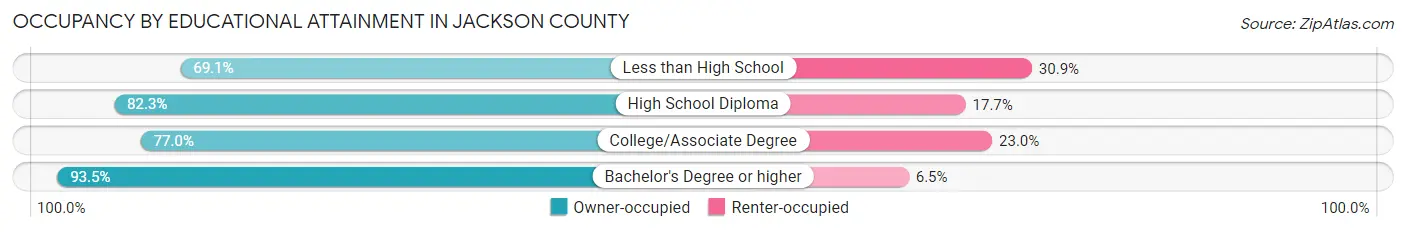
| Household Size | Owner-occupied | Renter-occupied |
| Less than High School | 931 (69.1%) | 416 (30.9%) |
| High School Diploma | 1,680 (82.3%) | 362 (17.7%) |
| College/Associate Degree | 871 (77.0%) | 260 (23.0%) |
| Bachelor's Degree or higher | 593 (93.5%) | 41 (6.5%) |
Occupancy by Age of Householder in Jackson County
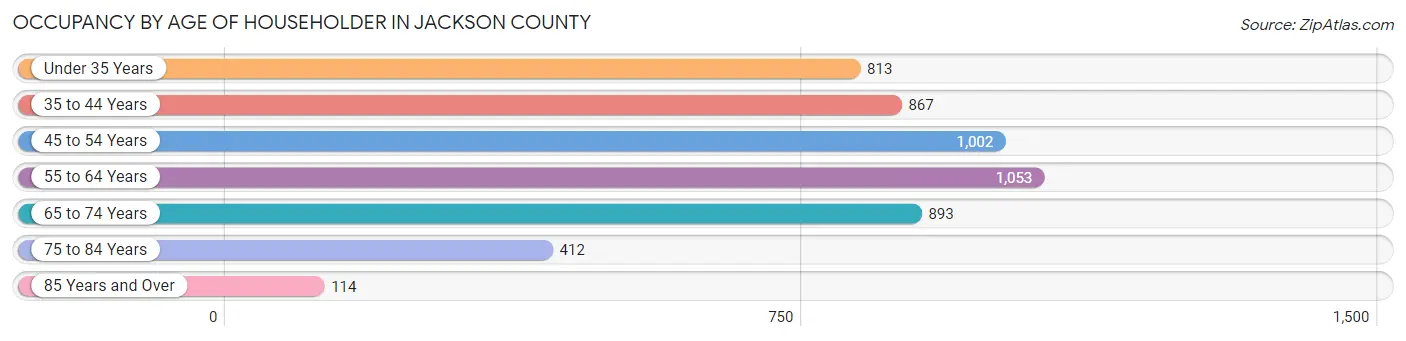
| Age Bracket | # Households | % Households |
| Under 35 Years | 813 | 15.8% |
| 35 to 44 Years | 867 | 16.8% |
| 45 to 54 Years | 1,002 | 19.4% |
| 55 to 64 Years | 1,053 | 20.4% |
| 65 to 74 Years | 893 | 17.3% |
| 75 to 84 Years | 412 | 8.0% |
| 85 Years and Over | 114 | 2.2% |
| Total | 5,154 | 100.0% |
Housing Finances in Jackson County
Median Income by Occupancy in Jackson County
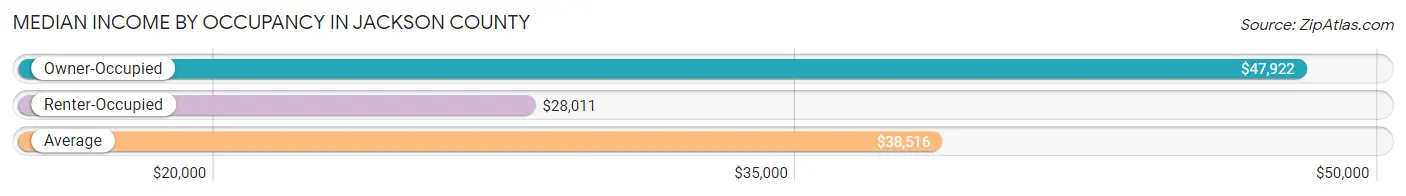
| Occupancy Type | # Households | Median Income |
| Owner-Occupied | 4,075 (79.1%) | $47,922 |
| Renter-Occupied | 1,079 (20.9%) | $28,011 |
| Average | 5,154 (100.0%) | $38,516 |
Occupancy by Householder Income Bracket in Jackson County
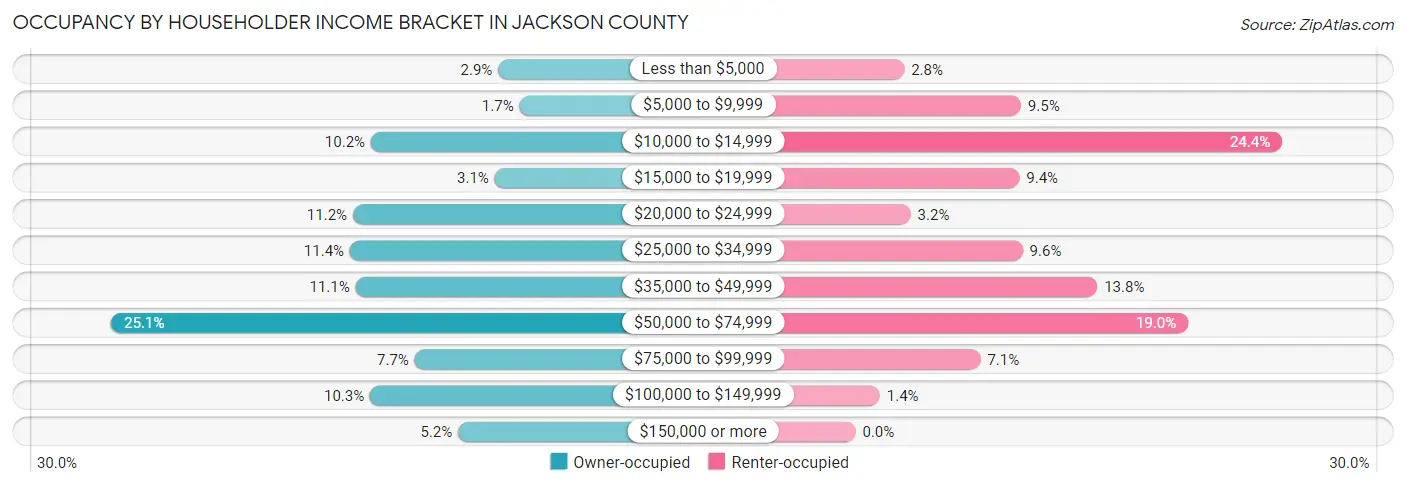
| Income Bracket | Owner-occupied | Renter-occupied |
| Less than $5,000 | 120 (2.9%) | 30 (2.8%) |
| $5,000 to $9,999 | 70 (1.7%) | 102 (9.5%) |
| $10,000 to $14,999 | 416 (10.2%) | 263 (24.4%) |
| $15,000 to $19,999 | 128 (3.1%) | 101 (9.4%) |
| $20,000 to $24,999 | 458 (11.2%) | 34 (3.2%) |
| $25,000 to $34,999 | 465 (11.4%) | 103 (9.6%) |
| $35,000 to $49,999 | 452 (11.1%) | 149 (13.8%) |
| $50,000 to $74,999 | 1,021 (25.1%) | 205 (19.0%) |
| $75,000 to $99,999 | 314 (7.7%) | 77 (7.1%) |
| $100,000 to $149,999 | 418 (10.3%) | 15 (1.4%) |
| $150,000 or more | 213 (5.2%) | 0 (0.0%) |
| Total | 4,075 (100.0%) | 1,079 (100.0%) |
Monthly Housing Cost Tiers in Jackson County
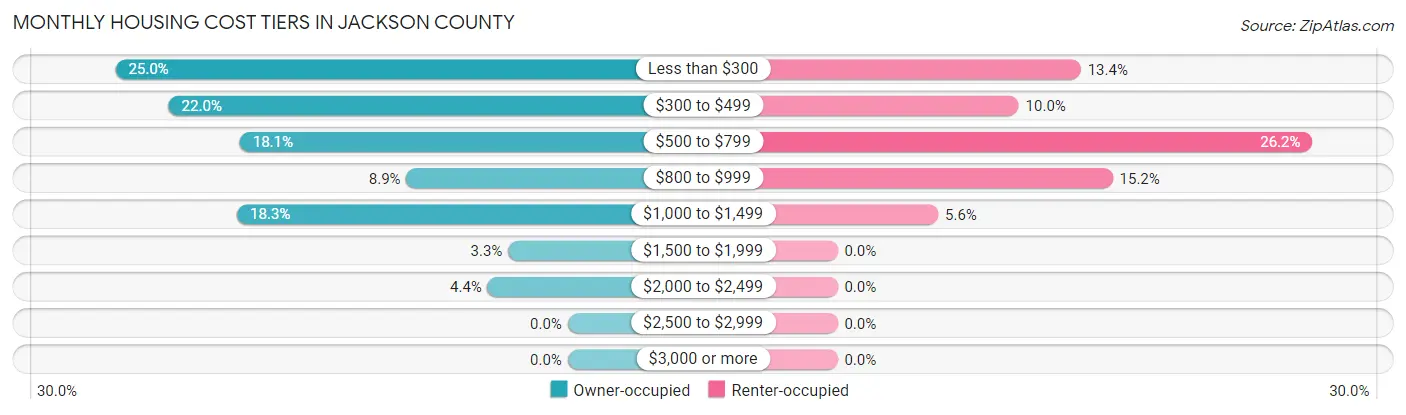
| Monthly Cost | Owner-occupied | Renter-occupied |
| Less than $300 | 1,018 (25.0%) | 145 (13.4%) |
| $300 to $499 | 898 (22.0%) | 108 (10.0%) |
| $500 to $799 | 738 (18.1%) | 283 (26.2%) |
| $800 to $999 | 363 (8.9%) | 164 (15.2%) |
| $1,000 to $1,499 | 744 (18.3%) | 60 (5.6%) |
| $1,500 to $1,999 | 134 (3.3%) | 0 (0.0%) |
| $2,000 to $2,499 | 180 (4.4%) | 0 (0.0%) |
| $2,500 to $2,999 | 0 (0.0%) | 0 (0.0%) |
| $3,000 or more | 0 (0.0%) | 0 (0.0%) |
| Total | 4,075 (100.0%) | 1,079 (100.0%) |
Physical Housing Characteristics in Jackson County
Housing Structures in Jackson County
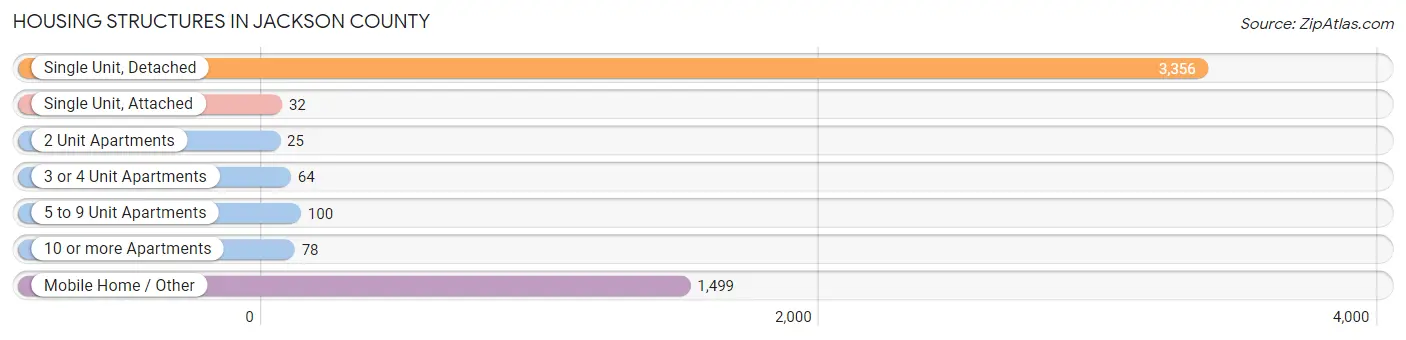
| Structure Type | # Housing Units | % Housing Units |
| Single Unit, Detached | 3,356 | 65.1% |
| Single Unit, Attached | 32 | 0.6% |
| 2 Unit Apartments | 25 | 0.5% |
| 3 or 4 Unit Apartments | 64 | 1.2% |
| 5 to 9 Unit Apartments | 100 | 1.9% |
| 10 or more Apartments | 78 | 1.5% |
| Mobile Home / Other | 1,499 | 29.1% |
| Total | 5,154 | 100.0% |
Housing Structures by Occupancy in Jackson County
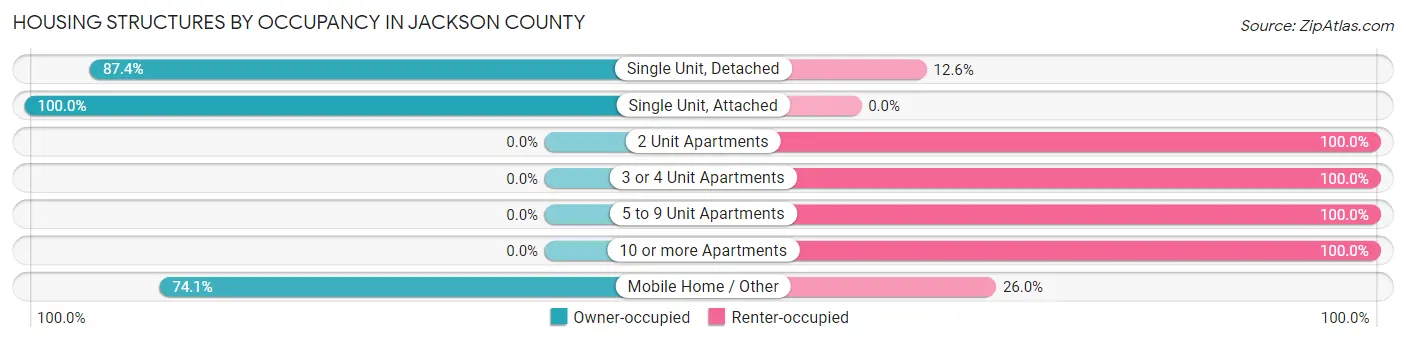
| Structure Type | Owner-occupied | Renter-occupied |
| Single Unit, Detached | 2,933 (87.4%) | 423 (12.6%) |
| Single Unit, Attached | 32 (100.0%) | 0 (0.0%) |
| 2 Unit Apartments | 0 (0.0%) | 25 (100.0%) |
| 3 or 4 Unit Apartments | 0 (0.0%) | 64 (100.0%) |
| 5 to 9 Unit Apartments | 0 (0.0%) | 100 (100.0%) |
| 10 or more Apartments | 0 (0.0%) | 78 (100.0%) |
| Mobile Home / Other | 1,110 (74.1%) | 389 (26.0%) |
| Total | 4,075 (79.1%) | 1,079 (20.9%) |
Housing Structures by Number of Rooms in Jackson County
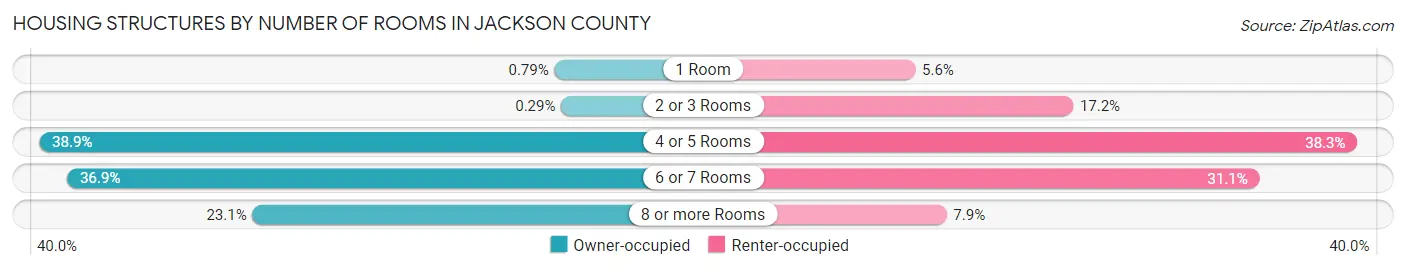
| Number of Rooms | Owner-occupied | Renter-occupied |
| 1 Room | 32 (0.8%) | 60 (5.6%) |
| 2 or 3 Rooms | 12 (0.3%) | 186 (17.2%) |
| 4 or 5 Rooms | 1,586 (38.9%) | 413 (38.3%) |
| 6 or 7 Rooms | 1,502 (36.9%) | 335 (31.0%) |
| 8 or more Rooms | 943 (23.1%) | 85 (7.9%) |
| Total | 4,075 (100.0%) | 1,079 (100.0%) |
Housing Structure by Heating Type in Jackson County
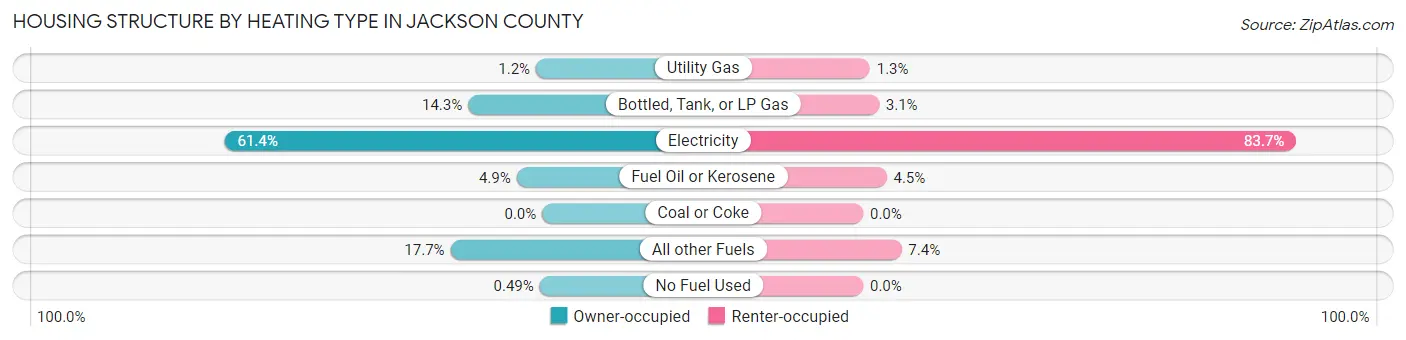
| Heating Type | Owner-occupied | Renter-occupied |
| Utility Gas | 49 (1.2%) | 14 (1.3%) |
| Bottled, Tank, or LP Gas | 583 (14.3%) | 33 (3.1%) |
| Electricity | 2,500 (61.4%) | 903 (83.7%) |
| Fuel Oil or Kerosene | 201 (4.9%) | 49 (4.5%) |
| Coal or Coke | 0 (0.0%) | 0 (0.0%) |
| All other Fuels | 722 (17.7%) | 80 (7.4%) |
| No Fuel Used | 20 (0.5%) | 0 (0.0%) |
| Total | 4,075 (100.0%) | 1,079 (100.0%) |
Household Vehicle Usage in Jackson County
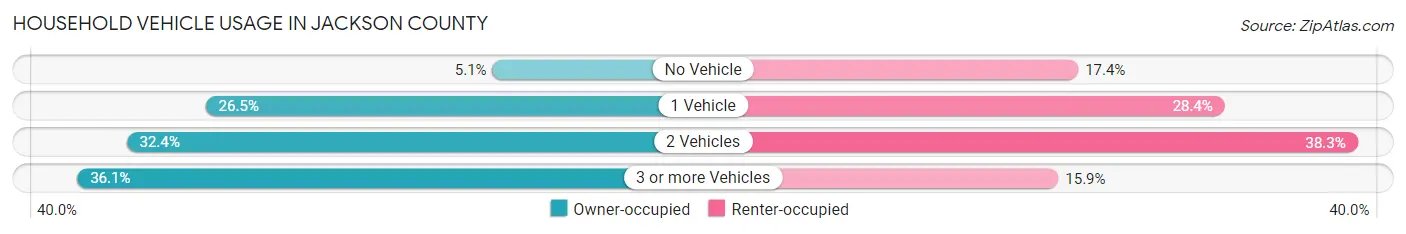
| Vehicles per Household | Owner-occupied | Renter-occupied |
| No Vehicle | 206 (5.1%) | 188 (17.4%) |
| 1 Vehicle | 1,079 (26.5%) | 306 (28.4%) |
| 2 Vehicles | 1,320 (32.4%) | 413 (38.3%) |
| 3 or more Vehicles | 1,470 (36.1%) | 172 (15.9%) |
| Total | 4,075 (100.0%) | 1,079 (100.0%) |
Real Estate & Mortgages in Jackson County
Real Estate and Mortgage Overview in Jackson County
| Characteristic | Without Mortgage | With Mortgage |
| Housing Units | 2,076 | 1,999 |
| Median Property Value | $85,200 | $116,800 |
| Median Household Income | $33,627 | $151 |
| Monthly Housing Costs | $308 | $0 |
| Real Estate Taxes | $503 | $315 |
Property Value by Mortgage Status in Jackson County
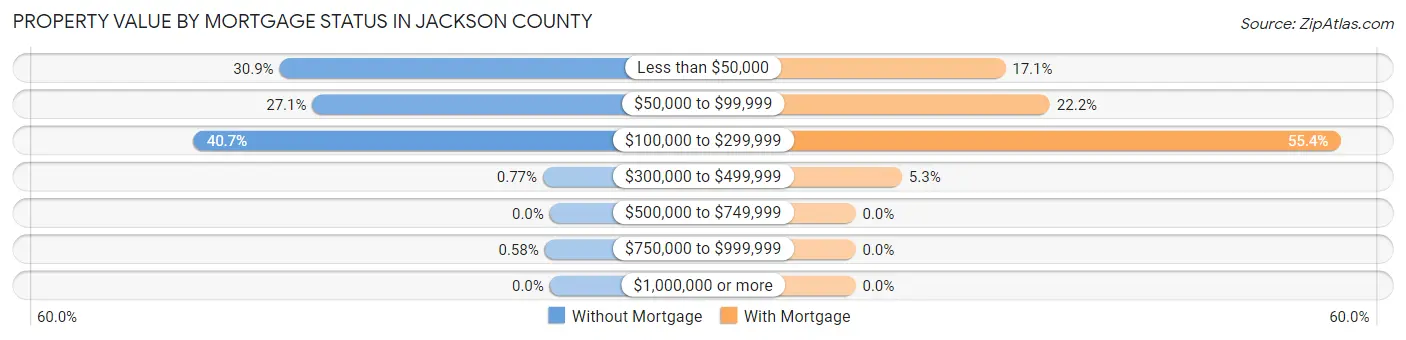
| Property Value | Without Mortgage | With Mortgage |
| Less than $50,000 | 641 (30.9%) | 342 (17.1%) |
| $50,000 to $99,999 | 563 (27.1%) | 444 (22.2%) |
| $100,000 to $299,999 | 844 (40.7%) | 1,107 (55.4%) |
| $300,000 to $499,999 | 16 (0.8%) | 106 (5.3%) |
| $500,000 to $749,999 | 0 (0.0%) | 0 (0.0%) |
| $750,000 to $999,999 | 12 (0.6%) | 0 (0.0%) |
| $1,000,000 or more | 0 (0.0%) | 0 (0.0%) |
| Total | 2,076 (100.0%) | 1,999 (100.0%) |
Household Income by Mortgage Status in Jackson County
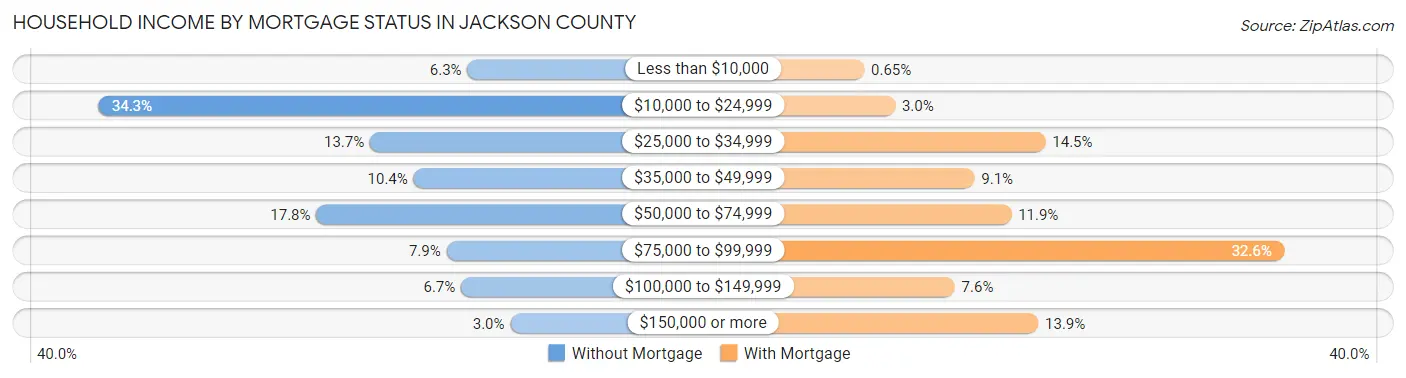
| Household Income | Without Mortgage | With Mortgage |
| Less than $10,000 | 130 (6.3%) | 13 (0.6%) |
| $10,000 to $24,999 | 713 (34.3%) | 60 (3.0%) |
| $25,000 to $34,999 | 284 (13.7%) | 289 (14.5%) |
| $35,000 to $49,999 | 215 (10.4%) | 181 (9.0%) |
| $50,000 to $74,999 | 369 (17.8%) | 237 (11.9%) |
| $75,000 to $99,999 | 163 (7.9%) | 652 (32.6%) |
| $100,000 to $149,999 | 140 (6.7%) | 151 (7.5%) |
| $150,000 or more | 62 (3.0%) | 278 (13.9%) |
| Total | 2,076 (100.0%) | 1,999 (100.0%) |
Property Value to Household Income Ratio in Jackson County
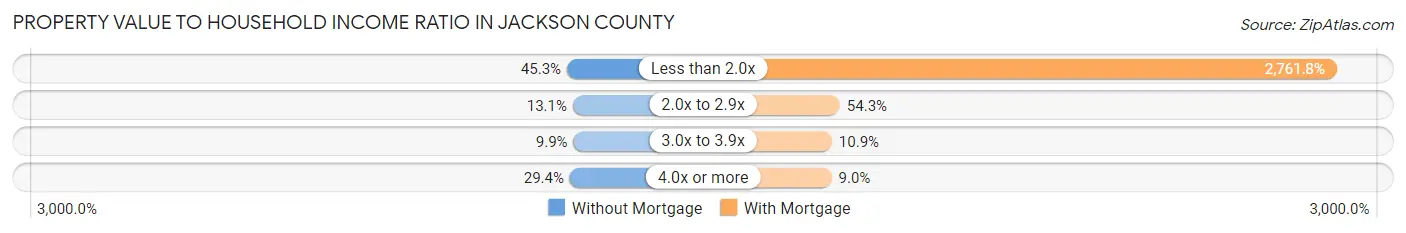
| Value-to-Income Ratio | Without Mortgage | With Mortgage |
| Less than 2.0x | 940 (45.3%) | 55,208 (2,761.8%) |
| 2.0x to 2.9x | 272 (13.1%) | 1,085 (54.3%) |
| 3.0x to 3.9x | 206 (9.9%) | 217 (10.9%) |
| 4.0x or more | 610 (29.4%) | 180 (9.0%) |
| Total | 2,076 (100.0%) | 1,999 (100.0%) |
Real Estate Taxes by Mortgage Status in Jackson County
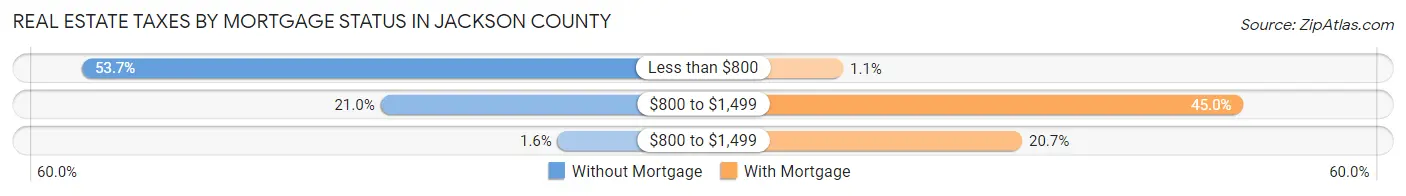
| Property Taxes | Without Mortgage | With Mortgage |
| Less than $800 | 1,115 (53.7%) | 22 (1.1%) |
| $800 to $1,499 | 436 (21.0%) | 899 (45.0%) |
| $800 to $1,499 | 33 (1.6%) | 414 (20.7%) |
| Total | 2,076 (100.0%) | 1,999 (100.0%) |
Health & Disability in Jackson County
Health Insurance Coverage by Age in Jackson County
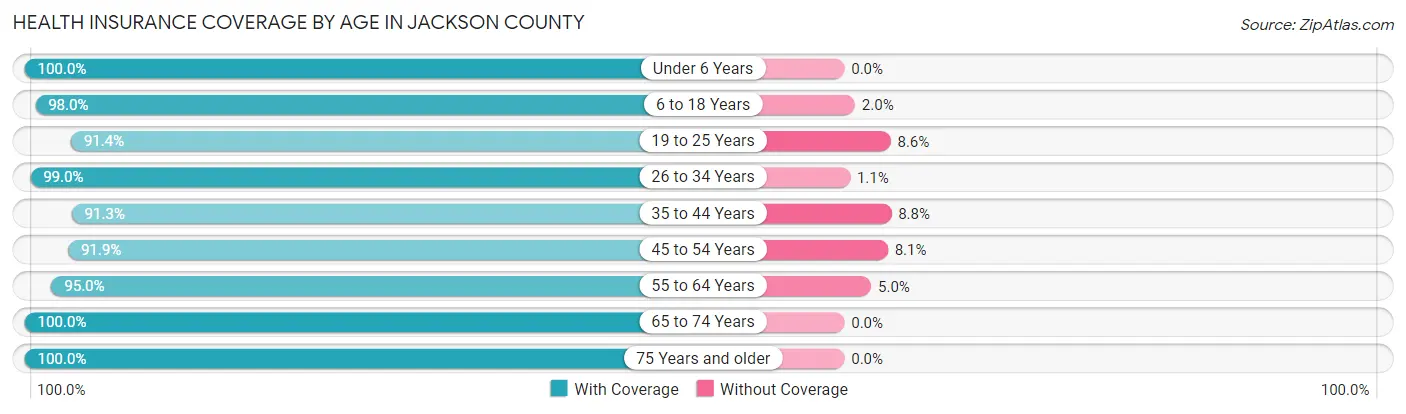
| Age Bracket | With Coverage | Without Coverage |
| Under 6 Years | 1,020 (100.0%) | 0 (0.0%) |
| 6 to 18 Years | 2,179 (98.0%) | 44 (2.0%) |
| 19 to 25 Years | 774 (91.4%) | 73 (8.6%) |
| 26 to 34 Years | 1,228 (99.0%) | 13 (1.1%) |
| 35 to 44 Years | 1,533 (91.2%) | 147 (8.7%) |
| 45 to 54 Years | 1,600 (91.9%) | 141 (8.1%) |
| 55 to 64 Years | 1,767 (95.0%) | 93 (5.0%) |
| 65 to 74 Years | 1,467 (100.0%) | 0 (0.0%) |
| 75 Years and older | 812 (100.0%) | 0 (0.0%) |
| Total | 12,380 (96.0%) | 511 (4.0%) |
Health Insurance Coverage by Citizenship Status in Jackson County
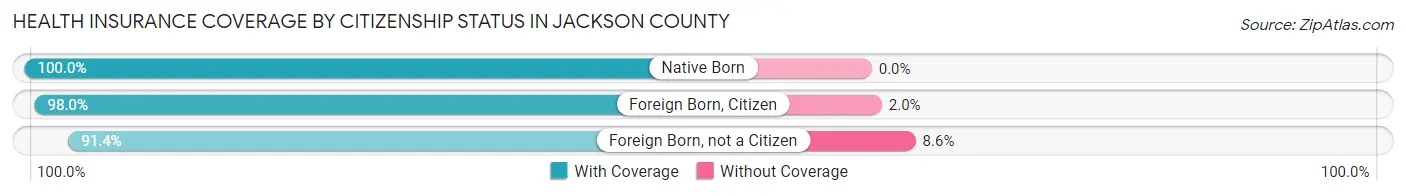
| Citizenship Status | With Coverage | Without Coverage |
| Native Born | 1,020 (100.0%) | 0 (0.0%) |
| Foreign Born, Citizen | 2,179 (98.0%) | 44 (2.0%) |
| Foreign Born, not a Citizen | 774 (91.4%) | 73 (8.6%) |
Health Insurance Coverage by Household Income in Jackson County
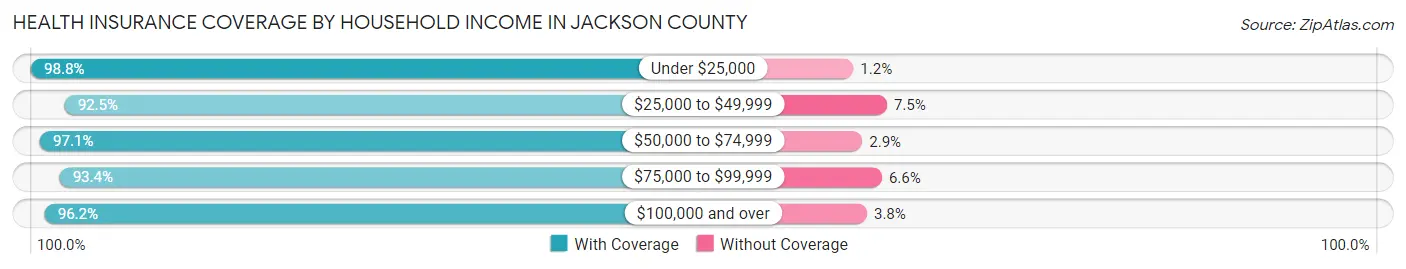
| Household Income | With Coverage | Without Coverage |
| Under $25,000 | 3,116 (98.8%) | 39 (1.2%) |
| $25,000 to $49,999 | 2,546 (92.5%) | 207 (7.5%) |
| $50,000 to $74,999 | 3,390 (97.1%) | 102 (2.9%) |
| $75,000 to $99,999 | 1,049 (93.4%) | 74 (6.6%) |
| $100,000 and over | 2,259 (96.2%) | 89 (3.8%) |
Public vs Private Health Insurance Coverage by Age in Jackson County
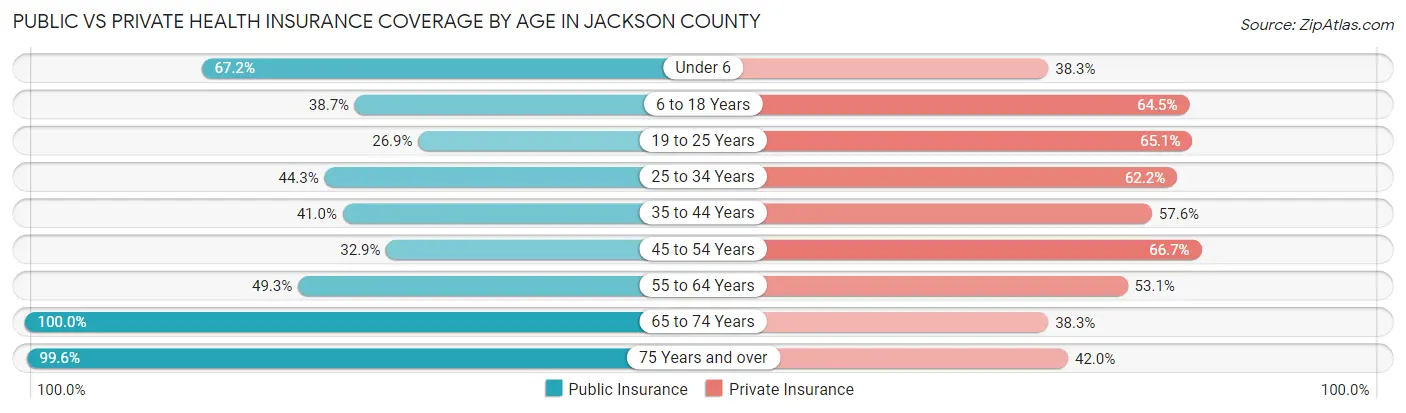
| Age Bracket | Public Insurance | Private Insurance |
| Under 6 | 685 (67.2%) | 391 (38.3%) |
| 6 to 18 Years | 860 (38.7%) | 1,434 (64.5%) |
| 19 to 25 Years | 228 (26.9%) | 551 (65.0%) |
| 25 to 34 Years | 550 (44.3%) | 772 (62.2%) |
| 35 to 44 Years | 688 (40.9%) | 967 (57.6%) |
| 45 to 54 Years | 572 (32.9%) | 1,162 (66.7%) |
| 55 to 64 Years | 916 (49.2%) | 987 (53.1%) |
| 65 to 74 Years | 1,467 (100.0%) | 562 (38.3%) |
| 75 Years and over | 809 (99.6%) | 341 (42.0%) |
| Total | 6,775 (52.6%) | 7,167 (55.6%) |
Disability Status by Sex by Age in Jackson County
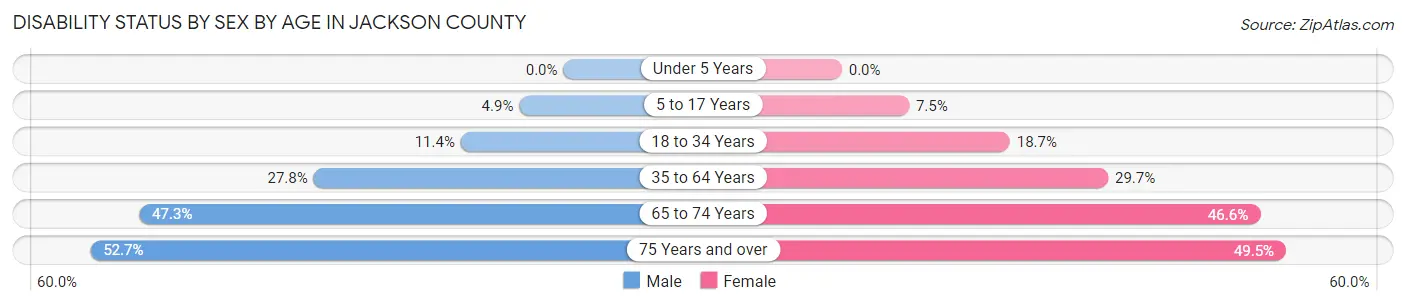
| Age Bracket | Male | Female |
| Under 5 Years | 0 (0.0%) | 0 (0.0%) |
| 5 to 17 Years | 57 (4.9%) | 77 (7.5%) |
| 18 to 34 Years | 137 (11.4%) | 215 (18.7%) |
| 35 to 64 Years | 727 (27.8%) | 791 (29.6%) |
| 65 to 74 Years | 328 (47.3%) | 360 (46.6%) |
| 75 Years and over | 186 (52.7%) | 227 (49.5%) |
Disability Class by Sex by Age in Jackson County
Disability Class: Hearing Difficulty
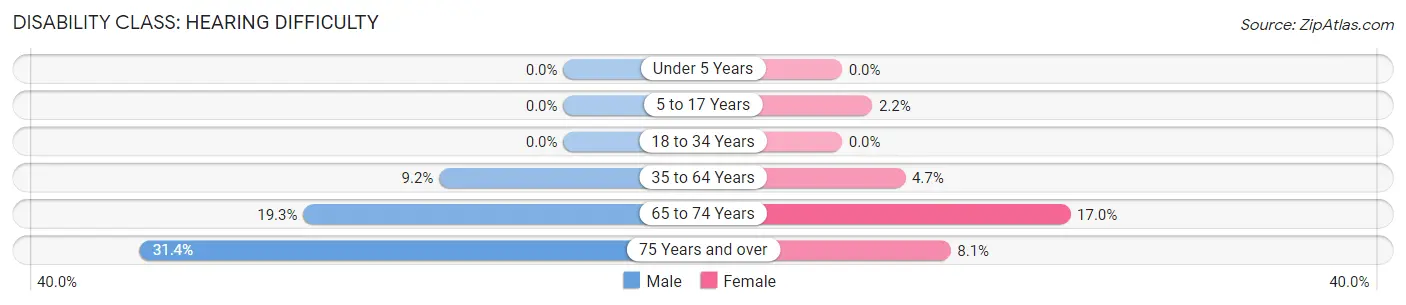
| Age Bracket | Male | Female |
| Under 5 Years | 0 (0.0%) | 0 (0.0%) |
| 5 to 17 Years | 0 (0.0%) | 23 (2.2%) |
| 18 to 34 Years | 0 (0.0%) | 0 (0.0%) |
| 35 to 64 Years | 241 (9.2%) | 125 (4.7%) |
| 65 to 74 Years | 134 (19.3%) | 131 (17.0%) |
| 75 Years and over | 111 (31.4%) | 37 (8.1%) |
Disability Class: Vision Difficulty
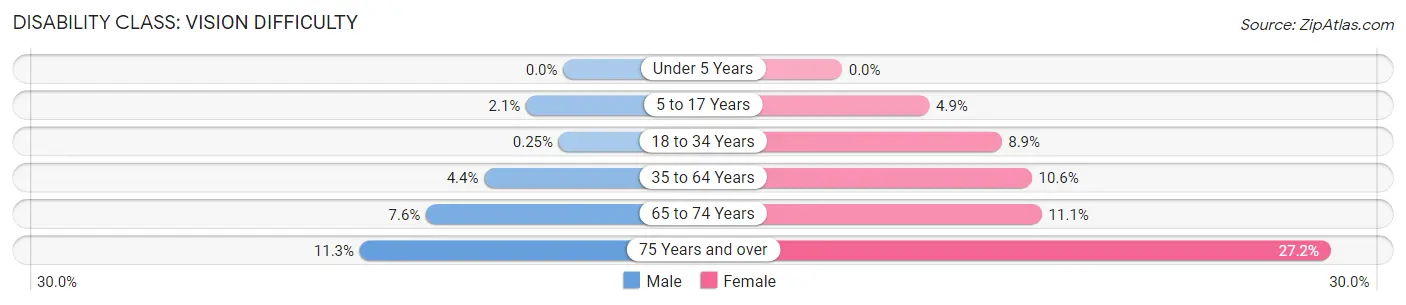
| Age Bracket | Male | Female |
| Under 5 Years | 0 (0.0%) | 0 (0.0%) |
| 5 to 17 Years | 24 (2.1%) | 50 (4.9%) |
| 18 to 34 Years | 3 (0.3%) | 102 (8.9%) |
| 35 to 64 Years | 115 (4.4%) | 282 (10.6%) |
| 65 to 74 Years | 53 (7.6%) | 86 (11.1%) |
| 75 Years and over | 40 (11.3%) | 125 (27.2%) |
Disability Class: Cognitive Difficulty
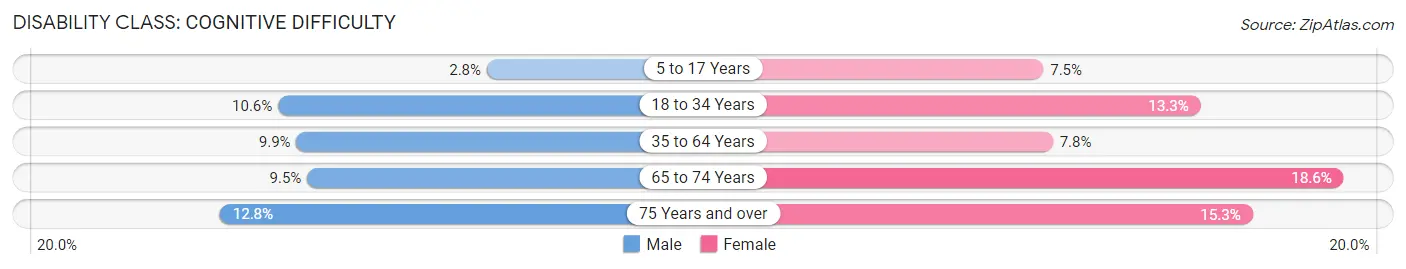
| Age Bracket | Male | Female |
| 5 to 17 Years | 33 (2.8%) | 77 (7.5%) |
| 18 to 34 Years | 127 (10.6%) | 153 (13.3%) |
| 35 to 64 Years | 259 (9.9%) | 209 (7.8%) |
| 65 to 74 Years | 66 (9.5%) | 144 (18.6%) |
| 75 Years and over | 45 (12.8%) | 70 (15.2%) |
Disability Class: Ambulatory Difficulty
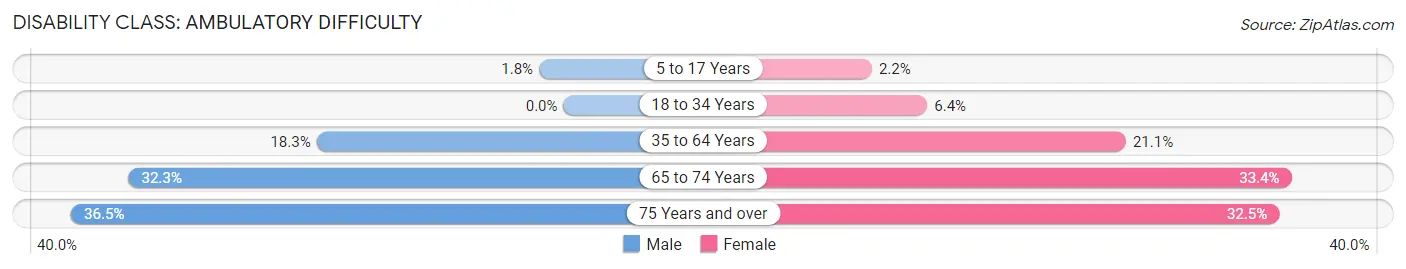
| Age Bracket | Male | Female |
| 5 to 17 Years | 21 (1.8%) | 23 (2.2%) |
| 18 to 34 Years | 0 (0.0%) | 73 (6.4%) |
| 35 to 64 Years | 479 (18.3%) | 563 (21.1%) |
| 65 to 74 Years | 224 (32.3%) | 258 (33.4%) |
| 75 Years and over | 129 (36.5%) | 149 (32.5%) |
Disability Class: Self-Care Difficulty
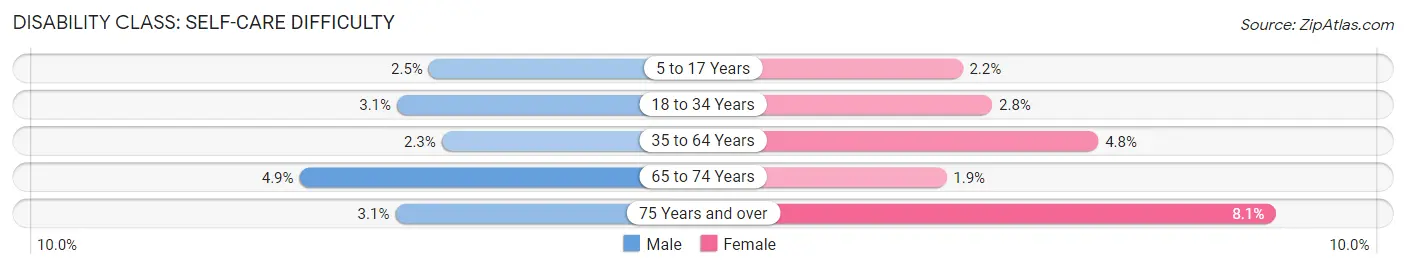
| Age Bracket | Male | Female |
| 5 to 17 Years | 29 (2.5%) | 23 (2.2%) |
| 18 to 34 Years | 37 (3.1%) | 32 (2.8%) |
| 35 to 64 Years | 59 (2.3%) | 127 (4.8%) |
| 65 to 74 Years | 34 (4.9%) | 15 (1.9%) |
| 75 Years and over | 11 (3.1%) | 37 (8.1%) |
Technology Access in Jackson County
Computing Device Access in Jackson County
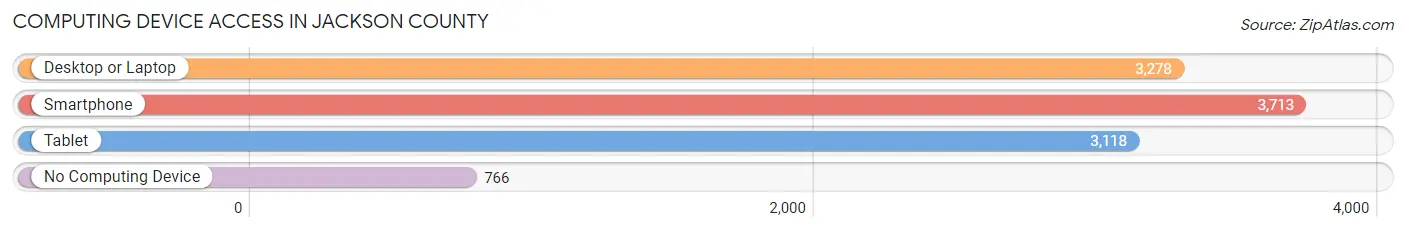
| Device Type | # Households | % Households |
| Desktop or Laptop | 3,278 | 63.6% |
| Smartphone | 3,713 | 72.0% |
| Tablet | 3,118 | 60.5% |
| No Computing Device | 766 | 14.9% |
| Total | 5,154 | 100.0% |
Internet Access in Jackson County
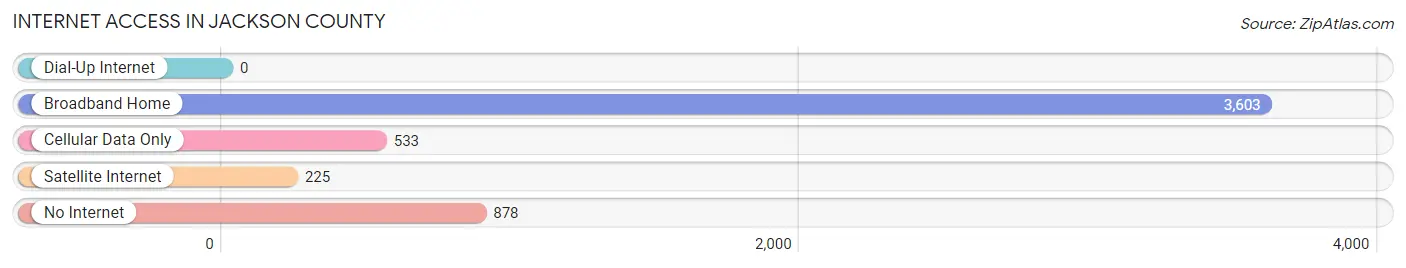
| Internet Type | # Households | % Households |
| Dial-Up Internet | 0 | 0.0% |
| Broadband Home | 3,603 | 69.9% |
| Cellular Data Only | 533 | 10.3% |
| Satellite Internet | 225 | 4.4% |
| No Internet | 878 | 17.0% |
| Total | 5,154 | 100.0% |
Jackson County Summary
Jackson County is located in the eastern part of Kentucky, in the Appalachian Mountains. It is bordered by Breathitt, Owsley, Clay, Laurel, and Rockcastle counties. The county seat is McKee. The county was established in 1858 and named for Andrew Jackson, the seventh president of the United States.
Geography
Jackson County is located in the Appalachian Mountains of eastern Kentucky. It is bordered by Breathitt, Owsley, Clay, Laurel, and Rockcastle counties. The county has a total area of 437 square miles, of which 435 square miles is land and 2 square miles is water. The highest point in the county is located on the border with Owsley County, at an elevation of 1,890 feet. The county is mostly hilly, with some flat areas in the valleys. The main rivers in the county are the Rockcastle River, the Red Bird River, and the South Fork of the Kentucky River.
Economy
The economy of Jackson County is largely based on agriculture and forestry. The county is home to several large farms, as well as smaller family-owned farms. The main crops grown in the county are corn, soybeans, hay, and tobacco. The county also has a large timber industry, with several sawmills and wood-processing plants.
The county also has a growing tourism industry, with several attractions, such as the Red Bird River Valley National Wildlife Refuge, the Daniel Boone National Forest, and the Big South Fork National River and Recreation Area.
Demographics
As of the 2010 census, the population of Jackson County was 13,494. The population density was 31 people per square mile. The racial makeup of the county was 97.3% White, 0.7% Black or African American, 0.2% Native American, 0.2% Asian, 0.1% Pacific Islander, 0.5% from other races, and 1.1% from two or more races. 1.7% of the population were Hispanic or Latino of any race.
The median income for a household in the county was $30,945, and the median income for a family was $37,917. The per capita income for the county was $15,945. About 17.2% of the population was below the poverty line.
Conclusion
Jackson County is a rural county located in the Appalachian Mountains of eastern Kentucky. The county is largely agricultural, with a growing timber industry and a growing tourism industry. The population of the county is mostly white, with a small percentage of other races. The median income for a household in the county is lower than the national average, and the poverty rate is higher than the national average.
Common Questions
What is Per Capita Income in Jackson County?
Per Capita income in Jackson County is $21,876.
What is the Median Family Income in Jackson County?
Median Family Income in Jackson County is $52,113.
What is the Median Household income in Jackson County?
Median Household Income in Jackson County is $38,516.
What is Income or Wage Gap in Jackson County?
Income or Wage Gap in Jackson County is 32.8%.
Women in Jackson County earn 67.2 cents for every dollar earned by a man.
What is Family Income Deficit in Jackson County?
Family Income Deficit in Jackson County is $7,614.
Families that are below poverty line in Jackson County earn $7,614 less on average than the poverty threshold level.
What is Inequality or Gini Index in Jackson County?
Inequality or Gini Index in Jackson County is 0.43.
What is the Total Population of Jackson County?
Total Population of Jackson County is 13,002.
What is the Total Male Population of Jackson County?
Total Male Population of Jackson County is 6,507.
What is the Total Female Population of Jackson County?
Total Female Population of Jackson County is 6,495.
What is the Ratio of Males per 100 Females in Jackson County?
There are 100.18 Males per 100 Females in Jackson County.
What is the Ratio of Females per 100 Males in Jackson County?
There are 99.82 Females per 100 Males in Jackson County.
What is the Median Population Age in Jackson County?
Median Population Age in Jackson County is 40.9 Years.
What is the Average Family Size in Jackson County
Average Family Size in Jackson County is 3.0 People.
What is the Average Household Size in Jackson County
Average Household Size in Jackson County is 2.5 People.
How Large is the Labor Force in Jackson County?
There are 4,601 People in the Labor Forcein in Jackson County.
What is the Percentage of People in the Labor Force in Jackson County?
44.0% of People are in the Labor Force in Jackson County.
What is the Unemployment Rate in Jackson County?
Unemployment Rate in Jackson County is 6.0%.