Hart County, KY Map & Demographics
Hart County Map
Hart County Overview
$23,837
PER CAPITA INCOME
$59,152
AVG FAMILY INCOME
$45,561
AVG HOUSEHOLD INCOME
47.0%
WAGE / INCOME GAP [ % ]
53.0¢/ $1
WAGE / INCOME GAP [ $ ]
$10,472
FAMILY INCOME DEFICIT
0.46
INEQUALITY / GINI INDEX
19,345
TOTAL POPULATION
9,580
MALE POPULATION
9,765
FEMALE POPULATION
98.11
MALES / 100 FEMALES
101.93
FEMALES / 100 MALES
40.3
MEDIAN AGE
3.2
AVG FAMILY SIZE
2.6
AVG HOUSEHOLD SIZE
8,174
LABOR FORCE [ PEOPLE ]
54.1%
PERCENT IN LABOR FORCE
3.5%
UNEMPLOYMENT RATE
Hart County Area Codes
Income in Hart County
Income Overview in Hart County
Per Capita Income in Hart County is $23,837, while median incomes of families and households are $59,152 and $45,561 respectively.
| Characteristic | Number | Measure |
| Per Capita Income | 19,345 | $23,837 |
| Median Family Income | 4,699 | $59,152 |
| Mean Family Income | 4,699 | $72,572 |
| Median Household Income | 7,199 | $45,561 |
| Mean Household Income | 7,199 | $60,803 |
| Income Deficit | 4,699 | $10,472 |
| Wage / Income Gap (%) | 19,345 | 46.97% |
| Wage / Income Gap ($) | 19,345 | 53.03¢ per $1 |
| Gini / Inequality Index | 19,345 | 0.46 |
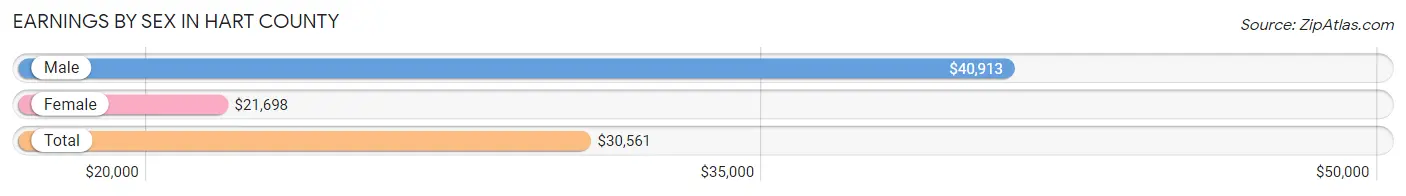
Earnings by Sex in Hart County
Average Earnings in Hart County are $30,561, $40,913 for men and $21,698 for women, a difference of 47.0%.
| Sex | Number | Average Earnings |
| Male | 4,582 (52.9%) | $40,913 |
| Female | 4,082 (47.1%) | $21,698 |
| Total | 8,664 (100.0%) | $30,561 |
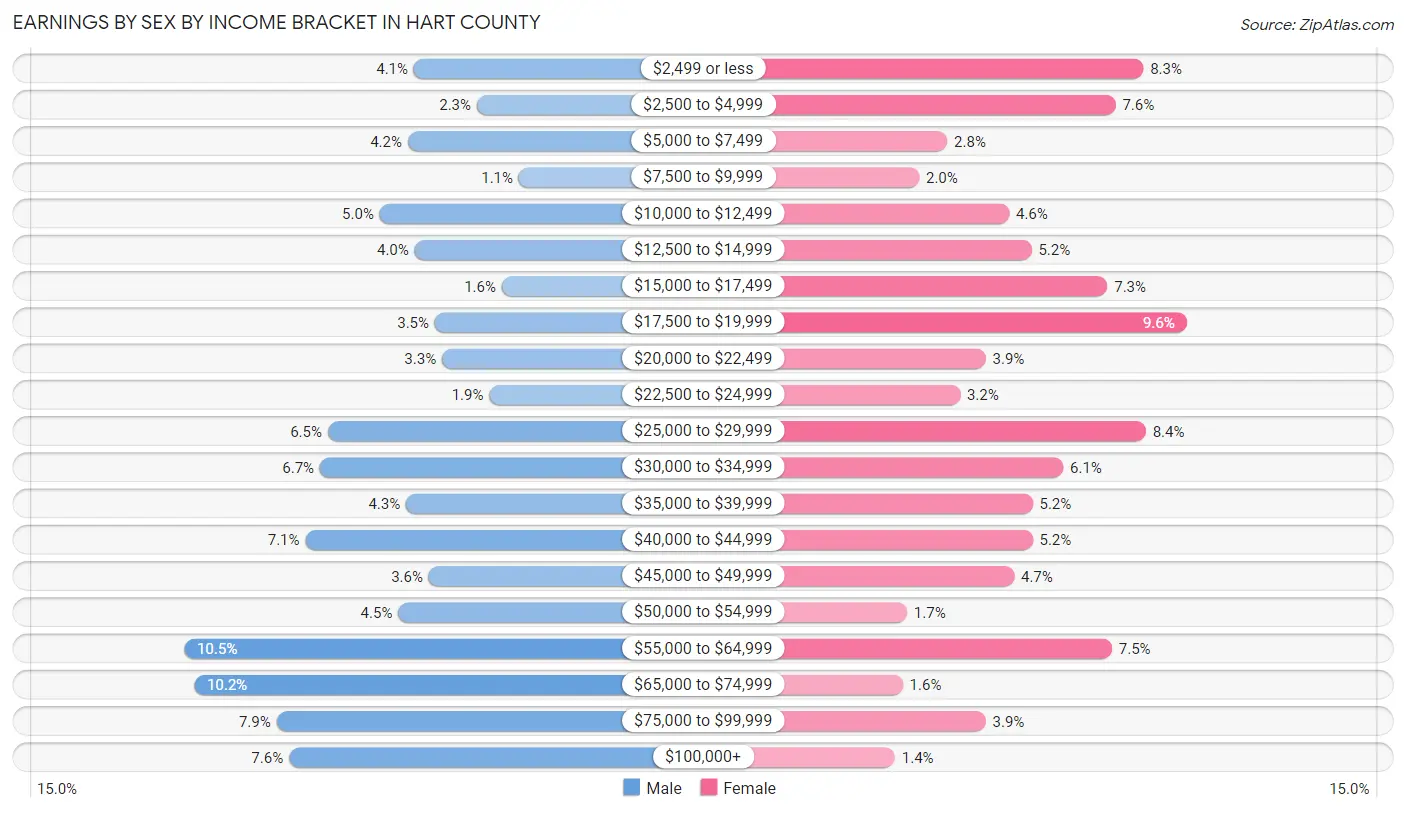
Earnings by Sex by Income Bracket in Hart County
The most common earnings brackets in Hart County are $55,000 to $64,999 for men (482 | 10.5%) and $17,500 to $19,999 for women (390 | 9.6%).
| Income | Male | Female |
| $2,499 or less | 186 (4.1%) | 340 (8.3%) |
| $2,500 to $4,999 | 105 (2.3%) | 308 (7.5%) |
| $5,000 to $7,499 | 194 (4.2%) | 115 (2.8%) |
| $7,500 to $9,999 | 51 (1.1%) | 83 (2.0%) |
| $10,000 to $12,499 | 230 (5.0%) | 186 (4.6%) |
| $12,500 to $14,999 | 185 (4.0%) | 212 (5.2%) |
| $15,000 to $17,499 | 73 (1.6%) | 299 (7.3%) |
| $17,500 to $19,999 | 159 (3.5%) | 390 (9.6%) |
| $20,000 to $22,499 | 150 (3.3%) | 159 (3.9%) |
| $22,500 to $24,999 | 89 (1.9%) | 130 (3.2%) |
| $25,000 to $29,999 | 297 (6.5%) | 343 (8.4%) |
| $30,000 to $34,999 | 307 (6.7%) | 248 (6.1%) |
| $35,000 to $39,999 | 196 (4.3%) | 213 (5.2%) |
| $40,000 to $44,999 | 326 (7.1%) | 213 (5.2%) |
| $45,000 to $49,999 | 167 (3.6%) | 192 (4.7%) |
| $50,000 to $54,999 | 206 (4.5%) | 69 (1.7%) |
| $55,000 to $64,999 | 482 (10.5%) | 304 (7.4%) |
| $65,000 to $74,999 | 469 (10.2%) | 64 (1.6%) |
| $75,000 to $99,999 | 363 (7.9%) | 159 (3.9%) |
| $100,000+ | 347 (7.6%) | 55 (1.3%) |
| Total | 4,582 (100.0%) | 4,082 (100.0%) |
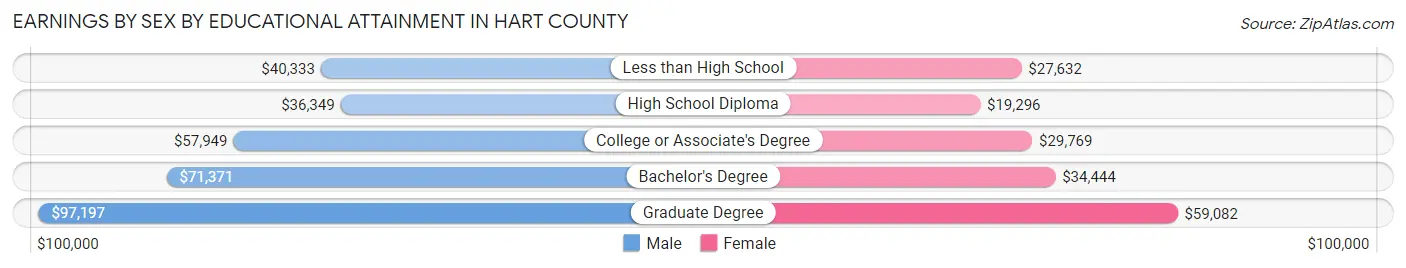
Earnings by Sex by Educational Attainment in Hart County
Average earnings in Hart County are $43,258 for men and $26,653 for women, a difference of 38.4%. Men with an educational attainment of graduate degree enjoy the highest average annual earnings of $97,197, while those with high school diploma education earn the least with $36,349. Women with an educational attainment of graduate degree earn the most with the average annual earnings of $59,082, while those with high school diploma education have the smallest earnings of $19,296.
| Educational Attainment | Male Income | Female Income |
| Less than High School | $40,333 | $27,632 |
| High School Diploma | $36,349 | $19,296 |
| College or Associate's Degree | $57,949 | $29,769 |
| Bachelor's Degree | $71,371 | $34,444 |
| Graduate Degree | $97,197 | $59,082 |
| Total | $43,258 | $26,653 |
Family Income in Hart County
Family Income Brackets in Hart County
According to the Hart County family income data, there are 921 families falling into the $50,000 to $74,999 income range, which is the most common income bracket and makes up 19.6% of all families. Conversely, the $150,000 to $199,999 income bracket is the least frequent group with only 164 families (3.5%) belonging to this category.
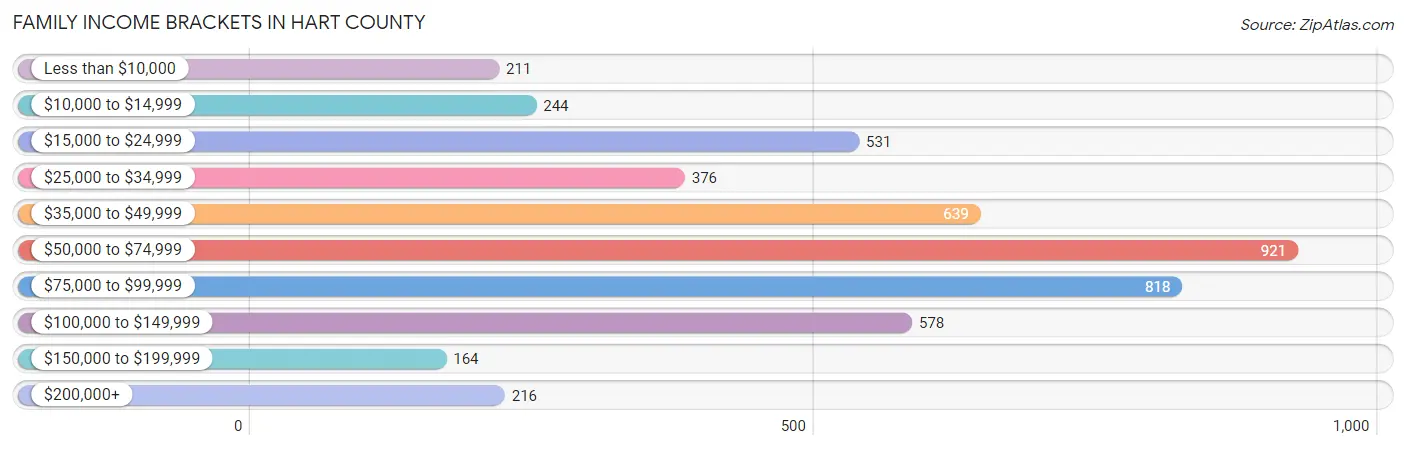
| Income Bracket | # Families | % Families |
| Less than $10,000 | 211 | 4.5% |
| $10,000 to $14,999 | 244 | 5.2% |
| $15,000 to $24,999 | 531 | 11.3% |
| $25,000 to $34,999 | 376 | 8.0% |
| $35,000 to $49,999 | 639 | 13.6% |
| $50,000 to $74,999 | 921 | 19.6% |
| $75,000 to $99,999 | 818 | 17.4% |
| $100,000 to $149,999 | 578 | 12.3% |
| $150,000 to $199,999 | 164 | 3.5% |
| $200,000+ | 216 | 4.6% |
Family Income by Famaliy Size in Hart County
4-person families (610 | 13.0%) account for the highest median family income in Hart County with $99,107 per family, while 2-person families (2,347 | 49.9%) have the highest median income of $25,452 per family member.
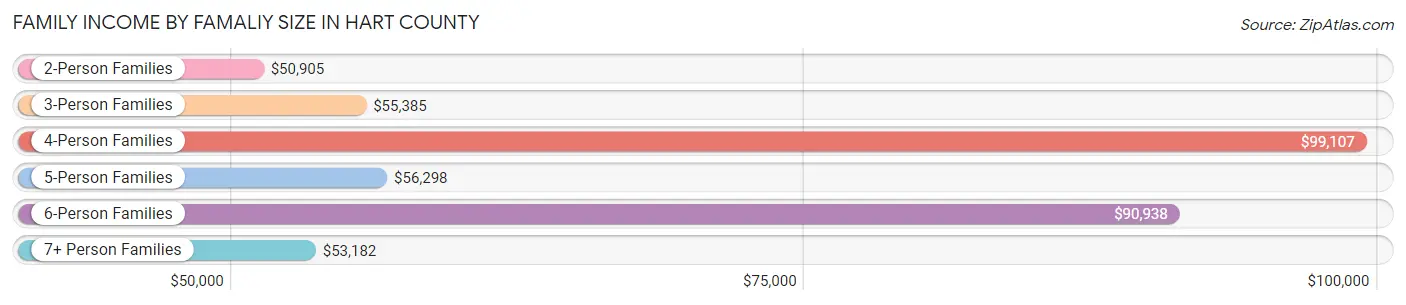
| Income Bracket | # Families | Median Income |
| 2-Person Families | 2,347 (49.9%) | $50,905 |
| 3-Person Families | 1,090 (23.2%) | $55,385 |
| 4-Person Families | 610 (13.0%) | $99,107 |
| 5-Person Families | 331 (7.0%) | $56,298 |
| 6-Person Families | 165 (3.5%) | $90,938 |
| 7+ Person Families | 156 (3.3%) | $53,182 |
| Total | 4,699 (100.0%) | $59,152 |
Family Income by Number of Earners in Hart County
The median family income in Hart County is $59,152, with families comprising 3+ earners (406) having the highest median family income of $110,714, while families with no earners (813) have the lowest median family income of $25,560, accounting for 8.6% and 17.3% of families, respectively.
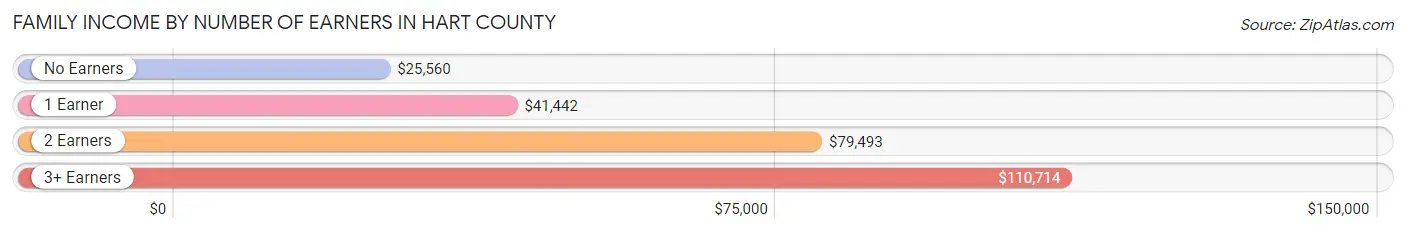
| Number of Earners | # Families | Median Income |
| No Earners | 813 (17.3%) | $25,560 |
| 1 Earner | 1,665 (35.4%) | $41,442 |
| 2 Earners | 1,815 (38.6%) | $79,493 |
| 3+ Earners | 406 (8.6%) | $110,714 |
| Total | 4,699 (100.0%) | $59,152 |
Household Income in Hart County
Household Income Brackets in Hart County
With 1,130 households falling in the category, the $75,000 to $99,999 income range is the most frequent in Hart County, accounting for 15.7% of all households. In contrast, only 187 households (2.6%) fall into the $150,000 to $199,999 income bracket, making it the least populous group.
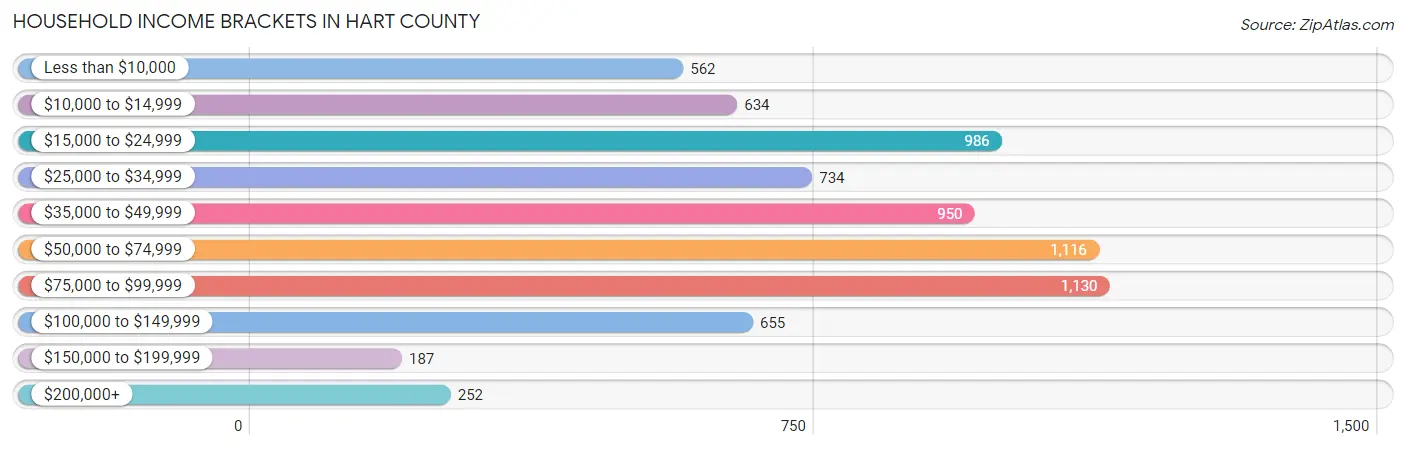
| Income Bracket | # Households | % Households |
| Less than $10,000 | 562 | 7.8% |
| $10,000 to $14,999 | 634 | 8.8% |
| $15,000 to $24,999 | 986 | 13.7% |
| $25,000 to $34,999 | 734 | 10.2% |
| $35,000 to $49,999 | 950 | 13.2% |
| $50,000 to $74,999 | 1,116 | 15.5% |
| $75,000 to $99,999 | 1,130 | 15.7% |
| $100,000 to $149,999 | 655 | 9.1% |
| $150,000 to $199,999 | 187 | 2.6% |
| $200,000+ | 252 | 3.5% |
Household Income by Householder Age in Hart County
The median household income in Hart County is $45,561, with the highest median household income of $54,933 found in the 45 to 64 years age bracket for the primary householder. A total of 3,001 households (41.7%) fall into this category. Meanwhile, the 65+ years age bracket for the primary householder has the lowest median household income of $28,500, with 1,988 households (27.6%) in this group.
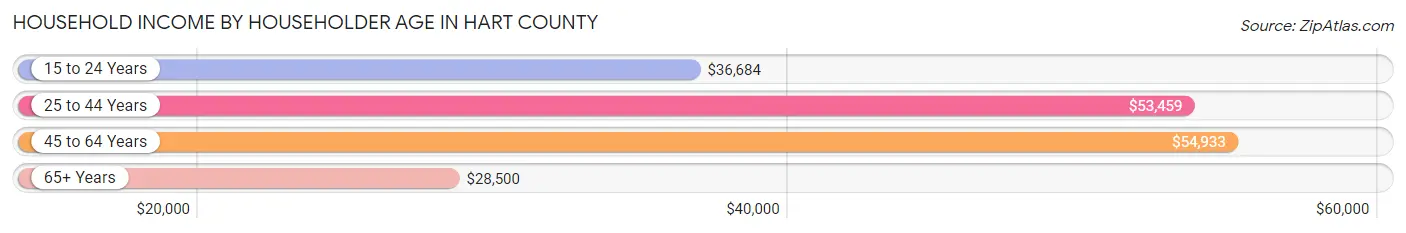
| Income Bracket | # Households | Median Income |
| 15 to 24 Years | 237 (3.3%) | $36,684 |
| 25 to 44 Years | 1,973 (27.4%) | $53,459 |
| 45 to 64 Years | 3,001 (41.7%) | $54,933 |
| 65+ Years | 1,988 (27.6%) | $28,500 |
| Total | 7,199 (100.0%) | $45,561 |
Poverty in Hart County
Income Below Poverty by Sex and Age in Hart County
With 23.1% poverty level for males and 22.2% for females among the residents of Hart County, 16 and 17 year old males and 6 to 11 year old females are the most vulnerable to poverty, with 135 males (48.0%) and 242 females (41.4%) in their respective age groups living below the poverty level.
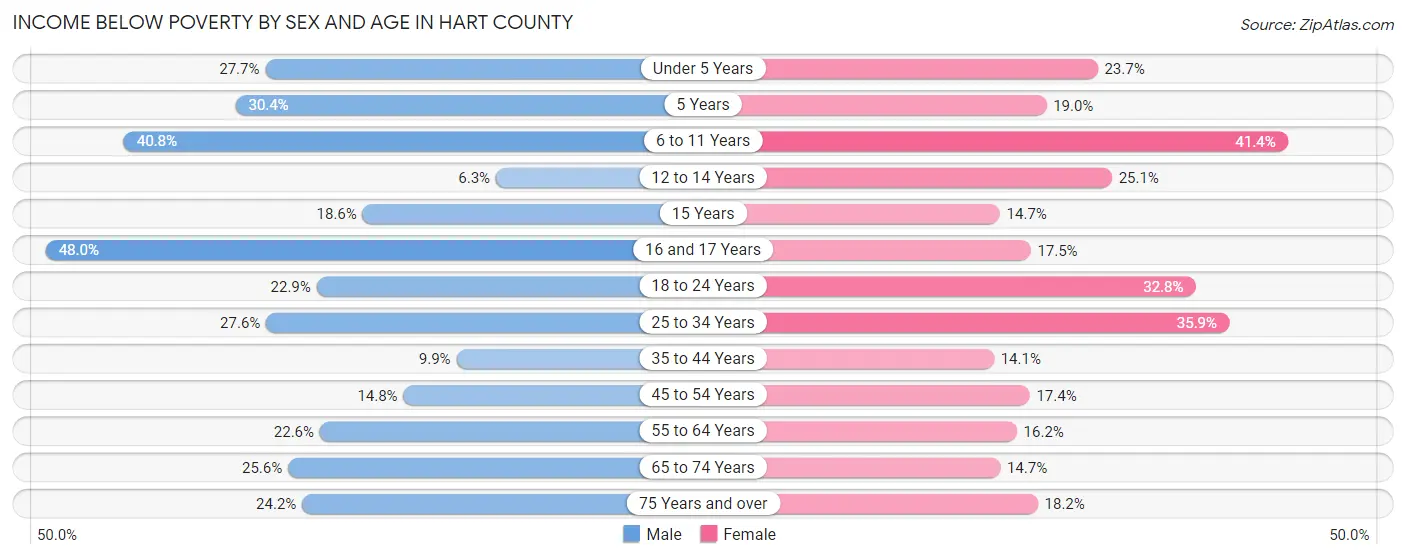
| Age Bracket | Male | Female |
| Under 5 Years | 161 (27.7%) | 150 (23.7%) |
| 5 Years | 7 (30.4%) | 22 (19.0%) |
| 6 to 11 Years | 319 (40.8%) | 242 (41.4%) |
| 12 to 14 Years | 27 (6.3%) | 116 (25.1%) |
| 15 Years | 38 (18.6%) | 23 (14.6%) |
| 16 and 17 Years | 135 (48.0%) | 38 (17.5%) |
| 18 to 24 Years | 180 (22.9%) | 252 (32.8%) |
| 25 to 34 Years | 313 (27.6%) | 394 (35.9%) |
| 35 to 44 Years | 99 (9.9%) | 152 (14.1%) |
| 45 to 54 Years | 173 (14.8%) | 232 (17.4%) |
| 55 to 64 Years | 335 (22.6%) | 217 (16.2%) |
| 65 to 74 Years | 234 (25.6%) | 161 (14.7%) |
| 75 Years and over | 120 (24.2%) | 119 (18.2%) |
| Total | 2,141 (23.1%) | 2,118 (22.2%) |
Income Above Poverty by Sex and Age in Hart County
According to the poverty statistics in Hart County, males aged 12 to 14 years and females aged 35 to 44 years are the age groups that are most secure financially, with 93.7% of males and 85.9% of females in these age groups living above the poverty line.
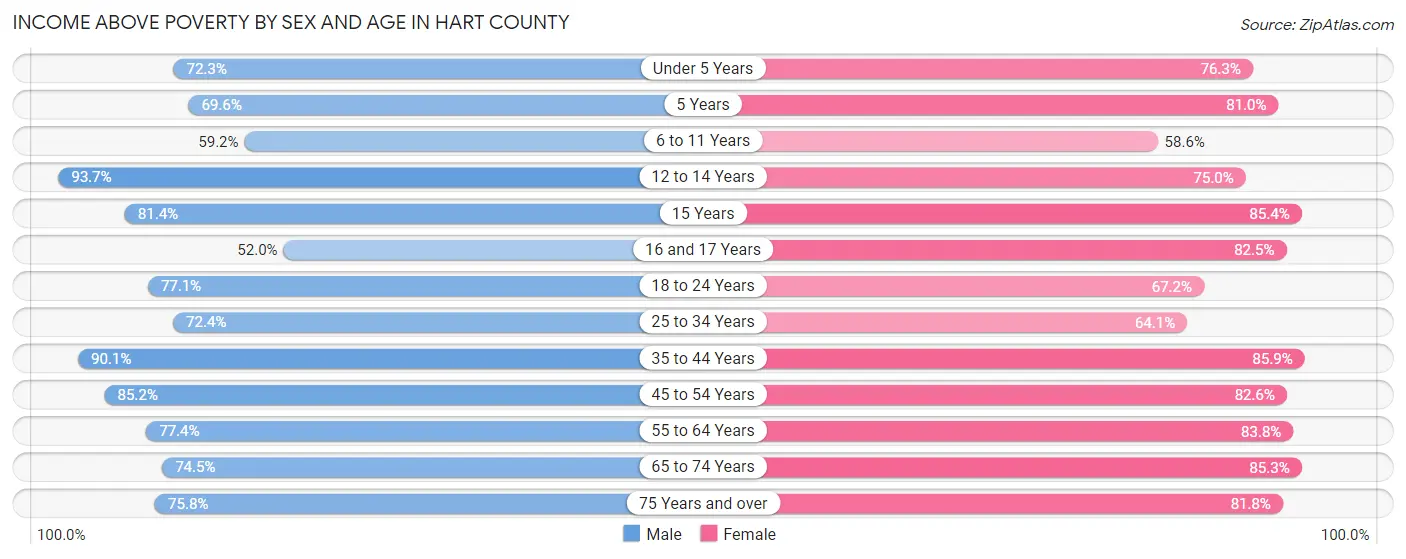
| Age Bracket | Male | Female |
| Under 5 Years | 421 (72.3%) | 482 (76.3%) |
| 5 Years | 16 (69.6%) | 94 (81.0%) |
| 6 to 11 Years | 463 (59.2%) | 343 (58.6%) |
| 12 to 14 Years | 404 (93.7%) | 347 (75.0%) |
| 15 Years | 166 (81.4%) | 134 (85.4%) |
| 16 and 17 Years | 146 (52.0%) | 179 (82.5%) |
| 18 to 24 Years | 606 (77.1%) | 516 (67.2%) |
| 25 to 34 Years | 822 (72.4%) | 703 (64.1%) |
| 35 to 44 Years | 899 (90.1%) | 926 (85.9%) |
| 45 to 54 Years | 993 (85.2%) | 1,100 (82.6%) |
| 55 to 64 Years | 1,147 (77.4%) | 1,120 (83.8%) |
| 65 to 74 Years | 682 (74.5%) | 936 (85.3%) |
| 75 Years and over | 375 (75.8%) | 536 (81.8%) |
| Total | 7,140 (76.9%) | 7,416 (77.8%) |
Income Below Poverty Among Married-Couple Families in Hart County
The poverty statistics for married-couple families in Hart County show that 8.7% or 304 of the total 3,481 families live below the poverty line. Families with 5 or more children have the highest poverty rate of 36.0%, comprising of 31 families. On the other hand, families with no children have the lowest poverty rate of 6.2%, which includes 135 families.
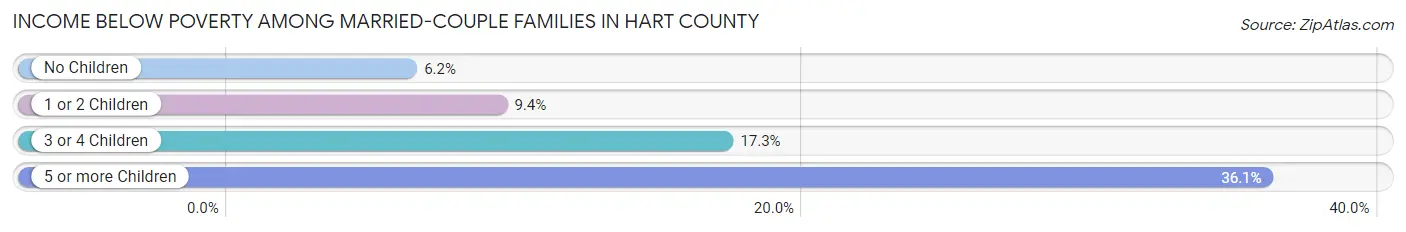
| Children | Above Poverty | Below Poverty |
| No Children | 2,027 (93.8%) | 135 (6.2%) |
| 1 or 2 Children | 860 (90.6%) | 89 (9.4%) |
| 3 or 4 Children | 235 (82.8%) | 49 (17.2%) |
| 5 or more Children | 55 (63.9%) | 31 (36.0%) |
| Total | 3,177 (91.3%) | 304 (8.7%) |
Income Below Poverty Among Single-Parent Households in Hart County
According to the poverty data in Hart County, 37.3% or 149 single-father households and 44.0% or 360 single-mother households are living below the poverty line. Among single-father households, those with 3 or 4 children have the highest poverty rate, with 38 households (100.0%) experiencing poverty. Likewise, among single-mother households, those with 5 or more children have the highest poverty rate, with 3 households (100.0%) falling below the poverty line.
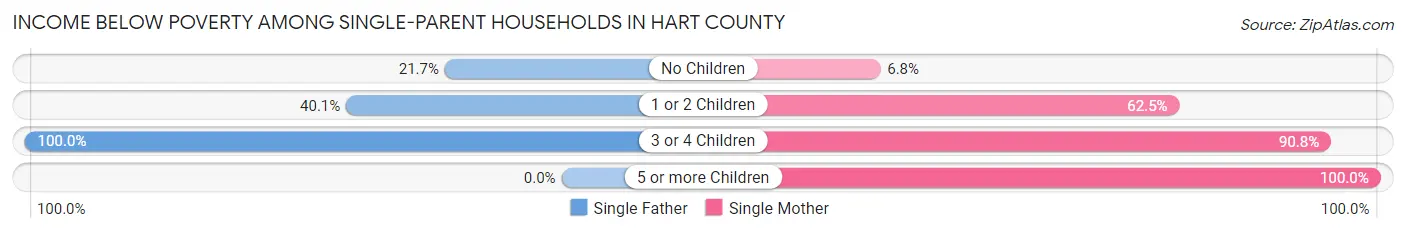
| Children | Single Father | Single Mother |
| No Children | 40 (21.7%) | 21 (6.8%) |
| 1 or 2 Children | 71 (40.1%) | 277 (62.5%) |
| 3 or 4 Children | 38 (100.0%) | 59 (90.8%) |
| 5 or more Children | 0 (0.0%) | 3 (100.0%) |
| Total | 149 (37.3%) | 360 (44.0%) |
Income Below Poverty Among Married-Couple vs Single-Parent Households in Hart County
The poverty data for Hart County shows that 304 of the married-couple family households (8.7%) and 509 of the single-parent households (41.8%) are living below the poverty level. Within the married-couple family households, those with 5 or more children have the highest poverty rate, with 31 households (36.0%) falling below the poverty line. Among the single-parent households, those with 5 or more children have the highest poverty rate, with 3 household (100.0%) living below poverty.
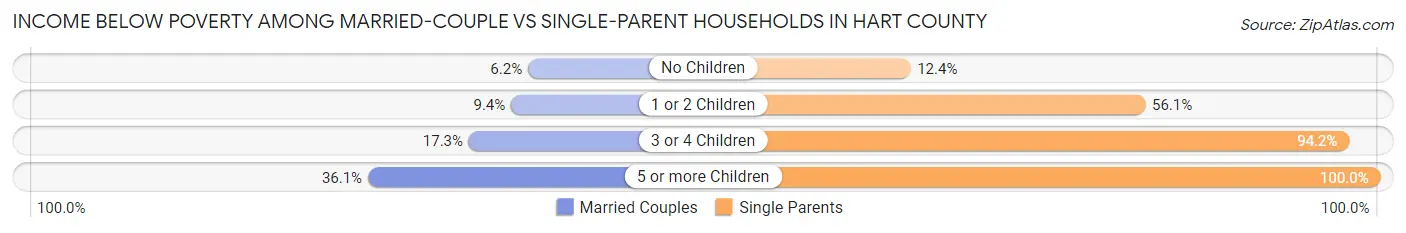
| Children | Married-Couple Families | Single-Parent Households |
| No Children | 135 (6.2%) | 61 (12.4%) |
| 1 or 2 Children | 89 (9.4%) | 348 (56.1%) |
| 3 or 4 Children | 49 (17.2%) | 97 (94.2%) |
| 5 or more Children | 31 (36.0%) | 3 (100.0%) |
| Total | 304 (8.7%) | 509 (41.8%) |
Race in Hart County
The most populous races in Hart County are White / Caucasian (17,700 | 91.5%), Black / African American (818 | 4.2%), and Two or more Races (534 | 2.8%).
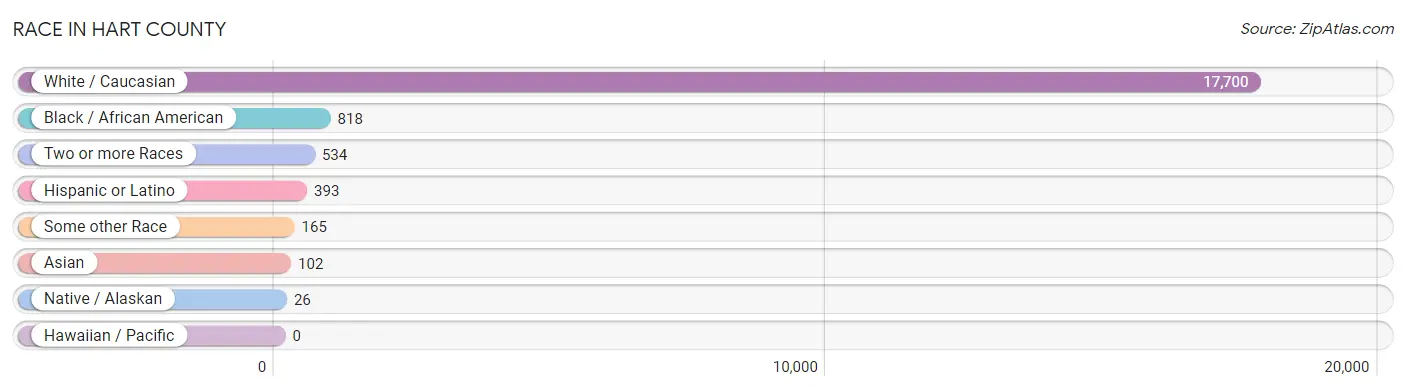
| Race | # Population | % Population |
| Asian | 102 | 0.5% |
| Black / African American | 818 | 4.2% |
| Hawaiian / Pacific | 0 | 0.0% |
| Hispanic or Latino | 393 | 2.0% |
| Native / Alaskan | 26 | 0.1% |
| White / Caucasian | 17,700 | 91.5% |
| Two or more Races | 534 | 2.8% |
| Some other Race | 165 | 0.9% |
| Total | 19,345 | 100.0% |
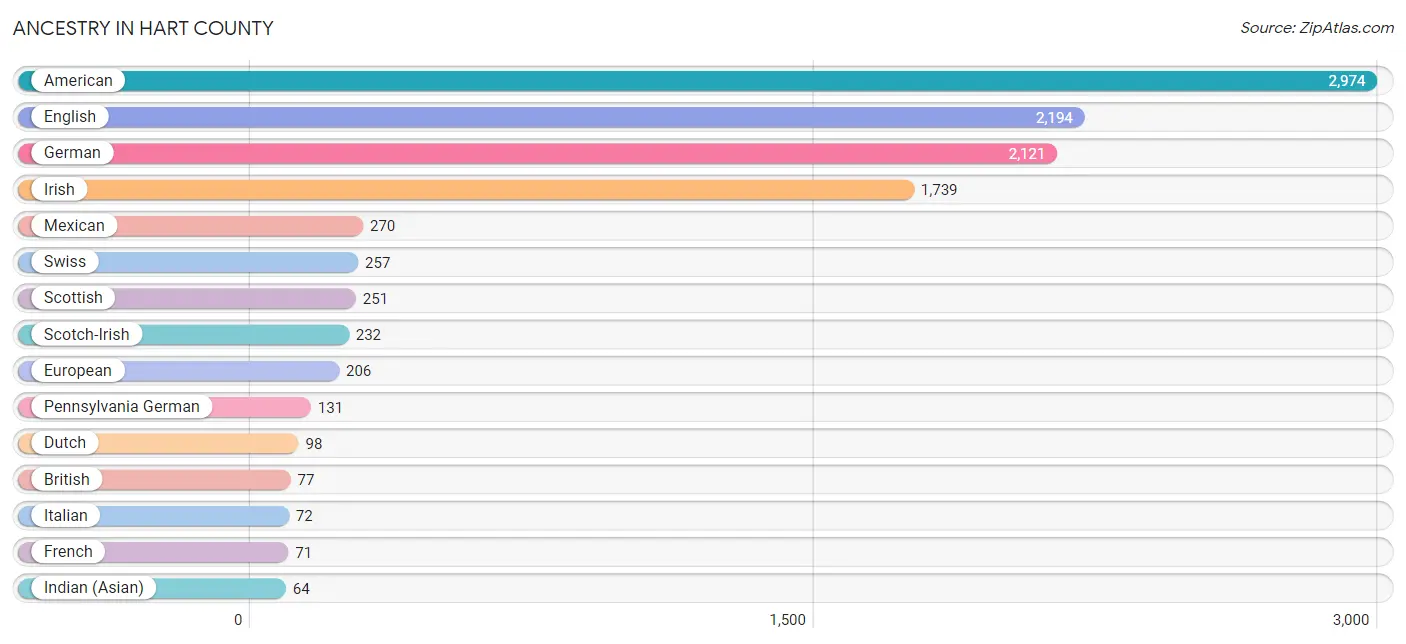
Ancestry in Hart County
The most populous ancestries reported in Hart County are American (2,974 | 15.4%), English (2,194 | 11.3%), German (2,121 | 11.0%), Irish (1,739 | 9.0%), and Mexican (270 | 1.4%), together accounting for 48.1% of all Hart County residents.
| Ancestry | # Population | % Population |
| African | 41 | 0.2% |
| American | 2,974 | 15.4% |
| Arab | 26 | 0.1% |
| Blackfeet | 1 | 0.0% |
| British | 77 | 0.4% |
| Burmese | 19 | 0.1% |
| Cherokee | 48 | 0.3% |
| Czech | 8 | 0.0% |
| Czechoslovakian | 30 | 0.2% |
| Dutch | 98 | 0.5% |
| Eastern European | 21 | 0.1% |
| English | 2,194 | 11.3% |
| European | 206 | 1.1% |
| Finnish | 16 | 0.1% |
| French | 71 | 0.4% |
| French Canadian | 23 | 0.1% |
| German | 2,121 | 11.0% |
| Hungarian | 14 | 0.1% |
| Indian (Asian) | 64 | 0.3% |
| Irish | 1,739 | 9.0% |
| Israeli | 5 | 0.0% |
| Italian | 72 | 0.4% |
| Jamaican | 14 | 0.1% |
| Korean | 35 | 0.2% |
| Lebanese | 21 | 0.1% |
| Mexican | 270 | 1.4% |
| Mexican American Indian | 12 | 0.1% |
| Norwegian | 32 | 0.2% |
| Palestinian | 5 | 0.0% |
| Pennsylvania German | 131 | 0.7% |
| Polish | 51 | 0.3% |
| Puerto Rican | 62 | 0.3% |
| Russian | 33 | 0.2% |
| Scandinavian | 16 | 0.1% |
| Scotch-Irish | 232 | 1.2% |
| Scottish | 251 | 1.3% |
| Slavic | 5 | 0.0% |
| Spanish | 61 | 0.3% |
| Subsaharan African | 41 | 0.2% |
| Swedish | 36 | 0.2% |
| Swiss | 257 | 1.3% |
| Thai | 3 | 0.0% |
| Welsh | 58 | 0.3% | View All 43 Rows |
Immigrants in Hart County
The most numerous immigrant groups reported in Hart County came from Asia (113 | 0.6%), Eastern Asia (75 | 0.4%), Europe (70 | 0.4%), China (56 | 0.3%), and Philippines (35 | 0.2%), together accounting for 1.8% of all Hart County residents.
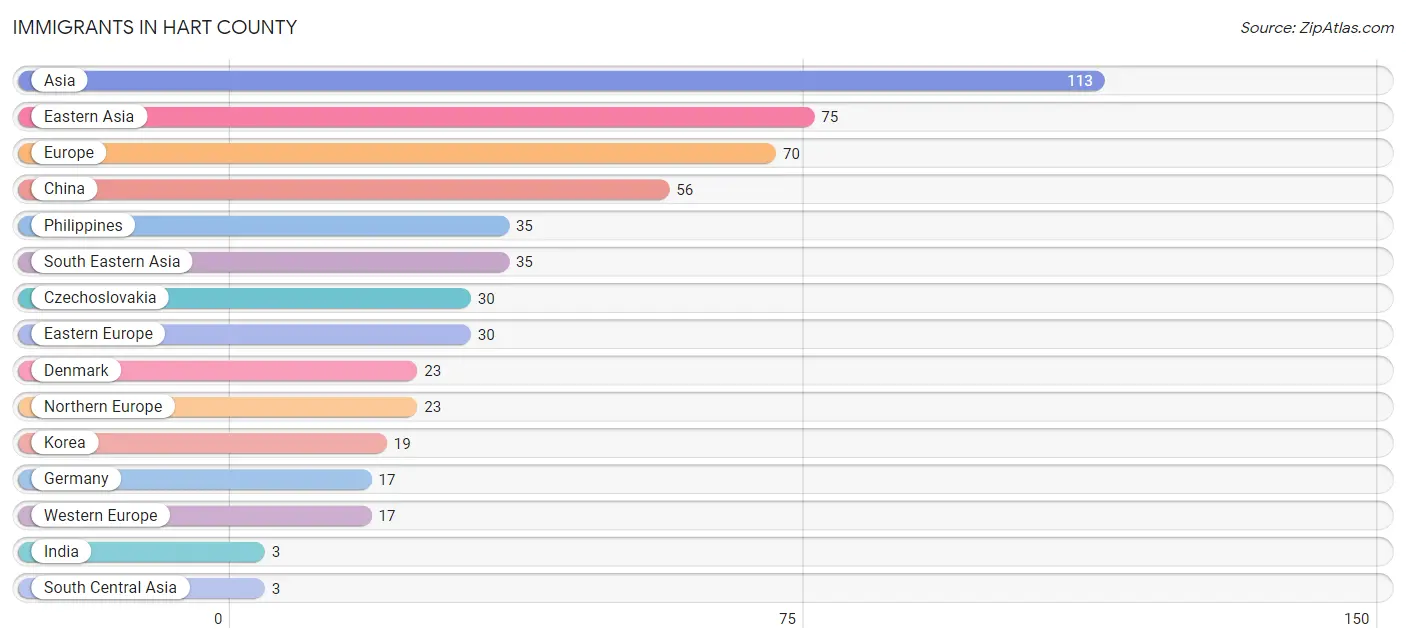
| Immigration Origin | # Population | % Population |
| Asia | 113 | 0.6% |
| China | 56 | 0.3% |
| Czechoslovakia | 30 | 0.2% |
| Denmark | 23 | 0.1% |
| Eastern Asia | 75 | 0.4% |
| Eastern Europe | 30 | 0.2% |
| Europe | 70 | 0.4% |
| Germany | 17 | 0.1% |
| India | 3 | 0.0% |
| Korea | 19 | 0.1% |
| Northern Europe | 23 | 0.1% |
| Philippines | 35 | 0.2% |
| South Central Asia | 3 | 0.0% |
| South Eastern Asia | 35 | 0.2% |
| Western Europe | 17 | 0.1% | View All 15 Rows |
Sex and Age in Hart County
Sex and Age in Hart County
The most populous age groups in Hart County are 60 to 64 Years (943 | 9.8%) for men and 50 to 54 Years (780 | 8.0%) for women.
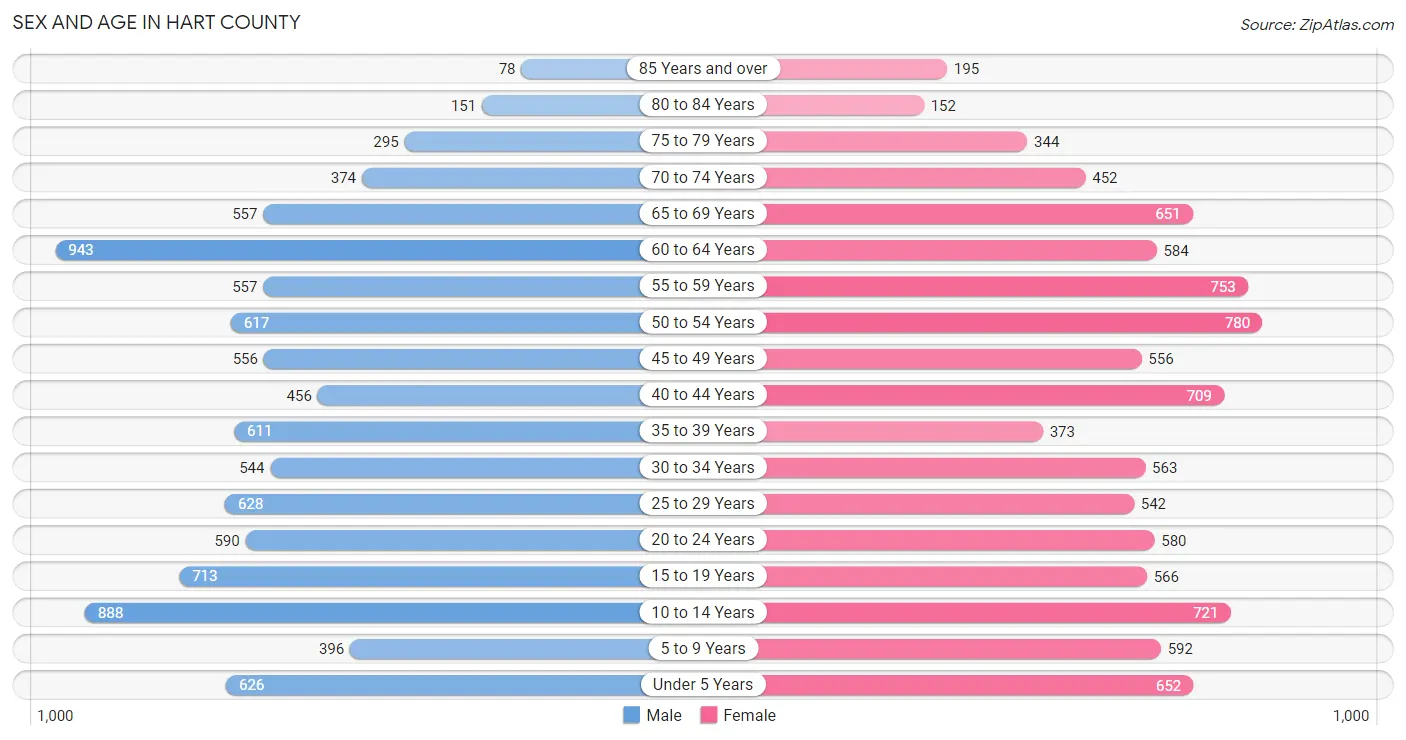
| Age Bracket | Male | Female |
| Under 5 Years | 626 (6.5%) | 652 (6.7%) |
| 5 to 9 Years | 396 (4.1%) | 592 (6.1%) |
| 10 to 14 Years | 888 (9.3%) | 721 (7.4%) |
| 15 to 19 Years | 713 (7.4%) | 566 (5.8%) |
| 20 to 24 Years | 590 (6.2%) | 580 (5.9%) |
| 25 to 29 Years | 628 (6.6%) | 542 (5.6%) |
| 30 to 34 Years | 544 (5.7%) | 563 (5.8%) |
| 35 to 39 Years | 611 (6.4%) | 373 (3.8%) |
| 40 to 44 Years | 456 (4.8%) | 709 (7.3%) |
| 45 to 49 Years | 556 (5.8%) | 556 (5.7%) |
| 50 to 54 Years | 617 (6.4%) | 780 (8.0%) |
| 55 to 59 Years | 557 (5.8%) | 753 (7.7%) |
| 60 to 64 Years | 943 (9.8%) | 584 (6.0%) |
| 65 to 69 Years | 557 (5.8%) | 651 (6.7%) |
| 70 to 74 Years | 374 (3.9%) | 452 (4.6%) |
| 75 to 79 Years | 295 (3.1%) | 344 (3.5%) |
| 80 to 84 Years | 151 (1.6%) | 152 (1.6%) |
| 85 Years and over | 78 (0.8%) | 195 (2.0%) |
| Total | 9,580 (100.0%) | 9,765 (100.0%) |
Families and Households in Hart County
Median Family Size in Hart County
The median family size in Hart County is 3.23 persons per family, with married-couple families (3,481 | 74.1%) accounting for the largest median family size of 3.27 persons per family. On the other hand, single female/mother families (819 | 17.4%) represent the smallest median family size with 3.11 persons per family.
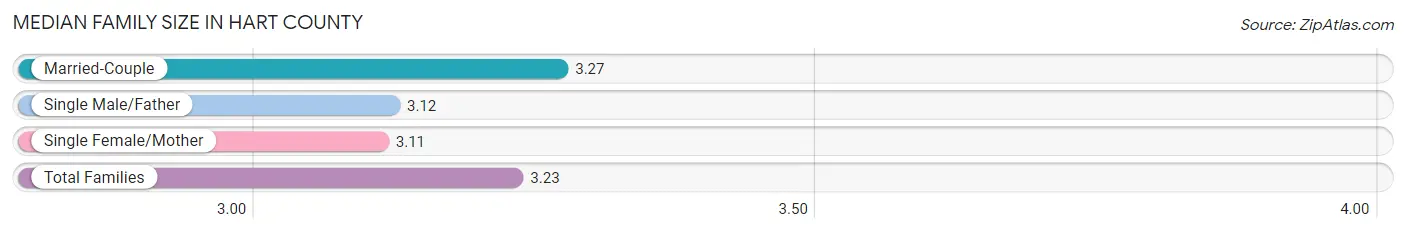
| Family Type | # Families | Family Size |
| Married-Couple | 3,481 (74.1%) | 3.27 |
| Single Male/Father | 399 (8.5%) | 3.12 |
| Single Female/Mother | 819 (17.4%) | 3.11 |
| Total Families | 4,699 (100.0%) | 3.23 |
Median Household Size in Hart County
The median household size in Hart County is 2.65 persons per household, with single female/mother households (819 | 11.4%) accounting for the largest median household size of 3.54 persons per household. non-family households (2,500 | 34.7%) represent the smallest median household size with 1.30 persons per household.
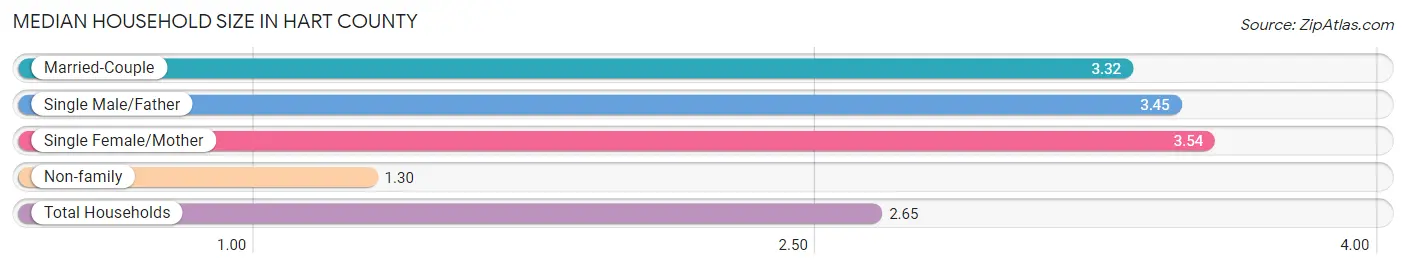
| Household Type | # Households | Household Size |
| Married-Couple | 3,481 (48.3%) | 3.32 |
| Single Male/Father | 399 (5.5%) | 3.45 |
| Single Female/Mother | 819 (11.4%) | 3.54 |
| Non-family | 2,500 (34.7%) | 1.30 |
| Total Households | 7,199 (100.0%) | 2.65 |
Household Size by Marriage Status in Hart County
Out of a total of 7,199 households in Hart County, 4,699 (65.3%) are family households, while 2,500 (34.7%) are nonfamily households. The most numerous type of family households are 2-person households, comprising 2,061, and the most common type of nonfamily households are 1-person households, comprising 2,060.
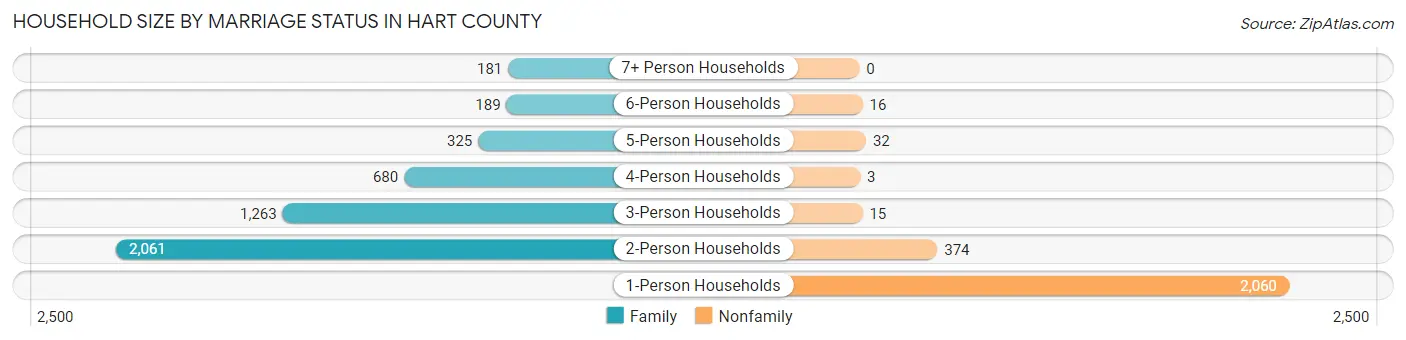
| Household Size | Family Households | Nonfamily Households |
| 1-Person Households | - | 2,060 (28.6%) |
| 2-Person Households | 2,061 (28.6%) | 374 (5.2%) |
| 3-Person Households | 1,263 (17.5%) | 15 (0.2%) |
| 4-Person Households | 680 (9.5%) | 3 (0.0%) |
| 5-Person Households | 325 (4.5%) | 32 (0.4%) |
| 6-Person Households | 189 (2.6%) | 16 (0.2%) |
| 7+ Person Households | 181 (2.5%) | 0 (0.0%) |
| Total | 4,699 (65.3%) | 2,500 (34.7%) |
Female Fertility in Hart County
Fertility by Age in Hart County
Average fertility rate in Hart County is 28.0 births per 1,000 women. Women in the age bracket of 20 to 34 years have the highest fertility rate with 50.0 births per 1,000 women. Women in the age bracket of 20 to 34 years acount for 74.3% of all women with births.
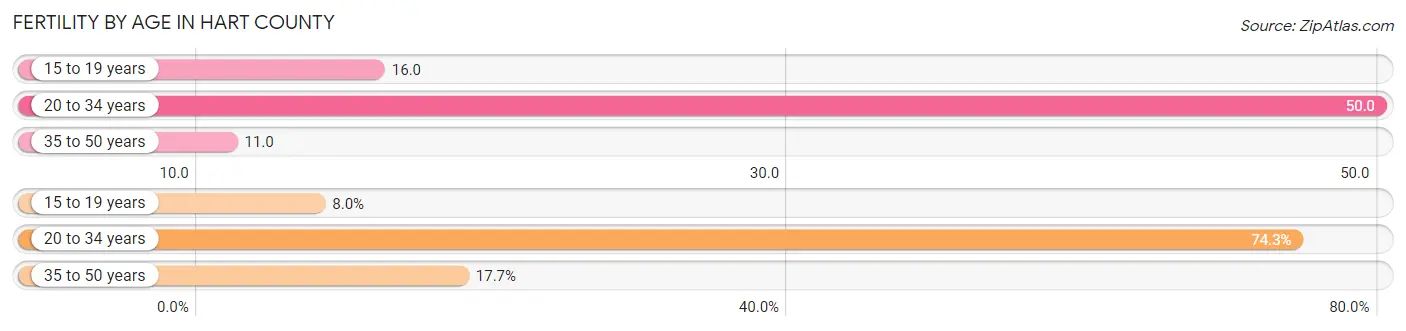
| Age Bracket | Women with Births | Births / 1,000 Women |
| 15 to 19 years | 9 (8.0%) | 16.0 |
| 20 to 34 years | 84 (74.3%) | 50.0 |
| 35 to 50 years | 20 (17.7%) | 11.0 |
| Total | 113 (100.0%) | 28.0 |
Fertility by Age by Marriage Status in Hart County
49.6% of women with births (113) in Hart County are married. The highest percentage of unmarried women with births falls into 15 to 19 years age bracket with 100.0% of them unmarried at the time of birth, while the lowest percentage of unmarried women with births belong to 35 to 50 years age bracket with 0.0% of them unmarried.
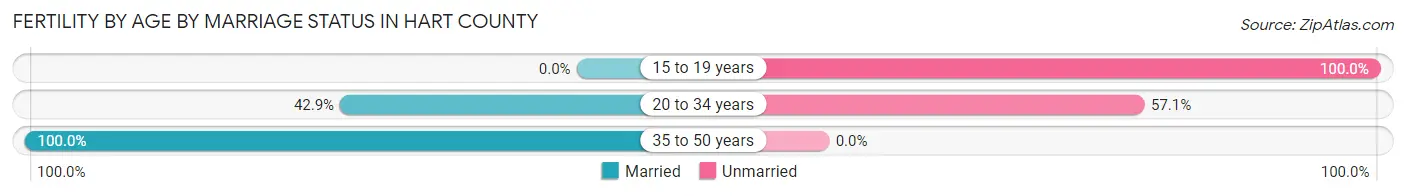
| Age Bracket | Married | Unmarried |
| 15 to 19 years | 0 (0.0%) | 9 (100.0%) |
| 20 to 34 years | 36 (42.9%) | 48 (57.1%) |
| 35 to 50 years | 20 (100.0%) | 0 (0.0%) |
| Total | 56 (49.6%) | 57 (50.4%) |
Fertility by Education in Hart County
Average fertility rate in Hart County is 28.0 births per 1,000 women. Women with the education attainment of bachelor's degree have the highest fertility rate of 120.0 births per 1,000 women, while women with the education attainment of high school diploma have the lowest fertility at 17.0 births per 1,000 women. Women with the education attainment of less than high school represent 28.3% of all women with births.
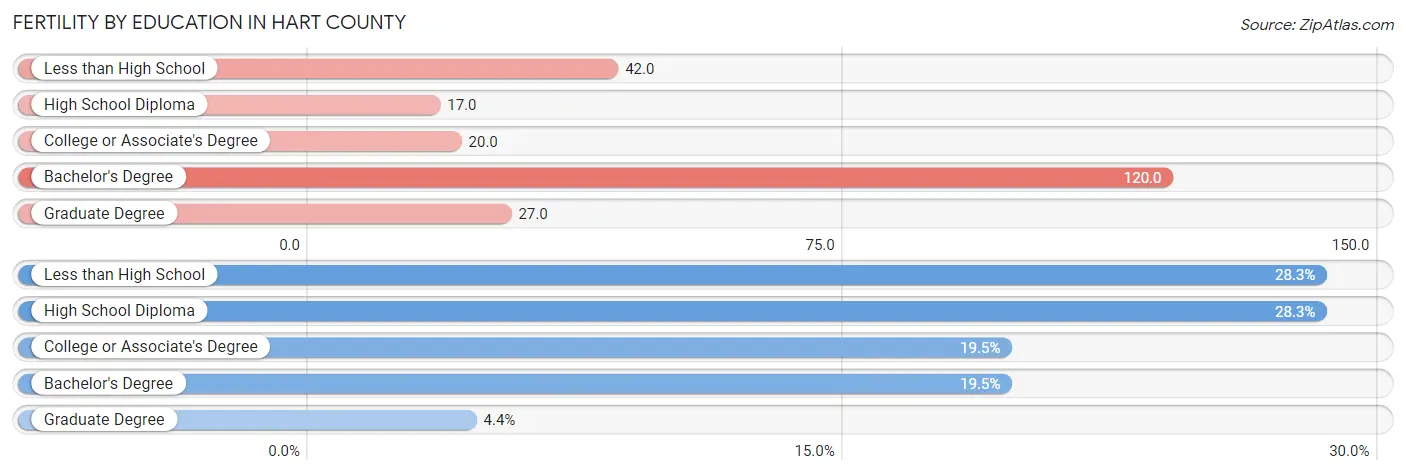
| Educational Attainment | Women with Births | Births / 1,000 Women |
| Less than High School | 32 (28.3%) | 42.0 |
| High School Diploma | 32 (28.3%) | 17.0 |
| College or Associate's Degree | 22 (19.5%) | 20.0 |
| Bachelor's Degree | 22 (19.5%) | 120.0 |
| Graduate Degree | 5 (4.4%) | 27.0 |
| Total | 113 (100.0%) | 28.0 |
Fertility by Education by Marriage Status in Hart County
50.4% of women with births in Hart County are unmarried. Women with the educational attainment of graduate degree are most likely to be married with 100.0% of them married at childbirth, while women with the educational attainment of college or associate's degree are least likely to be married with 77.3% of them unmarried at childbirth.
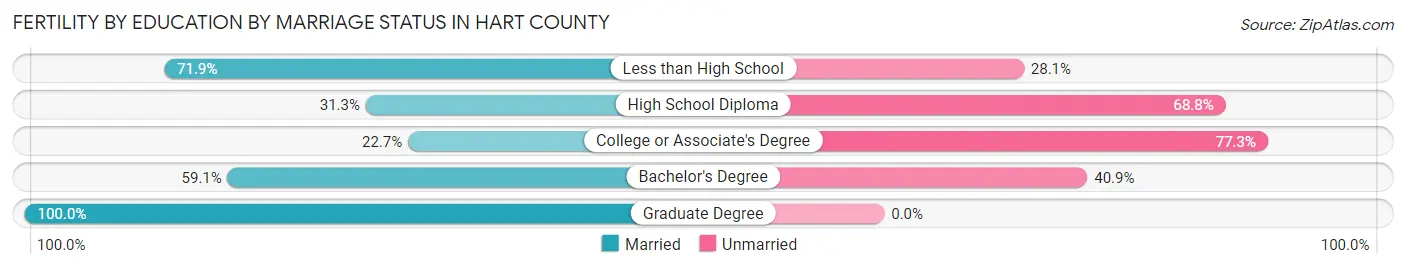
| Educational Attainment | Married | Unmarried |
| Less than High School | 23 (71.9%) | 9 (28.1%) |
| High School Diploma | 10 (31.2%) | 22 (68.8%) |
| College or Associate's Degree | 5 (22.7%) | 17 (77.3%) |
| Bachelor's Degree | 13 (59.1%) | 9 (40.9%) |
| Graduate Degree | 5 (100.0%) | 0 (0.0%) |
| Total | 56 (49.6%) | 57 (50.4%) |
Employment Characteristics in Hart County
Employment by Class of Employer in Hart County
Among the 7,675 employed individuals in Hart County, private company employees (5,557 | 72.4%), self-employed (not incorporated) (722 | 9.4%), and local government employees (465 | 6.1%) make up the most common classes of employment.
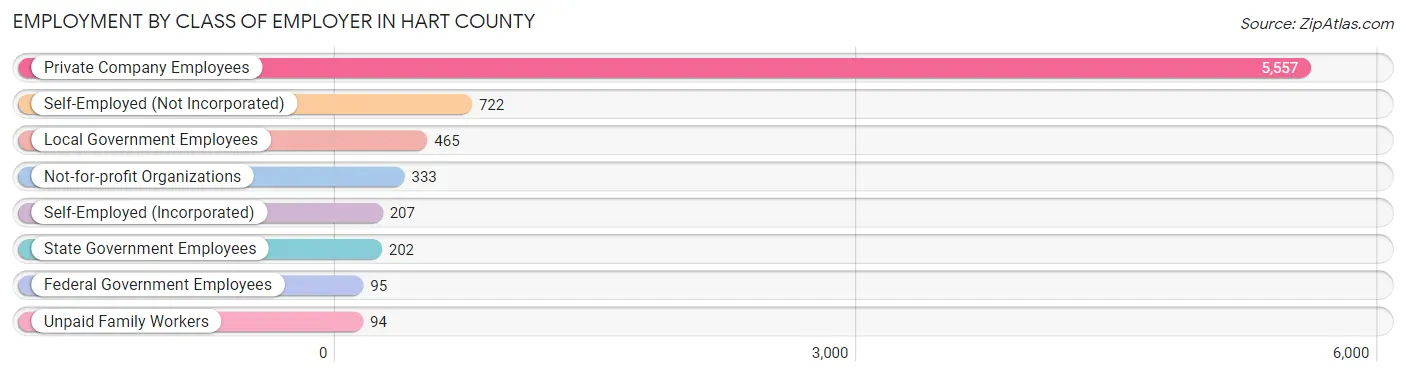
| Employer Class | # Employees | % Employees |
| Private Company Employees | 5,557 | 72.4% |
| Self-Employed (Incorporated) | 207 | 2.7% |
| Self-Employed (Not Incorporated) | 722 | 9.4% |
| Not-for-profit Organizations | 333 | 4.3% |
| Local Government Employees | 465 | 6.1% |
| State Government Employees | 202 | 2.6% |
| Federal Government Employees | 95 | 1.2% |
| Unpaid Family Workers | 94 | 1.2% |
| Total | 7,675 | 100.0% |
Employment Status by Age in Hart County
According to the labor force statistics for Hart County, out of the total population over 16 years of age (15,109), 54.1% or 8,174 individuals are in the labor force, with 3.5% or 286 of them unemployed. The age group with the highest labor force participation rate is 45 to 54 years, with 77.4% or 1,942 individuals in the labor force. Within the labor force, the 25 to 29 years age range has the highest percentage of unemployed individuals, with 6.1% or 53 of them being unemployed.
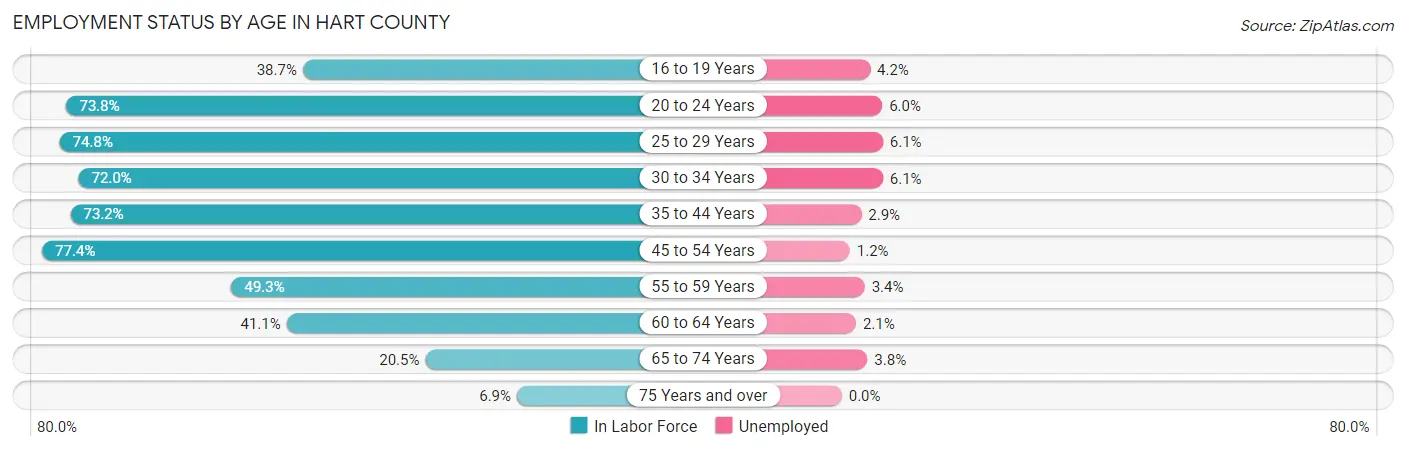
| Age Bracket | In Labor Force | Unemployed |
| 16 to 19 Years | 355 (38.7%) | 15 (4.2%) |
| 20 to 24 Years | 863 (73.8%) | 52 (6.0%) |
| 25 to 29 Years | 875 (74.8%) | 53 (6.1%) |
| 30 to 34 Years | 797 (72.0%) | 49 (6.1%) |
| 35 to 44 Years | 1,573 (73.2%) | 46 (2.9%) |
| 45 to 54 Years | 1,942 (77.4%) | 23 (1.2%) |
| 55 to 59 Years | 646 (49.3%) | 22 (3.4%) |
| 60 to 64 Years | 628 (41.1%) | 13 (2.1%) |
| 65 to 74 Years | 417 (20.5%) | 16 (3.8%) |
| 75 Years and over | 84 (6.9%) | 0 (0.0%) |
| Total | 8,174 (54.1%) | 286 (3.5%) |
Employment Status by Educational Attainment in Hart County
According to labor force statistics for Hart County, 66.1% of individuals (6,459) out of the total population between 25 and 64 years of age (9,772) are in the labor force, with 3.2% or 207 of them being unemployed. The group with the highest labor force participation rate are those with the educational attainment of bachelor's degree or higher, with 83.7% or 944 individuals in the labor force. Within the labor force, individuals with less than high school education have the highest percentage of unemployment, with 6.5% or 65 of them being unemployed.
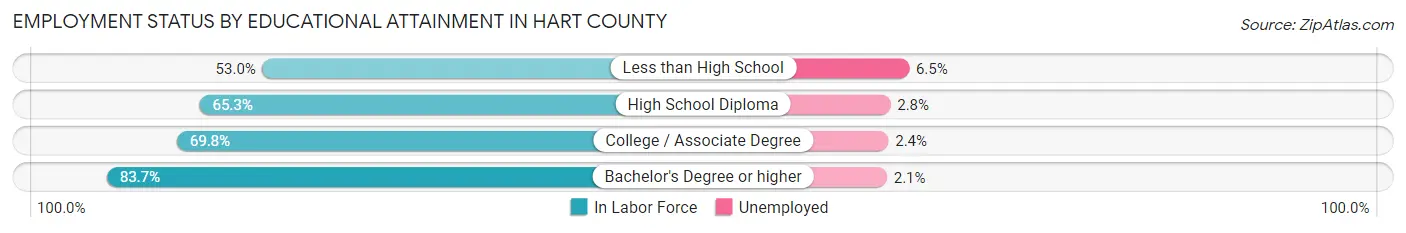
| Educational Attainment | In Labor Force | Unemployed |
| Less than High School | 1,007 (53.0%) | 124 (6.5%) |
| High School Diploma | 2,849 (65.3%) | 122 (2.8%) |
| College / Associate Degree | 1,662 (69.8%) | 57 (2.4%) |
| Bachelor's Degree or higher | 944 (83.7%) | 24 (2.1%) |
| Total | 6,459 (66.1%) | 313 (3.2%) |
Employment Occupations by Sex in Hart County
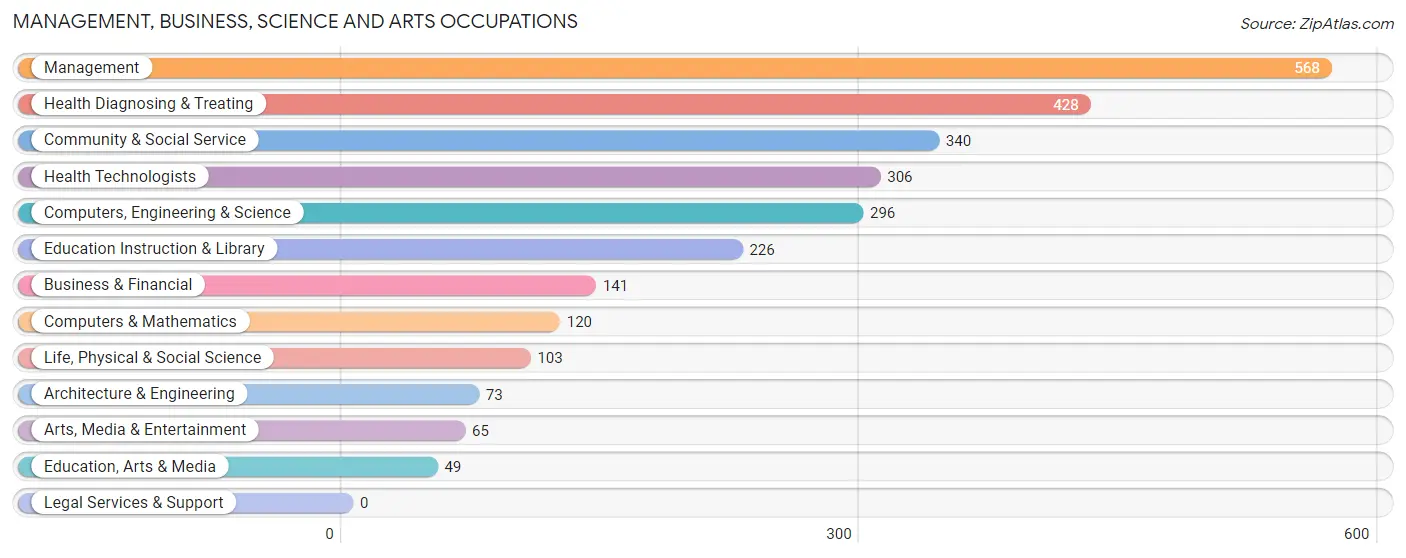
Management, Business, Science and Arts Occupations
The most common Management, Business, Science and Arts occupations in Hart County are Management (568 | 7.2%), Health Diagnosing & Treating (428 | 5.4%), Community & Social Service (340 | 4.3%), Health Technologists (306 | 3.9%), and Computers, Engineering & Science (296 | 3.7%).
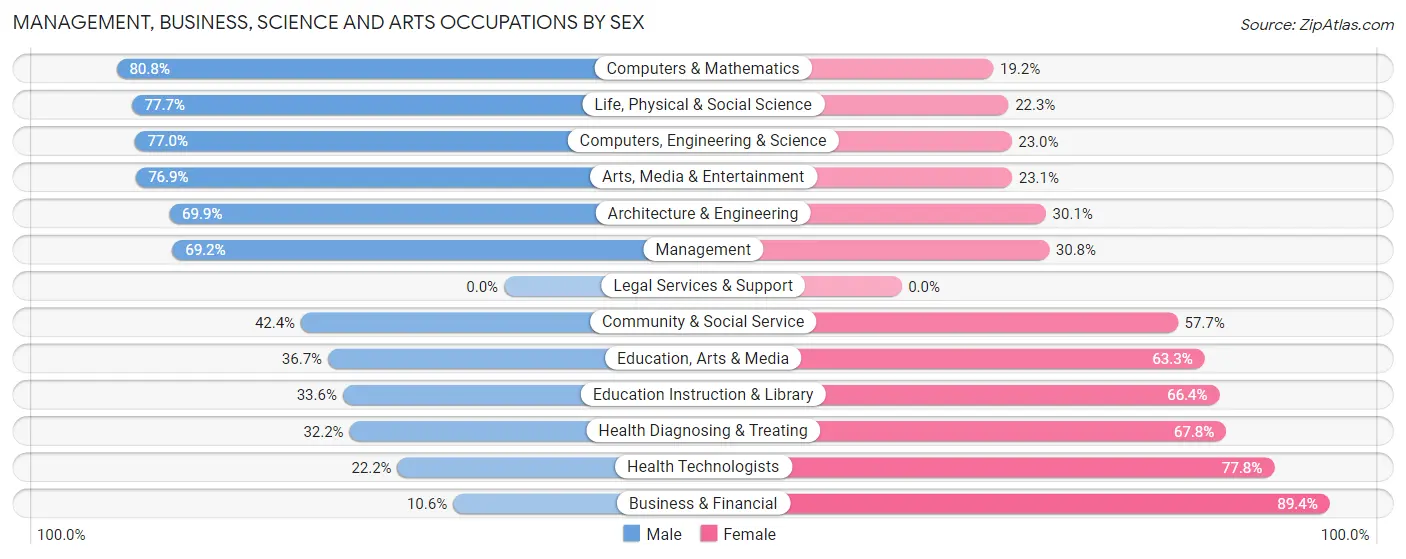
Management, Business, Science and Arts Occupations by Sex
Within the Management, Business, Science and Arts occupations in Hart County, the most male-oriented occupations are Computers & Mathematics (80.8%), Life, Physical & Social Science (77.7%), and Computers, Engineering & Science (77.0%), while the most female-oriented occupations are Business & Financial (89.4%), Health Technologists (77.8%), and Health Diagnosing & Treating (67.8%).
| Occupation | Male | Female |
| Management | 393 (69.2%) | 175 (30.8%) |
| Business & Financial | 15 (10.6%) | 126 (89.4%) |
| Computers, Engineering & Science | 228 (77.0%) | 68 (23.0%) |
| Computers & Mathematics | 97 (80.8%) | 23 (19.2%) |
| Architecture & Engineering | 51 (69.9%) | 22 (30.1%) |
| Life, Physical & Social Science | 80 (77.7%) | 23 (22.3%) |
| Community & Social Service | 144 (42.3%) | 196 (57.7%) |
| Education, Arts & Media | 18 (36.7%) | 31 (63.3%) |
| Legal Services & Support | 0 (0.0%) | 0 (0.0%) |
| Education Instruction & Library | 76 (33.6%) | 150 (66.4%) |
| Arts, Media & Entertainment | 50 (76.9%) | 15 (23.1%) |
| Health Diagnosing & Treating | 138 (32.2%) | 290 (67.8%) |
| Health Technologists | 68 (22.2%) | 238 (77.8%) |
| Total (Category) | 918 (51.8%) | 855 (48.2%) |
| Total (Overall) | 4,160 (52.7%) | 3,732 (47.3%) |
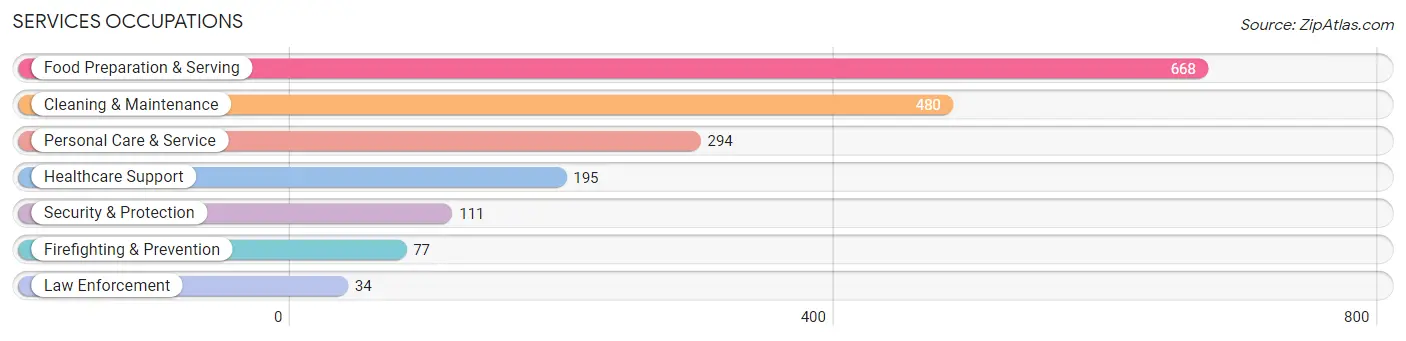
Services Occupations
The most common Services occupations in Hart County are Food Preparation & Serving (668 | 8.5%), Cleaning & Maintenance (480 | 6.1%), Personal Care & Service (294 | 3.7%), Healthcare Support (195 | 2.5%), and Security & Protection (111 | 1.4%).
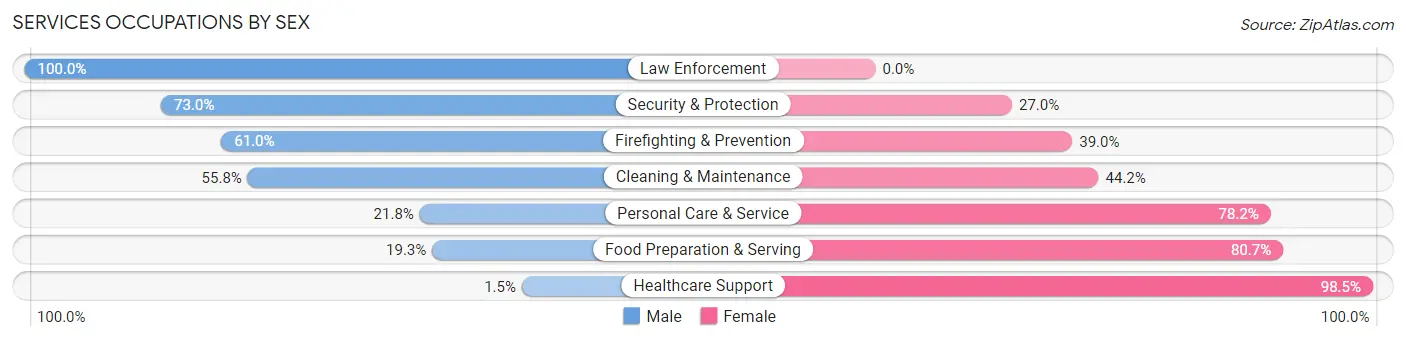
Services Occupations by Sex
Within the Services occupations in Hart County, the most male-oriented occupations are Law Enforcement (100.0%), Security & Protection (73.0%), and Firefighting & Prevention (61.0%), while the most female-oriented occupations are Healthcare Support (98.5%), Food Preparation & Serving (80.7%), and Personal Care & Service (78.2%).
| Occupation | Male | Female |
| Healthcare Support | 3 (1.5%) | 192 (98.5%) |
| Security & Protection | 81 (73.0%) | 30 (27.0%) |
| Firefighting & Prevention | 47 (61.0%) | 30 (39.0%) |
| Law Enforcement | 34 (100.0%) | 0 (0.0%) |
| Food Preparation & Serving | 129 (19.3%) | 539 (80.7%) |
| Cleaning & Maintenance | 268 (55.8%) | 212 (44.2%) |
| Personal Care & Service | 64 (21.8%) | 230 (78.2%) |
| Total (Category) | 545 (31.2%) | 1,203 (68.8%) |
| Total (Overall) | 4,160 (52.7%) | 3,732 (47.3%) |
Sales and Office Occupations
The most common Sales and Office occupations in Hart County are Office & Administration (729 | 9.2%), and Sales & Related (649 | 8.2%).
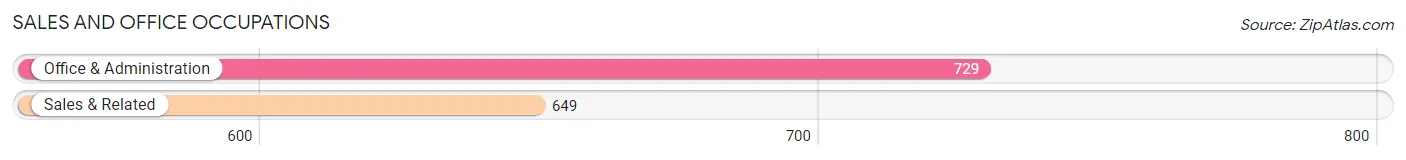
Sales and Office Occupations by Sex
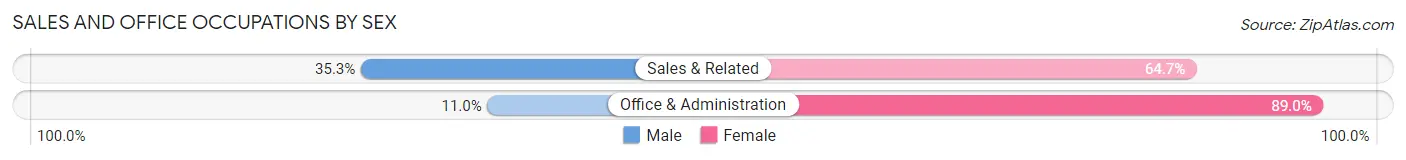
| Occupation | Male | Female |
| Sales & Related | 229 (35.3%) | 420 (64.7%) |
| Office & Administration | 80 (11.0%) | 649 (89.0%) |
| Total (Category) | 309 (22.4%) | 1,069 (77.6%) |
| Total (Overall) | 4,160 (52.7%) | 3,732 (47.3%) |
Natural Resources, Construction and Maintenance Occupations
The most common Natural Resources, Construction and Maintenance occupations in Hart County are Installation, Maintenance & Repair (610 | 7.7%), Construction & Extraction (441 | 5.6%), and Farming, Fishing & Forestry (114 | 1.4%).
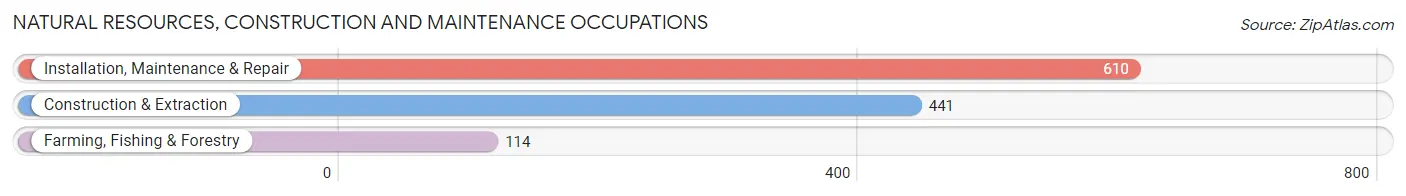
Natural Resources, Construction and Maintenance Occupations by Sex
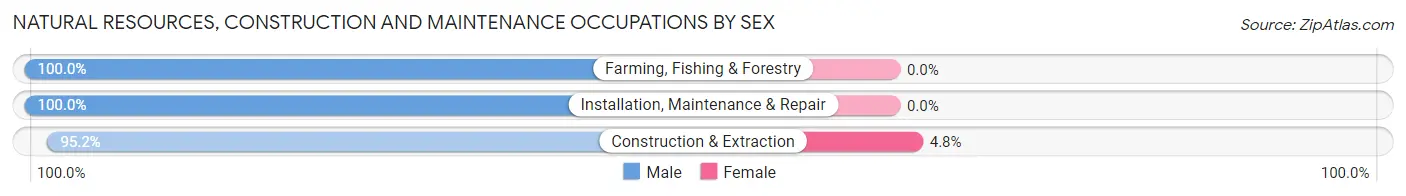
| Occupation | Male | Female |
| Farming, Fishing & Forestry | 114 (100.0%) | 0 (0.0%) |
| Construction & Extraction | 420 (95.2%) | 21 (4.8%) |
| Installation, Maintenance & Repair | 610 (100.0%) | 0 (0.0%) |
| Total (Category) | 1,144 (98.2%) | 21 (1.8%) |
| Total (Overall) | 4,160 (52.7%) | 3,732 (47.3%) |
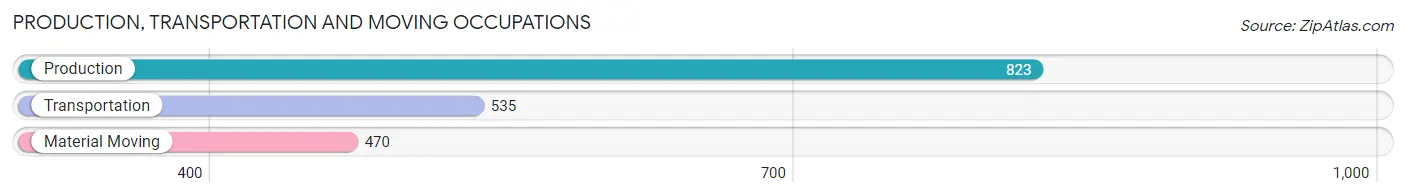
Production, Transportation and Moving Occupations
The most common Production, Transportation and Moving occupations in Hart County are Production (823 | 10.4%), Transportation (535 | 6.8%), and Material Moving (470 | 6.0%).
Production, Transportation and Moving Occupations by Sex
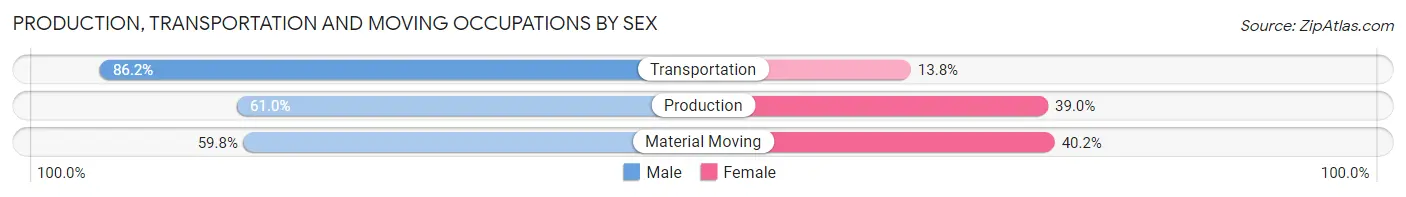
| Occupation | Male | Female |
| Production | 502 (61.0%) | 321 (39.0%) |
| Transportation | 461 (86.2%) | 74 (13.8%) |
| Material Moving | 281 (59.8%) | 189 (40.2%) |
| Total (Category) | 1,244 (68.0%) | 584 (32.0%) |
| Total (Overall) | 4,160 (52.7%) | 3,732 (47.3%) |
Employment Industries by Sex in Hart County
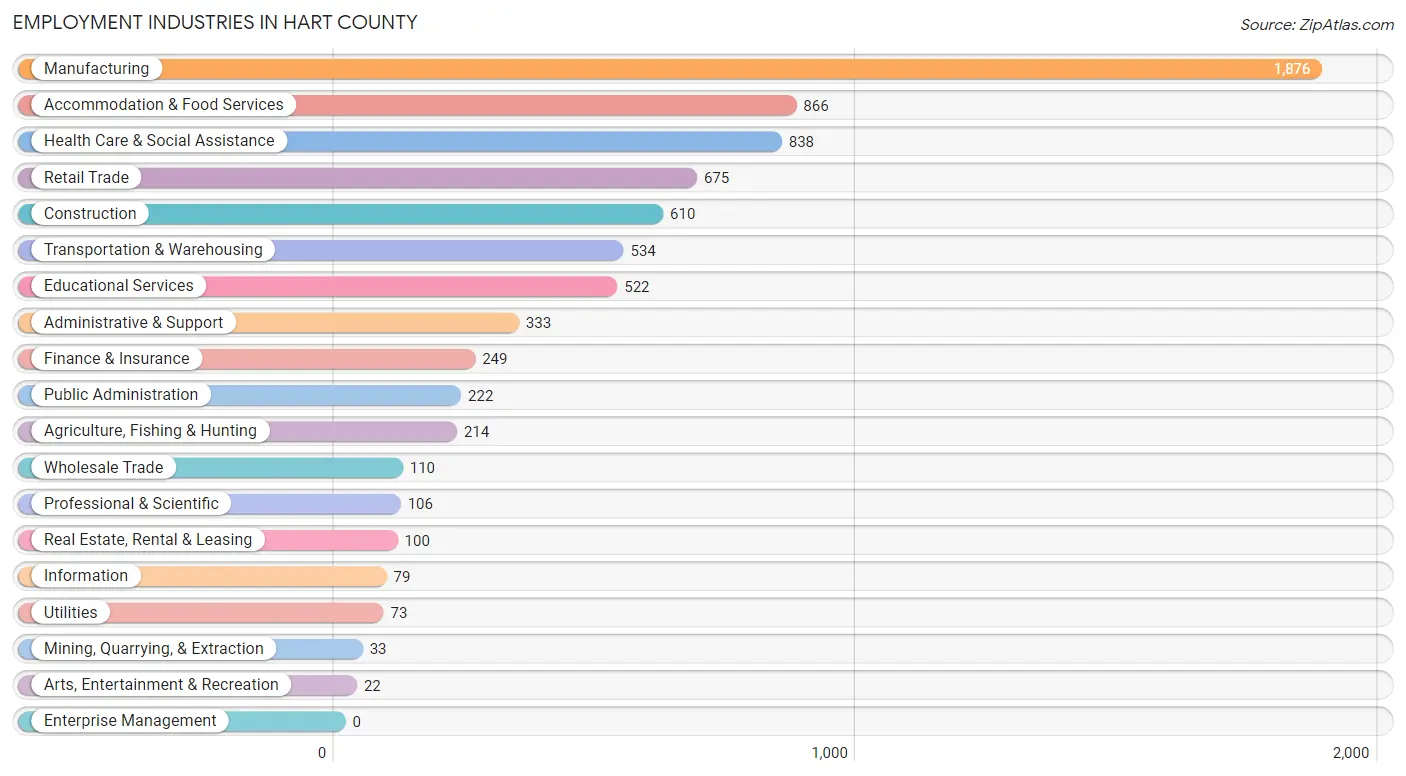
Employment Industries in Hart County
The major employment industries in Hart County include Manufacturing (1,876 | 23.8%), Accommodation & Food Services (866 | 11.0%), Health Care & Social Assistance (838 | 10.6%), Retail Trade (675 | 8.6%), and Construction (610 | 7.7%).
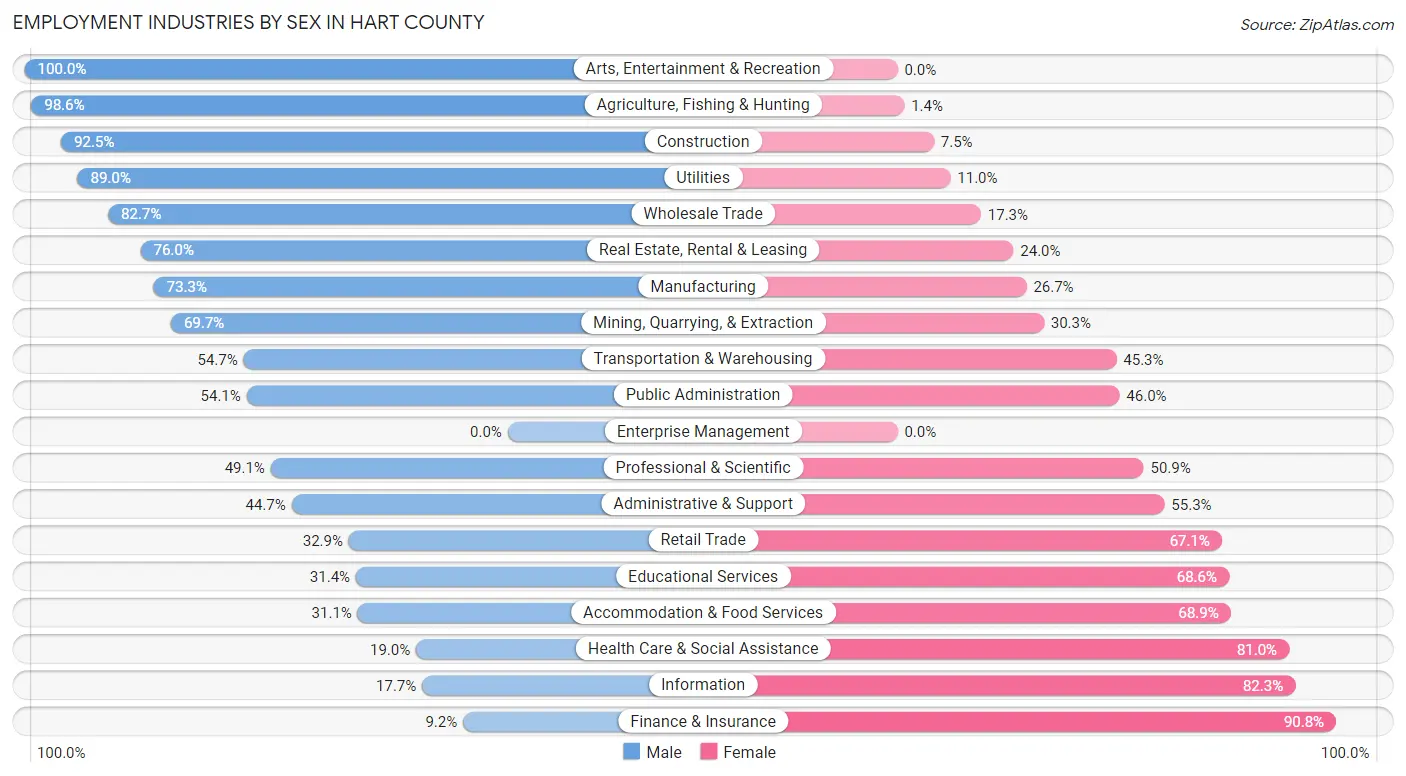
Employment Industries by Sex in Hart County
The Hart County industries that see more men than women are Arts, Entertainment & Recreation (100.0%), Agriculture, Fishing & Hunting (98.6%), and Construction (92.5%), whereas the industries that tend to have a higher number of women are Finance & Insurance (90.8%), Information (82.3%), and Health Care & Social Assistance (81.0%).
| Industry | Male | Female |
| Agriculture, Fishing & Hunting | 211 (98.6%) | 3 (1.4%) |
| Mining, Quarrying, & Extraction | 23 (69.7%) | 10 (30.3%) |
| Construction | 564 (92.5%) | 46 (7.5%) |
| Manufacturing | 1,375 (73.3%) | 501 (26.7%) |
| Wholesale Trade | 91 (82.7%) | 19 (17.3%) |
| Retail Trade | 222 (32.9%) | 453 (67.1%) |
| Transportation & Warehousing | 292 (54.7%) | 242 (45.3%) |
| Utilities | 65 (89.0%) | 8 (11.0%) |
| Information | 14 (17.7%) | 65 (82.3%) |
| Finance & Insurance | 23 (9.2%) | 226 (90.8%) |
| Real Estate, Rental & Leasing | 76 (76.0%) | 24 (24.0%) |
| Professional & Scientific | 52 (49.1%) | 54 (50.9%) |
| Enterprise Management | 0 (0.0%) | 0 (0.0%) |
| Administrative & Support | 149 (44.7%) | 184 (55.3%) |
| Educational Services | 164 (31.4%) | 358 (68.6%) |
| Health Care & Social Assistance | 159 (19.0%) | 679 (81.0%) |
| Arts, Entertainment & Recreation | 22 (100.0%) | 0 (0.0%) |
| Accommodation & Food Services | 269 (31.1%) | 597 (68.9%) |
| Public Administration | 120 (54.0%) | 102 (46.0%) |
| Total | 4,160 (52.7%) | 3,732 (47.3%) |
Education in Hart County
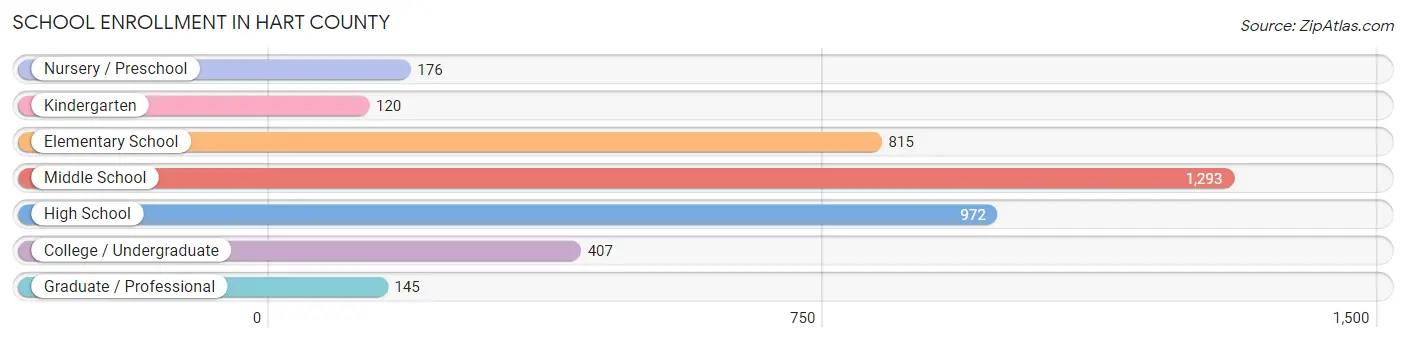
School Enrollment in Hart County
The most common levels of schooling among the 3,928 students in Hart County are middle school (1,293 | 32.9%), high school (972 | 24.7%), and elementary school (815 | 20.7%).
| School Level | # Students | % Students |
| Nursery / Preschool | 176 | 4.5% |
| Kindergarten | 120 | 3.0% |
| Elementary School | 815 | 20.7% |
| Middle School | 1,293 | 32.9% |
| High School | 972 | 24.7% |
| College / Undergraduate | 407 | 10.4% |
| Graduate / Professional | 145 | 3.7% |
| Total | 3,928 | 100.0% |
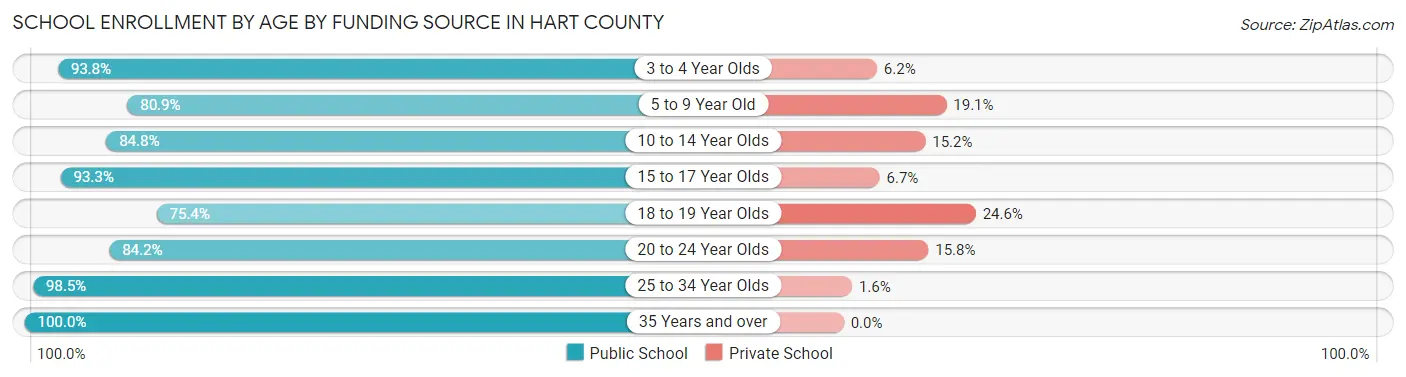
School Enrollment by Age by Funding Source in Hart County
Out of a total of 3,928 students who are enrolled in schools in Hart County, 530 (13.5%) attend a private institution, while the remaining 3,398 (86.5%) are enrolled in public schools. The age group of 18 to 19 year olds has the highest likelihood of being enrolled in private schools, with 30 (24.6% in the age bracket) enrolled. Conversely, the age group of 35 years and over has the lowest likelihood of being enrolled in a private school, with 69 (100.0% in the age bracket) attending a public institution.
| Age Bracket | Public School | Private School |
| 3 to 4 Year Olds | 91 (93.8%) | 6 (6.2%) |
| 5 to 9 Year Old | 727 (80.9%) | 172 (19.1%) |
| 10 to 14 Year Olds | 1,271 (84.8%) | 228 (15.2%) |
| 15 to 17 Year Olds | 753 (93.3%) | 54 (6.7%) |
| 18 to 19 Year Olds | 92 (75.4%) | 30 (24.6%) |
| 20 to 24 Year Olds | 203 (84.2%) | 38 (15.8%) |
| 25 to 34 Year Olds | 191 (98.5%) | 3 (1.5%) |
| 35 Years and over | 69 (100.0%) | 0 (0.0%) |
| Total | 3,398 (86.5%) | 530 (13.5%) |
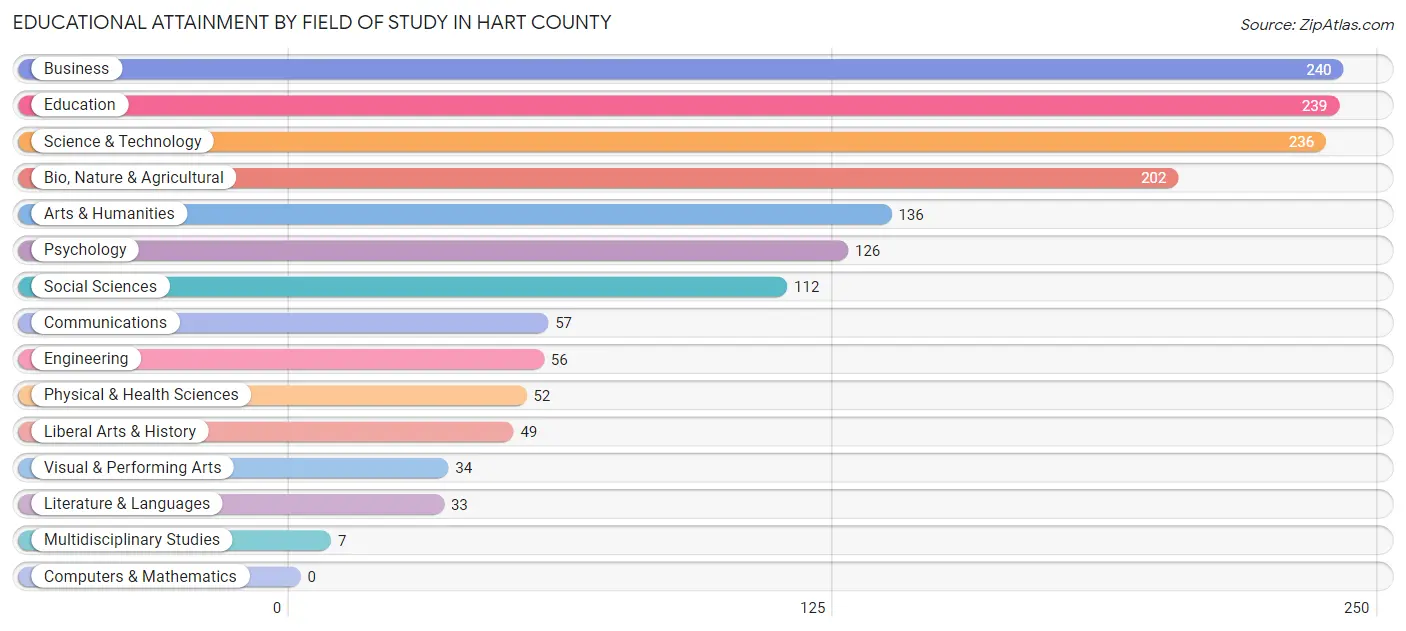
Educational Attainment by Field of Study in Hart County
Business (240 | 15.2%), education (239 | 15.1%), science & technology (236 | 14.9%), bio, nature & agricultural (202 | 12.8%), and arts & humanities (136 | 8.6%) are the most common fields of study among 1,579 individuals in Hart County who have obtained a bachelor's degree or higher.
| Field of Study | # Graduates | % Graduates |
| Computers & Mathematics | 0 | 0.0% |
| Bio, Nature & Agricultural | 202 | 12.8% |
| Physical & Health Sciences | 52 | 3.3% |
| Psychology | 126 | 8.0% |
| Social Sciences | 112 | 7.1% |
| Engineering | 56 | 3.5% |
| Multidisciplinary Studies | 7 | 0.4% |
| Science & Technology | 236 | 14.9% |
| Business | 240 | 15.2% |
| Education | 239 | 15.1% |
| Literature & Languages | 33 | 2.1% |
| Liberal Arts & History | 49 | 3.1% |
| Visual & Performing Arts | 34 | 2.1% |
| Communications | 57 | 3.6% |
| Arts & Humanities | 136 | 8.6% |
| Total | 1,579 | 100.0% |
Transportation & Commute in Hart County
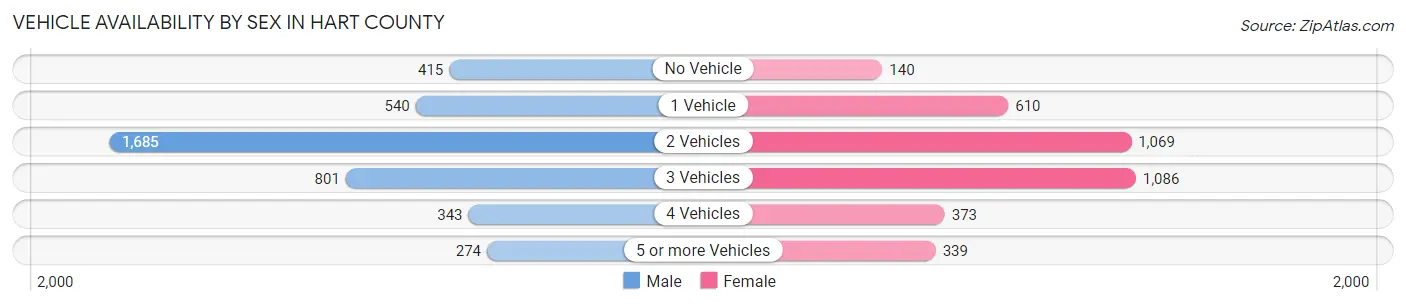
Vehicle Availability by Sex in Hart County
The most prevalent vehicle ownership categories in Hart County are males with 2 vehicles (1,685, accounting for 41.5%) and females with 2 vehicles (1,069, making up 46.6%).
| Vehicles Available | Male | Female |
| No Vehicle | 415 (10.2%) | 140 (3.9%) |
| 1 Vehicle | 540 (13.3%) | 610 (16.9%) |
| 2 Vehicles | 1,685 (41.5%) | 1,069 (29.5%) |
| 3 Vehicles | 801 (19.7%) | 1,086 (30.0%) |
| 4 Vehicles | 343 (8.5%) | 373 (10.3%) |
| 5 or more Vehicles | 274 (6.8%) | 339 (9.4%) |
| Total | 4,058 (100.0%) | 3,617 (100.0%) |
Commute Time in Hart County
The most frequently occuring commute durations in Hart County are 10 to 14 minutes (1,040 commuters, 14.1%), 15 to 19 minutes (931 commuters, 12.6%), and 20 to 24 minutes (782 commuters, 10.6%).
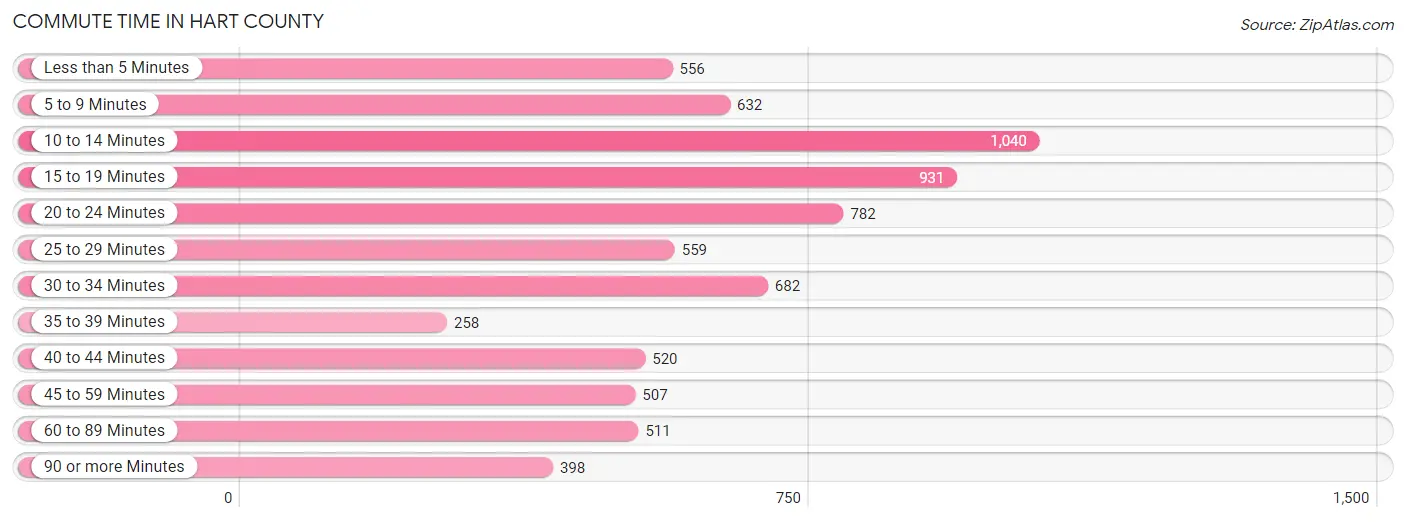
| Commute Time | # Commuters | % Commuters |
| Less than 5 Minutes | 556 | 7.5% |
| 5 to 9 Minutes | 632 | 8.6% |
| 10 to 14 Minutes | 1,040 | 14.1% |
| 15 to 19 Minutes | 931 | 12.6% |
| 20 to 24 Minutes | 782 | 10.6% |
| 25 to 29 Minutes | 559 | 7.6% |
| 30 to 34 Minutes | 682 | 9.2% |
| 35 to 39 Minutes | 258 | 3.5% |
| 40 to 44 Minutes | 520 | 7.0% |
| 45 to 59 Minutes | 507 | 6.9% |
| 60 to 89 Minutes | 511 | 6.9% |
| 90 or more Minutes | 398 | 5.4% |
Commute Time by Sex in Hart County
The most common commute times in Hart County are 10 to 14 minutes (536 commuters, 13.7%) for males and 15 to 19 minutes (525 commuters, 15.1%) for females.
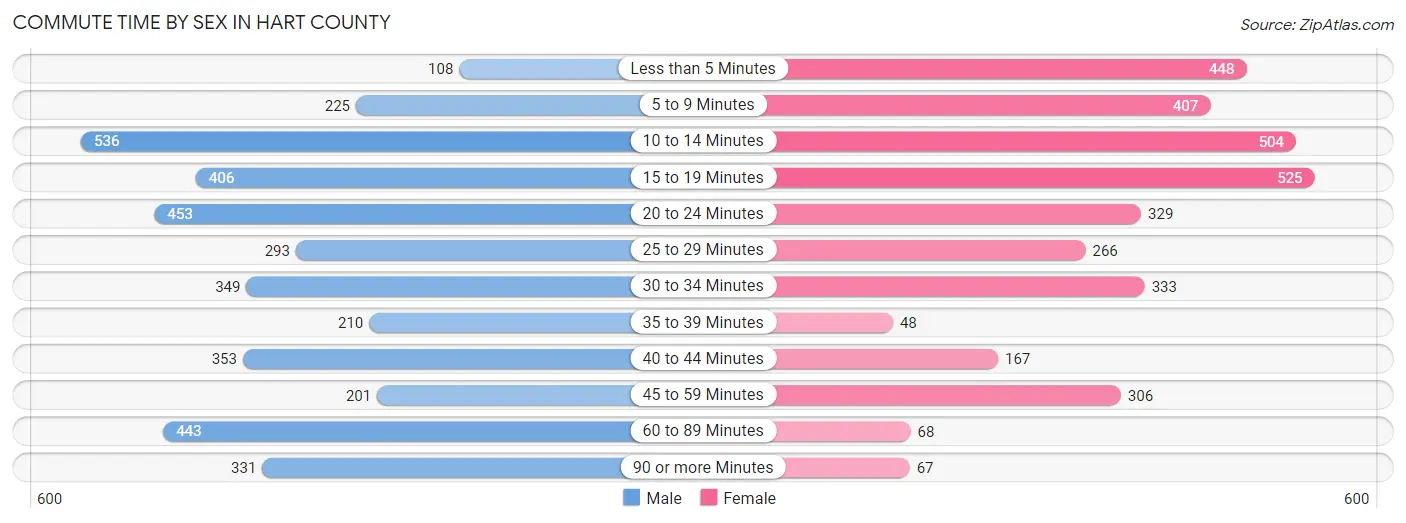
| Commute Time | Male | Female |
| Less than 5 Minutes | 108 (2.8%) | 448 (12.9%) |
| 5 to 9 Minutes | 225 (5.8%) | 407 (11.7%) |
| 10 to 14 Minutes | 536 (13.7%) | 504 (14.5%) |
| 15 to 19 Minutes | 406 (10.4%) | 525 (15.1%) |
| 20 to 24 Minutes | 453 (11.6%) | 329 (9.5%) |
| 25 to 29 Minutes | 293 (7.5%) | 266 (7.7%) |
| 30 to 34 Minutes | 349 (8.9%) | 333 (9.6%) |
| 35 to 39 Minutes | 210 (5.4%) | 48 (1.4%) |
| 40 to 44 Minutes | 353 (9.0%) | 167 (4.8%) |
| 45 to 59 Minutes | 201 (5.1%) | 306 (8.8%) |
| 60 to 89 Minutes | 443 (11.3%) | 68 (2.0%) |
| 90 or more Minutes | 331 (8.5%) | 67 (1.9%) |
Time of Departure to Work by Sex in Hart County
The most frequent times of departure to work in Hart County are 6:00 AM to 6:29 AM (874, 22.4%) for males and 7:00 AM to 7:29 AM (681, 19.6%) for females.
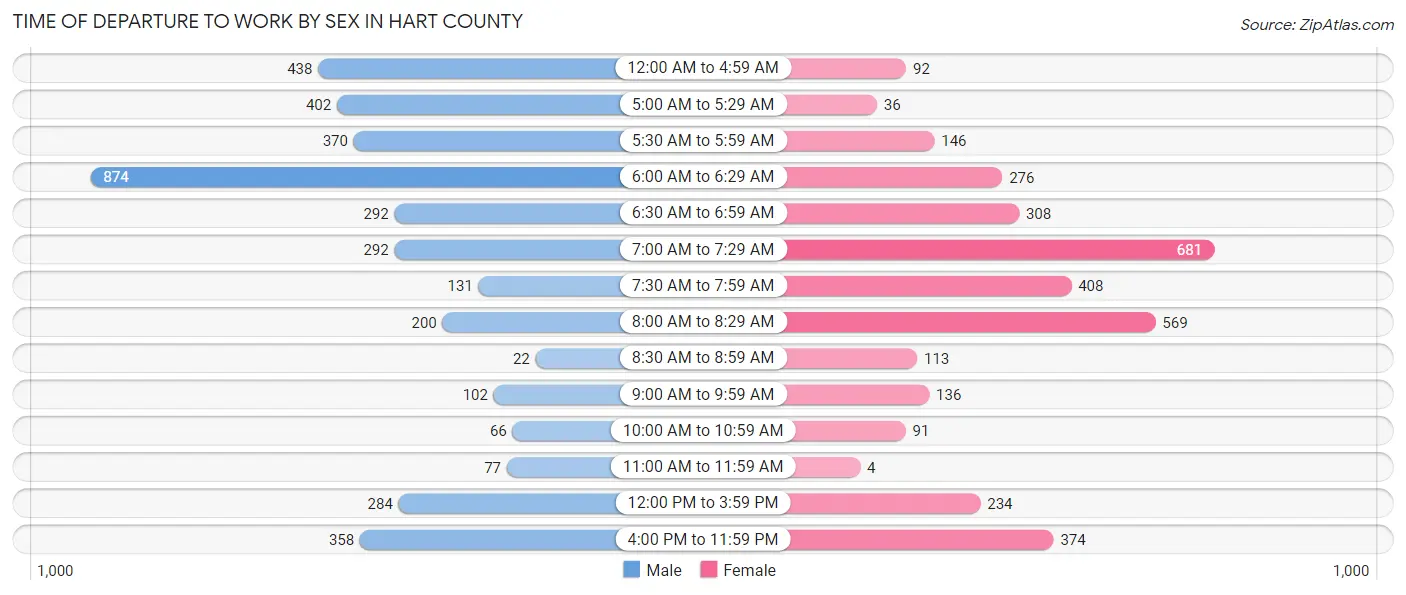
| Time of Departure | Male | Female |
| 12:00 AM to 4:59 AM | 438 (11.2%) | 92 (2.6%) |
| 5:00 AM to 5:29 AM | 402 (10.3%) | 36 (1.0%) |
| 5:30 AM to 5:59 AM | 370 (9.5%) | 146 (4.2%) |
| 6:00 AM to 6:29 AM | 874 (22.4%) | 276 (8.0%) |
| 6:30 AM to 6:59 AM | 292 (7.5%) | 308 (8.9%) |
| 7:00 AM to 7:29 AM | 292 (7.5%) | 681 (19.6%) |
| 7:30 AM to 7:59 AM | 131 (3.4%) | 408 (11.8%) |
| 8:00 AM to 8:29 AM | 200 (5.1%) | 569 (16.4%) |
| 8:30 AM to 8:59 AM | 22 (0.6%) | 113 (3.3%) |
| 9:00 AM to 9:59 AM | 102 (2.6%) | 136 (3.9%) |
| 10:00 AM to 10:59 AM | 66 (1.7%) | 91 (2.6%) |
| 11:00 AM to 11:59 AM | 77 (2.0%) | 4 (0.1%) |
| 12:00 PM to 3:59 PM | 284 (7.3%) | 234 (6.8%) |
| 4:00 PM to 11:59 PM | 358 (9.2%) | 374 (10.8%) |
| Total | 3,908 (100.0%) | 3,468 (100.0%) |
Housing Occupancy in Hart County
Occupancy by Ownership in Hart County
Of the total 7,199 dwellings in Hart County, owner-occupied units account for 5,306 (73.7%), while renter-occupied units make up 1,893 (26.3%).
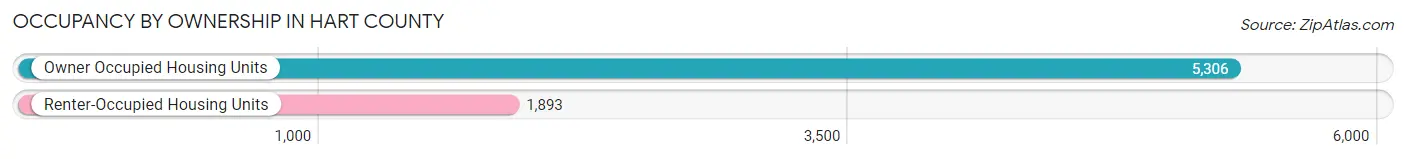
| Occupancy | # Housing Units | % Housing Units |
| Owner Occupied Housing Units | 5,306 | 73.7% |
| Renter-Occupied Housing Units | 1,893 | 26.3% |
| Total Occupied Housing Units | 7,199 | 100.0% |
Occupancy by Household Size in Hart County
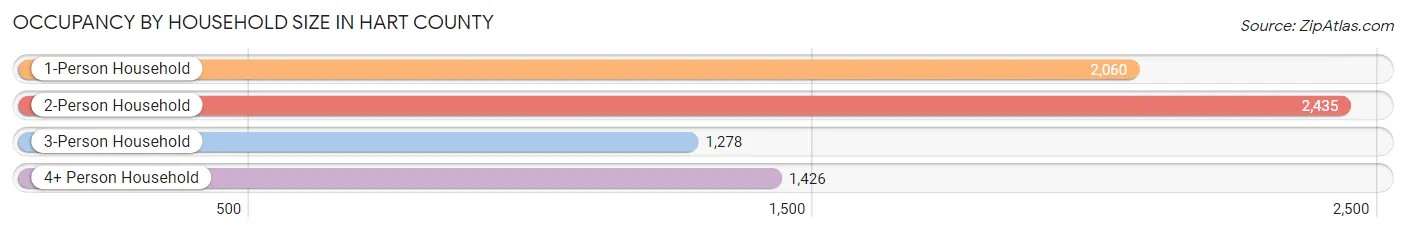
| Household Size | # Housing Units | % Housing Units |
| 1-Person Household | 2,060 | 28.6% |
| 2-Person Household | 2,435 | 33.8% |
| 3-Person Household | 1,278 | 17.7% |
| 4+ Person Household | 1,426 | 19.8% |
| Total Housing Units | 7,199 | 100.0% |
Occupancy by Ownership by Household Size in Hart County
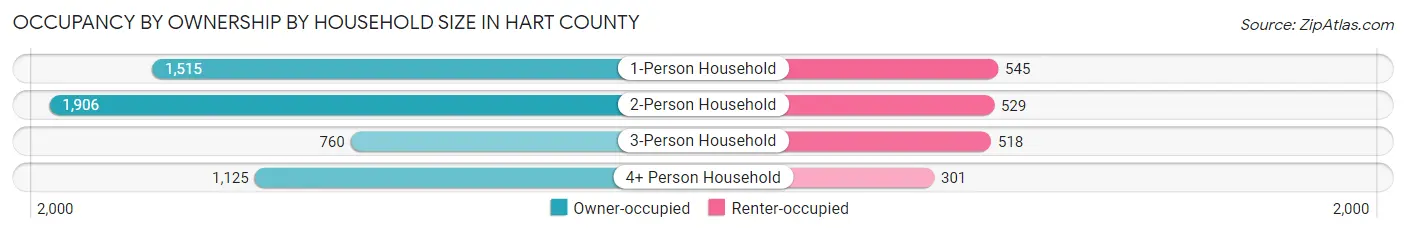
| Household Size | Owner-occupied | Renter-occupied |
| 1-Person Household | 1,515 (73.5%) | 545 (26.5%) |
| 2-Person Household | 1,906 (78.3%) | 529 (21.7%) |
| 3-Person Household | 760 (59.5%) | 518 (40.5%) |
| 4+ Person Household | 1,125 (78.9%) | 301 (21.1%) |
| Total Housing Units | 5,306 (73.7%) | 1,893 (26.3%) |
Occupancy by Educational Attainment in Hart County
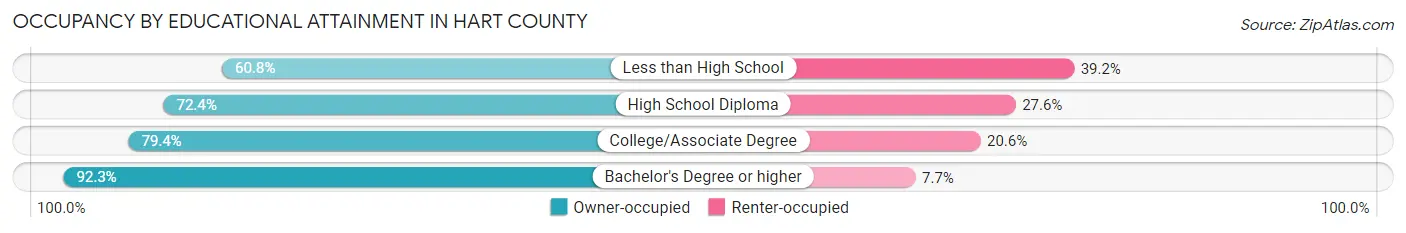
| Household Size | Owner-occupied | Renter-occupied |
| Less than High School | 926 (60.8%) | 596 (39.2%) |
| High School Diploma | 2,247 (72.4%) | 855 (27.6%) |
| College/Associate Degree | 1,499 (79.4%) | 389 (20.6%) |
| Bachelor's Degree or higher | 634 (92.3%) | 53 (7.7%) |
Occupancy by Age of Householder in Hart County
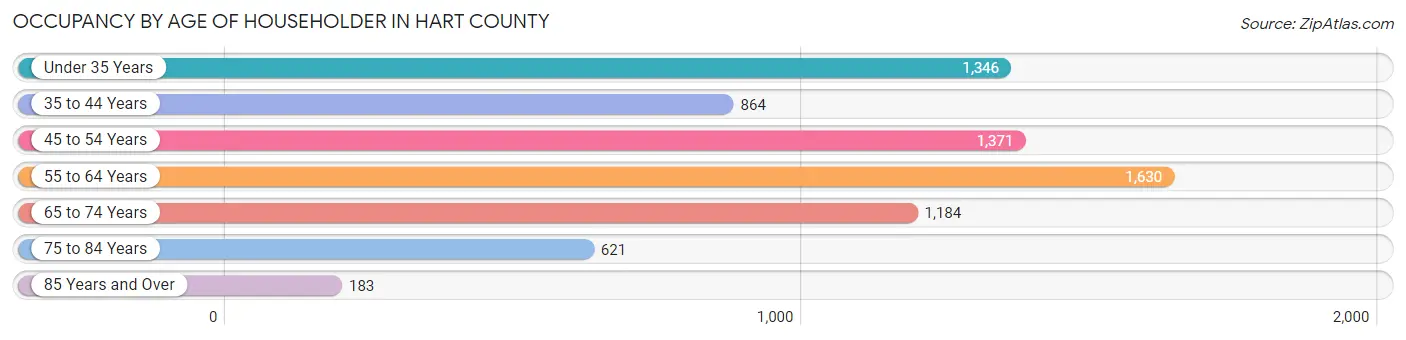
| Age Bracket | # Households | % Households |
| Under 35 Years | 1,346 | 18.7% |
| 35 to 44 Years | 864 | 12.0% |
| 45 to 54 Years | 1,371 | 19.0% |
| 55 to 64 Years | 1,630 | 22.6% |
| 65 to 74 Years | 1,184 | 16.5% |
| 75 to 84 Years | 621 | 8.6% |
| 85 Years and Over | 183 | 2.5% |
| Total | 7,199 | 100.0% |
Housing Finances in Hart County
Median Income by Occupancy in Hart County
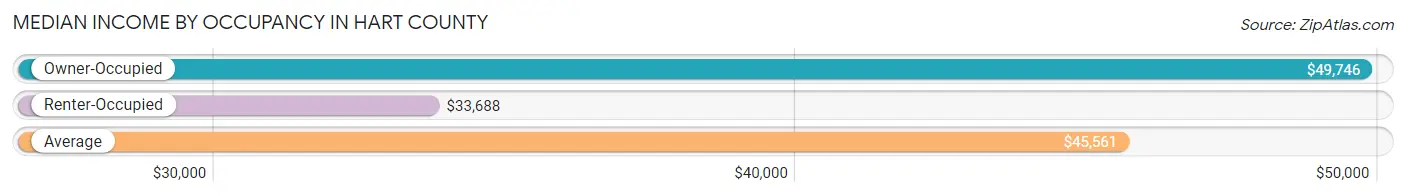
| Occupancy Type | # Households | Median Income |
| Owner-Occupied | 5,306 (73.7%) | $49,746 |
| Renter-Occupied | 1,893 (26.3%) | $33,688 |
| Average | 7,199 (100.0%) | $45,561 |
Occupancy by Householder Income Bracket in Hart County
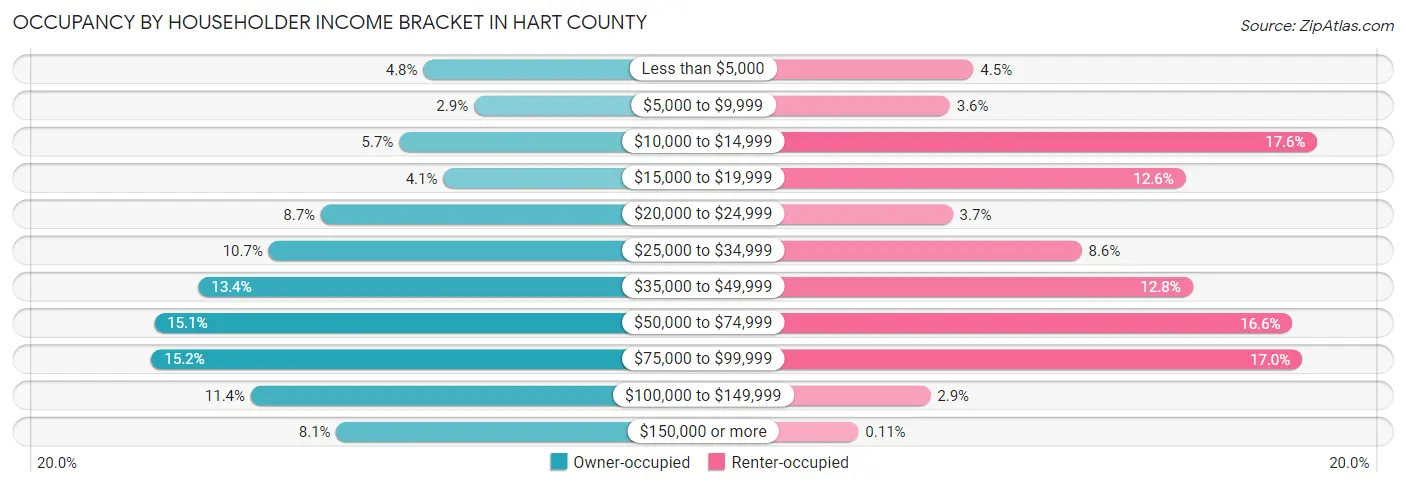
| Income Bracket | Owner-occupied | Renter-occupied |
| Less than $5,000 | 255 (4.8%) | 85 (4.5%) |
| $5,000 to $9,999 | 153 (2.9%) | 68 (3.6%) |
| $10,000 to $14,999 | 304 (5.7%) | 333 (17.6%) |
| $15,000 to $19,999 | 215 (4.1%) | 238 (12.6%) |
| $20,000 to $24,999 | 462 (8.7%) | 70 (3.7%) |
| $25,000 to $34,999 | 568 (10.7%) | 163 (8.6%) |
| $35,000 to $49,999 | 710 (13.4%) | 243 (12.8%) |
| $50,000 to $74,999 | 799 (15.1%) | 315 (16.6%) |
| $75,000 to $99,999 | 805 (15.2%) | 322 (17.0%) |
| $100,000 to $149,999 | 604 (11.4%) | 54 (2.9%) |
| $150,000 or more | 431 (8.1%) | 2 (0.1%) |
| Total | 5,306 (100.0%) | 1,893 (100.0%) |
Monthly Housing Cost Tiers in Hart County
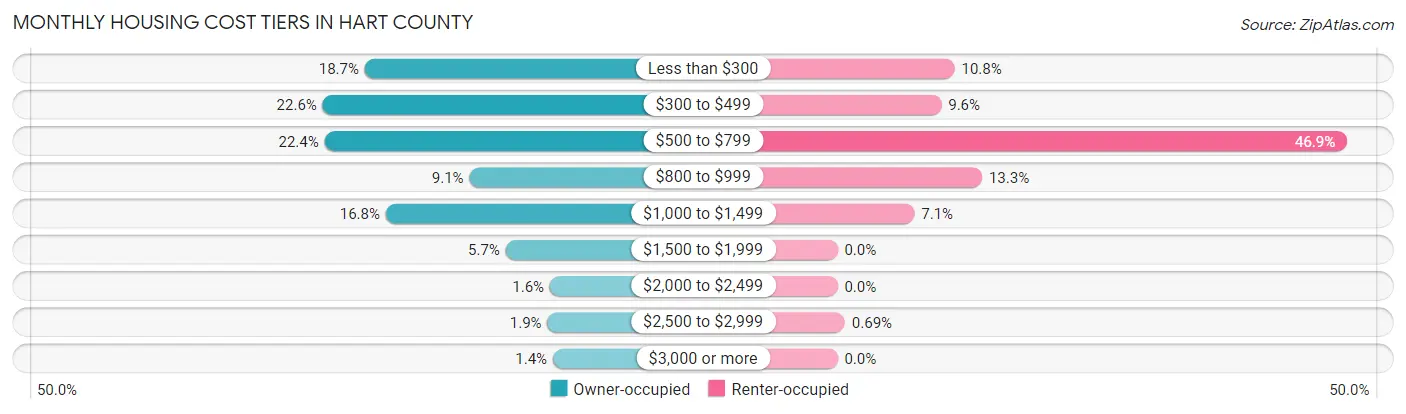
| Monthly Cost | Owner-occupied | Renter-occupied |
| Less than $300 | 991 (18.7%) | 204 (10.8%) |
| $300 to $499 | 1,197 (22.6%) | 181 (9.6%) |
| $500 to $799 | 1,188 (22.4%) | 888 (46.9%) |
| $800 to $999 | 480 (9.0%) | 252 (13.3%) |
| $1,000 to $1,499 | 889 (16.8%) | 134 (7.1%) |
| $1,500 to $1,999 | 303 (5.7%) | 0 (0.0%) |
| $2,000 to $2,499 | 87 (1.6%) | 0 (0.0%) |
| $2,500 to $2,999 | 99 (1.9%) | 13 (0.7%) |
| $3,000 or more | 72 (1.4%) | 0 (0.0%) |
| Total | 5,306 (100.0%) | 1,893 (100.0%) |
Physical Housing Characteristics in Hart County
Housing Structures in Hart County
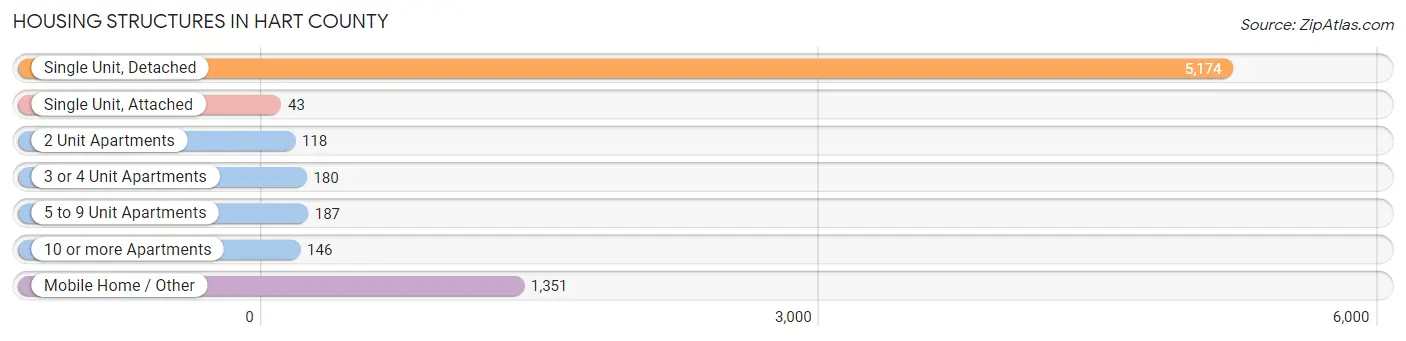
| Structure Type | # Housing Units | % Housing Units |
| Single Unit, Detached | 5,174 | 71.9% |
| Single Unit, Attached | 43 | 0.6% |
| 2 Unit Apartments | 118 | 1.6% |
| 3 or 4 Unit Apartments | 180 | 2.5% |
| 5 to 9 Unit Apartments | 187 | 2.6% |
| 10 or more Apartments | 146 | 2.0% |
| Mobile Home / Other | 1,351 | 18.8% |
| Total | 7,199 | 100.0% |
Housing Structures by Occupancy in Hart County
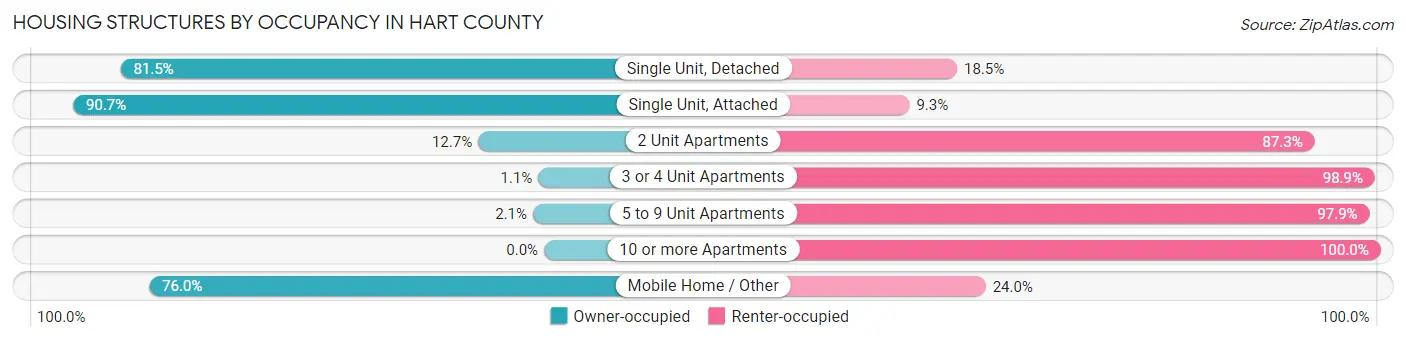
| Structure Type | Owner-occupied | Renter-occupied |
| Single Unit, Detached | 4,219 (81.5%) | 955 (18.5%) |
| Single Unit, Attached | 39 (90.7%) | 4 (9.3%) |
| 2 Unit Apartments | 15 (12.7%) | 103 (87.3%) |
| 3 or 4 Unit Apartments | 2 (1.1%) | 178 (98.9%) |
| 5 to 9 Unit Apartments | 4 (2.1%) | 183 (97.9%) |
| 10 or more Apartments | 0 (0.0%) | 146 (100.0%) |
| Mobile Home / Other | 1,027 (76.0%) | 324 (24.0%) |
| Total | 5,306 (73.7%) | 1,893 (26.3%) |
Housing Structures by Number of Rooms in Hart County
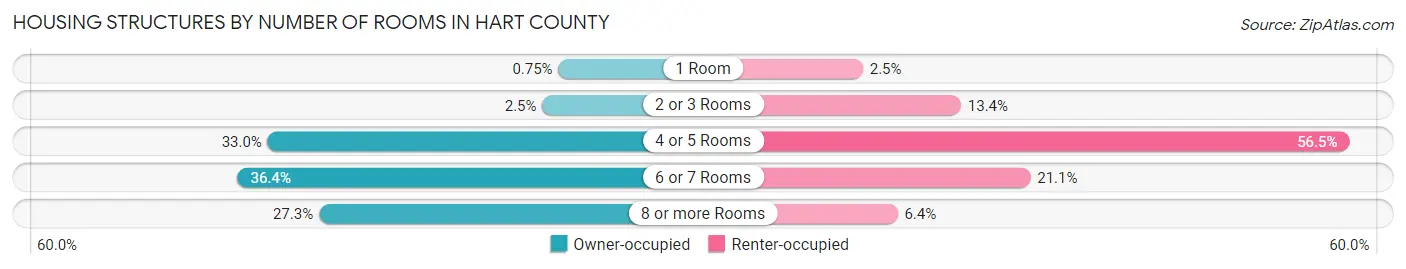
| Number of Rooms | Owner-occupied | Renter-occupied |
| 1 Room | 40 (0.7%) | 48 (2.5%) |
| 2 or 3 Rooms | 135 (2.5%) | 254 (13.4%) |
| 4 or 5 Rooms | 1,752 (33.0%) | 1,070 (56.5%) |
| 6 or 7 Rooms | 1,929 (36.4%) | 400 (21.1%) |
| 8 or more Rooms | 1,450 (27.3%) | 121 (6.4%) |
| Total | 5,306 (100.0%) | 1,893 (100.0%) |
Housing Structure by Heating Type in Hart County
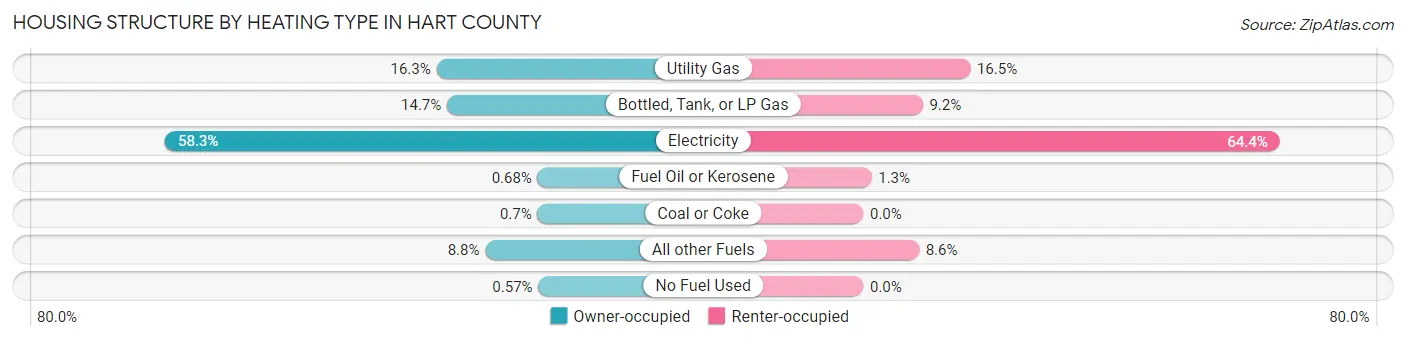
| Heating Type | Owner-occupied | Renter-occupied |
| Utility Gas | 866 (16.3%) | 313 (16.5%) |
| Bottled, Tank, or LP Gas | 779 (14.7%) | 174 (9.2%) |
| Electricity | 3,092 (58.3%) | 1,219 (64.4%) |
| Fuel Oil or Kerosene | 36 (0.7%) | 24 (1.3%) |
| Coal or Coke | 37 (0.7%) | 0 (0.0%) |
| All other Fuels | 466 (8.8%) | 163 (8.6%) |
| No Fuel Used | 30 (0.6%) | 0 (0.0%) |
| Total | 5,306 (100.0%) | 1,893 (100.0%) |
Household Vehicle Usage in Hart County
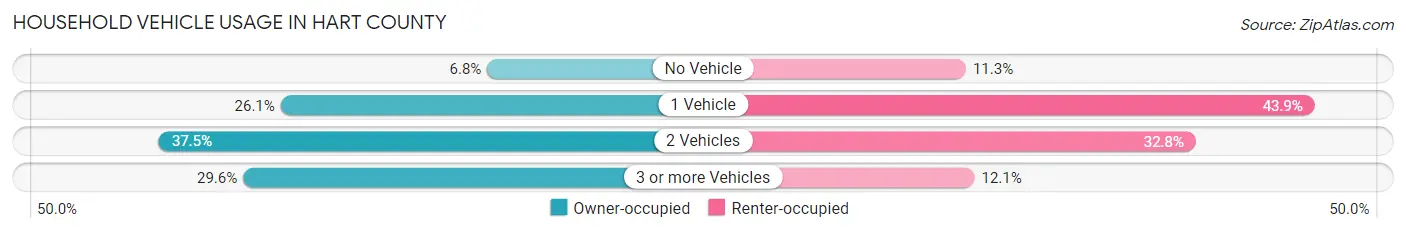
| Vehicles per Household | Owner-occupied | Renter-occupied |
| No Vehicle | 362 (6.8%) | 214 (11.3%) |
| 1 Vehicle | 1,385 (26.1%) | 830 (43.9%) |
| 2 Vehicles | 1,988 (37.5%) | 620 (32.8%) |
| 3 or more Vehicles | 1,571 (29.6%) | 229 (12.1%) |
| Total | 5,306 (100.0%) | 1,893 (100.0%) |
Real Estate & Mortgages in Hart County
Real Estate and Mortgage Overview in Hart County
| Characteristic | Without Mortgage | With Mortgage |
| Housing Units | 2,800 | 2,506 |
| Median Property Value | $98,800 | $133,800 |
| Median Household Income | $34,318 | $333 |
| Monthly Housing Costs | $359 | $72 |
| Real Estate Taxes | $530 | $49 |
Property Value by Mortgage Status in Hart County
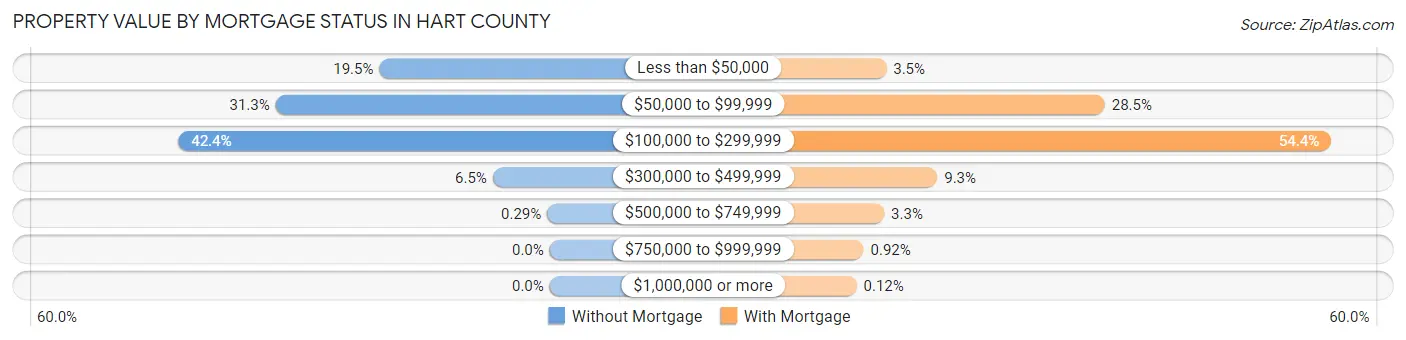
| Property Value | Without Mortgage | With Mortgage |
| Less than $50,000 | 545 (19.5%) | 88 (3.5%) |
| $50,000 to $99,999 | 877 (31.3%) | 714 (28.5%) |
| $100,000 to $299,999 | 1,188 (42.4%) | 1,362 (54.3%) |
| $300,000 to $499,999 | 182 (6.5%) | 234 (9.3%) |
| $500,000 to $749,999 | 8 (0.3%) | 82 (3.3%) |
| $750,000 to $999,999 | 0 (0.0%) | 23 (0.9%) |
| $1,000,000 or more | 0 (0.0%) | 3 (0.1%) |
| Total | 2,800 (100.0%) | 2,506 (100.0%) |
Household Income by Mortgage Status in Hart County
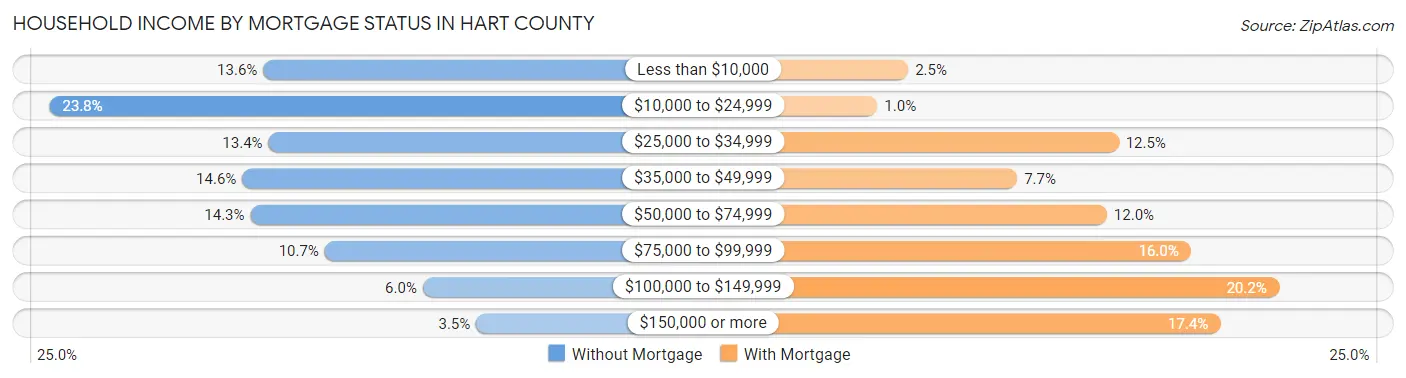
| Household Income | Without Mortgage | With Mortgage |
| Less than $10,000 | 382 (13.6%) | 63 (2.5%) |
| $10,000 to $24,999 | 667 (23.8%) | 26 (1.0%) |
| $25,000 to $34,999 | 375 (13.4%) | 314 (12.5%) |
| $35,000 to $49,999 | 410 (14.6%) | 193 (7.7%) |
| $50,000 to $74,999 | 399 (14.2%) | 300 (12.0%) |
| $75,000 to $99,999 | 300 (10.7%) | 400 (16.0%) |
| $100,000 to $149,999 | 169 (6.0%) | 505 (20.2%) |
| $150,000 or more | 98 (3.5%) | 435 (17.4%) |
| Total | 2,800 (100.0%) | 2,506 (100.0%) |
Property Value to Household Income Ratio in Hart County
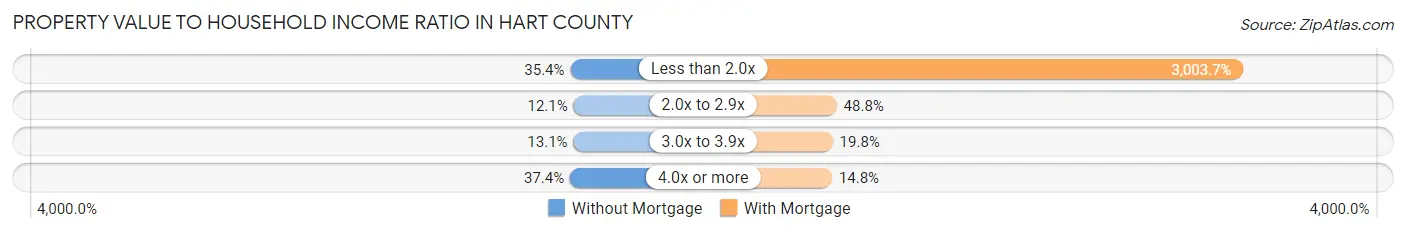
| Value-to-Income Ratio | Without Mortgage | With Mortgage |
| Less than 2.0x | 992 (35.4%) | 75,272 (3,003.7%) |
| 2.0x to 2.9x | 338 (12.1%) | 1,224 (48.8%) |
| 3.0x to 3.9x | 367 (13.1%) | 496 (19.8%) |
| 4.0x or more | 1,046 (37.4%) | 371 (14.8%) |
| Total | 2,800 (100.0%) | 2,506 (100.0%) |
Real Estate Taxes by Mortgage Status in Hart County
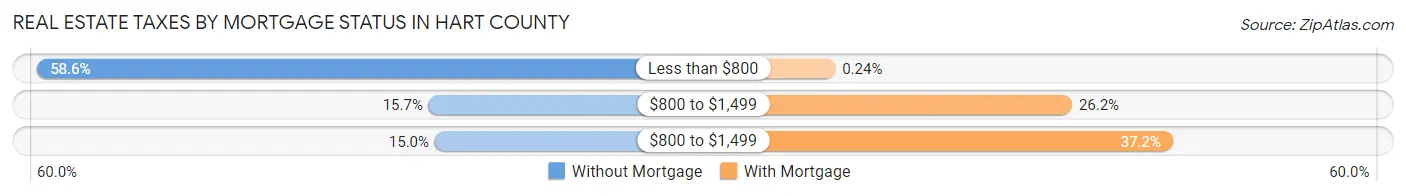
| Property Taxes | Without Mortgage | With Mortgage |
| Less than $800 | 1,641 (58.6%) | 6 (0.2%) |
| $800 to $1,499 | 440 (15.7%) | 656 (26.2%) |
| $800 to $1,499 | 421 (15.0%) | 933 (37.2%) |
| Total | 2,800 (100.0%) | 2,506 (100.0%) |
Health & Disability in Hart County
Health Insurance Coverage by Age in Hart County
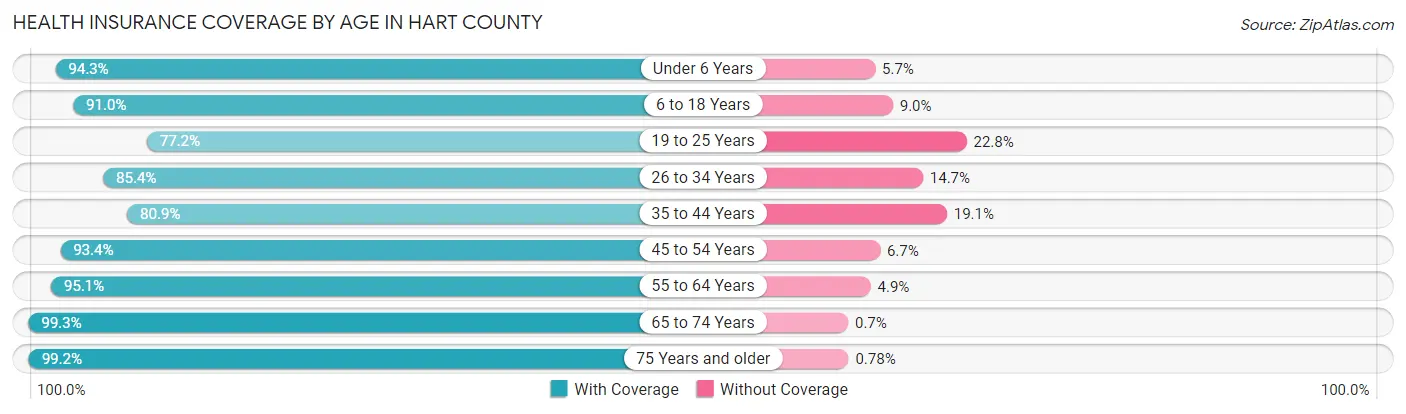
| Age Bracket | With Coverage | Without Coverage |
| Under 6 Years | 1,347 (94.3%) | 82 (5.7%) |
| 6 to 18 Years | 3,170 (91.0%) | 315 (9.0%) |
| 19 to 25 Years | 1,230 (77.2%) | 363 (22.8%) |
| 26 to 34 Years | 1,718 (85.4%) | 295 (14.6%) |
| 35 to 44 Years | 1,679 (80.9%) | 397 (19.1%) |
| 45 to 54 Years | 2,332 (93.3%) | 166 (6.7%) |
| 55 to 64 Years | 2,681 (95.1%) | 138 (4.9%) |
| 65 to 74 Years | 1,999 (99.3%) | 14 (0.7%) |
| 75 Years and older | 1,141 (99.2%) | 9 (0.8%) |
| Total | 17,297 (90.7%) | 1,779 (9.3%) |
Health Insurance Coverage by Citizenship Status in Hart County
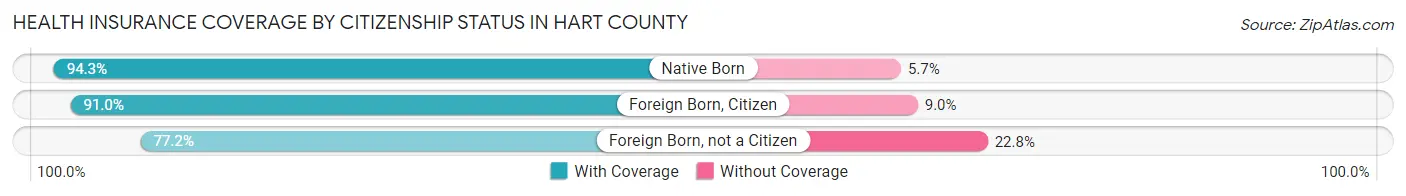
| Citizenship Status | With Coverage | Without Coverage |
| Native Born | 1,347 (94.3%) | 82 (5.7%) |
| Foreign Born, Citizen | 3,170 (91.0%) | 315 (9.0%) |
| Foreign Born, not a Citizen | 1,230 (77.2%) | 363 (22.8%) |
Health Insurance Coverage by Household Income in Hart County
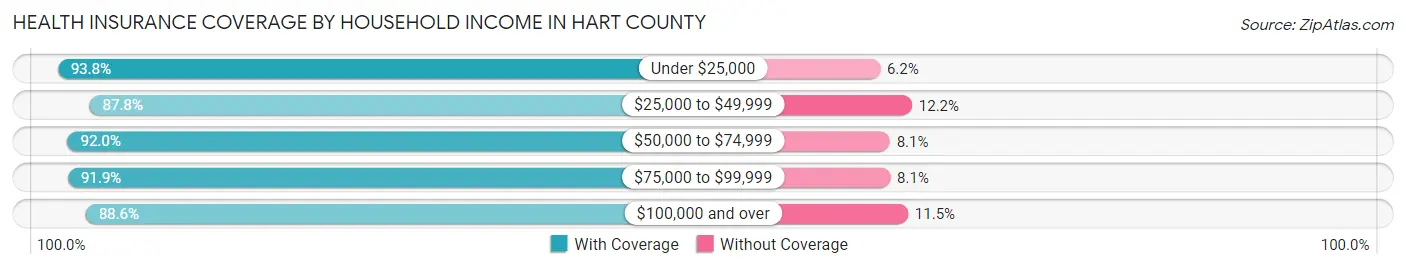
| Household Income | With Coverage | Without Coverage |
| Under $25,000 | 3,881 (93.8%) | 257 (6.2%) |
| $25,000 to $49,999 | 3,644 (87.8%) | 506 (12.2%) |
| $50,000 to $74,999 | 3,176 (91.9%) | 278 (8.1%) |
| $75,000 to $99,999 | 2,805 (91.9%) | 248 (8.1%) |
| $100,000 and over | 3,791 (88.5%) | 490 (11.5%) |
Public vs Private Health Insurance Coverage by Age in Hart County
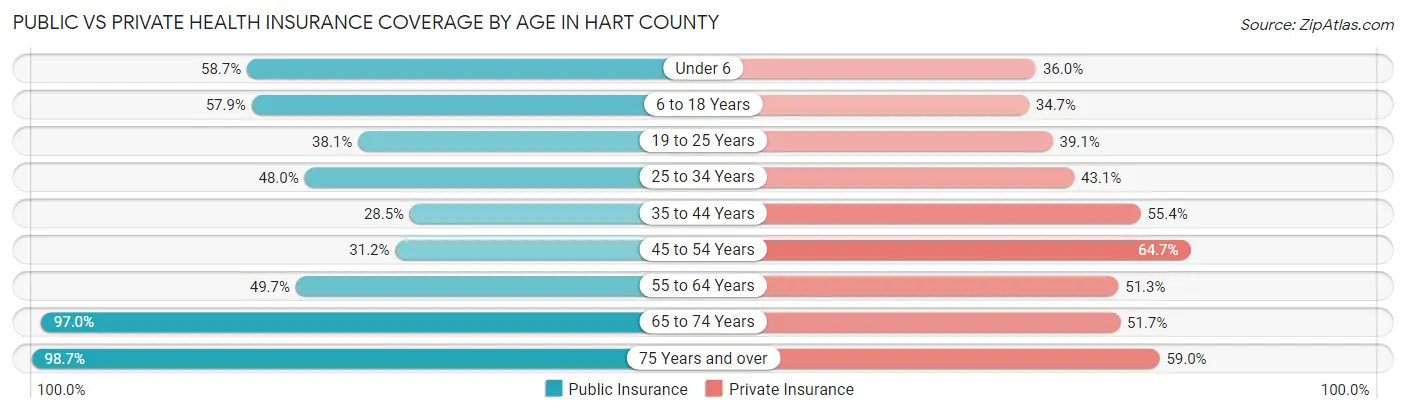
| Age Bracket | Public Insurance | Private Insurance |
| Under 6 | 839 (58.7%) | 515 (36.0%) |
| 6 to 18 Years | 2,016 (57.9%) | 1,210 (34.7%) |
| 19 to 25 Years | 607 (38.1%) | 623 (39.1%) |
| 25 to 34 Years | 967 (48.0%) | 868 (43.1%) |
| 35 to 44 Years | 591 (28.5%) | 1,151 (55.4%) |
| 45 to 54 Years | 779 (31.2%) | 1,616 (64.7%) |
| 55 to 64 Years | 1,400 (49.7%) | 1,447 (51.3%) |
| 65 to 74 Years | 1,952 (97.0%) | 1,040 (51.7%) |
| 75 Years and over | 1,135 (98.7%) | 678 (59.0%) |
| Total | 10,286 (53.9%) | 9,148 (48.0%) |
Disability Status by Sex by Age in Hart County
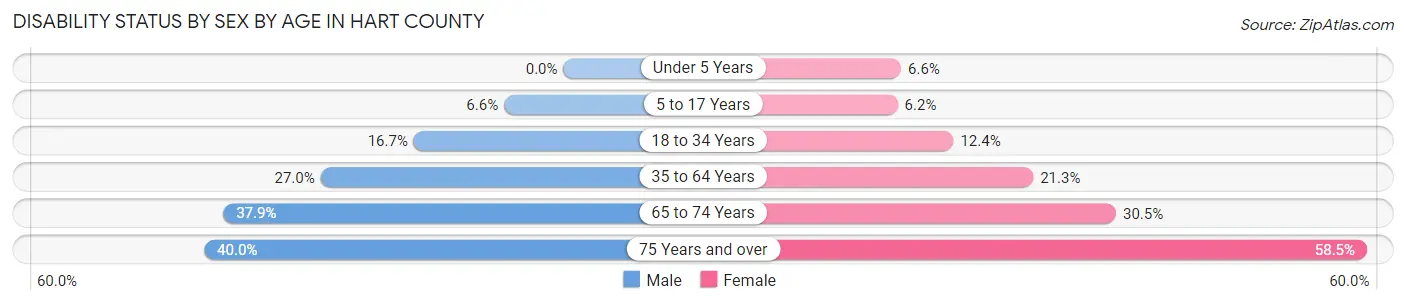
| Age Bracket | Male | Female |
| Under 5 Years | 0 (0.0%) | 43 (6.6%) |
| 5 to 17 Years | 117 (6.6%) | 105 (6.2%) |
| 18 to 34 Years | 320 (16.7%) | 232 (12.4%) |
| 35 to 64 Years | 986 (27.0%) | 799 (21.3%) |
| 65 to 74 Years | 347 (37.9%) | 335 (30.5%) |
| 75 Years and over | 198 (40.0%) | 383 (58.5%) |
Disability Class by Sex by Age in Hart County
Disability Class: Hearing Difficulty
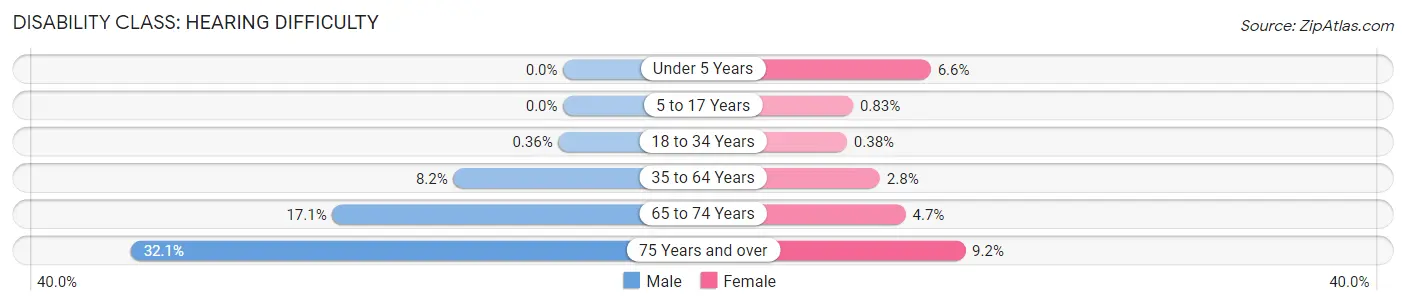
| Age Bracket | Male | Female |
| Under 5 Years | 0 (0.0%) | 43 (6.6%) |
| 5 to 17 Years | 0 (0.0%) | 14 (0.8%) |
| 18 to 34 Years | 7 (0.4%) | 7 (0.4%) |
| 35 to 64 Years | 297 (8.2%) | 106 (2.8%) |
| 65 to 74 Years | 157 (17.1%) | 52 (4.7%) |
| 75 Years and over | 159 (32.1%) | 60 (9.2%) |
Disability Class: Vision Difficulty
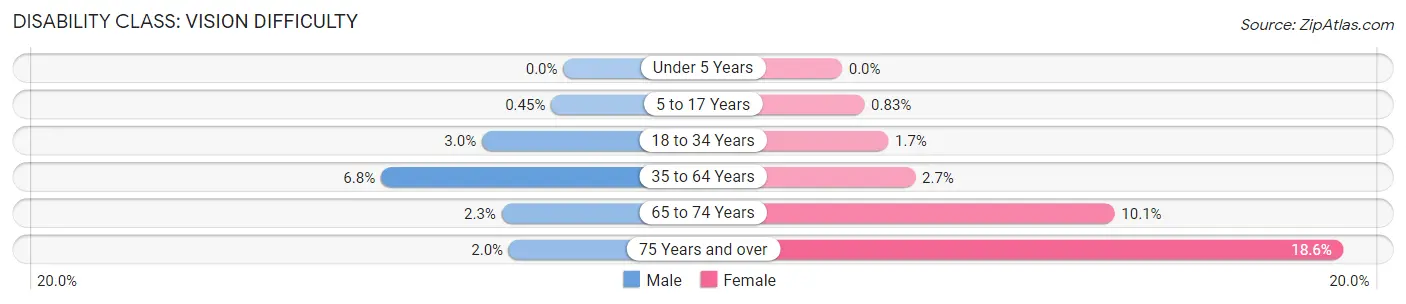
| Age Bracket | Male | Female |
| Under 5 Years | 0 (0.0%) | 0 (0.0%) |
| 5 to 17 Years | 8 (0.4%) | 14 (0.8%) |
| 18 to 34 Years | 58 (3.0%) | 32 (1.7%) |
| 35 to 64 Years | 247 (6.8%) | 102 (2.7%) |
| 65 to 74 Years | 21 (2.3%) | 111 (10.1%) |
| 75 Years and over | 10 (2.0%) | 122 (18.6%) |
Disability Class: Cognitive Difficulty
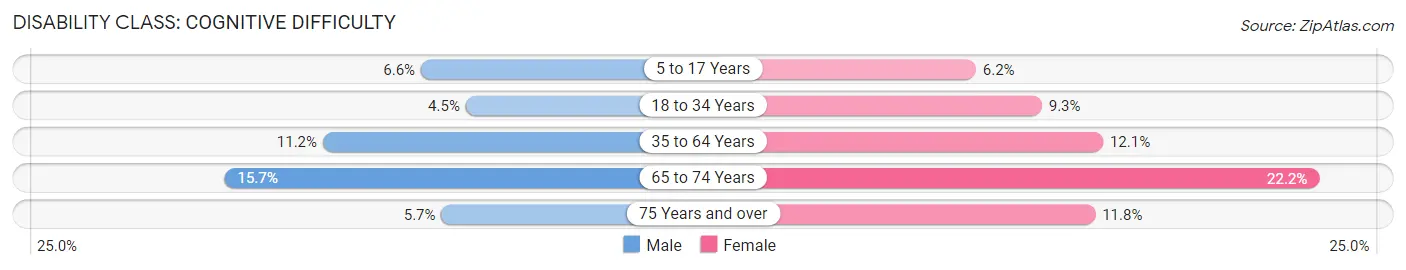
| Age Bracket | Male | Female |
| 5 to 17 Years | 117 (6.6%) | 105 (6.2%) |
| 18 to 34 Years | 87 (4.5%) | 173 (9.3%) |
| 35 to 64 Years | 407 (11.2%) | 454 (12.1%) |
| 65 to 74 Years | 144 (15.7%) | 243 (22.2%) |
| 75 Years and over | 28 (5.7%) | 77 (11.8%) |
Disability Class: Ambulatory Difficulty
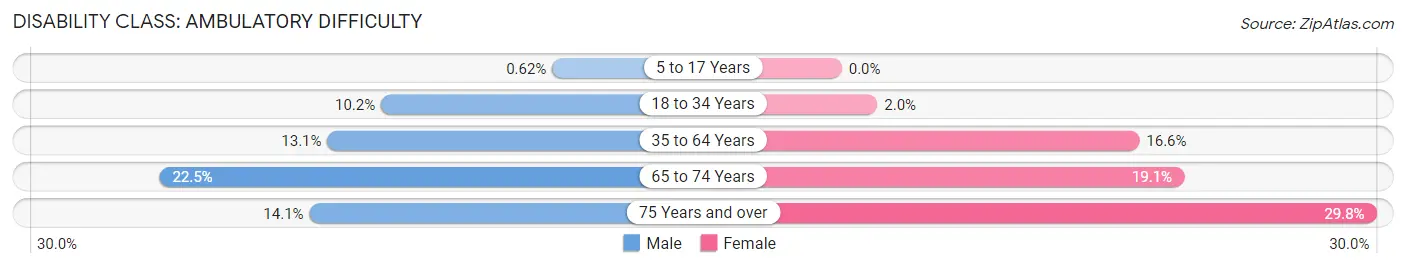
| Age Bracket | Male | Female |
| 5 to 17 Years | 11 (0.6%) | 0 (0.0%) |
| 18 to 34 Years | 195 (10.2%) | 37 (2.0%) |
| 35 to 64 Years | 479 (13.1%) | 621 (16.6%) |
| 65 to 74 Years | 206 (22.5%) | 209 (19.1%) |
| 75 Years and over | 70 (14.1%) | 195 (29.8%) |
Disability Class: Self-Care Difficulty
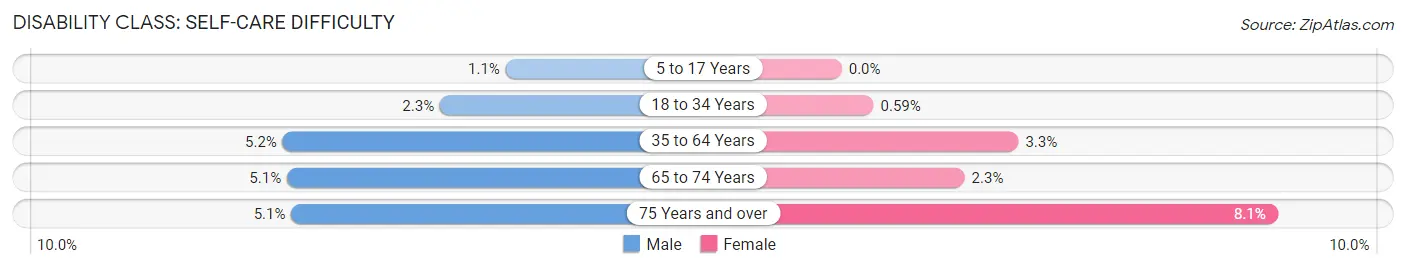
| Age Bracket | Male | Female |
| 5 to 17 Years | 19 (1.1%) | 0 (0.0%) |
| 18 to 34 Years | 44 (2.3%) | 11 (0.6%) |
| 35 to 64 Years | 190 (5.2%) | 123 (3.3%) |
| 65 to 74 Years | 47 (5.1%) | 25 (2.3%) |
| 75 Years and over | 25 (5.1%) | 53 (8.1%) |
Technology Access in Hart County
Computing Device Access in Hart County
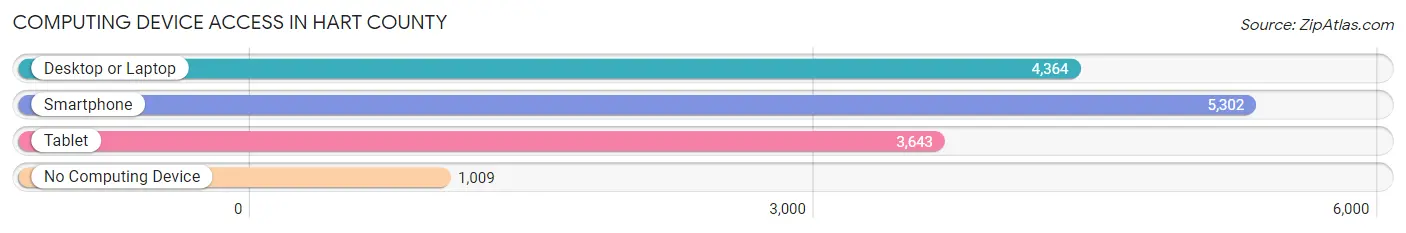
| Device Type | # Households | % Households |
| Desktop or Laptop | 4,364 | 60.6% |
| Smartphone | 5,302 | 73.7% |
| Tablet | 3,643 | 50.6% |
| No Computing Device | 1,009 | 14.0% |
| Total | 7,199 | 100.0% |
Internet Access in Hart County
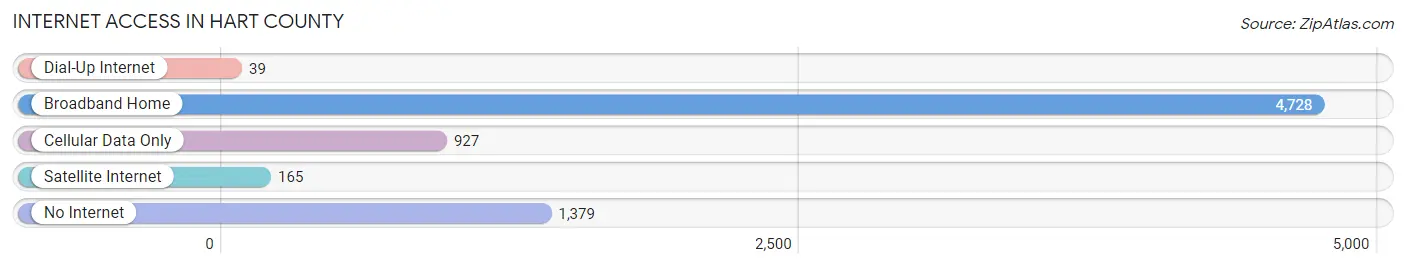
| Internet Type | # Households | % Households |
| Dial-Up Internet | 39 | 0.5% |
| Broadband Home | 4,728 | 65.7% |
| Cellular Data Only | 927 | 12.9% |
| Satellite Internet | 165 | 2.3% |
| No Internet | 1,379 | 19.2% |
| Total | 7,199 | 100.0% |
Hart County Summary
Hart County is located in south-central Kentucky, and is part of the Barren River Area Development District. It is bordered by Grayson County to the north, Edmonson County to the east, Metcalfe County to the south, and Warren County to the west. The county seat is Munfordville, and the county was formed in 1819 from portions of Hardin and Barren counties. The county has a total area of 441 square miles, and a population of 18,199 as of the 2010 census.
History
The area that is now Hart County was originally inhabited by Native American tribes, including the Cherokee, Chickasaw, and Shawnee. The first European settlers arrived in the area in the late 1700s, and the county was officially established in 1819. The county was named for Captain Nathaniel Hart, a Revolutionary War veteran and early settler of the area.
During the Civil War, Hart County was a major site of the Battle of Munfordville, which took place in September 1862. The battle was a Confederate victory, and resulted in the surrender of the Union forces in the area.
Geography
Hart County is located in south-central Kentucky, and is part of the Barren River Area Development District. It is bordered by Grayson County to the north, Edmonson County to the east, Metcalfe County to the south, and Warren County to the west. The county has a total area of 441 square miles, and is mostly composed of rolling hills and valleys. The county is drained by the Green River, which flows through the western part of the county.
The county is home to several state parks and recreation areas, including Mammoth Cave National Park, Nolin Lake State Park, and Barren River Lake State Resort Park. The county also contains several small towns and villages, including Munfordville, Horse Cave, and Bonnieville.
Economy
The economy of Hart County is largely based on agriculture and tourism. The county is home to several large farms, which produce a variety of crops, including corn, soybeans, wheat, and hay. The county is also home to several large dairy farms, which produce milk and other dairy products.
The county is also home to several tourist attractions, including Mammoth Cave National Park, Nolin Lake State Park, and Barren River Lake State Resort Park. These attractions draw thousands of visitors to the county each year, and provide a significant boost to the local economy.
Demographics
As of the 2010 census, Hart County had a population of 18,199. The racial makeup of the county was 95.3% White, 2.3% African American, 0.4% Native American, 0.2% Asian, 0.1% Pacific Islander, 0.7% from other races, and 0.9% from two or more races. Hispanic or Latino of any race were 1.7% of the population.
The median income for a household in the county was $35,945, and the median income for a family was $43,945. The per capita income for the county was $17,945. About 15.3% of the population was below the poverty line.
Common Questions
What is Per Capita Income in Hart County?
Per Capita income in Hart County is $23,837.
What is the Median Family Income in Hart County?
Median Family Income in Hart County is $59,152.
What is the Median Household income in Hart County?
Median Household Income in Hart County is $45,561.
What is Income or Wage Gap in Hart County?
Income or Wage Gap in Hart County is 47.0%.
Women in Hart County earn 53.0 cents for every dollar earned by a man.
What is Family Income Deficit in Hart County?
Family Income Deficit in Hart County is $10,472.
Families that are below poverty line in Hart County earn $10,472 less on average than the poverty threshold level.
What is Inequality or Gini Index in Hart County?
Inequality or Gini Index in Hart County is 0.46.
What is the Total Population of Hart County?
Total Population of Hart County is 19,345.
What is the Total Male Population of Hart County?
Total Male Population of Hart County is 9,580.
What is the Total Female Population of Hart County?
Total Female Population of Hart County is 9,765.
What is the Ratio of Males per 100 Females in Hart County?
There are 98.11 Males per 100 Females in Hart County.
What is the Ratio of Females per 100 Males in Hart County?
There are 101.93 Females per 100 Males in Hart County.
What is the Median Population Age in Hart County?
Median Population Age in Hart County is 40.3 Years.
What is the Average Family Size in Hart County
Average Family Size in Hart County is 3.2 People.
What is the Average Household Size in Hart County
Average Household Size in Hart County is 2.6 People.
How Large is the Labor Force in Hart County?
There are 8,174 People in the Labor Forcein in Hart County.
What is the Percentage of People in the Labor Force in Hart County?
54.1% of People are in the Labor Force in Hart County.
What is the Unemployment Rate in Hart County?
Unemployment Rate in Hart County is 3.5%.