Harlan County, KY Map & Demographics
Harlan County Map
Harlan County Overview
$20,511
PER CAPITA INCOME
$45,564
AVG FAMILY INCOME
$35,128
AVG HOUSEHOLD INCOME
21.7%
WAGE / INCOME GAP [ % ]
78.3¢/ $1
WAGE / INCOME GAP [ $ ]
$9,214
FAMILY INCOME DEFICIT
0.48
INEQUALITY / GINI INDEX
26,589
TOTAL POPULATION
12,841
MALE POPULATION
13,748
FEMALE POPULATION
93.40
MALES / 100 FEMALES
107.06
FEMALES / 100 MALES
41.2
MEDIAN AGE
3.0
AVG FAMILY SIZE
2.5
AVG HOUSEHOLD SIZE
8,360
LABOR FORCE [ PEOPLE ]
39.6%
PERCENT IN LABOR FORCE
10.8%
UNEMPLOYMENT RATE
Harlan County Area Codes
Income in Harlan County
Income Overview in Harlan County
Per Capita Income in Harlan County is $20,511, while median incomes of families and households are $45,564 and $35,128 respectively.
| Characteristic | Number | Measure |
| Per Capita Income | 26,589 | $20,511 |
| Median Family Income | 7,115 | $45,564 |
| Mean Family Income | 7,115 | $60,038 |
| Median Household Income | 10,498 | $35,128 |
| Mean Household Income | 10,498 | $51,132 |
| Income Deficit | 7,115 | $9,214 |
| Wage / Income Gap (%) | 26,589 | 21.66% |
| Wage / Income Gap ($) | 26,589 | 78.34¢ per $1 |
| Gini / Inequality Index | 26,589 | 0.48 |
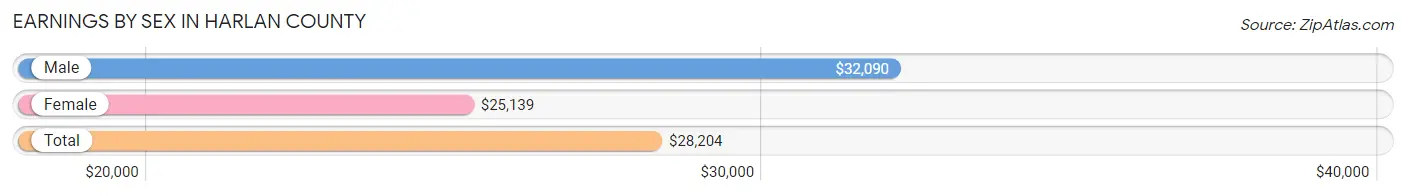
Earnings by Sex in Harlan County
Average Earnings in Harlan County are $28,204, $32,090 for men and $25,139 for women, a difference of 21.7%.
| Sex | Number | Average Earnings |
| Male | 4,269 (49.5%) | $32,090 |
| Female | 4,359 (50.5%) | $25,139 |
| Total | 8,628 (100.0%) | $28,204 |
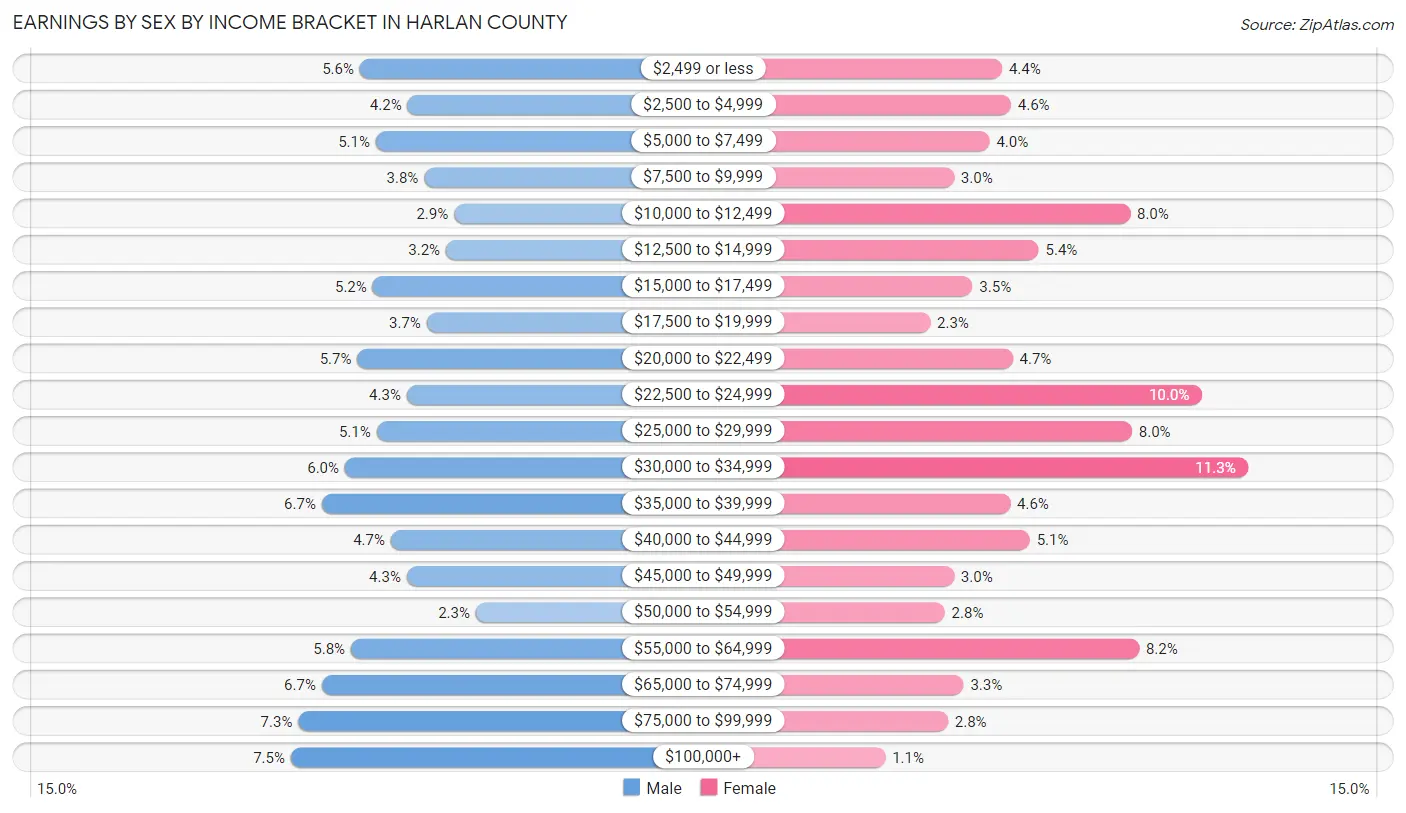
Earnings by Sex by Income Bracket in Harlan County
The most common earnings brackets in Harlan County are $100,000+ for men (321 | 7.5%) and $30,000 to $34,999 for women (491 | 11.3%).
| Income | Male | Female |
| $2,499 or less | 238 (5.6%) | 190 (4.4%) |
| $2,500 to $4,999 | 181 (4.2%) | 201 (4.6%) |
| $5,000 to $7,499 | 219 (5.1%) | 175 (4.0%) |
| $7,500 to $9,999 | 161 (3.8%) | 131 (3.0%) |
| $10,000 to $12,499 | 125 (2.9%) | 347 (8.0%) |
| $12,500 to $14,999 | 135 (3.2%) | 235 (5.4%) |
| $15,000 to $17,499 | 223 (5.2%) | 154 (3.5%) |
| $17,500 to $19,999 | 158 (3.7%) | 102 (2.3%) |
| $20,000 to $22,499 | 241 (5.7%) | 203 (4.7%) |
| $22,500 to $24,999 | 182 (4.3%) | 434 (10.0%) |
| $25,000 to $29,999 | 218 (5.1%) | 349 (8.0%) |
| $30,000 to $34,999 | 256 (6.0%) | 491 (11.3%) |
| $35,000 to $39,999 | 284 (6.7%) | 200 (4.6%) |
| $40,000 to $44,999 | 201 (4.7%) | 224 (5.1%) |
| $45,000 to $49,999 | 182 (4.3%) | 131 (3.0%) |
| $50,000 to $54,999 | 99 (2.3%) | 120 (2.8%) |
| $55,000 to $64,999 | 249 (5.8%) | 358 (8.2%) |
| $65,000 to $74,999 | 284 (6.7%) | 143 (3.3%) |
| $75,000 to $99,999 | 312 (7.3%) | 124 (2.8%) |
| $100,000+ | 321 (7.5%) | 47 (1.1%) |
| Total | 4,269 (100.0%) | 4,359 (100.0%) |
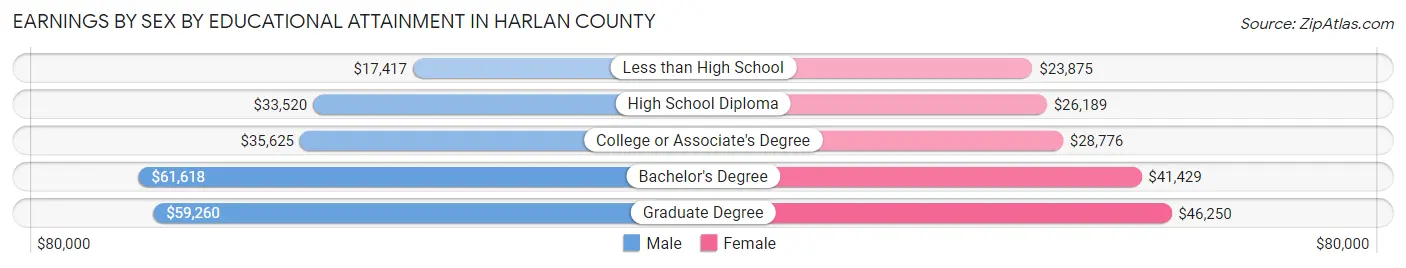
Earnings by Sex by Educational Attainment in Harlan County
Average earnings in Harlan County are $36,112 for men and $28,680 for women, a difference of 20.6%. Men with an educational attainment of bachelor's degree enjoy the highest average annual earnings of $61,618, while those with less than high school education earn the least with $17,417. Women with an educational attainment of graduate degree earn the most with the average annual earnings of $46,250, while those with less than high school education have the smallest earnings of $23,875.
| Educational Attainment | Male Income | Female Income |
| Less than High School | $17,417 | $23,875 |
| High School Diploma | $33,520 | $26,189 |
| College or Associate's Degree | $35,625 | $28,776 |
| Bachelor's Degree | $61,618 | $41,429 |
| Graduate Degree | $59,260 | $46,250 |
| Total | $36,112 | $28,680 |
Family Income in Harlan County
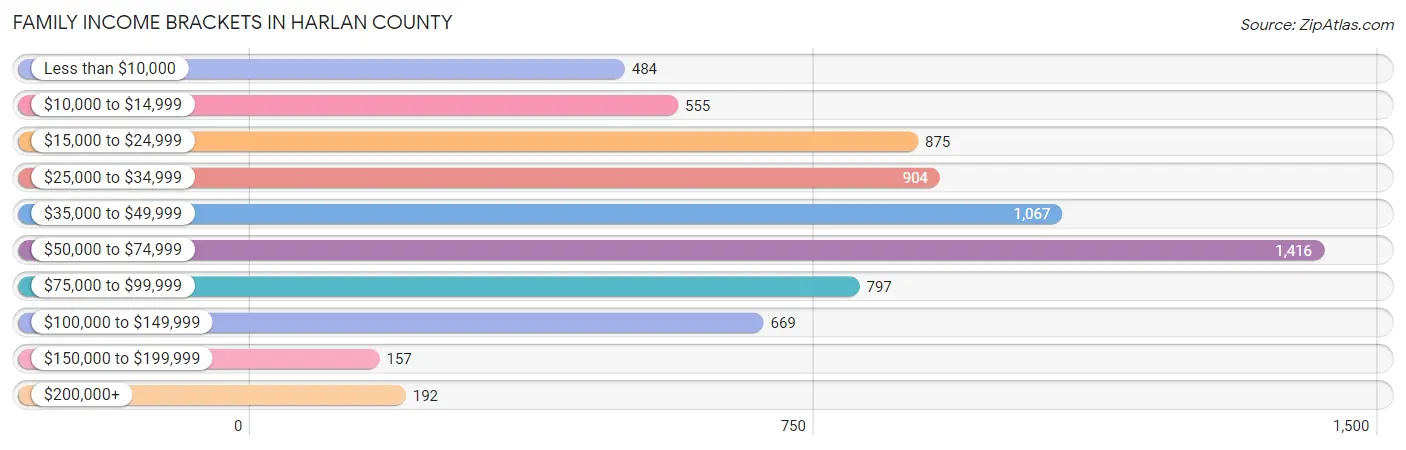
Family Income Brackets in Harlan County
According to the Harlan County family income data, there are 1,416 families falling into the $50,000 to $74,999 income range, which is the most common income bracket and makes up 19.9% of all families. Conversely, the $150,000 to $199,999 income bracket is the least frequent group with only 157 families (2.2%) belonging to this category.
| Income Bracket | # Families | % Families |
| Less than $10,000 | 484 | 6.8% |
| $10,000 to $14,999 | 555 | 7.8% |
| $15,000 to $24,999 | 875 | 12.3% |
| $25,000 to $34,999 | 904 | 12.7% |
| $35,000 to $49,999 | 1,067 | 15.0% |
| $50,000 to $74,999 | 1,416 | 19.9% |
| $75,000 to $99,999 | 797 | 11.2% |
| $100,000 to $149,999 | 669 | 9.4% |
| $150,000 to $199,999 | 157 | 2.2% |
| $200,000+ | 192 | 2.7% |
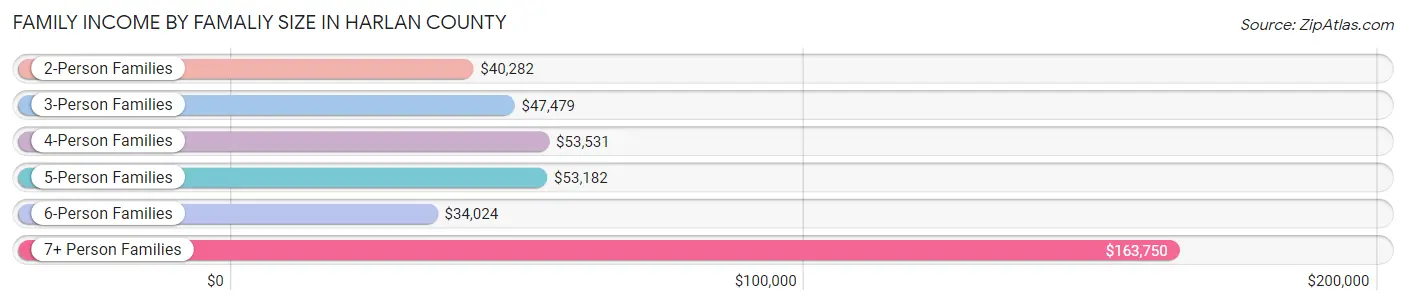
Family Income by Famaliy Size in Harlan County
7+ person families (32 | 0.4%) account for the highest median family income in Harlan County with $163,750 per family, while 7+ person families (32 | 0.4%) have the highest median income of $23,393 per family member.
| Income Bracket | # Families | Median Income |
| 2-Person Families | 3,981 (55.9%) | $40,282 |
| 3-Person Families | 1,263 (17.7%) | $47,479 |
| 4-Person Families | 1,187 (16.7%) | $53,531 |
| 5-Person Families | 510 (7.2%) | $53,182 |
| 6-Person Families | 142 (2.0%) | $34,024 |
| 7+ Person Families | 32 (0.4%) | $163,750 |
| Total | 7,115 (100.0%) | $45,564 |
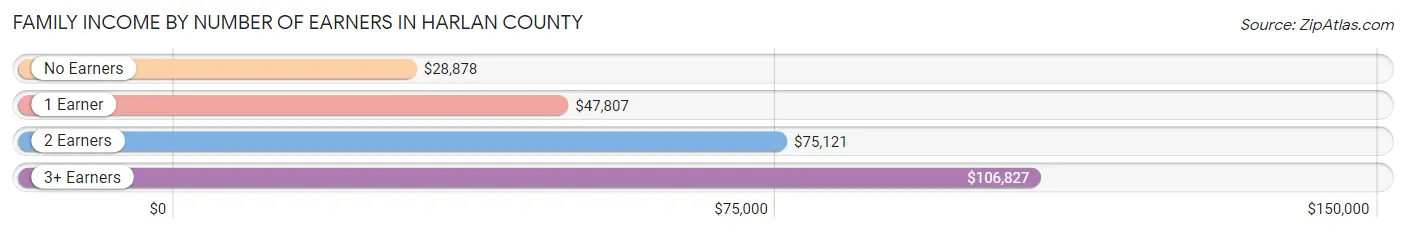
Family Income by Number of Earners in Harlan County
The median family income in Harlan County is $45,564, with families comprising 3+ earners (289) having the highest median family income of $106,827, while families with no earners (2,687) have the lowest median family income of $28,878, accounting for 4.1% and 37.8% of families, respectively.
| Number of Earners | # Families | Median Income |
| No Earners | 2,687 (37.8%) | $28,878 |
| 1 Earner | 2,658 (37.4%) | $47,807 |
| 2 Earners | 1,481 (20.8%) | $75,121 |
| 3+ Earners | 289 (4.1%) | $106,827 |
| Total | 7,115 (100.0%) | $45,564 |
Household Income in Harlan County
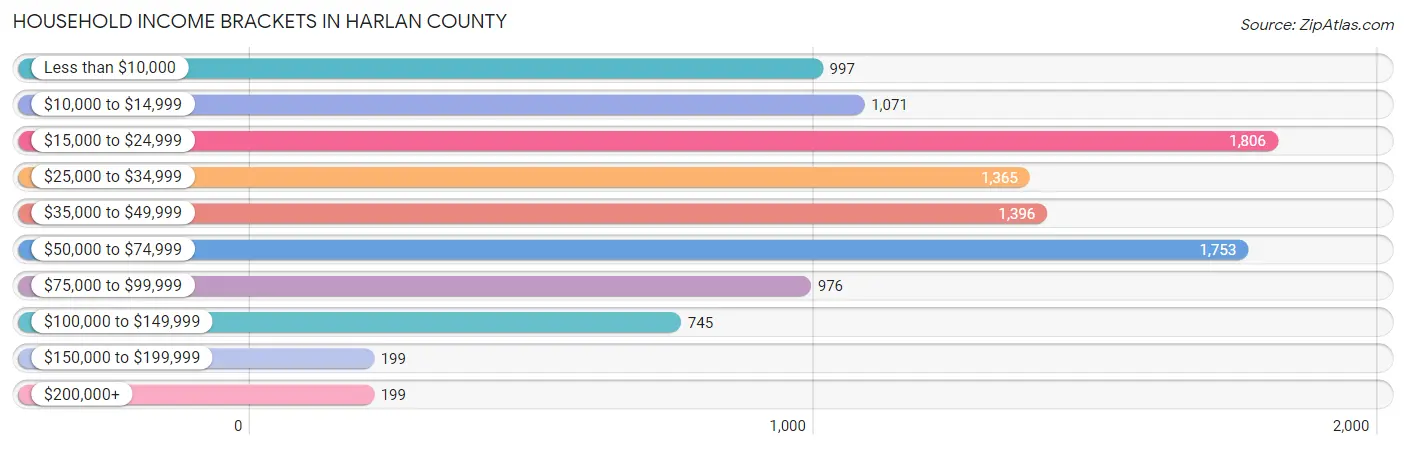
Household Income Brackets in Harlan County
With 1,806 households falling in the category, the $15,000 to $24,999 income range is the most frequent in Harlan County, accounting for 17.2% of all households. In contrast, only 199 households (1.9%) fall into the $150,000 to $199,999 income bracket, making it the least populous group.
| Income Bracket | # Households | % Households |
| Less than $10,000 | 997 | 9.5% |
| $10,000 to $14,999 | 1,071 | 10.2% |
| $15,000 to $24,999 | 1,806 | 17.2% |
| $25,000 to $34,999 | 1,365 | 13.0% |
| $35,000 to $49,999 | 1,396 | 13.3% |
| $50,000 to $74,999 | 1,753 | 16.7% |
| $75,000 to $99,999 | 976 | 9.3% |
| $100,000 to $149,999 | 745 | 7.1% |
| $150,000 to $199,999 | 199 | 1.9% |
| $200,000+ | 199 | 1.9% |
Household Income by Householder Age in Harlan County
The median household income in Harlan County is $35,128, with the highest median household income of $38,237 found in the 25 to 44 years age bracket for the primary householder. A total of 2,637 households (25.1%) fall into this category. Meanwhile, the 15 to 24 years age bracket for the primary householder has the lowest median household income of $25,735, with 394 households (3.7%) in this group.
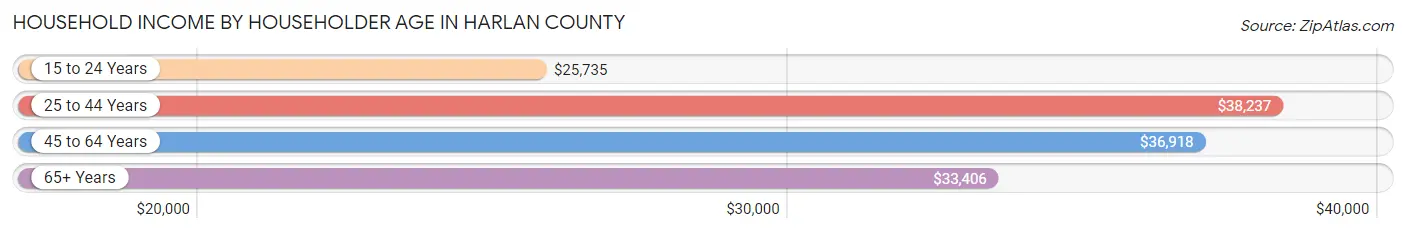
| Income Bracket | # Households | Median Income |
| 15 to 24 Years | 394 (3.7%) | $25,735 |
| 25 to 44 Years | 2,637 (25.1%) | $38,237 |
| 45 to 64 Years | 4,111 (39.2%) | $36,918 |
| 65+ Years | 3,356 (32.0%) | $33,406 |
| Total | 10,498 (100.0%) | $35,128 |
Poverty in Harlan County
Income Below Poverty by Sex and Age in Harlan County
With 28.5% poverty level for males and 31.4% for females among the residents of Harlan County, 16 and 17 year old males and 6 to 11 year old females are the most vulnerable to poverty, with 214 males (59.8%) and 542 females (46.1%) in their respective age groups living below the poverty level.
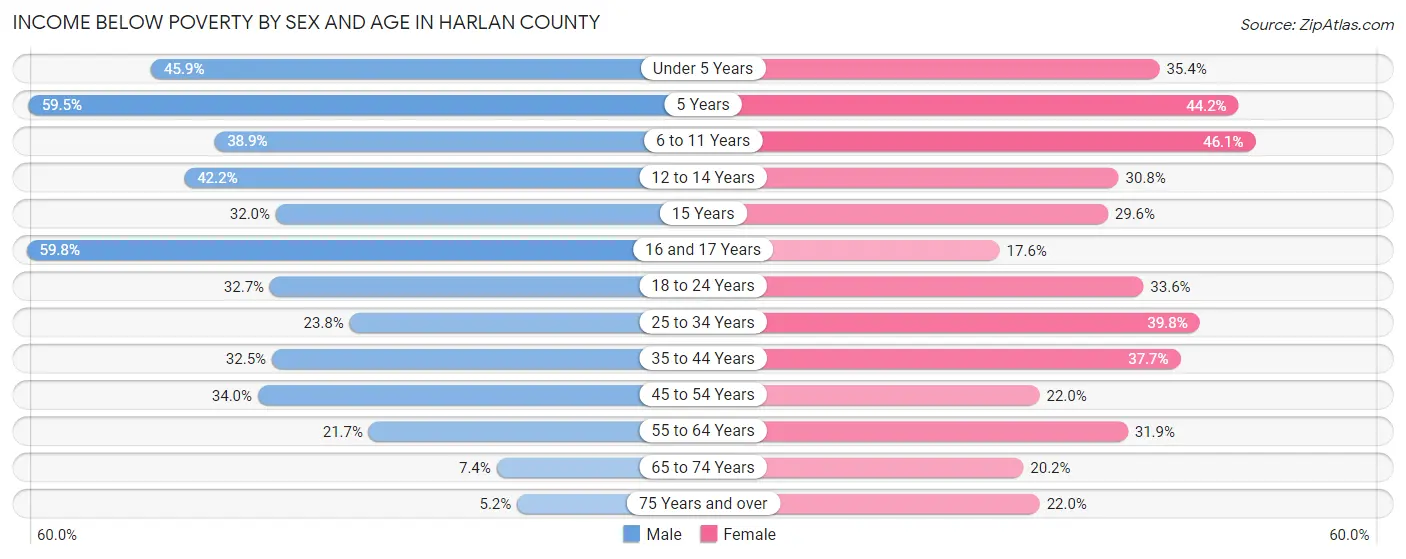
| Age Bracket | Male | Female |
| Under 5 Years | 349 (45.9%) | 259 (35.4%) |
| 5 Years | 78 (59.5%) | 72 (44.2%) |
| 6 to 11 Years | 383 (38.9%) | 542 (46.1%) |
| 12 to 14 Years | 282 (42.2%) | 115 (30.8%) |
| 15 Years | 57 (32.0%) | 40 (29.6%) |
| 16 and 17 Years | 214 (59.8%) | 61 (17.6%) |
| 18 to 24 Years | 300 (32.7%) | 300 (33.6%) |
| 25 to 34 Years | 365 (23.8%) | 665 (39.8%) |
| 35 to 44 Years | 473 (32.5%) | 597 (37.7%) |
| 45 to 54 Years | 563 (34.0%) | 370 (22.0%) |
| 55 to 64 Years | 379 (21.7%) | 630 (31.9%) |
| 65 to 74 Years | 112 (7.4%) | 335 (20.2%) |
| 75 Years and over | 35 (5.1%) | 223 (22.0%) |
| Total | 3,590 (28.5%) | 4,209 (31.4%) |
Income Above Poverty by Sex and Age in Harlan County
According to the poverty statistics in Harlan County, males aged 75 years and over and females aged 16 and 17 years are the age groups that are most secure financially, with 94.9% of males and 82.4% of females in these age groups living above the poverty line.
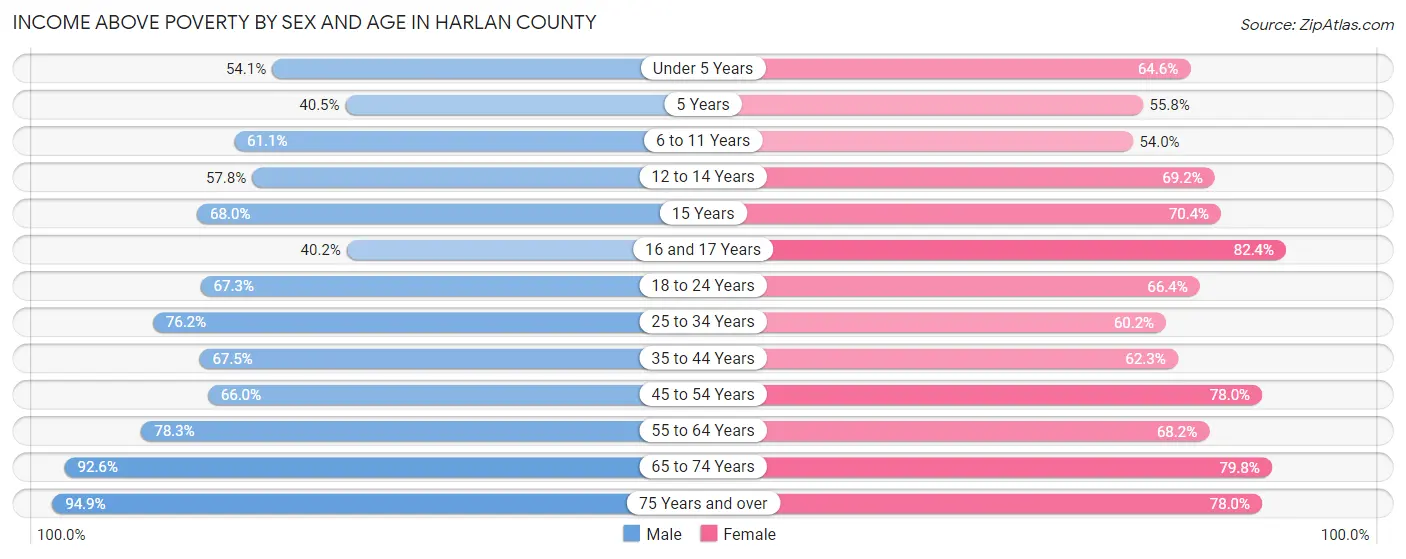
| Age Bracket | Male | Female |
| Under 5 Years | 411 (54.1%) | 473 (64.6%) |
| 5 Years | 53 (40.5%) | 91 (55.8%) |
| 6 to 11 Years | 602 (61.1%) | 635 (53.9%) |
| 12 to 14 Years | 386 (57.8%) | 258 (69.2%) |
| 15 Years | 121 (68.0%) | 95 (70.4%) |
| 16 and 17 Years | 144 (40.2%) | 286 (82.4%) |
| 18 to 24 Years | 618 (67.3%) | 593 (66.4%) |
| 25 to 34 Years | 1,168 (76.2%) | 1,004 (60.2%) |
| 35 to 44 Years | 984 (67.5%) | 987 (62.3%) |
| 45 to 54 Years | 1,092 (66.0%) | 1,310 (78.0%) |
| 55 to 64 Years | 1,370 (78.3%) | 1,348 (68.1%) |
| 65 to 74 Years | 1,395 (92.6%) | 1,322 (79.8%) |
| 75 Years and over | 645 (94.9%) | 789 (78.0%) |
| Total | 8,989 (71.5%) | 9,191 (68.6%) |
Income Below Poverty Among Married-Couple Families in Harlan County
The poverty statistics for married-couple families in Harlan County show that 16.6% or 839 of the total 5,059 families live below the poverty line. Families with 3 or 4 children have the highest poverty rate of 49.8%, comprising of 170 families. On the other hand, families with 5 or more children have the lowest poverty rate of 0.0%, which includes 0 families.
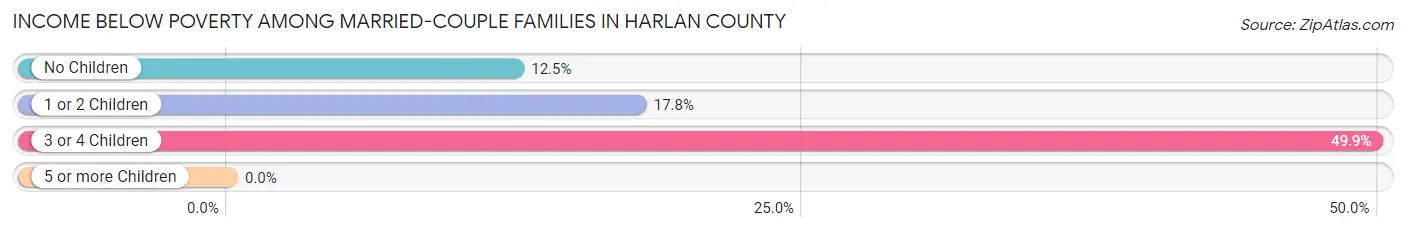
| Children | Above Poverty | Below Poverty |
| No Children | 2,781 (87.5%) | 396 (12.5%) |
| 1 or 2 Children | 1,262 (82.2%) | 273 (17.8%) |
| 3 or 4 Children | 171 (50.1%) | 170 (49.8%) |
| 5 or more Children | 6 (100.0%) | 0 (0.0%) |
| Total | 4,220 (83.4%) | 839 (16.6%) |
Income Below Poverty Among Single-Parent Households in Harlan County
According to the poverty data in Harlan County, 30.1% or 170 single-father households and 51.4% or 766 single-mother households are living below the poverty line. Among single-father households, those with 1 or 2 children have the highest poverty rate, with 150 households (54.7%) experiencing poverty. Likewise, among single-mother households, those with 3 or 4 children have the highest poverty rate, with 171 households (84.7%) falling below the poverty line.
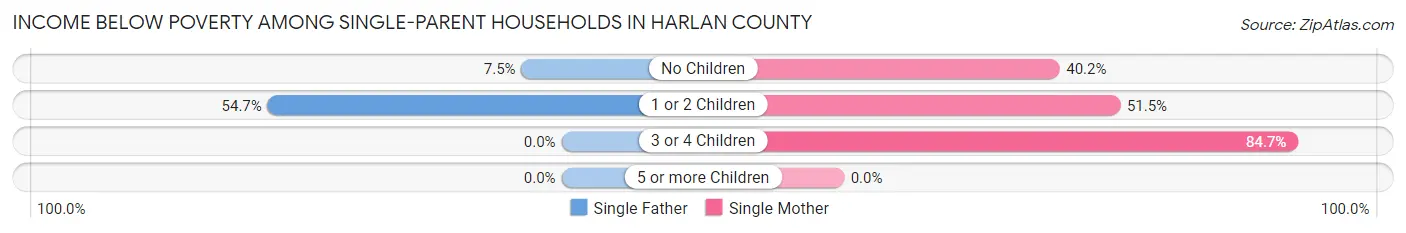
| Children | Single Father | Single Mother |
| No Children | 20 (7.5%) | 243 (40.2%) |
| 1 or 2 Children | 150 (54.7%) | 352 (51.5%) |
| 3 or 4 Children | 0 (0.0%) | 171 (84.7%) |
| 5 or more Children | 0 (0.0%) | 0 (0.0%) |
| Total | 170 (30.1%) | 766 (51.4%) |
Income Below Poverty Among Married-Couple vs Single-Parent Households in Harlan County
The poverty data for Harlan County shows that 839 of the married-couple family households (16.6%) and 936 of the single-parent households (45.5%) are living below the poverty level. Within the married-couple family households, those with 3 or 4 children have the highest poverty rate, with 170 households (49.8%) falling below the poverty line. Among the single-parent households, those with 3 or 4 children have the highest poverty rate, with 171 household (76.0%) living below poverty.
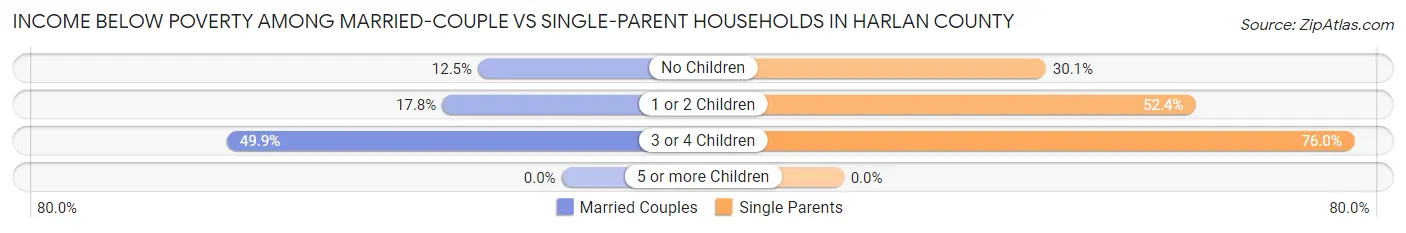
| Children | Married-Couple Families | Single-Parent Households |
| No Children | 396 (12.5%) | 263 (30.1%) |
| 1 or 2 Children | 273 (17.8%) | 502 (52.4%) |
| 3 or 4 Children | 170 (49.8%) | 171 (76.0%) |
| 5 or more Children | 0 (0.0%) | 0 (0.0%) |
| Total | 839 (16.6%) | 936 (45.5%) |
Race in Harlan County
The most populous races in Harlan County are White / Caucasian (25,163 | 94.6%), Two or more Races (671 | 2.5%), and Black / African American (548 | 2.1%).
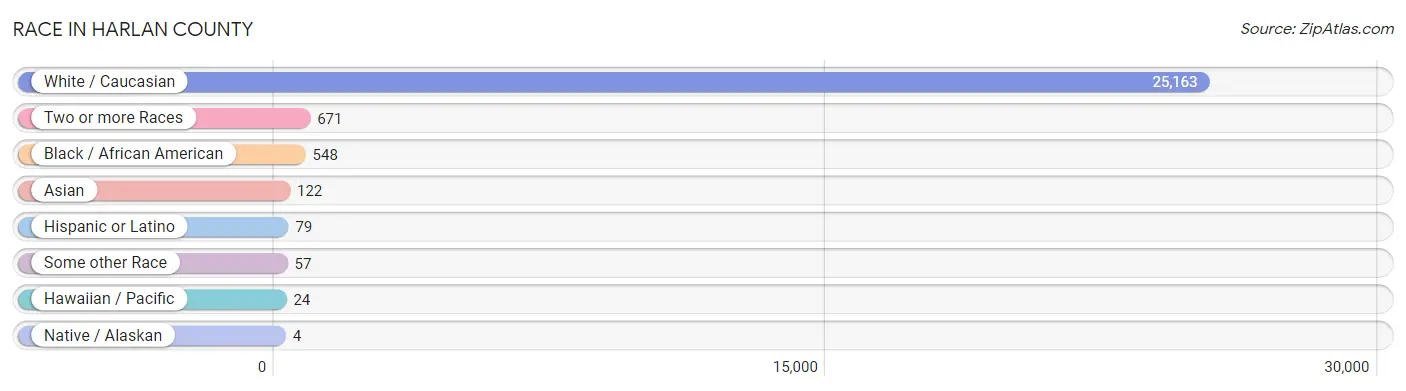
| Race | # Population | % Population |
| Asian | 122 | 0.5% |
| Black / African American | 548 | 2.1% |
| Hawaiian / Pacific | 24 | 0.1% |
| Hispanic or Latino | 79 | 0.3% |
| Native / Alaskan | 4 | 0.0% |
| White / Caucasian | 25,163 | 94.6% |
| Two or more Races | 671 | 2.5% |
| Some other Race | 57 | 0.2% |
| Total | 26,589 | 100.0% |
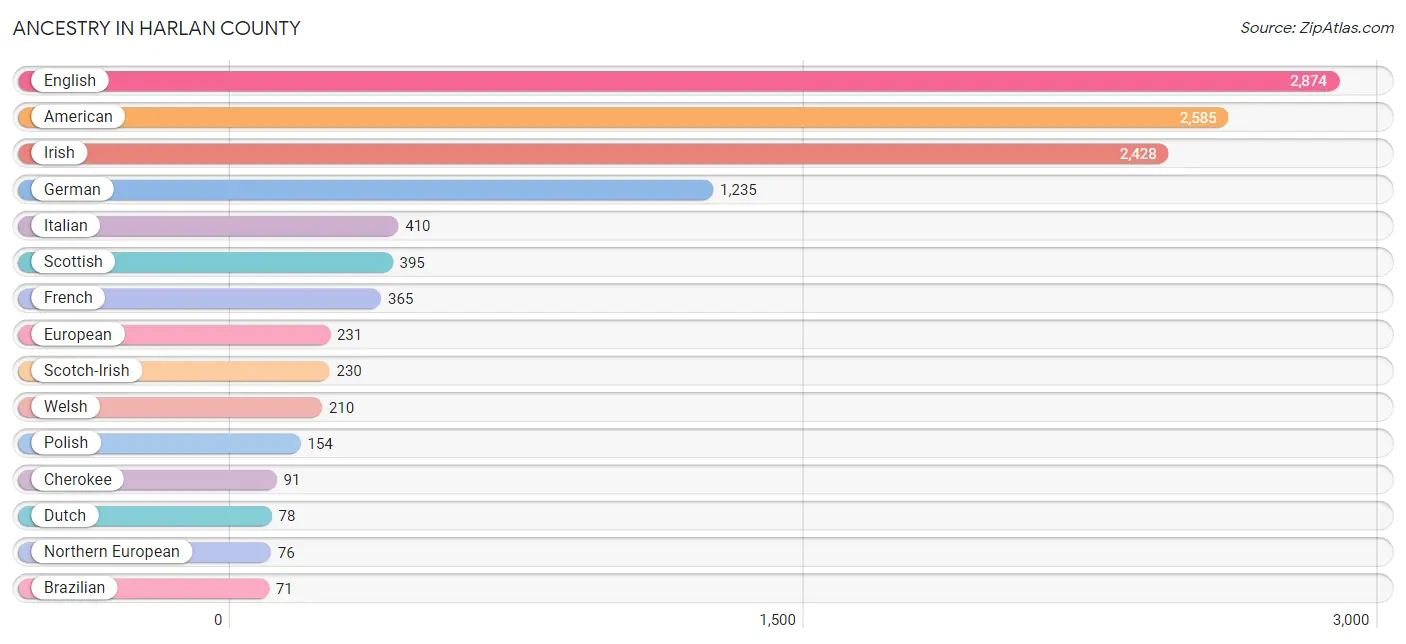
Ancestry in Harlan County
The most populous ancestries reported in Harlan County are English (2,874 | 10.8%), American (2,585 | 9.7%), Irish (2,428 | 9.1%), German (1,235 | 4.6%), and Italian (410 | 1.5%), together accounting for 35.8% of all Harlan County residents.
| Ancestry | # Population | % Population |
| African | 20 | 0.1% |
| American | 2,585 | 9.7% |
| Blackfeet | 5 | 0.0% |
| Brazilian | 71 | 0.3% |
| British | 50 | 0.2% |
| Burmese | 21 | 0.1% |
| Cajun | 7 | 0.0% |
| Central American | 3 | 0.0% |
| Cherokee | 91 | 0.3% |
| Cheyenne | 4 | 0.0% |
| Choctaw | 3 | 0.0% |
| Cuban | 1 | 0.0% |
| Czech | 10 | 0.0% |
| Dutch | 78 | 0.3% |
| Eastern European | 69 | 0.3% |
| English | 2,874 | 10.8% |
| European | 231 | 0.9% |
| French | 365 | 1.4% |
| German | 1,235 | 4.6% |
| Guatemalan | 3 | 0.0% |
| Hungarian | 24 | 0.1% |
| Indian (Asian) | 58 | 0.2% |
| Irish | 2,428 | 9.1% |
| Italian | 410 | 1.5% |
| Korean | 17 | 0.1% |
| Mexican | 39 | 0.2% |
| Northern European | 76 | 0.3% |
| Norwegian | 23 | 0.1% |
| Polish | 154 | 0.6% |
| Portuguese | 21 | 0.1% |
| Puerto Rican | 16 | 0.1% |
| Romanian | 33 | 0.1% |
| Samoan | 24 | 0.1% |
| Scotch-Irish | 230 | 0.9% |
| Scottish | 395 | 1.5% |
| Sioux | 5 | 0.0% |
| Sri Lankan | 30 | 0.1% |
| Subsaharan African | 20 | 0.1% |
| Swedish | 67 | 0.3% |
| Swiss | 25 | 0.1% |
| Vietnamese | 22 | 0.1% |
| Welsh | 210 | 0.8% | View All 42 Rows |
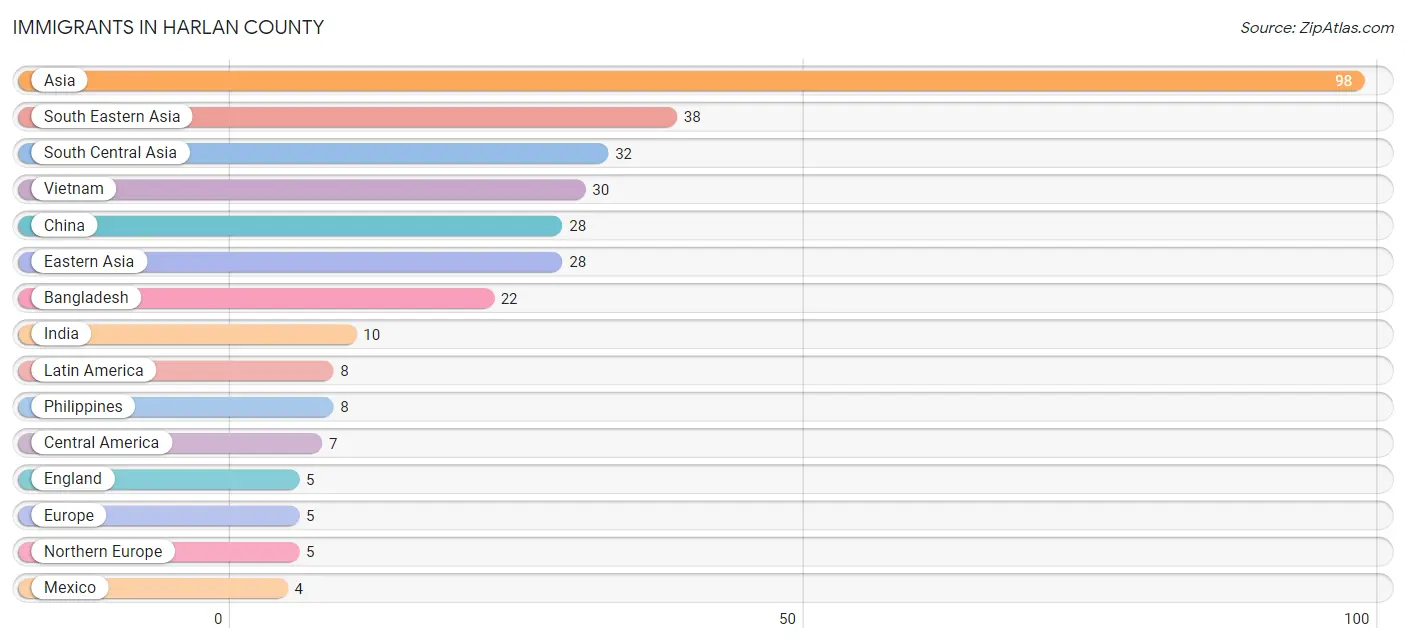
Immigrants in Harlan County
The most numerous immigrant groups reported in Harlan County came from Asia (98 | 0.4%), South Eastern Asia (38 | 0.1%), South Central Asia (32 | 0.1%), Vietnam (30 | 0.1%), and China (28 | 0.1%), together accounting for 0.9% of all Harlan County residents.
| Immigration Origin | # Population | % Population |
| Asia | 98 | 0.4% |
| Bangladesh | 22 | 0.1% |
| Canada | 3 | 0.0% |
| Caribbean | 1 | 0.0% |
| Central America | 7 | 0.0% |
| China | 28 | 0.1% |
| Cuba | 1 | 0.0% |
| Eastern Asia | 28 | 0.1% |
| England | 5 | 0.0% |
| Europe | 5 | 0.0% |
| Guatemala | 3 | 0.0% |
| India | 10 | 0.0% |
| Latin America | 8 | 0.0% |
| Mexico | 4 | 0.0% |
| Northern Europe | 5 | 0.0% |
| Philippines | 8 | 0.0% |
| South Central Asia | 32 | 0.1% |
| South Eastern Asia | 38 | 0.1% |
| Vietnam | 30 | 0.1% | View All 19 Rows |
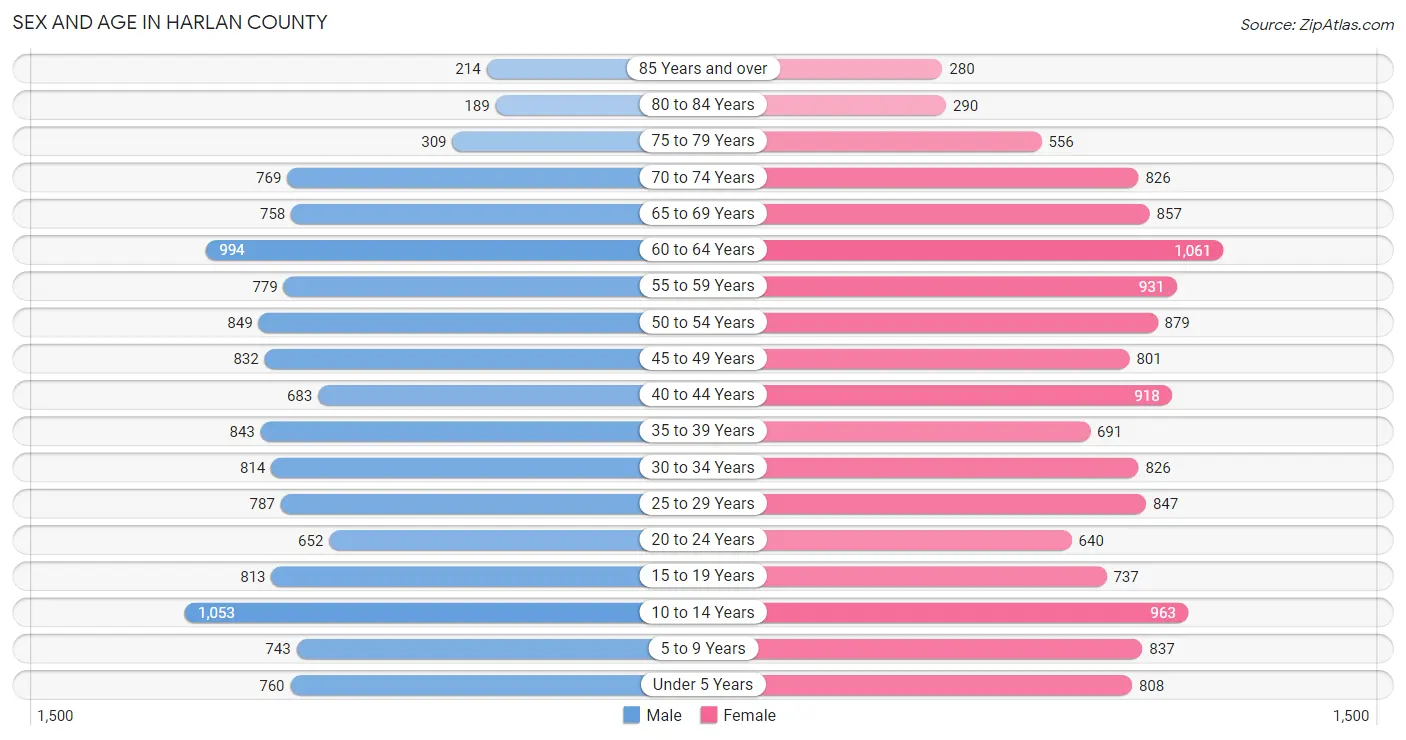
Sex and Age in Harlan County
Sex and Age in Harlan County
The most populous age groups in Harlan County are 10 to 14 Years (1,053 | 8.2%) for men and 60 to 64 Years (1,061 | 7.7%) for women.
| Age Bracket | Male | Female |
| Under 5 Years | 760 (5.9%) | 808 (5.9%) |
| 5 to 9 Years | 743 (5.8%) | 837 (6.1%) |
| 10 to 14 Years | 1,053 (8.2%) | 963 (7.0%) |
| 15 to 19 Years | 813 (6.3%) | 737 (5.4%) |
| 20 to 24 Years | 652 (5.1%) | 640 (4.7%) |
| 25 to 29 Years | 787 (6.1%) | 847 (6.2%) |
| 30 to 34 Years | 814 (6.3%) | 826 (6.0%) |
| 35 to 39 Years | 843 (6.6%) | 691 (5.0%) |
| 40 to 44 Years | 683 (5.3%) | 918 (6.7%) |
| 45 to 49 Years | 832 (6.5%) | 801 (5.8%) |
| 50 to 54 Years | 849 (6.6%) | 879 (6.4%) |
| 55 to 59 Years | 779 (6.1%) | 931 (6.8%) |
| 60 to 64 Years | 994 (7.7%) | 1,061 (7.7%) |
| 65 to 69 Years | 758 (5.9%) | 857 (6.2%) |
| 70 to 74 Years | 769 (6.0%) | 826 (6.0%) |
| 75 to 79 Years | 309 (2.4%) | 556 (4.0%) |
| 80 to 84 Years | 189 (1.5%) | 290 (2.1%) |
| 85 Years and over | 214 (1.7%) | 280 (2.0%) |
| Total | 12,841 (100.0%) | 13,748 (100.0%) |
Families and Households in Harlan County
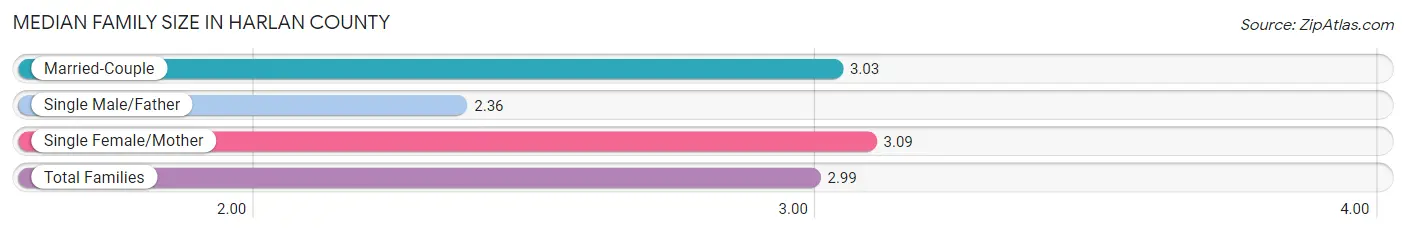
Median Family Size in Harlan County
The median family size in Harlan County is 2.99 persons per family, with single female/mother families (1,491 | 21.0%) accounting for the largest median family size of 3.09 persons per family. On the other hand, single male/father families (565 | 7.9%) represent the smallest median family size with 2.36 persons per family.
| Family Type | # Families | Family Size |
| Married-Couple | 5,059 (71.1%) | 3.03 |
| Single Male/Father | 565 (7.9%) | 2.36 |
| Single Female/Mother | 1,491 (21.0%) | 3.09 |
| Total Families | 7,115 (100.0%) | 2.99 |
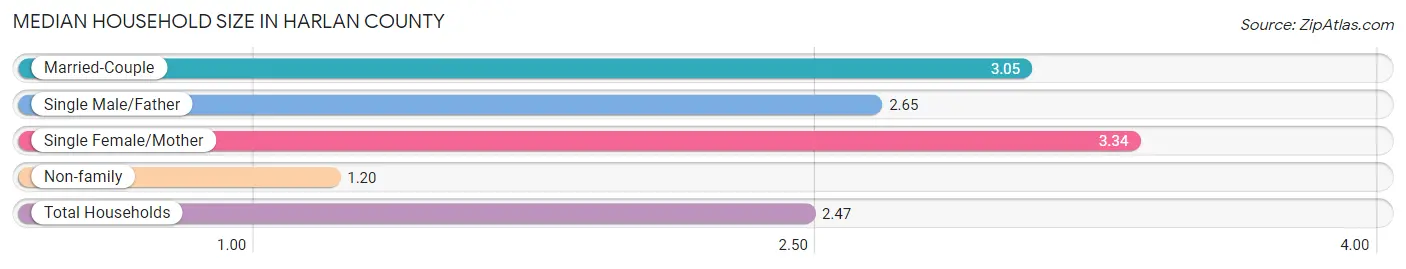
Median Household Size in Harlan County
The median household size in Harlan County is 2.47 persons per household, with single female/mother households (1,491 | 14.2%) accounting for the largest median household size of 3.34 persons per household. non-family households (3,383 | 32.2%) represent the smallest median household size with 1.20 persons per household.
| Household Type | # Households | Household Size |
| Married-Couple | 5,059 (48.2%) | 3.05 |
| Single Male/Father | 565 (5.4%) | 2.65 |
| Single Female/Mother | 1,491 (14.2%) | 3.34 |
| Non-family | 3,383 (32.2%) | 1.20 |
| Total Households | 10,498 (100.0%) | 2.47 |
Household Size by Marriage Status in Harlan County
Out of a total of 10,498 households in Harlan County, 7,115 (67.8%) are family households, while 3,383 (32.2%) are nonfamily households. The most numerous type of family households are 2-person households, comprising 3,682, and the most common type of nonfamily households are 1-person households, comprising 2,954.
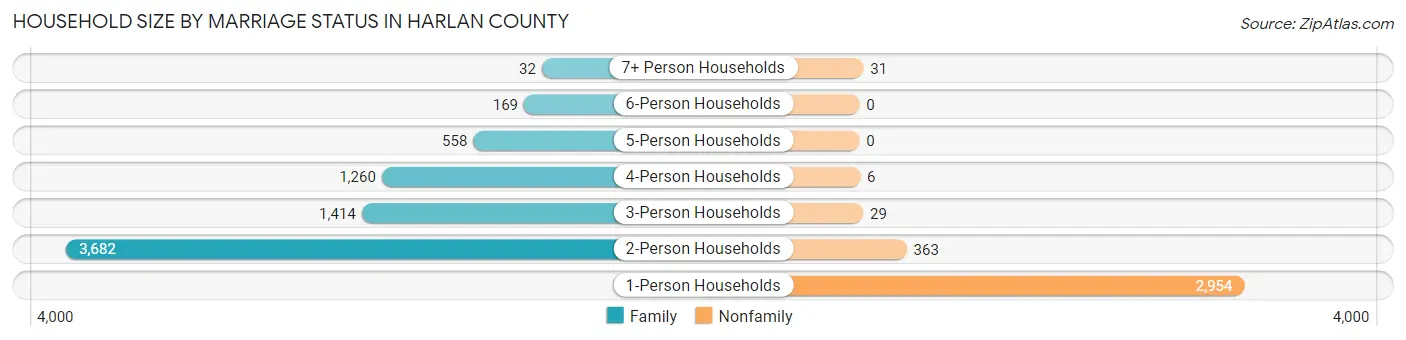
| Household Size | Family Households | Nonfamily Households |
| 1-Person Households | - | 2,954 (28.1%) |
| 2-Person Households | 3,682 (35.1%) | 363 (3.5%) |
| 3-Person Households | 1,414 (13.5%) | 29 (0.3%) |
| 4-Person Households | 1,260 (12.0%) | 6 (0.1%) |
| 5-Person Households | 558 (5.3%) | 0 (0.0%) |
| 6-Person Households | 169 (1.6%) | 0 (0.0%) |
| 7+ Person Households | 32 (0.3%) | 31 (0.3%) |
| Total | 7,115 (67.8%) | 3,383 (32.2%) |
Female Fertility in Harlan County
Fertility by Age in Harlan County
Average fertility rate in Harlan County is 21.0 births per 1,000 women. Women in the age bracket of 20 to 34 years have the highest fertility rate with 47.0 births per 1,000 women. Women in the age bracket of 20 to 34 years acount for 93.1% of all women with births.
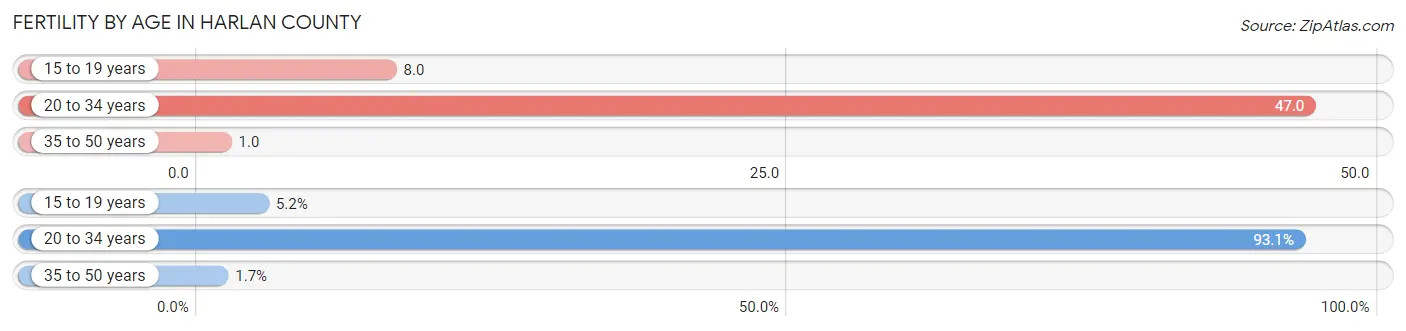
| Age Bracket | Women with Births | Births / 1,000 Women |
| 15 to 19 years | 6 (5.2%) | 8.0 |
| 20 to 34 years | 108 (93.1%) | 47.0 |
| 35 to 50 years | 2 (1.7%) | 1.0 |
| Total | 116 (100.0%) | 21.0 |
Fertility by Age by Marriage Status in Harlan County
69.8% of women with births (116) in Harlan County are married. The highest percentage of unmarried women with births falls into 15 to 19 years age bracket with 100.0% of them unmarried at the time of birth, while the lowest percentage of unmarried women with births belong to 35 to 50 years age bracket with 0.0% of them unmarried.
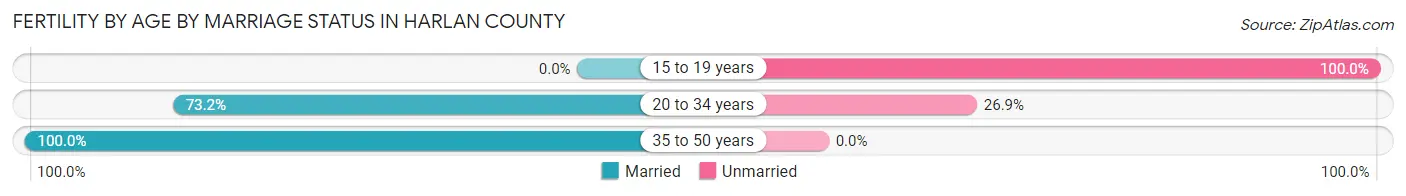
| Age Bracket | Married | Unmarried |
| 15 to 19 years | 0 (0.0%) | 6 (100.0%) |
| 20 to 34 years | 79 (73.2%) | 29 (26.9%) |
| 35 to 50 years | 2 (100.0%) | 0 (0.0%) |
| Total | 81 (69.8%) | 35 (30.2%) |
Fertility by Education in Harlan County
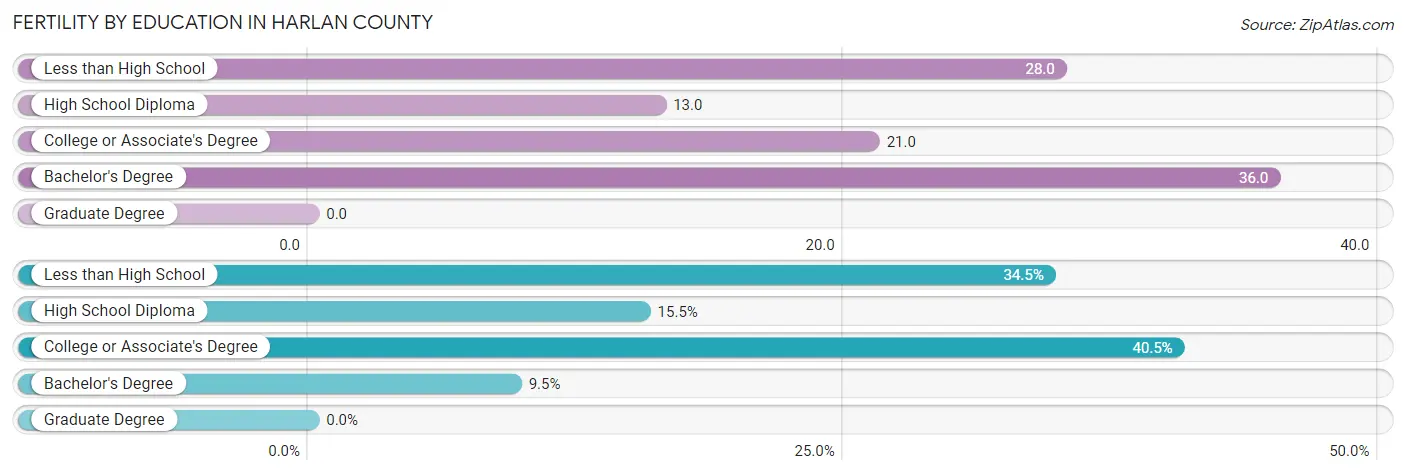
| Educational Attainment | Women with Births | Births / 1,000 Women |
| Less than High School | 40 (34.5%) | 28.0 |
| High School Diploma | 18 (15.5%) | 13.0 |
| College or Associate's Degree | 47 (40.5%) | 21.0 |
| Bachelor's Degree | 11 (9.5%) | 36.0 |
| Graduate Degree | 0 (0.0%) | 0.0 |
| Total | 116 (100.0%) | 21.0 |
Fertility by Education by Marriage Status in Harlan County
30.2% of women with births in Harlan County are unmarried. Women with the educational attainment of college or associate's degree are most likely to be married with 100.0% of them married at childbirth, while women with the educational attainment of high school diploma are least likely to be married with 100.0% of them unmarried at childbirth.
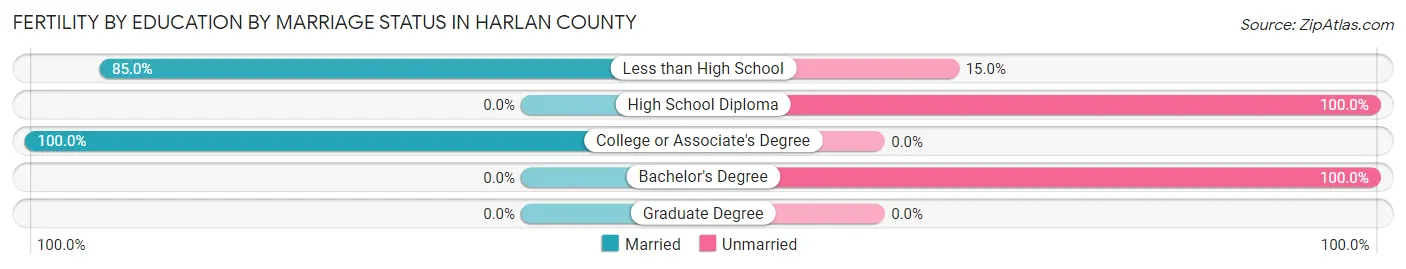
| Educational Attainment | Married | Unmarried |
| Less than High School | 34 (85.0%) | 6 (15.0%) |
| High School Diploma | 0 (0.0%) | 18 (100.0%) |
| College or Associate's Degree | 47 (100.0%) | 0 (0.0%) |
| Bachelor's Degree | 0 (0.0%) | 11 (100.0%) |
| Graduate Degree | 0 (0.0%) | 0 (0.0%) |
| Total | 81 (69.8%) | 35 (30.2%) |
Employment Characteristics in Harlan County
Employment by Class of Employer in Harlan County
Among the 7,271 employed individuals in Harlan County, private company employees (4,431 | 60.9%), not-for-profit organizations (1,104 | 15.2%), and local government employees (639 | 8.8%) make up the most common classes of employment.
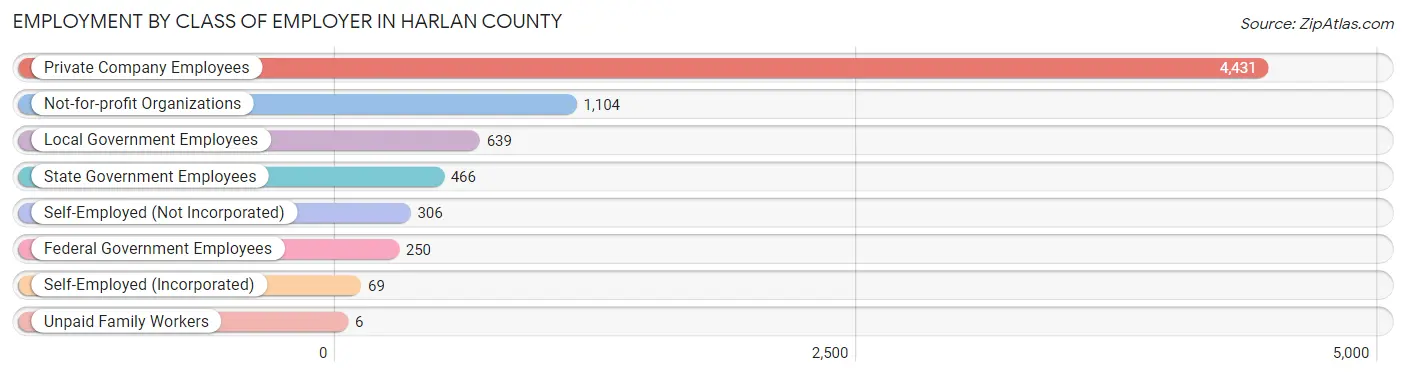
| Employer Class | # Employees | % Employees |
| Private Company Employees | 4,431 | 60.9% |
| Self-Employed (Incorporated) | 69 | 0.9% |
| Self-Employed (Not Incorporated) | 306 | 4.2% |
| Not-for-profit Organizations | 1,104 | 15.2% |
| Local Government Employees | 639 | 8.8% |
| State Government Employees | 466 | 6.4% |
| Federal Government Employees | 250 | 3.4% |
| Unpaid Family Workers | 6 | 0.1% |
| Total | 7,271 | 100.0% |
Employment Status by Age in Harlan County
According to the labor force statistics for Harlan County, out of the total population over 16 years of age (21,112), 39.6% or 8,360 individuals are in the labor force, with 10.8% or 903 of them unemployed. The age group with the highest labor force participation rate is 20 to 24 years, with 68.0% or 879 individuals in the labor force. Within the labor force, the 16 to 19 years age range has the highest percentage of unemployed individuals, with 19.5% or 57 of them being unemployed.
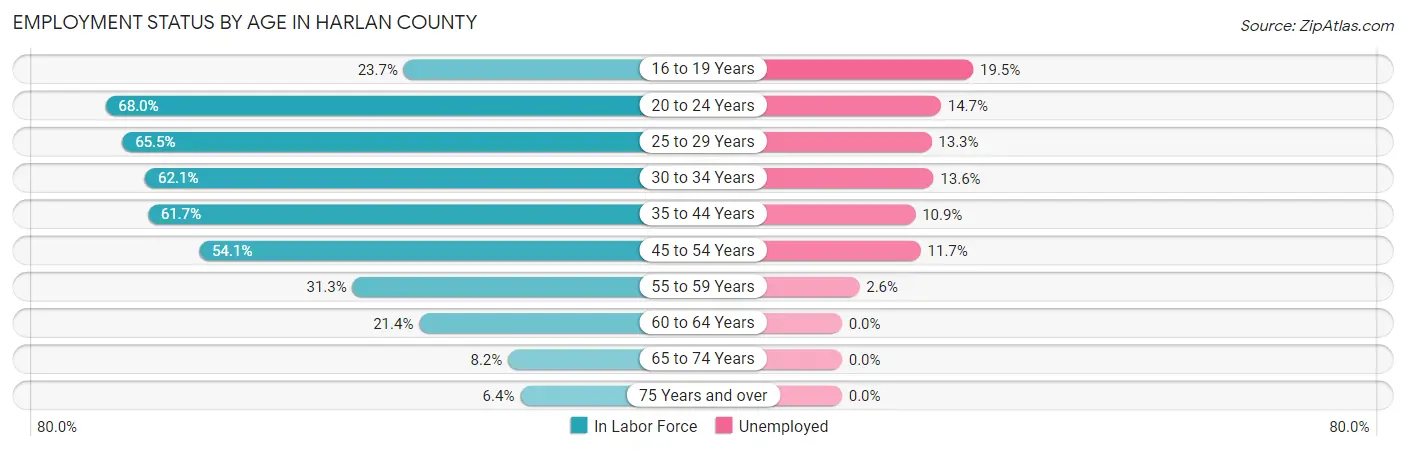
| Age Bracket | In Labor Force | Unemployed |
| 16 to 19 Years | 293 (23.7%) | 57 (19.5%) |
| 20 to 24 Years | 879 (68.0%) | 129 (14.7%) |
| 25 to 29 Years | 1,070 (65.5%) | 142 (13.3%) |
| 30 to 34 Years | 1,018 (62.1%) | 138 (13.6%) |
| 35 to 44 Years | 1,934 (61.7%) | 211 (10.9%) |
| 45 to 54 Years | 1,818 (54.1%) | 213 (11.7%) |
| 55 to 59 Years | 535 (31.3%) | 14 (2.6%) |
| 60 to 64 Years | 440 (21.4%) | 0 (0.0%) |
| 65 to 74 Years | 263 (8.2%) | 0 (0.0%) |
| 75 Years and over | 118 (6.4%) | 0 (0.0%) |
| Total | 8,360 (39.6%) | 903 (10.8%) |
Employment Status by Educational Attainment in Harlan County
According to labor force statistics for Harlan County, 50.4% of individuals (6,822) out of the total population between 25 and 64 years of age (13,535) are in the labor force, with 10.5% or 716 of them being unemployed. The group with the highest labor force participation rate are those with the educational attainment of bachelor's degree or higher, with 81.2% or 1,215 individuals in the labor force. Within the labor force, individuals with less than high school education have the highest percentage of unemployment, with 25.0% or 167 of them being unemployed.
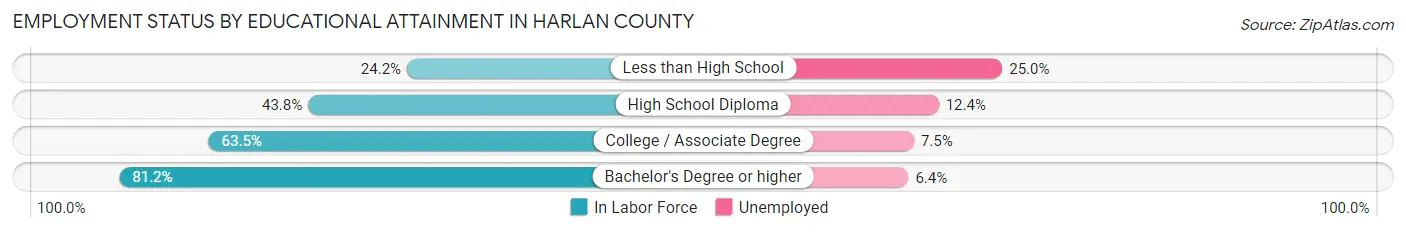
| Educational Attainment | In Labor Force | Unemployed |
| Less than High School | 668 (24.2%) | 690 (25.0%) |
| High School Diploma | 2,134 (43.8%) | 604 (12.4%) |
| College / Associate Degree | 2,797 (63.5%) | 330 (7.5%) |
| Bachelor's Degree or higher | 1,215 (81.2%) | 96 (6.4%) |
| Total | 6,822 (50.4%) | 1,421 (10.5%) |
Employment Occupations by Sex in Harlan County
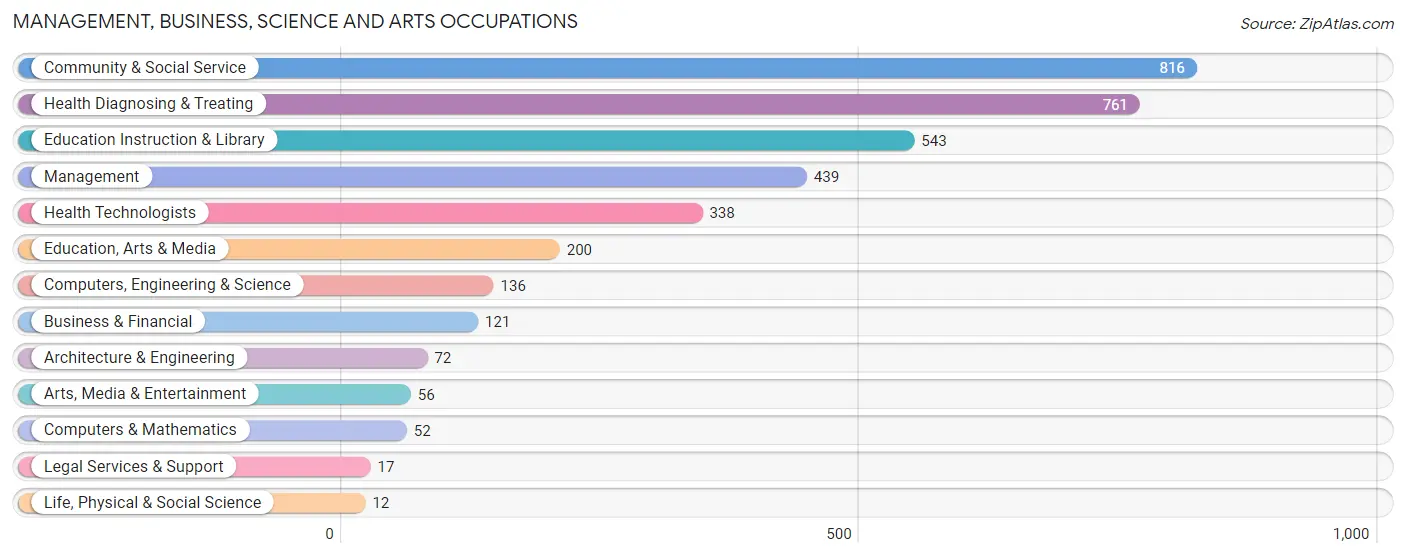
Management, Business, Science and Arts Occupations
The most common Management, Business, Science and Arts occupations in Harlan County are Community & Social Service (816 | 10.9%), Health Diagnosing & Treating (761 | 10.2%), Education Instruction & Library (543 | 7.3%), Management (439 | 5.9%), and Health Technologists (338 | 4.5%).
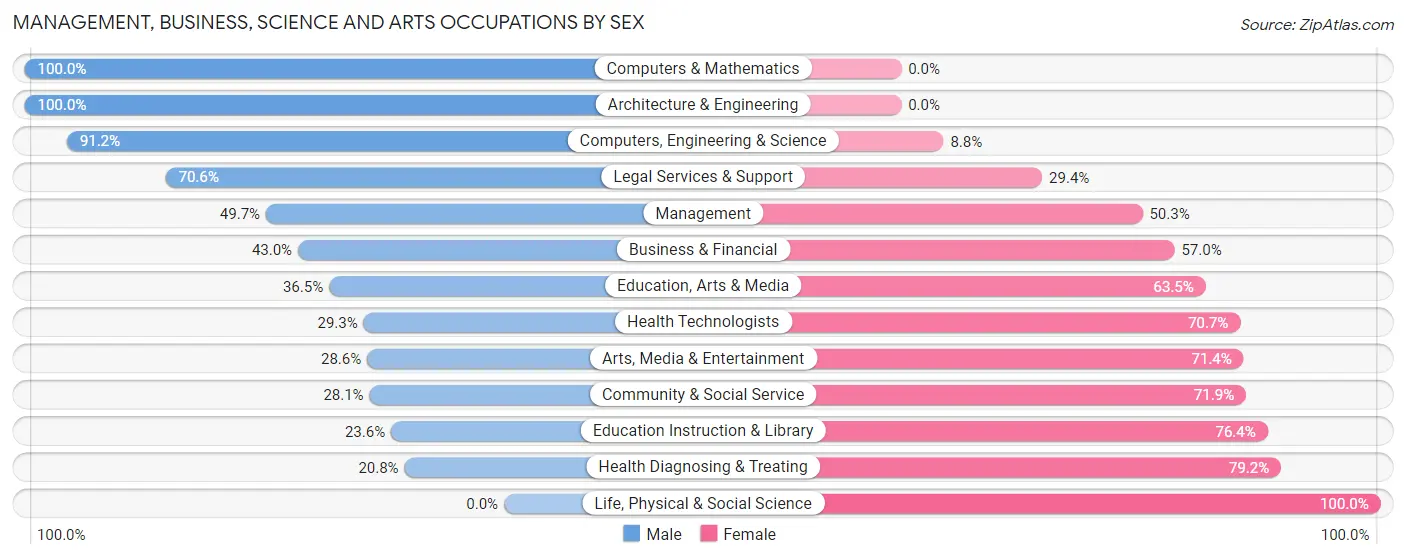
Management, Business, Science and Arts Occupations by Sex
Within the Management, Business, Science and Arts occupations in Harlan County, the most male-oriented occupations are Computers & Mathematics (100.0%), Architecture & Engineering (100.0%), and Computers, Engineering & Science (91.2%), while the most female-oriented occupations are Life, Physical & Social Science (100.0%), Health Diagnosing & Treating (79.2%), and Education Instruction & Library (76.4%).
| Occupation | Male | Female |
| Management | 218 (49.7%) | 221 (50.3%) |
| Business & Financial | 52 (43.0%) | 69 (57.0%) |
| Computers, Engineering & Science | 124 (91.2%) | 12 (8.8%) |
| Computers & Mathematics | 52 (100.0%) | 0 (0.0%) |
| Architecture & Engineering | 72 (100.0%) | 0 (0.0%) |
| Life, Physical & Social Science | 0 (0.0%) | 12 (100.0%) |
| Community & Social Service | 229 (28.1%) | 587 (71.9%) |
| Education, Arts & Media | 73 (36.5%) | 127 (63.5%) |
| Legal Services & Support | 12 (70.6%) | 5 (29.4%) |
| Education Instruction & Library | 128 (23.6%) | 415 (76.4%) |
| Arts, Media & Entertainment | 16 (28.6%) | 40 (71.4%) |
| Health Diagnosing & Treating | 158 (20.8%) | 603 (79.2%) |
| Health Technologists | 99 (29.3%) | 239 (70.7%) |
| Total (Category) | 781 (34.4%) | 1,492 (65.6%) |
| Total (Overall) | 3,663 (49.1%) | 3,800 (50.9%) |
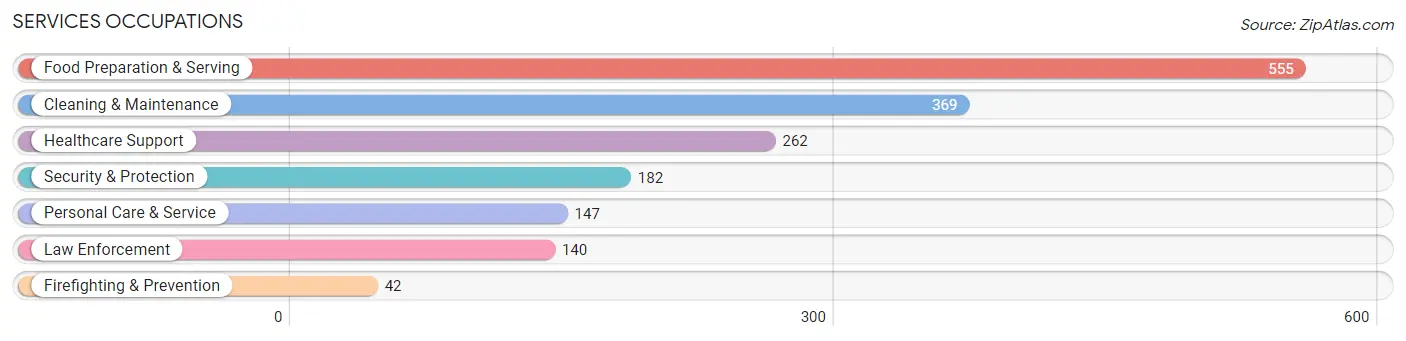
Services Occupations
The most common Services occupations in Harlan County are Food Preparation & Serving (555 | 7.4%), Cleaning & Maintenance (369 | 4.9%), Healthcare Support (262 | 3.5%), Security & Protection (182 | 2.4%), and Personal Care & Service (147 | 2.0%).
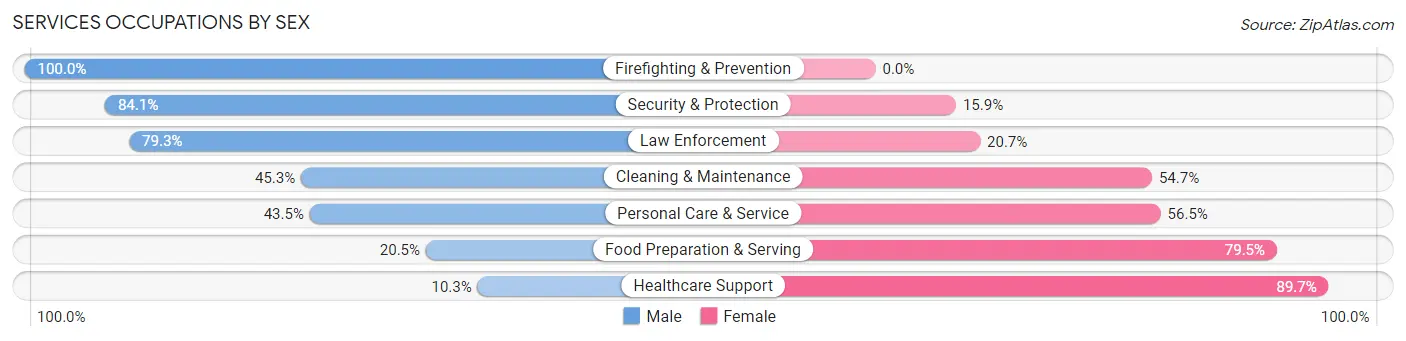
Services Occupations by Sex
Within the Services occupations in Harlan County, the most male-oriented occupations are Firefighting & Prevention (100.0%), Security & Protection (84.1%), and Law Enforcement (79.3%), while the most female-oriented occupations are Healthcare Support (89.7%), Food Preparation & Serving (79.5%), and Personal Care & Service (56.5%).
| Occupation | Male | Female |
| Healthcare Support | 27 (10.3%) | 235 (89.7%) |
| Security & Protection | 153 (84.1%) | 29 (15.9%) |
| Firefighting & Prevention | 42 (100.0%) | 0 (0.0%) |
| Law Enforcement | 111 (79.3%) | 29 (20.7%) |
| Food Preparation & Serving | 114 (20.5%) | 441 (79.5%) |
| Cleaning & Maintenance | 167 (45.3%) | 202 (54.7%) |
| Personal Care & Service | 64 (43.5%) | 83 (56.5%) |
| Total (Category) | 525 (34.6%) | 990 (65.3%) |
| Total (Overall) | 3,663 (49.1%) | 3,800 (50.9%) |
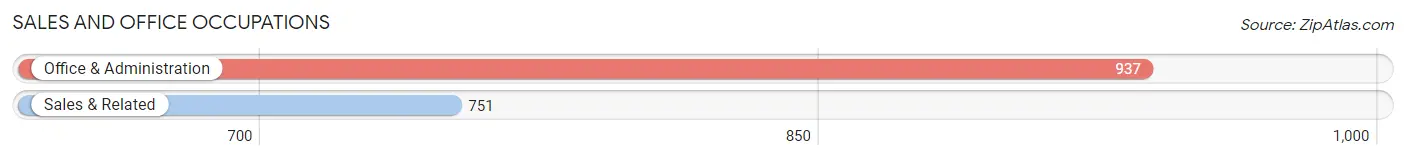
Sales and Office Occupations
The most common Sales and Office occupations in Harlan County are Office & Administration (937 | 12.6%), and Sales & Related (751 | 10.1%).
Sales and Office Occupations by Sex
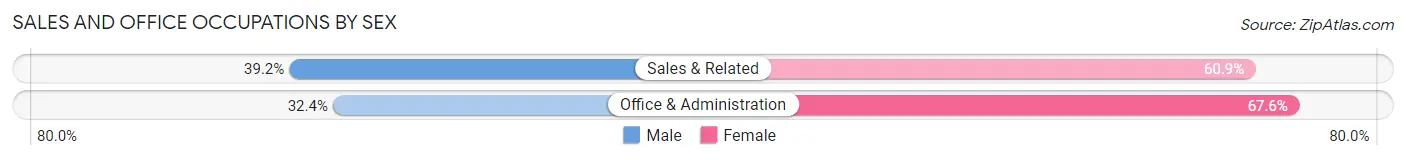
| Occupation | Male | Female |
| Sales & Related | 294 (39.2%) | 457 (60.9%) |
| Office & Administration | 304 (32.4%) | 633 (67.6%) |
| Total (Category) | 598 (35.4%) | 1,090 (64.6%) |
| Total (Overall) | 3,663 (49.1%) | 3,800 (50.9%) |
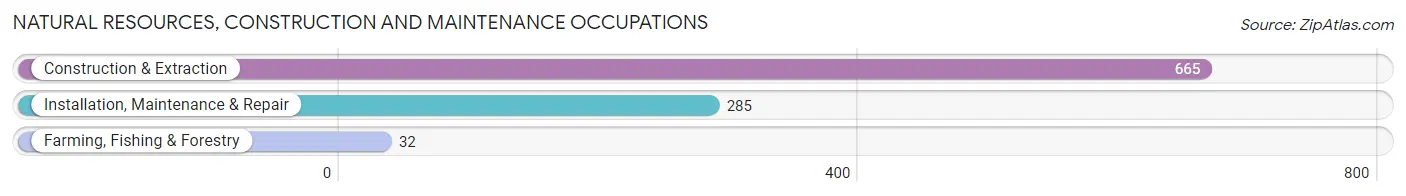
Natural Resources, Construction and Maintenance Occupations
The most common Natural Resources, Construction and Maintenance occupations in Harlan County are Construction & Extraction (665 | 8.9%), Installation, Maintenance & Repair (285 | 3.8%), and Farming, Fishing & Forestry (32 | 0.4%).
Natural Resources, Construction and Maintenance Occupations by Sex
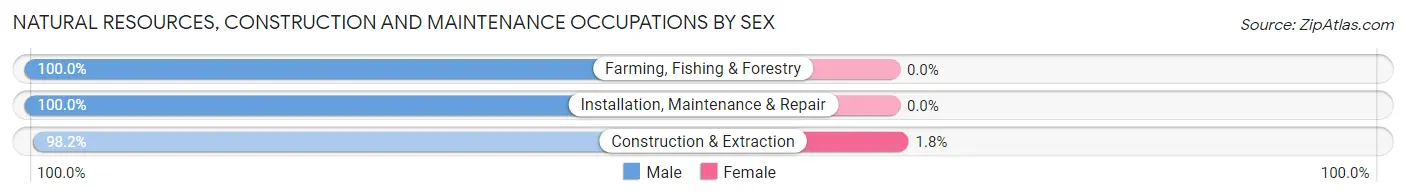
| Occupation | Male | Female |
| Farming, Fishing & Forestry | 32 (100.0%) | 0 (0.0%) |
| Construction & Extraction | 653 (98.2%) | 12 (1.8%) |
| Installation, Maintenance & Repair | 285 (100.0%) | 0 (0.0%) |
| Total (Category) | 970 (98.8%) | 12 (1.2%) |
| Total (Overall) | 3,663 (49.1%) | 3,800 (50.9%) |
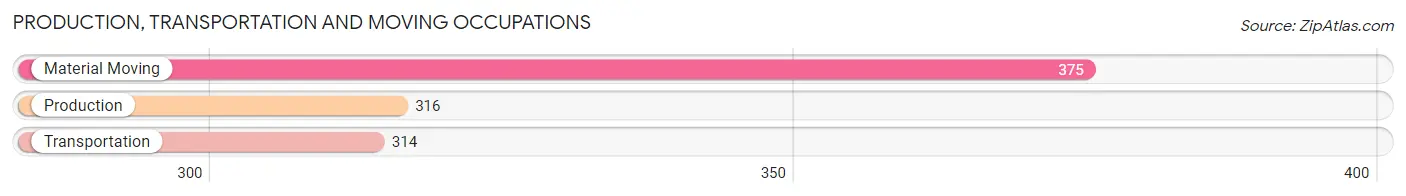
Production, Transportation and Moving Occupations
The most common Production, Transportation and Moving occupations in Harlan County are Material Moving (375 | 5.0%), Production (316 | 4.2%), and Transportation (314 | 4.2%).
Production, Transportation and Moving Occupations by Sex
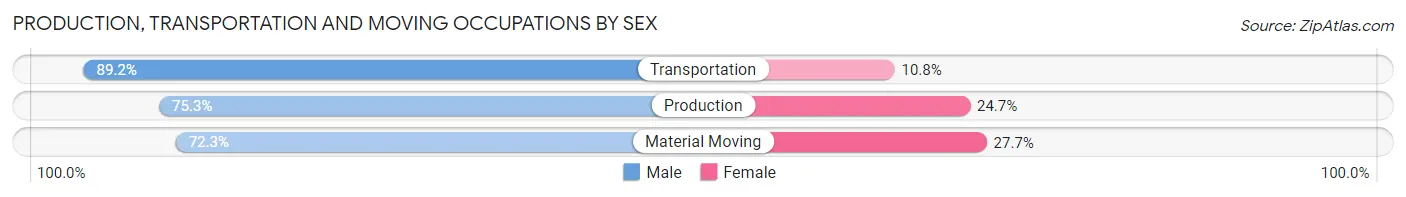
| Occupation | Male | Female |
| Production | 238 (75.3%) | 78 (24.7%) |
| Transportation | 280 (89.2%) | 34 (10.8%) |
| Material Moving | 271 (72.3%) | 104 (27.7%) |
| Total (Category) | 789 (78.5%) | 216 (21.5%) |
| Total (Overall) | 3,663 (49.1%) | 3,800 (50.9%) |
Employment Industries by Sex in Harlan County
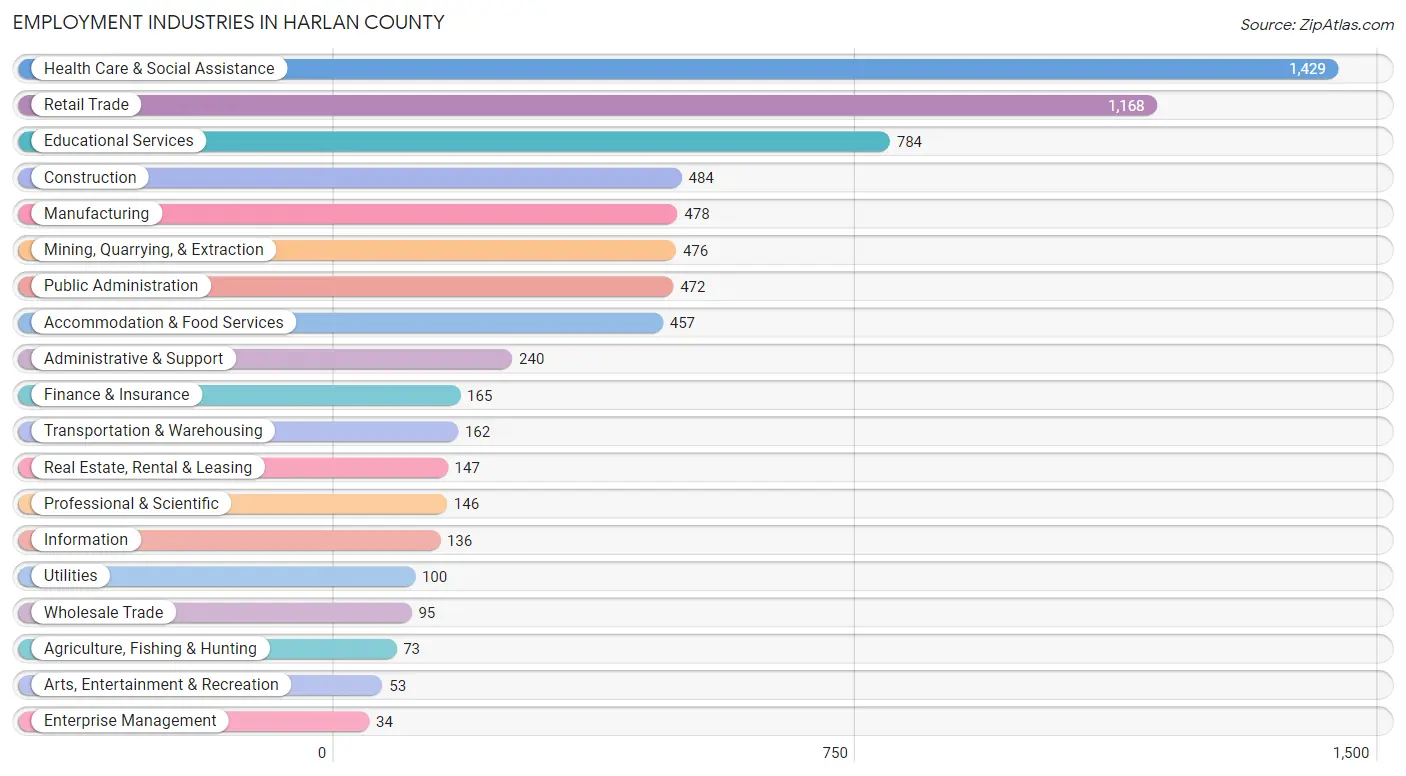
Employment Industries in Harlan County
The major employment industries in Harlan County include Health Care & Social Assistance (1,429 | 19.2%), Retail Trade (1,168 | 15.7%), Educational Services (784 | 10.5%), Construction (484 | 6.5%), and Manufacturing (478 | 6.4%).
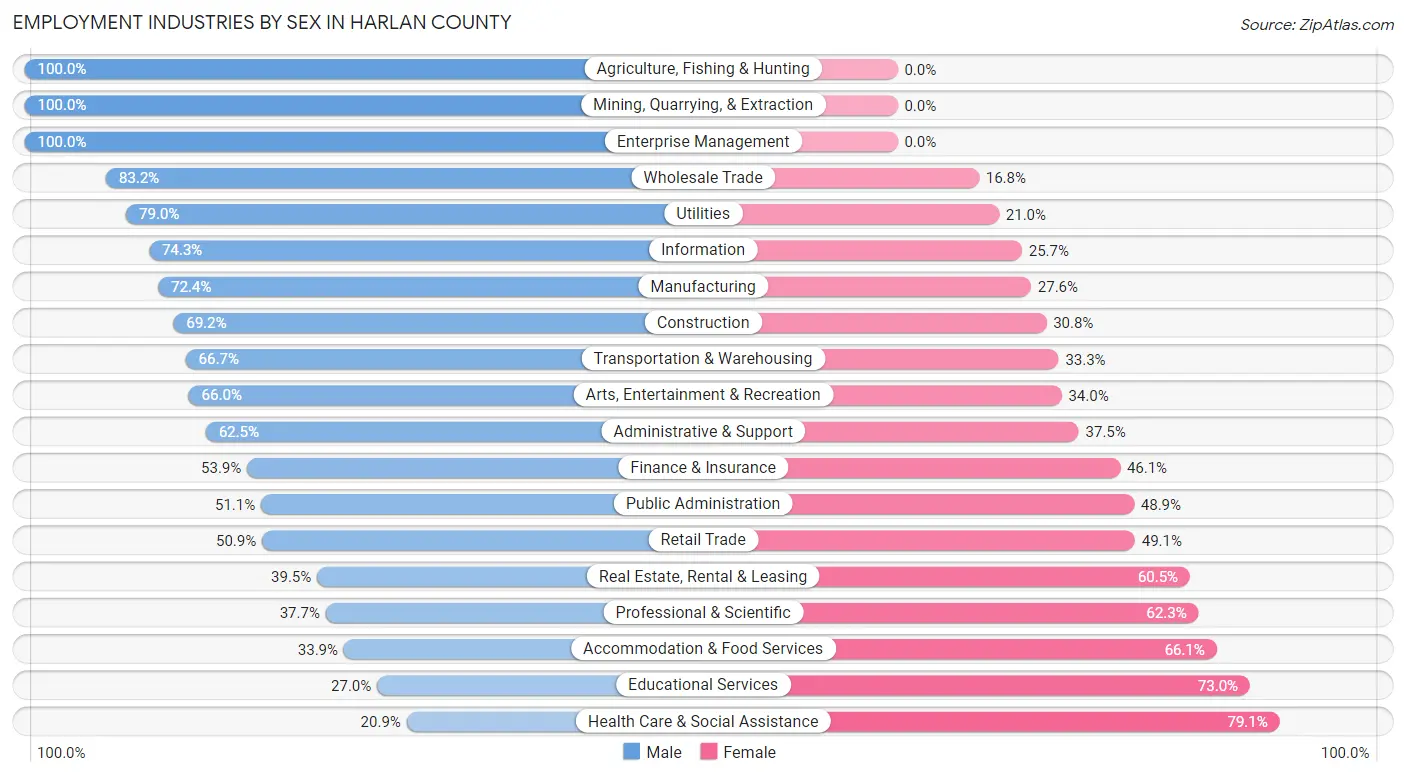
Employment Industries by Sex in Harlan County
The Harlan County industries that see more men than women are Agriculture, Fishing & Hunting (100.0%), Mining, Quarrying, & Extraction (100.0%), and Enterprise Management (100.0%), whereas the industries that tend to have a higher number of women are Health Care & Social Assistance (79.1%), Educational Services (73.0%), and Accommodation & Food Services (66.1%).
| Industry | Male | Female |
| Agriculture, Fishing & Hunting | 73 (100.0%) | 0 (0.0%) |
| Mining, Quarrying, & Extraction | 476 (100.0%) | 0 (0.0%) |
| Construction | 335 (69.2%) | 149 (30.8%) |
| Manufacturing | 346 (72.4%) | 132 (27.6%) |
| Wholesale Trade | 79 (83.2%) | 16 (16.8%) |
| Retail Trade | 594 (50.9%) | 574 (49.1%) |
| Transportation & Warehousing | 108 (66.7%) | 54 (33.3%) |
| Utilities | 79 (79.0%) | 21 (21.0%) |
| Information | 101 (74.3%) | 35 (25.7%) |
| Finance & Insurance | 89 (53.9%) | 76 (46.1%) |
| Real Estate, Rental & Leasing | 58 (39.5%) | 89 (60.5%) |
| Professional & Scientific | 55 (37.7%) | 91 (62.3%) |
| Enterprise Management | 34 (100.0%) | 0 (0.0%) |
| Administrative & Support | 150 (62.5%) | 90 (37.5%) |
| Educational Services | 212 (27.0%) | 572 (73.0%) |
| Health Care & Social Assistance | 299 (20.9%) | 1,130 (79.1%) |
| Arts, Entertainment & Recreation | 35 (66.0%) | 18 (34.0%) |
| Accommodation & Food Services | 155 (33.9%) | 302 (66.1%) |
| Public Administration | 241 (51.1%) | 231 (48.9%) |
| Total | 3,663 (49.1%) | 3,800 (50.9%) |
Education in Harlan County
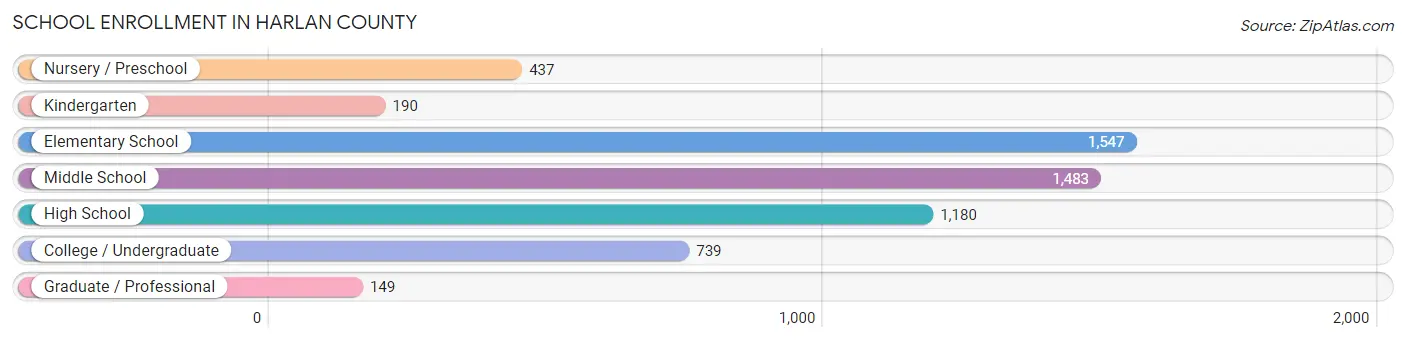
School Enrollment in Harlan County
The most common levels of schooling among the 5,725 students in Harlan County are elementary school (1,547 | 27.0%), middle school (1,483 | 25.9%), and high school (1,180 | 20.6%).
| School Level | # Students | % Students |
| Nursery / Preschool | 437 | 7.6% |
| Kindergarten | 190 | 3.3% |
| Elementary School | 1,547 | 27.0% |
| Middle School | 1,483 | 25.9% |
| High School | 1,180 | 20.6% |
| College / Undergraduate | 739 | 12.9% |
| Graduate / Professional | 149 | 2.6% |
| Total | 5,725 | 100.0% |
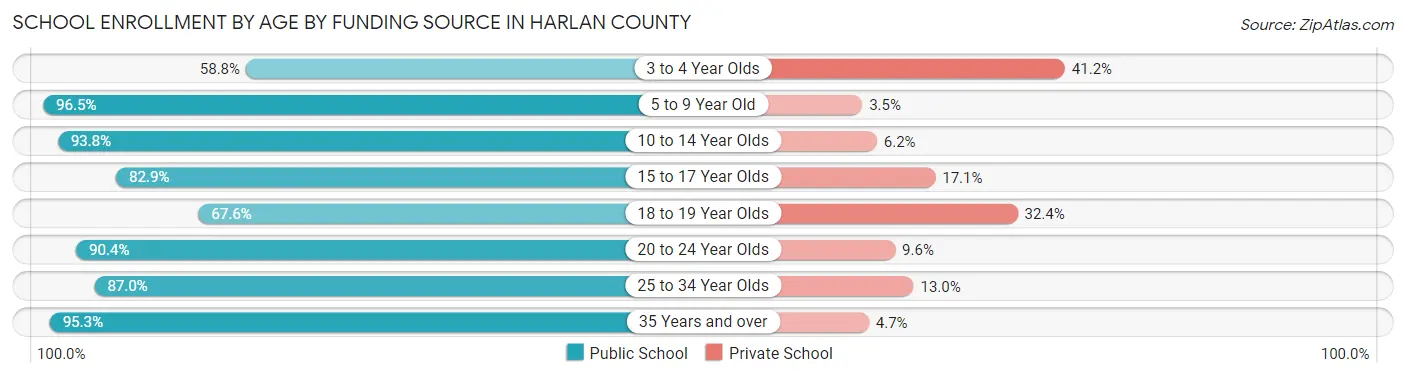
School Enrollment by Age by Funding Source in Harlan County
Out of a total of 5,725 students who are enrolled in schools in Harlan County, 647 (11.3%) attend a private institution, while the remaining 5,078 (88.7%) are enrolled in public schools. The age group of 3 to 4 year olds has the highest likelihood of being enrolled in private schools, with 150 (41.2% in the age bracket) enrolled. Conversely, the age group of 5 to 9 year old has the lowest likelihood of being enrolled in a private school, with 1,369 (96.5% in the age bracket) attending a public institution.
| Age Bracket | Public School | Private School |
| 3 to 4 Year Olds | 214 (58.8%) | 150 (41.2%) |
| 5 to 9 Year Old | 1,369 (96.5%) | 49 (3.5%) |
| 10 to 14 Year Olds | 1,837 (93.8%) | 121 (6.2%) |
| 15 to 17 Year Olds | 705 (82.9%) | 145 (17.1%) |
| 18 to 19 Year Olds | 213 (67.6%) | 102 (32.4%) |
| 20 to 24 Year Olds | 264 (90.4%) | 28 (9.6%) |
| 25 to 34 Year Olds | 274 (87.0%) | 41 (13.0%) |
| 35 Years and over | 203 (95.3%) | 10 (4.7%) |
| Total | 5,078 (88.7%) | 647 (11.3%) |
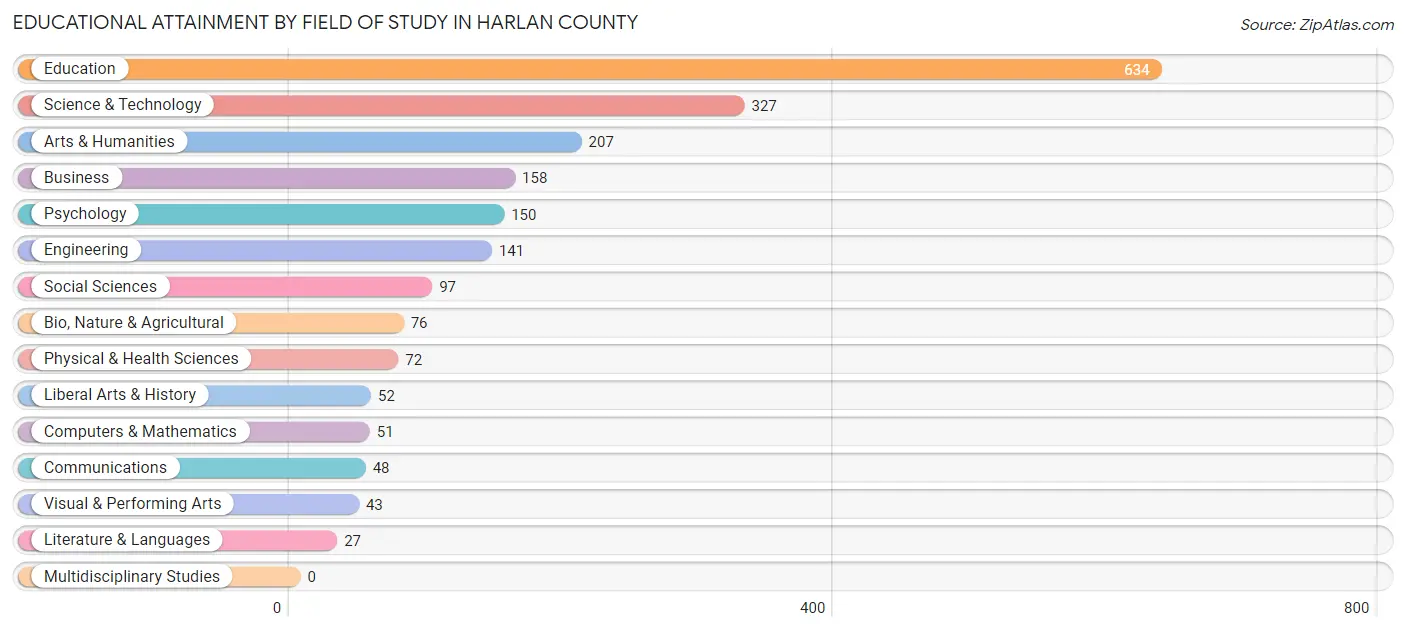
Educational Attainment by Field of Study in Harlan County
Education (634 | 30.4%), science & technology (327 | 15.7%), arts & humanities (207 | 9.9%), business (158 | 7.6%), and psychology (150 | 7.2%) are the most common fields of study among 2,083 individuals in Harlan County who have obtained a bachelor's degree or higher.
| Field of Study | # Graduates | % Graduates |
| Computers & Mathematics | 51 | 2.5% |
| Bio, Nature & Agricultural | 76 | 3.6% |
| Physical & Health Sciences | 72 | 3.5% |
| Psychology | 150 | 7.2% |
| Social Sciences | 97 | 4.7% |
| Engineering | 141 | 6.8% |
| Multidisciplinary Studies | 0 | 0.0% |
| Science & Technology | 327 | 15.7% |
| Business | 158 | 7.6% |
| Education | 634 | 30.4% |
| Literature & Languages | 27 | 1.3% |
| Liberal Arts & History | 52 | 2.5% |
| Visual & Performing Arts | 43 | 2.1% |
| Communications | 48 | 2.3% |
| Arts & Humanities | 207 | 9.9% |
| Total | 2,083 | 100.0% |
Transportation & Commute in Harlan County
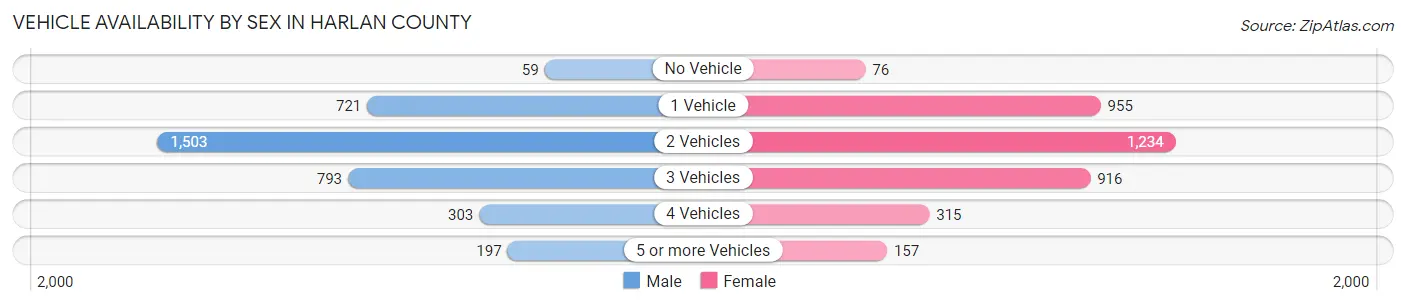
Vehicle Availability by Sex in Harlan County
The most prevalent vehicle ownership categories in Harlan County are males with 2 vehicles (1,503, accounting for 42.0%) and females with 2 vehicles (1,234, making up 41.1%).
| Vehicles Available | Male | Female |
| No Vehicle | 59 (1.7%) | 76 (2.1%) |
| 1 Vehicle | 721 (20.2%) | 955 (26.1%) |
| 2 Vehicles | 1,503 (42.0%) | 1,234 (33.8%) |
| 3 Vehicles | 793 (22.2%) | 916 (25.1%) |
| 4 Vehicles | 303 (8.5%) | 315 (8.6%) |
| 5 or more Vehicles | 197 (5.5%) | 157 (4.3%) |
| Total | 3,576 (100.0%) | 3,653 (100.0%) |
Commute Time in Harlan County
The most frequently occuring commute durations in Harlan County are 10 to 14 minutes (1,362 commuters, 19.9%), 15 to 19 minutes (1,087 commuters, 15.9%), and 5 to 9 minutes (1,015 commuters, 14.8%).
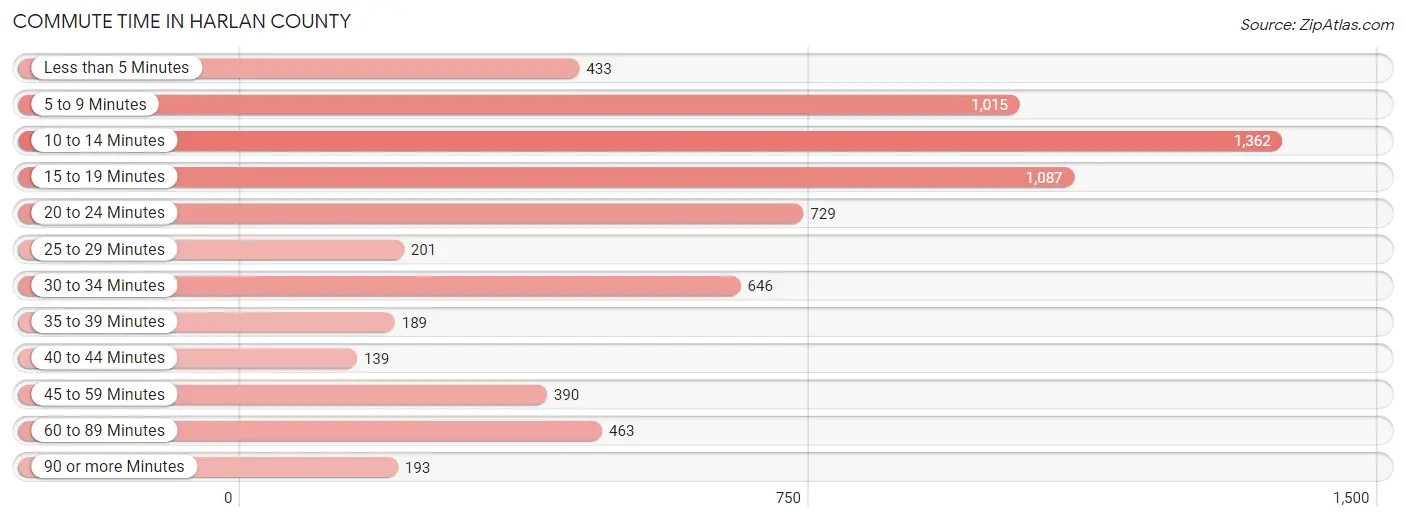
| Commute Time | # Commuters | % Commuters |
| Less than 5 Minutes | 433 | 6.3% |
| 5 to 9 Minutes | 1,015 | 14.8% |
| 10 to 14 Minutes | 1,362 | 19.9% |
| 15 to 19 Minutes | 1,087 | 15.9% |
| 20 to 24 Minutes | 729 | 10.6% |
| 25 to 29 Minutes | 201 | 2.9% |
| 30 to 34 Minutes | 646 | 9.4% |
| 35 to 39 Minutes | 189 | 2.8% |
| 40 to 44 Minutes | 139 | 2.0% |
| 45 to 59 Minutes | 390 | 5.7% |
| 60 to 89 Minutes | 463 | 6.8% |
| 90 or more Minutes | 193 | 2.8% |
Commute Time by Sex in Harlan County
The most common commute times in Harlan County are 10 to 14 minutes (551 commuters, 16.5%) for males and 10 to 14 minutes (811 commuters, 23.2%) for females.
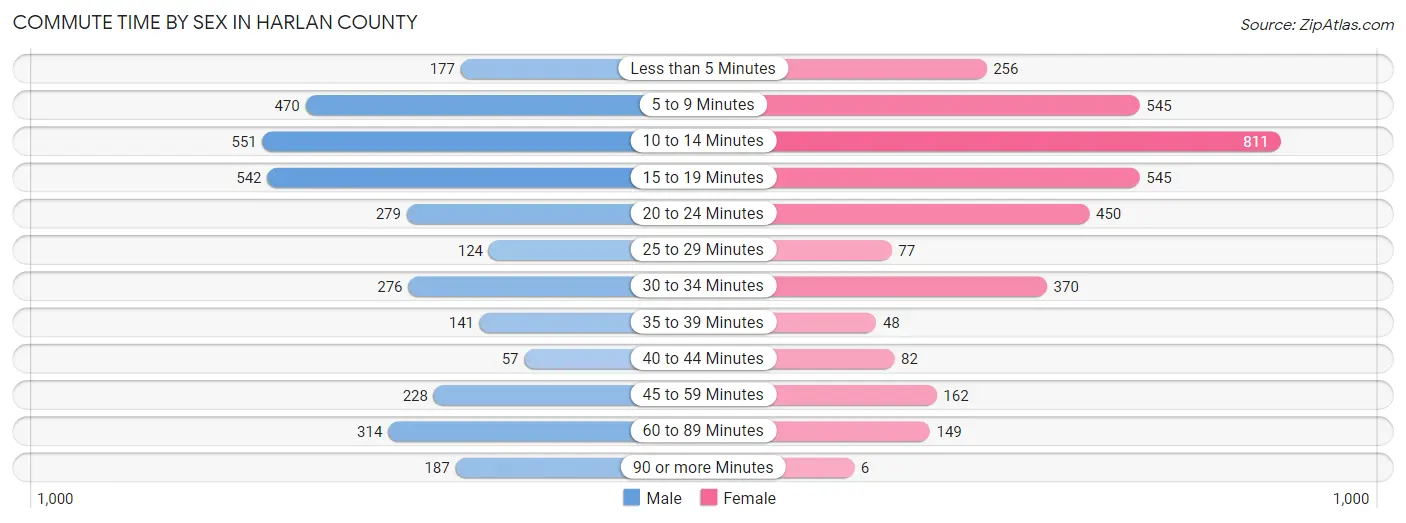
| Commute Time | Male | Female |
| Less than 5 Minutes | 177 (5.3%) | 256 (7.3%) |
| 5 to 9 Minutes | 470 (14.1%) | 545 (15.6%) |
| 10 to 14 Minutes | 551 (16.5%) | 811 (23.2%) |
| 15 to 19 Minutes | 542 (16.2%) | 545 (15.6%) |
| 20 to 24 Minutes | 279 (8.3%) | 450 (12.9%) |
| 25 to 29 Minutes | 124 (3.7%) | 77 (2.2%) |
| 30 to 34 Minutes | 276 (8.3%) | 370 (10.6%) |
| 35 to 39 Minutes | 141 (4.2%) | 48 (1.4%) |
| 40 to 44 Minutes | 57 (1.7%) | 82 (2.3%) |
| 45 to 59 Minutes | 228 (6.8%) | 162 (4.6%) |
| 60 to 89 Minutes | 314 (9.4%) | 149 (4.3%) |
| 90 or more Minutes | 187 (5.6%) | 6 (0.2%) |
Time of Departure to Work by Sex in Harlan County
The most frequent times of departure to work in Harlan County are 7:00 AM to 7:29 AM (550, 16.4%) for males and 7:30 AM to 7:59 AM (662, 18.9%) for females.
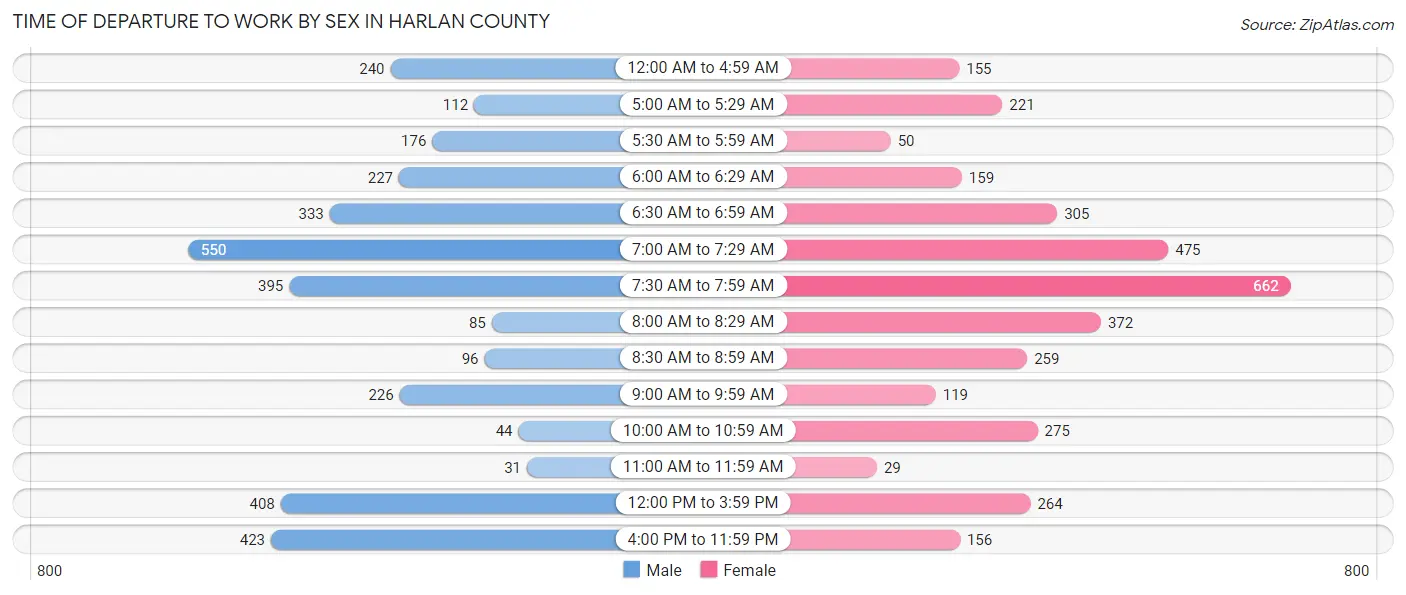
| Time of Departure | Male | Female |
| 12:00 AM to 4:59 AM | 240 (7.2%) | 155 (4.4%) |
| 5:00 AM to 5:29 AM | 112 (3.4%) | 221 (6.3%) |
| 5:30 AM to 5:59 AM | 176 (5.3%) | 50 (1.4%) |
| 6:00 AM to 6:29 AM | 227 (6.8%) | 159 (4.5%) |
| 6:30 AM to 6:59 AM | 333 (10.0%) | 305 (8.7%) |
| 7:00 AM to 7:29 AM | 550 (16.4%) | 475 (13.6%) |
| 7:30 AM to 7:59 AM | 395 (11.8%) | 662 (18.9%) |
| 8:00 AM to 8:29 AM | 85 (2.5%) | 372 (10.6%) |
| 8:30 AM to 8:59 AM | 96 (2.9%) | 259 (7.4%) |
| 9:00 AM to 9:59 AM | 226 (6.8%) | 119 (3.4%) |
| 10:00 AM to 10:59 AM | 44 (1.3%) | 275 (7.9%) |
| 11:00 AM to 11:59 AM | 31 (0.9%) | 29 (0.8%) |
| 12:00 PM to 3:59 PM | 408 (12.2%) | 264 (7.5%) |
| 4:00 PM to 11:59 PM | 423 (12.6%) | 156 (4.5%) |
| Total | 3,346 (100.0%) | 3,501 (100.0%) |
Housing Occupancy in Harlan County
Occupancy by Ownership in Harlan County
Of the total 10,498 dwellings in Harlan County, owner-occupied units account for 7,230 (68.9%), while renter-occupied units make up 3,268 (31.1%).
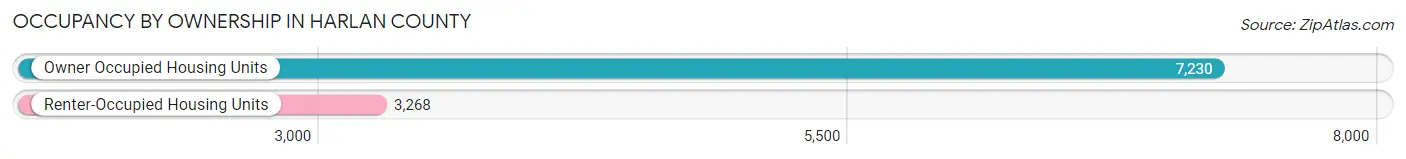
| Occupancy | # Housing Units | % Housing Units |
| Owner Occupied Housing Units | 7,230 | 68.9% |
| Renter-Occupied Housing Units | 3,268 | 31.1% |
| Total Occupied Housing Units | 10,498 | 100.0% |
Occupancy by Household Size in Harlan County
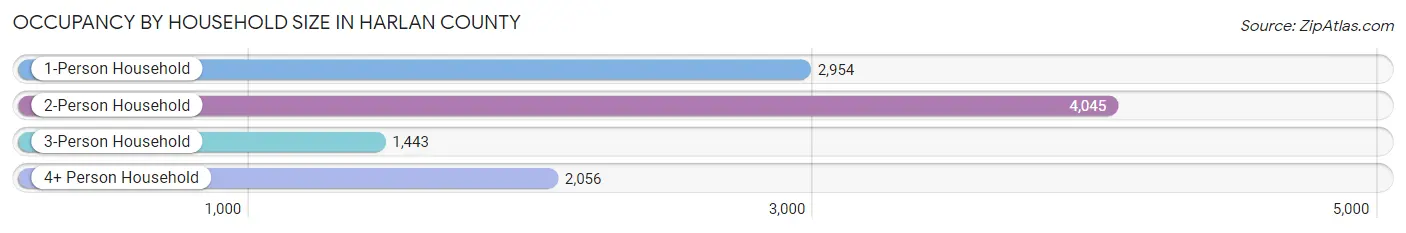
| Household Size | # Housing Units | % Housing Units |
| 1-Person Household | 2,954 | 28.1% |
| 2-Person Household | 4,045 | 38.5% |
| 3-Person Household | 1,443 | 13.8% |
| 4+ Person Household | 2,056 | 19.6% |
| Total Housing Units | 10,498 | 100.0% |
Occupancy by Ownership by Household Size in Harlan County
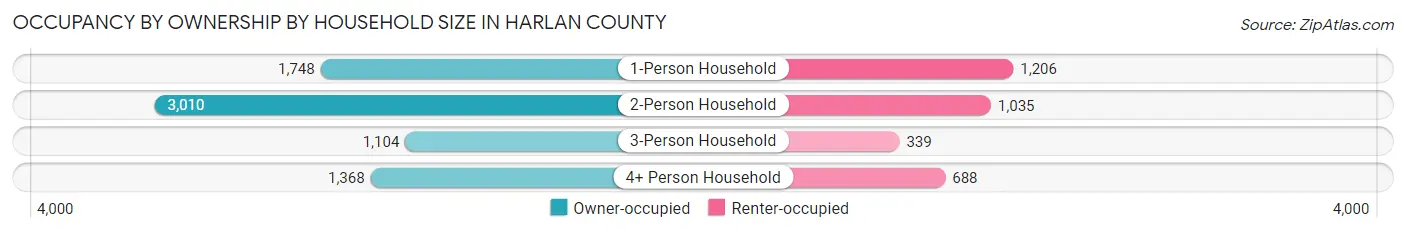
| Household Size | Owner-occupied | Renter-occupied |
| 1-Person Household | 1,748 (59.2%) | 1,206 (40.8%) |
| 2-Person Household | 3,010 (74.4%) | 1,035 (25.6%) |
| 3-Person Household | 1,104 (76.5%) | 339 (23.5%) |
| 4+ Person Household | 1,368 (66.5%) | 688 (33.5%) |
| Total Housing Units | 7,230 (68.9%) | 3,268 (31.1%) |
Occupancy by Educational Attainment in Harlan County
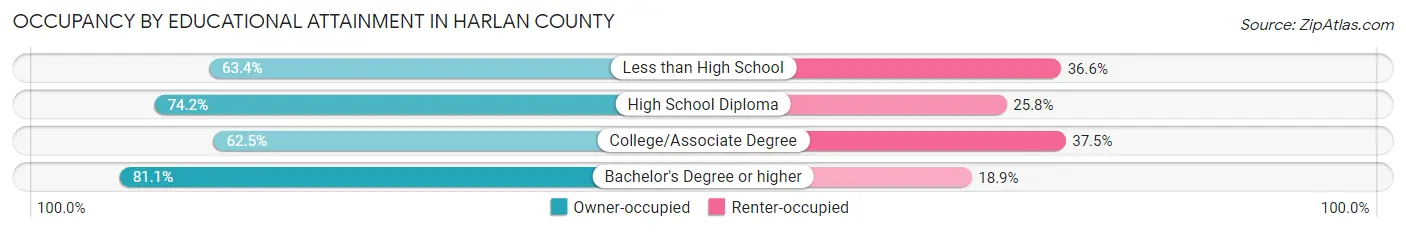
| Household Size | Owner-occupied | Renter-occupied |
| Less than High School | 1,452 (63.4%) | 838 (36.6%) |
| High School Diploma | 2,650 (74.2%) | 922 (25.8%) |
| College/Associate Degree | 2,126 (62.5%) | 1,275 (37.5%) |
| Bachelor's Degree or higher | 1,002 (81.1%) | 233 (18.9%) |
Occupancy by Age of Householder in Harlan County
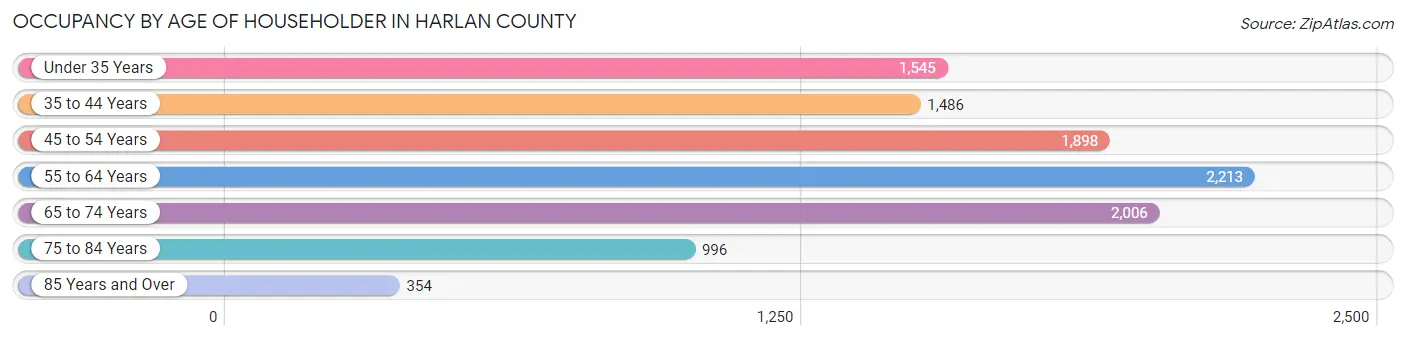
| Age Bracket | # Households | % Households |
| Under 35 Years | 1,545 | 14.7% |
| 35 to 44 Years | 1,486 | 14.2% |
| 45 to 54 Years | 1,898 | 18.1% |
| 55 to 64 Years | 2,213 | 21.1% |
| 65 to 74 Years | 2,006 | 19.1% |
| 75 to 84 Years | 996 | 9.5% |
| 85 Years and Over | 354 | 3.4% |
| Total | 10,498 | 100.0% |
Housing Finances in Harlan County
Median Income by Occupancy in Harlan County
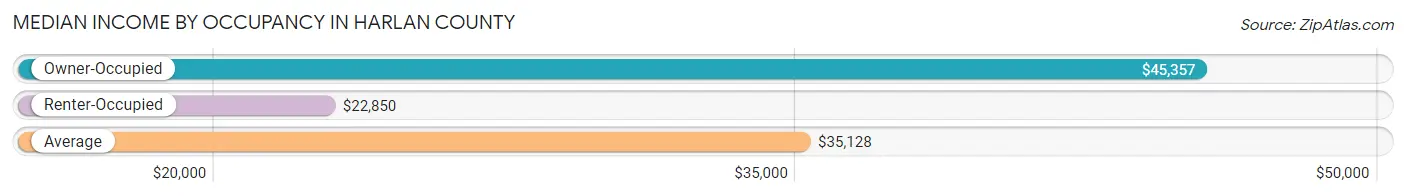
| Occupancy Type | # Households | Median Income |
| Owner-Occupied | 7,230 (68.9%) | $45,357 |
| Renter-Occupied | 3,268 (31.1%) | $22,850 |
| Average | 10,498 (100.0%) | $35,128 |
Occupancy by Householder Income Bracket in Harlan County
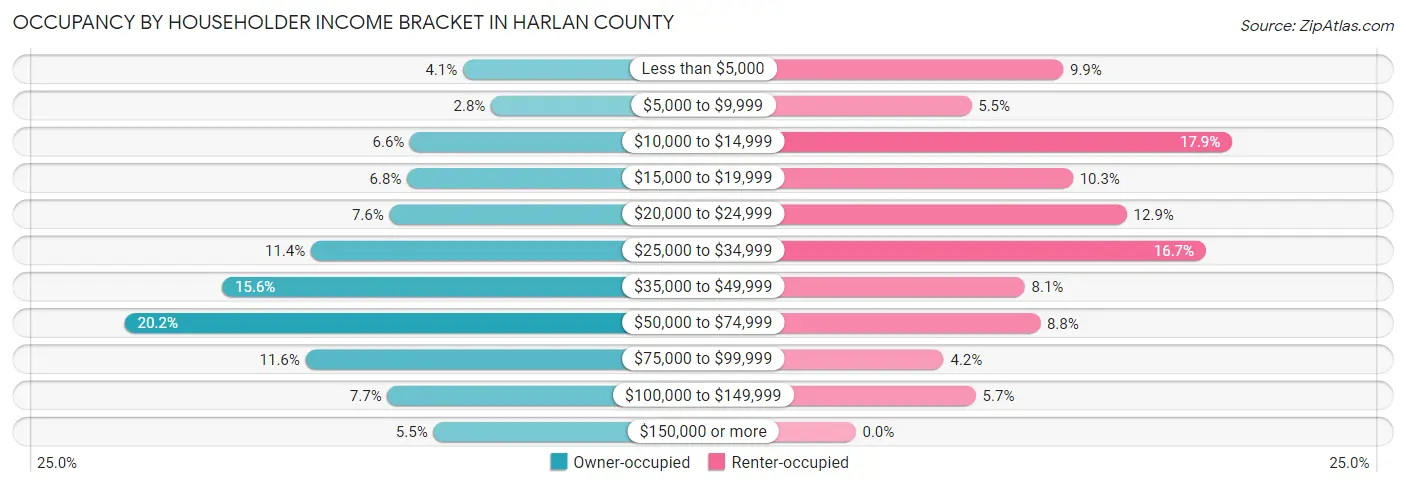
| Income Bracket | Owner-occupied | Renter-occupied |
| Less than $5,000 | 298 (4.1%) | 323 (9.9%) |
| $5,000 to $9,999 | 201 (2.8%) | 180 (5.5%) |
| $10,000 to $14,999 | 480 (6.6%) | 586 (17.9%) |
| $15,000 to $19,999 | 490 (6.8%) | 338 (10.3%) |
| $20,000 to $24,999 | 551 (7.6%) | 422 (12.9%) |
| $25,000 to $34,999 | 821 (11.4%) | 545 (16.7%) |
| $35,000 to $49,999 | 1,128 (15.6%) | 263 (8.1%) |
| $50,000 to $74,999 | 1,463 (20.2%) | 287 (8.8%) |
| $75,000 to $99,999 | 840 (11.6%) | 137 (4.2%) |
| $100,000 to $149,999 | 558 (7.7%) | 187 (5.7%) |
| $150,000 or more | 400 (5.5%) | 0 (0.0%) |
| Total | 7,230 (100.0%) | 3,268 (100.0%) |
Monthly Housing Cost Tiers in Harlan County
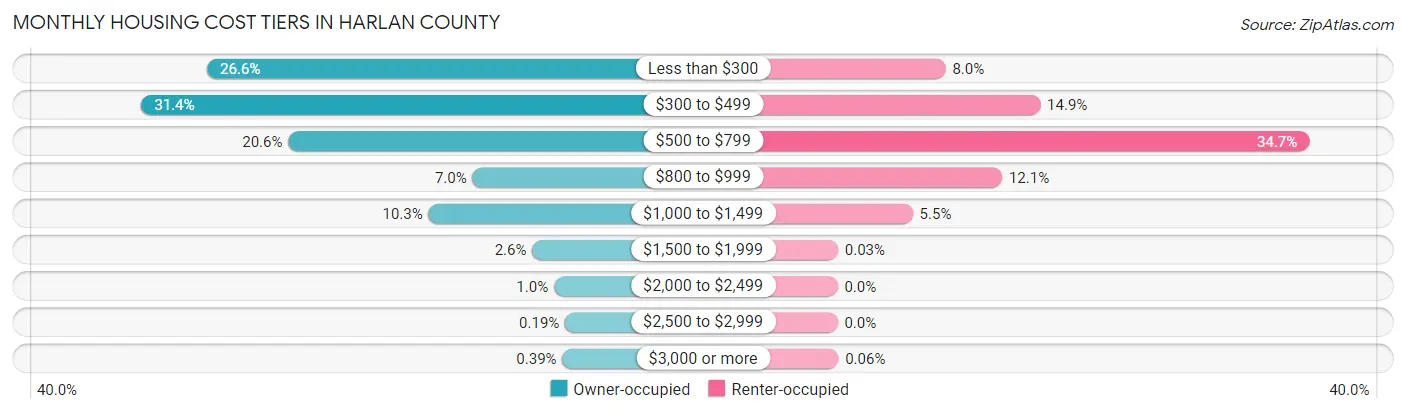
| Monthly Cost | Owner-occupied | Renter-occupied |
| Less than $300 | 1,920 (26.6%) | 260 (8.0%) |
| $300 to $499 | 2,270 (31.4%) | 488 (14.9%) |
| $500 to $799 | 1,488 (20.6%) | 1,135 (34.7%) |
| $800 to $999 | 507 (7.0%) | 396 (12.1%) |
| $1,000 to $1,499 | 741 (10.2%) | 181 (5.5%) |
| $1,500 to $1,999 | 189 (2.6%) | 1 (0.0%) |
| $2,000 to $2,499 | 73 (1.0%) | 0 (0.0%) |
| $2,500 to $2,999 | 14 (0.2%) | 0 (0.0%) |
| $3,000 or more | 28 (0.4%) | 2 (0.1%) |
| Total | 7,230 (100.0%) | 3,268 (100.0%) |
Physical Housing Characteristics in Harlan County
Housing Structures in Harlan County
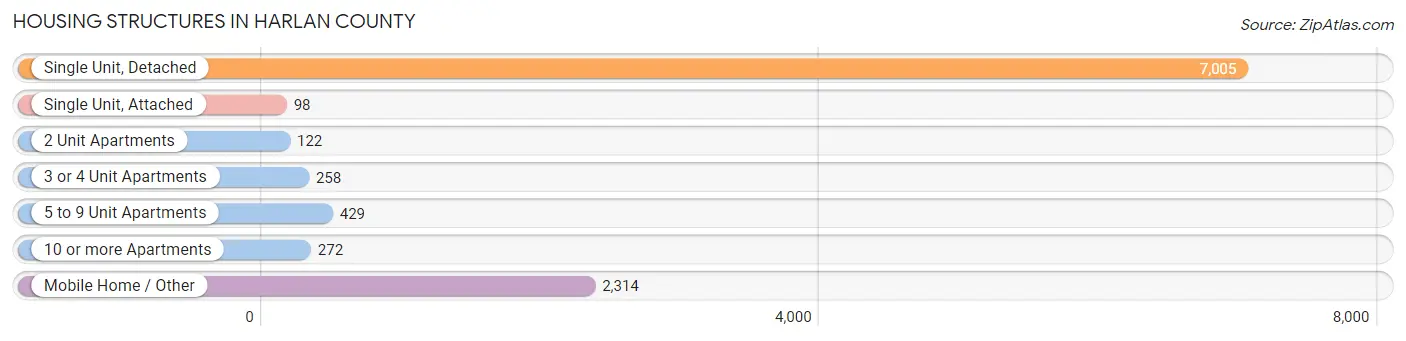
| Structure Type | # Housing Units | % Housing Units |
| Single Unit, Detached | 7,005 | 66.7% |
| Single Unit, Attached | 98 | 0.9% |
| 2 Unit Apartments | 122 | 1.2% |
| 3 or 4 Unit Apartments | 258 | 2.5% |
| 5 to 9 Unit Apartments | 429 | 4.1% |
| 10 or more Apartments | 272 | 2.6% |
| Mobile Home / Other | 2,314 | 22.0% |
| Total | 10,498 | 100.0% |
Housing Structures by Occupancy in Harlan County
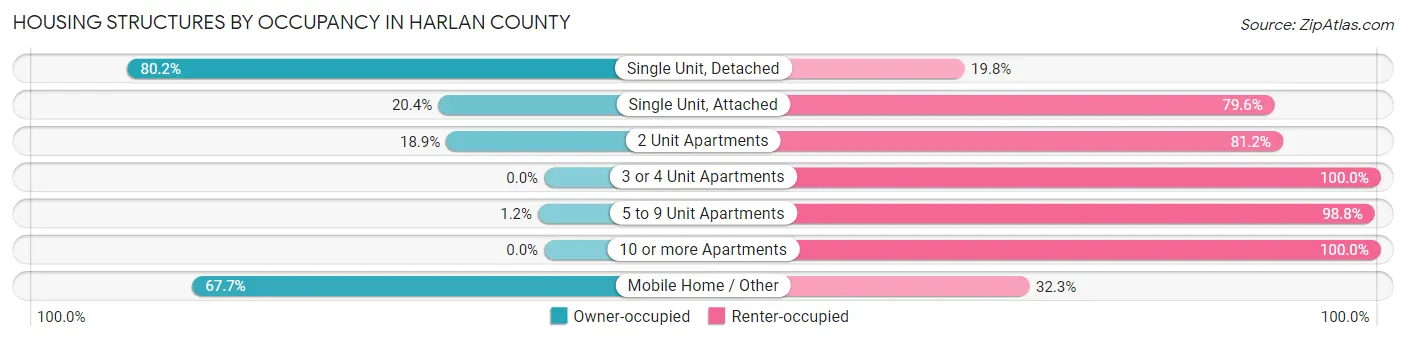
| Structure Type | Owner-occupied | Renter-occupied |
| Single Unit, Detached | 5,616 (80.2%) | 1,389 (19.8%) |
| Single Unit, Attached | 20 (20.4%) | 78 (79.6%) |
| 2 Unit Apartments | 23 (18.9%) | 99 (81.1%) |
| 3 or 4 Unit Apartments | 0 (0.0%) | 258 (100.0%) |
| 5 to 9 Unit Apartments | 5 (1.2%) | 424 (98.8%) |
| 10 or more Apartments | 0 (0.0%) | 272 (100.0%) |
| Mobile Home / Other | 1,566 (67.7%) | 748 (32.3%) |
| Total | 7,230 (68.9%) | 3,268 (31.1%) |
Housing Structures by Number of Rooms in Harlan County
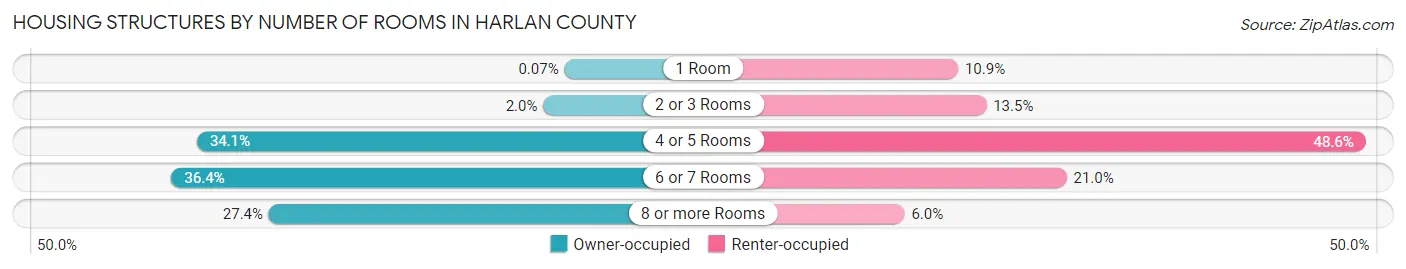
| Number of Rooms | Owner-occupied | Renter-occupied |
| 1 Room | 5 (0.1%) | 357 (10.9%) |
| 2 or 3 Rooms | 147 (2.0%) | 442 (13.5%) |
| 4 or 5 Rooms | 2,463 (34.1%) | 1,589 (48.6%) |
| 6 or 7 Rooms | 2,633 (36.4%) | 685 (21.0%) |
| 8 or more Rooms | 1,982 (27.4%) | 195 (6.0%) |
| Total | 7,230 (100.0%) | 3,268 (100.0%) |
Housing Structure by Heating Type in Harlan County
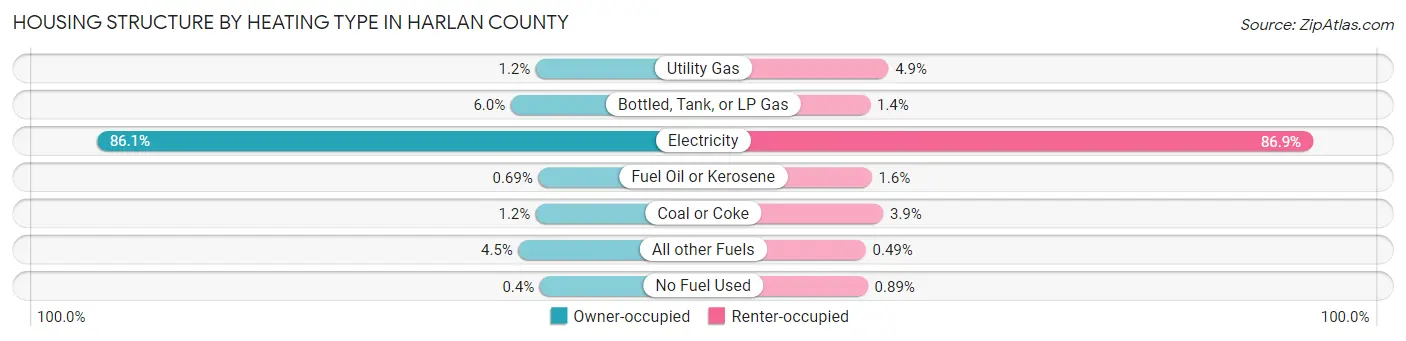
| Heating Type | Owner-occupied | Renter-occupied |
| Utility Gas | 84 (1.2%) | 159 (4.9%) |
| Bottled, Tank, or LP Gas | 434 (6.0%) | 44 (1.3%) |
| Electricity | 6,222 (86.1%) | 2,841 (86.9%) |
| Fuel Oil or Kerosene | 50 (0.7%) | 53 (1.6%) |
| Coal or Coke | 84 (1.2%) | 126 (3.9%) |
| All other Fuels | 327 (4.5%) | 16 (0.5%) |
| No Fuel Used | 29 (0.4%) | 29 (0.9%) |
| Total | 7,230 (100.0%) | 3,268 (100.0%) |
Household Vehicle Usage in Harlan County
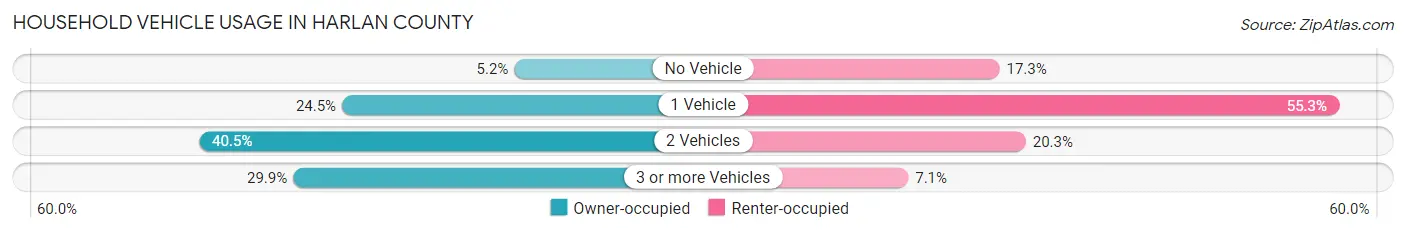
| Vehicles per Household | Owner-occupied | Renter-occupied |
| No Vehicle | 373 (5.2%) | 566 (17.3%) |
| 1 Vehicle | 1,768 (24.4%) | 1,808 (55.3%) |
| 2 Vehicles | 2,925 (40.5%) | 662 (20.3%) |
| 3 or more Vehicles | 2,164 (29.9%) | 232 (7.1%) |
| Total | 7,230 (100.0%) | 3,268 (100.0%) |
Real Estate & Mortgages in Harlan County
Real Estate and Mortgage Overview in Harlan County
| Characteristic | Without Mortgage | With Mortgage |
| Housing Units | 4,973 | 2,257 |
| Median Property Value | $60,700 | $88,500 |
| Median Household Income | $38,482 | $153 |
| Monthly Housing Costs | $338 | $28 |
| Real Estate Taxes | $572 | $226 |
Property Value by Mortgage Status in Harlan County
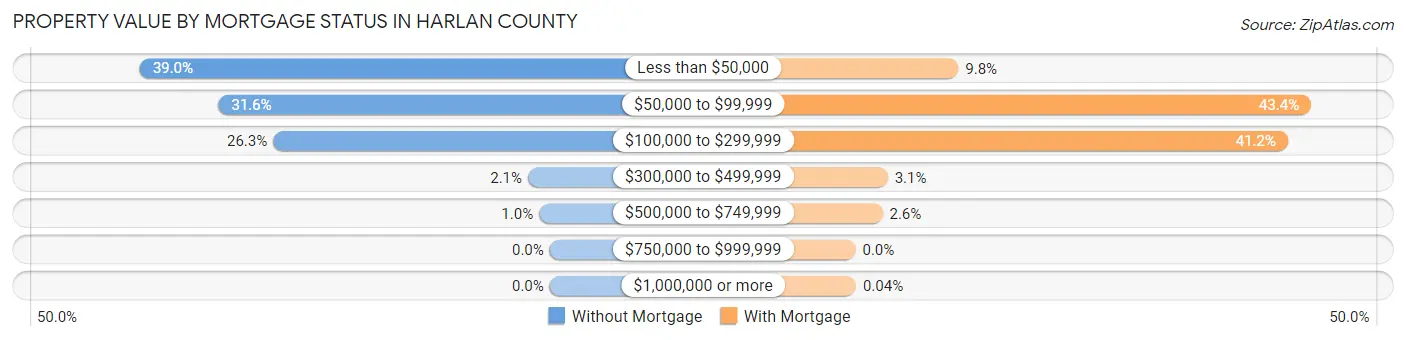
| Property Value | Without Mortgage | With Mortgage |
| Less than $50,000 | 1,941 (39.0%) | 221 (9.8%) |
| $50,000 to $99,999 | 1,569 (31.6%) | 979 (43.4%) |
| $100,000 to $299,999 | 1,310 (26.3%) | 929 (41.2%) |
| $300,000 to $499,999 | 103 (2.1%) | 69 (3.1%) |
| $500,000 to $749,999 | 50 (1.0%) | 58 (2.6%) |
| $750,000 to $999,999 | 0 (0.0%) | 0 (0.0%) |
| $1,000,000 or more | 0 (0.0%) | 1 (0.0%) |
| Total | 4,973 (100.0%) | 2,257 (100.0%) |
Household Income by Mortgage Status in Harlan County
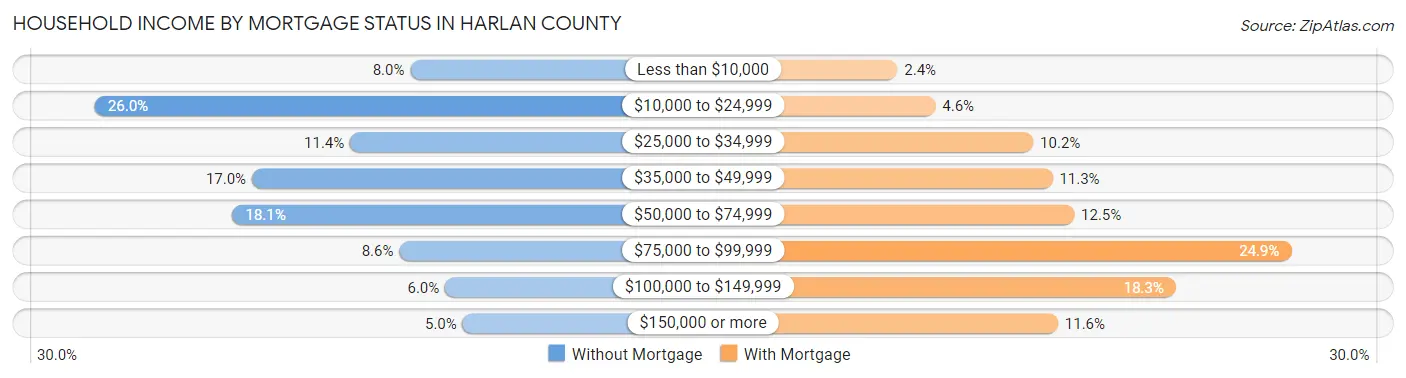
| Household Income | Without Mortgage | With Mortgage |
| Less than $10,000 | 396 (8.0%) | 54 (2.4%) |
| $10,000 to $24,999 | 1,292 (26.0%) | 103 (4.6%) |
| $25,000 to $34,999 | 567 (11.4%) | 229 (10.2%) |
| $35,000 to $49,999 | 846 (17.0%) | 254 (11.3%) |
| $50,000 to $74,999 | 901 (18.1%) | 282 (12.5%) |
| $75,000 to $99,999 | 427 (8.6%) | 562 (24.9%) |
| $100,000 to $149,999 | 297 (6.0%) | 413 (18.3%) |
| $150,000 or more | 247 (5.0%) | 261 (11.6%) |
| Total | 4,973 (100.0%) | 2,257 (100.0%) |
Property Value to Household Income Ratio in Harlan County
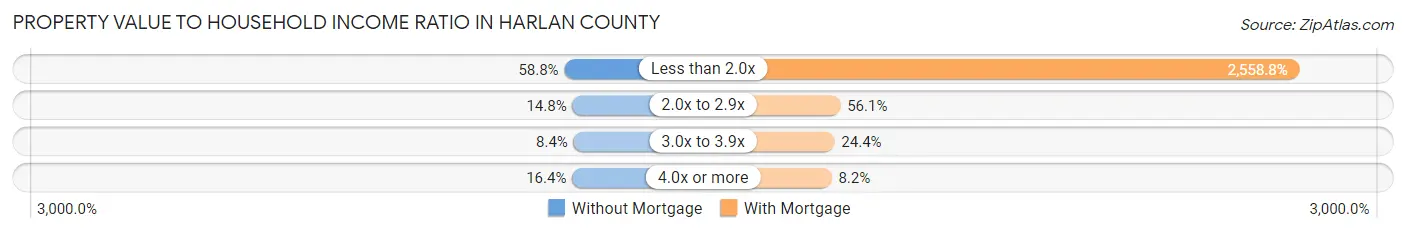
| Value-to-Income Ratio | Without Mortgage | With Mortgage |
| Less than 2.0x | 2,926 (58.8%) | 57,752 (2,558.8%) |
| 2.0x to 2.9x | 737 (14.8%) | 1,267 (56.1%) |
| 3.0x to 3.9x | 417 (8.4%) | 551 (24.4%) |
| 4.0x or more | 813 (16.4%) | 186 (8.2%) |
| Total | 4,973 (100.0%) | 2,257 (100.0%) |
Real Estate Taxes by Mortgage Status in Harlan County
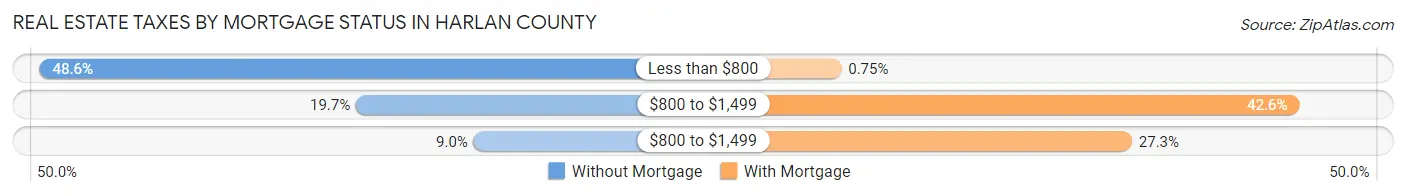
| Property Taxes | Without Mortgage | With Mortgage |
| Less than $800 | 2,418 (48.6%) | 17 (0.7%) |
| $800 to $1,499 | 981 (19.7%) | 961 (42.6%) |
| $800 to $1,499 | 447 (9.0%) | 616 (27.3%) |
| Total | 4,973 (100.0%) | 2,257 (100.0%) |
Health & Disability in Harlan County
Health Insurance Coverage by Age in Harlan County
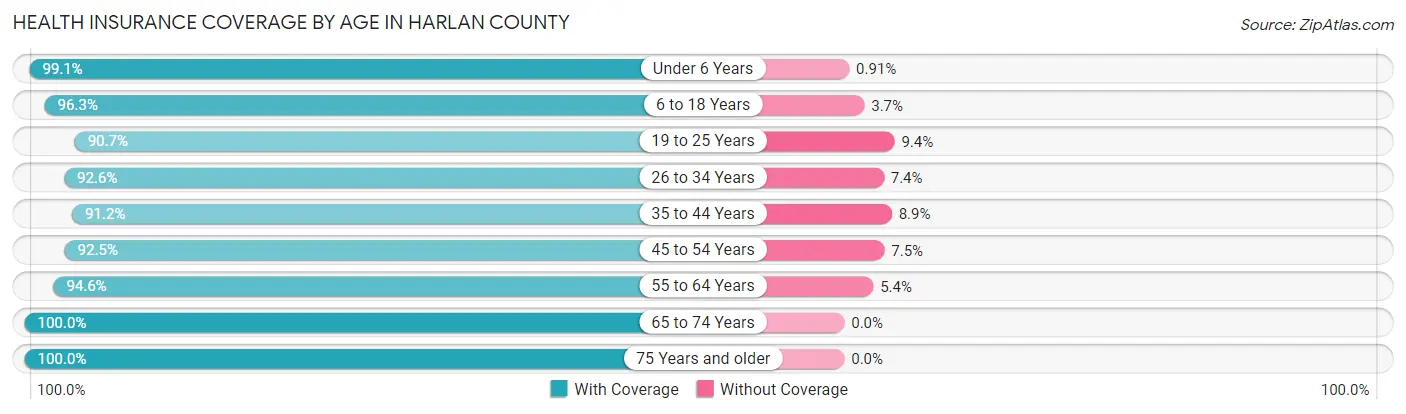
| Age Bracket | With Coverage | Without Coverage |
| Under 6 Years | 1,845 (99.1%) | 17 (0.9%) |
| 6 to 18 Years | 4,439 (96.3%) | 172 (3.7%) |
| 19 to 25 Years | 1,668 (90.6%) | 172 (9.3%) |
| 26 to 34 Years | 2,670 (92.6%) | 212 (7.4%) |
| 35 to 44 Years | 2,772 (91.1%) | 269 (8.8%) |
| 45 to 54 Years | 3,086 (92.5%) | 249 (7.5%) |
| 55 to 64 Years | 3,526 (94.6%) | 201 (5.4%) |
| 65 to 74 Years | 3,164 (100.0%) | 0 (0.0%) |
| 75 Years and older | 1,692 (100.0%) | 0 (0.0%) |
| Total | 24,862 (95.1%) | 1,292 (4.9%) |
Health Insurance Coverage by Citizenship Status in Harlan County
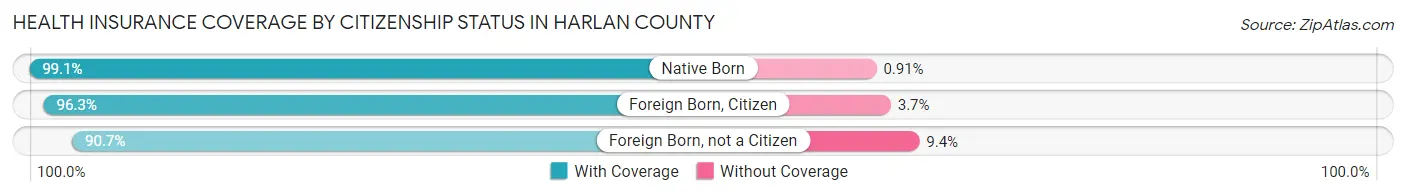
| Citizenship Status | With Coverage | Without Coverage |
| Native Born | 1,845 (99.1%) | 17 (0.9%) |
| Foreign Born, Citizen | 4,439 (96.3%) | 172 (3.7%) |
| Foreign Born, not a Citizen | 1,668 (90.6%) | 172 (9.3%) |
Health Insurance Coverage by Household Income in Harlan County
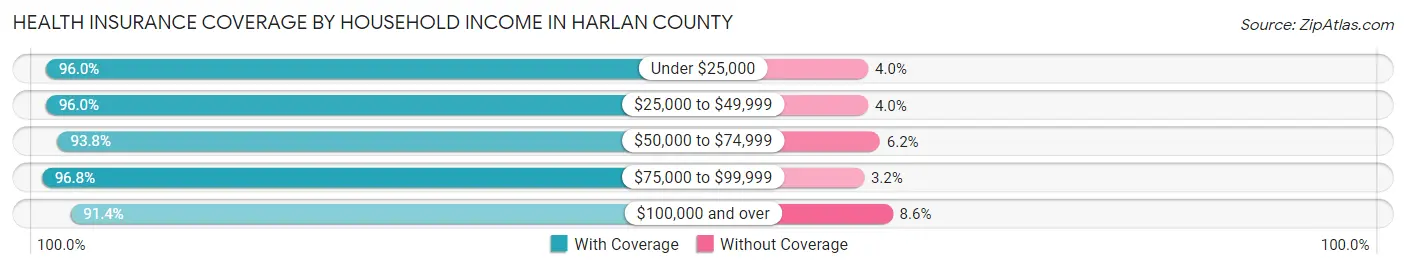
| Household Income | With Coverage | Without Coverage |
| Under $25,000 | 7,096 (96.0%) | 296 (4.0%) |
| $25,000 to $49,999 | 6,959 (96.0%) | 287 (4.0%) |
| $50,000 to $74,999 | 4,443 (93.8%) | 293 (6.2%) |
| $75,000 to $99,999 | 2,851 (96.8%) | 95 (3.2%) |
| $100,000 and over | 3,343 (91.4%) | 314 (8.6%) |
Public vs Private Health Insurance Coverage by Age in Harlan County
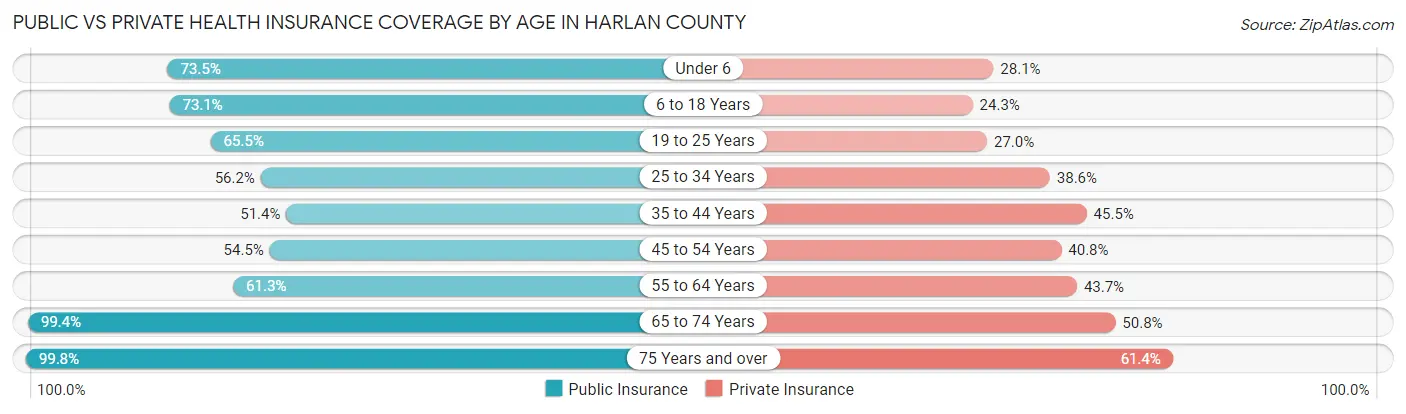
| Age Bracket | Public Insurance | Private Insurance |
| Under 6 | 1,368 (73.5%) | 524 (28.1%) |
| 6 to 18 Years | 3,371 (73.1%) | 1,120 (24.3%) |
| 19 to 25 Years | 1,205 (65.5%) | 496 (27.0%) |
| 25 to 34 Years | 1,619 (56.2%) | 1,113 (38.6%) |
| 35 to 44 Years | 1,564 (51.4%) | 1,382 (45.5%) |
| 45 to 54 Years | 1,818 (54.5%) | 1,359 (40.7%) |
| 55 to 64 Years | 2,284 (61.3%) | 1,627 (43.6%) |
| 65 to 74 Years | 3,145 (99.4%) | 1,607 (50.8%) |
| 75 Years and over | 1,688 (99.8%) | 1,039 (61.4%) |
| Total | 18,062 (69.1%) | 10,267 (39.3%) |
Disability Status by Sex by Age in Harlan County
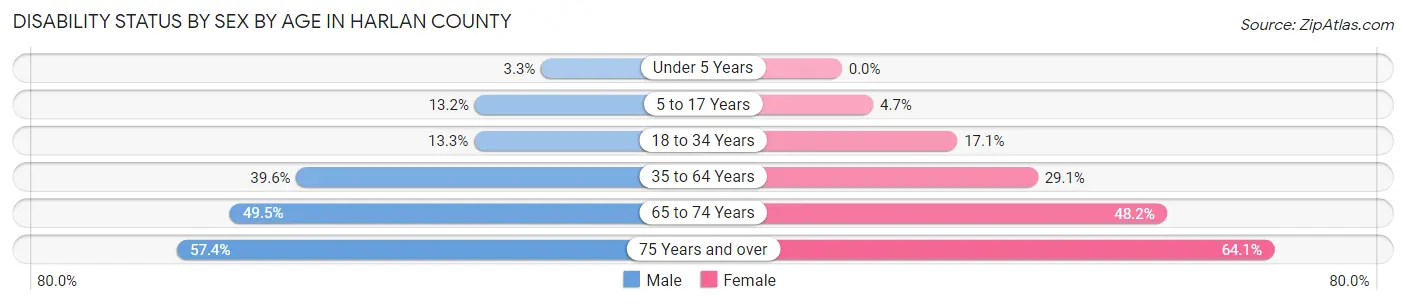
| Age Bracket | Male | Female |
| Under 5 Years | 25 (3.3%) | 0 (0.0%) |
| 5 to 17 Years | 307 (13.2%) | 106 (4.6%) |
| 18 to 34 Years | 325 (13.3%) | 439 (17.1%) |
| 35 to 64 Years | 1,927 (39.6%) | 1,525 (29.1%) |
| 65 to 74 Years | 746 (49.5%) | 799 (48.2%) |
| 75 Years and over | 390 (57.4%) | 649 (64.1%) |
Disability Class by Sex by Age in Harlan County
Disability Class: Hearing Difficulty
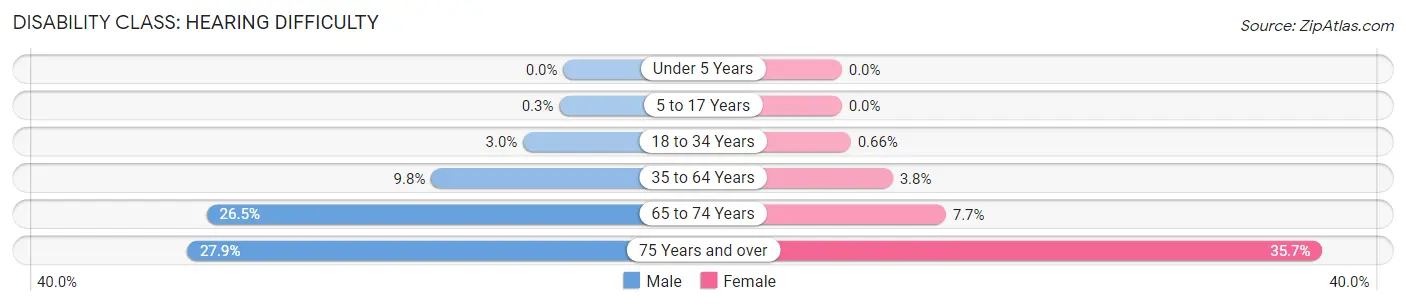
| Age Bracket | Male | Female |
| Under 5 Years | 0 (0.0%) | 0 (0.0%) |
| 5 to 17 Years | 7 (0.3%) | 0 (0.0%) |
| 18 to 34 Years | 73 (3.0%) | 17 (0.7%) |
| 35 to 64 Years | 477 (9.8%) | 198 (3.8%) |
| 65 to 74 Years | 399 (26.5%) | 128 (7.7%) |
| 75 Years and over | 190 (27.9%) | 361 (35.7%) |
Disability Class: Vision Difficulty
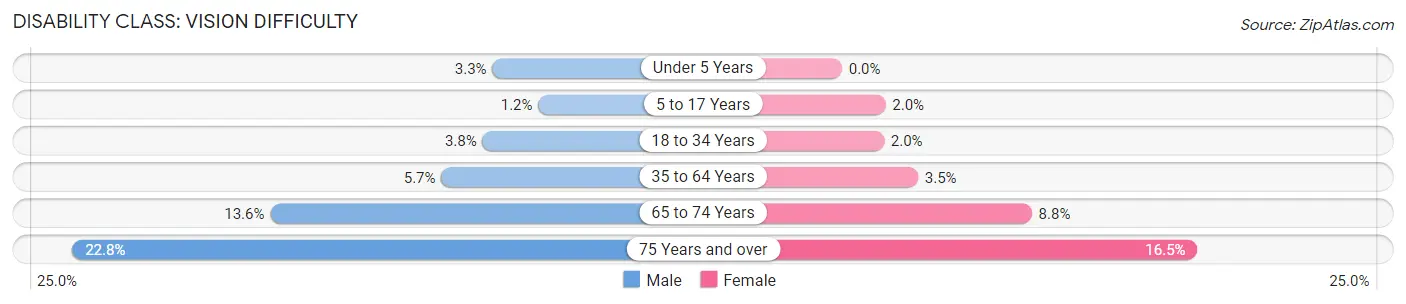
| Age Bracket | Male | Female |
| Under 5 Years | 25 (3.3%) | 0 (0.0%) |
| 5 to 17 Years | 27 (1.2%) | 46 (2.0%) |
| 18 to 34 Years | 92 (3.7%) | 50 (1.9%) |
| 35 to 64 Years | 275 (5.7%) | 185 (3.5%) |
| 65 to 74 Years | 205 (13.6%) | 146 (8.8%) |
| 75 Years and over | 155 (22.8%) | 167 (16.5%) |
Disability Class: Cognitive Difficulty
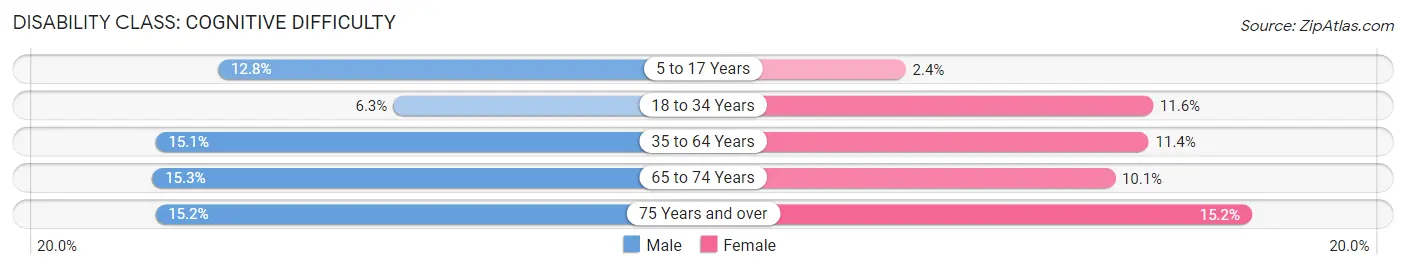
| Age Bracket | Male | Female |
| 5 to 17 Years | 299 (12.8%) | 54 (2.4%) |
| 18 to 34 Years | 155 (6.3%) | 296 (11.6%) |
| 35 to 64 Years | 736 (15.1%) | 597 (11.4%) |
| 65 to 74 Years | 230 (15.3%) | 168 (10.1%) |
| 75 Years and over | 103 (15.1%) | 154 (15.2%) |
Disability Class: Ambulatory Difficulty
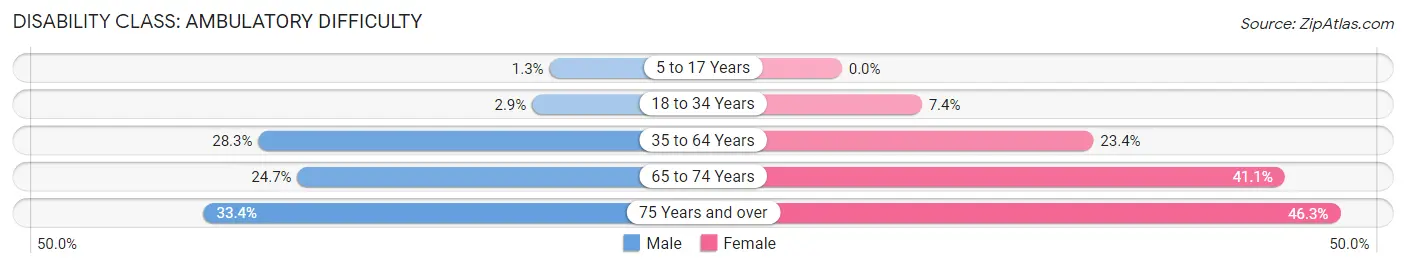
| Age Bracket | Male | Female |
| 5 to 17 Years | 30 (1.3%) | 0 (0.0%) |
| 18 to 34 Years | 71 (2.9%) | 190 (7.4%) |
| 35 to 64 Years | 1,376 (28.3%) | 1,224 (23.4%) |
| 65 to 74 Years | 372 (24.7%) | 681 (41.1%) |
| 75 Years and over | 227 (33.4%) | 468 (46.3%) |
Disability Class: Self-Care Difficulty

| Age Bracket | Male | Female |
| 5 to 17 Years | 47 (2.0%) | 22 (1.0%) |
| 18 to 34 Years | 30 (1.2%) | 114 (4.4%) |
| 35 to 64 Years | 395 (8.1%) | 210 (4.0%) |
| 65 to 74 Years | 76 (5.0%) | 177 (10.7%) |
| 75 Years and over | 112 (16.5%) | 114 (11.3%) |
Technology Access in Harlan County
Computing Device Access in Harlan County
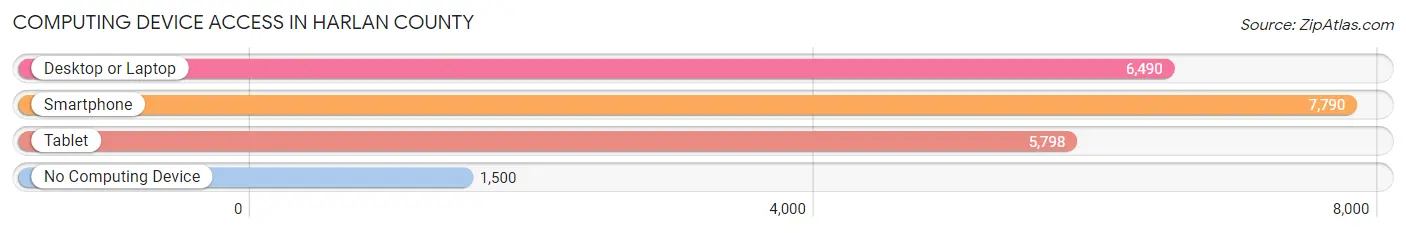
| Device Type | # Households | % Households |
| Desktop or Laptop | 6,490 | 61.8% |
| Smartphone | 7,790 | 74.2% |
| Tablet | 5,798 | 55.2% |
| No Computing Device | 1,500 | 14.3% |
| Total | 10,498 | 100.0% |
Internet Access in Harlan County
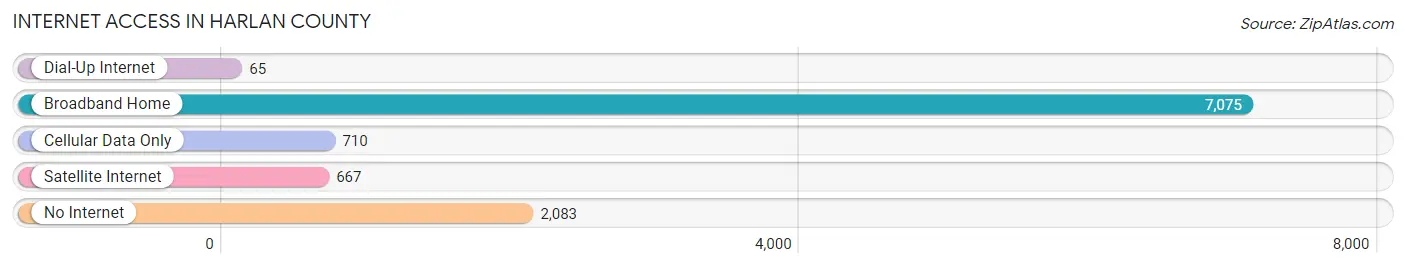
| Internet Type | # Households | % Households |
| Dial-Up Internet | 65 | 0.6% |
| Broadband Home | 7,075 | 67.4% |
| Cellular Data Only | 710 | 6.8% |
| Satellite Internet | 667 | 6.4% |
| No Internet | 2,083 | 19.8% |
| Total | 10,498 | 100.0% |
Harlan County Summary
Harlan County is located in the southeastern corner of Kentucky, and is part of the Appalachian region. It is bordered by Bell County to the north, Leslie County to the east, Letcher County to the south, and Knox County to the west. The county seat is Harlan, and the county was formed in 1819 from parts of Knox and Green Counties. The county is named for Silas Harlan, a Revolutionary War soldier.
Geography
Harlan County is located in the Appalachian Mountains, and is part of the Cumberland Plateau. The county is mostly mountainous, with elevations ranging from 1,000 to 3,000 feet. The highest point in the county is Black Mountain, at 3,039 feet. The county is drained by the Cumberland River and its tributaries, including the Clover Fork, Poor Fork, and Martins Fork. The county is mostly forested, with oak, hickory, and pine being the most common trees.
Economy
Harlan County has a diverse economy, with the primary industries being coal mining, timber, and tourism. Coal mining has been the primary industry in the county since the late 19th century, and is still a major employer. The county is home to several coal mines, including the Black Mountain Coal Mine, which is the largest in the state. Timber is also an important industry in the county, with the timber industry providing jobs for many residents. Tourism is also an important part of the economy, with the county being home to several state parks and recreational areas.
Demographics
As of the 2010 census, Harlan County had a population of 29,278. The population is mostly white, with the largest racial group being non-Hispanic whites, at 97.2%. The other racial groups include African Americans (1.3%), Hispanics (0.7%), and Native Americans (0.2%). The median household income in the county is $30,845, and the median age is 41.7 years.
Conclusion
Harlan County is a rural county located in the Appalachian Mountains of southeastern Kentucky. The county has a diverse economy, with the primary industries being coal mining, timber, and tourism. The population is mostly white, with the median household income being $30,845. The county is home to several state parks and recreational areas, making it a popular destination for tourists.
Common Questions
What is Per Capita Income in Harlan County?
Per Capita income in Harlan County is $20,511.
What is the Median Family Income in Harlan County?
Median Family Income in Harlan County is $45,564.
What is the Median Household income in Harlan County?
Median Household Income in Harlan County is $35,128.
What is Income or Wage Gap in Harlan County?
Income or Wage Gap in Harlan County is 21.7%.
Women in Harlan County earn 78.3 cents for every dollar earned by a man.
What is Family Income Deficit in Harlan County?
Family Income Deficit in Harlan County is $9,214.
Families that are below poverty line in Harlan County earn $9,214 less on average than the poverty threshold level.
What is Inequality or Gini Index in Harlan County?
Inequality or Gini Index in Harlan County is 0.48.
What is the Total Population of Harlan County?
Total Population of Harlan County is 26,589.
What is the Total Male Population of Harlan County?
Total Male Population of Harlan County is 12,841.
What is the Total Female Population of Harlan County?
Total Female Population of Harlan County is 13,748.
What is the Ratio of Males per 100 Females in Harlan County?
There are 93.40 Males per 100 Females in Harlan County.
What is the Ratio of Females per 100 Males in Harlan County?
There are 107.06 Females per 100 Males in Harlan County.
What is the Median Population Age in Harlan County?
Median Population Age in Harlan County is 41.2 Years.
What is the Average Family Size in Harlan County
Average Family Size in Harlan County is 3.0 People.
What is the Average Household Size in Harlan County
Average Household Size in Harlan County is 2.5 People.
How Large is the Labor Force in Harlan County?
There are 8,360 People in the Labor Forcein in Harlan County.
What is the Percentage of People in the Labor Force in Harlan County?
39.6% of People are in the Labor Force in Harlan County.
What is the Unemployment Rate in Harlan County?
Unemployment Rate in Harlan County is 10.8%.