Green County, KY Map & Demographics
Green County Map
Green County Overview
$24,090
PER CAPITA INCOME
$57,117
AVG FAMILY INCOME
$38,595
AVG HOUSEHOLD INCOME
19.1%
WAGE / INCOME GAP [ % ]
80.9¢/ $1
WAGE / INCOME GAP [ $ ]
$10,475
FAMILY INCOME DEFICIT
0.47
INEQUALITY / GINI INDEX
11,198
TOTAL POPULATION
5,611
MALE POPULATION
5,587
FEMALE POPULATION
100.43
MALES / 100 FEMALES
99.57
FEMALES / 100 MALES
45.1
MEDIAN AGE
3.0
AVG FAMILY SIZE
2.5
AVG HOUSEHOLD SIZE
4,516
LABOR FORCE [ PEOPLE ]
49.9%
PERCENT IN LABOR FORCE
9.5%
UNEMPLOYMENT RATE
Green County Area Codes
Income in Green County
Income Overview in Green County
Per Capita Income in Green County is $24,090, while median incomes of families and households are $57,117 and $38,595 respectively.
| Characteristic | Number | Measure |
| Per Capita Income | 11,198 | $24,090 |
| Median Family Income | 3,005 | $57,117 |
| Mean Family Income | 3,005 | $71,499 |
| Median Household Income | 4,399 | $38,595 |
| Mean Household Income | 4,399 | $58,189 |
| Income Deficit | 3,005 | $10,475 |
| Wage / Income Gap (%) | 11,198 | 19.15% |
| Wage / Income Gap ($) | 11,198 | 80.85¢ per $1 |
| Gini / Inequality Index | 11,198 | 0.47 |
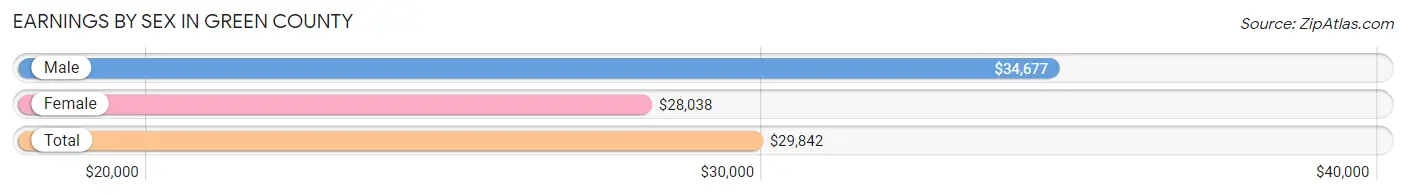
Earnings by Sex in Green County
Average Earnings in Green County are $29,842, $34,677 for men and $28,038 for women, a difference of 19.2%.
| Sex | Number | Average Earnings |
| Male | 2,378 (52.3%) | $34,677 |
| Female | 2,168 (47.7%) | $28,038 |
| Total | 4,546 (100.0%) | $29,842 |
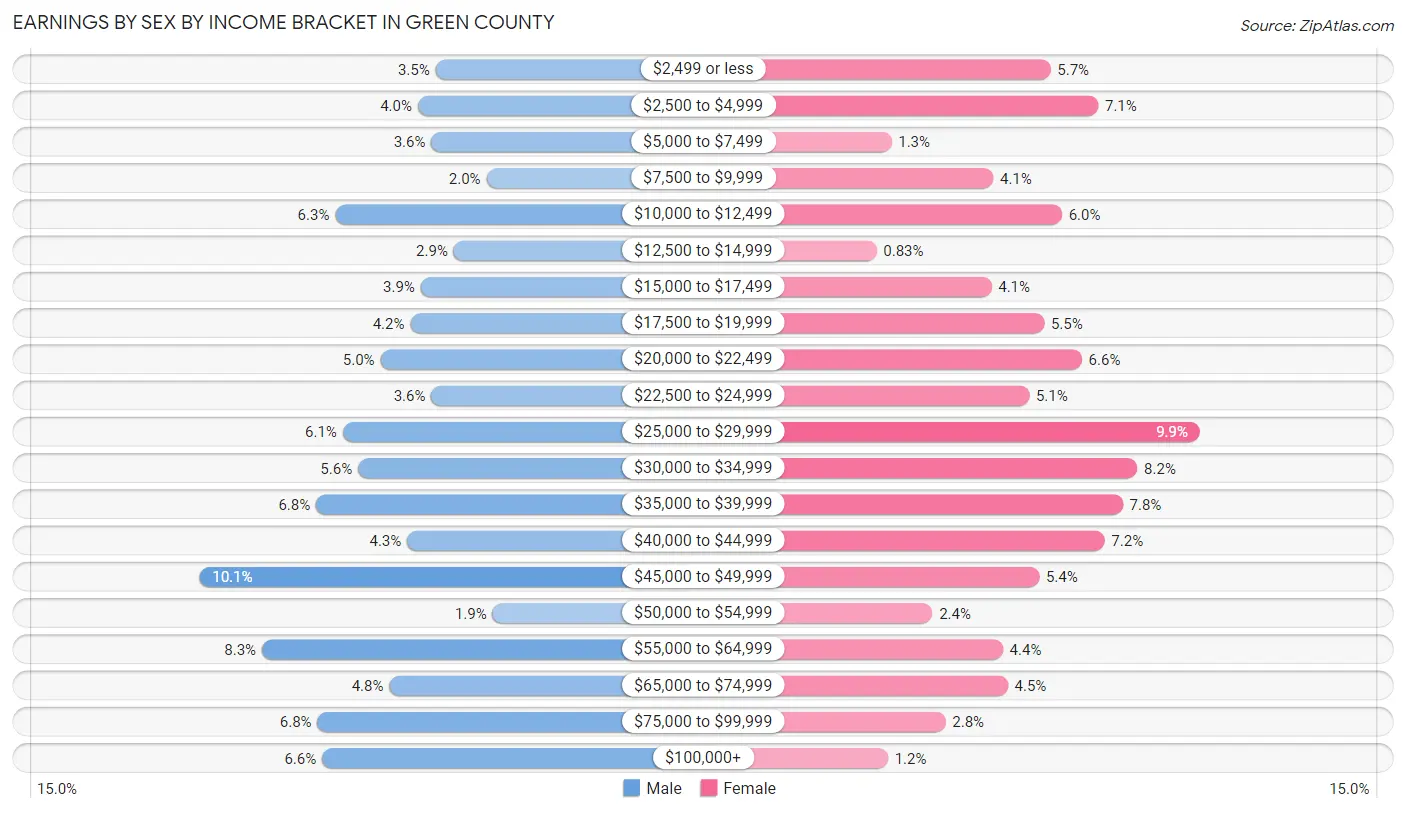
Earnings by Sex by Income Bracket in Green County
The most common earnings brackets in Green County are $45,000 to $49,999 for men (240 | 10.1%) and $25,000 to $29,999 for women (215 | 9.9%).
| Income | Male | Female |
| $2,499 or less | 82 (3.5%) | 124 (5.7%) |
| $2,500 to $4,999 | 94 (4.0%) | 153 (7.1%) |
| $5,000 to $7,499 | 85 (3.6%) | 27 (1.3%) |
| $7,500 to $9,999 | 48 (2.0%) | 89 (4.1%) |
| $10,000 to $12,499 | 149 (6.3%) | 131 (6.0%) |
| $12,500 to $14,999 | 70 (2.9%) | 18 (0.8%) |
| $15,000 to $17,499 | 92 (3.9%) | 88 (4.1%) |
| $17,500 to $19,999 | 99 (4.2%) | 120 (5.5%) |
| $20,000 to $22,499 | 119 (5.0%) | 143 (6.6%) |
| $22,500 to $24,999 | 85 (3.6%) | 111 (5.1%) |
| $25,000 to $29,999 | 144 (6.1%) | 215 (9.9%) |
| $30,000 to $34,999 | 134 (5.6%) | 177 (8.2%) |
| $35,000 to $39,999 | 162 (6.8%) | 168 (7.7%) |
| $40,000 to $44,999 | 101 (4.3%) | 157 (7.2%) |
| $45,000 to $49,999 | 240 (10.1%) | 117 (5.4%) |
| $50,000 to $54,999 | 44 (1.8%) | 52 (2.4%) |
| $55,000 to $64,999 | 198 (8.3%) | 95 (4.4%) |
| $65,000 to $74,999 | 113 (4.8%) | 98 (4.5%) |
| $75,000 to $99,999 | 161 (6.8%) | 60 (2.8%) |
| $100,000+ | 158 (6.6%) | 25 (1.1%) |
| Total | 2,378 (100.0%) | 2,168 (100.0%) |
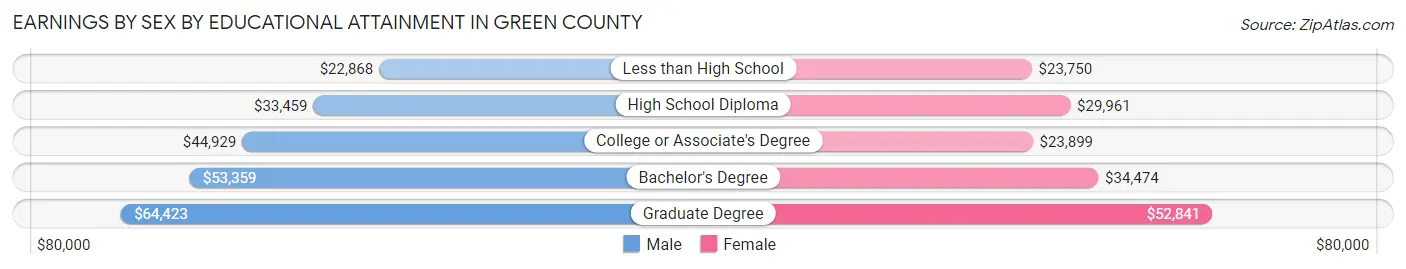
Earnings by Sex by Educational Attainment in Green County
Average earnings in Green County are $37,452 for men and $29,512 for women, a difference of 21.2%. Men with an educational attainment of graduate degree enjoy the highest average annual earnings of $64,423, while those with less than high school education earn the least with $22,868. Women with an educational attainment of graduate degree earn the most with the average annual earnings of $52,841, while those with less than high school education have the smallest earnings of $23,750.
| Educational Attainment | Male Income | Female Income |
| Less than High School | $22,868 | $23,750 |
| High School Diploma | $33,459 | $29,961 |
| College or Associate's Degree | $44,929 | $23,899 |
| Bachelor's Degree | $53,359 | $34,474 |
| Graduate Degree | $64,423 | $52,841 |
| Total | $37,452 | $29,512 |
Family Income in Green County
Family Income Brackets in Green County
According to the Green County family income data, there are 505 families falling into the $50,000 to $74,999 income range, which is the most common income bracket and makes up 16.8% of all families. Conversely, the $10,000 to $14,999 income bracket is the least frequent group with only 96 families (3.2%) belonging to this category.
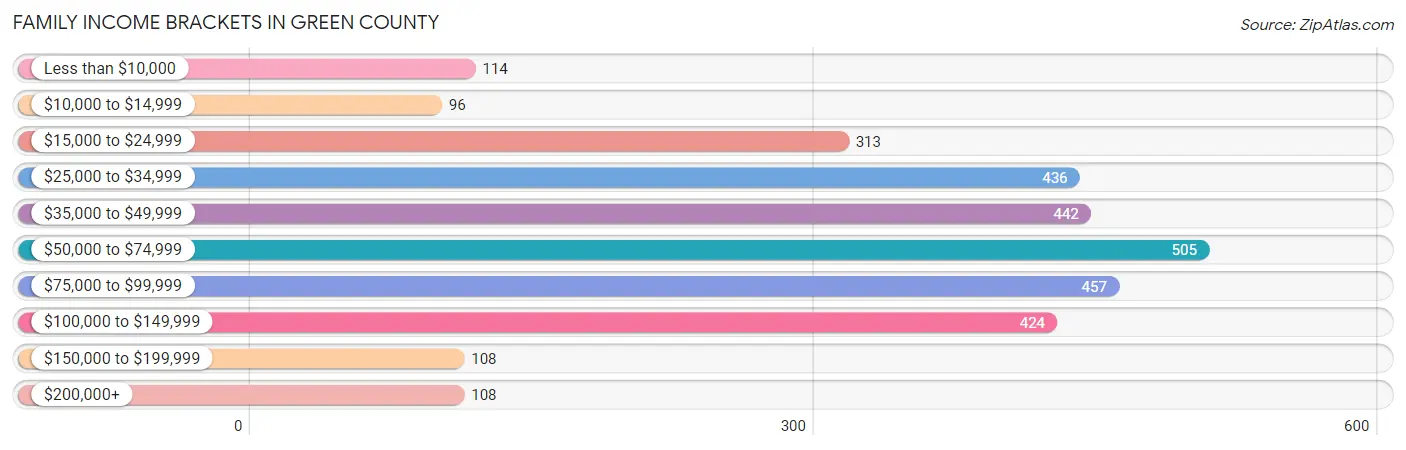
| Income Bracket | # Families | % Families |
| Less than $10,000 | 114 | 3.8% |
| $10,000 to $14,999 | 96 | 3.2% |
| $15,000 to $24,999 | 313 | 10.4% |
| $25,000 to $34,999 | 436 | 14.5% |
| $35,000 to $49,999 | 442 | 14.7% |
| $50,000 to $74,999 | 505 | 16.8% |
| $75,000 to $99,999 | 457 | 15.2% |
| $100,000 to $149,999 | 424 | 14.1% |
| $150,000 to $199,999 | 108 | 3.6% |
| $200,000+ | 108 | 3.6% |
Family Income by Famaliy Size in Green County
7+ person families (28 | 0.9%) account for the highest median family income in Green County with $128,382 per family, while 2-person families (1,480 | 49.2%) have the highest median income of $26,574 per family member.
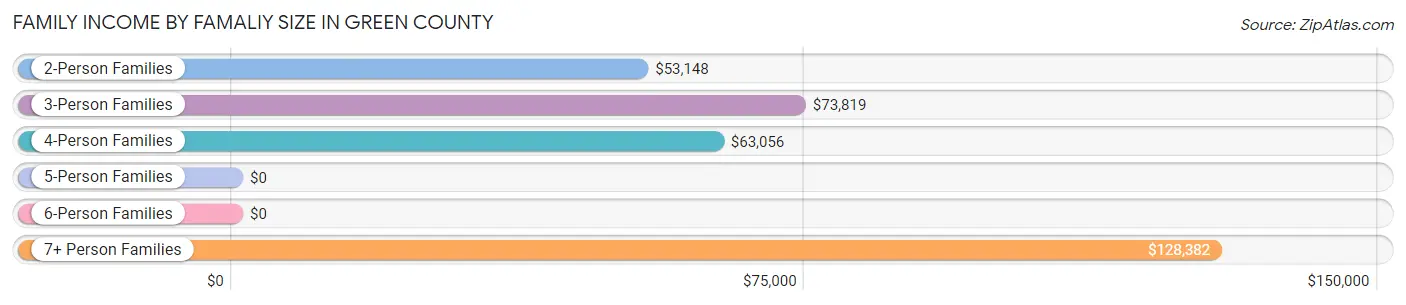
| Income Bracket | # Families | Median Income |
| 2-Person Families | 1,480 (49.2%) | $53,148 |
| 3-Person Families | 703 (23.4%) | $73,819 |
| 4-Person Families | 582 (19.4%) | $63,056 |
| 5-Person Families | 185 (6.2%) | $0 |
| 6-Person Families | 27 (0.9%) | $0 |
| 7+ Person Families | 28 (0.9%) | $128,382 |
| Total | 3,005 (100.0%) | $57,117 |
Family Income by Number of Earners in Green County
The median family income in Green County is $57,117, with families comprising 3+ earners (176) having the highest median family income of $127,647, while families with no earners (737) have the lowest median family income of $30,688, accounting for 5.9% and 24.5% of families, respectively.
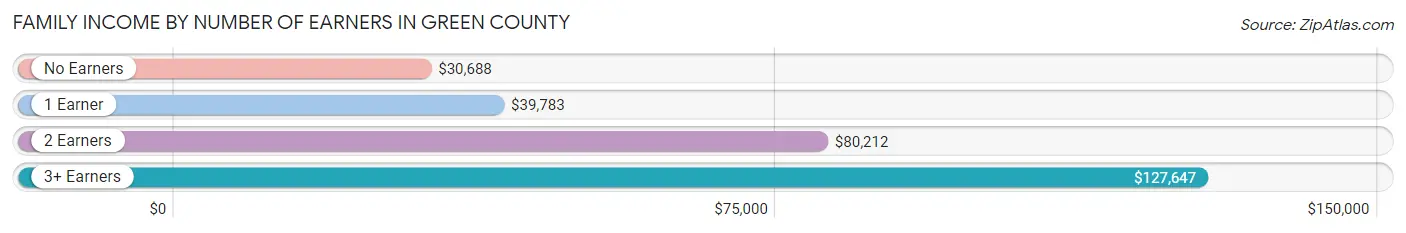
| Number of Earners | # Families | Median Income |
| No Earners | 737 (24.5%) | $30,688 |
| 1 Earner | 1,100 (36.6%) | $39,783 |
| 2 Earners | 992 (33.0%) | $80,212 |
| 3+ Earners | 176 (5.9%) | $127,647 |
| Total | 3,005 (100.0%) | $57,117 |
Household Income in Green County
Household Income Brackets in Green County
With 699 households falling in the category, the $15,000 to $24,999 income range is the most frequent in Green County, accounting for 15.9% of all households. In contrast, only 110 households (2.5%) fall into the $200,000+ income bracket, making it the least populous group.
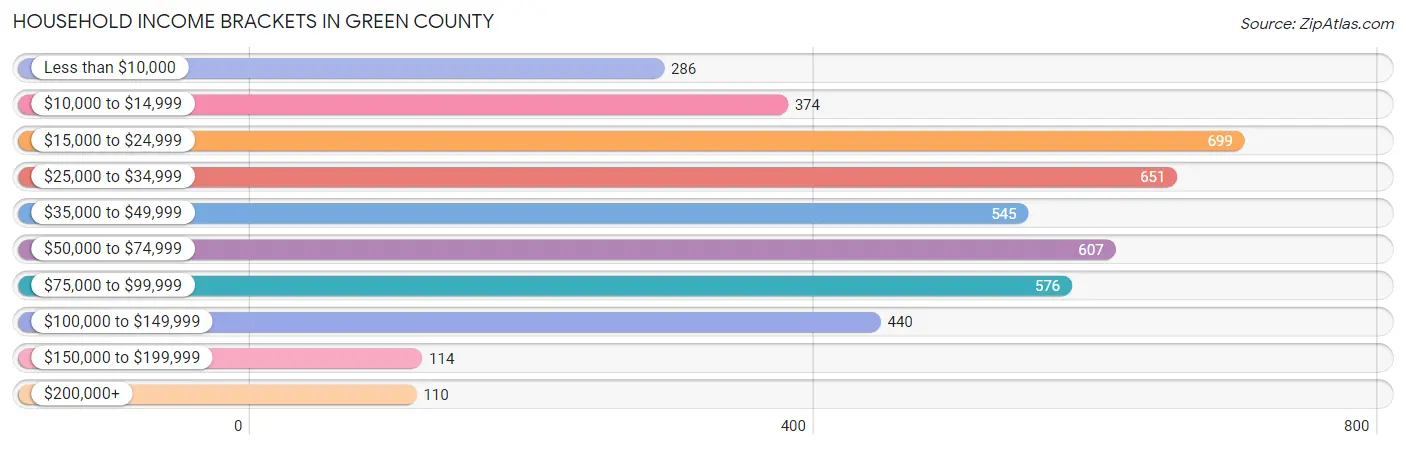
| Income Bracket | # Households | % Households |
| Less than $10,000 | 286 | 6.5% |
| $10,000 to $14,999 | 374 | 8.5% |
| $15,000 to $24,999 | 699 | 15.9% |
| $25,000 to $34,999 | 651 | 14.8% |
| $35,000 to $49,999 | 545 | 12.4% |
| $50,000 to $74,999 | 607 | 13.8% |
| $75,000 to $99,999 | 576 | 13.1% |
| $100,000 to $149,999 | 440 | 10.0% |
| $150,000 to $199,999 | 114 | 2.6% |
| $200,000+ | 110 | 2.5% |
Household Income by Householder Age in Green County
The median household income in Green County is $38,595, with the highest median household income of $59,095 found in the 25 to 44 years age bracket for the primary householder. A total of 1,185 households (26.9%) fall into this category. Meanwhile, the 15 to 24 years age bracket for the primary householder has the lowest median household income of $0, with 63 households (1.4%) in this group.
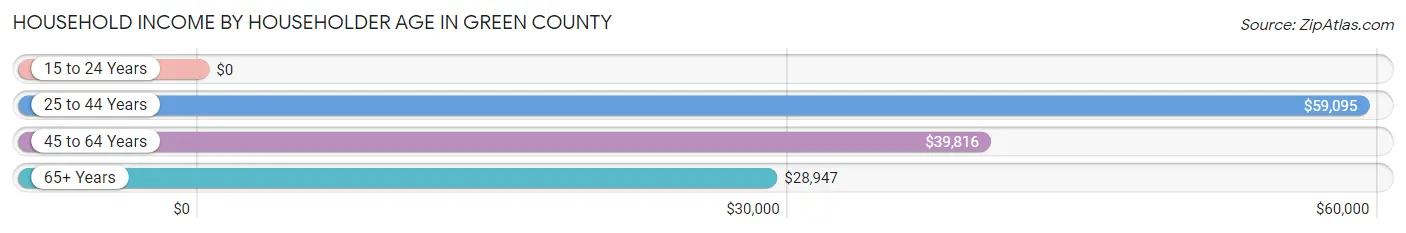
| Income Bracket | # Households | Median Income |
| 15 to 24 Years | 63 (1.4%) | $0 |
| 25 to 44 Years | 1,185 (26.9%) | $59,095 |
| 45 to 64 Years | 1,859 (42.3%) | $39,816 |
| 65+ Years | 1,292 (29.4%) | $28,947 |
| Total | 4,399 (100.0%) | $38,595 |
Poverty in Green County
Income Below Poverty by Sex and Age in Green County
With 20.6% poverty level for males and 22.1% for females among the residents of Green County, 12 to 14 year old males and 18 to 24 year old females are the most vulnerable to poverty, with 98 males (50.0%) and 162 females (44.5%) in their respective age groups living below the poverty level.
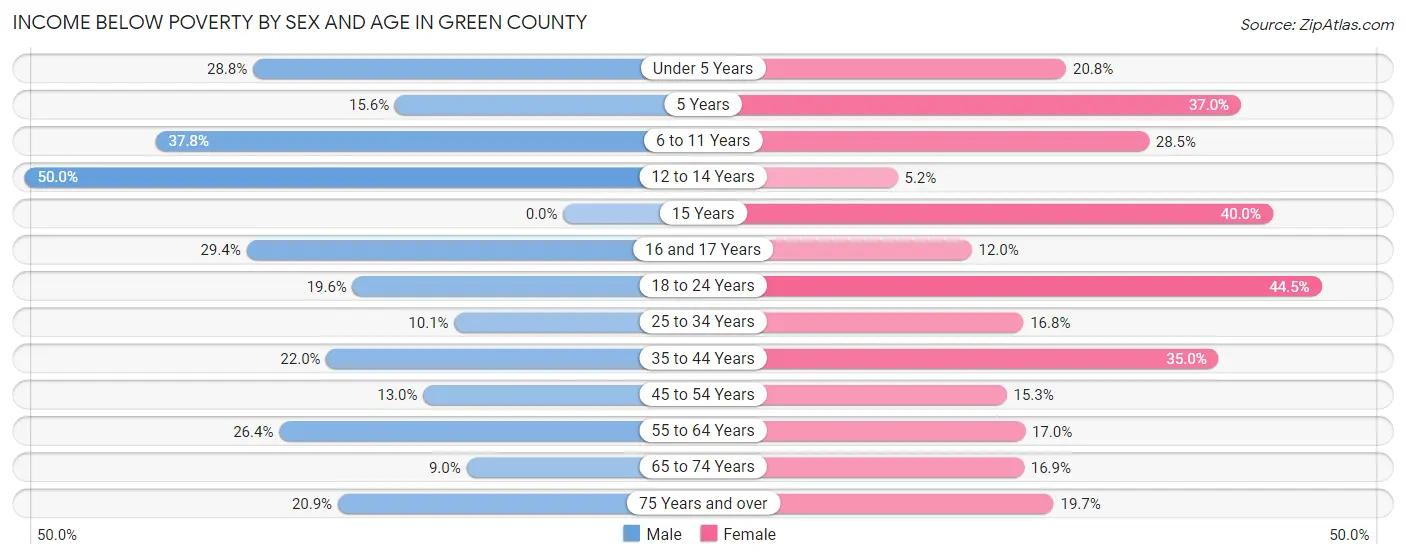
| Age Bracket | Male | Female |
| Under 5 Years | 91 (28.8%) | 72 (20.8%) |
| 5 Years | 5 (15.6%) | 30 (37.0%) |
| 6 to 11 Years | 151 (37.8%) | 112 (28.5%) |
| 12 to 14 Years | 98 (50.0%) | 9 (5.2%) |
| 15 Years | 0 (0.0%) | 38 (40.0%) |
| 16 and 17 Years | 35 (29.4%) | 13 (12.0%) |
| 18 to 24 Years | 78 (19.6%) | 162 (44.5%) |
| 25 to 34 Years | 64 (10.1%) | 98 (16.8%) |
| 35 to 44 Years | 135 (22.0%) | 214 (35.0%) |
| 45 to 54 Years | 105 (13.0%) | 109 (15.3%) |
| 55 to 64 Years | 250 (26.4%) | 151 (17.0%) |
| 65 to 74 Years | 58 (9.0%) | 114 (16.9%) |
| 75 Years and over | 73 (20.9%) | 91 (19.7%) |
| Total | 1,143 (20.6%) | 1,213 (22.1%) |
Income Above Poverty by Sex and Age in Green County
According to the poverty statistics in Green County, males aged 15 years and females aged 12 to 14 years are the age groups that are most secure financially, with 100.0% of males and 94.8% of females in these age groups living above the poverty line.
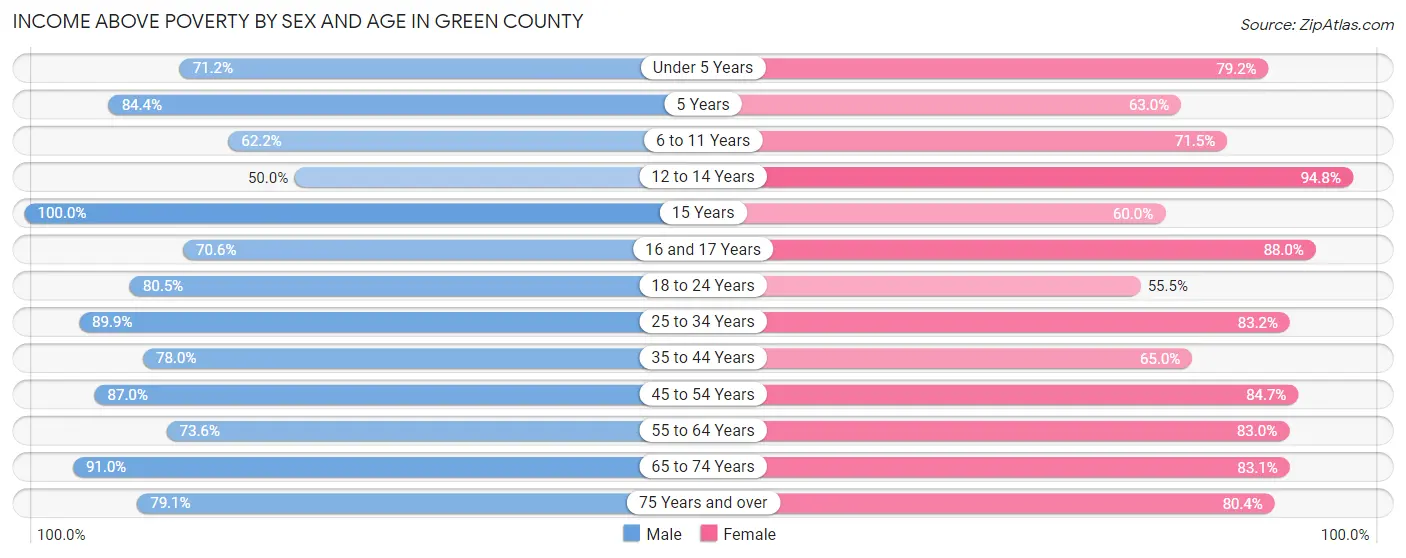
| Age Bracket | Male | Female |
| Under 5 Years | 225 (71.2%) | 274 (79.2%) |
| 5 Years | 27 (84.4%) | 51 (63.0%) |
| 6 to 11 Years | 248 (62.2%) | 281 (71.5%) |
| 12 to 14 Years | 98 (50.0%) | 165 (94.8%) |
| 15 Years | 83 (100.0%) | 57 (60.0%) |
| 16 and 17 Years | 84 (70.6%) | 95 (88.0%) |
| 18 to 24 Years | 321 (80.4%) | 202 (55.5%) |
| 25 to 34 Years | 569 (89.9%) | 484 (83.2%) |
| 35 to 44 Years | 479 (78.0%) | 398 (65.0%) |
| 45 to 54 Years | 703 (87.0%) | 604 (84.7%) |
| 55 to 64 Years | 698 (73.6%) | 737 (83.0%) |
| 65 to 74 Years | 588 (91.0%) | 561 (83.1%) |
| 75 Years and over | 276 (79.1%) | 372 (80.3%) |
| Total | 4,399 (79.4%) | 4,281 (77.9%) |
Income Below Poverty Among Married-Couple Families in Green County
The poverty statistics for married-couple families in Green County show that 10.2% or 226 of the total 2,216 families live below the poverty line. Families with 5 or more children have the highest poverty rate of 100.0%, comprising of 1 families. On the other hand, families with no children have the lowest poverty rate of 4.2%, which includes 56 families.
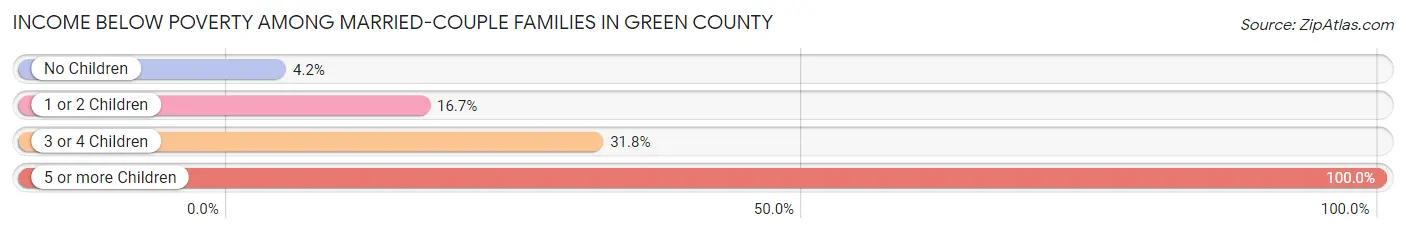
| Children | Above Poverty | Below Poverty |
| No Children | 1,284 (95.8%) | 56 (4.2%) |
| 1 or 2 Children | 603 (83.3%) | 121 (16.7%) |
| 3 or 4 Children | 103 (68.2%) | 48 (31.8%) |
| 5 or more Children | 0 (0.0%) | 1 (100.0%) |
| Total | 1,990 (89.8%) | 226 (10.2%) |
Income Below Poverty Among Single-Parent Households in Green County
According to the poverty data in Green County, 35.2% or 74 single-father households and 29.0% or 168 single-mother households are living below the poverty line. Among single-father households, those with 1 or 2 children have the highest poverty rate, with 63 households (42.6%) experiencing poverty. Likewise, among single-mother households, those with 1 or 2 children have the highest poverty rate, with 137 households (43.6%) falling below the poverty line.
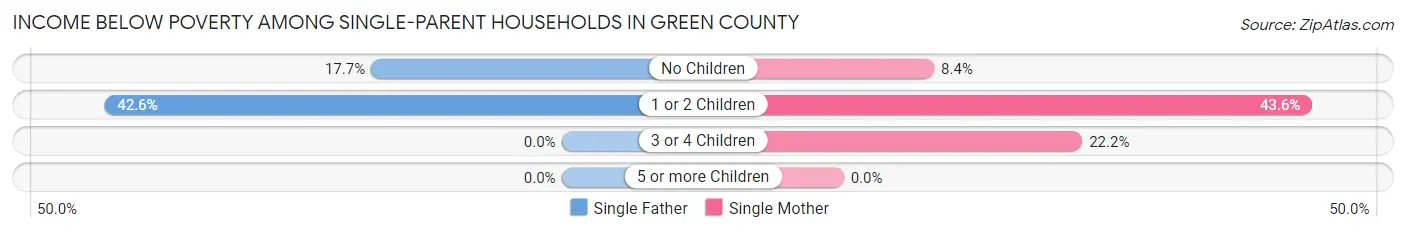
| Children | Single Father | Single Mother |
| No Children | 11 (17.7%) | 17 (8.4%) |
| 1 or 2 Children | 63 (42.6%) | 137 (43.6%) |
| 3 or 4 Children | 0 (0.0%) | 14 (22.2%) |
| 5 or more Children | 0 (0.0%) | 0 (0.0%) |
| Total | 74 (35.2%) | 168 (29.0%) |
Income Below Poverty Among Married-Couple vs Single-Parent Households in Green County
The poverty data for Green County shows that 226 of the married-couple family households (10.2%) and 242 of the single-parent households (30.7%) are living below the poverty level. Within the married-couple family households, those with 5 or more children have the highest poverty rate, with 1 households (100.0%) falling below the poverty line. Among the single-parent households, those with 1 or 2 children have the highest poverty rate, with 200 household (43.3%) living below poverty.
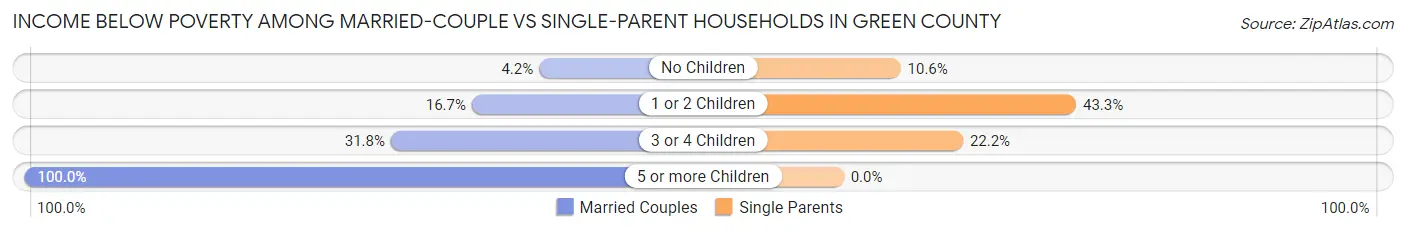
| Children | Married-Couple Families | Single-Parent Households |
| No Children | 56 (4.2%) | 28 (10.6%) |
| 1 or 2 Children | 121 (16.7%) | 200 (43.3%) |
| 3 or 4 Children | 48 (31.8%) | 14 (22.2%) |
| 5 or more Children | 1 (100.0%) | 0 (0.0%) |
| Total | 226 (10.2%) | 242 (30.7%) |
Race in Green County
The most populous races in Green County are White / Caucasian (10,610 | 94.8%), Black / African American (201 | 1.8%), and Hispanic or Latino (199 | 1.8%).
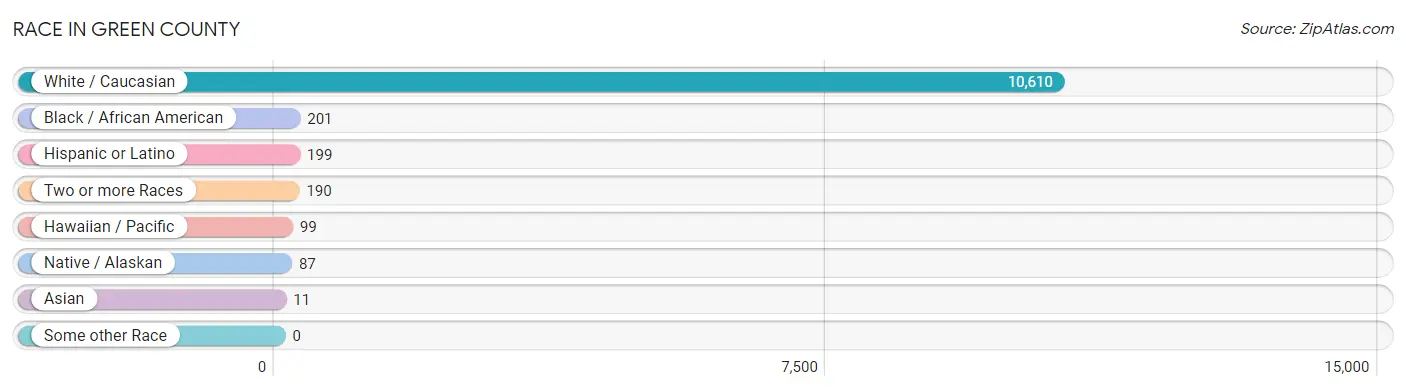
| Race | # Population | % Population |
| Asian | 11 | 0.1% |
| Black / African American | 201 | 1.8% |
| Hawaiian / Pacific | 99 | 0.9% |
| Hispanic or Latino | 199 | 1.8% |
| Native / Alaskan | 87 | 0.8% |
| White / Caucasian | 10,610 | 94.8% |
| Two or more Races | 190 | 1.7% |
| Some other Race | 0 | 0.0% |
| Total | 11,198 | 100.0% |
Ancestry in Green County
The most populous ancestries reported in Green County are American (1,904 | 17.0%), English (997 | 8.9%), Irish (811 | 7.2%), German (547 | 4.9%), and Scottish (176 | 1.6%), together accounting for 39.6% of all Green County residents.
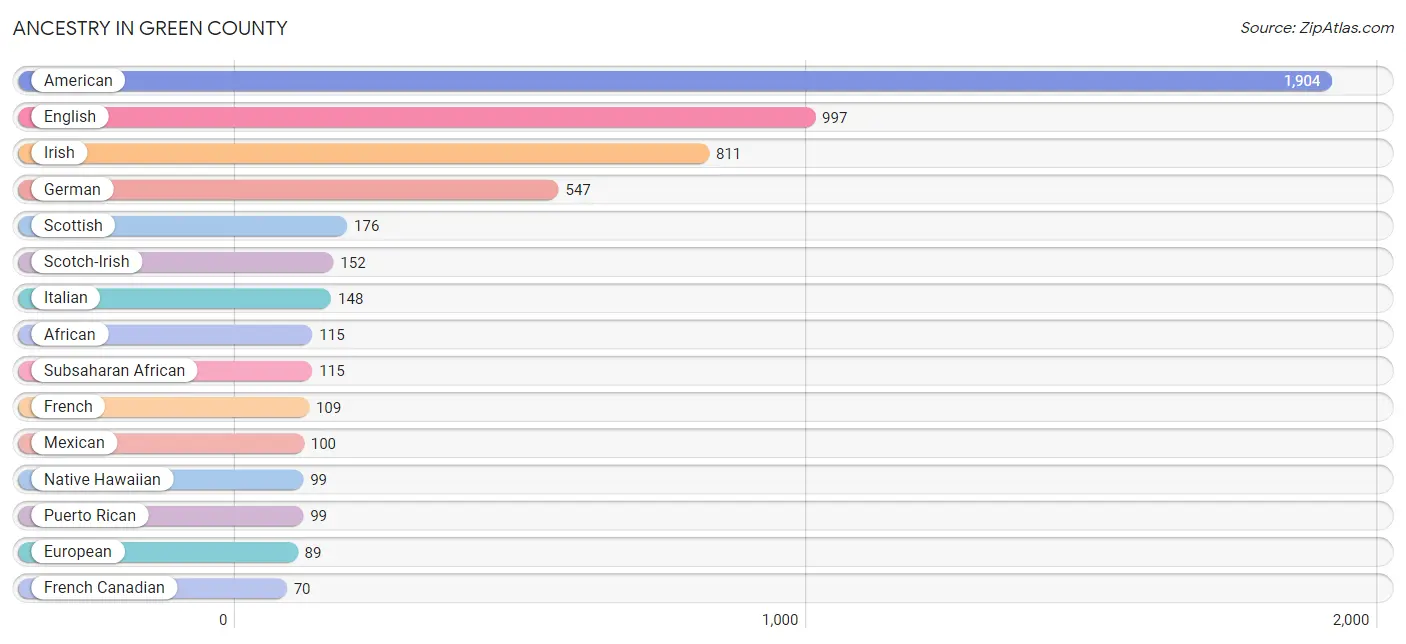
| Ancestry | # Population | % Population |
| African | 115 | 1.0% |
| American | 1,904 | 17.0% |
| Australian | 11 | 0.1% |
| Austrian | 4 | 0.0% |
| Belgian | 12 | 0.1% |
| British | 12 | 0.1% |
| Canadian | 35 | 0.3% |
| Cherokee | 23 | 0.2% |
| Chippewa | 65 | 0.6% |
| Comanche | 2 | 0.0% |
| Czech | 23 | 0.2% |
| Dutch | 68 | 0.6% |
| Eastern European | 47 | 0.4% |
| English | 997 | 8.9% |
| European | 89 | 0.8% |
| French | 109 | 1.0% |
| French Canadian | 70 | 0.6% |
| German | 547 | 4.9% |
| Irish | 811 | 7.2% |
| Italian | 148 | 1.3% |
| Mexican | 100 | 0.9% |
| Native Hawaiian | 99 | 0.9% |
| Norwegian | 7 | 0.1% |
| Pakistani | 11 | 0.1% |
| Polish | 47 | 0.4% |
| Puerto Rican | 99 | 0.9% |
| Scandinavian | 36 | 0.3% |
| Scotch-Irish | 152 | 1.4% |
| Scottish | 176 | 1.6% |
| Sioux | 1 | 0.0% |
| Subsaharan African | 115 | 1.0% |
| Swedish | 48 | 0.4% |
| Swiss | 50 | 0.4% |
| Welsh | 29 | 0.3% | View All 34 Rows |
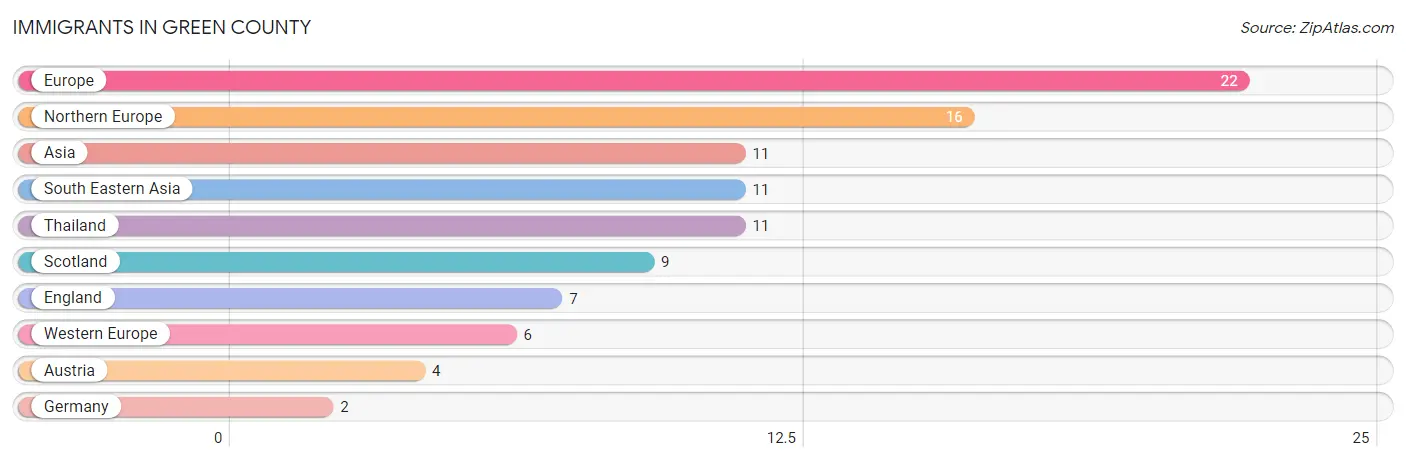
Immigrants in Green County
The most numerous immigrant groups reported in Green County came from Europe (22 | 0.2%), Northern Europe (16 | 0.1%), Asia (11 | 0.1%), South Eastern Asia (11 | 0.1%), and Thailand (11 | 0.1%), together accounting for 0.6% of all Green County residents.
| Immigration Origin | # Population | % Population |
| Asia | 11 | 0.1% |
| Austria | 4 | 0.0% |
| England | 7 | 0.1% |
| Europe | 22 | 0.2% |
| Germany | 2 | 0.0% |
| Northern Europe | 16 | 0.1% |
| Scotland | 9 | 0.1% |
| South Eastern Asia | 11 | 0.1% |
| Thailand | 11 | 0.1% |
| Western Europe | 6 | 0.1% | View All 10 Rows |
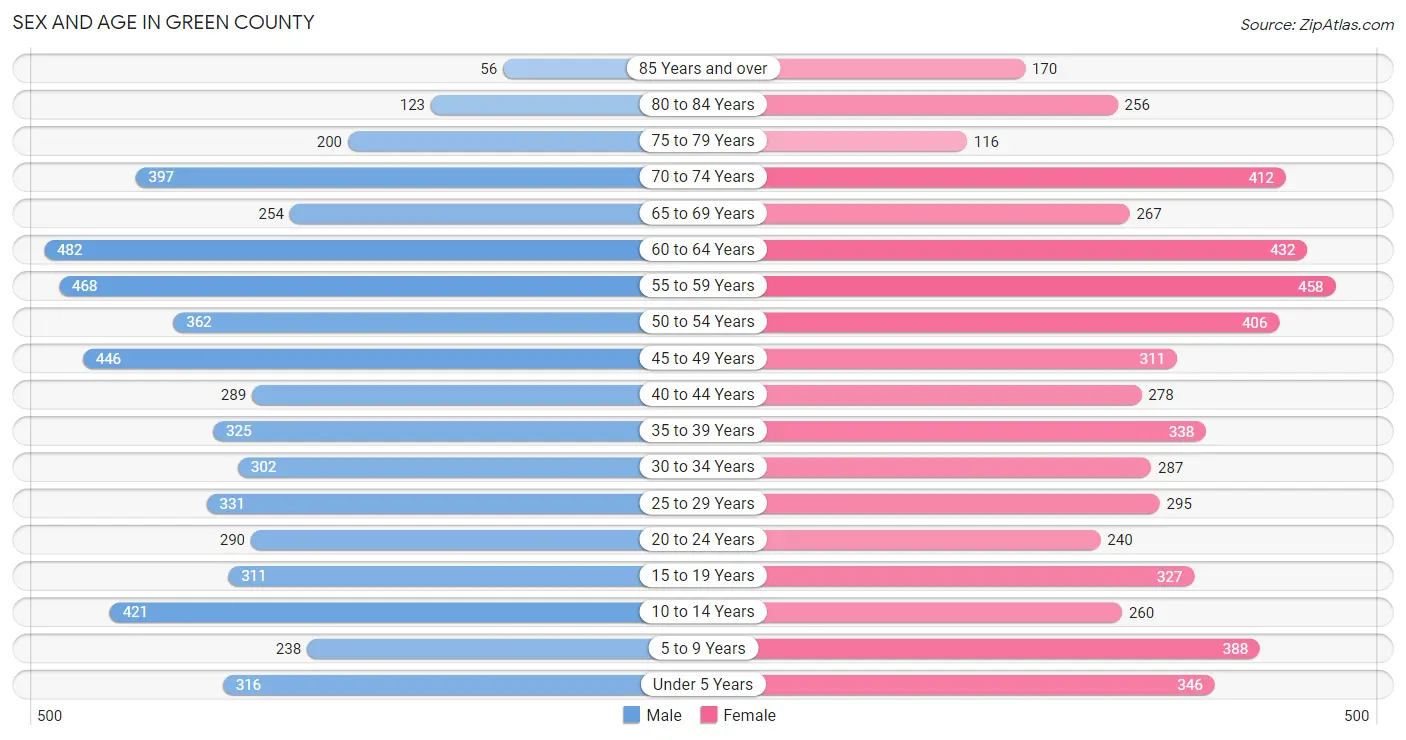
Sex and Age in Green County
Sex and Age in Green County
The most populous age groups in Green County are 60 to 64 Years (482 | 8.6%) for men and 55 to 59 Years (458 | 8.2%) for women.
| Age Bracket | Male | Female |
| Under 5 Years | 316 (5.6%) | 346 (6.2%) |
| 5 to 9 Years | 238 (4.2%) | 388 (6.9%) |
| 10 to 14 Years | 421 (7.5%) | 260 (4.6%) |
| 15 to 19 Years | 311 (5.5%) | 327 (5.9%) |
| 20 to 24 Years | 290 (5.2%) | 240 (4.3%) |
| 25 to 29 Years | 331 (5.9%) | 295 (5.3%) |
| 30 to 34 Years | 302 (5.4%) | 287 (5.1%) |
| 35 to 39 Years | 325 (5.8%) | 338 (6.0%) |
| 40 to 44 Years | 289 (5.1%) | 278 (5.0%) |
| 45 to 49 Years | 446 (8.0%) | 311 (5.6%) |
| 50 to 54 Years | 362 (6.5%) | 406 (7.3%) |
| 55 to 59 Years | 468 (8.3%) | 458 (8.2%) |
| 60 to 64 Years | 482 (8.6%) | 432 (7.7%) |
| 65 to 69 Years | 254 (4.5%) | 267 (4.8%) |
| 70 to 74 Years | 397 (7.1%) | 412 (7.4%) |
| 75 to 79 Years | 200 (3.6%) | 116 (2.1%) |
| 80 to 84 Years | 123 (2.2%) | 256 (4.6%) |
| 85 Years and over | 56 (1.0%) | 170 (3.0%) |
| Total | 5,611 (100.0%) | 5,587 (100.0%) |
Families and Households in Green County
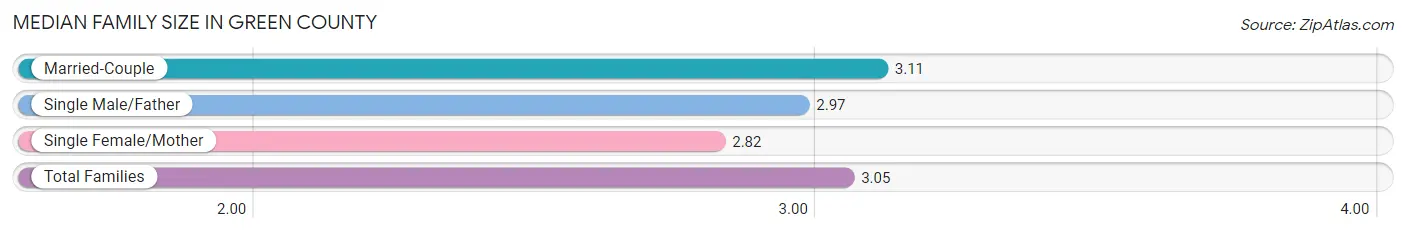
Median Family Size in Green County
The median family size in Green County is 3.05 persons per family, with married-couple families (2,216 | 73.7%) accounting for the largest median family size of 3.11 persons per family. On the other hand, single female/mother families (579 | 19.3%) represent the smallest median family size with 2.82 persons per family.
| Family Type | # Families | Family Size |
| Married-Couple | 2,216 (73.7%) | 3.11 |
| Single Male/Father | 210 (7.0%) | 2.97 |
| Single Female/Mother | 579 (19.3%) | 2.82 |
| Total Families | 3,005 (100.0%) | 3.05 |
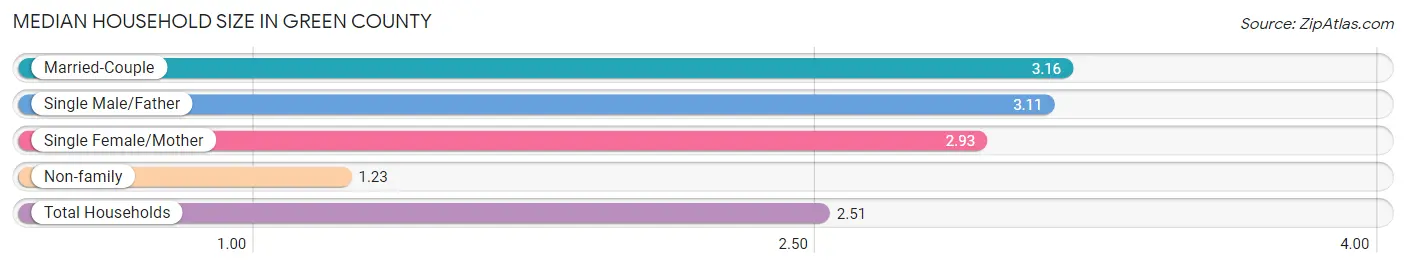
Median Household Size in Green County
The median household size in Green County is 2.51 persons per household, with married-couple households (2,216 | 50.4%) accounting for the largest median household size of 3.16 persons per household. non-family households (1,394 | 31.7%) represent the smallest median household size with 1.23 persons per household.
| Household Type | # Households | Household Size |
| Married-Couple | 2,216 (50.4%) | 3.16 |
| Single Male/Father | 210 (4.8%) | 3.11 |
| Single Female/Mother | 579 (13.2%) | 2.93 |
| Non-family | 1,394 (31.7%) | 1.23 |
| Total Households | 4,399 (100.0%) | 2.51 |
Household Size by Marriage Status in Green County
Out of a total of 4,399 households in Green County, 3,005 (68.3%) are family households, while 1,394 (31.7%) are nonfamily households. The most numerous type of family households are 2-person households, comprising 1,434, and the most common type of nonfamily households are 1-person households, comprising 1,122.
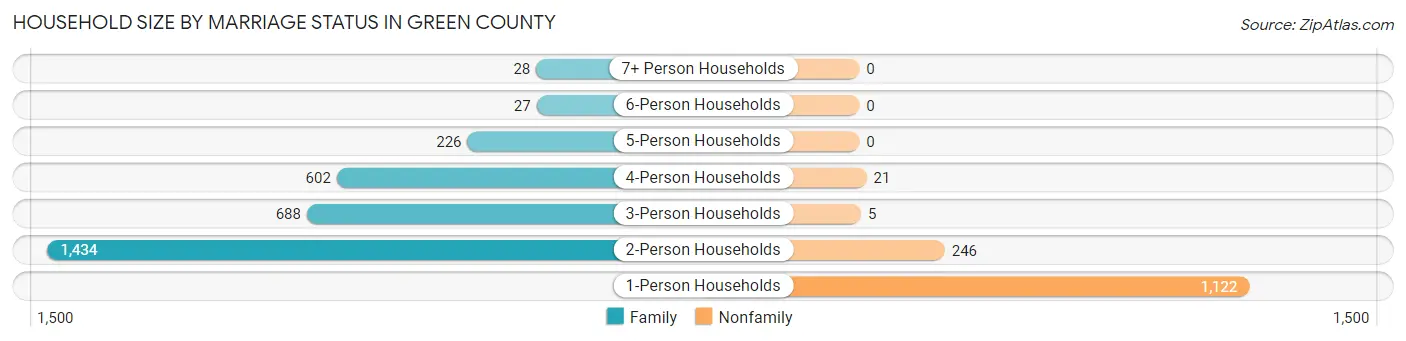
| Household Size | Family Households | Nonfamily Households |
| 1-Person Households | - | 1,122 (25.5%) |
| 2-Person Households | 1,434 (32.6%) | 246 (5.6%) |
| 3-Person Households | 688 (15.6%) | 5 (0.1%) |
| 4-Person Households | 602 (13.7%) | 21 (0.5%) |
| 5-Person Households | 226 (5.1%) | 0 (0.0%) |
| 6-Person Households | 27 (0.6%) | 0 (0.0%) |
| 7+ Person Households | 28 (0.6%) | 0 (0.0%) |
| Total | 3,005 (68.3%) | 1,394 (31.7%) |
Female Fertility in Green County
Fertility by Age in Green County
Average fertility rate in Green County is 63.0 births per 1,000 women. Women in the age bracket of 20 to 34 years have the highest fertility rate with 151.0 births per 1,000 women. Women in the age bracket of 20 to 34 years acount for 93.9% of all women with births.
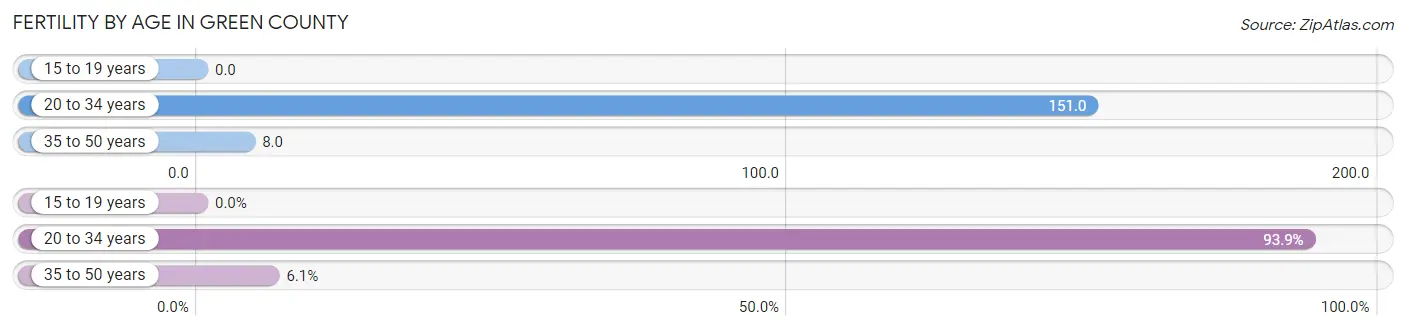
| Age Bracket | Women with Births | Births / 1,000 Women |
| 15 to 19 years | 0 (0.0%) | 0.0 |
| 20 to 34 years | 124 (93.9%) | 151.0 |
| 35 to 50 years | 8 (6.1%) | 8.0 |
| Total | 132 (100.0%) | 63.0 |
Fertility by Age by Marriage Status in Green County
92.4% of women with births (132) in Green County are married. The highest percentage of unmarried women with births falls into 35 to 50 years age bracket with 100.0% of them unmarried at the time of birth, while the lowest percentage of unmarried women with births belong to 20 to 34 years age bracket with 1.6% of them unmarried.
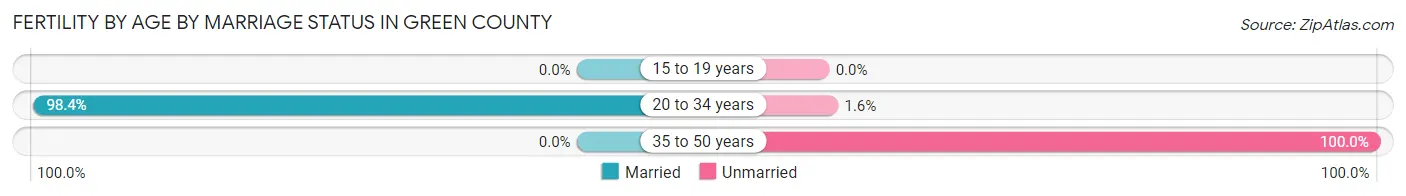
| Age Bracket | Married | Unmarried |
| 15 to 19 years | 0 (0.0%) | 0 (0.0%) |
| 20 to 34 years | 122 (98.4%) | 2 (1.6%) |
| 35 to 50 years | 0 (0.0%) | 8 (100.0%) |
| Total | 122 (92.4%) | 10 (7.6%) |
Fertility by Education in Green County
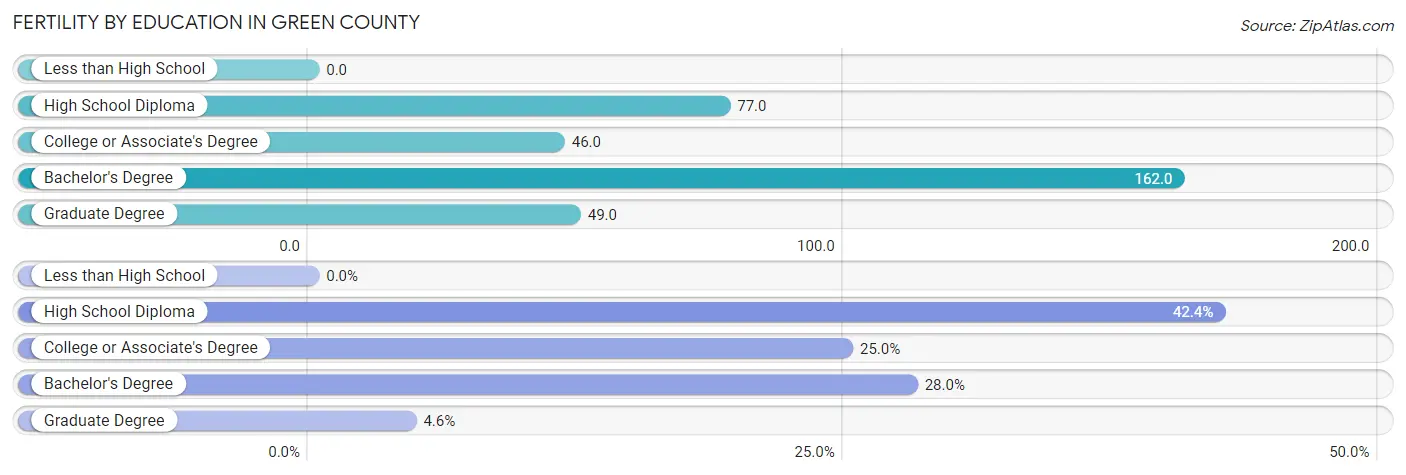
| Educational Attainment | Women with Births | Births / 1,000 Women |
| Less than High School | 0 (0.0%) | 0.0 |
| High School Diploma | 56 (42.4%) | 77.0 |
| College or Associate's Degree | 33 (25.0%) | 46.0 |
| Bachelor's Degree | 37 (28.0%) | 162.0 |
| Graduate Degree | 6 (4.5%) | 49.0 |
| Total | 132 (100.0%) | 63.0 |
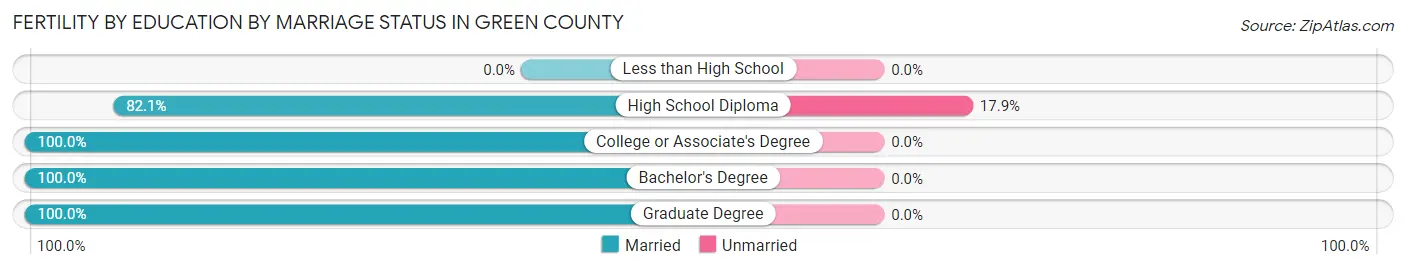
Fertility by Education by Marriage Status in Green County
7.6% of women with births in Green County are unmarried. Women with the educational attainment of college or associate's degree are most likely to be married with 100.0% of them married at childbirth, while women with the educational attainment of high school diploma are least likely to be married with 17.9% of them unmarried at childbirth.
| Educational Attainment | Married | Unmarried |
| Less than High School | 0 (0.0%) | 0 (0.0%) |
| High School Diploma | 46 (82.1%) | 10 (17.9%) |
| College or Associate's Degree | 33 (100.0%) | 0 (0.0%) |
| Bachelor's Degree | 37 (100.0%) | 0 (0.0%) |
| Graduate Degree | 6 (100.0%) | 0 (0.0%) |
| Total | 122 (92.4%) | 10 (7.6%) |
Employment Characteristics in Green County
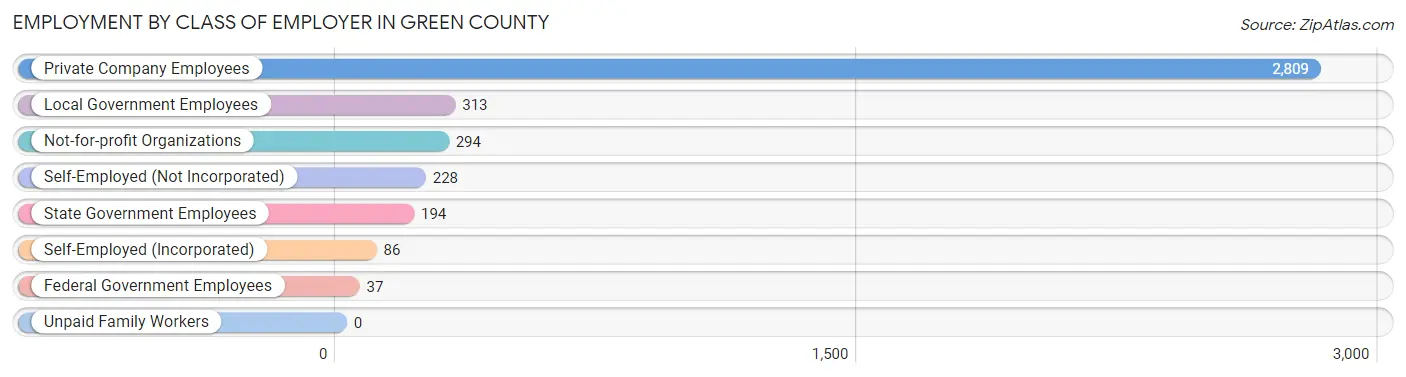
Employment by Class of Employer in Green County
Among the 3,961 employed individuals in Green County, private company employees (2,809 | 70.9%), local government employees (313 | 7.9%), and not-for-profit organizations (294 | 7.4%) make up the most common classes of employment.
| Employer Class | # Employees | % Employees |
| Private Company Employees | 2,809 | 70.9% |
| Self-Employed (Incorporated) | 86 | 2.2% |
| Self-Employed (Not Incorporated) | 228 | 5.8% |
| Not-for-profit Organizations | 294 | 7.4% |
| Local Government Employees | 313 | 7.9% |
| State Government Employees | 194 | 4.9% |
| Federal Government Employees | 37 | 0.9% |
| Unpaid Family Workers | 0 | 0.0% |
| Total | 3,961 | 100.0% |
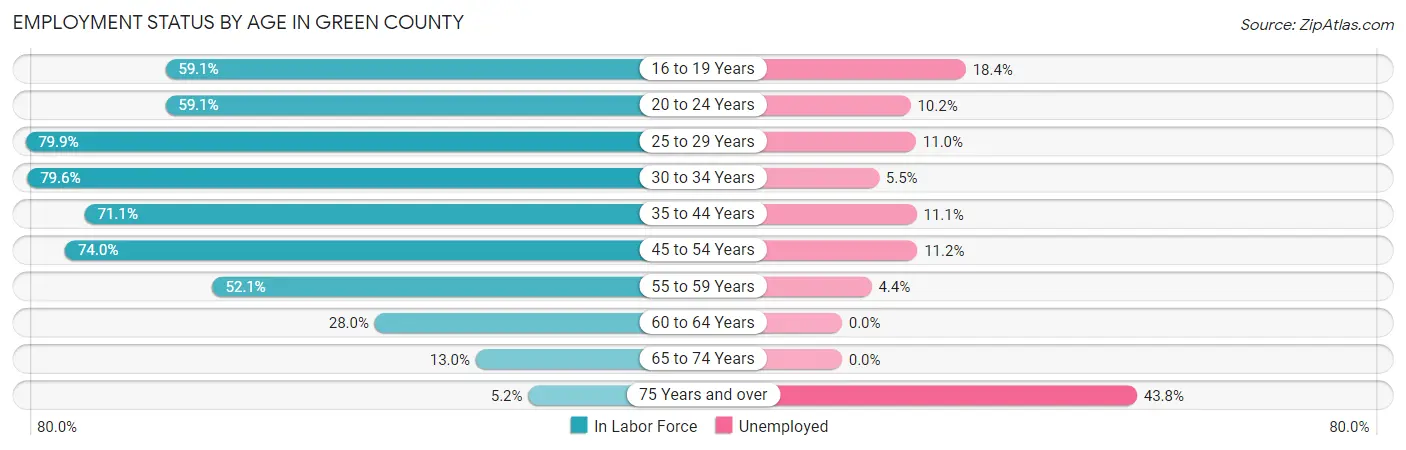
Employment Status by Age in Green County
According to the labor force statistics for Green County, out of the total population over 16 years of age (9,051), 49.9% or 4,516 individuals are in the labor force, with 9.5% or 429 of them unemployed. The age group with the highest labor force participation rate is 25 to 29 years, with 79.9% or 500 individuals in the labor force. Within the labor force, the 75 years and over age range has the highest percentage of unemployed individuals, with 43.8% or 21 of them being unemployed.
| Age Bracket | In Labor Force | Unemployed |
| 16 to 19 Years | 272 (59.1%) | 50 (18.4%) |
| 20 to 24 Years | 313 (59.1%) | 32 (10.2%) |
| 25 to 29 Years | 500 (79.9%) | 55 (11.0%) |
| 30 to 34 Years | 469 (79.6%) | 26 (5.5%) |
| 35 to 44 Years | 875 (71.1%) | 97 (11.1%) |
| 45 to 54 Years | 1,128 (74.0%) | 126 (11.2%) |
| 55 to 59 Years | 482 (52.1%) | 21 (4.4%) |
| 60 to 64 Years | 256 (28.0%) | 0 (0.0%) |
| 65 to 74 Years | 173 (13.0%) | 0 (0.0%) |
| 75 Years and over | 48 (5.2%) | 21 (43.8%) |
| Total | 4,516 (49.9%) | 429 (9.5%) |
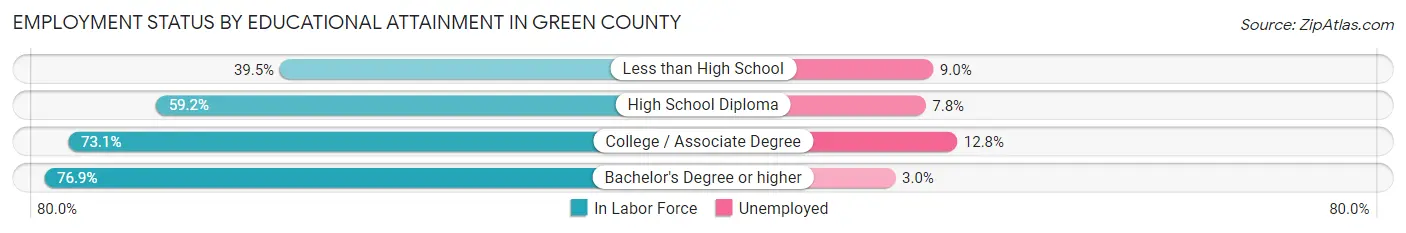
Employment Status by Educational Attainment in Green County
According to labor force statistics for Green County, 63.9% of individuals (3,713) out of the total population between 25 and 64 years of age (5,810) are in the labor force, with 8.8% or 327 of them being unemployed. The group with the highest labor force participation rate are those with the educational attainment of bachelor's degree or higher, with 76.9% or 691 individuals in the labor force. Within the labor force, individuals with college / associate degree education have the highest percentage of unemployment, with 12.8% or 168 of them being unemployed.
| Educational Attainment | In Labor Force | Unemployed |
| Less than High School | 277 (39.5%) | 63 (9.0%) |
| High School Diploma | 1,428 (59.2%) | 188 (7.8%) |
| College / Associate Degree | 1,314 (73.1%) | 230 (12.8%) |
| Bachelor's Degree or higher | 691 (76.9%) | 27 (3.0%) |
| Total | 3,713 (63.9%) | 511 (8.8%) |
Employment Occupations by Sex in Green County
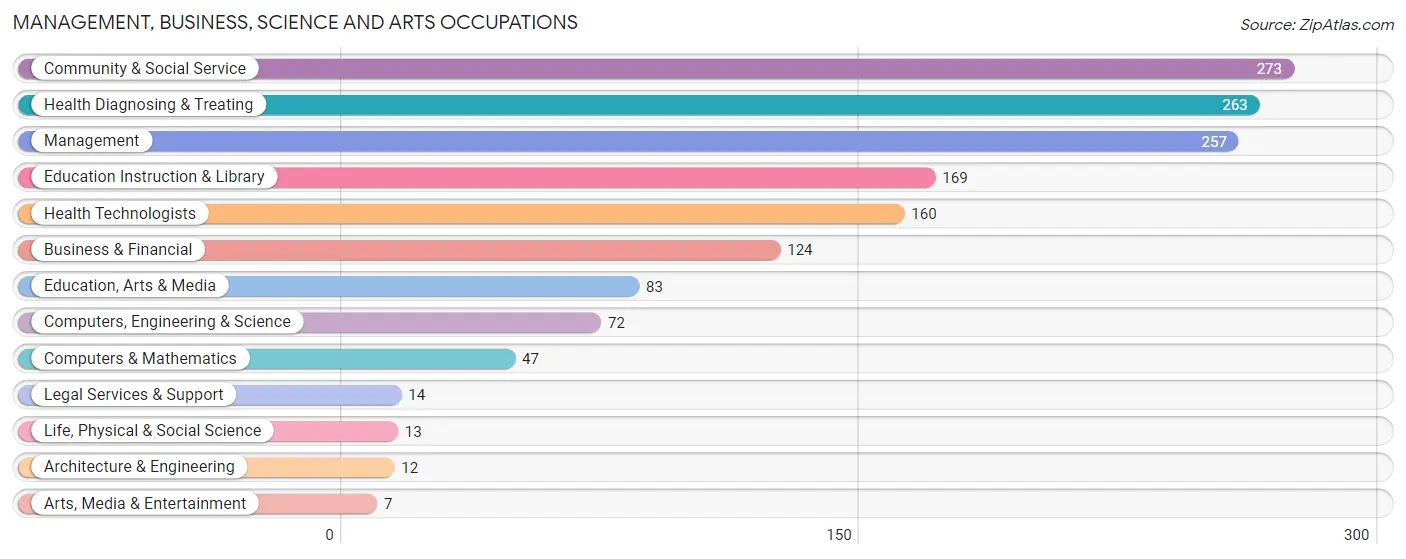
Management, Business, Science and Arts Occupations
The most common Management, Business, Science and Arts occupations in Green County are Community & Social Service (273 | 6.7%), Health Diagnosing & Treating (263 | 6.4%), Management (257 | 6.3%), Education Instruction & Library (169 | 4.1%), and Health Technologists (160 | 3.9%).
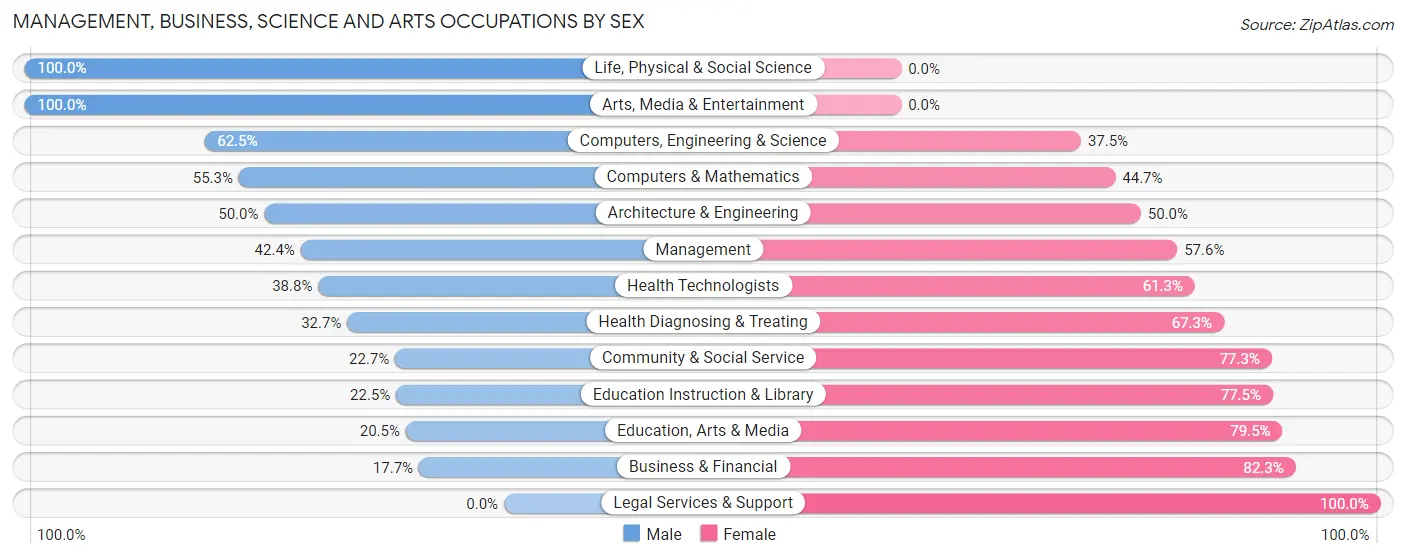
Management, Business, Science and Arts Occupations by Sex
Within the Management, Business, Science and Arts occupations in Green County, the most male-oriented occupations are Life, Physical & Social Science (100.0%), Arts, Media & Entertainment (100.0%), and Computers, Engineering & Science (62.5%), while the most female-oriented occupations are Legal Services & Support (100.0%), Business & Financial (82.3%), and Education, Arts & Media (79.5%).
| Occupation | Male | Female |
| Management | 109 (42.4%) | 148 (57.6%) |
| Business & Financial | 22 (17.7%) | 102 (82.3%) |
| Computers, Engineering & Science | 45 (62.5%) | 27 (37.5%) |
| Computers & Mathematics | 26 (55.3%) | 21 (44.7%) |
| Architecture & Engineering | 6 (50.0%) | 6 (50.0%) |
| Life, Physical & Social Science | 13 (100.0%) | 0 (0.0%) |
| Community & Social Service | 62 (22.7%) | 211 (77.3%) |
| Education, Arts & Media | 17 (20.5%) | 66 (79.5%) |
| Legal Services & Support | 0 (0.0%) | 14 (100.0%) |
| Education Instruction & Library | 38 (22.5%) | 131 (77.5%) |
| Arts, Media & Entertainment | 7 (100.0%) | 0 (0.0%) |
| Health Diagnosing & Treating | 86 (32.7%) | 177 (67.3%) |
| Health Technologists | 62 (38.8%) | 98 (61.3%) |
| Total (Category) | 324 (32.8%) | 665 (67.2%) |
| Total (Overall) | 2,103 (51.4%) | 1,985 (48.6%) |
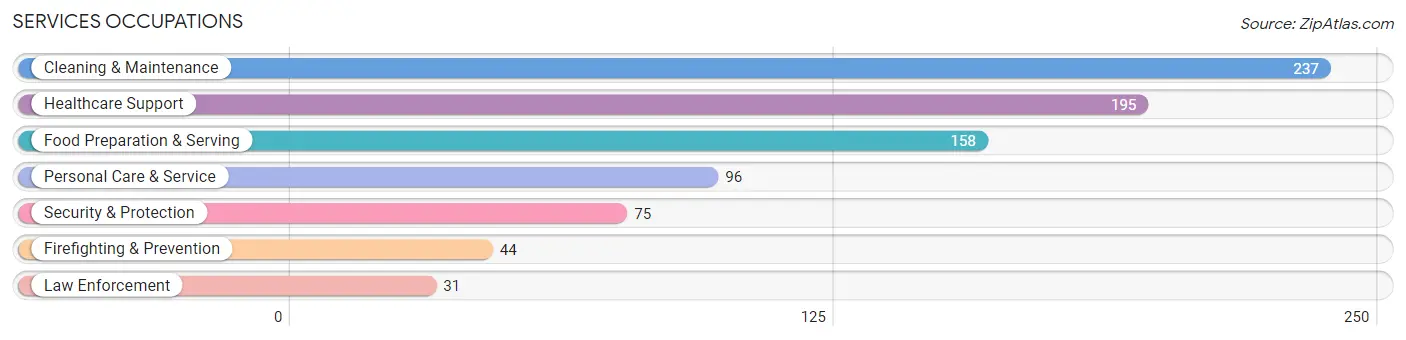
Services Occupations
The most common Services occupations in Green County are Cleaning & Maintenance (237 | 5.8%), Healthcare Support (195 | 4.8%), Food Preparation & Serving (158 | 3.9%), Personal Care & Service (96 | 2.4%), and Security & Protection (75 | 1.8%).
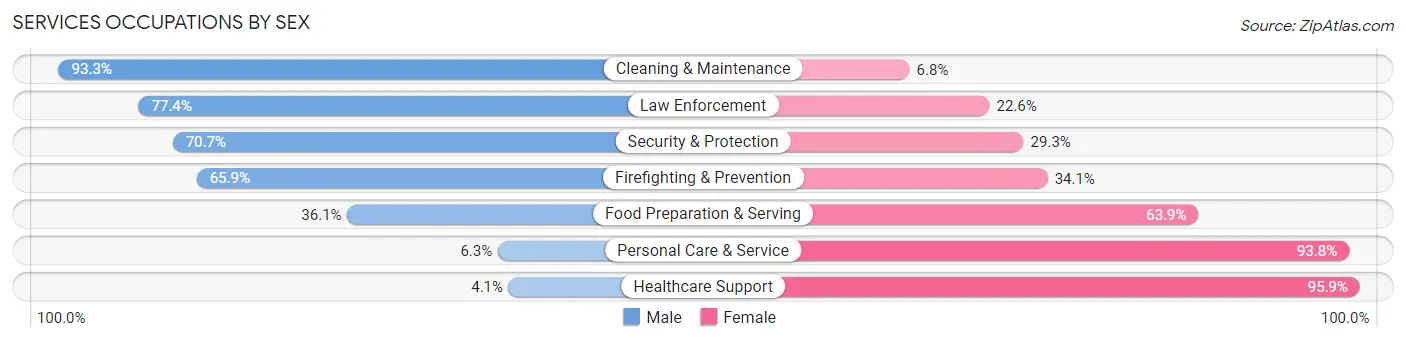
Services Occupations by Sex
Within the Services occupations in Green County, the most male-oriented occupations are Cleaning & Maintenance (93.2%), Law Enforcement (77.4%), and Security & Protection (70.7%), while the most female-oriented occupations are Healthcare Support (95.9%), Personal Care & Service (93.8%), and Food Preparation & Serving (63.9%).
| Occupation | Male | Female |
| Healthcare Support | 8 (4.1%) | 187 (95.9%) |
| Security & Protection | 53 (70.7%) | 22 (29.3%) |
| Firefighting & Prevention | 29 (65.9%) | 15 (34.1%) |
| Law Enforcement | 24 (77.4%) | 7 (22.6%) |
| Food Preparation & Serving | 57 (36.1%) | 101 (63.9%) |
| Cleaning & Maintenance | 221 (93.2%) | 16 (6.8%) |
| Personal Care & Service | 6 (6.2%) | 90 (93.8%) |
| Total (Category) | 345 (45.3%) | 416 (54.7%) |
| Total (Overall) | 2,103 (51.4%) | 1,985 (48.6%) |
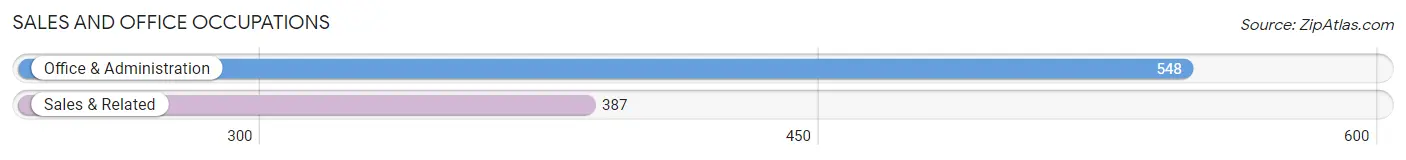
Sales and Office Occupations
The most common Sales and Office occupations in Green County are Office & Administration (548 | 13.4%), and Sales & Related (387 | 9.5%).
Sales and Office Occupations by Sex
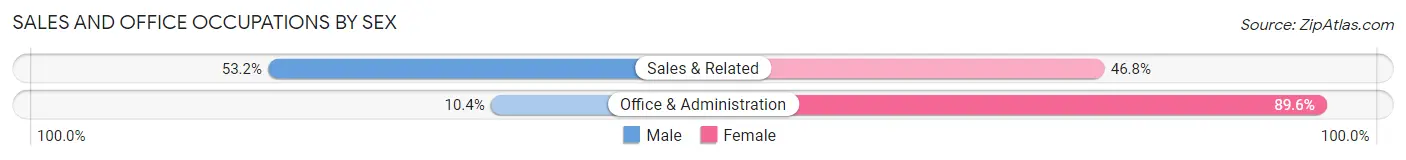
| Occupation | Male | Female |
| Sales & Related | 206 (53.2%) | 181 (46.8%) |
| Office & Administration | 57 (10.4%) | 491 (89.6%) |
| Total (Category) | 263 (28.1%) | 672 (71.9%) |
| Total (Overall) | 2,103 (51.4%) | 1,985 (48.6%) |
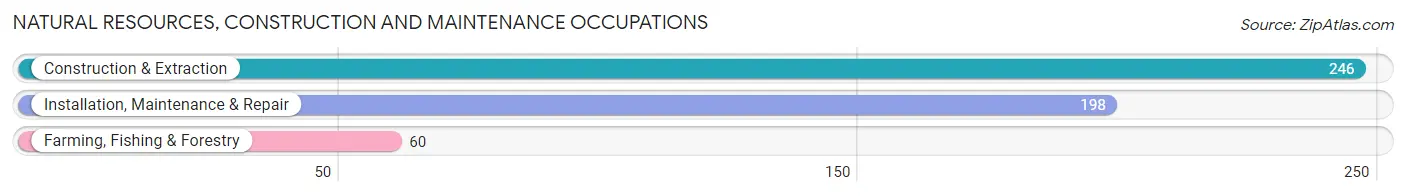
Natural Resources, Construction and Maintenance Occupations
The most common Natural Resources, Construction and Maintenance occupations in Green County are Construction & Extraction (246 | 6.0%), Installation, Maintenance & Repair (198 | 4.8%), and Farming, Fishing & Forestry (60 | 1.5%).
Natural Resources, Construction and Maintenance Occupations by Sex
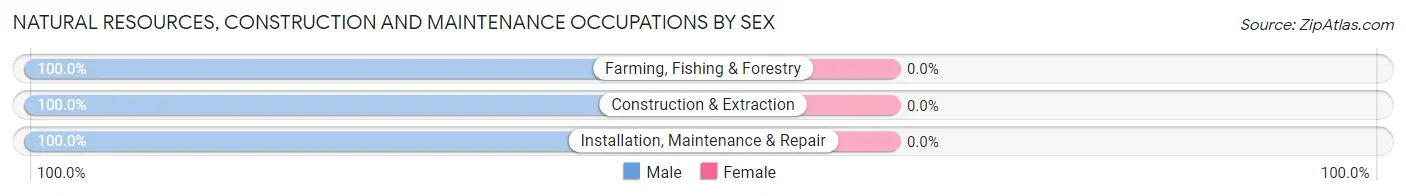
| Occupation | Male | Female |
| Farming, Fishing & Forestry | 60 (100.0%) | 0 (0.0%) |
| Construction & Extraction | 246 (100.0%) | 0 (0.0%) |
| Installation, Maintenance & Repair | 198 (100.0%) | 0 (0.0%) |
| Total (Category) | 504 (100.0%) | 0 (0.0%) |
| Total (Overall) | 2,103 (51.4%) | 1,985 (48.6%) |
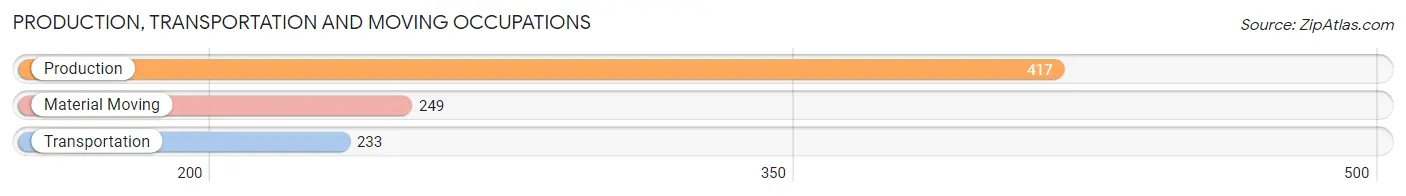
Production, Transportation and Moving Occupations
The most common Production, Transportation and Moving occupations in Green County are Production (417 | 10.2%), Material Moving (249 | 6.1%), and Transportation (233 | 5.7%).
Production, Transportation and Moving Occupations by Sex
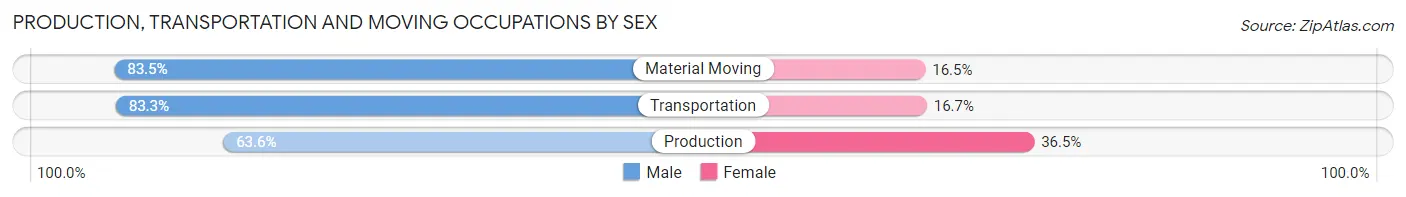
| Occupation | Male | Female |
| Production | 265 (63.5%) | 152 (36.4%) |
| Transportation | 194 (83.3%) | 39 (16.7%) |
| Material Moving | 208 (83.5%) | 41 (16.5%) |
| Total (Category) | 667 (74.2%) | 232 (25.8%) |
| Total (Overall) | 2,103 (51.4%) | 1,985 (48.6%) |
Employment Industries by Sex in Green County
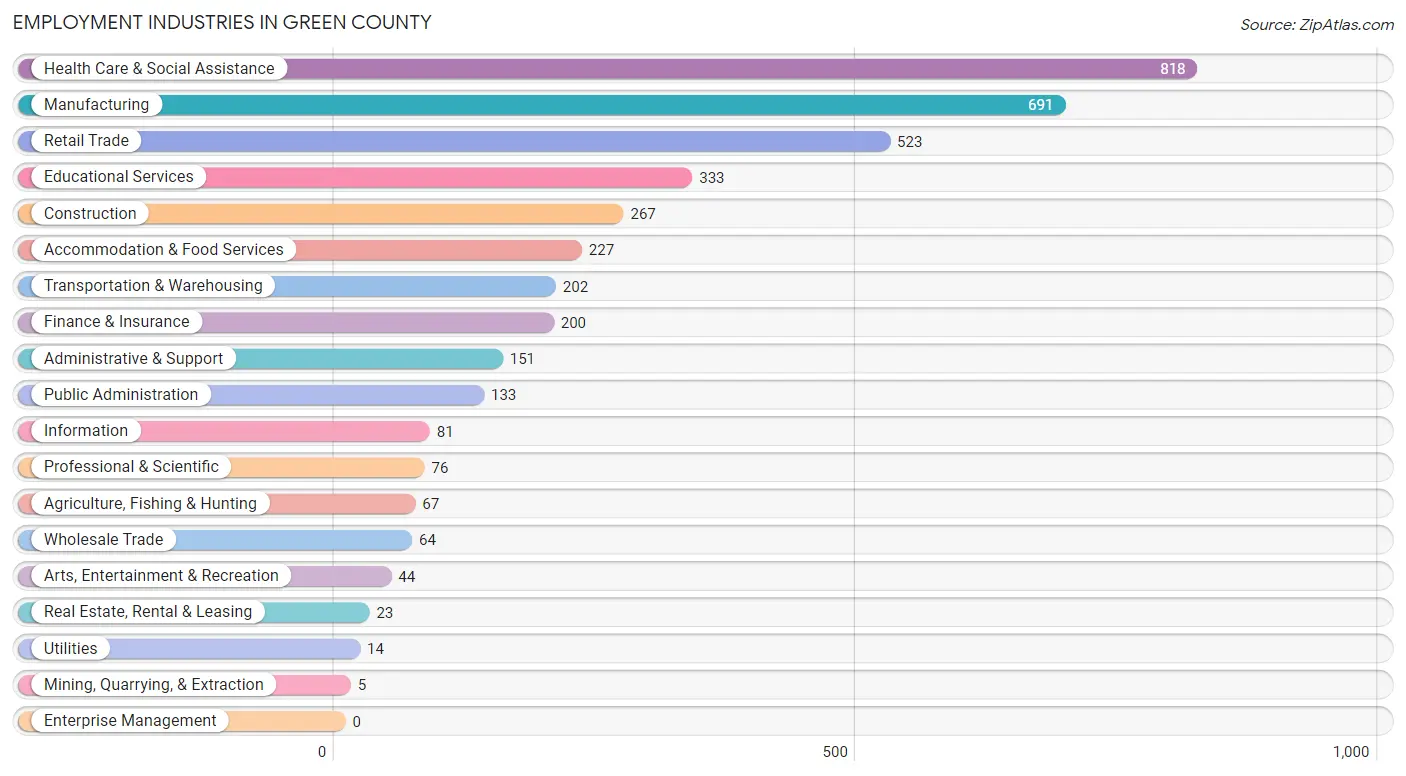
Employment Industries in Green County
The major employment industries in Green County include Health Care & Social Assistance (818 | 20.0%), Manufacturing (691 | 16.9%), Retail Trade (523 | 12.8%), Educational Services (333 | 8.2%), and Construction (267 | 6.5%).
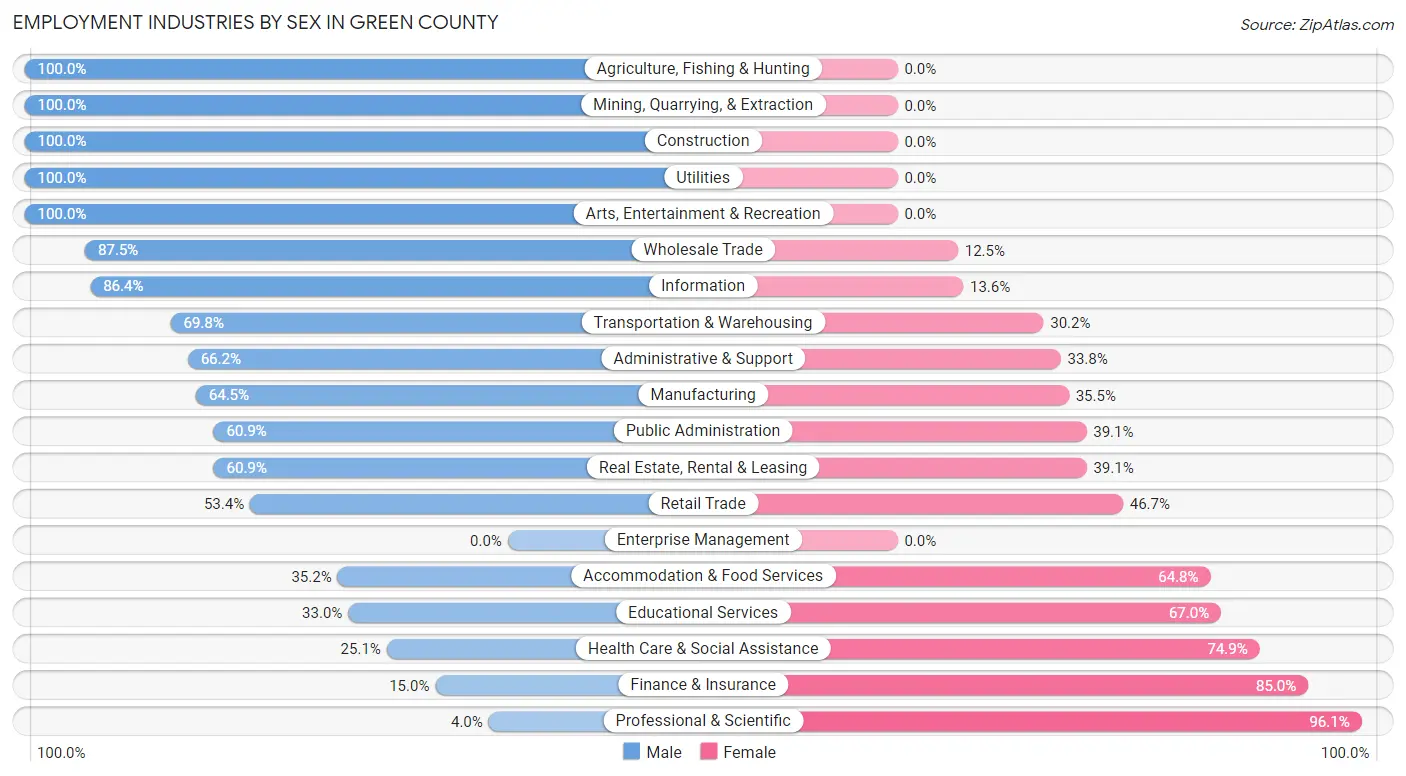
Employment Industries by Sex in Green County
The Green County industries that see more men than women are Agriculture, Fishing & Hunting (100.0%), Mining, Quarrying, & Extraction (100.0%), and Construction (100.0%), whereas the industries that tend to have a higher number of women are Professional & Scientific (96.1%), Finance & Insurance (85.0%), and Health Care & Social Assistance (74.9%).
| Industry | Male | Female |
| Agriculture, Fishing & Hunting | 67 (100.0%) | 0 (0.0%) |
| Mining, Quarrying, & Extraction | 5 (100.0%) | 0 (0.0%) |
| Construction | 267 (100.0%) | 0 (0.0%) |
| Manufacturing | 446 (64.5%) | 245 (35.5%) |
| Wholesale Trade | 56 (87.5%) | 8 (12.5%) |
| Retail Trade | 279 (53.3%) | 244 (46.7%) |
| Transportation & Warehousing | 141 (69.8%) | 61 (30.2%) |
| Utilities | 14 (100.0%) | 0 (0.0%) |
| Information | 70 (86.4%) | 11 (13.6%) |
| Finance & Insurance | 30 (15.0%) | 170 (85.0%) |
| Real Estate, Rental & Leasing | 14 (60.9%) | 9 (39.1%) |
| Professional & Scientific | 3 (4.0%) | 73 (96.1%) |
| Enterprise Management | 0 (0.0%) | 0 (0.0%) |
| Administrative & Support | 100 (66.2%) | 51 (33.8%) |
| Educational Services | 110 (33.0%) | 223 (67.0%) |
| Health Care & Social Assistance | 205 (25.1%) | 613 (74.9%) |
| Arts, Entertainment & Recreation | 44 (100.0%) | 0 (0.0%) |
| Accommodation & Food Services | 80 (35.2%) | 147 (64.8%) |
| Public Administration | 81 (60.9%) | 52 (39.1%) |
| Total | 2,103 (51.4%) | 1,985 (48.6%) |
Education in Green County
School Enrollment in Green County
The most common levels of schooling among the 1,977 students in Green County are elementary school (526 | 26.6%), high school (503 | 25.4%), and middle school (417 | 21.1%).
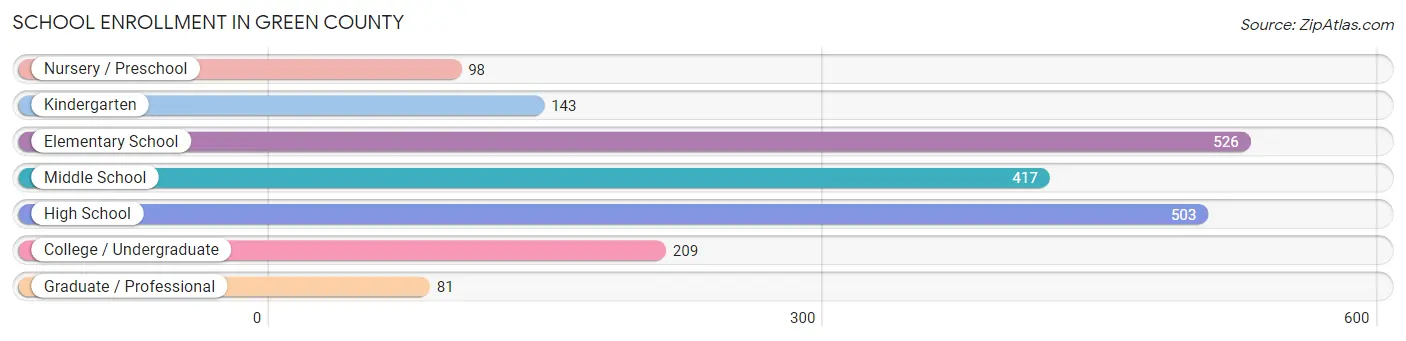
| School Level | # Students | % Students |
| Nursery / Preschool | 98 | 5.0% |
| Kindergarten | 143 | 7.2% |
| Elementary School | 526 | 26.6% |
| Middle School | 417 | 21.1% |
| High School | 503 | 25.4% |
| College / Undergraduate | 209 | 10.6% |
| Graduate / Professional | 81 | 4.1% |
| Total | 1,977 | 100.0% |
School Enrollment by Age by Funding Source in Green County
Out of a total of 1,977 students who are enrolled in schools in Green County, 212 (10.7%) attend a private institution, while the remaining 1,765 (89.3%) are enrolled in public schools. The age group of 20 to 24 year olds has the highest likelihood of being enrolled in private schools, with 31 (41.9% in the age bracket) enrolled. Conversely, the age group of 35 years and over has the lowest likelihood of being enrolled in a private school, with 35 (100.0% in the age bracket) attending a public institution.
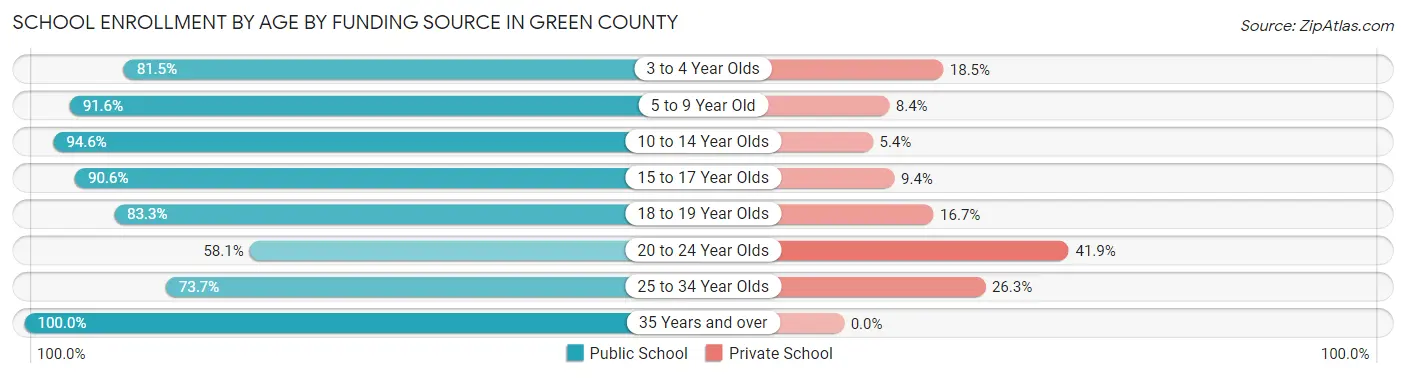
| Age Bracket | Public School | Private School |
| 3 to 4 Year Olds | 75 (81.5%) | 17 (18.5%) |
| 5 to 9 Year Old | 511 (91.6%) | 47 (8.4%) |
| 10 to 14 Year Olds | 564 (94.6%) | 32 (5.4%) |
| 15 to 17 Year Olds | 347 (90.6%) | 36 (9.4%) |
| 18 to 19 Year Olds | 120 (83.3%) | 24 (16.7%) |
| 20 to 24 Year Olds | 43 (58.1%) | 31 (41.9%) |
| 25 to 34 Year Olds | 70 (73.7%) | 25 (26.3%) |
| 35 Years and over | 35 (100.0%) | 0 (0.0%) |
| Total | 1,765 (89.3%) | 212 (10.7%) |
Educational Attainment by Field of Study in Green County
Education (267 | 22.4%), business (164 | 13.8%), science & technology (154 | 12.9%), arts & humanities (124 | 10.4%), and bio, nature & agricultural (88 | 7.4%) are the most common fields of study among 1,193 individuals in Green County who have obtained a bachelor's degree or higher.
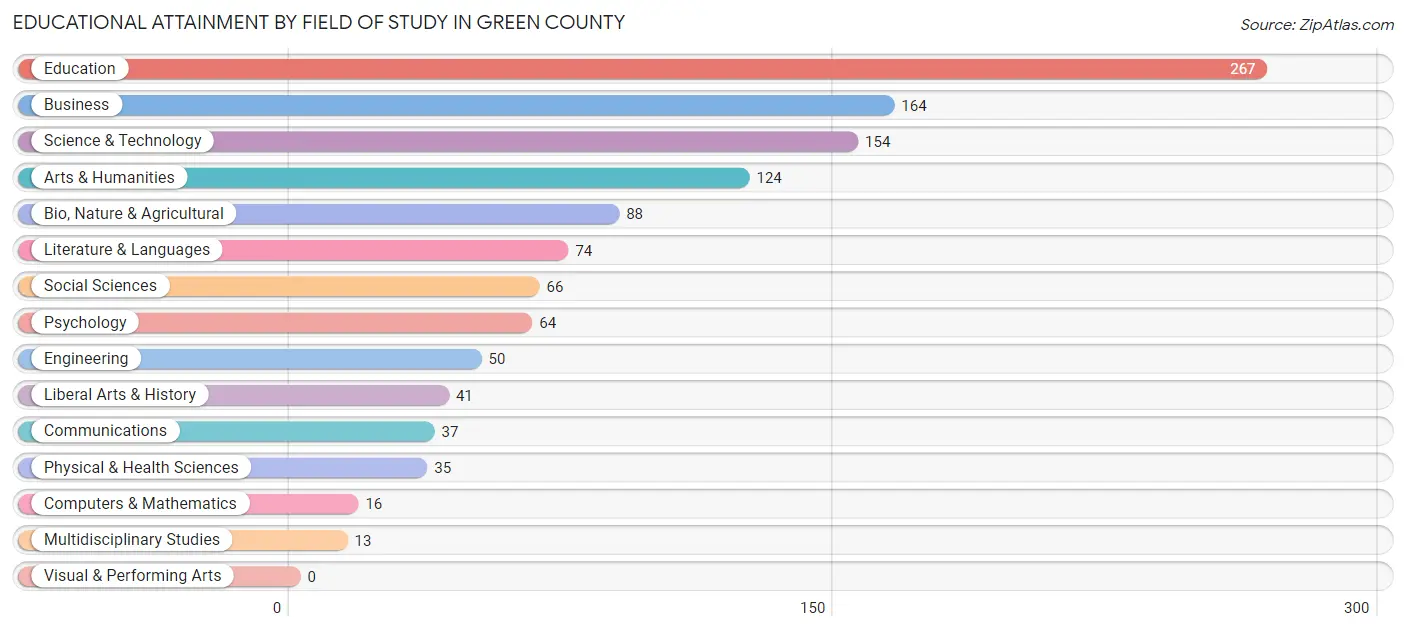
| Field of Study | # Graduates | % Graduates |
| Computers & Mathematics | 16 | 1.3% |
| Bio, Nature & Agricultural | 88 | 7.4% |
| Physical & Health Sciences | 35 | 2.9% |
| Psychology | 64 | 5.4% |
| Social Sciences | 66 | 5.5% |
| Engineering | 50 | 4.2% |
| Multidisciplinary Studies | 13 | 1.1% |
| Science & Technology | 154 | 12.9% |
| Business | 164 | 13.8% |
| Education | 267 | 22.4% |
| Literature & Languages | 74 | 6.2% |
| Liberal Arts & History | 41 | 3.4% |
| Visual & Performing Arts | 0 | 0.0% |
| Communications | 37 | 3.1% |
| Arts & Humanities | 124 | 10.4% |
| Total | 1,193 | 100.0% |
Transportation & Commute in Green County
Vehicle Availability by Sex in Green County
The most prevalent vehicle ownership categories in Green County are males with 2 vehicles (813, accounting for 39.1%) and females with 2 vehicles (738, making up 43.2%).
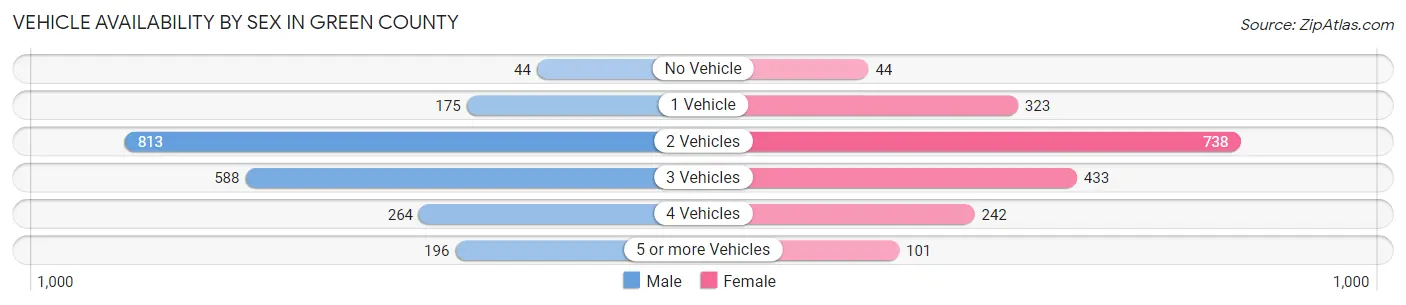
| Vehicles Available | Male | Female |
| No Vehicle | 44 (2.1%) | 44 (2.3%) |
| 1 Vehicle | 175 (8.4%) | 323 (17.2%) |
| 2 Vehicles | 813 (39.1%) | 738 (39.2%) |
| 3 Vehicles | 588 (28.3%) | 433 (23.0%) |
| 4 Vehicles | 264 (12.7%) | 242 (12.9%) |
| 5 or more Vehicles | 196 (9.4%) | 101 (5.4%) |
| Total | 2,080 (100.0%) | 1,881 (100.0%) |
Commute Time in Green County
The most frequently occuring commute durations in Green County are 15 to 19 minutes (561 commuters, 15.3%), 5 to 9 minutes (484 commuters, 13.2%), and 30 to 34 minutes (460 commuters, 12.5%).
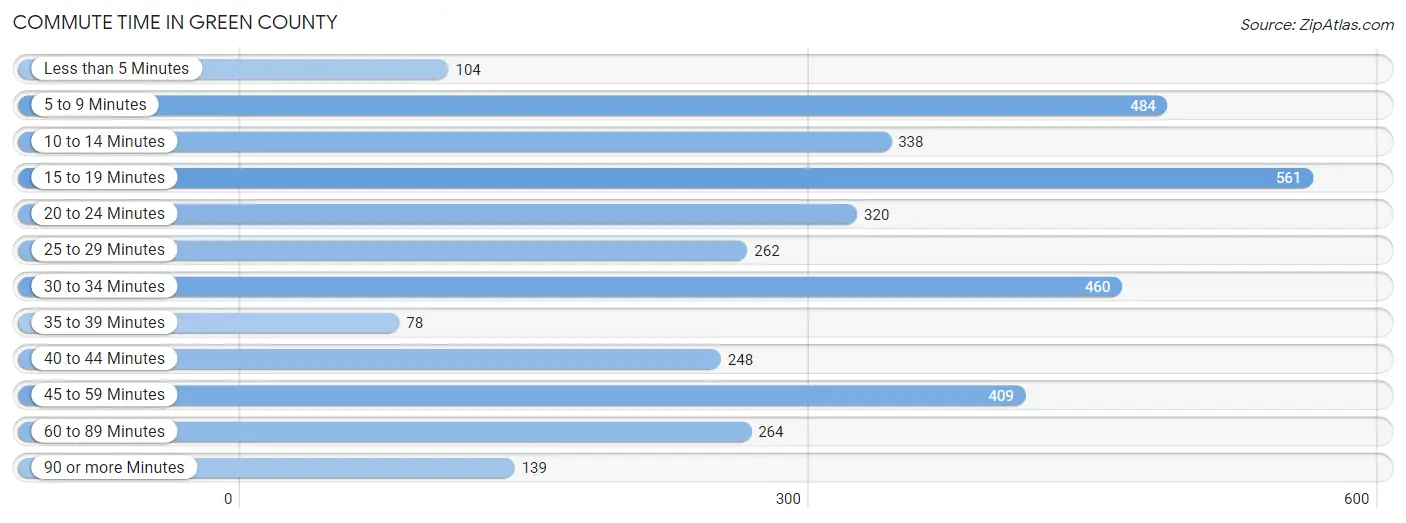
| Commute Time | # Commuters | % Commuters |
| Less than 5 Minutes | 104 | 2.8% |
| 5 to 9 Minutes | 484 | 13.2% |
| 10 to 14 Minutes | 338 | 9.2% |
| 15 to 19 Minutes | 561 | 15.3% |
| 20 to 24 Minutes | 320 | 8.7% |
| 25 to 29 Minutes | 262 | 7.1% |
| 30 to 34 Minutes | 460 | 12.5% |
| 35 to 39 Minutes | 78 | 2.1% |
| 40 to 44 Minutes | 248 | 6.8% |
| 45 to 59 Minutes | 409 | 11.2% |
| 60 to 89 Minutes | 264 | 7.2% |
| 90 or more Minutes | 139 | 3.8% |
Commute Time by Sex in Green County
The most common commute times in Green County are 45 to 59 minutes (294 commuters, 15.1%) for males and 15 to 19 minutes (304 commuters, 17.6%) for females.
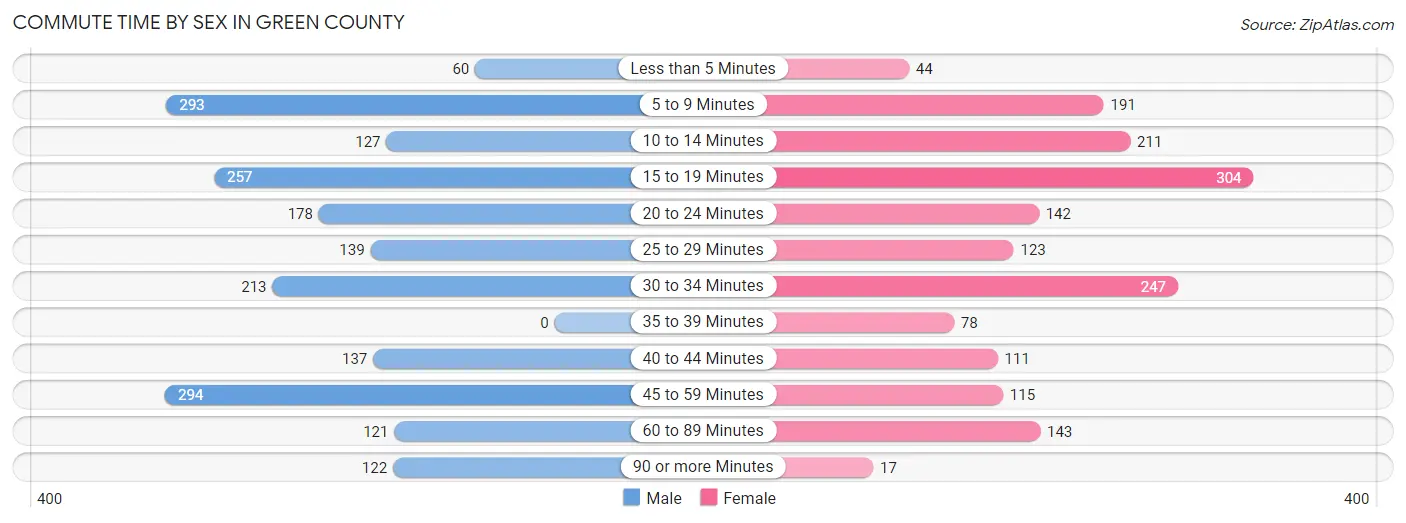
| Commute Time | Male | Female |
| Less than 5 Minutes | 60 (3.1%) | 44 (2.5%) |
| 5 to 9 Minutes | 293 (15.1%) | 191 (11.1%) |
| 10 to 14 Minutes | 127 (6.5%) | 211 (12.2%) |
| 15 to 19 Minutes | 257 (13.2%) | 304 (17.6%) |
| 20 to 24 Minutes | 178 (9.2%) | 142 (8.2%) |
| 25 to 29 Minutes | 139 (7.2%) | 123 (7.1%) |
| 30 to 34 Minutes | 213 (11.0%) | 247 (14.3%) |
| 35 to 39 Minutes | 0 (0.0%) | 78 (4.5%) |
| 40 to 44 Minutes | 137 (7.1%) | 111 (6.4%) |
| 45 to 59 Minutes | 294 (15.1%) | 115 (6.7%) |
| 60 to 89 Minutes | 121 (6.2%) | 143 (8.3%) |
| 90 or more Minutes | 122 (6.3%) | 17 (1.0%) |
Time of Departure to Work by Sex in Green County
The most frequent times of departure to work in Green County are 6:00 AM to 6:29 AM (318, 16.4%) for males and 7:30 AM to 7:59 AM (317, 18.4%) for females.
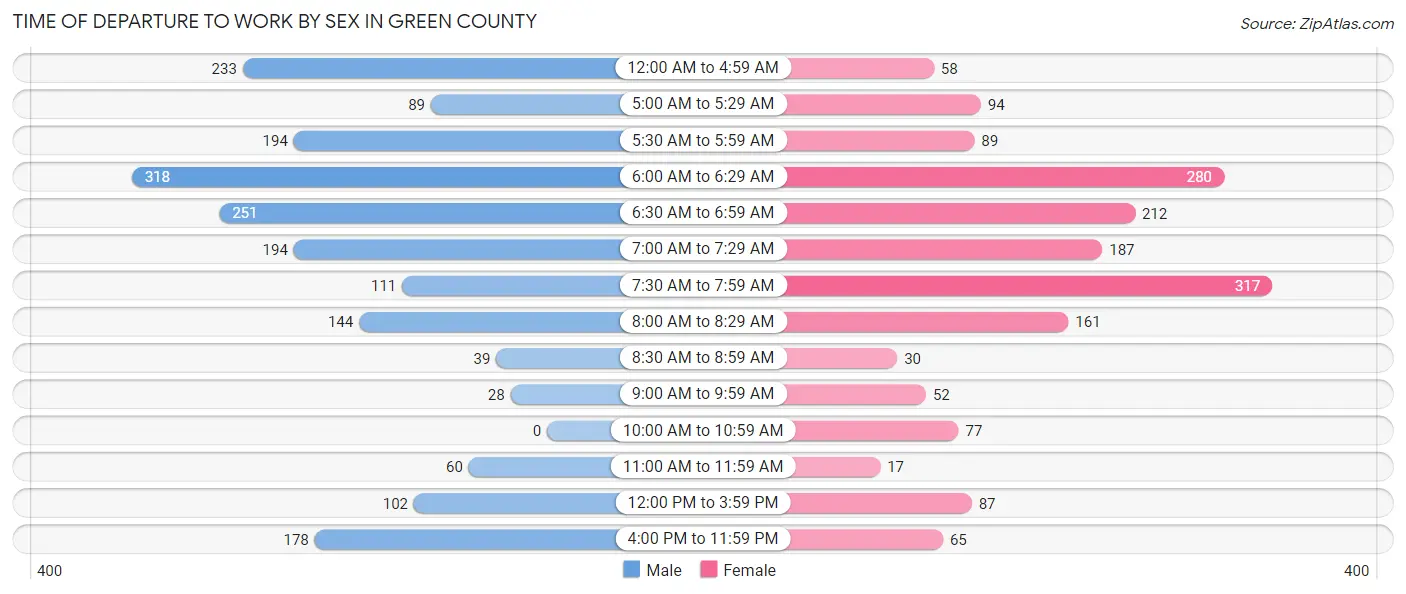
| Time of Departure | Male | Female |
| 12:00 AM to 4:59 AM | 233 (12.0%) | 58 (3.4%) |
| 5:00 AM to 5:29 AM | 89 (4.6%) | 94 (5.4%) |
| 5:30 AM to 5:59 AM | 194 (10.0%) | 89 (5.2%) |
| 6:00 AM to 6:29 AM | 318 (16.4%) | 280 (16.2%) |
| 6:30 AM to 6:59 AM | 251 (12.9%) | 212 (12.3%) |
| 7:00 AM to 7:29 AM | 194 (10.0%) | 187 (10.8%) |
| 7:30 AM to 7:59 AM | 111 (5.7%) | 317 (18.4%) |
| 8:00 AM to 8:29 AM | 144 (7.4%) | 161 (9.3%) |
| 8:30 AM to 8:59 AM | 39 (2.0%) | 30 (1.7%) |
| 9:00 AM to 9:59 AM | 28 (1.4%) | 52 (3.0%) |
| 10:00 AM to 10:59 AM | 0 (0.0%) | 77 (4.5%) |
| 11:00 AM to 11:59 AM | 60 (3.1%) | 17 (1.0%) |
| 12:00 PM to 3:59 PM | 102 (5.3%) | 87 (5.0%) |
| 4:00 PM to 11:59 PM | 178 (9.2%) | 65 (3.8%) |
| Total | 1,941 (100.0%) | 1,726 (100.0%) |
Housing Occupancy in Green County
Occupancy by Ownership in Green County
Of the total 4,399 dwellings in Green County, owner-occupied units account for 3,275 (74.5%), while renter-occupied units make up 1,124 (25.6%).
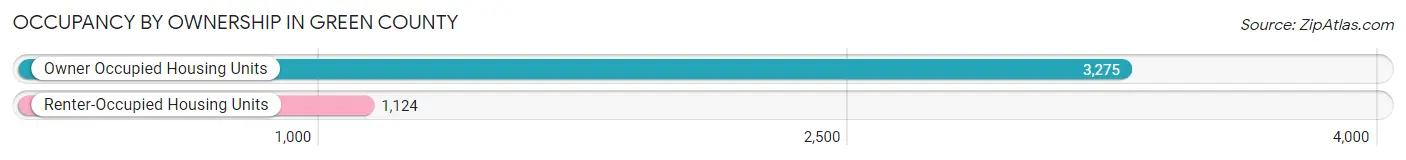
| Occupancy | # Housing Units | % Housing Units |
| Owner Occupied Housing Units | 3,275 | 74.5% |
| Renter-Occupied Housing Units | 1,124 | 25.6% |
| Total Occupied Housing Units | 4,399 | 100.0% |
Occupancy by Household Size in Green County
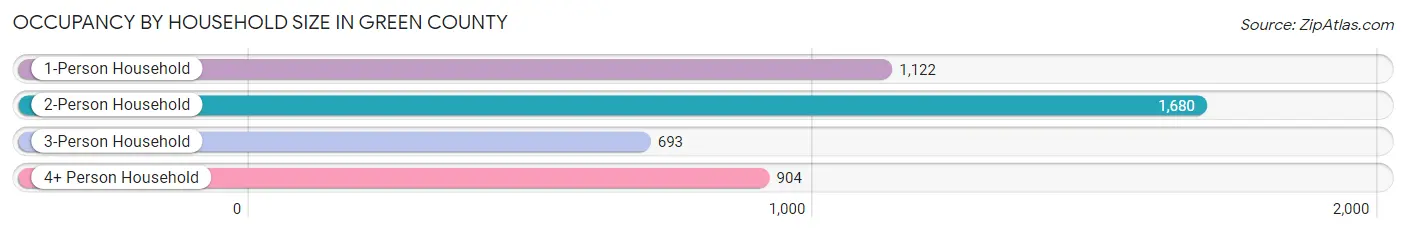
| Household Size | # Housing Units | % Housing Units |
| 1-Person Household | 1,122 | 25.5% |
| 2-Person Household | 1,680 | 38.2% |
| 3-Person Household | 693 | 15.8% |
| 4+ Person Household | 904 | 20.5% |
| Total Housing Units | 4,399 | 100.0% |
Occupancy by Ownership by Household Size in Green County
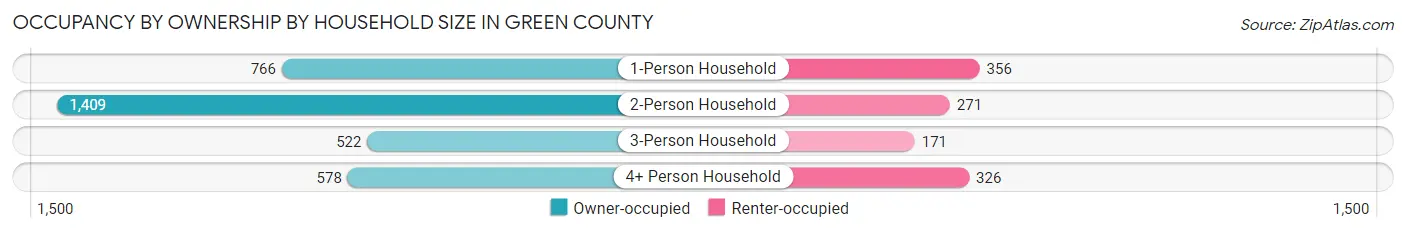
| Household Size | Owner-occupied | Renter-occupied |
| 1-Person Household | 766 (68.3%) | 356 (31.7%) |
| 2-Person Household | 1,409 (83.9%) | 271 (16.1%) |
| 3-Person Household | 522 (75.3%) | 171 (24.7%) |
| 4+ Person Household | 578 (63.9%) | 326 (36.1%) |
| Total Housing Units | 3,275 (74.5%) | 1,124 (25.6%) |
Occupancy by Educational Attainment in Green County
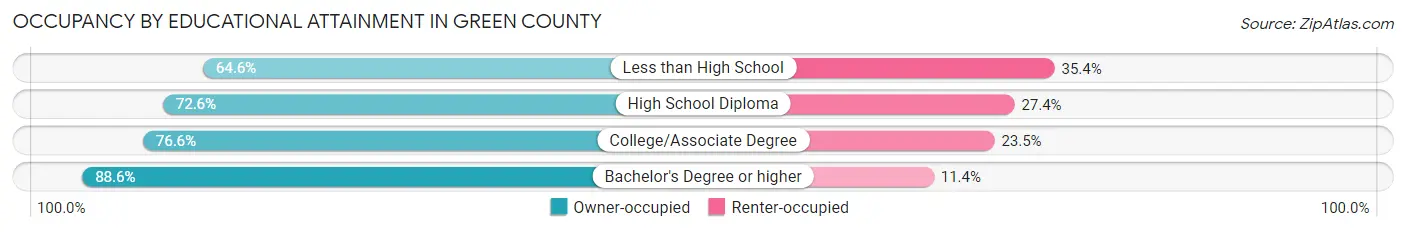
| Household Size | Owner-occupied | Renter-occupied |
| Less than High School | 490 (64.6%) | 268 (35.4%) |
| High School Diploma | 1,329 (72.6%) | 502 (27.4%) |
| College/Associate Degree | 937 (76.5%) | 287 (23.4%) |
| Bachelor's Degree or higher | 519 (88.6%) | 67 (11.4%) |
Occupancy by Age of Householder in Green County
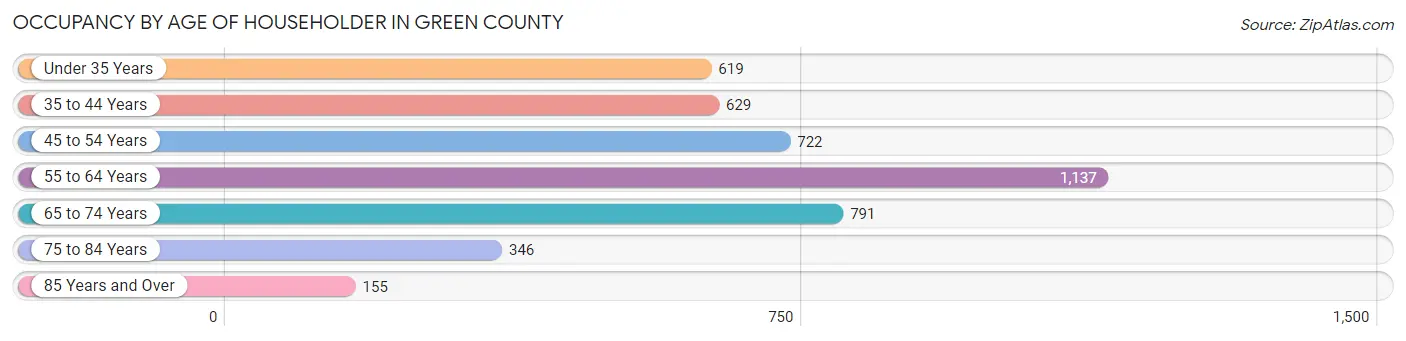
| Age Bracket | # Households | % Households |
| Under 35 Years | 619 | 14.1% |
| 35 to 44 Years | 629 | 14.3% |
| 45 to 54 Years | 722 | 16.4% |
| 55 to 64 Years | 1,137 | 25.9% |
| 65 to 74 Years | 791 | 18.0% |
| 75 to 84 Years | 346 | 7.9% |
| 85 Years and Over | 155 | 3.5% |
| Total | 4,399 | 100.0% |
Housing Finances in Green County
Median Income by Occupancy in Green County
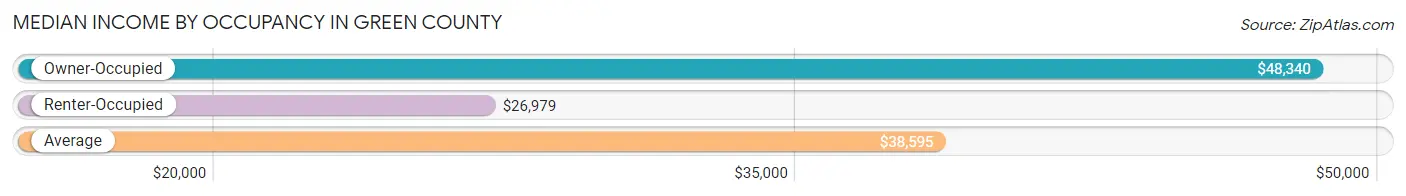
| Occupancy Type | # Households | Median Income |
| Owner-Occupied | 3,275 (74.5%) | $48,340 |
| Renter-Occupied | 1,124 (25.6%) | $26,979 |
| Average | 4,399 (100.0%) | $38,595 |
Occupancy by Householder Income Bracket in Green County
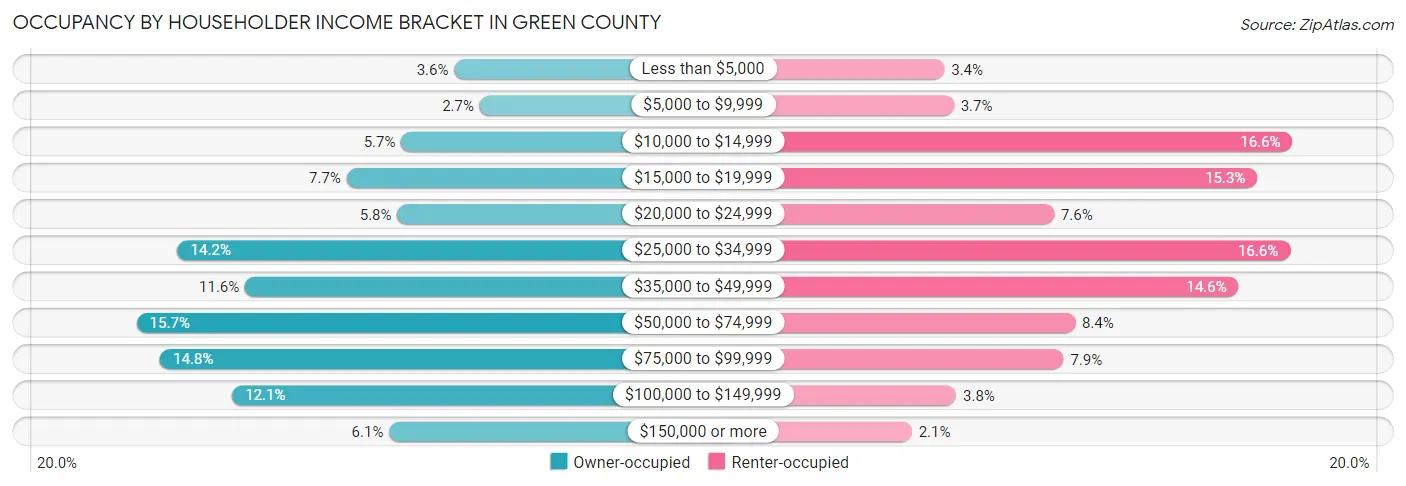
| Income Bracket | Owner-occupied | Renter-occupied |
| Less than $5,000 | 119 (3.6%) | 38 (3.4%) |
| $5,000 to $9,999 | 87 (2.7%) | 42 (3.7%) |
| $10,000 to $14,999 | 185 (5.7%) | 187 (16.6%) |
| $15,000 to $19,999 | 253 (7.7%) | 172 (15.3%) |
| $20,000 to $24,999 | 190 (5.8%) | 85 (7.6%) |
| $25,000 to $34,999 | 464 (14.2%) | 186 (16.6%) |
| $35,000 to $49,999 | 380 (11.6%) | 164 (14.6%) |
| $50,000 to $74,999 | 515 (15.7%) | 94 (8.4%) |
| $75,000 to $99,999 | 486 (14.8%) | 89 (7.9%) |
| $100,000 to $149,999 | 396 (12.1%) | 43 (3.8%) |
| $150,000 or more | 200 (6.1%) | 24 (2.1%) |
| Total | 3,275 (100.0%) | 1,124 (100.0%) |
Monthly Housing Cost Tiers in Green County
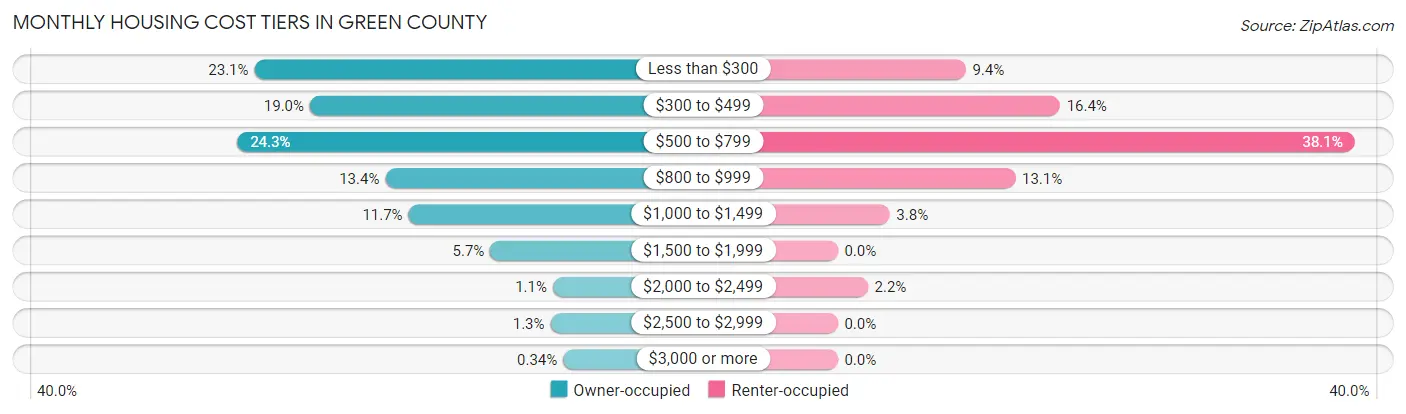
| Monthly Cost | Owner-occupied | Renter-occupied |
| Less than $300 | 756 (23.1%) | 106 (9.4%) |
| $300 to $499 | 622 (19.0%) | 184 (16.4%) |
| $500 to $799 | 797 (24.3%) | 428 (38.1%) |
| $800 to $999 | 440 (13.4%) | 147 (13.1%) |
| $1,000 to $1,499 | 384 (11.7%) | 43 (3.8%) |
| $1,500 to $1,999 | 187 (5.7%) | 0 (0.0%) |
| $2,000 to $2,499 | 36 (1.1%) | 25 (2.2%) |
| $2,500 to $2,999 | 42 (1.3%) | 0 (0.0%) |
| $3,000 or more | 11 (0.3%) | 0 (0.0%) |
| Total | 3,275 (100.0%) | 1,124 (100.0%) |
Physical Housing Characteristics in Green County
Housing Structures in Green County
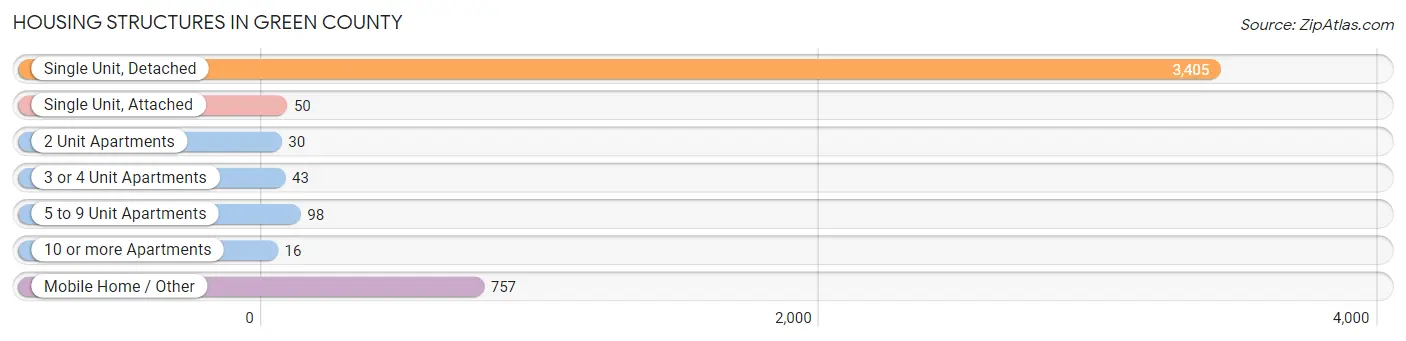
| Structure Type | # Housing Units | % Housing Units |
| Single Unit, Detached | 3,405 | 77.4% |
| Single Unit, Attached | 50 | 1.1% |
| 2 Unit Apartments | 30 | 0.7% |
| 3 or 4 Unit Apartments | 43 | 1.0% |
| 5 to 9 Unit Apartments | 98 | 2.2% |
| 10 or more Apartments | 16 | 0.4% |
| Mobile Home / Other | 757 | 17.2% |
| Total | 4,399 | 100.0% |
Housing Structures by Occupancy in Green County
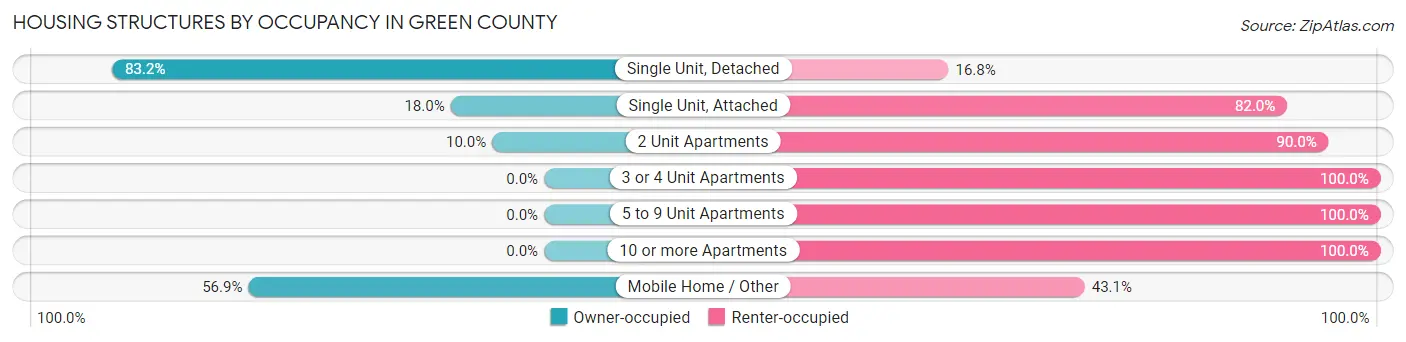
| Structure Type | Owner-occupied | Renter-occupied |
| Single Unit, Detached | 2,832 (83.2%) | 573 (16.8%) |
| Single Unit, Attached | 9 (18.0%) | 41 (82.0%) |
| 2 Unit Apartments | 3 (10.0%) | 27 (90.0%) |
| 3 or 4 Unit Apartments | 0 (0.0%) | 43 (100.0%) |
| 5 to 9 Unit Apartments | 0 (0.0%) | 98 (100.0%) |
| 10 or more Apartments | 0 (0.0%) | 16 (100.0%) |
| Mobile Home / Other | 431 (56.9%) | 326 (43.1%) |
| Total | 3,275 (74.5%) | 1,124 (25.6%) |
Housing Structures by Number of Rooms in Green County
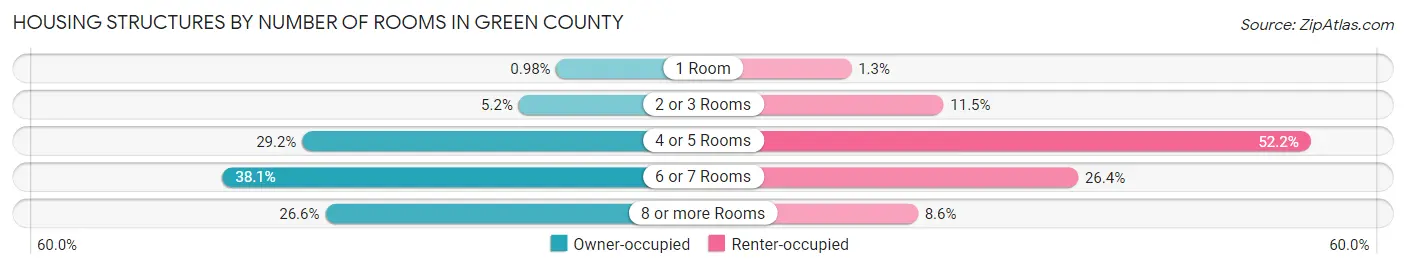
| Number of Rooms | Owner-occupied | Renter-occupied |
| 1 Room | 32 (1.0%) | 14 (1.3%) |
| 2 or 3 Rooms | 169 (5.2%) | 129 (11.5%) |
| 4 or 5 Rooms | 956 (29.2%) | 587 (52.2%) |
| 6 or 7 Rooms | 1,246 (38.1%) | 297 (26.4%) |
| 8 or more Rooms | 872 (26.6%) | 97 (8.6%) |
| Total | 3,275 (100.0%) | 1,124 (100.0%) |
Housing Structure by Heating Type in Green County
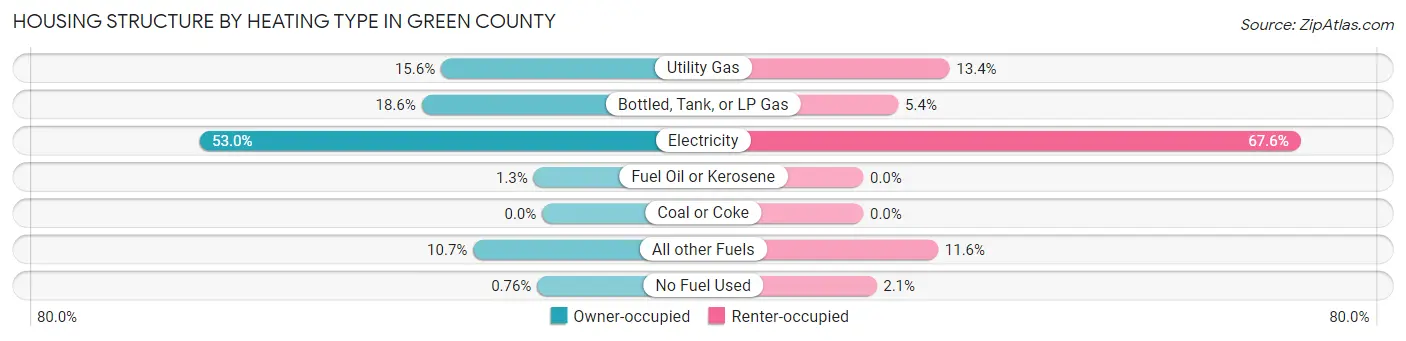
| Heating Type | Owner-occupied | Renter-occupied |
| Utility Gas | 512 (15.6%) | 150 (13.4%) |
| Bottled, Tank, or LP Gas | 610 (18.6%) | 61 (5.4%) |
| Electricity | 1,736 (53.0%) | 760 (67.6%) |
| Fuel Oil or Kerosene | 43 (1.3%) | 0 (0.0%) |
| Coal or Coke | 0 (0.0%) | 0 (0.0%) |
| All other Fuels | 349 (10.7%) | 130 (11.6%) |
| No Fuel Used | 25 (0.8%) | 23 (2.1%) |
| Total | 3,275 (100.0%) | 1,124 (100.0%) |
Household Vehicle Usage in Green County
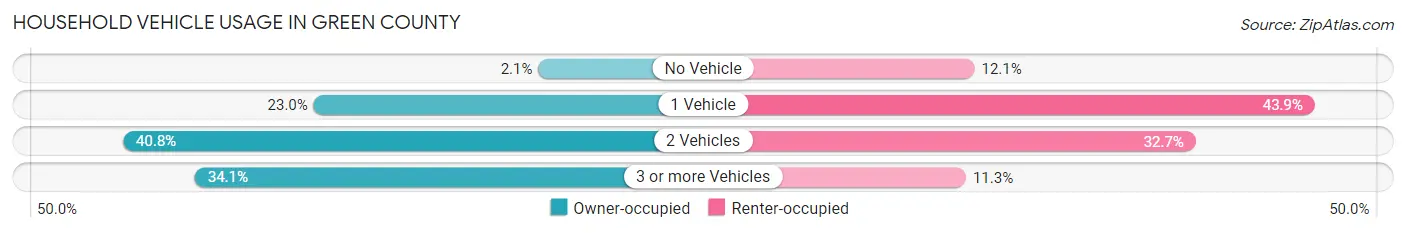
| Vehicles per Household | Owner-occupied | Renter-occupied |
| No Vehicle | 67 (2.1%) | 136 (12.1%) |
| 1 Vehicle | 754 (23.0%) | 493 (43.9%) |
| 2 Vehicles | 1,337 (40.8%) | 368 (32.7%) |
| 3 or more Vehicles | 1,117 (34.1%) | 127 (11.3%) |
| Total | 3,275 (100.0%) | 1,124 (100.0%) |
Real Estate & Mortgages in Green County
Real Estate and Mortgage Overview in Green County
| Characteristic | Without Mortgage | With Mortgage |
| Housing Units | 1,659 | 1,616 |
| Median Property Value | $102,900 | $94,600 |
| Median Household Income | $37,596 | $96 |
| Monthly Housing Costs | $317 | $0 |
| Real Estate Taxes | $560 | $166 |
Property Value by Mortgage Status in Green County
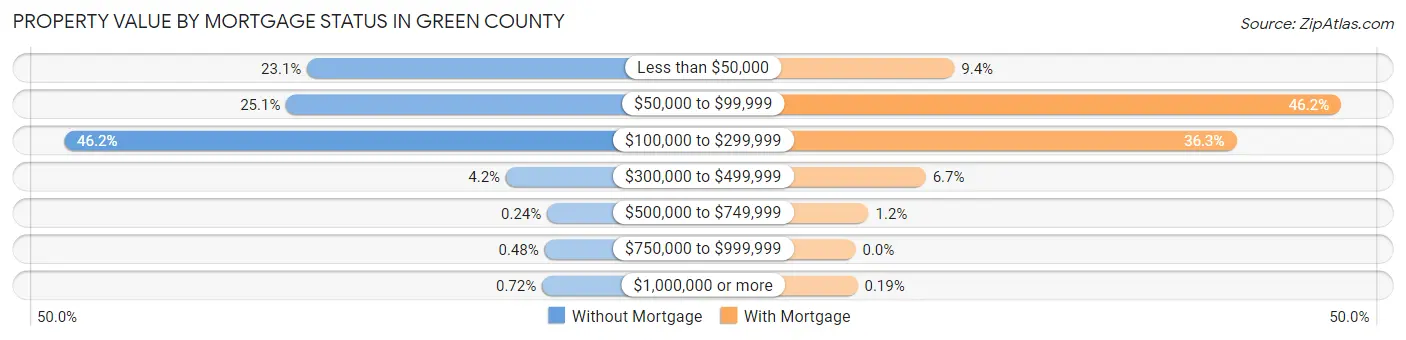
| Property Value | Without Mortgage | With Mortgage |
| Less than $50,000 | 383 (23.1%) | 152 (9.4%) |
| $50,000 to $99,999 | 416 (25.1%) | 747 (46.2%) |
| $100,000 to $299,999 | 767 (46.2%) | 586 (36.3%) |
| $300,000 to $499,999 | 69 (4.2%) | 108 (6.7%) |
| $500,000 to $749,999 | 4 (0.2%) | 20 (1.2%) |
| $750,000 to $999,999 | 8 (0.5%) | 0 (0.0%) |
| $1,000,000 or more | 12 (0.7%) | 3 (0.2%) |
| Total | 1,659 (100.0%) | 1,616 (100.0%) |
Household Income by Mortgage Status in Green County
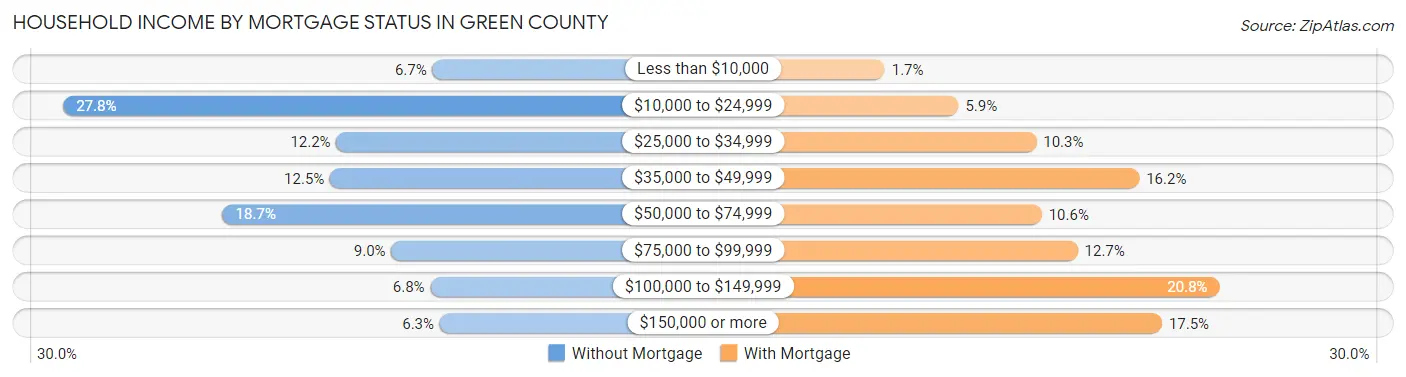
| Household Income | Without Mortgage | With Mortgage |
| Less than $10,000 | 111 (6.7%) | 27 (1.7%) |
| $10,000 to $24,999 | 461 (27.8%) | 95 (5.9%) |
| $25,000 to $34,999 | 202 (12.2%) | 167 (10.3%) |
| $35,000 to $49,999 | 208 (12.5%) | 262 (16.2%) |
| $50,000 to $74,999 | 310 (18.7%) | 172 (10.6%) |
| $75,000 to $99,999 | 150 (9.0%) | 205 (12.7%) |
| $100,000 to $149,999 | 113 (6.8%) | 336 (20.8%) |
| $150,000 or more | 104 (6.3%) | 283 (17.5%) |
| Total | 1,659 (100.0%) | 1,616 (100.0%) |
Property Value to Household Income Ratio in Green County
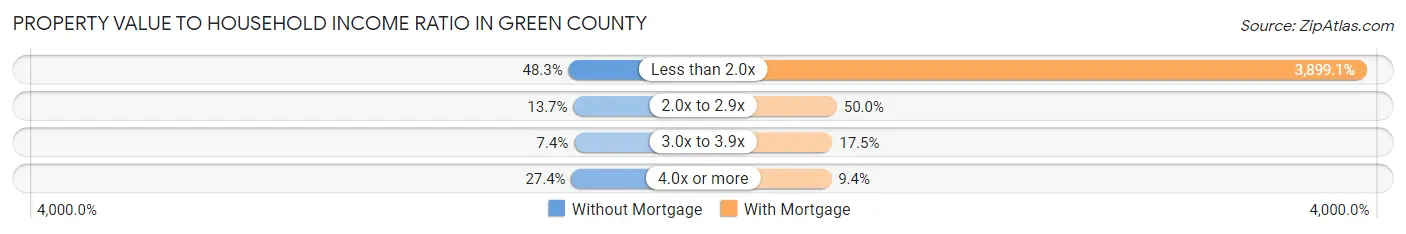
| Value-to-Income Ratio | Without Mortgage | With Mortgage |
| Less than 2.0x | 801 (48.3%) | 63,009 (3,899.1%) |
| 2.0x to 2.9x | 227 (13.7%) | 808 (50.0%) |
| 3.0x to 3.9x | 123 (7.4%) | 282 (17.4%) |
| 4.0x or more | 455 (27.4%) | 152 (9.4%) |
| Total | 1,659 (100.0%) | 1,616 (100.0%) |
Real Estate Taxes by Mortgage Status in Green County
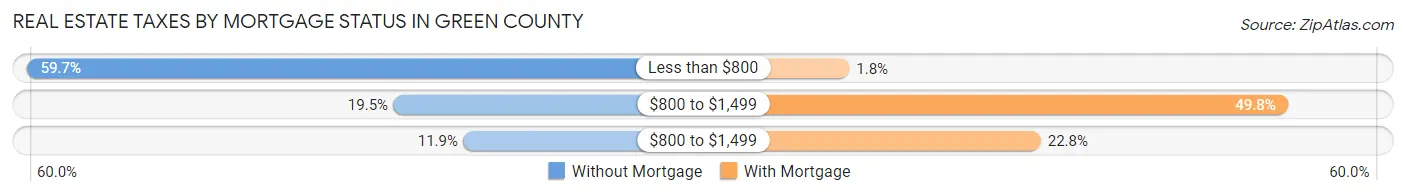
| Property Taxes | Without Mortgage | With Mortgage |
| Less than $800 | 990 (59.7%) | 29 (1.8%) |
| $800 to $1,499 | 324 (19.5%) | 805 (49.8%) |
| $800 to $1,499 | 197 (11.9%) | 368 (22.8%) |
| Total | 1,659 (100.0%) | 1,616 (100.0%) |
Health & Disability in Green County
Health Insurance Coverage by Age in Green County
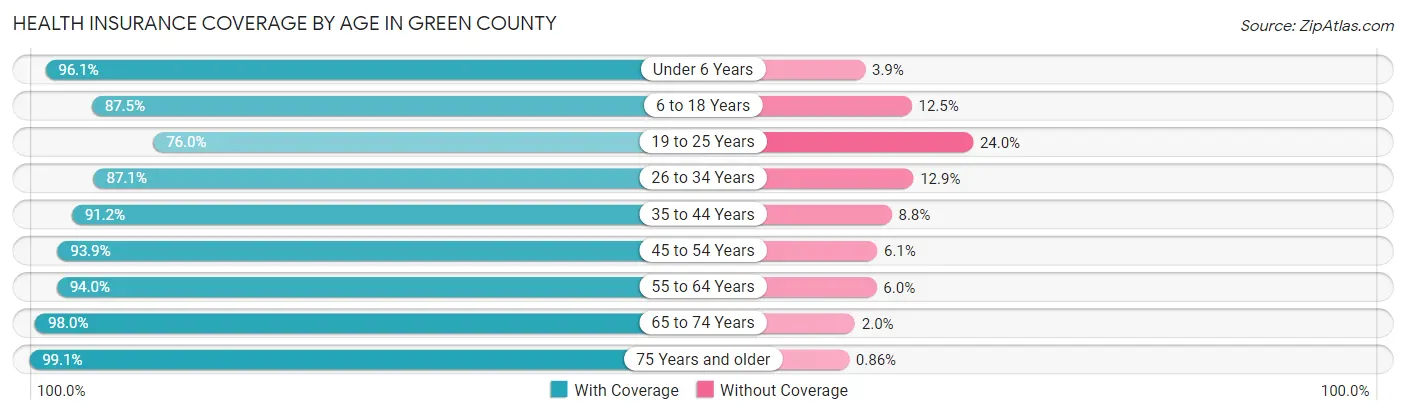
| Age Bracket | With Coverage | Without Coverage |
| Under 6 Years | 745 (96.1%) | 30 (3.9%) |
| 6 to 18 Years | 1,492 (87.5%) | 214 (12.5%) |
| 19 to 25 Years | 583 (76.0%) | 184 (24.0%) |
| 26 to 34 Years | 962 (87.1%) | 142 (12.9%) |
| 35 to 44 Years | 1,118 (91.2%) | 108 (8.8%) |
| 45 to 54 Years | 1,428 (93.9%) | 93 (6.1%) |
| 55 to 64 Years | 1,726 (94.0%) | 110 (6.0%) |
| 65 to 74 Years | 1,295 (98.0%) | 26 (2.0%) |
| 75 Years and older | 805 (99.1%) | 7 (0.9%) |
| Total | 10,154 (91.7%) | 914 (8.3%) |
Health Insurance Coverage by Citizenship Status in Green County
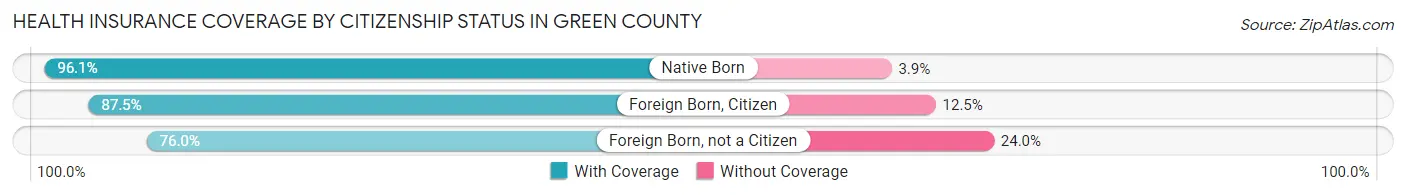
| Citizenship Status | With Coverage | Without Coverage |
| Native Born | 745 (96.1%) | 30 (3.9%) |
| Foreign Born, Citizen | 1,492 (87.5%) | 214 (12.5%) |
| Foreign Born, not a Citizen | 583 (76.0%) | 184 (24.0%) |
Health Insurance Coverage by Household Income in Green County
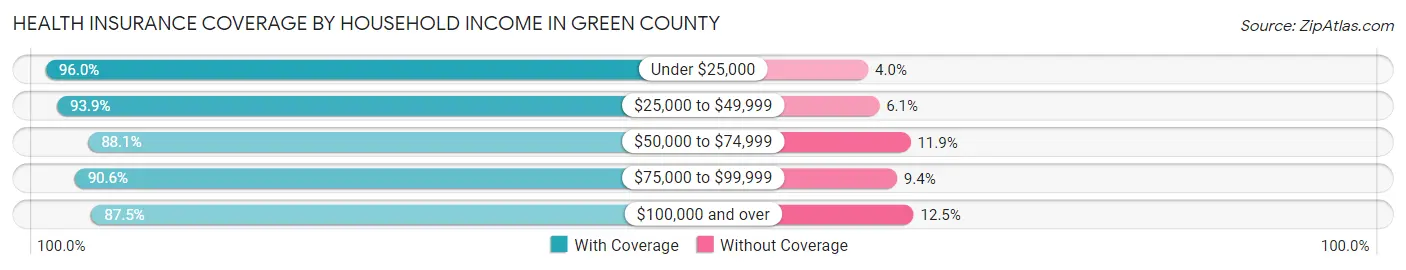
| Household Income | With Coverage | Without Coverage |
| Under $25,000 | 2,331 (96.0%) | 97 (4.0%) |
| $25,000 to $49,999 | 2,953 (93.9%) | 191 (6.1%) |
| $50,000 to $74,999 | 1,565 (88.1%) | 212 (11.9%) |
| $75,000 to $99,999 | 1,466 (90.6%) | 152 (9.4%) |
| $100,000 and over | 1,830 (87.5%) | 262 (12.5%) |
Public vs Private Health Insurance Coverage by Age in Green County
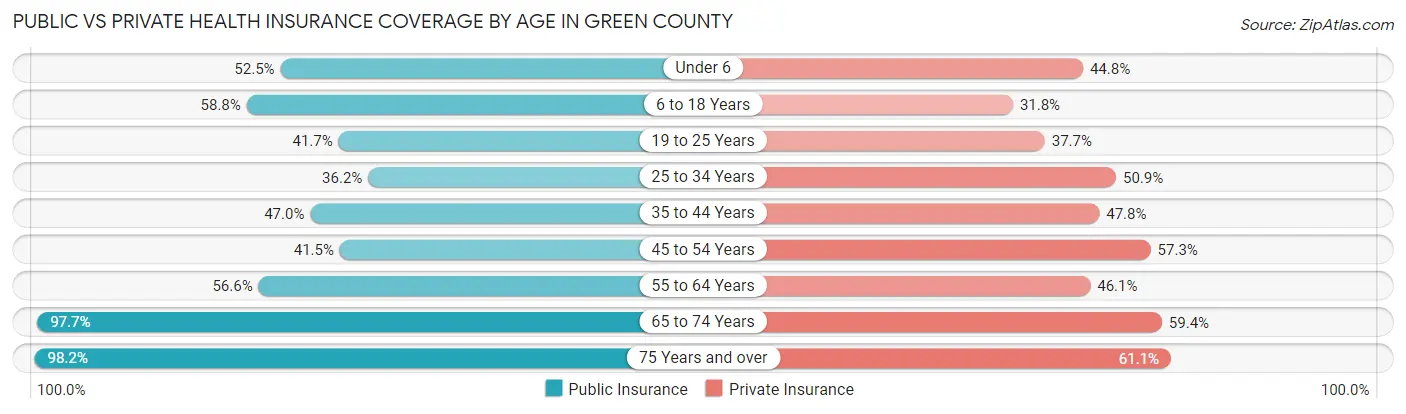
| Age Bracket | Public Insurance | Private Insurance |
| Under 6 | 407 (52.5%) | 347 (44.8%) |
| 6 to 18 Years | 1,003 (58.8%) | 542 (31.8%) |
| 19 to 25 Years | 320 (41.7%) | 289 (37.7%) |
| 25 to 34 Years | 400 (36.2%) | 562 (50.9%) |
| 35 to 44 Years | 576 (47.0%) | 586 (47.8%) |
| 45 to 54 Years | 631 (41.5%) | 872 (57.3%) |
| 55 to 64 Years | 1,039 (56.6%) | 847 (46.1%) |
| 65 to 74 Years | 1,290 (97.7%) | 785 (59.4%) |
| 75 Years and over | 797 (98.2%) | 496 (61.1%) |
| Total | 6,463 (58.4%) | 5,326 (48.1%) |
Disability Status by Sex by Age in Green County
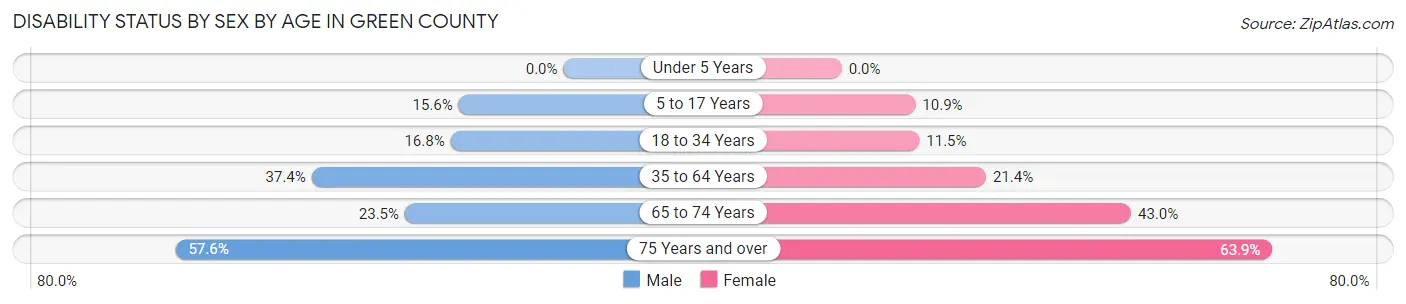
| Age Bracket | Male | Female |
| Under 5 Years | 0 (0.0%) | 0 (0.0%) |
| 5 to 17 Years | 134 (15.6%) | 93 (10.9%) |
| 18 to 34 Years | 173 (16.8%) | 109 (11.5%) |
| 35 to 64 Years | 886 (37.4%) | 474 (21.4%) |
| 65 to 74 Years | 152 (23.5%) | 290 (43.0%) |
| 75 Years and over | 201 (57.6%) | 296 (63.9%) |
Disability Class by Sex by Age in Green County
Disability Class: Hearing Difficulty
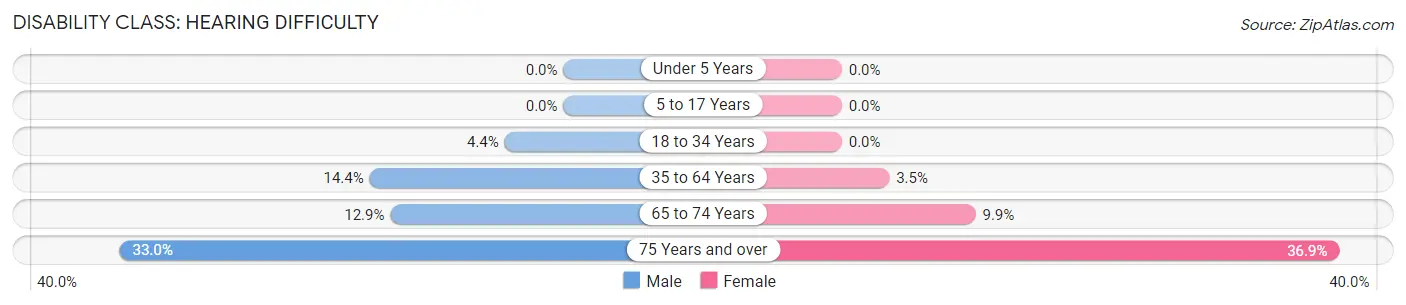
| Age Bracket | Male | Female |
| Under 5 Years | 0 (0.0%) | 0 (0.0%) |
| 5 to 17 Years | 0 (0.0%) | 0 (0.0%) |
| 18 to 34 Years | 45 (4.4%) | 0 (0.0%) |
| 35 to 64 Years | 341 (14.4%) | 78 (3.5%) |
| 65 to 74 Years | 83 (12.9%) | 67 (9.9%) |
| 75 Years and over | 115 (33.0%) | 171 (36.9%) |
Disability Class: Vision Difficulty
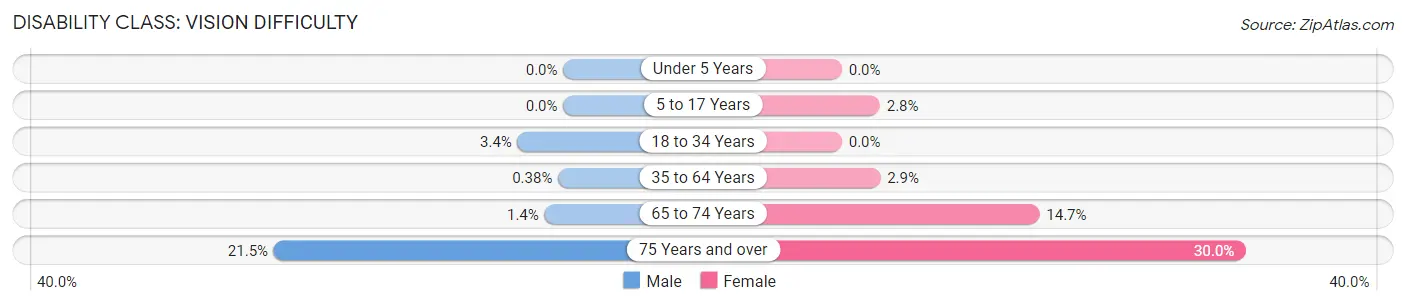
| Age Bracket | Male | Female |
| Under 5 Years | 0 (0.0%) | 0 (0.0%) |
| 5 to 17 Years | 0 (0.0%) | 24 (2.8%) |
| 18 to 34 Years | 35 (3.4%) | 0 (0.0%) |
| 35 to 64 Years | 9 (0.4%) | 63 (2.9%) |
| 65 to 74 Years | 9 (1.4%) | 99 (14.7%) |
| 75 Years and over | 75 (21.5%) | 139 (30.0%) |
Disability Class: Cognitive Difficulty
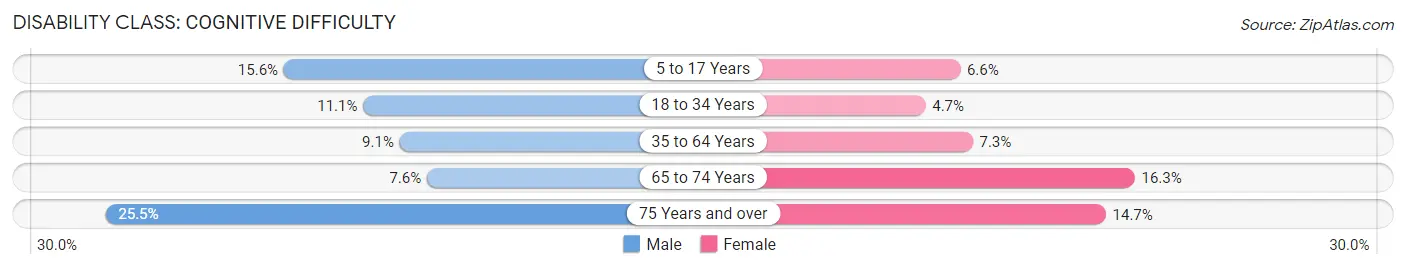
| Age Bracket | Male | Female |
| 5 to 17 Years | 134 (15.6%) | 56 (6.6%) |
| 18 to 34 Years | 115 (11.1%) | 44 (4.6%) |
| 35 to 64 Years | 216 (9.1%) | 161 (7.3%) |
| 65 to 74 Years | 49 (7.6%) | 110 (16.3%) |
| 75 Years and over | 89 (25.5%) | 68 (14.7%) |
Disability Class: Ambulatory Difficulty
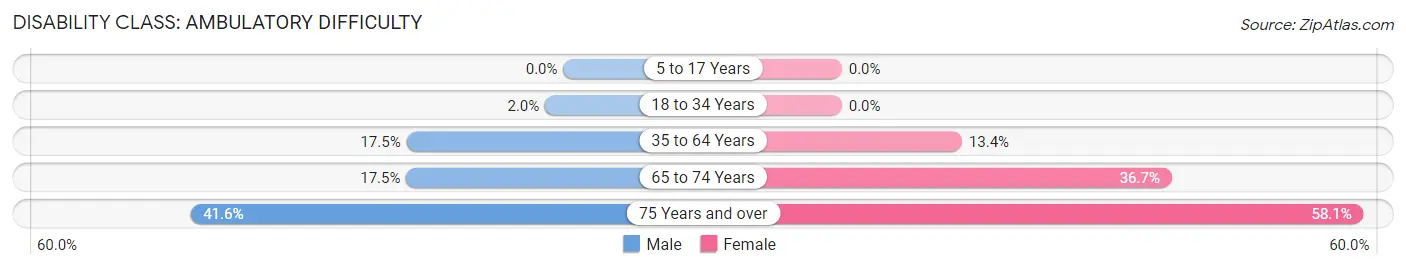
| Age Bracket | Male | Female |
| 5 to 17 Years | 0 (0.0%) | 0 (0.0%) |
| 18 to 34 Years | 21 (2.0%) | 0 (0.0%) |
| 35 to 64 Years | 414 (17.5%) | 296 (13.4%) |
| 65 to 74 Years | 113 (17.5%) | 248 (36.7%) |
| 75 Years and over | 145 (41.5%) | 269 (58.1%) |
Disability Class: Self-Care Difficulty
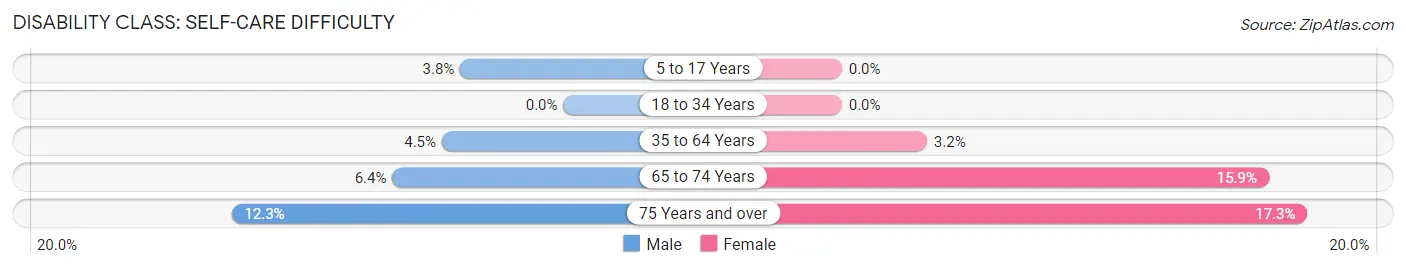
| Age Bracket | Male | Female |
| 5 to 17 Years | 33 (3.8%) | 0 (0.0%) |
| 18 to 34 Years | 0 (0.0%) | 0 (0.0%) |
| 35 to 64 Years | 107 (4.5%) | 70 (3.2%) |
| 65 to 74 Years | 41 (6.4%) | 107 (15.9%) |
| 75 Years and over | 43 (12.3%) | 80 (17.3%) |
Technology Access in Green County
Computing Device Access in Green County
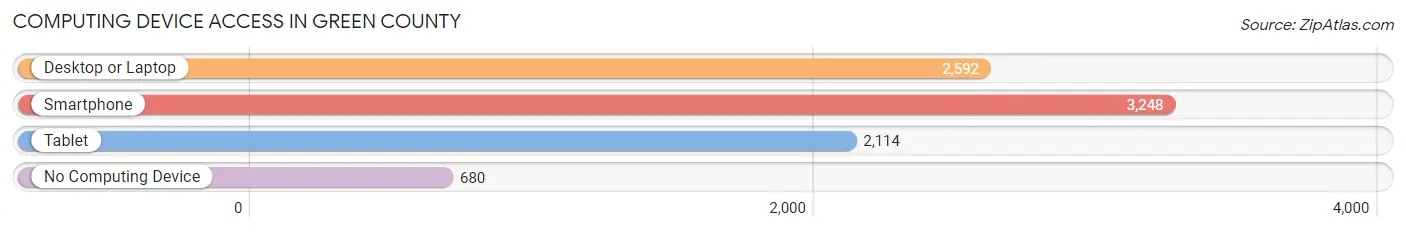
| Device Type | # Households | % Households |
| Desktop or Laptop | 2,592 | 58.9% |
| Smartphone | 3,248 | 73.8% |
| Tablet | 2,114 | 48.1% |
| No Computing Device | 680 | 15.5% |
| Total | 4,399 | 100.0% |
Internet Access in Green County
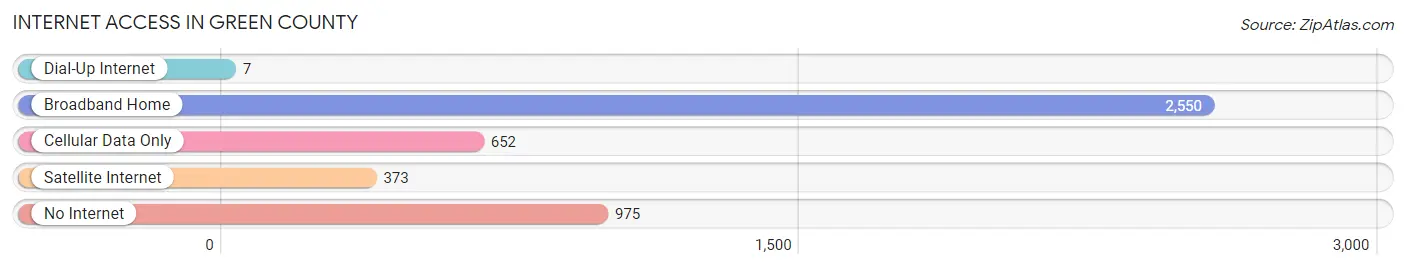
| Internet Type | # Households | % Households |
| Dial-Up Internet | 7 | 0.2% |
| Broadband Home | 2,550 | 58.0% |
| Cellular Data Only | 652 | 14.8% |
| Satellite Internet | 373 | 8.5% |
| No Internet | 975 | 22.2% |
| Total | 4,399 | 100.0% |
Green County Summary
Green County is a county located in the U.S. state of Kentucky. As of the 2010 census, the population was 11,258. The county seat is Greensburg. The county was formed in 1793 and named for Revolutionary War General Nathanael Greene.
Geography
Green County is located in south-central Kentucky, in the Pennyroyal region of the state. It is bordered by Adair County to the north, Taylor County to the east, Metcalfe County to the south, and Barren County to the west. The county has a total area of 441 square miles, of which 439 square miles is land and 2.2 square miles (0.5%) is water.
The county is located in the Western Coal Fields region of the state. The terrain is generally rolling hills, with the highest point being near the center of the county at an elevation of 890 feet above sea level. The county is drained by the Green River, which flows through the county from east to west.
Demographics
As of the 2010 census, there were 11,258 people, 4,541 households, and 3,092 families residing in the county. The population density was 25.6 people per square mile. There were 5,093 housing units at an average density of 11.6 per square mile. The racial makeup of the county was 97.2% White, 0.9% Black or African American, 0.2% Native American, 0.2% Asian, 0.2% from other races, and 1.3% from two or more races. 1.2% of the population were Hispanic or Latino of any race.
There were 4,541 households, out of which 28.2% had children under the age of 18 living with them, 53.2% were married couples living together, 11.2% had a female householder with no husband present, and 31.2% were non-families. 27.2% of all households were made up of individuals, and 12.7% had someone living alone who was 65 years of age or older. The average household size was 2.41 and the average family size was 2.91.
In the county, the population was spread out, with 22.7% under the age of 18, 8.3% from 18 to 24, 27.2% from 25 to 44, 25.3% from 45 to 64, and 16.5% who were 65 years of age or older. The median age was 39 years. For every 100 females there were 95.2 males. For every 100 females age 18 and over, there were 92.2 males.
The median income for a household in the county was $30,845, and the median income for a family was $37,813. Males had a median income of $30,945 versus $20,945 for females. The per capita income for the county was $16,845. About 13.2% of families and 16.7% of the population were below the poverty line, including 22.2% of those under age 18 and 16.2% of those age 65 or over.
Economy
Green County is a rural county with a largely agricultural economy. The county is home to several large farms, as well as smaller family farms. The county is also home to several small businesses, including a few restaurants, convenience stores, and other retail establishments.
The county is also home to several manufacturing companies, including a furniture manufacturer, a plastics manufacturer, and a metal fabrication company. The county is also home to a large coal mine, which is the largest employer in the county.
The county is served by two major highways, US Route 68 and KY Route 61. The county is also served by a small airport, the Green County Airport.
Conclusion
Green County is a rural county located in south-central Kentucky. The county has a population of 11,258 and is home to several large farms, as well as smaller family farms. The county is also home to several small businesses, manufacturing companies, and a large coal mine. The county is served by two major highways and a small airport. The county has a largely agricultural economy, with the largest employer being the coal mine.
Common Questions
What is Per Capita Income in Green County?
Per Capita income in Green County is $24,090.
What is the Median Family Income in Green County?
Median Family Income in Green County is $57,117.
What is the Median Household income in Green County?
Median Household Income in Green County is $38,595.
What is Income or Wage Gap in Green County?
Income or Wage Gap in Green County is 19.1%.
Women in Green County earn 80.9 cents for every dollar earned by a man.
What is Family Income Deficit in Green County?
Family Income Deficit in Green County is $10,475.
Families that are below poverty line in Green County earn $10,475 less on average than the poverty threshold level.
What is Inequality or Gini Index in Green County?
Inequality or Gini Index in Green County is 0.47.
What is the Total Population of Green County?
Total Population of Green County is 11,198.
What is the Total Male Population of Green County?
Total Male Population of Green County is 5,611.
What is the Total Female Population of Green County?
Total Female Population of Green County is 5,587.
What is the Ratio of Males per 100 Females in Green County?
There are 100.43 Males per 100 Females in Green County.
What is the Ratio of Females per 100 Males in Green County?
There are 99.57 Females per 100 Males in Green County.
What is the Median Population Age in Green County?
Median Population Age in Green County is 45.1 Years.
What is the Average Family Size in Green County
Average Family Size in Green County is 3.0 People.
What is the Average Household Size in Green County
Average Household Size in Green County is 2.5 People.
How Large is the Labor Force in Green County?
There are 4,516 People in the Labor Forcein in Green County.
What is the Percentage of People in the Labor Force in Green County?
49.9% of People are in the Labor Force in Green County.
What is the Unemployment Rate in Green County?
Unemployment Rate in Green County is 9.5%.