Grayson County, KY Map & Demographics
Grayson County Map
Grayson County Overview
$25,565
PER CAPITA INCOME
$58,638
AVG FAMILY INCOME
$47,024
AVG HOUSEHOLD INCOME
30.5%
WAGE / INCOME GAP [ % ]
69.5¢/ $1
WAGE / INCOME GAP [ $ ]
$11,539
FAMILY INCOME DEFICIT
0.48
INEQUALITY / GINI INDEX
26,465
TOTAL POPULATION
13,178
MALE POPULATION
13,287
FEMALE POPULATION
99.18
MALES / 100 FEMALES
100.83
FEMALES / 100 MALES
40.0
MEDIAN AGE
3.4
AVG FAMILY SIZE
2.7
AVG HOUSEHOLD SIZE
11,192
LABOR FORCE [ PEOPLE ]
53.4%
PERCENT IN LABOR FORCE
4.8%
UNEMPLOYMENT RATE
Grayson County Area Codes
Income in Grayson County
Income Overview in Grayson County
Per Capita Income in Grayson County is $25,565, while median incomes of families and households are $58,638 and $47,024 respectively.
| Characteristic | Number | Measure |
| Per Capita Income | 26,465 | $25,565 |
| Median Family Income | 6,174 | $58,638 |
| Mean Family Income | 6,174 | $81,330 |
| Median Household Income | 9,705 | $47,024 |
| Mean Household Income | 9,705 | $65,162 |
| Income Deficit | 6,174 | $11,539 |
| Wage / Income Gap (%) | 26,465 | 30.53% |
| Wage / Income Gap ($) | 26,465 | 69.47¢ per $1 |
| Gini / Inequality Index | 26,465 | 0.48 |
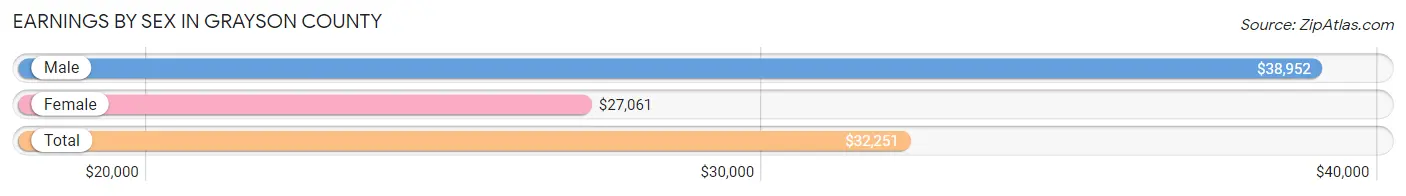
Earnings by Sex in Grayson County
Average Earnings in Grayson County are $32,251, $38,952 for men and $27,061 for women, a difference of 30.5%.
| Sex | Number | Average Earnings |
| Male | 6,258 (52.3%) | $38,952 |
| Female | 5,711 (47.7%) | $27,061 |
| Total | 11,969 (100.0%) | $32,251 |
Earnings by Sex by Income Bracket in Grayson County
The most common earnings brackets in Grayson County are $100,000+ for men (594 | 9.5%) and $30,000 to $34,999 for women (587 | 10.3%).
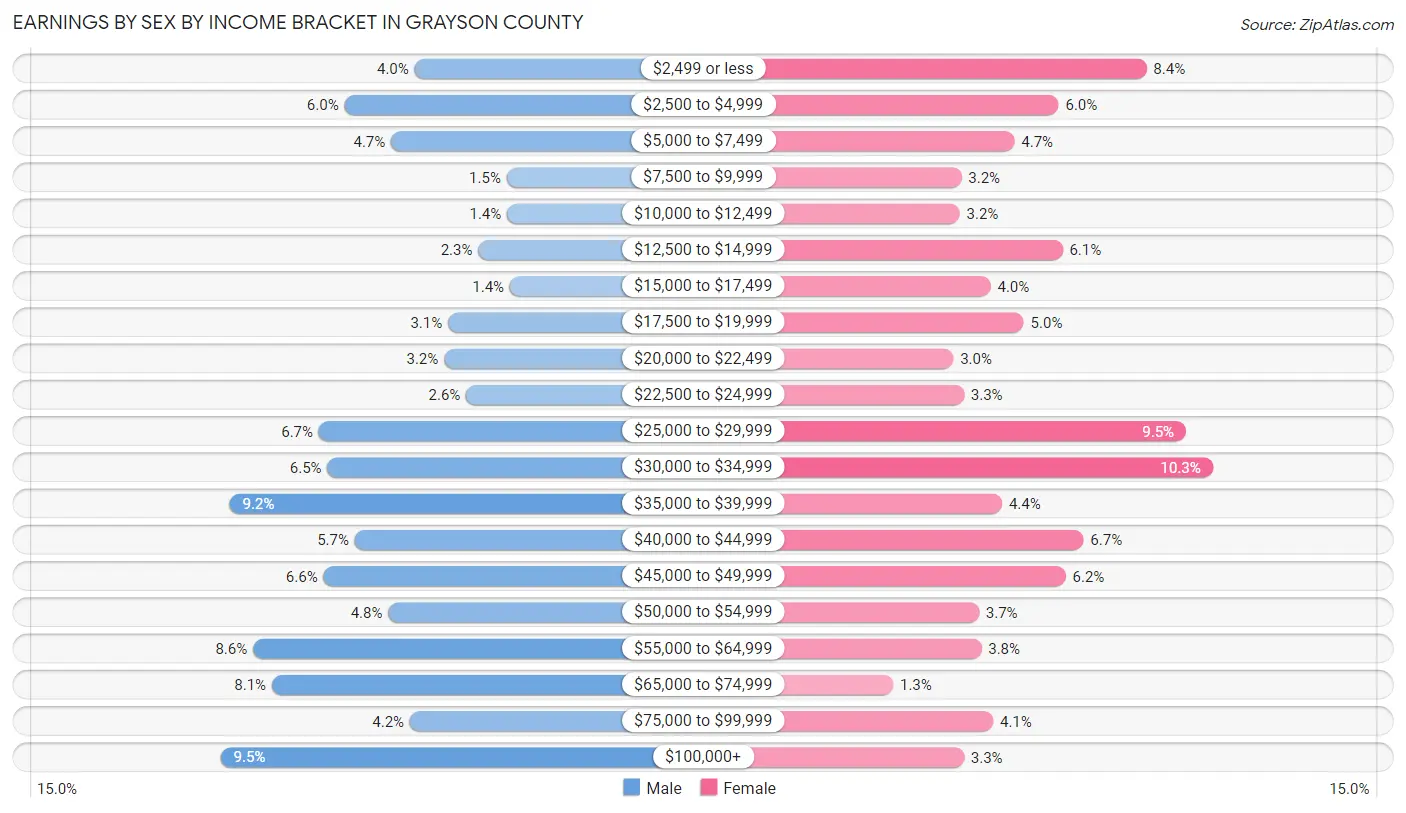
| Income | Male | Female |
| $2,499 or less | 253 (4.0%) | 481 (8.4%) |
| $2,500 to $4,999 | 376 (6.0%) | 340 (5.9%) |
| $5,000 to $7,499 | 294 (4.7%) | 269 (4.7%) |
| $7,500 to $9,999 | 91 (1.5%) | 184 (3.2%) |
| $10,000 to $12,499 | 90 (1.4%) | 181 (3.2%) |
| $12,500 to $14,999 | 141 (2.2%) | 346 (6.1%) |
| $15,000 to $17,499 | 85 (1.4%) | 231 (4.0%) |
| $17,500 to $19,999 | 194 (3.1%) | 284 (5.0%) |
| $20,000 to $22,499 | 201 (3.2%) | 171 (3.0%) |
| $22,500 to $24,999 | 162 (2.6%) | 188 (3.3%) |
| $25,000 to $29,999 | 421 (6.7%) | 544 (9.5%) |
| $30,000 to $34,999 | 406 (6.5%) | 587 (10.3%) |
| $35,000 to $39,999 | 578 (9.2%) | 249 (4.4%) |
| $40,000 to $44,999 | 358 (5.7%) | 380 (6.7%) |
| $45,000 to $49,999 | 413 (6.6%) | 351 (6.1%) |
| $50,000 to $54,999 | 299 (4.8%) | 212 (3.7%) |
| $55,000 to $64,999 | 537 (8.6%) | 216 (3.8%) |
| $65,000 to $74,999 | 504 (8.1%) | 74 (1.3%) |
| $75,000 to $99,999 | 261 (4.2%) | 235 (4.1%) |
| $100,000+ | 594 (9.5%) | 188 (3.3%) |
| Total | 6,258 (100.0%) | 5,711 (100.0%) |
Earnings by Sex by Educational Attainment in Grayson County
Average earnings in Grayson County are $40,647 for men and $30,390 for women, a difference of 25.2%. Men with an educational attainment of bachelor's degree enjoy the highest average annual earnings of $60,033, while those with less than high school education earn the least with $30,318. Women with an educational attainment of graduate degree earn the most with the average annual earnings of $62,143, while those with less than high school education have the smallest earnings of $16,523.
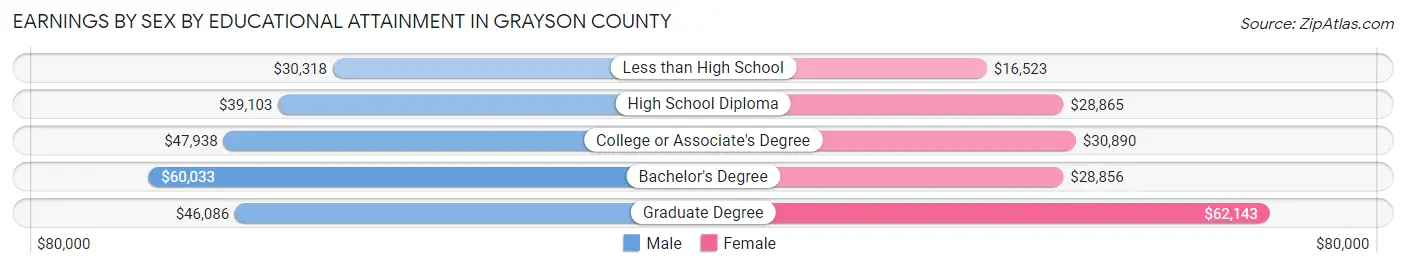
| Educational Attainment | Male Income | Female Income |
| Less than High School | $30,318 | $16,523 |
| High School Diploma | $39,103 | $28,865 |
| College or Associate's Degree | $47,938 | $30,890 |
| Bachelor's Degree | $60,033 | $28,856 |
| Graduate Degree | $46,086 | $62,143 |
| Total | $40,647 | $30,390 |
Family Income in Grayson County
Family Income Brackets in Grayson County
According to the Grayson County family income data, there are 1,179 families falling into the $35,000 to $49,999 income range, which is the most common income bracket and makes up 19.1% of all families. Conversely, the less than $10,000 income bracket is the least frequent group with only 265 families (4.3%) belonging to this category.
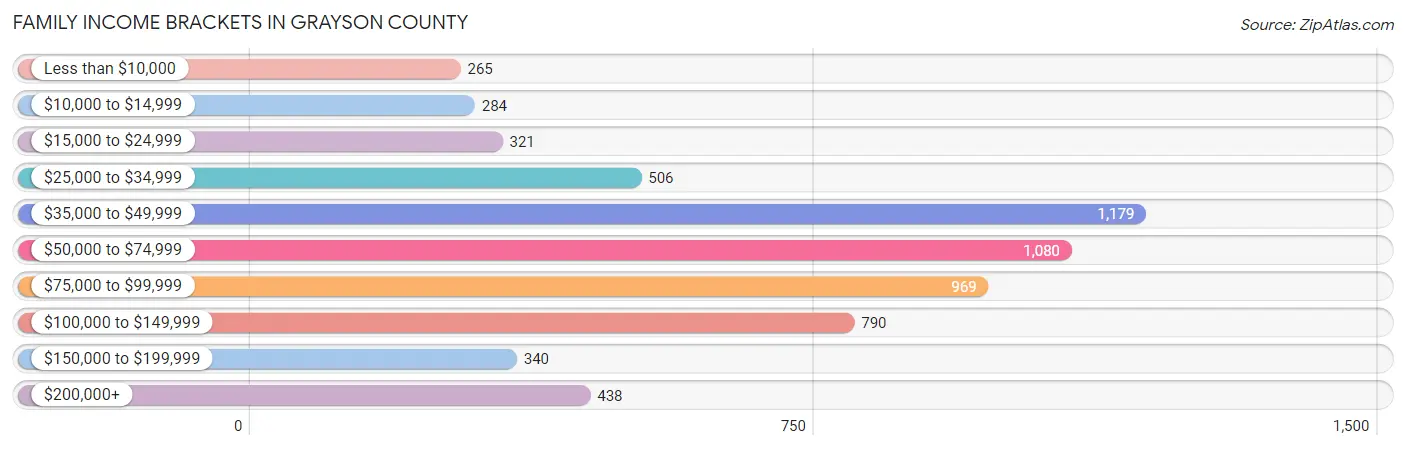
| Income Bracket | # Families | % Families |
| Less than $10,000 | 265 | 4.3% |
| $10,000 to $14,999 | 284 | 4.6% |
| $15,000 to $24,999 | 321 | 5.2% |
| $25,000 to $34,999 | 506 | 8.2% |
| $35,000 to $49,999 | 1,179 | 19.1% |
| $50,000 to $74,999 | 1,080 | 17.5% |
| $75,000 to $99,999 | 969 | 15.7% |
| $100,000 to $149,999 | 790 | 12.8% |
| $150,000 to $199,999 | 340 | 5.5% |
| $200,000+ | 438 | 7.1% |
Family Income by Famaliy Size in Grayson County
4-person families (864 | 14.0%) account for the highest median family income in Grayson County with $93,167 per family, while 2-person families (3,304 | 53.5%) have the highest median income of $25,900 per family member.
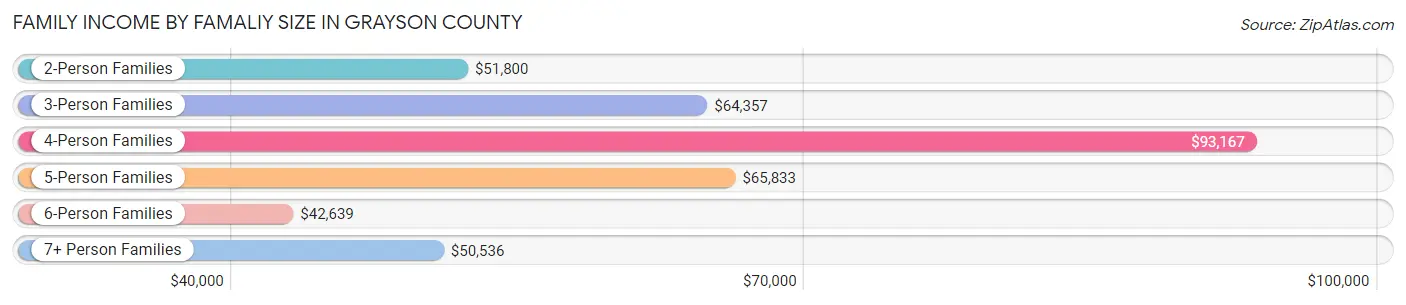
| Income Bracket | # Families | Median Income |
| 2-Person Families | 3,304 (53.5%) | $51,800 |
| 3-Person Families | 1,296 (21.0%) | $64,357 |
| 4-Person Families | 864 (14.0%) | $93,167 |
| 5-Person Families | 502 (8.1%) | $65,833 |
| 6-Person Families | 169 (2.7%) | $42,639 |
| 7+ Person Families | 39 (0.6%) | $50,536 |
| Total | 6,174 (100.0%) | $58,638 |
Family Income by Number of Earners in Grayson County
The median family income in Grayson County is $58,638, with families comprising 3+ earners (598) having the highest median family income of $138,145, while families with no earners (1,291) have the lowest median family income of $32,740, accounting for 9.7% and 20.9% of families, respectively.
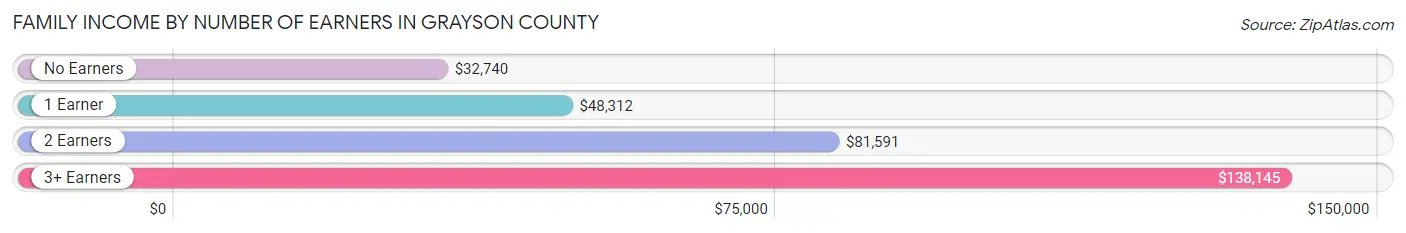
| Number of Earners | # Families | Median Income |
| No Earners | 1,291 (20.9%) | $32,740 |
| 1 Earner | 1,971 (31.9%) | $48,312 |
| 2 Earners | 2,314 (37.5%) | $81,591 |
| 3+ Earners | 598 (9.7%) | $138,145 |
| Total | 6,174 (100.0%) | $58,638 |
Household Income in Grayson County
Household Income Brackets in Grayson County
With 1,708 households falling in the category, the $35,000 to $49,999 income range is the most frequent in Grayson County, accounting for 17.6% of all households. In contrast, only 340 households (3.5%) fall into the $150,000 to $199,999 income bracket, making it the least populous group.
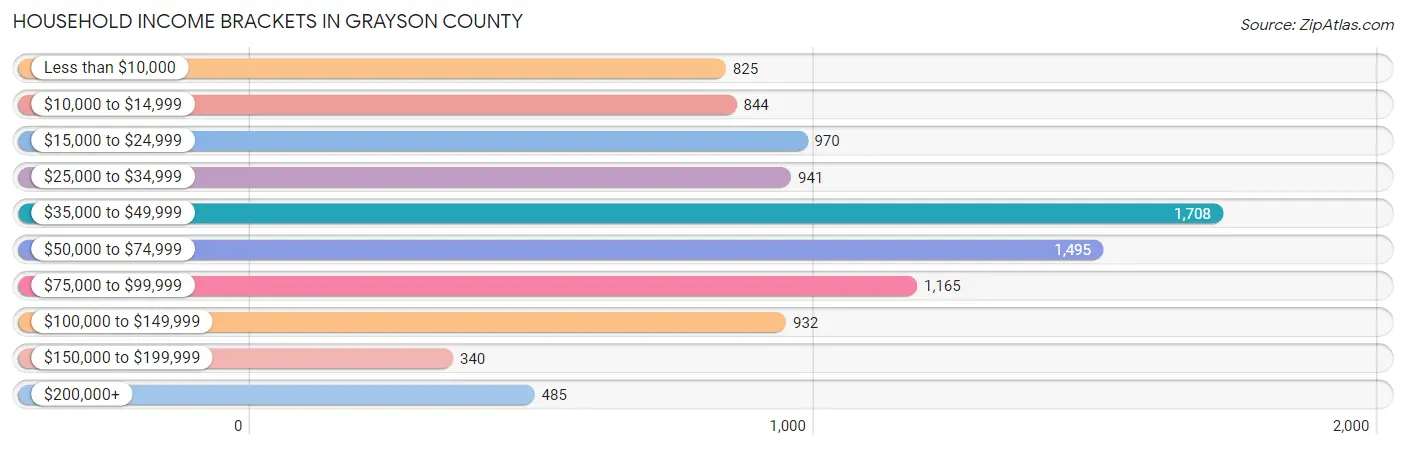
| Income Bracket | # Households | % Households |
| Less than $10,000 | 825 | 8.5% |
| $10,000 to $14,999 | 844 | 8.7% |
| $15,000 to $24,999 | 970 | 10.0% |
| $25,000 to $34,999 | 941 | 9.7% |
| $35,000 to $49,999 | 1,708 | 17.6% |
| $50,000 to $74,999 | 1,495 | 15.4% |
| $75,000 to $99,999 | 1,165 | 12.0% |
| $100,000 to $149,999 | 932 | 9.6% |
| $150,000 to $199,999 | 340 | 3.5% |
| $200,000+ | 485 | 5.0% |
Household Income by Householder Age in Grayson County
The median household income in Grayson County is $47,024, with the highest median household income of $59,323 found in the 25 to 44 years age bracket for the primary householder. A total of 2,463 households (25.4%) fall into this category. Meanwhile, the 65+ years age bracket for the primary householder has the lowest median household income of $29,775, with 3,196 households (32.9%) in this group.
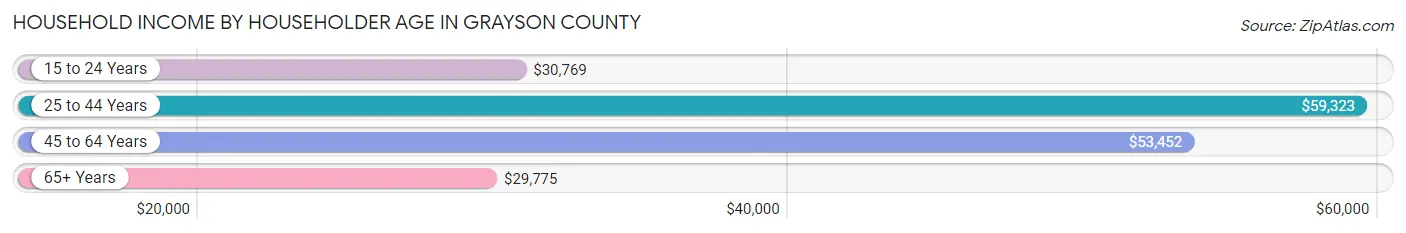
| Income Bracket | # Households | Median Income |
| 15 to 24 Years | 252 (2.6%) | $30,769 |
| 25 to 44 Years | 2,463 (25.4%) | $59,323 |
| 45 to 64 Years | 3,794 (39.1%) | $53,452 |
| 65+ Years | 3,196 (32.9%) | $29,775 |
| Total | 9,705 (100.0%) | $47,024 |
Poverty in Grayson County
Income Below Poverty by Sex and Age in Grayson County
With 17.5% poverty level for males and 24.5% for females among the residents of Grayson County, 6 to 11 year old males and 12 to 14 year old females are the most vulnerable to poverty, with 298 males (29.8%) and 261 females (40.5%) in their respective age groups living below the poverty level.
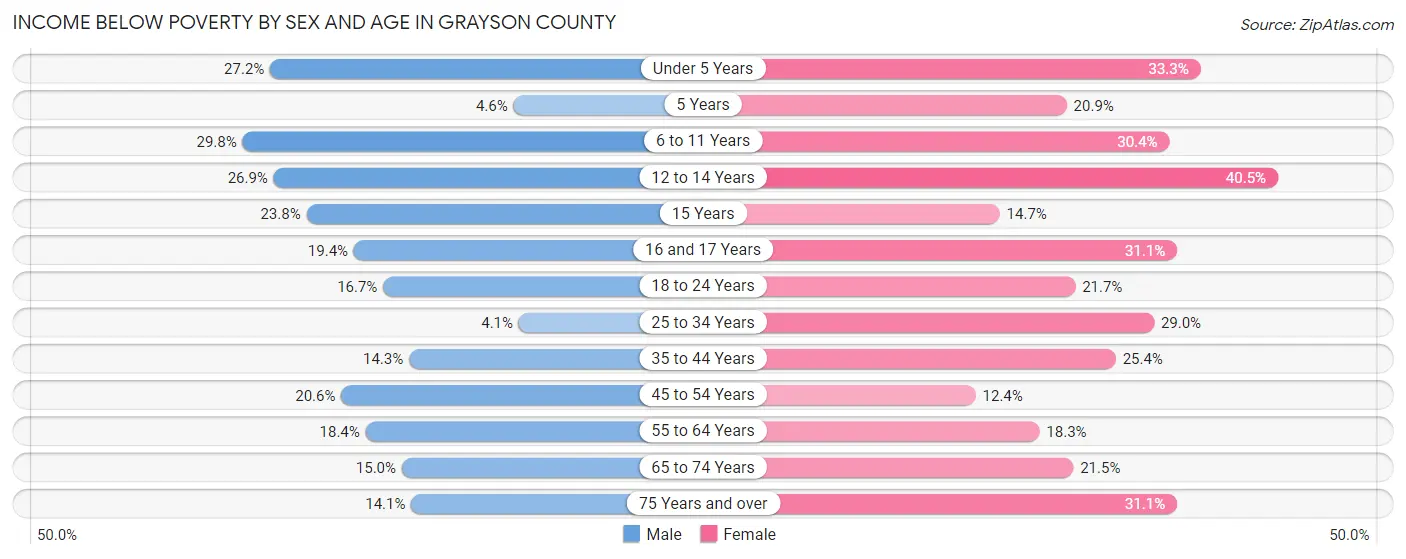
| Age Bracket | Male | Female |
| Under 5 Years | 228 (27.2%) | 281 (33.3%) |
| 5 Years | 6 (4.6%) | 24 (20.9%) |
| 6 to 11 Years | 298 (29.8%) | 287 (30.4%) |
| 12 to 14 Years | 143 (26.9%) | 261 (40.5%) |
| 15 Years | 36 (23.8%) | 29 (14.6%) |
| 16 and 17 Years | 90 (19.4%) | 103 (31.1%) |
| 18 to 24 Years | 168 (16.7%) | 235 (21.7%) |
| 25 to 34 Years | 64 (4.1%) | 458 (29.0%) |
| 35 to 44 Years | 211 (14.3%) | 392 (25.4%) |
| 45 to 54 Years | 340 (20.6%) | 197 (12.4%) |
| 55 to 64 Years | 340 (18.3%) | 334 (18.3%) |
| 65 to 74 Years | 213 (15.0%) | 314 (21.5%) |
| 75 Years and over | 102 (14.1%) | 308 (31.1%) |
| Total | 2,239 (17.5%) | 3,223 (24.5%) |
Income Above Poverty by Sex and Age in Grayson County
According to the poverty statistics in Grayson County, males aged 25 to 34 years and females aged 45 to 54 years are the age groups that are most secure financially, with 95.9% of males and 87.6% of females in these age groups living above the poverty line.
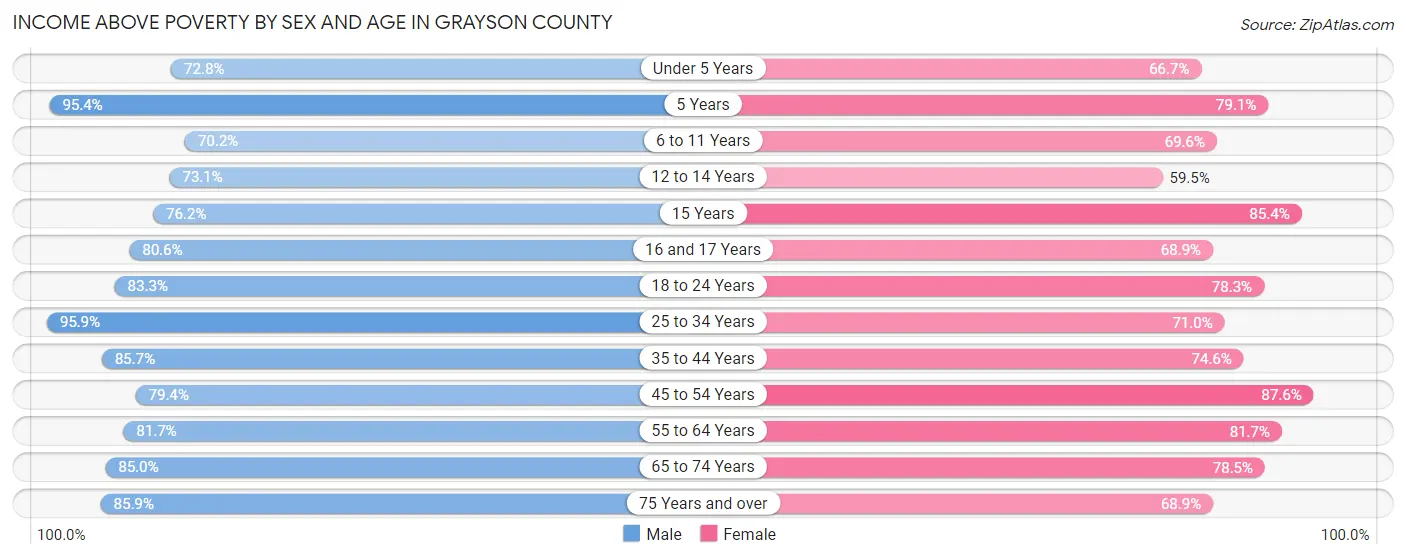
| Age Bracket | Male | Female |
| Under 5 Years | 610 (72.8%) | 563 (66.7%) |
| 5 Years | 124 (95.4%) | 91 (79.1%) |
| 6 to 11 Years | 703 (70.2%) | 657 (69.6%) |
| 12 to 14 Years | 389 (73.1%) | 384 (59.5%) |
| 15 Years | 115 (76.2%) | 169 (85.4%) |
| 16 and 17 Years | 373 (80.6%) | 228 (68.9%) |
| 18 to 24 Years | 837 (83.3%) | 850 (78.3%) |
| 25 to 34 Years | 1,485 (95.9%) | 1,123 (71.0%) |
| 35 to 44 Years | 1,262 (85.7%) | 1,150 (74.6%) |
| 45 to 54 Years | 1,310 (79.4%) | 1,389 (87.6%) |
| 55 to 64 Years | 1,513 (81.7%) | 1,487 (81.7%) |
| 65 to 74 Years | 1,208 (85.0%) | 1,148 (78.5%) |
| 75 Years and over | 621 (85.9%) | 682 (68.9%) |
| Total | 10,550 (82.5%) | 9,921 (75.5%) |
Income Below Poverty Among Married-Couple Families in Grayson County
The poverty statistics for married-couple families in Grayson County show that 9.5% or 438 of the total 4,612 families live below the poverty line. Families with 3 or 4 children have the highest poverty rate of 39.5%, comprising of 158 families. On the other hand, families with 5 or more children have the lowest poverty rate of 0.0%, which includes 0 families.
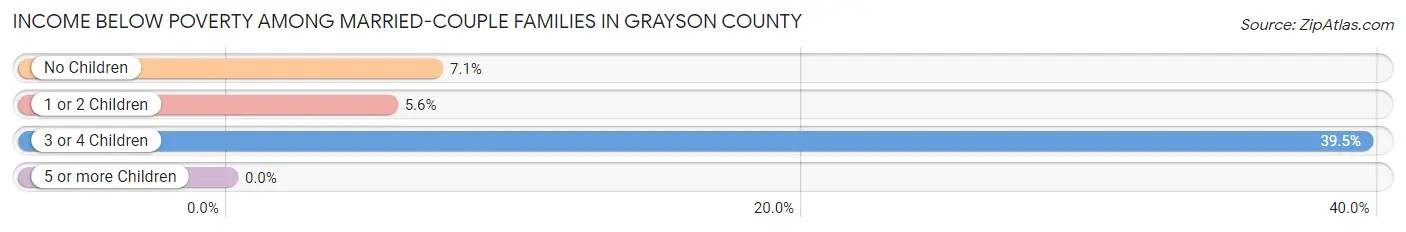
| Children | Above Poverty | Below Poverty |
| No Children | 2,743 (92.9%) | 211 (7.1%) |
| 1 or 2 Children | 1,171 (94.4%) | 69 (5.6%) |
| 3 or 4 Children | 242 (60.5%) | 158 (39.5%) |
| 5 or more Children | 18 (100.0%) | 0 (0.0%) |
| Total | 4,174 (90.5%) | 438 (9.5%) |
Income Below Poverty Among Single-Parent Households in Grayson County
According to the poverty data in Grayson County, 8.7% or 51 single-father households and 39.8% or 388 single-mother households are living below the poverty line. Among single-father households, those with no children have the highest poverty rate, with 37 households (12.1%) experiencing poverty. Likewise, among single-mother households, those with 3 or 4 children have the highest poverty rate, with 48 households (55.8%) falling below the poverty line.
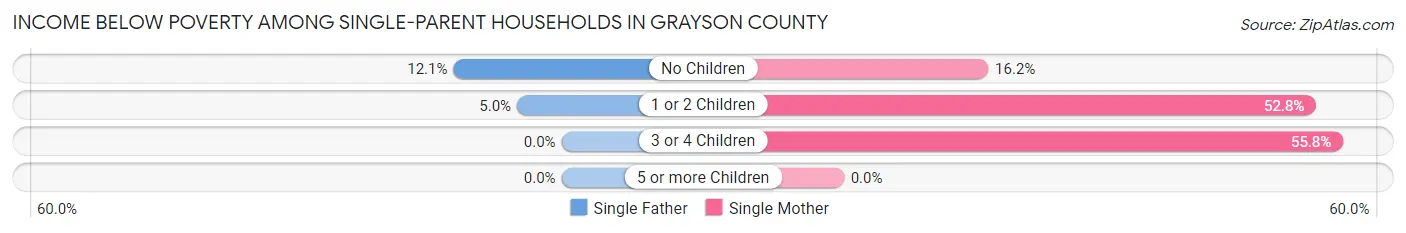
| Children | Single Father | Single Mother |
| No Children | 37 (12.1%) | 57 (16.2%) |
| 1 or 2 Children | 14 (5.0%) | 283 (52.8%) |
| 3 or 4 Children | 0 (0.0%) | 48 (55.8%) |
| 5 or more Children | 0 (0.0%) | 0 (0.0%) |
| Total | 51 (8.7%) | 388 (39.8%) |
Income Below Poverty Among Married-Couple vs Single-Parent Households in Grayson County
The poverty data for Grayson County shows that 438 of the married-couple family households (9.5%) and 439 of the single-parent households (28.1%) are living below the poverty level. Within the married-couple family households, those with 3 or 4 children have the highest poverty rate, with 158 households (39.5%) falling below the poverty line. Among the single-parent households, those with 3 or 4 children have the highest poverty rate, with 48 household (55.8%) living below poverty.
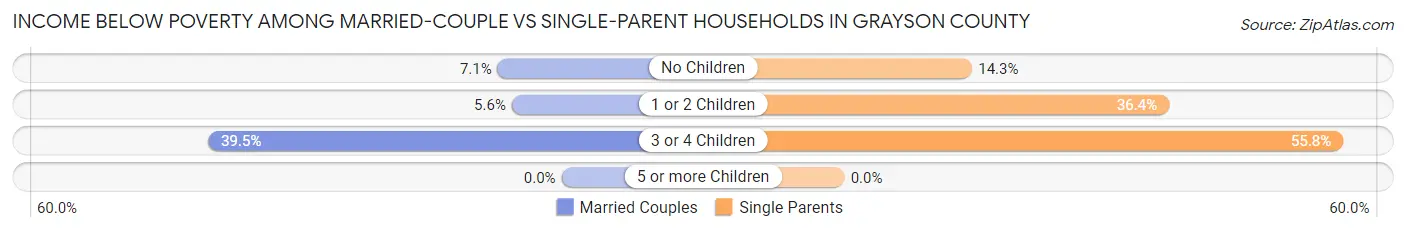
| Children | Married-Couple Families | Single-Parent Households |
| No Children | 211 (7.1%) | 94 (14.3%) |
| 1 or 2 Children | 69 (5.6%) | 297 (36.3%) |
| 3 or 4 Children | 158 (39.5%) | 48 (55.8%) |
| 5 or more Children | 0 (0.0%) | 0 (0.0%) |
| Total | 438 (9.5%) | 439 (28.1%) |
Race in Grayson County
The most populous races in Grayson County are White / Caucasian (25,305 | 95.6%), Two or more Races (658 | 2.5%), and Hispanic or Latino (394 | 1.5%).
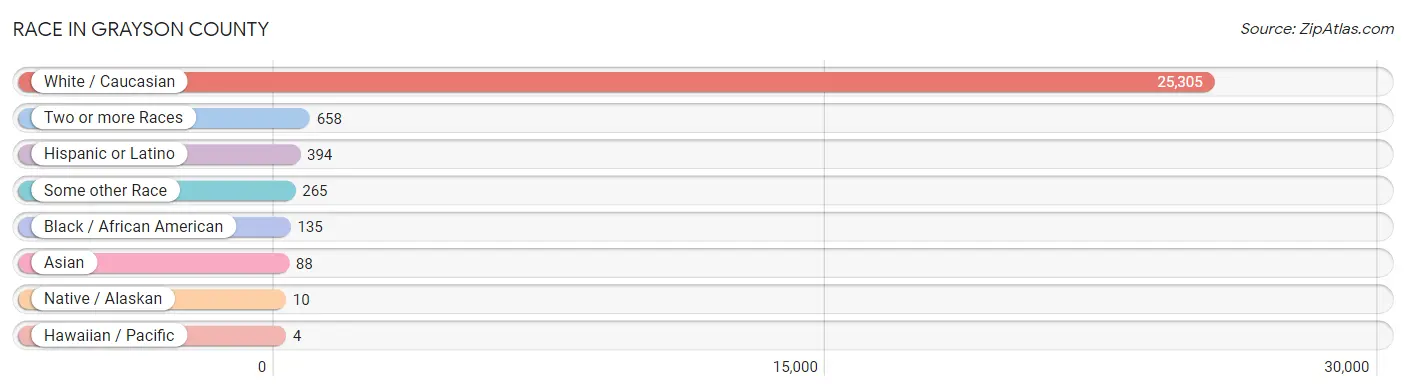
| Race | # Population | % Population |
| Asian | 88 | 0.3% |
| Black / African American | 135 | 0.5% |
| Hawaiian / Pacific | 4 | 0.0% |
| Hispanic or Latino | 394 | 1.5% |
| Native / Alaskan | 10 | 0.0% |
| White / Caucasian | 25,305 | 95.6% |
| Two or more Races | 658 | 2.5% |
| Some other Race | 265 | 1.0% |
| Total | 26,465 | 100.0% |
Ancestry in Grayson County
The most populous ancestries reported in Grayson County are American (4,036 | 15.2%), English (3,284 | 12.4%), German (2,544 | 9.6%), Irish (2,535 | 9.6%), and Scottish (611 | 2.3%), together accounting for 49.2% of all Grayson County residents.
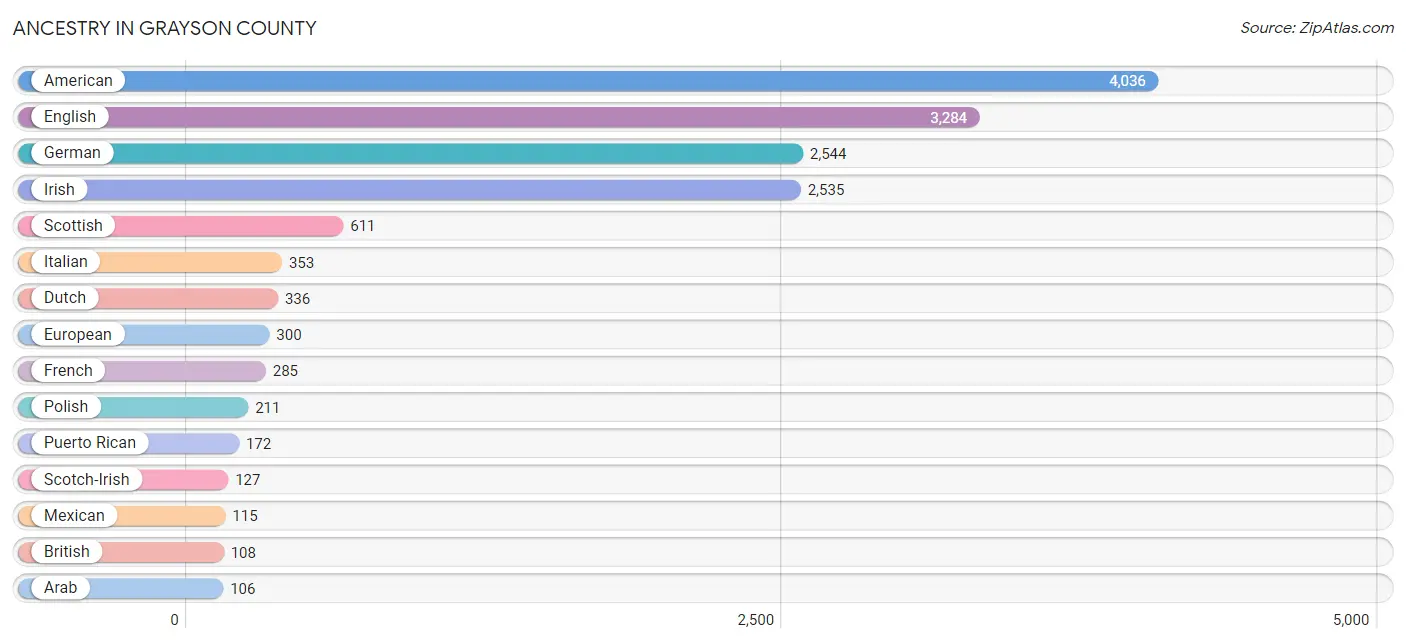
| Ancestry | # Population | % Population |
| American | 4,036 | 15.2% |
| Arab | 106 | 0.4% |
| Armenian | 41 | 0.2% |
| Belgian | 42 | 0.2% |
| Bhutanese | 1 | 0.0% |
| Blackfeet | 33 | 0.1% |
| British | 108 | 0.4% |
| Burmese | 14 | 0.1% |
| Cajun | 6 | 0.0% |
| Central American | 68 | 0.3% |
| Central American Indian | 34 | 0.1% |
| Cherokee | 96 | 0.4% |
| Chickasaw | 3 | 0.0% |
| Crow | 8 | 0.0% |
| Czech | 46 | 0.2% |
| Danish | 8 | 0.0% |
| Dutch | 336 | 1.3% |
| Eastern European | 10 | 0.0% |
| English | 3,284 | 12.4% |
| European | 300 | 1.1% |
| Finnish | 3 | 0.0% |
| French | 285 | 1.1% |
| French Canadian | 22 | 0.1% |
| German | 2,544 | 9.6% |
| Greek | 23 | 0.1% |
| Guatemalan | 55 | 0.2% |
| Honduran | 13 | 0.1% |
| Hungarian | 3 | 0.0% |
| Irish | 2,535 | 9.6% |
| Italian | 353 | 1.3% |
| Jamaican | 44 | 0.2% |
| Korean | 23 | 0.1% |
| Mexican | 115 | 0.4% |
| Mexican American Indian | 3 | 0.0% |
| Navajo | 1 | 0.0% |
| Northern European | 16 | 0.1% |
| Norwegian | 17 | 0.1% |
| Palestinian | 37 | 0.1% |
| Polish | 211 | 0.8% |
| Portuguese | 15 | 0.1% |
| Puerto Rican | 172 | 0.6% |
| Russian | 13 | 0.1% |
| Scandinavian | 62 | 0.2% |
| Scotch-Irish | 127 | 0.5% |
| Scottish | 611 | 2.3% |
| Serbian | 66 | 0.3% |
| Slovak | 8 | 0.0% |
| Swedish | 27 | 0.1% |
| Swiss | 19 | 0.1% |
| Syrian | 69 | 0.3% |
| Ukrainian | 2 | 0.0% |
| Welsh | 62 | 0.2% |
| Yaqui | 4 | 0.0% | View All 53 Rows |
Immigrants in Grayson County
The most numerous immigrant groups reported in Grayson County came from Europe (98 | 0.4%), Latin America (70 | 0.3%), Eastern Europe (66 | 0.3%), Serbia (66 | 0.3%), and Caribbean (51 | 0.2%), together accounting for 1.3% of all Grayson County residents.
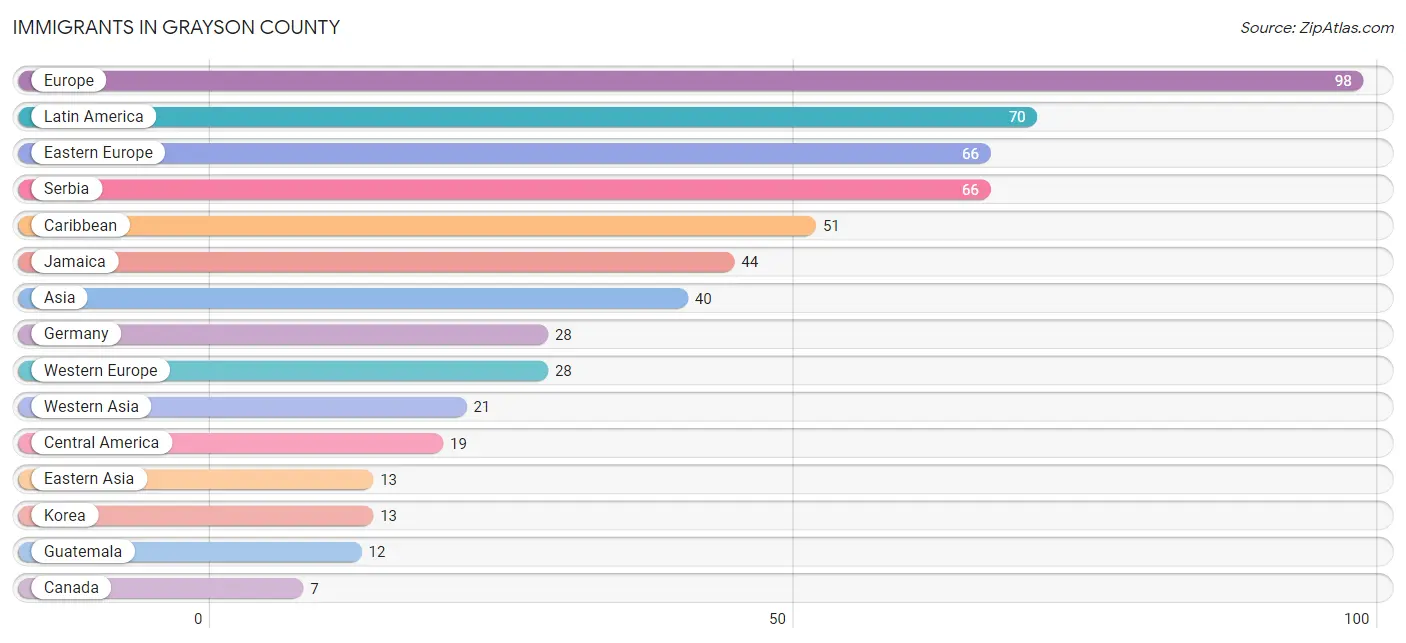
| Immigration Origin | # Population | % Population |
| Asia | 40 | 0.2% |
| Canada | 7 | 0.0% |
| Caribbean | 51 | 0.2% |
| Central America | 19 | 0.1% |
| Eastern Asia | 13 | 0.1% |
| Eastern Europe | 66 | 0.3% |
| El Salvador | 7 | 0.0% |
| Europe | 98 | 0.4% |
| Germany | 28 | 0.1% |
| Guatemala | 12 | 0.1% |
| Haiti | 7 | 0.0% |
| Ireland | 4 | 0.0% |
| Jamaica | 44 | 0.2% |
| Korea | 13 | 0.1% |
| Latin America | 70 | 0.3% |
| Northern Europe | 4 | 0.0% |
| Philippines | 4 | 0.0% |
| Serbia | 66 | 0.3% |
| South Central Asia | 2 | 0.0% |
| South Eastern Asia | 4 | 0.0% |
| Sri Lanka | 2 | 0.0% |
| Western Asia | 21 | 0.1% |
| Western Europe | 28 | 0.1% | View All 23 Rows |
Sex and Age in Grayson County
Sex and Age in Grayson County
The most populous age groups in Grayson County are 60 to 64 Years (1,110 | 8.4%) for men and 10 to 14 Years (1,040 | 7.8%) for women.
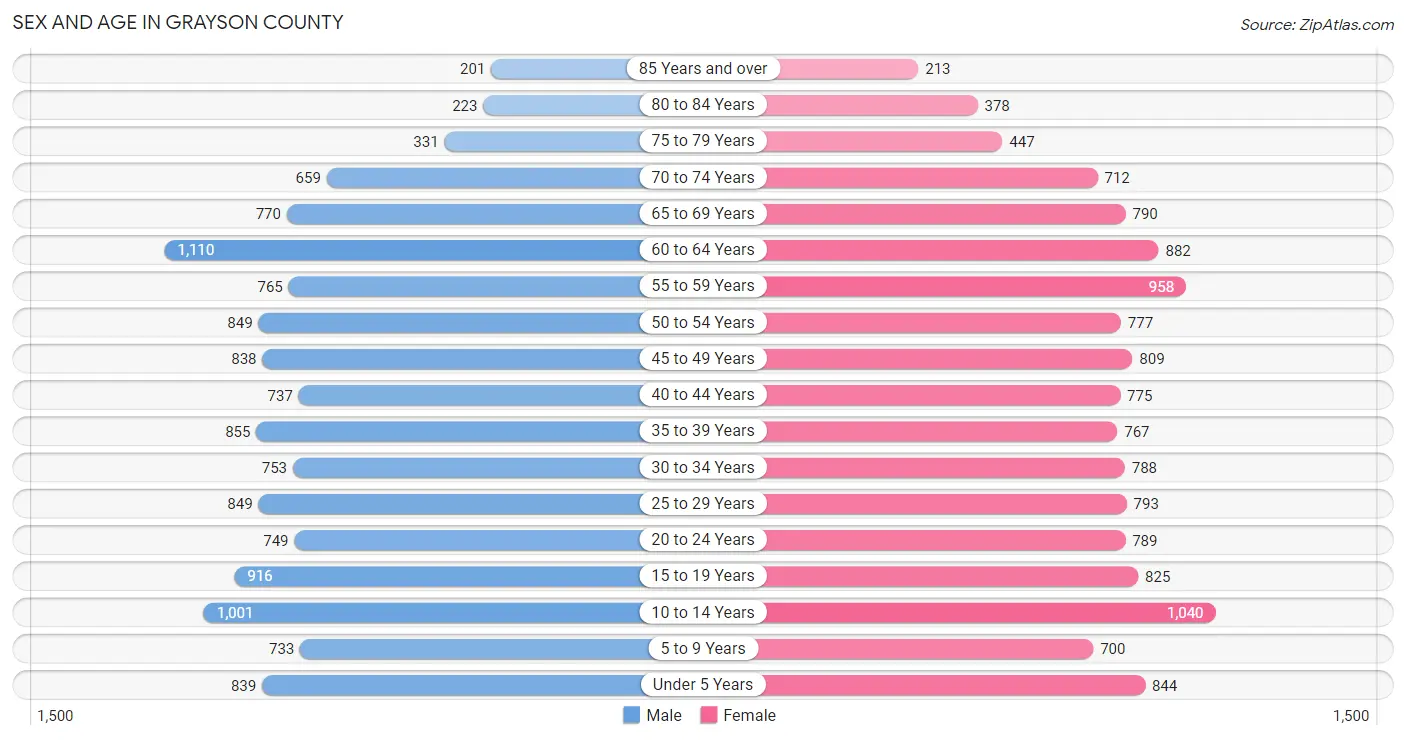
| Age Bracket | Male | Female |
| Under 5 Years | 839 (6.4%) | 844 (6.4%) |
| 5 to 9 Years | 733 (5.6%) | 700 (5.3%) |
| 10 to 14 Years | 1,001 (7.6%) | 1,040 (7.8%) |
| 15 to 19 Years | 916 (7.0%) | 825 (6.2%) |
| 20 to 24 Years | 749 (5.7%) | 789 (5.9%) |
| 25 to 29 Years | 849 (6.4%) | 793 (6.0%) |
| 30 to 34 Years | 753 (5.7%) | 788 (5.9%) |
| 35 to 39 Years | 855 (6.5%) | 767 (5.8%) |
| 40 to 44 Years | 737 (5.6%) | 775 (5.8%) |
| 45 to 49 Years | 838 (6.4%) | 809 (6.1%) |
| 50 to 54 Years | 849 (6.4%) | 777 (5.9%) |
| 55 to 59 Years | 765 (5.8%) | 958 (7.2%) |
| 60 to 64 Years | 1,110 (8.4%) | 882 (6.6%) |
| 65 to 69 Years | 770 (5.8%) | 790 (5.9%) |
| 70 to 74 Years | 659 (5.0%) | 712 (5.4%) |
| 75 to 79 Years | 331 (2.5%) | 447 (3.4%) |
| 80 to 84 Years | 223 (1.7%) | 378 (2.8%) |
| 85 Years and over | 201 (1.5%) | 213 (1.6%) |
| Total | 13,178 (100.0%) | 13,287 (100.0%) |
Families and Households in Grayson County
Median Family Size in Grayson County
The median family size in Grayson County is 3.41 persons per family, with single male/father families (587 | 9.5%) accounting for the largest median family size of 3.59 persons per family. On the other hand, married-couple families (4,612 | 74.7%) represent the smallest median family size with 3.38 persons per family.
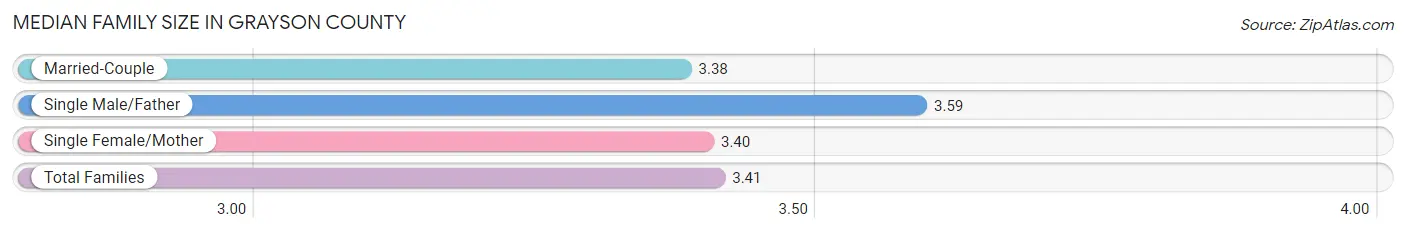
| Family Type | # Families | Family Size |
| Married-Couple | 4,612 (74.7%) | 3.38 |
| Single Male/Father | 587 (9.5%) | 3.59 |
| Single Female/Mother | 975 (15.8%) | 3.40 |
| Total Families | 6,174 (100.0%) | 3.41 |
Median Household Size in Grayson County
The median household size in Grayson County is 2.68 persons per household, with single male/father households (587 | 6.0%) accounting for the largest median household size of 4.3 persons per household. non-family households (3,531 | 36.4%) represent the smallest median household size with 1.18 persons per household.
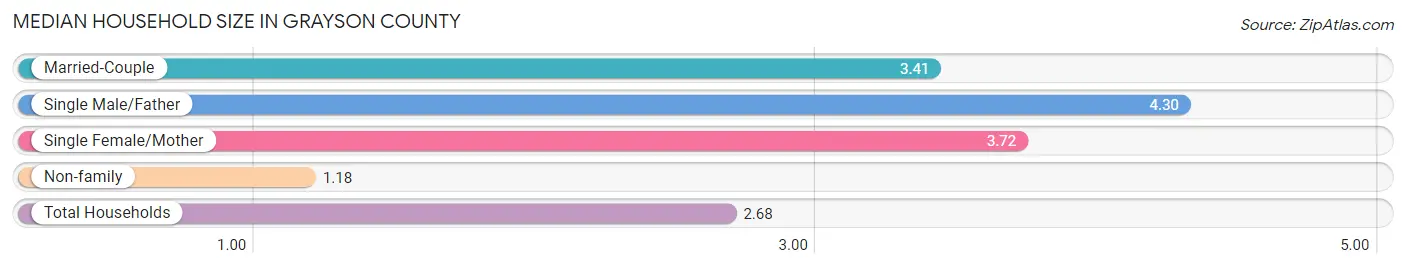
| Household Type | # Households | Household Size |
| Married-Couple | 4,612 (47.5%) | 3.41 |
| Single Male/Father | 587 (6.0%) | 4.30 |
| Single Female/Mother | 975 (10.1%) | 3.72 |
| Non-family | 3,531 (36.4%) | 1.18 |
| Total Households | 9,705 (100.0%) | 2.68 |
Household Size by Marriage Status in Grayson County
Out of a total of 9,705 households in Grayson County, 6,174 (63.6%) are family households, while 3,531 (36.4%) are nonfamily households. The most numerous type of family households are 2-person households, comprising 3,052, and the most common type of nonfamily households are 1-person households, comprising 3,042.
| Household Size | Family Households | Nonfamily Households |
| 1-Person Households | - | 3,042 (31.3%) |
| 2-Person Households | 3,052 (31.5%) | 412 (4.3%) |
| 3-Person Households | 1,371 (14.1%) | 62 (0.6%) |
| 4-Person Households | 986 (10.2%) | 15 (0.2%) |
| 5-Person Households | 476 (4.9%) | 0 (0.0%) |
| 6-Person Households | 250 (2.6%) | 0 (0.0%) |
| 7+ Person Households | 39 (0.4%) | 0 (0.0%) |
| Total | 6,174 (63.6%) | 3,531 (36.4%) |
Female Fertility in Grayson County
Fertility by Age in Grayson County
Average fertility rate in Grayson County is 71.0 births per 1,000 women. Women in the age bracket of 20 to 34 years have the highest fertility rate with 149.0 births per 1,000 women. Women in the age bracket of 20 to 34 years acount for 87.2% of all women with births.
| Age Bracket | Women with Births | Births / 1,000 Women |
| 15 to 19 years | 6 (1.5%) | 7.0 |
| 20 to 34 years | 353 (87.2%) | 149.0 |
| 35 to 50 years | 46 (11.4%) | 18.0 |
| Total | 405 (100.0%) | 71.0 |
Fertility by Age by Marriage Status in Grayson County
24.2% of women with births (405) in Grayson County are married. The highest percentage of unmarried women with births falls into 15 to 19 years age bracket with 100.0% of them unmarried at the time of birth, while the lowest percentage of unmarried women with births belong to 35 to 50 years age bracket with 54.3% of them unmarried.
| Age Bracket | Married | Unmarried |
| 15 to 19 years | 0 (0.0%) | 6 (100.0%) |
| 20 to 34 years | 77 (21.8%) | 276 (78.2%) |
| 35 to 50 years | 21 (45.7%) | 25 (54.3%) |
| Total | 98 (24.2%) | 307 (75.8%) |
Fertility by Education in Grayson County
Average fertility rate in Grayson County is 71.0 births per 1,000 women. Women with the education attainment of graduate degree have the highest fertility rate of 135.0 births per 1,000 women, while women with the education attainment of bachelor's degree have the lowest fertility at 9.0 births per 1,000 women. Women with the education attainment of high school diploma represent 51.4% of all women with births.
| Educational Attainment | Women with Births | Births / 1,000 Women |
| Less than High School | 11 (2.7%) | 13.0 |
| High School Diploma | 208 (51.4%) | 104.0 |
| College or Associate's Degree | 128 (31.6%) | 63.0 |
| Bachelor's Degree | 4 (1.0%) | 9.0 |
| Graduate Degree | 54 (13.3%) | 135.0 |
| Total | 405 (100.0%) | 71.0 |
Fertility by Education by Marriage Status in Grayson County
75.8% of women with births in Grayson County are unmarried. Women with the educational attainment of less than high school are most likely to be married with 100.0% of them married at childbirth, while women with the educational attainment of high school diploma are least likely to be married with 100.0% of them unmarried at childbirth.
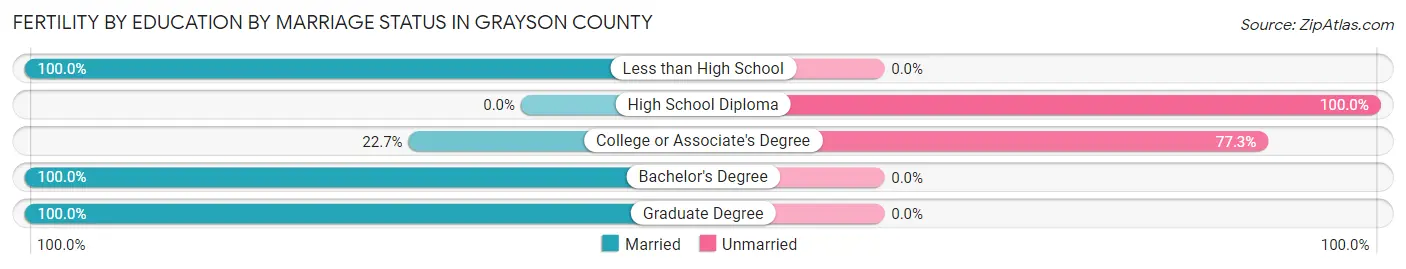
| Educational Attainment | Married | Unmarried |
| Less than High School | 11 (100.0%) | 0 (0.0%) |
| High School Diploma | 0 (0.0%) | 208 (100.0%) |
| College or Associate's Degree | 29 (22.7%) | 99 (77.3%) |
| Bachelor's Degree | 4 (100.0%) | 0 (0.0%) |
| Graduate Degree | 54 (100.0%) | 0 (0.0%) |
| Total | 98 (24.2%) | 307 (75.8%) |
Employment Characteristics in Grayson County
Employment by Class of Employer in Grayson County
Among the 10,404 employed individuals in Grayson County, private company employees (7,105 | 68.3%), local government employees (938 | 9.0%), and not-for-profit organizations (910 | 8.7%) make up the most common classes of employment.
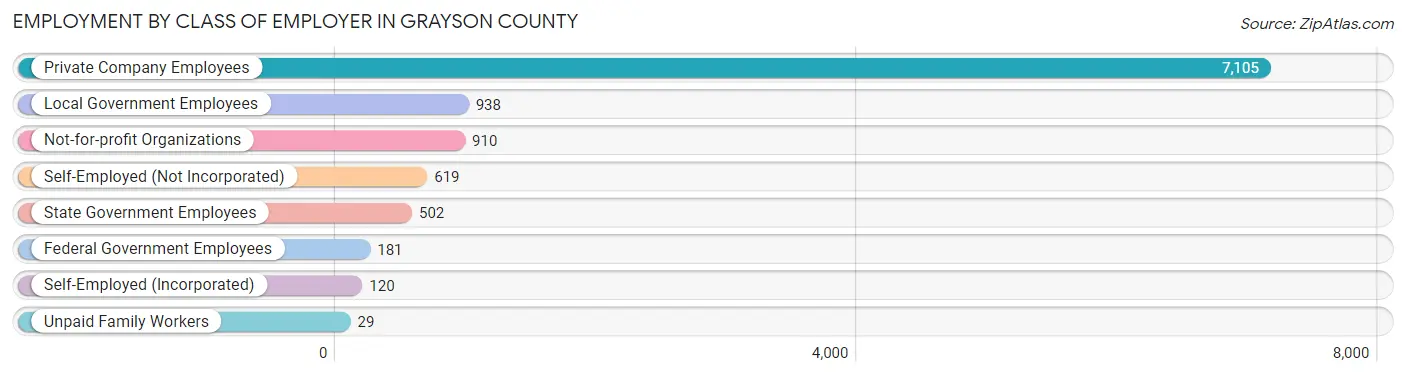
| Employer Class | # Employees | % Employees |
| Private Company Employees | 7,105 | 68.3% |
| Self-Employed (Incorporated) | 120 | 1.1% |
| Self-Employed (Not Incorporated) | 619 | 5.9% |
| Not-for-profit Organizations | 910 | 8.7% |
| Local Government Employees | 938 | 9.0% |
| State Government Employees | 502 | 4.8% |
| Federal Government Employees | 181 | 1.7% |
| Unpaid Family Workers | 29 | 0.3% |
| Total | 10,404 | 100.0% |
Employment Status by Age in Grayson County
According to the labor force statistics for Grayson County, out of the total population over 16 years of age (20,959), 53.4% or 11,192 individuals are in the labor force, with 4.8% or 537 of them unemployed. The age group with the highest labor force participation rate is 35 to 44 years, with 76.7% or 2,404 individuals in the labor force. Within the labor force, the 16 to 19 years age range has the highest percentage of unemployed individuals, with 20.9% or 115 of them being unemployed.
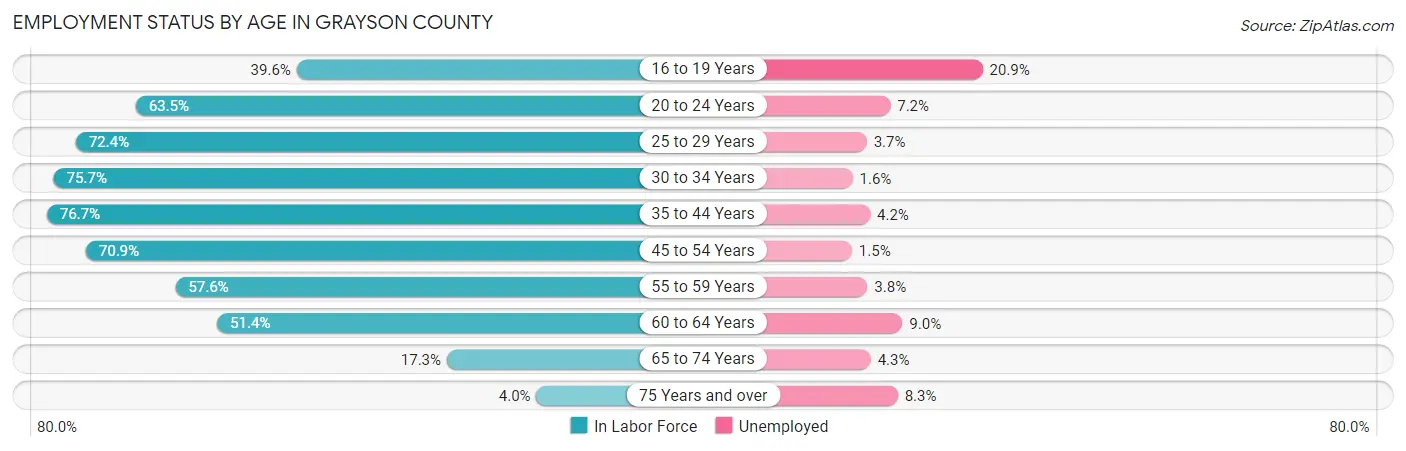
| Age Bracket | In Labor Force | Unemployed |
| 16 to 19 Years | 551 (39.6%) | 115 (20.9%) |
| 20 to 24 Years | 977 (63.5%) | 70 (7.2%) |
| 25 to 29 Years | 1,189 (72.4%) | 44 (3.7%) |
| 30 to 34 Years | 1,167 (75.7%) | 19 (1.6%) |
| 35 to 44 Years | 2,404 (76.7%) | 101 (4.2%) |
| 45 to 54 Years | 2,321 (70.9%) | 35 (1.5%) |
| 55 to 59 Years | 992 (57.6%) | 38 (3.8%) |
| 60 to 64 Years | 1,024 (51.4%) | 92 (9.0%) |
| 65 to 74 Years | 507 (17.3%) | 22 (4.3%) |
| 75 Years and over | 72 (4.0%) | 6 (8.3%) |
| Total | 11,192 (53.4%) | 537 (4.8%) |
Employment Status by Educational Attainment in Grayson County
According to labor force statistics for Grayson County, 68.4% of individuals (9,101) out of the total population between 25 and 64 years of age (13,305) are in the labor force, with 3.6% or 328 of them being unemployed. The group with the highest labor force participation rate are those with the educational attainment of bachelor's degree or higher, with 80.8% or 1,433 individuals in the labor force. Within the labor force, individuals with less than high school education have the highest percentage of unemployment, with 8.0% or 59 of them being unemployed.
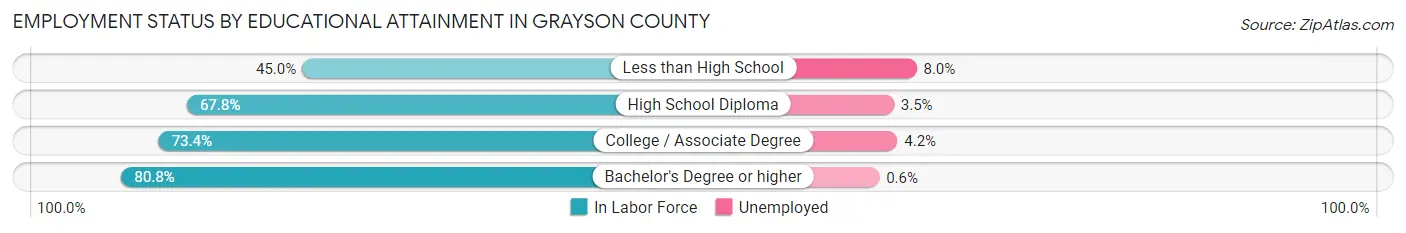
| Educational Attainment | In Labor Force | Unemployed |
| Less than High School | 734 (45.0%) | 130 (8.0%) |
| High School Diploma | 4,087 (67.8%) | 211 (3.5%) |
| College / Associate Degree | 2,842 (73.4%) | 163 (4.2%) |
| Bachelor's Degree or higher | 1,433 (80.8%) | 11 (0.6%) |
| Total | 9,101 (68.4%) | 479 (3.6%) |
Employment Occupations by Sex in Grayson County
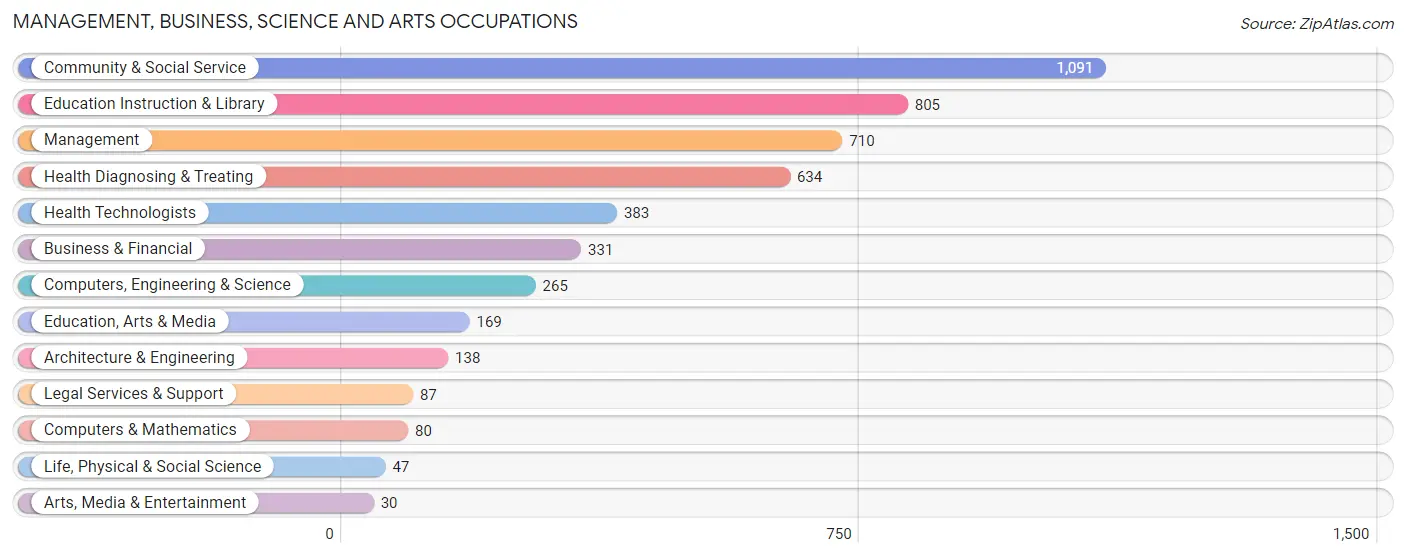
Management, Business, Science and Arts Occupations
The most common Management, Business, Science and Arts occupations in Grayson County are Community & Social Service (1,091 | 10.2%), Education Instruction & Library (805 | 7.6%), Management (710 | 6.7%), Health Diagnosing & Treating (634 | 6.0%), and Health Technologists (383 | 3.6%).
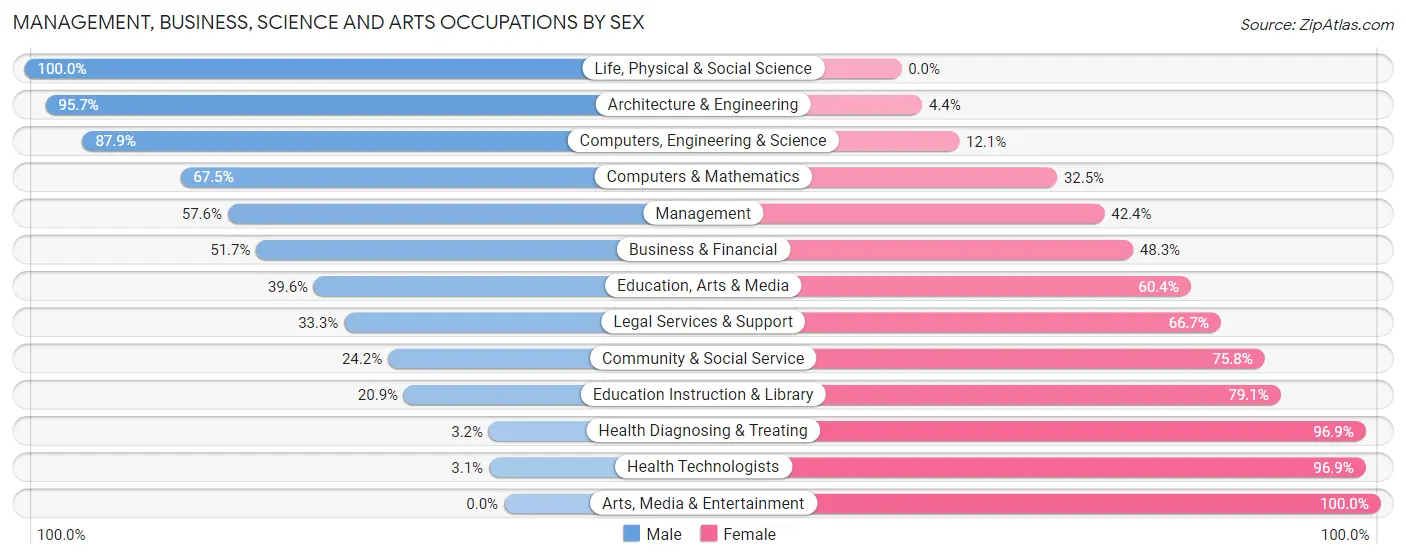
Management, Business, Science and Arts Occupations by Sex
Within the Management, Business, Science and Arts occupations in Grayson County, the most male-oriented occupations are Life, Physical & Social Science (100.0%), Architecture & Engineering (95.7%), and Computers, Engineering & Science (87.9%), while the most female-oriented occupations are Arts, Media & Entertainment (100.0%), Health Technologists (96.9%), and Health Diagnosing & Treating (96.9%).
| Occupation | Male | Female |
| Management | 409 (57.6%) | 301 (42.4%) |
| Business & Financial | 171 (51.7%) | 160 (48.3%) |
| Computers, Engineering & Science | 233 (87.9%) | 32 (12.1%) |
| Computers & Mathematics | 54 (67.5%) | 26 (32.5%) |
| Architecture & Engineering | 132 (95.7%) | 6 (4.3%) |
| Life, Physical & Social Science | 47 (100.0%) | 0 (0.0%) |
| Community & Social Service | 264 (24.2%) | 827 (75.8%) |
| Education, Arts & Media | 67 (39.6%) | 102 (60.4%) |
| Legal Services & Support | 29 (33.3%) | 58 (66.7%) |
| Education Instruction & Library | 168 (20.9%) | 637 (79.1%) |
| Arts, Media & Entertainment | 0 (0.0%) | 30 (100.0%) |
| Health Diagnosing & Treating | 20 (3.2%) | 614 (96.9%) |
| Health Technologists | 12 (3.1%) | 371 (96.9%) |
| Total (Category) | 1,097 (36.2%) | 1,934 (63.8%) |
| Total (Overall) | 5,536 (52.0%) | 5,103 (48.0%) |
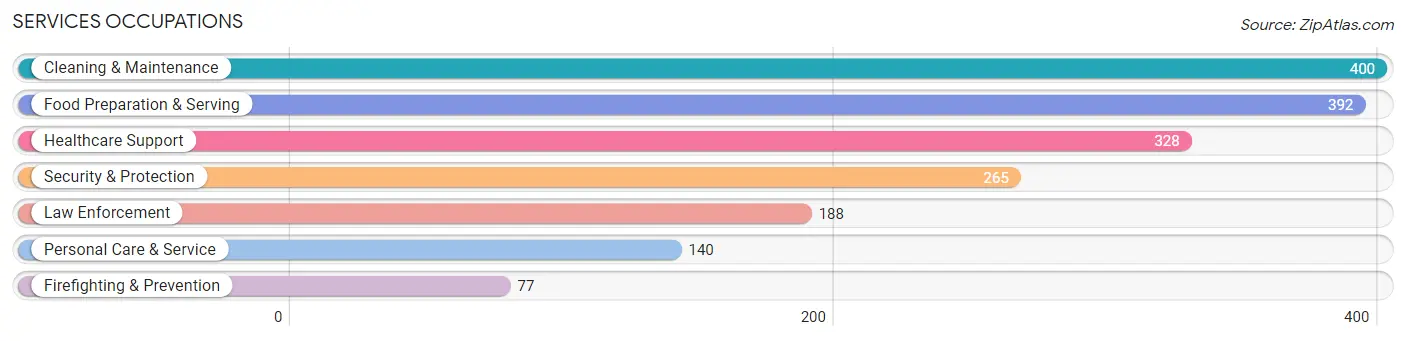
Services Occupations
The most common Services occupations in Grayson County are Cleaning & Maintenance (400 | 3.8%), Food Preparation & Serving (392 | 3.7%), Healthcare Support (328 | 3.1%), Security & Protection (265 | 2.5%), and Law Enforcement (188 | 1.8%).
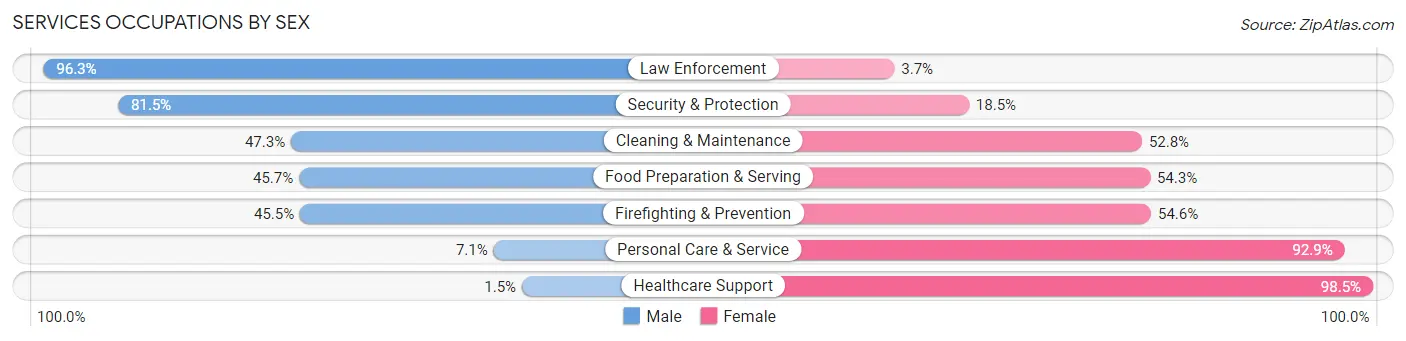
Services Occupations by Sex
Within the Services occupations in Grayson County, the most male-oriented occupations are Law Enforcement (96.3%), Security & Protection (81.5%), and Cleaning & Maintenance (47.2%), while the most female-oriented occupations are Healthcare Support (98.5%), Personal Care & Service (92.9%), and Firefighting & Prevention (54.5%).
| Occupation | Male | Female |
| Healthcare Support | 5 (1.5%) | 323 (98.5%) |
| Security & Protection | 216 (81.5%) | 49 (18.5%) |
| Firefighting & Prevention | 35 (45.5%) | 42 (54.5%) |
| Law Enforcement | 181 (96.3%) | 7 (3.7%) |
| Food Preparation & Serving | 179 (45.7%) | 213 (54.3%) |
| Cleaning & Maintenance | 189 (47.2%) | 211 (52.7%) |
| Personal Care & Service | 10 (7.1%) | 130 (92.9%) |
| Total (Category) | 599 (39.3%) | 926 (60.7%) |
| Total (Overall) | 5,536 (52.0%) | 5,103 (48.0%) |
Sales and Office Occupations
The most common Sales and Office occupations in Grayson County are Sales & Related (1,059 | 10.0%), and Office & Administration (897 | 8.4%).
Sales and Office Occupations by Sex
| Occupation | Male | Female |
| Sales & Related | 438 (41.4%) | 621 (58.6%) |
| Office & Administration | 127 (14.2%) | 770 (85.8%) |
| Total (Category) | 565 (28.9%) | 1,391 (71.1%) |
| Total (Overall) | 5,536 (52.0%) | 5,103 (48.0%) |
Natural Resources, Construction and Maintenance Occupations
The most common Natural Resources, Construction and Maintenance occupations in Grayson County are Construction & Extraction (1,078 | 10.1%), Installation, Maintenance & Repair (439 | 4.1%), and Farming, Fishing & Forestry (140 | 1.3%).
Natural Resources, Construction and Maintenance Occupations by Sex
| Occupation | Male | Female |
| Farming, Fishing & Forestry | 51 (36.4%) | 89 (63.6%) |
| Construction & Extraction | 1,054 (97.8%) | 24 (2.2%) |
| Installation, Maintenance & Repair | 422 (96.1%) | 17 (3.9%) |
| Total (Category) | 1,527 (92.1%) | 130 (7.9%) |
| Total (Overall) | 5,536 (52.0%) | 5,103 (48.0%) |
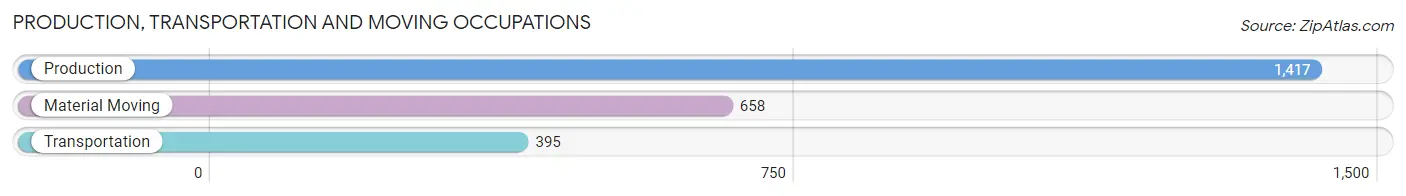
Production, Transportation and Moving Occupations
The most common Production, Transportation and Moving occupations in Grayson County are Production (1,417 | 13.3%), Material Moving (658 | 6.2%), and Transportation (395 | 3.7%).
Production, Transportation and Moving Occupations by Sex
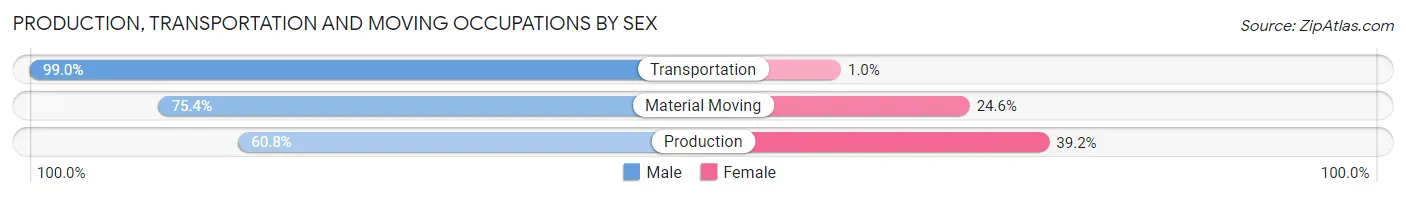
| Occupation | Male | Female |
| Production | 861 (60.8%) | 556 (39.2%) |
| Transportation | 391 (99.0%) | 4 (1.0%) |
| Material Moving | 496 (75.4%) | 162 (24.6%) |
| Total (Category) | 1,748 (70.8%) | 722 (29.2%) |
| Total (Overall) | 5,536 (52.0%) | 5,103 (48.0%) |
Employment Industries by Sex in Grayson County
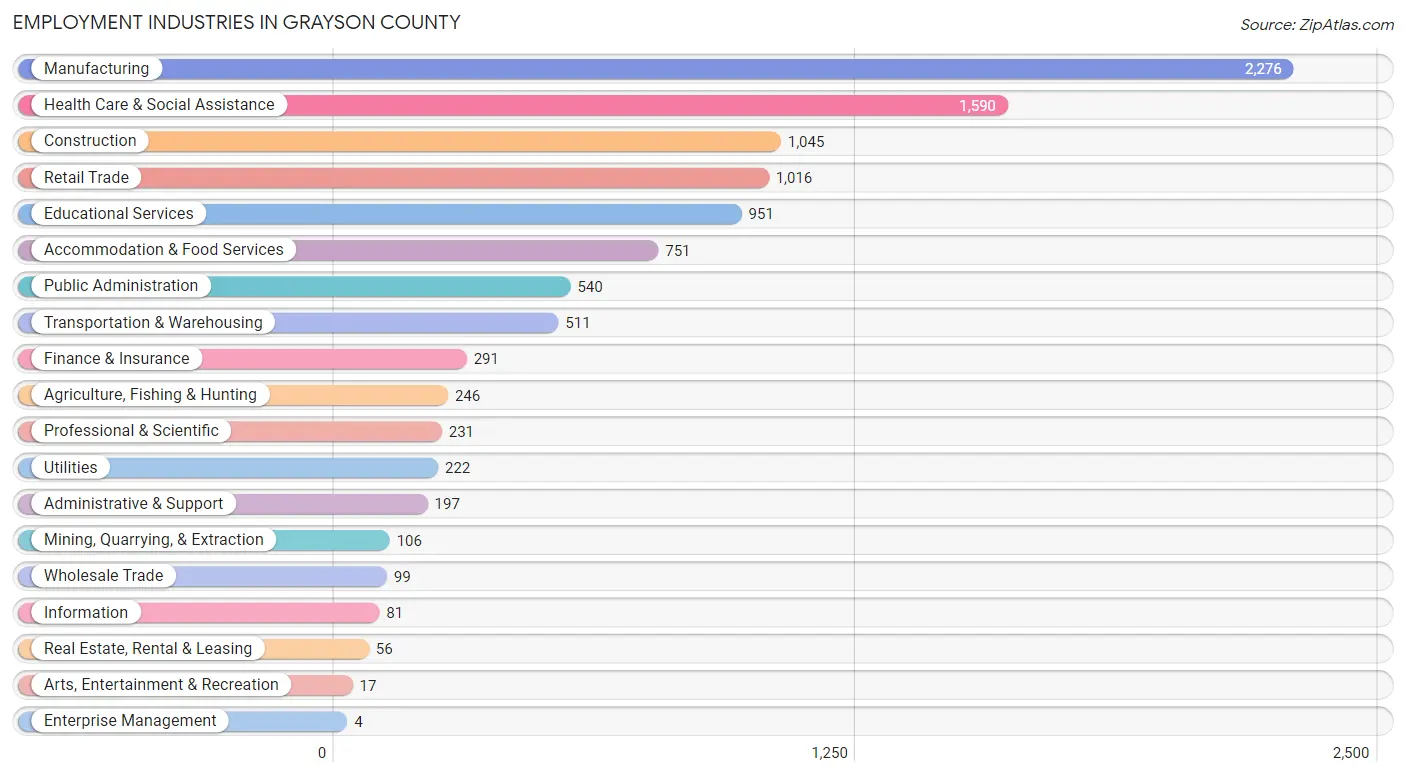
Employment Industries in Grayson County
The major employment industries in Grayson County include Manufacturing (2,276 | 21.4%), Health Care & Social Assistance (1,590 | 14.9%), Construction (1,045 | 9.8%), Retail Trade (1,016 | 9.6%), and Educational Services (951 | 8.9%).
Employment Industries by Sex in Grayson County
The Grayson County industries that see more men than women are Mining, Quarrying, & Extraction (100.0%), Construction (97.6%), and Wholesale Trade (87.9%), whereas the industries that tend to have a higher number of women are Enterprise Management (100.0%), Health Care & Social Assistance (96.5%), and Finance & Insurance (78.0%).
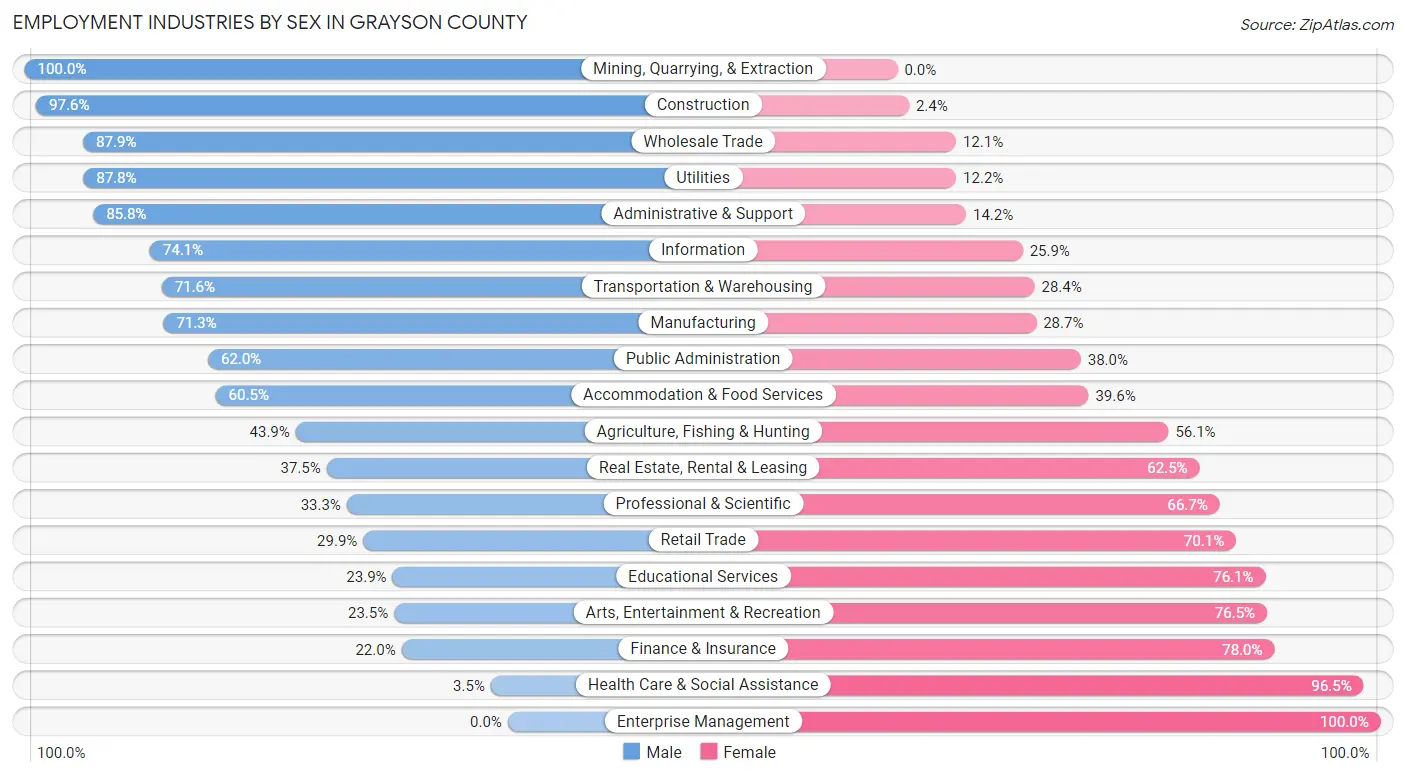
| Industry | Male | Female |
| Agriculture, Fishing & Hunting | 108 (43.9%) | 138 (56.1%) |
| Mining, Quarrying, & Extraction | 106 (100.0%) | 0 (0.0%) |
| Construction | 1,020 (97.6%) | 25 (2.4%) |
| Manufacturing | 1,622 (71.3%) | 654 (28.7%) |
| Wholesale Trade | 87 (87.9%) | 12 (12.1%) |
| Retail Trade | 304 (29.9%) | 712 (70.1%) |
| Transportation & Warehousing | 366 (71.6%) | 145 (28.4%) |
| Utilities | 195 (87.8%) | 27 (12.2%) |
| Information | 60 (74.1%) | 21 (25.9%) |
| Finance & Insurance | 64 (22.0%) | 227 (78.0%) |
| Real Estate, Rental & Leasing | 21 (37.5%) | 35 (62.5%) |
| Professional & Scientific | 77 (33.3%) | 154 (66.7%) |
| Enterprise Management | 0 (0.0%) | 4 (100.0%) |
| Administrative & Support | 169 (85.8%) | 28 (14.2%) |
| Educational Services | 227 (23.9%) | 724 (76.1%) |
| Health Care & Social Assistance | 56 (3.5%) | 1,534 (96.5%) |
| Arts, Entertainment & Recreation | 4 (23.5%) | 13 (76.5%) |
| Accommodation & Food Services | 454 (60.5%) | 297 (39.6%) |
| Public Administration | 335 (62.0%) | 205 (38.0%) |
| Total | 5,536 (52.0%) | 5,103 (48.0%) |
Education in Grayson County
School Enrollment in Grayson County
The most common levels of schooling among the 5,550 students in Grayson County are middle school (1,576 | 28.4%), high school (1,413 | 25.5%), and elementary school (1,207 | 21.7%).
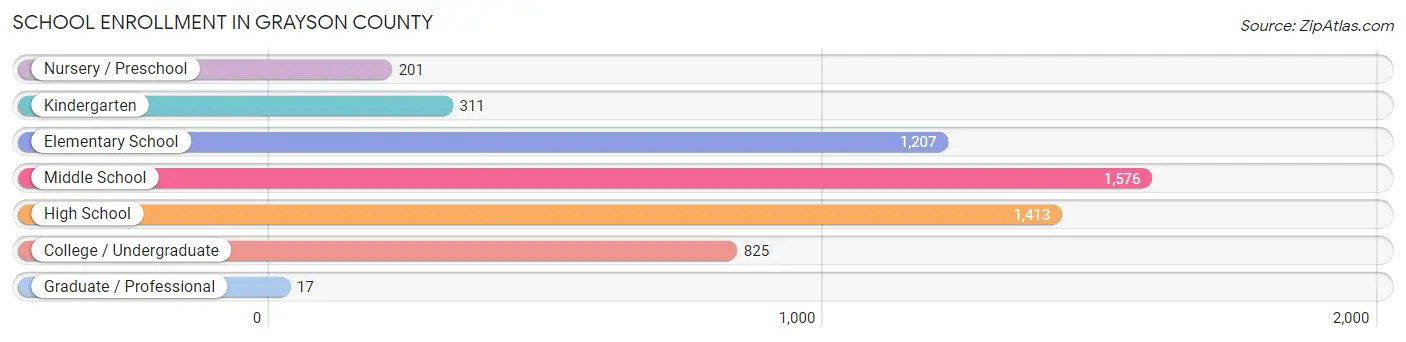
| School Level | # Students | % Students |
| Nursery / Preschool | 201 | 3.6% |
| Kindergarten | 311 | 5.6% |
| Elementary School | 1,207 | 21.7% |
| Middle School | 1,576 | 28.4% |
| High School | 1,413 | 25.5% |
| College / Undergraduate | 825 | 14.9% |
| Graduate / Professional | 17 | 0.3% |
| Total | 5,550 | 100.0% |
School Enrollment by Age by Funding Source in Grayson County
Out of a total of 5,550 students who are enrolled in schools in Grayson County, 616 (11.1%) attend a private institution, while the remaining 4,934 (88.9%) are enrolled in public schools. The age group of 3 to 4 year olds has the highest likelihood of being enrolled in private schools, with 31 (17.5% in the age bracket) enrolled. Conversely, the age group of 18 to 19 year olds has the lowest likelihood of being enrolled in a private school, with 208 (97.2% in the age bracket) attending a public institution.
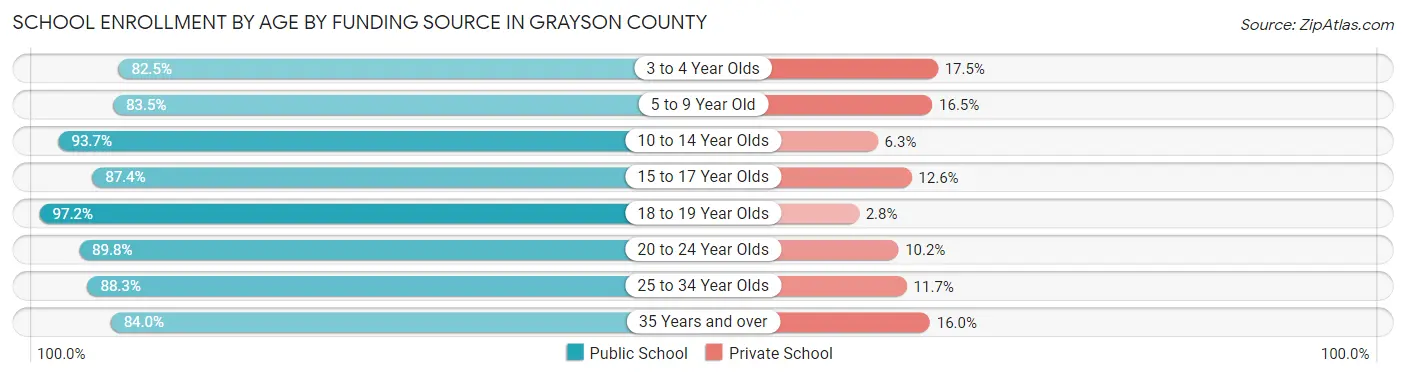
| Age Bracket | Public School | Private School |
| 3 to 4 Year Olds | 146 (82.5%) | 31 (17.5%) |
| 5 to 9 Year Old | 1,111 (83.5%) | 219 (16.5%) |
| 10 to 14 Year Olds | 1,821 (93.7%) | 123 (6.3%) |
| 15 to 17 Year Olds | 983 (87.4%) | 142 (12.6%) |
| 18 to 19 Year Olds | 208 (97.2%) | 6 (2.8%) |
| 20 to 24 Year Olds | 274 (89.8%) | 31 (10.2%) |
| 25 to 34 Year Olds | 143 (88.3%) | 19 (11.7%) |
| 35 Years and over | 246 (84.0%) | 47 (16.0%) |
| Total | 4,934 (88.9%) | 616 (11.1%) |
Educational Attainment by Field of Study in Grayson County
Education (673 | 26.0%), science & technology (331 | 12.8%), business (320 | 12.3%), bio, nature & agricultural (292 | 11.3%), and arts & humanities (258 | 10.0%) are the most common fields of study among 2,592 individuals in Grayson County who have obtained a bachelor's degree or higher.
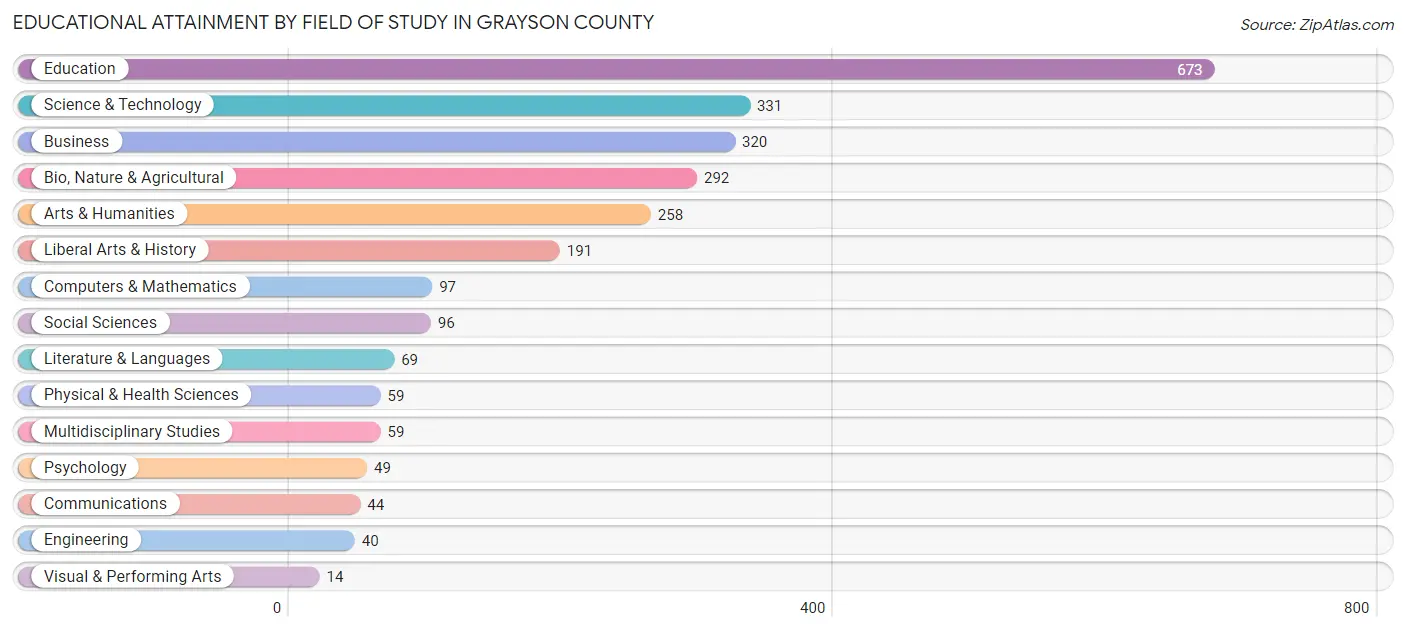
| Field of Study | # Graduates | % Graduates |
| Computers & Mathematics | 97 | 3.7% |
| Bio, Nature & Agricultural | 292 | 11.3% |
| Physical & Health Sciences | 59 | 2.3% |
| Psychology | 49 | 1.9% |
| Social Sciences | 96 | 3.7% |
| Engineering | 40 | 1.5% |
| Multidisciplinary Studies | 59 | 2.3% |
| Science & Technology | 331 | 12.8% |
| Business | 320 | 12.3% |
| Education | 673 | 26.0% |
| Literature & Languages | 69 | 2.7% |
| Liberal Arts & History | 191 | 7.4% |
| Visual & Performing Arts | 14 | 0.5% |
| Communications | 44 | 1.7% |
| Arts & Humanities | 258 | 10.0% |
| Total | 2,592 | 100.0% |
Transportation & Commute in Grayson County
Vehicle Availability by Sex in Grayson County
The most prevalent vehicle ownership categories in Grayson County are males with 3 vehicles (1,819, accounting for 33.2%) and females with 3 vehicles (1,264, making up 36.9%).
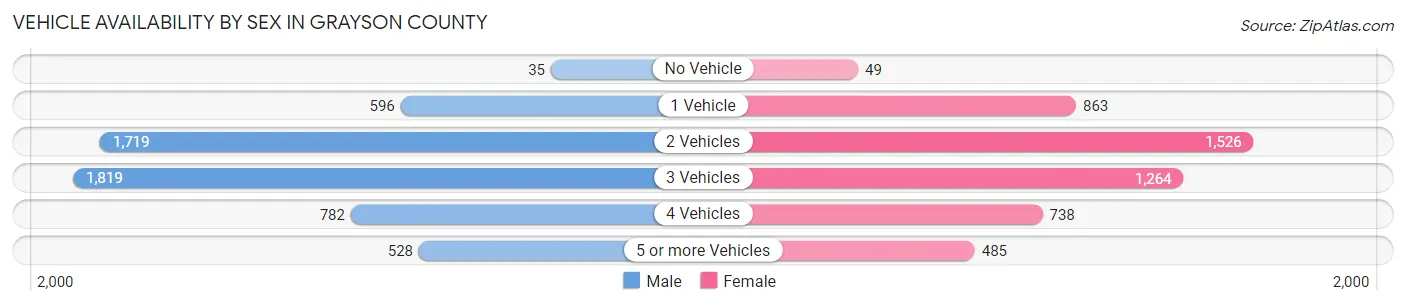
| Vehicles Available | Male | Female |
| No Vehicle | 35 (0.6%) | 49 (1.0%) |
| 1 Vehicle | 596 (10.9%) | 863 (17.5%) |
| 2 Vehicles | 1,719 (31.4%) | 1,526 (31.0%) |
| 3 Vehicles | 1,819 (33.2%) | 1,264 (25.7%) |
| 4 Vehicles | 782 (14.3%) | 738 (15.0%) |
| 5 or more Vehicles | 528 (9.6%) | 485 (9.9%) |
| Total | 5,479 (100.0%) | 4,925 (100.0%) |
Commute Time in Grayson County
The most frequently occuring commute durations in Grayson County are 10 to 14 minutes (1,693 commuters, 17.2%), 15 to 19 minutes (1,336 commuters, 13.5%), and 20 to 24 minutes (1,280 commuters, 13.0%).
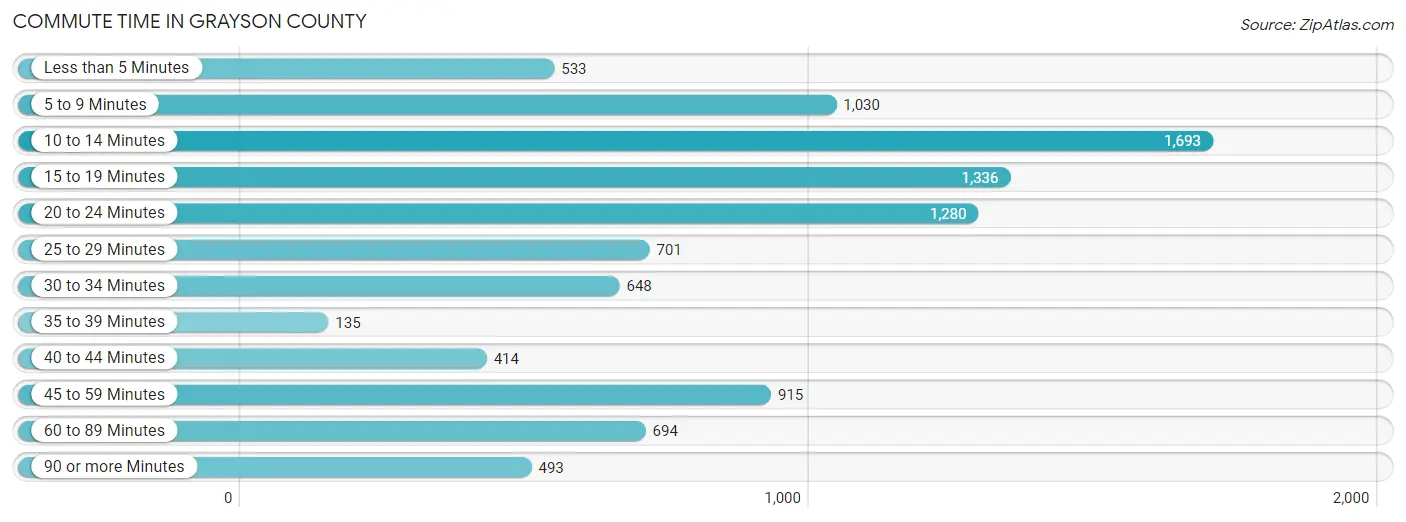
| Commute Time | # Commuters | % Commuters |
| Less than 5 Minutes | 533 | 5.4% |
| 5 to 9 Minutes | 1,030 | 10.4% |
| 10 to 14 Minutes | 1,693 | 17.2% |
| 15 to 19 Minutes | 1,336 | 13.5% |
| 20 to 24 Minutes | 1,280 | 13.0% |
| 25 to 29 Minutes | 701 | 7.1% |
| 30 to 34 Minutes | 648 | 6.6% |
| 35 to 39 Minutes | 135 | 1.4% |
| 40 to 44 Minutes | 414 | 4.2% |
| 45 to 59 Minutes | 915 | 9.3% |
| 60 to 89 Minutes | 694 | 7.0% |
| 90 or more Minutes | 493 | 5.0% |
Commute Time by Sex in Grayson County
The most common commute times in Grayson County are 10 to 14 minutes (1,092 commuters, 21.1%) for males and 15 to 19 minutes (910 commuters, 19.4%) for females.
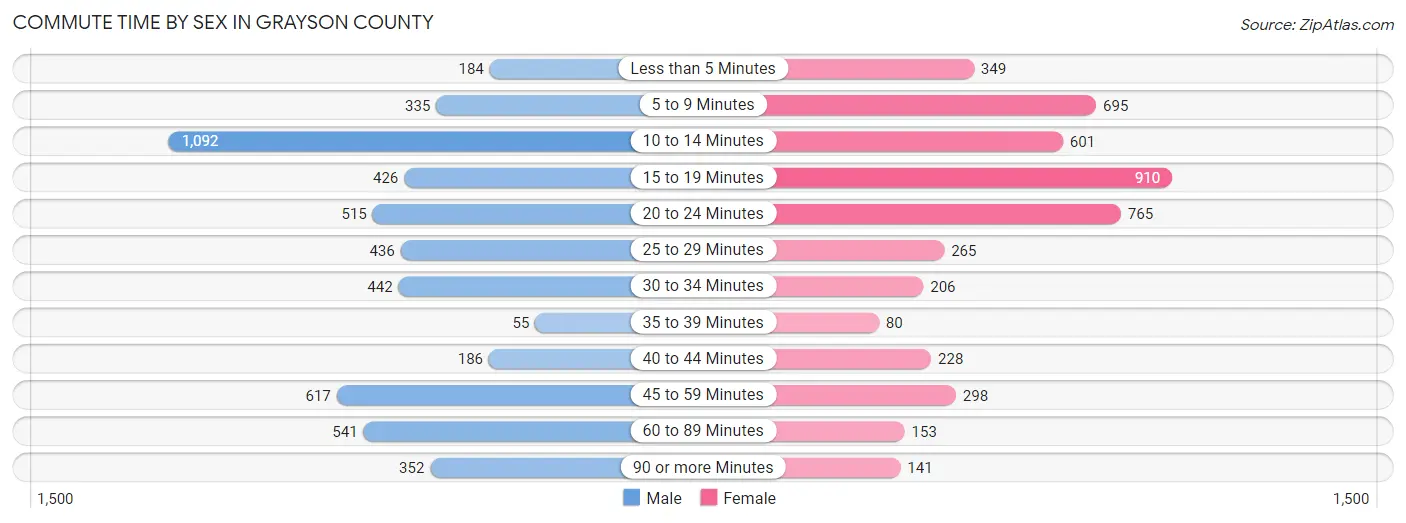
| Commute Time | Male | Female |
| Less than 5 Minutes | 184 (3.5%) | 349 (7.4%) |
| 5 to 9 Minutes | 335 (6.5%) | 695 (14.8%) |
| 10 to 14 Minutes | 1,092 (21.1%) | 601 (12.8%) |
| 15 to 19 Minutes | 426 (8.2%) | 910 (19.4%) |
| 20 to 24 Minutes | 515 (9.9%) | 765 (16.3%) |
| 25 to 29 Minutes | 436 (8.4%) | 265 (5.7%) |
| 30 to 34 Minutes | 442 (8.5%) | 206 (4.4%) |
| 35 to 39 Minutes | 55 (1.1%) | 80 (1.7%) |
| 40 to 44 Minutes | 186 (3.6%) | 228 (4.9%) |
| 45 to 59 Minutes | 617 (11.9%) | 298 (6.4%) |
| 60 to 89 Minutes | 541 (10.4%) | 153 (3.3%) |
| 90 or more Minutes | 352 (6.8%) | 141 (3.0%) |
Time of Departure to Work by Sex in Grayson County
The most frequent times of departure to work in Grayson County are 12:00 AM to 4:59 AM (1,018, 19.7%) for males and 7:00 AM to 7:29 AM (969, 20.7%) for females.
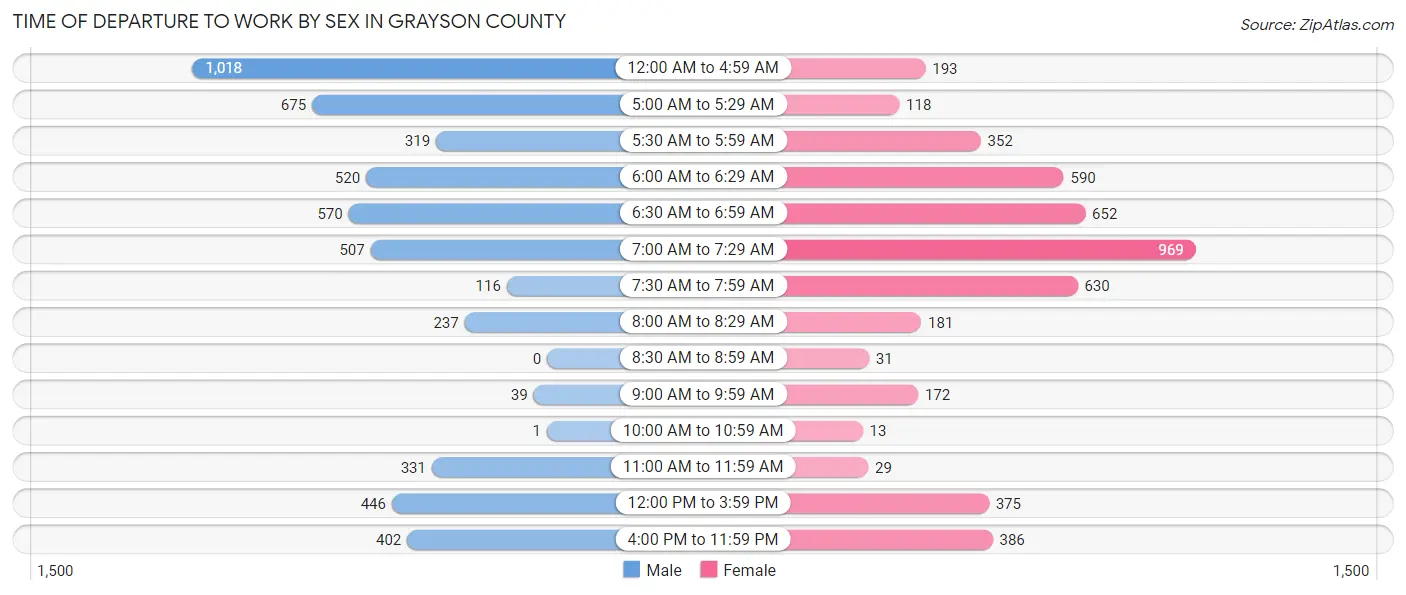
| Time of Departure | Male | Female |
| 12:00 AM to 4:59 AM | 1,018 (19.7%) | 193 (4.1%) |
| 5:00 AM to 5:29 AM | 675 (13.0%) | 118 (2.5%) |
| 5:30 AM to 5:59 AM | 319 (6.2%) | 352 (7.5%) |
| 6:00 AM to 6:29 AM | 520 (10.0%) | 590 (12.6%) |
| 6:30 AM to 6:59 AM | 570 (11.0%) | 652 (13.9%) |
| 7:00 AM to 7:29 AM | 507 (9.8%) | 969 (20.7%) |
| 7:30 AM to 7:59 AM | 116 (2.2%) | 630 (13.4%) |
| 8:00 AM to 8:29 AM | 237 (4.6%) | 181 (3.9%) |
| 8:30 AM to 8:59 AM | 0 (0.0%) | 31 (0.7%) |
| 9:00 AM to 9:59 AM | 39 (0.7%) | 172 (3.7%) |
| 10:00 AM to 10:59 AM | 1 (0.0%) | 13 (0.3%) |
| 11:00 AM to 11:59 AM | 331 (6.4%) | 29 (0.6%) |
| 12:00 PM to 3:59 PM | 446 (8.6%) | 375 (8.0%) |
| 4:00 PM to 11:59 PM | 402 (7.8%) | 386 (8.2%) |
| Total | 5,181 (100.0%) | 4,691 (100.0%) |
Housing Occupancy in Grayson County
Occupancy by Ownership in Grayson County
Of the total 9,705 dwellings in Grayson County, owner-occupied units account for 7,464 (76.9%), while renter-occupied units make up 2,241 (23.1%).
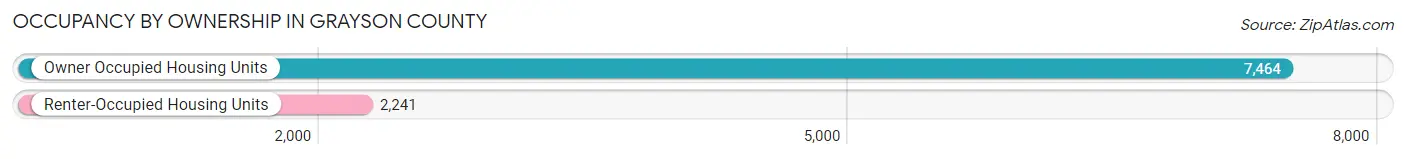
| Occupancy | # Housing Units | % Housing Units |
| Owner Occupied Housing Units | 7,464 | 76.9% |
| Renter-Occupied Housing Units | 2,241 | 23.1% |
| Total Occupied Housing Units | 9,705 | 100.0% |
Occupancy by Household Size in Grayson County
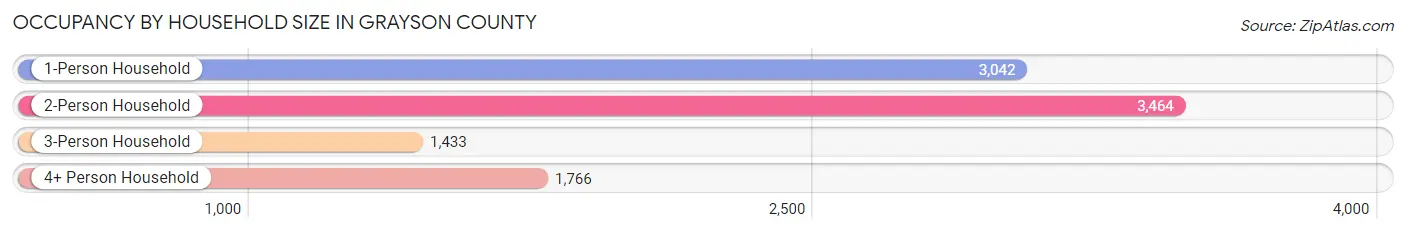
| Household Size | # Housing Units | % Housing Units |
| 1-Person Household | 3,042 | 31.3% |
| 2-Person Household | 3,464 | 35.7% |
| 3-Person Household | 1,433 | 14.8% |
| 4+ Person Household | 1,766 | 18.2% |
| Total Housing Units | 9,705 | 100.0% |
Occupancy by Ownership by Household Size in Grayson County
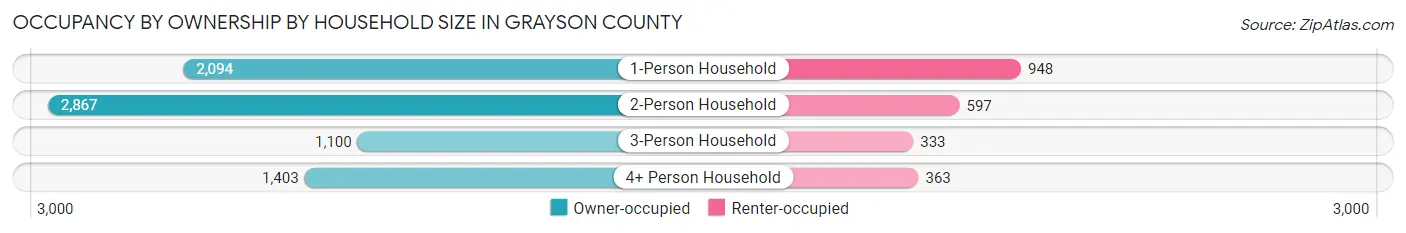
| Household Size | Owner-occupied | Renter-occupied |
| 1-Person Household | 2,094 (68.8%) | 948 (31.2%) |
| 2-Person Household | 2,867 (82.8%) | 597 (17.2%) |
| 3-Person Household | 1,100 (76.8%) | 333 (23.2%) |
| 4+ Person Household | 1,403 (79.4%) | 363 (20.5%) |
| Total Housing Units | 7,464 (76.9%) | 2,241 (23.1%) |
Occupancy by Educational Attainment in Grayson County
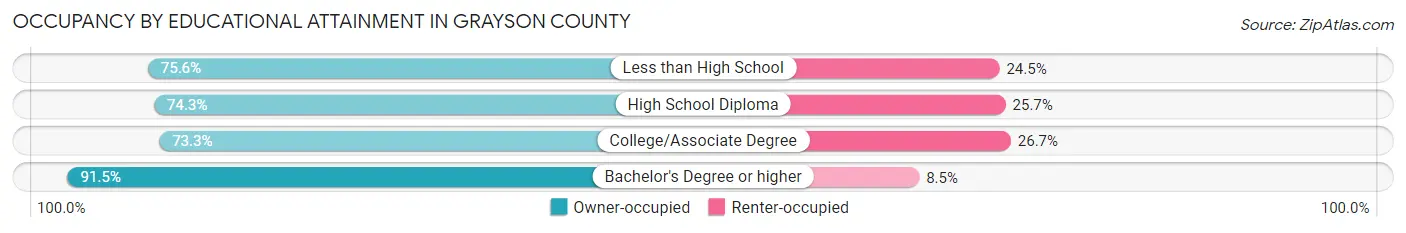
| Household Size | Owner-occupied | Renter-occupied |
| Less than High School | 1,165 (75.5%) | 377 (24.4%) |
| High School Diploma | 3,060 (74.3%) | 1,056 (25.7%) |
| College/Associate Degree | 1,867 (73.3%) | 680 (26.7%) |
| Bachelor's Degree or higher | 1,372 (91.5%) | 128 (8.5%) |
Occupancy by Age of Householder in Grayson County
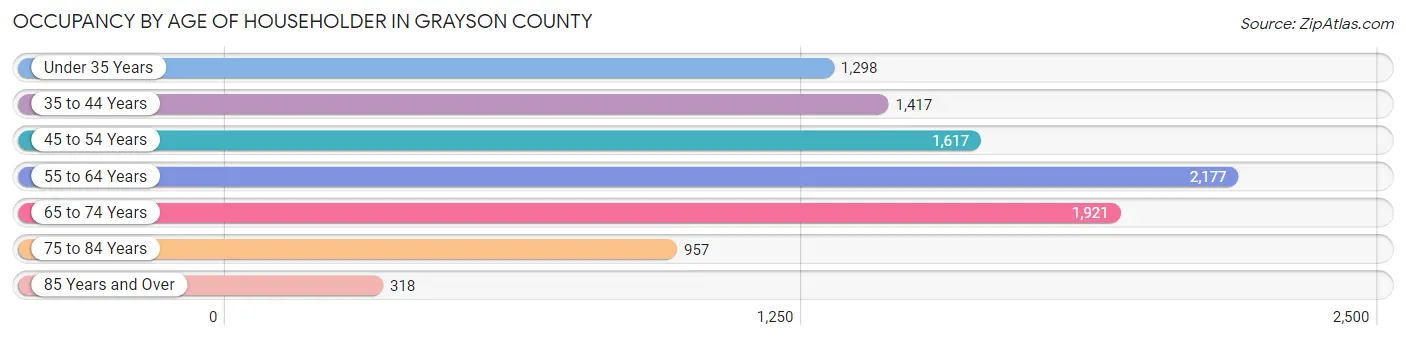
| Age Bracket | # Households | % Households |
| Under 35 Years | 1,298 | 13.4% |
| 35 to 44 Years | 1,417 | 14.6% |
| 45 to 54 Years | 1,617 | 16.7% |
| 55 to 64 Years | 2,177 | 22.4% |
| 65 to 74 Years | 1,921 | 19.8% |
| 75 to 84 Years | 957 | 9.9% |
| 85 Years and Over | 318 | 3.3% |
| Total | 9,705 | 100.0% |
Housing Finances in Grayson County
Median Income by Occupancy in Grayson County
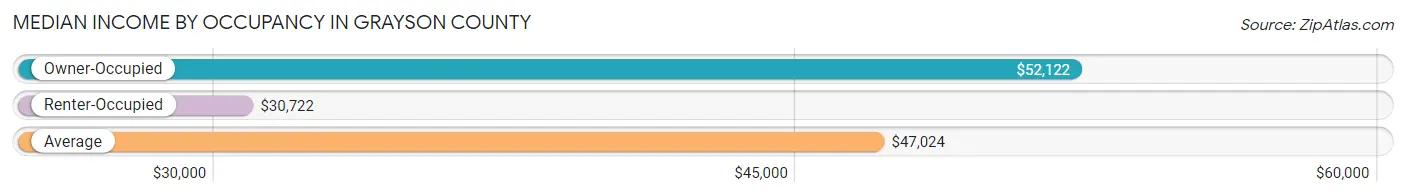
| Occupancy Type | # Households | Median Income |
| Owner-Occupied | 7,464 (76.9%) | $52,122 |
| Renter-Occupied | 2,241 (23.1%) | $30,722 |
| Average | 9,705 (100.0%) | $47,024 |
Occupancy by Householder Income Bracket in Grayson County
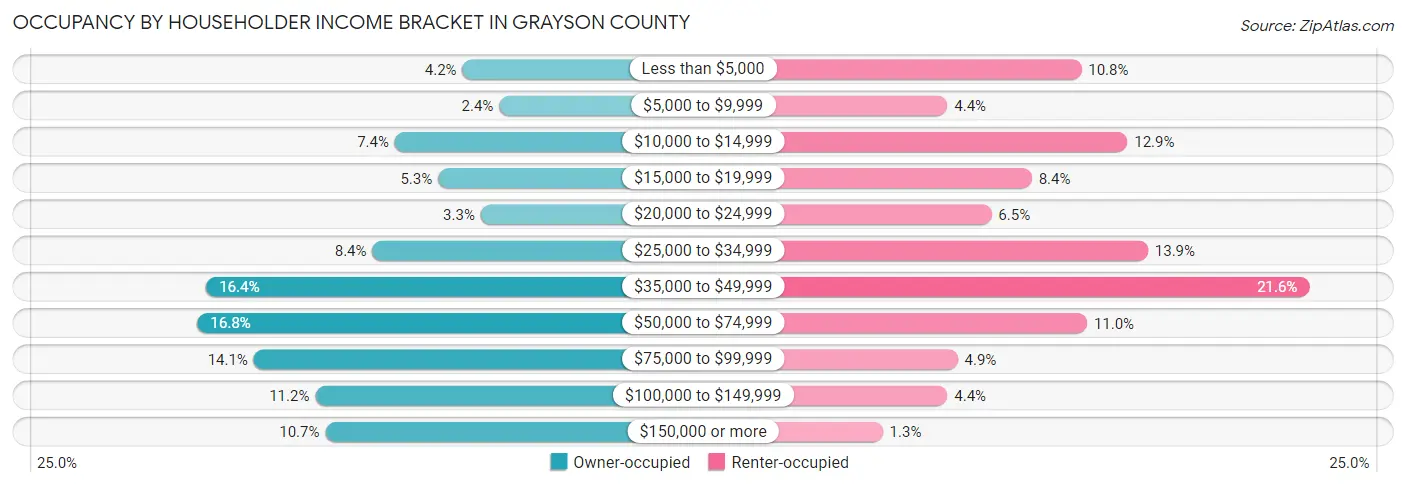
| Income Bracket | Owner-occupied | Renter-occupied |
| Less than $5,000 | 310 (4.2%) | 241 (10.7%) |
| $5,000 to $9,999 | 179 (2.4%) | 98 (4.4%) |
| $10,000 to $14,999 | 550 (7.4%) | 290 (12.9%) |
| $15,000 to $19,999 | 396 (5.3%) | 188 (8.4%) |
| $20,000 to $24,999 | 245 (3.3%) | 145 (6.5%) |
| $25,000 to $34,999 | 630 (8.4%) | 312 (13.9%) |
| $35,000 to $49,999 | 1,220 (16.4%) | 484 (21.6%) |
| $50,000 to $74,999 | 1,252 (16.8%) | 247 (11.0%) |
| $75,000 to $99,999 | 1,052 (14.1%) | 109 (4.9%) |
| $100,000 to $149,999 | 833 (11.2%) | 98 (4.4%) |
| $150,000 or more | 797 (10.7%) | 29 (1.3%) |
| Total | 7,464 (100.0%) | 2,241 (100.0%) |
Monthly Housing Cost Tiers in Grayson County
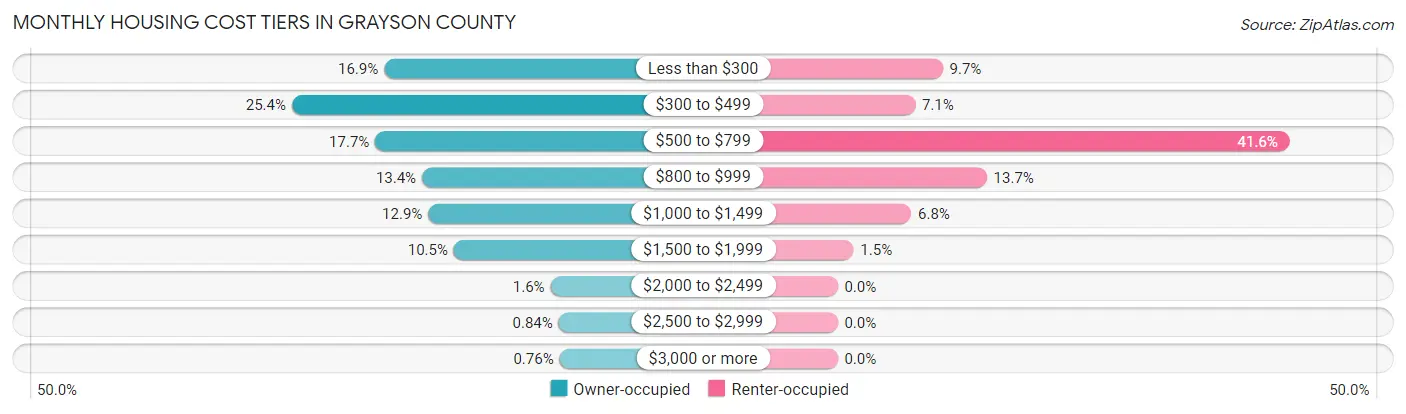
| Monthly Cost | Owner-occupied | Renter-occupied |
| Less than $300 | 1,262 (16.9%) | 217 (9.7%) |
| $300 to $499 | 1,896 (25.4%) | 160 (7.1%) |
| $500 to $799 | 1,323 (17.7%) | 933 (41.6%) |
| $800 to $999 | 1,002 (13.4%) | 308 (13.7%) |
| $1,000 to $1,499 | 959 (12.9%) | 152 (6.8%) |
| $1,500 to $1,999 | 783 (10.5%) | 33 (1.5%) |
| $2,000 to $2,499 | 119 (1.6%) | 0 (0.0%) |
| $2,500 to $2,999 | 63 (0.8%) | 0 (0.0%) |
| $3,000 or more | 57 (0.8%) | 0 (0.0%) |
| Total | 7,464 (100.0%) | 2,241 (100.0%) |
Physical Housing Characteristics in Grayson County
Housing Structures in Grayson County
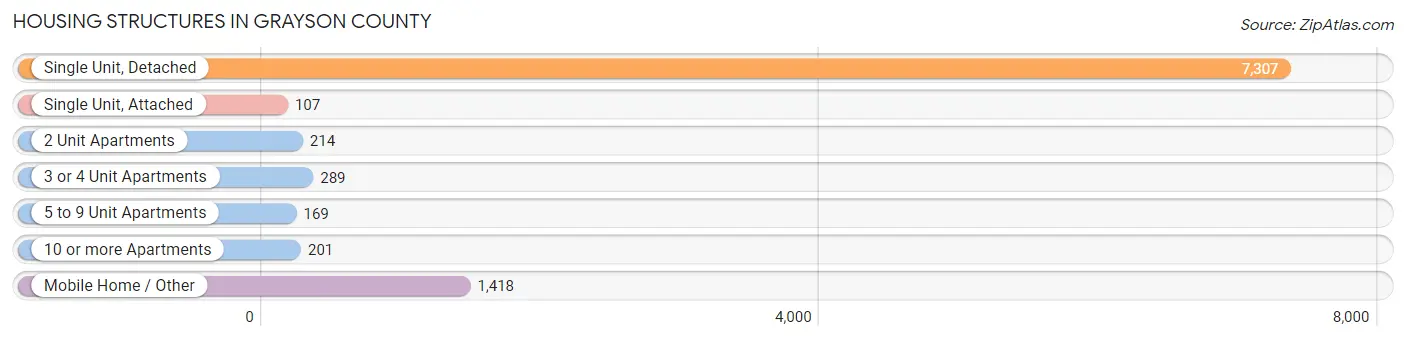
| Structure Type | # Housing Units | % Housing Units |
| Single Unit, Detached | 7,307 | 75.3% |
| Single Unit, Attached | 107 | 1.1% |
| 2 Unit Apartments | 214 | 2.2% |
| 3 or 4 Unit Apartments | 289 | 3.0% |
| 5 to 9 Unit Apartments | 169 | 1.7% |
| 10 or more Apartments | 201 | 2.1% |
| Mobile Home / Other | 1,418 | 14.6% |
| Total | 9,705 | 100.0% |
Housing Structures by Occupancy in Grayson County
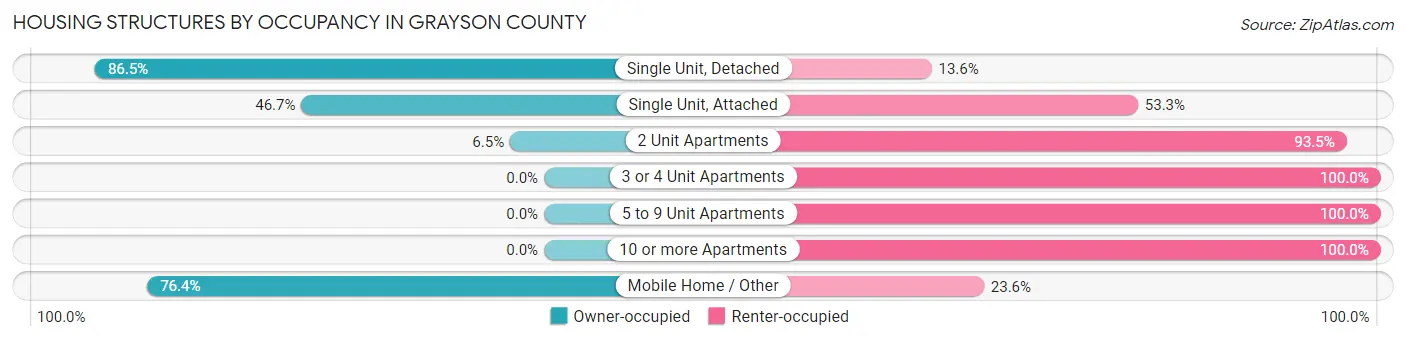
| Structure Type | Owner-occupied | Renter-occupied |
| Single Unit, Detached | 6,317 (86.5%) | 990 (13.6%) |
| Single Unit, Attached | 50 (46.7%) | 57 (53.3%) |
| 2 Unit Apartments | 14 (6.5%) | 200 (93.5%) |
| 3 or 4 Unit Apartments | 0 (0.0%) | 289 (100.0%) |
| 5 to 9 Unit Apartments | 0 (0.0%) | 169 (100.0%) |
| 10 or more Apartments | 0 (0.0%) | 201 (100.0%) |
| Mobile Home / Other | 1,083 (76.4%) | 335 (23.6%) |
| Total | 7,464 (76.9%) | 2,241 (23.1%) |
Housing Structures by Number of Rooms in Grayson County
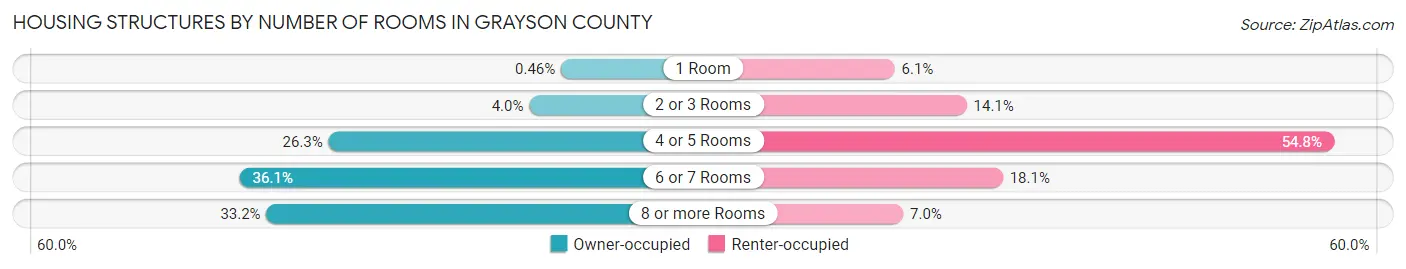
| Number of Rooms | Owner-occupied | Renter-occupied |
| 1 Room | 34 (0.5%) | 136 (6.1%) |
| 2 or 3 Rooms | 298 (4.0%) | 315 (14.1%) |
| 4 or 5 Rooms | 1,960 (26.3%) | 1,228 (54.8%) |
| 6 or 7 Rooms | 2,697 (36.1%) | 405 (18.1%) |
| 8 or more Rooms | 2,475 (33.2%) | 157 (7.0%) |
| Total | 7,464 (100.0%) | 2,241 (100.0%) |
Housing Structure by Heating Type in Grayson County
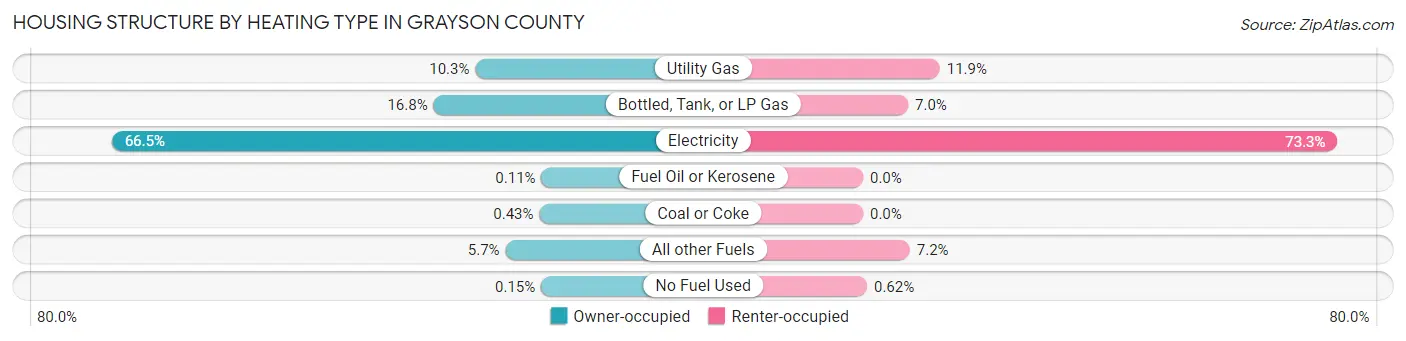
| Heating Type | Owner-occupied | Renter-occupied |
| Utility Gas | 771 (10.3%) | 266 (11.9%) |
| Bottled, Tank, or LP Gas | 1,253 (16.8%) | 156 (7.0%) |
| Electricity | 4,966 (66.5%) | 1,643 (73.3%) |
| Fuel Oil or Kerosene | 8 (0.1%) | 0 (0.0%) |
| Coal or Coke | 32 (0.4%) | 0 (0.0%) |
| All other Fuels | 423 (5.7%) | 162 (7.2%) |
| No Fuel Used | 11 (0.2%) | 14 (0.6%) |
| Total | 7,464 (100.0%) | 2,241 (100.0%) |
Household Vehicle Usage in Grayson County
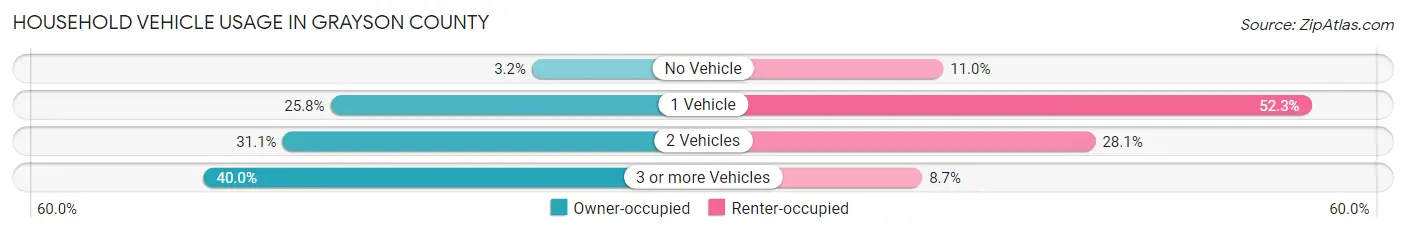
| Vehicles per Household | Owner-occupied | Renter-occupied |
| No Vehicle | 237 (3.2%) | 247 (11.0%) |
| 1 Vehicle | 1,922 (25.8%) | 1,171 (52.2%) |
| 2 Vehicles | 2,323 (31.1%) | 629 (28.1%) |
| 3 or more Vehicles | 2,982 (40.0%) | 194 (8.7%) |
| Total | 7,464 (100.0%) | 2,241 (100.0%) |
Real Estate & Mortgages in Grayson County
Real Estate and Mortgage Overview in Grayson County
| Characteristic | Without Mortgage | With Mortgage |
| Housing Units | 4,134 | 3,330 |
| Median Property Value | $122,700 | $166,500 |
| Median Household Income | $45,404 | $473 |
| Monthly Housing Costs | $386 | $57 |
| Real Estate Taxes | $685 | $196 |
Property Value by Mortgage Status in Grayson County
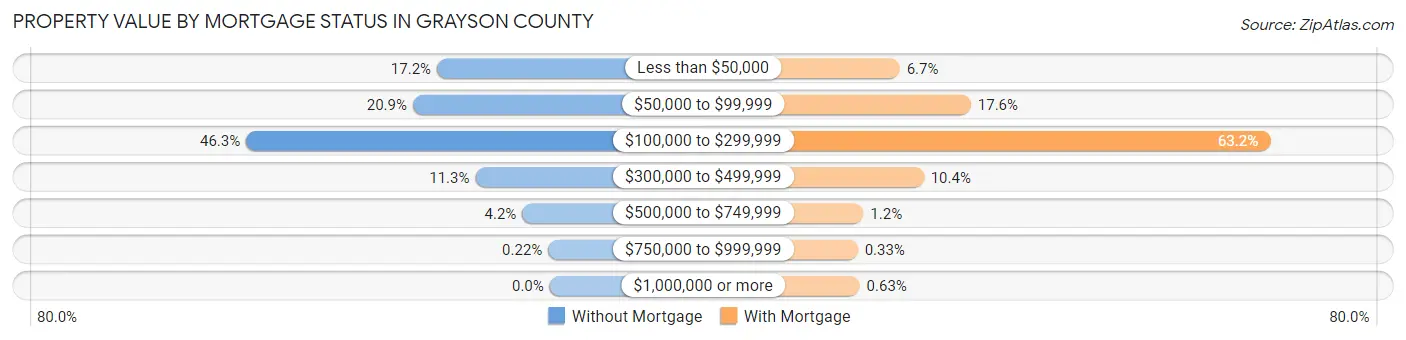
| Property Value | Without Mortgage | With Mortgage |
| Less than $50,000 | 710 (17.2%) | 224 (6.7%) |
| $50,000 to $99,999 | 862 (20.8%) | 585 (17.6%) |
| $100,000 to $299,999 | 1,912 (46.3%) | 2,103 (63.1%) |
| $300,000 to $499,999 | 468 (11.3%) | 346 (10.4%) |
| $500,000 to $749,999 | 173 (4.2%) | 40 (1.2%) |
| $750,000 to $999,999 | 9 (0.2%) | 11 (0.3%) |
| $1,000,000 or more | 0 (0.0%) | 21 (0.6%) |
| Total | 4,134 (100.0%) | 3,330 (100.0%) |
Household Income by Mortgage Status in Grayson County
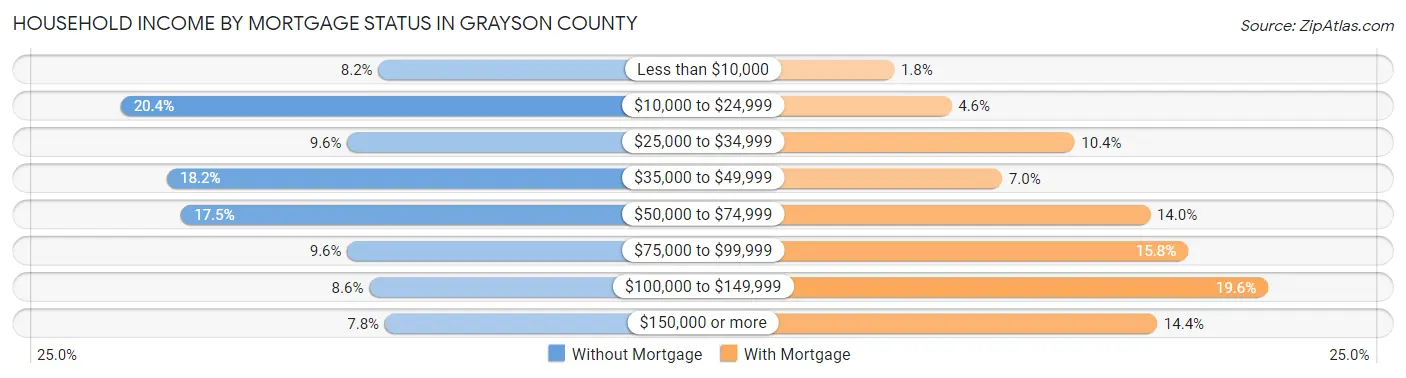
| Household Income | Without Mortgage | With Mortgage |
| Less than $10,000 | 337 (8.2%) | 61 (1.8%) |
| $10,000 to $24,999 | 844 (20.4%) | 152 (4.6%) |
| $25,000 to $34,999 | 398 (9.6%) | 347 (10.4%) |
| $35,000 to $49,999 | 753 (18.2%) | 232 (7.0%) |
| $50,000 to $74,999 | 725 (17.5%) | 467 (14.0%) |
| $75,000 to $99,999 | 398 (9.6%) | 527 (15.8%) |
| $100,000 to $149,999 | 355 (8.6%) | 654 (19.6%) |
| $150,000 or more | 324 (7.8%) | 478 (14.3%) |
| Total | 4,134 (100.0%) | 3,330 (100.0%) |
Property Value to Household Income Ratio in Grayson County
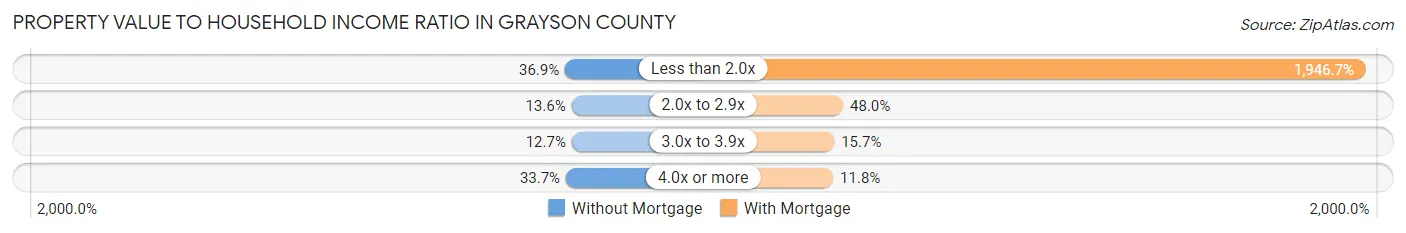
| Value-to-Income Ratio | Without Mortgage | With Mortgage |
| Less than 2.0x | 1,525 (36.9%) | 64,824 (1,946.7%) |
| 2.0x to 2.9x | 560 (13.6%) | 1,597 (48.0%) |
| 3.0x to 3.9x | 523 (12.7%) | 524 (15.7%) |
| 4.0x or more | 1,393 (33.7%) | 392 (11.8%) |
| Total | 4,134 (100.0%) | 3,330 (100.0%) |
Real Estate Taxes by Mortgage Status in Grayson County
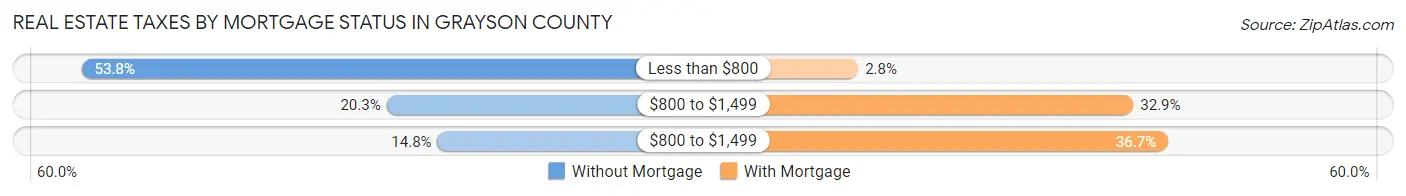
| Property Taxes | Without Mortgage | With Mortgage |
| Less than $800 | 2,222 (53.7%) | 92 (2.8%) |
| $800 to $1,499 | 841 (20.3%) | 1,096 (32.9%) |
| $800 to $1,499 | 610 (14.8%) | 1,222 (36.7%) |
| Total | 4,134 (100.0%) | 3,330 (100.0%) |
Health & Disability in Grayson County
Health Insurance Coverage by Age in Grayson County
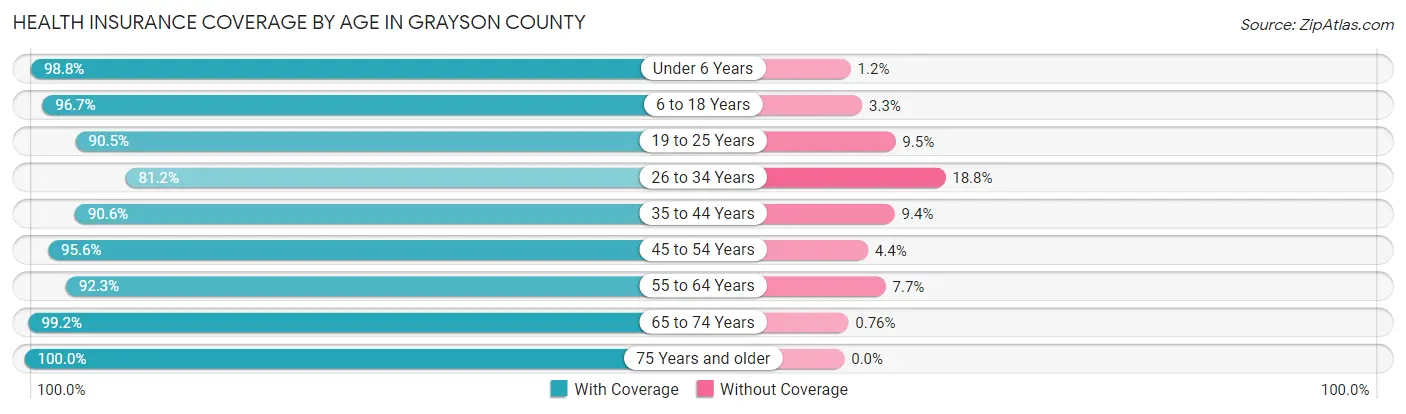
| Age Bracket | With Coverage | Without Coverage |
| Under 6 Years | 1,905 (98.8%) | 23 (1.2%) |
| 6 to 18 Years | 4,452 (96.7%) | 153 (3.3%) |
| 19 to 25 Years | 1,993 (90.5%) | 210 (9.5%) |
| 26 to 34 Years | 2,249 (81.2%) | 522 (18.8%) |
| 35 to 44 Years | 2,732 (90.6%) | 283 (9.4%) |
| 45 to 54 Years | 3,088 (95.6%) | 142 (4.4%) |
| 55 to 64 Years | 3,391 (92.3%) | 283 (7.7%) |
| 65 to 74 Years | 2,861 (99.2%) | 22 (0.8%) |
| 75 Years and older | 1,713 (100.0%) | 0 (0.0%) |
| Total | 24,384 (93.7%) | 1,638 (6.3%) |
Health Insurance Coverage by Citizenship Status in Grayson County
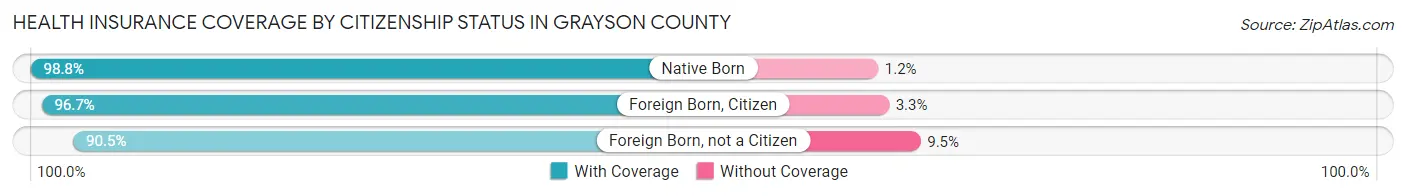
| Citizenship Status | With Coverage | Without Coverage |
| Native Born | 1,905 (98.8%) | 23 (1.2%) |
| Foreign Born, Citizen | 4,452 (96.7%) | 153 (3.3%) |
| Foreign Born, not a Citizen | 1,993 (90.5%) | 210 (9.5%) |
Health Insurance Coverage by Household Income in Grayson County
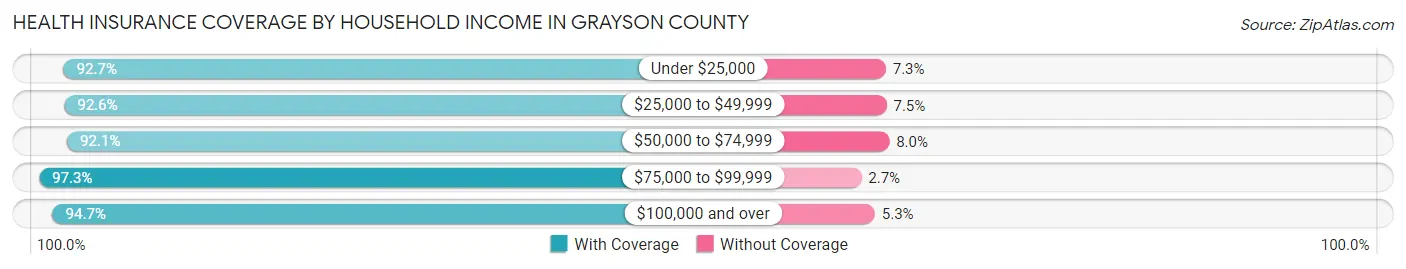
| Household Income | With Coverage | Without Coverage |
| Under $25,000 | 4,629 (92.7%) | 365 (7.3%) |
| $25,000 to $49,999 | 5,885 (92.5%) | 474 (7.4%) |
| $50,000 to $74,999 | 4,155 (92.0%) | 359 (8.0%) |
| $75,000 to $99,999 | 3,573 (97.3%) | 100 (2.7%) |
| $100,000 and over | 6,130 (94.7%) | 340 (5.3%) |
Public vs Private Health Insurance Coverage by Age in Grayson County
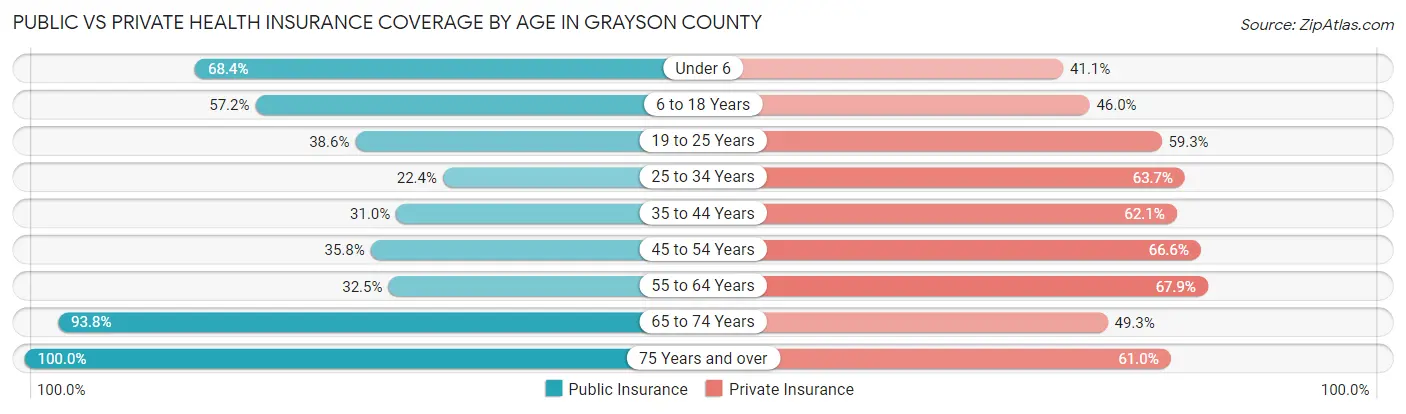
| Age Bracket | Public Insurance | Private Insurance |
| Under 6 | 1,318 (68.4%) | 792 (41.1%) |
| 6 to 18 Years | 2,633 (57.2%) | 2,117 (46.0%) |
| 19 to 25 Years | 851 (38.6%) | 1,307 (59.3%) |
| 25 to 34 Years | 620 (22.4%) | 1,764 (63.7%) |
| 35 to 44 Years | 936 (31.0%) | 1,873 (62.1%) |
| 45 to 54 Years | 1,156 (35.8%) | 2,152 (66.6%) |
| 55 to 64 Years | 1,194 (32.5%) | 2,495 (67.9%) |
| 65 to 74 Years | 2,704 (93.8%) | 1,422 (49.3%) |
| 75 Years and over | 1,713 (100.0%) | 1,045 (61.0%) |
| Total | 13,125 (50.4%) | 14,967 (57.5%) |
Disability Status by Sex by Age in Grayson County
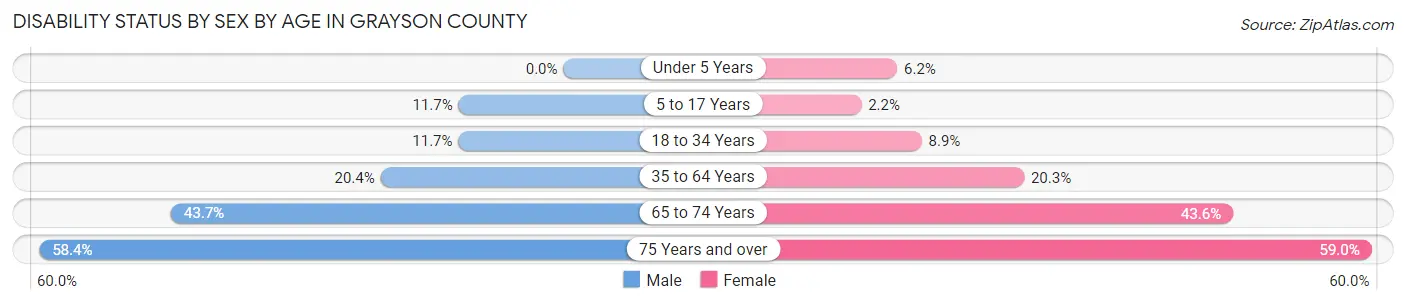
| Age Bracket | Male | Female |
| Under 5 Years | 0 (0.0%) | 52 (6.2%) |
| 5 to 17 Years | 274 (11.7%) | 49 (2.2%) |
| 18 to 34 Years | 297 (11.7%) | 237 (8.9%) |
| 35 to 64 Years | 1,012 (20.4%) | 1,004 (20.3%) |
| 65 to 74 Years | 621 (43.7%) | 637 (43.6%) |
| 75 Years and over | 422 (58.4%) | 584 (59.0%) |
Disability Class by Sex by Age in Grayson County
Disability Class: Hearing Difficulty
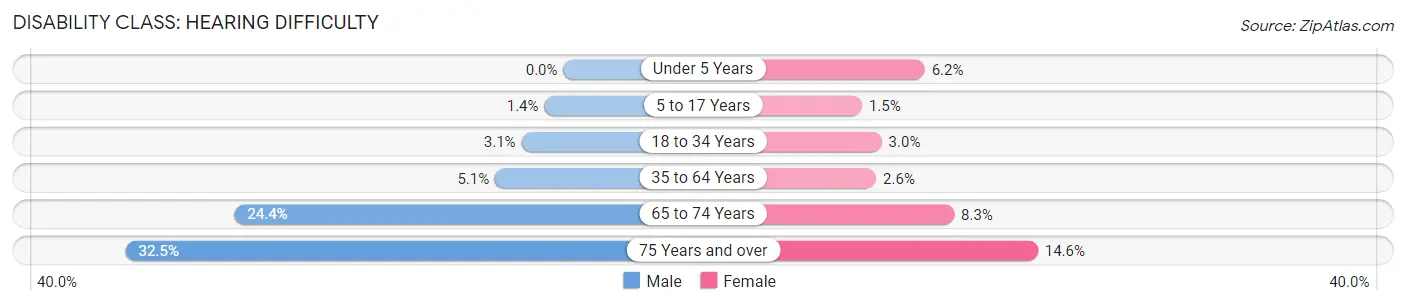
| Age Bracket | Male | Female |
| Under 5 Years | 0 (0.0%) | 52 (6.2%) |
| 5 to 17 Years | 33 (1.4%) | 34 (1.5%) |
| 18 to 34 Years | 79 (3.1%) | 79 (3.0%) |
| 35 to 64 Years | 252 (5.1%) | 126 (2.5%) |
| 65 to 74 Years | 347 (24.4%) | 122 (8.3%) |
| 75 Years and over | 235 (32.5%) | 144 (14.5%) |
Disability Class: Vision Difficulty
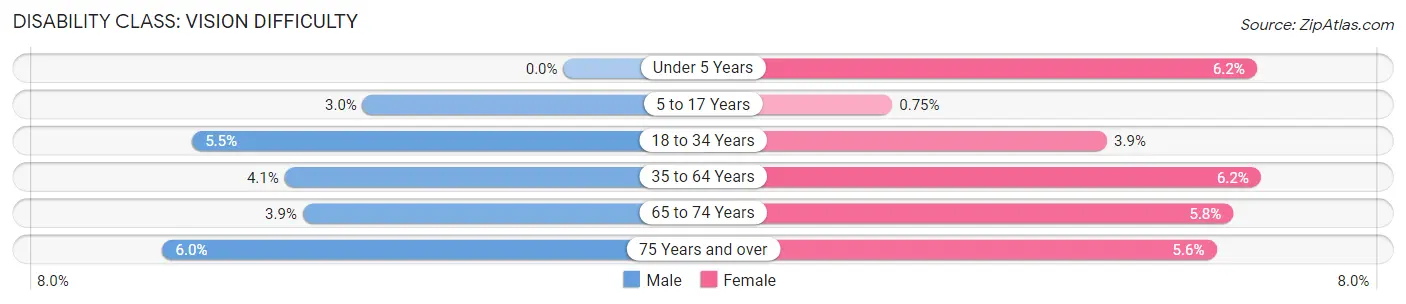
| Age Bracket | Male | Female |
| Under 5 Years | 0 (0.0%) | 52 (6.2%) |
| 5 to 17 Years | 70 (3.0%) | 17 (0.7%) |
| 18 to 34 Years | 140 (5.5%) | 105 (3.9%) |
| 35 to 64 Years | 206 (4.1%) | 308 (6.2%) |
| 65 to 74 Years | 55 (3.9%) | 85 (5.8%) |
| 75 Years and over | 43 (5.9%) | 55 (5.6%) |
Disability Class: Cognitive Difficulty
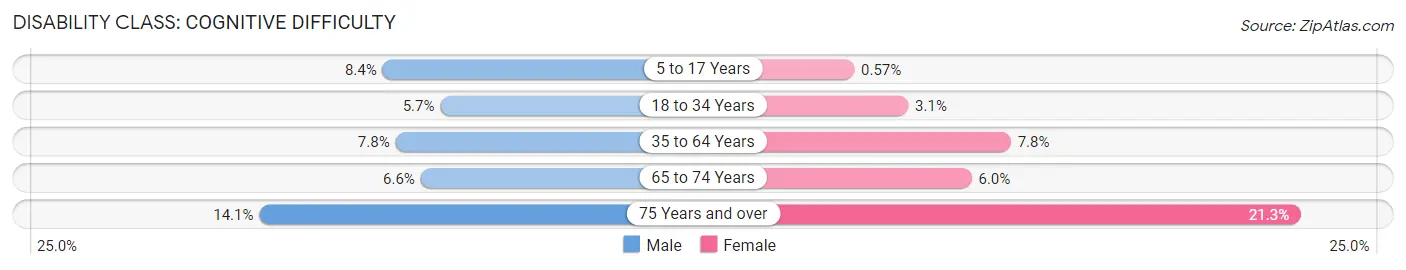
| Age Bracket | Male | Female |
| 5 to 17 Years | 197 (8.4%) | 13 (0.6%) |
| 18 to 34 Years | 145 (5.7%) | 82 (3.1%) |
| 35 to 64 Years | 387 (7.8%) | 388 (7.8%) |
| 65 to 74 Years | 94 (6.6%) | 88 (6.0%) |
| 75 Years and over | 102 (14.1%) | 211 (21.3%) |
Disability Class: Ambulatory Difficulty

| Age Bracket | Male | Female |
| 5 to 17 Years | 0 (0.0%) | 0 (0.0%) |
| 18 to 34 Years | 100 (3.9%) | 43 (1.6%) |
| 35 to 64 Years | 553 (11.1%) | 570 (11.5%) |
| 65 to 74 Years | 291 (20.5%) | 492 (33.7%) |
| 75 Years and over | 243 (33.6%) | 445 (45.0%) |
Disability Class: Self-Care Difficulty
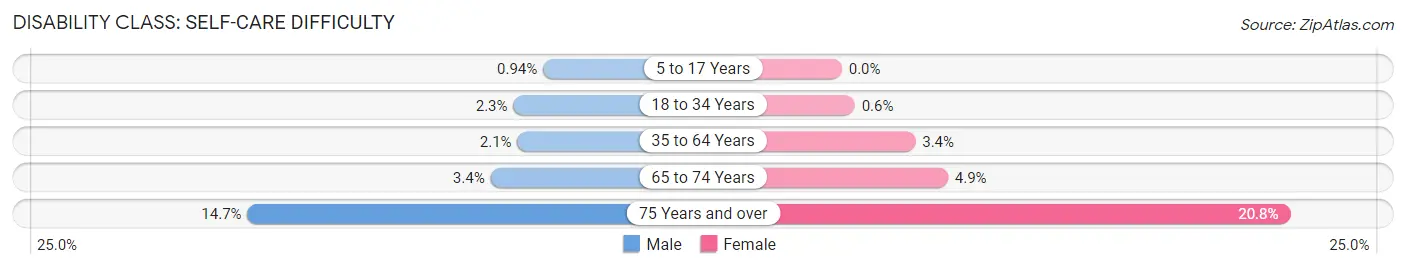
| Age Bracket | Male | Female |
| 5 to 17 Years | 22 (0.9%) | 0 (0.0%) |
| 18 to 34 Years | 59 (2.3%) | 16 (0.6%) |
| 35 to 64 Years | 106 (2.1%) | 169 (3.4%) |
| 65 to 74 Years | 48 (3.4%) | 72 (4.9%) |
| 75 Years and over | 106 (14.7%) | 206 (20.8%) |
Technology Access in Grayson County
Computing Device Access in Grayson County
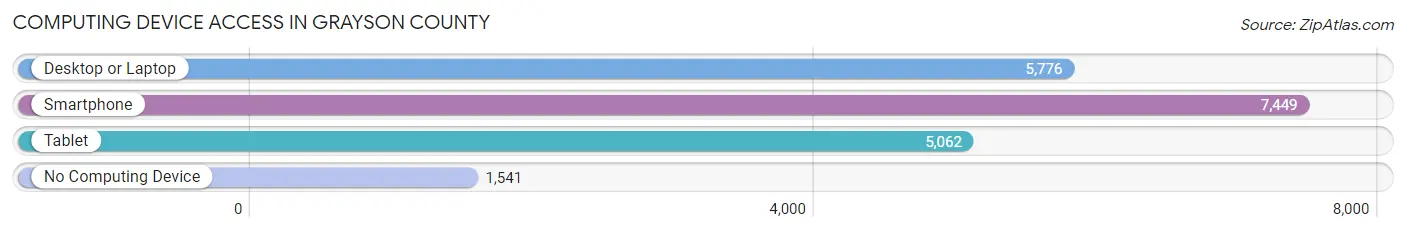
| Device Type | # Households | % Households |
| Desktop or Laptop | 5,776 | 59.5% |
| Smartphone | 7,449 | 76.7% |
| Tablet | 5,062 | 52.2% |
| No Computing Device | 1,541 | 15.9% |
| Total | 9,705 | 100.0% |
Internet Access in Grayson County
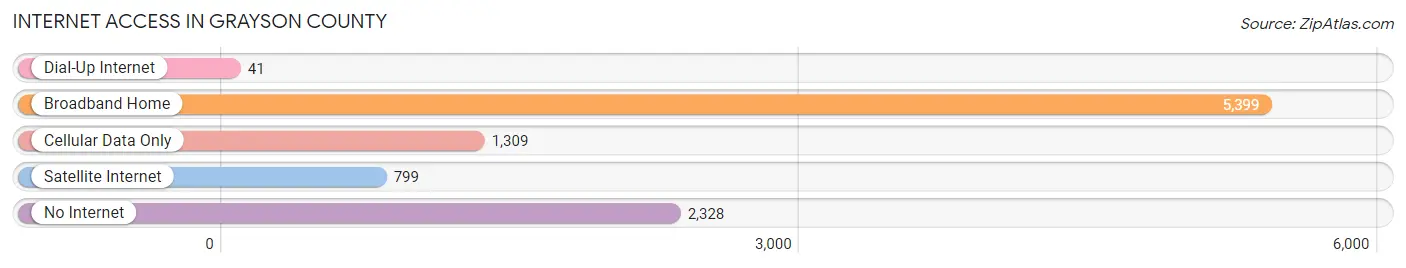
| Internet Type | # Households | % Households |
| Dial-Up Internet | 41 | 0.4% |
| Broadband Home | 5,399 | 55.6% |
| Cellular Data Only | 1,309 | 13.5% |
| Satellite Internet | 799 | 8.2% |
| No Internet | 2,328 | 24.0% |
| Total | 9,705 | 100.0% |
Grayson County Summary
Grayson County is located in the western part of Kentucky, in the Jackson Purchase region. It is bordered by Ohio and Indiana to the north, and by the Green and Rough Rivers to the east and south. The county seat is Leitchfield, and the county has a population of approximately 25,000 people.
History
Grayson County was formed in 1810 from parts of Hardin and Ohio counties. It was named for William Grayson, a Revolutionary War veteran and one of the first two United States senators from Virginia. The county was originally part of the Chickasaw Nation, and the area was home to several Native American tribes, including the Shawnee, Cherokee, and Chickasaw.
The first settlers in the area were mostly farmers from Virginia, North Carolina, and Tennessee. They were attracted to the area by the fertile soil and abundant wildlife. The county was largely agricultural until the late 19th century, when coal mining began to take off. The coal industry was the main source of employment in the county until the mid-20th century, when it began to decline.
Geography
Grayson County is located in the western part of Kentucky, in the Jackson Purchase region. It is bordered by Ohio and Indiana to the north, and by the Green and Rough Rivers to the east and south. The county has a total area of 441 square miles, of which 437 square miles is land and 4 square miles is water. The terrain is mostly rolling hills, with some flat areas in the northern part of the county.
The county is home to several state parks, including Nolin Lake State Park, Rough River Dam State Resort Park, and Grayson Lake State Park. The county also has several lakes, including Nolin Lake, Rough River Lake, and Grayson Lake.
Economy
Grayson County’s economy is largely based on agriculture and manufacturing. The county’s main agricultural products are corn, soybeans, wheat, hay, and tobacco. The county is also home to several manufacturing companies, including a furniture factory, a plastics factory, and a metal fabrication plant.
The county also has a growing tourism industry, with several state parks and lakes attracting visitors from across the region. The county is also home to several wineries, and the annual Grayson County Fair is a popular event.
Demographics
As of the 2010 census, the population of Grayson County was 25,746. The racial makeup of the county was 95.3% White, 1.7% Black or African American, 0.3% Native American, 0.3% Asian, 0.1% Pacific Islander, 1.2% from other races, and 1.2% from two or more races. Hispanic or Latino of any race were 2.7% of the population.
The median household income in the county was $37,945, and the median family income was $45,945. The per capita income was $19,945. About 15.3% of the population was below the poverty line.
Grayson County is a rural county with a diverse economy and a rich history. The county is home to several state parks and lakes, and the county’s economy is largely based on agriculture and manufacturing. The county has a population of approximately 25,000 people, and the median household income is $37,945.
Common Questions
What is Per Capita Income in Grayson County?
Per Capita income in Grayson County is $25,565.
What is the Median Family Income in Grayson County?
Median Family Income in Grayson County is $58,638.
What is the Median Household income in Grayson County?
Median Household Income in Grayson County is $47,024.
What is Income or Wage Gap in Grayson County?
Income or Wage Gap in Grayson County is 30.5%.
Women in Grayson County earn 69.5 cents for every dollar earned by a man.
What is Family Income Deficit in Grayson County?
Family Income Deficit in Grayson County is $11,539.
Families that are below poverty line in Grayson County earn $11,539 less on average than the poverty threshold level.
What is Inequality or Gini Index in Grayson County?
Inequality or Gini Index in Grayson County is 0.48.
What is the Total Population of Grayson County?
Total Population of Grayson County is 26,465.
What is the Total Male Population of Grayson County?
Total Male Population of Grayson County is 13,178.
What is the Total Female Population of Grayson County?
Total Female Population of Grayson County is 13,287.
What is the Ratio of Males per 100 Females in Grayson County?
There are 99.18 Males per 100 Females in Grayson County.
What is the Ratio of Females per 100 Males in Grayson County?
There are 100.83 Females per 100 Males in Grayson County.
What is the Median Population Age in Grayson County?
Median Population Age in Grayson County is 40.0 Years.
What is the Average Family Size in Grayson County
Average Family Size in Grayson County is 3.4 People.
What is the Average Household Size in Grayson County
Average Household Size in Grayson County is 2.7 People.
How Large is the Labor Force in Grayson County?
There are 11,192 People in the Labor Forcein in Grayson County.
What is the Percentage of People in the Labor Force in Grayson County?
53.4% of People are in the Labor Force in Grayson County.
What is the Unemployment Rate in Grayson County?
Unemployment Rate in Grayson County is 4.8%.