Garrard County, KY Map & Demographics
Garrard County Overview
$30,728
PER CAPITA INCOME
$68,351
AVG FAMILY INCOME
$58,263
AVG HOUSEHOLD INCOME
28.4%
WAGE / INCOME GAP [ % ]
71.6¢/ $1
WAGE / INCOME GAP [ $ ]
0.45
INEQUALITY / GINI INDEX
17,175
TOTAL POPULATION
8,444
MALE POPULATION
8,731
FEMALE POPULATION
96.71
MALES / 100 FEMALES
103.40
FEMALES / 100 MALES
43.5
MEDIAN AGE
3.1
AVG FAMILY SIZE
2.6
AVG HOUSEHOLD SIZE
7,611
LABOR FORCE [ PEOPLE ]
54.9%
PERCENT IN LABOR FORCE
5.3%
UNEMPLOYMENT RATE
Garrard County Area Codes
Income in Garrard County
Income Overview in Garrard County
Per Capita Income in Garrard County is $30,728, while median incomes of families and households are $68,351 and $58,263 respectively.
| Characteristic | Number | Measure |
| Per Capita Income | 17,175 | $30,728 |
| Median Family Income | 4,705 | $68,351 |
| Mean Family Income | 4,705 | $85,983 |
| Median Household Income | 6,488 | $58,263 |
| Mean Household Income | 6,488 | $79,557 |
| Income Deficit | 4,705 | $0 |
| Wage / Income Gap (%) | 17,175 | 28.35% |
| Wage / Income Gap ($) | 17,175 | 71.65¢ per $1 |
| Gini / Inequality Index | 17,175 | 0.45 |
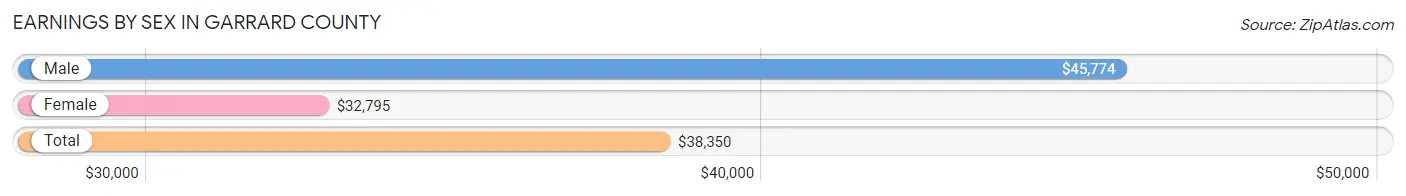
Earnings by Sex in Garrard County
Average Earnings in Garrard County are $38,350, $45,774 for men and $32,795 for women, a difference of 28.3%.
| Sex | Number | Average Earnings |
| Male | 4,354 (54.8%) | $45,774 |
| Female | 3,587 (45.2%) | $32,795 |
| Total | 7,941 (100.0%) | $38,350 |
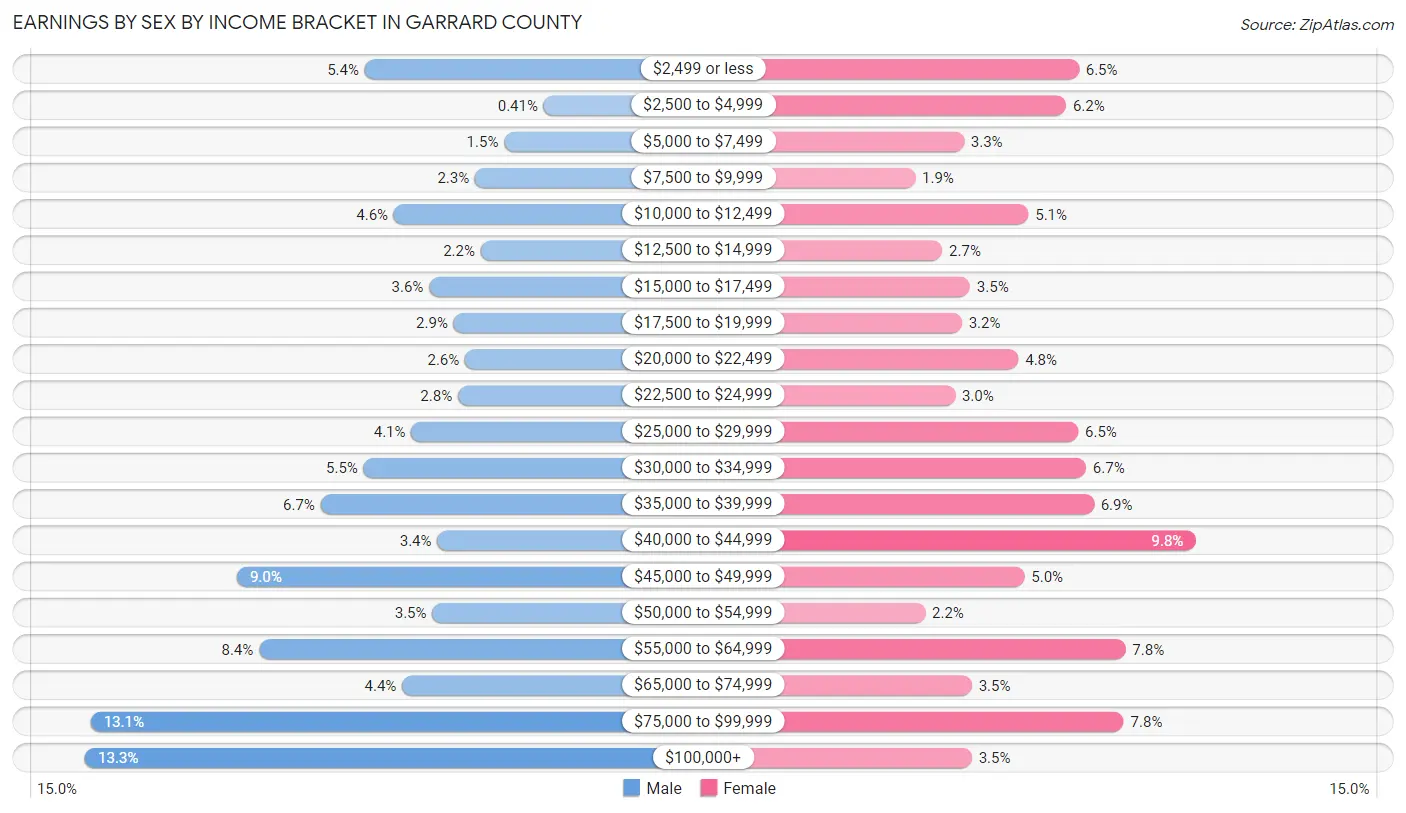
Earnings by Sex by Income Bracket in Garrard County
The most common earnings brackets in Garrard County are $100,000+ for men (579 | 13.3%) and $40,000 to $44,999 for women (351 | 9.8%).
| Income | Male | Female |
| $2,499 or less | 237 (5.4%) | 234 (6.5%) |
| $2,500 to $4,999 | 18 (0.4%) | 221 (6.2%) |
| $5,000 to $7,499 | 66 (1.5%) | 118 (3.3%) |
| $7,500 to $9,999 | 102 (2.3%) | 69 (1.9%) |
| $10,000 to $12,499 | 201 (4.6%) | 183 (5.1%) |
| $12,500 to $14,999 | 95 (2.2%) | 96 (2.7%) |
| $15,000 to $17,499 | 158 (3.6%) | 124 (3.5%) |
| $17,500 to $19,999 | 128 (2.9%) | 116 (3.2%) |
| $20,000 to $22,499 | 114 (2.6%) | 173 (4.8%) |
| $22,500 to $24,999 | 123 (2.8%) | 109 (3.0%) |
| $25,000 to $29,999 | 180 (4.1%) | 233 (6.5%) |
| $30,000 to $34,999 | 238 (5.5%) | 241 (6.7%) |
| $35,000 to $39,999 | 291 (6.7%) | 249 (6.9%) |
| $40,000 to $44,999 | 148 (3.4%) | 351 (9.8%) |
| $45,000 to $49,999 | 393 (9.0%) | 179 (5.0%) |
| $50,000 to $54,999 | 154 (3.5%) | 79 (2.2%) |
| $55,000 to $64,999 | 366 (8.4%) | 281 (7.8%) |
| $65,000 to $74,999 | 191 (4.4%) | 126 (3.5%) |
| $75,000 to $99,999 | 572 (13.1%) | 279 (7.8%) |
| $100,000+ | 579 (13.3%) | 126 (3.5%) |
| Total | 4,354 (100.0%) | 3,587 (100.0%) |
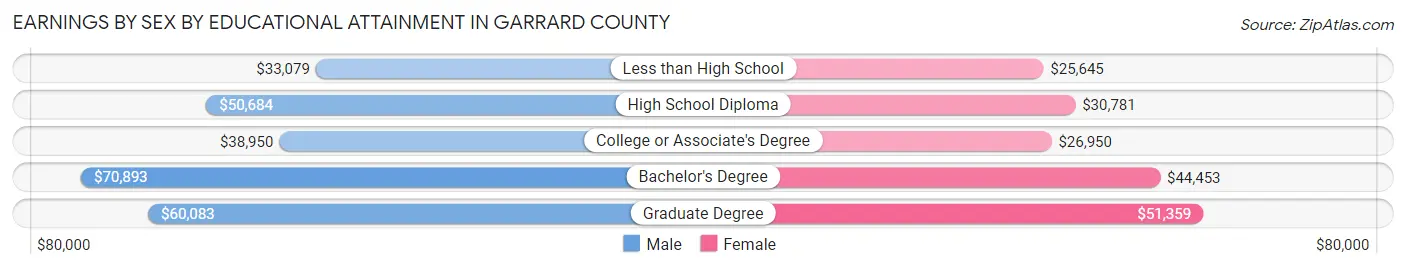
Earnings by Sex by Educational Attainment in Garrard County
Average earnings in Garrard County are $47,748 for men and $35,433 for women, a difference of 25.8%. Men with an educational attainment of bachelor's degree enjoy the highest average annual earnings of $70,893, while those with less than high school education earn the least with $33,079. Women with an educational attainment of graduate degree earn the most with the average annual earnings of $51,359, while those with less than high school education have the smallest earnings of $25,645.
| Educational Attainment | Male Income | Female Income |
| Less than High School | $33,079 | $25,645 |
| High School Diploma | $50,684 | $30,781 |
| College or Associate's Degree | $38,950 | $26,950 |
| Bachelor's Degree | $70,893 | $44,453 |
| Graduate Degree | $60,083 | $51,359 |
| Total | $47,748 | $35,433 |
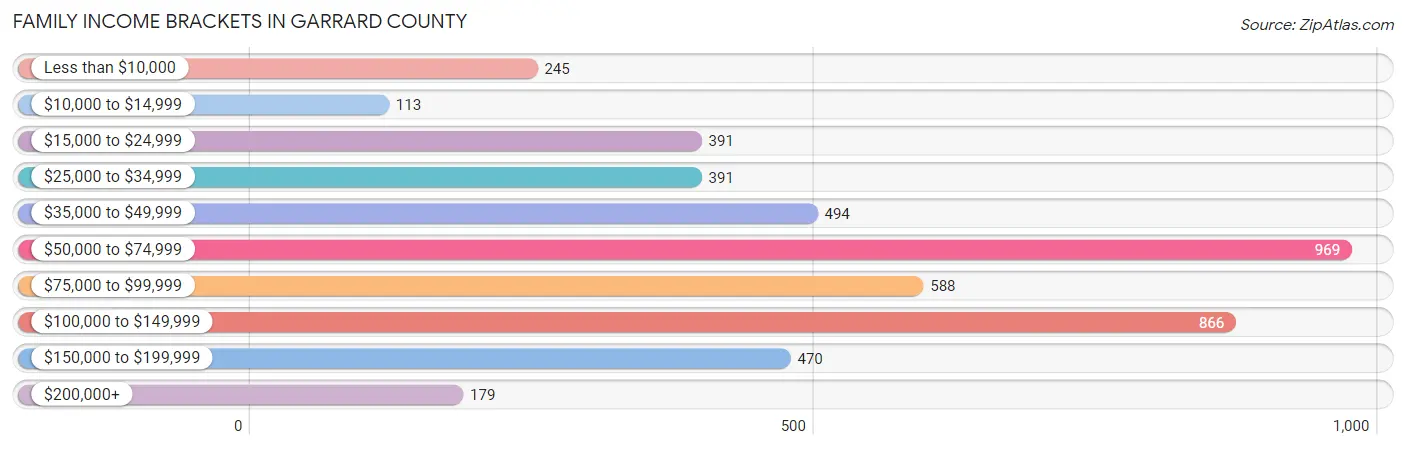
Family Income in Garrard County
Family Income Brackets in Garrard County
According to the Garrard County family income data, there are 969 families falling into the $50,000 to $74,999 income range, which is the most common income bracket and makes up 20.6% of all families. Conversely, the $10,000 to $14,999 income bracket is the least frequent group with only 113 families (2.4%) belonging to this category.
| Income Bracket | # Families | % Families |
| Less than $10,000 | 245 | 5.2% |
| $10,000 to $14,999 | 113 | 2.4% |
| $15,000 to $24,999 | 391 | 8.3% |
| $25,000 to $34,999 | 391 | 8.3% |
| $35,000 to $49,999 | 494 | 10.5% |
| $50,000 to $74,999 | 969 | 20.6% |
| $75,000 to $99,999 | 588 | 12.5% |
| $100,000 to $149,999 | 866 | 18.4% |
| $150,000 to $199,999 | 470 | 10.0% |
| $200,000+ | 179 | 3.8% |
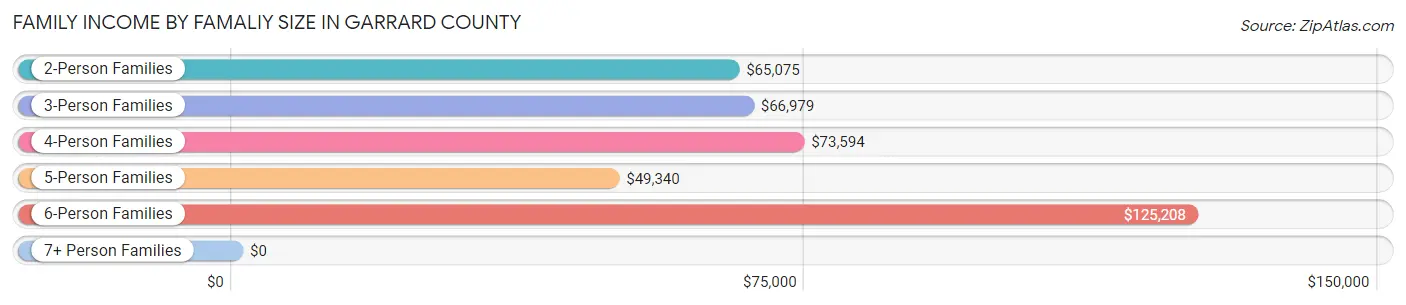
Family Income by Famaliy Size in Garrard County
6-person families (226 | 4.8%) account for the highest median family income in Garrard County with $125,208 per family, while 2-person families (2,198 | 46.7%) have the highest median income of $32,538 per family member.
| Income Bracket | # Families | Median Income |
| 2-Person Families | 2,198 (46.7%) | $65,075 |
| 3-Person Families | 1,104 (23.5%) | $66,979 |
| 4-Person Families | 864 (18.4%) | $73,594 |
| 5-Person Families | 231 (4.9%) | $49,340 |
| 6-Person Families | 226 (4.8%) | $125,208 |
| 7+ Person Families | 82 (1.7%) | $0 |
| Total | 4,705 (100.0%) | $68,351 |
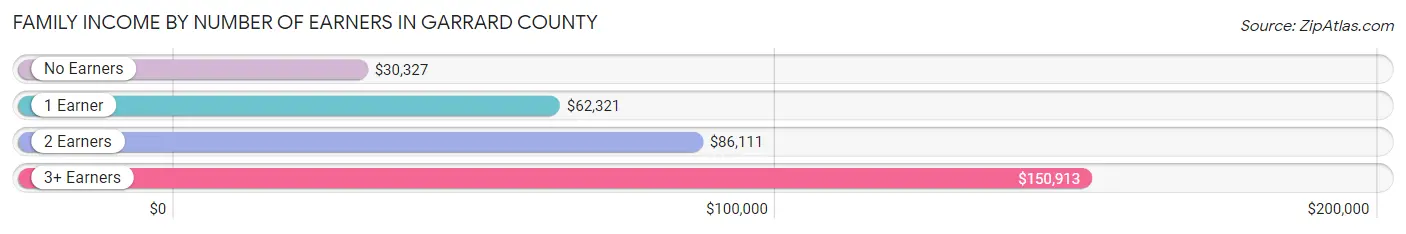
Family Income by Number of Earners in Garrard County
The median family income in Garrard County is $68,351, with families comprising 3+ earners (349) having the highest median family income of $150,913, while families with no earners (1,064) have the lowest median family income of $30,327, accounting for 7.4% and 22.6% of families, respectively.
| Number of Earners | # Families | Median Income |
| No Earners | 1,064 (22.6%) | $30,327 |
| 1 Earner | 1,638 (34.8%) | $62,321 |
| 2 Earners | 1,654 (35.1%) | $86,111 |
| 3+ Earners | 349 (7.4%) | $150,913 |
| Total | 4,705 (100.0%) | $68,351 |
Household Income in Garrard County
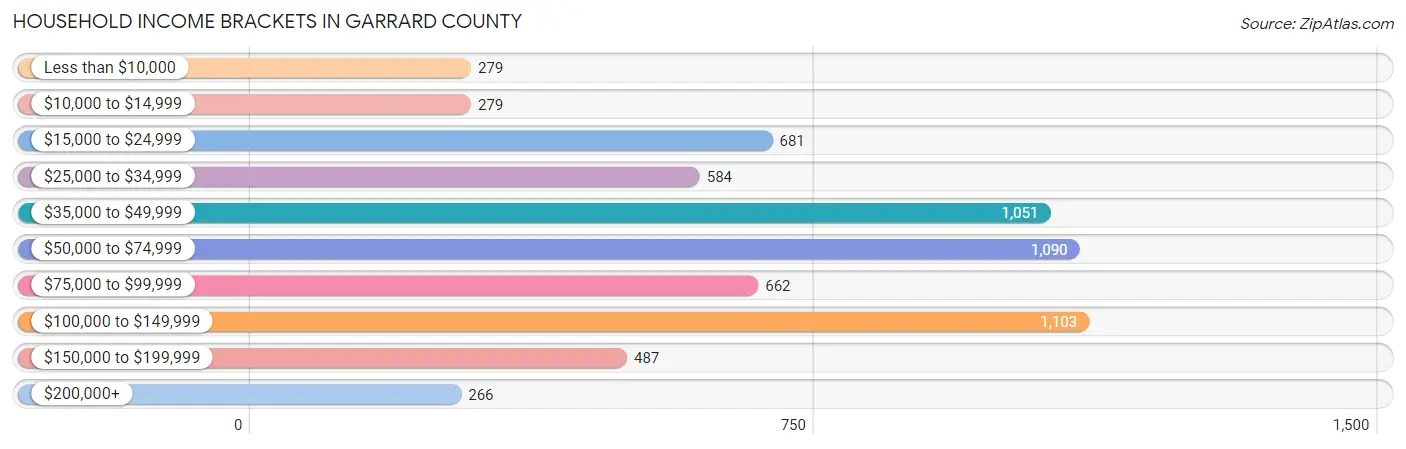
Household Income Brackets in Garrard County
With 1,103 households falling in the category, the $100,000 to $149,999 income range is the most frequent in Garrard County, accounting for 17.0% of all households. In contrast, only 266 households (4.1%) fall into the $200,000+ income bracket, making it the least populous group.
| Income Bracket | # Households | % Households |
| Less than $10,000 | 279 | 4.3% |
| $10,000 to $14,999 | 279 | 4.3% |
| $15,000 to $24,999 | 681 | 10.5% |
| $25,000 to $34,999 | 584 | 9.0% |
| $35,000 to $49,999 | 1,051 | 16.2% |
| $50,000 to $74,999 | 1,090 | 16.8% |
| $75,000 to $99,999 | 662 | 10.2% |
| $100,000 to $149,999 | 1,103 | 17.0% |
| $150,000 to $199,999 | 487 | 7.5% |
| $200,000+ | 266 | 4.1% |
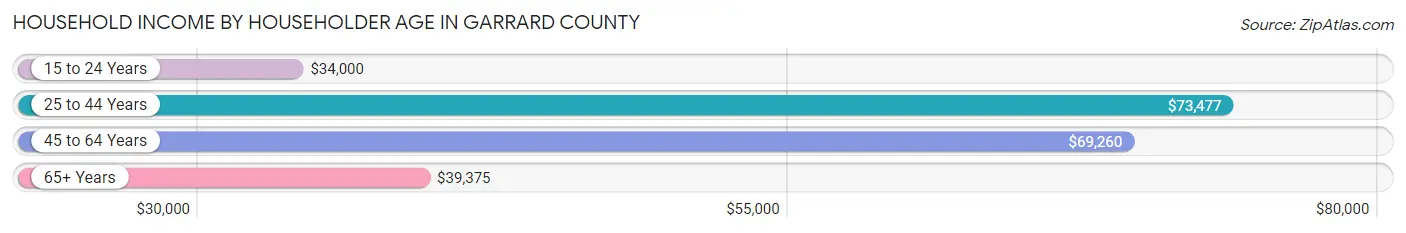
Household Income by Householder Age in Garrard County
The median household income in Garrard County is $58,263, with the highest median household income of $73,477 found in the 25 to 44 years age bracket for the primary householder. A total of 1,865 households (28.7%) fall into this category. Meanwhile, the 15 to 24 years age bracket for the primary householder has the lowest median household income of $34,000, with 70 households (1.1%) in this group.
| Income Bracket | # Households | Median Income |
| 15 to 24 Years | 70 (1.1%) | $34,000 |
| 25 to 44 Years | 1,865 (28.7%) | $73,477 |
| 45 to 64 Years | 2,697 (41.6%) | $69,260 |
| 65+ Years | 1,856 (28.6%) | $39,375 |
| Total | 6,488 (100.0%) | $58,263 |
Poverty in Garrard County
Income Below Poverty by Sex and Age in Garrard County
With 13.6% poverty level for males and 17.7% for females among the residents of Garrard County, 6 to 11 year old males and 18 to 24 year old females are the most vulnerable to poverty, with 166 males (27.3%) and 202 females (33.7%) in their respective age groups living below the poverty level.
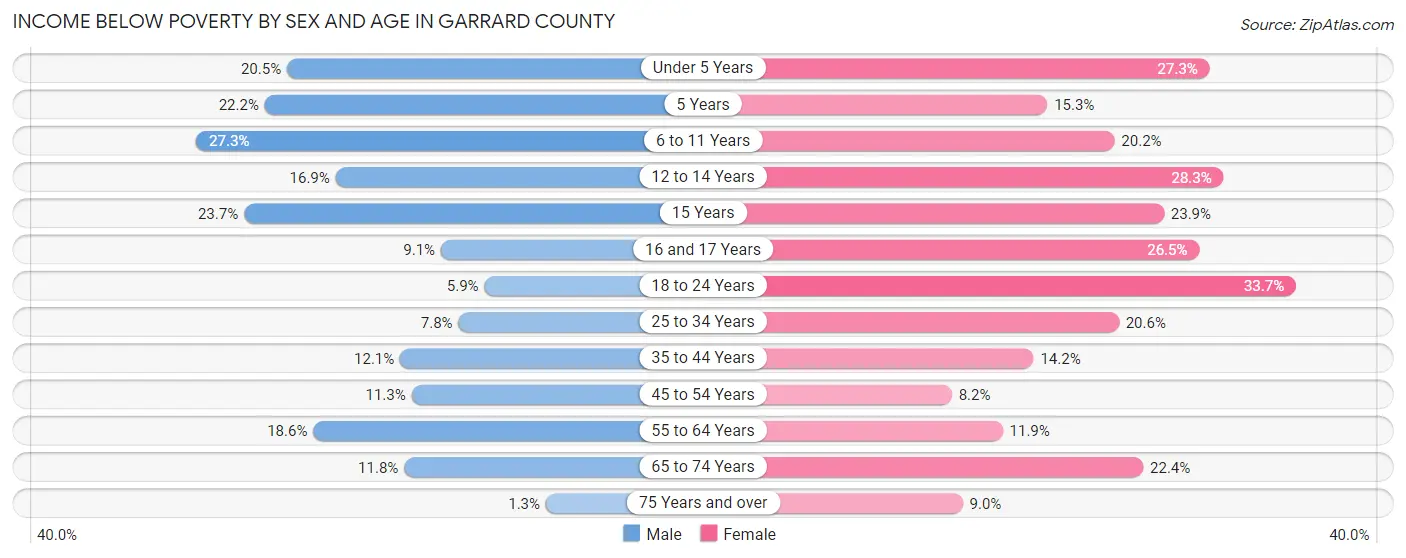
| Age Bracket | Male | Female |
| Under 5 Years | 94 (20.5%) | 121 (27.3%) |
| 5 Years | 49 (22.2%) | 9 (15.2%) |
| 6 to 11 Years | 166 (27.3%) | 120 (20.2%) |
| 12 to 14 Years | 35 (16.9%) | 87 (28.3%) |
| 15 Years | 46 (23.7%) | 22 (23.9%) |
| 16 and 17 Years | 17 (9.1%) | 56 (26.5%) |
| 18 to 24 Years | 35 (5.9%) | 202 (33.7%) |
| 25 to 34 Years | 72 (7.8%) | 199 (20.6%) |
| 35 to 44 Years | 120 (12.1%) | 160 (14.2%) |
| 45 to 54 Years | 141 (11.3%) | 90 (8.2%) |
| 55 to 64 Years | 254 (18.6%) | 161 (11.9%) |
| 65 to 74 Years | 105 (11.8%) | 223 (22.4%) |
| 75 Years and over | 6 (1.3%) | 67 (9.0%) |
| Total | 1,140 (13.6%) | 1,517 (17.7%) |
Income Above Poverty by Sex and Age in Garrard County
According to the poverty statistics in Garrard County, males aged 75 years and over and females aged 45 to 54 years are the age groups that are most secure financially, with 98.7% of males and 91.8% of females in these age groups living above the poverty line.
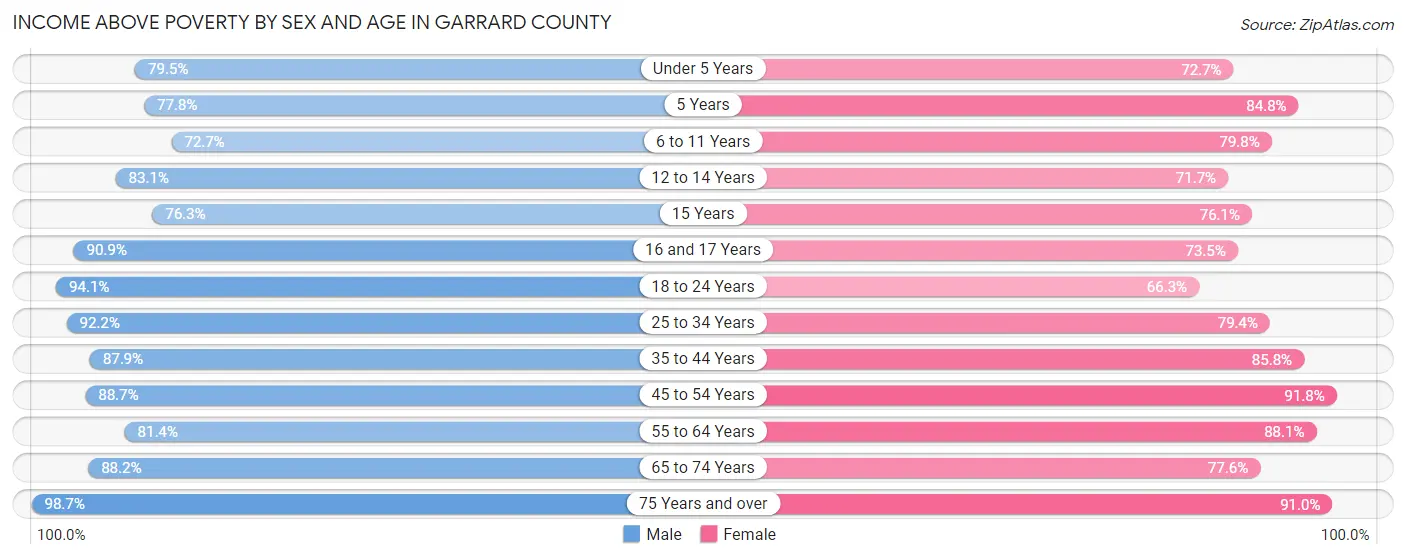
| Age Bracket | Male | Female |
| Under 5 Years | 364 (79.5%) | 322 (72.7%) |
| 5 Years | 172 (77.8%) | 50 (84.8%) |
| 6 to 11 Years | 443 (72.7%) | 473 (79.8%) |
| 12 to 14 Years | 172 (83.1%) | 220 (71.7%) |
| 15 Years | 148 (76.3%) | 70 (76.1%) |
| 16 and 17 Years | 170 (90.9%) | 155 (73.5%) |
| 18 to 24 Years | 562 (94.1%) | 397 (66.3%) |
| 25 to 34 Years | 852 (92.2%) | 769 (79.4%) |
| 35 to 44 Years | 870 (87.9%) | 964 (85.8%) |
| 45 to 54 Years | 1,110 (88.7%) | 1,013 (91.8%) |
| 55 to 64 Years | 1,114 (81.4%) | 1,187 (88.1%) |
| 65 to 74 Years | 783 (88.2%) | 774 (77.6%) |
| 75 Years and over | 456 (98.7%) | 680 (91.0%) |
| Total | 7,216 (86.4%) | 7,074 (82.3%) |
Income Below Poverty Among Married-Couple Families in Garrard County
The poverty statistics for married-couple families in Garrard County show that 7.7% or 285 of the total 3,723 families live below the poverty line. Families with 5 or more children have the highest poverty rate of 77.1%, comprising of 27 families. On the other hand, families with 1 or 2 children have the lowest poverty rate of 4.1%, which includes 44 families.
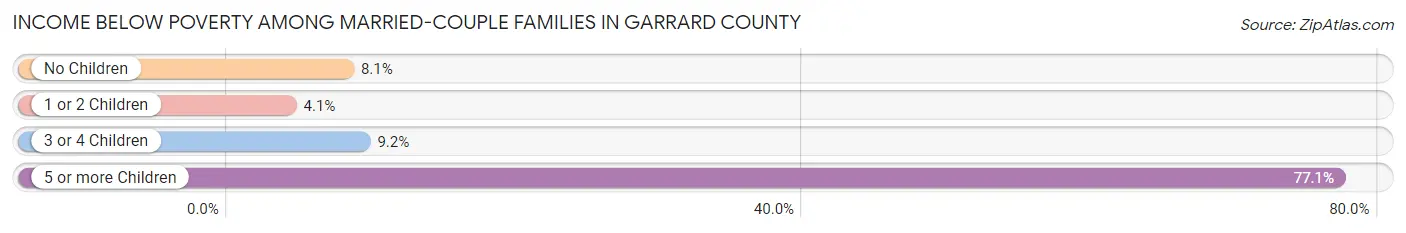
| Children | Above Poverty | Below Poverty |
| No Children | 2,130 (91.9%) | 187 (8.1%) |
| 1 or 2 Children | 1,034 (95.9%) | 44 (4.1%) |
| 3 or 4 Children | 266 (90.8%) | 27 (9.2%) |
| 5 or more Children | 8 (22.9%) | 27 (77.1%) |
| Total | 3,438 (92.3%) | 285 (7.7%) |
Income Below Poverty Among Single-Parent Households in Garrard County
According to the poverty data in Garrard County, 16.7% or 40 single-father households and 37.6% or 279 single-mother households are living below the poverty line. Among single-father households, those with 1 or 2 children have the highest poverty rate, with 40 households (26.3%) experiencing poverty. Likewise, among single-mother households, those with 5 or more children have the highest poverty rate, with 20 households (100.0%) falling below the poverty line.
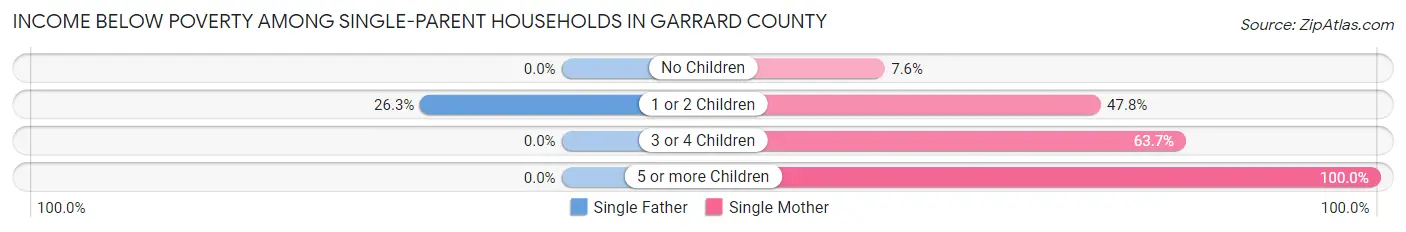
| Children | Single Father | Single Mother |
| No Children | 0 (0.0%) | 19 (7.6%) |
| 1 or 2 Children | 40 (26.3%) | 182 (47.8%) |
| 3 or 4 Children | 0 (0.0%) | 58 (63.7%) |
| 5 or more Children | 0 (0.0%) | 20 (100.0%) |
| Total | 40 (16.7%) | 279 (37.6%) |
Income Below Poverty Among Married-Couple vs Single-Parent Households in Garrard County
The poverty data for Garrard County shows that 285 of the married-couple family households (7.7%) and 319 of the single-parent households (32.5%) are living below the poverty level. Within the married-couple family households, those with 5 or more children have the highest poverty rate, with 27 households (77.1%) falling below the poverty line. Among the single-parent households, those with 5 or more children have the highest poverty rate, with 20 household (100.0%) living below poverty.
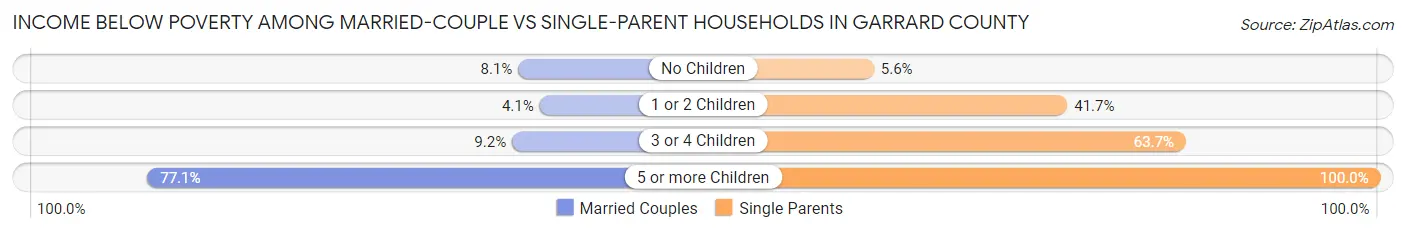
| Children | Married-Couple Families | Single-Parent Households |
| No Children | 187 (8.1%) | 19 (5.6%) |
| 1 or 2 Children | 44 (4.1%) | 222 (41.6%) |
| 3 or 4 Children | 27 (9.2%) | 58 (63.7%) |
| 5 or more Children | 27 (77.1%) | 20 (100.0%) |
| Total | 285 (7.7%) | 319 (32.5%) |
Race in Garrard County
The most populous races in Garrard County are White / Caucasian (15,937 | 92.8%), Two or more Races (490 | 2.9%), and Hispanic or Latino (421 | 2.5%).
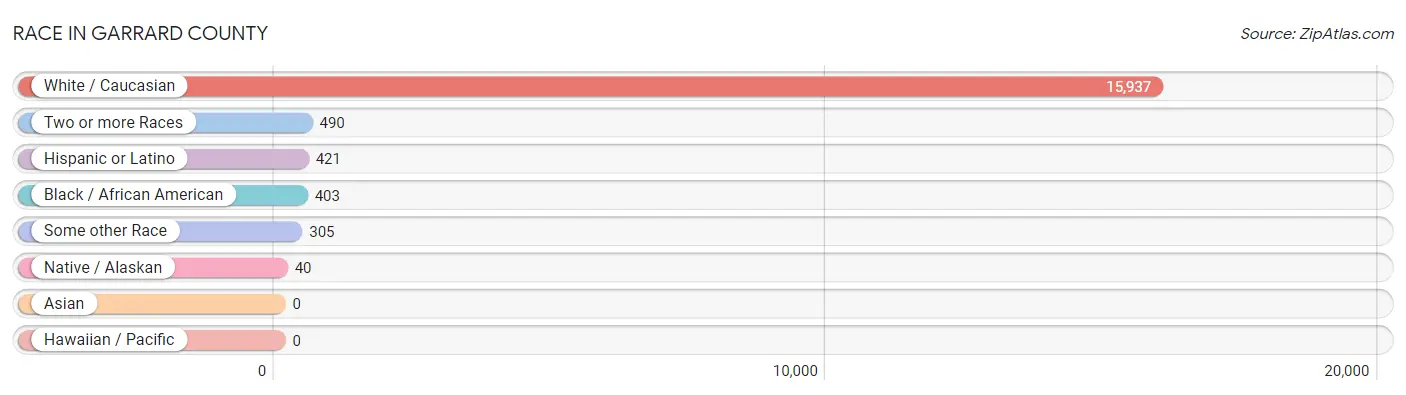
| Race | # Population | % Population |
| Asian | 0 | 0.0% |
| Black / African American | 403 | 2.4% |
| Hawaiian / Pacific | 0 | 0.0% |
| Hispanic or Latino | 421 | 2.5% |
| Native / Alaskan | 40 | 0.2% |
| White / Caucasian | 15,937 | 92.8% |
| Two or more Races | 490 | 2.9% |
| Some other Race | 305 | 1.8% |
| Total | 17,175 | 100.0% |
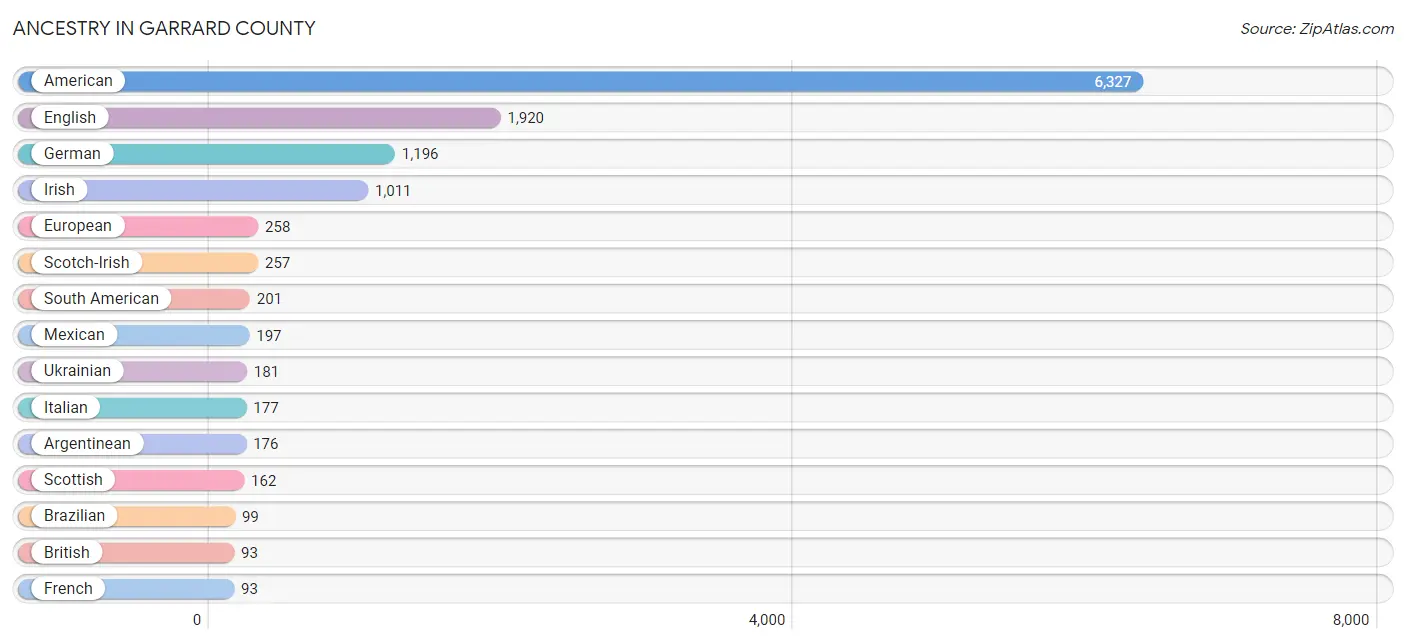
Ancestry in Garrard County
The most populous ancestries reported in Garrard County are American (6,327 | 36.8%), English (1,920 | 11.2%), German (1,196 | 7.0%), Irish (1,011 | 5.9%), and European (258 | 1.5%), together accounting for 62.4% of all Garrard County residents.
| Ancestry | # Population | % Population |
| American | 6,327 | 36.8% |
| Argentinean | 176 | 1.0% |
| Austrian | 13 | 0.1% |
| Brazilian | 99 | 0.6% |
| British | 93 | 0.5% |
| Burmese | 41 | 0.2% |
| Central American | 23 | 0.1% |
| Cherokee | 14 | 0.1% |
| Chippewa | 11 | 0.1% |
| Colombian | 25 | 0.2% |
| Costa Rican | 9 | 0.1% |
| Croatian | 26 | 0.2% |
| Czech | 7 | 0.0% |
| Danish | 24 | 0.1% |
| Dutch | 37 | 0.2% |
| Eastern European | 30 | 0.2% |
| English | 1,920 | 11.2% |
| European | 258 | 1.5% |
| Finnish | 14 | 0.1% |
| French | 93 | 0.5% |
| French Canadian | 24 | 0.1% |
| German | 1,196 | 7.0% |
| Greek | 18 | 0.1% |
| Guatemalan | 14 | 0.1% |
| Hungarian | 15 | 0.1% |
| Irish | 1,011 | 5.9% |
| Italian | 177 | 1.0% |
| Lithuanian | 32 | 0.2% |
| Mexican | 197 | 1.1% |
| Northern European | 36 | 0.2% |
| Norwegian | 34 | 0.2% |
| Pakistani | 17 | 0.1% |
| Pennsylvania German | 32 | 0.2% |
| Polish | 45 | 0.3% |
| Portuguese | 12 | 0.1% |
| Scotch-Irish | 257 | 1.5% |
| Scottish | 162 | 0.9% |
| Serbian | 4 | 0.0% |
| Slovak | 33 | 0.2% |
| South American | 201 | 1.2% |
| Swedish | 70 | 0.4% |
| Swiss | 24 | 0.1% |
| Ukrainian | 181 | 1.1% |
| Welsh | 27 | 0.2% | View All 44 Rows |
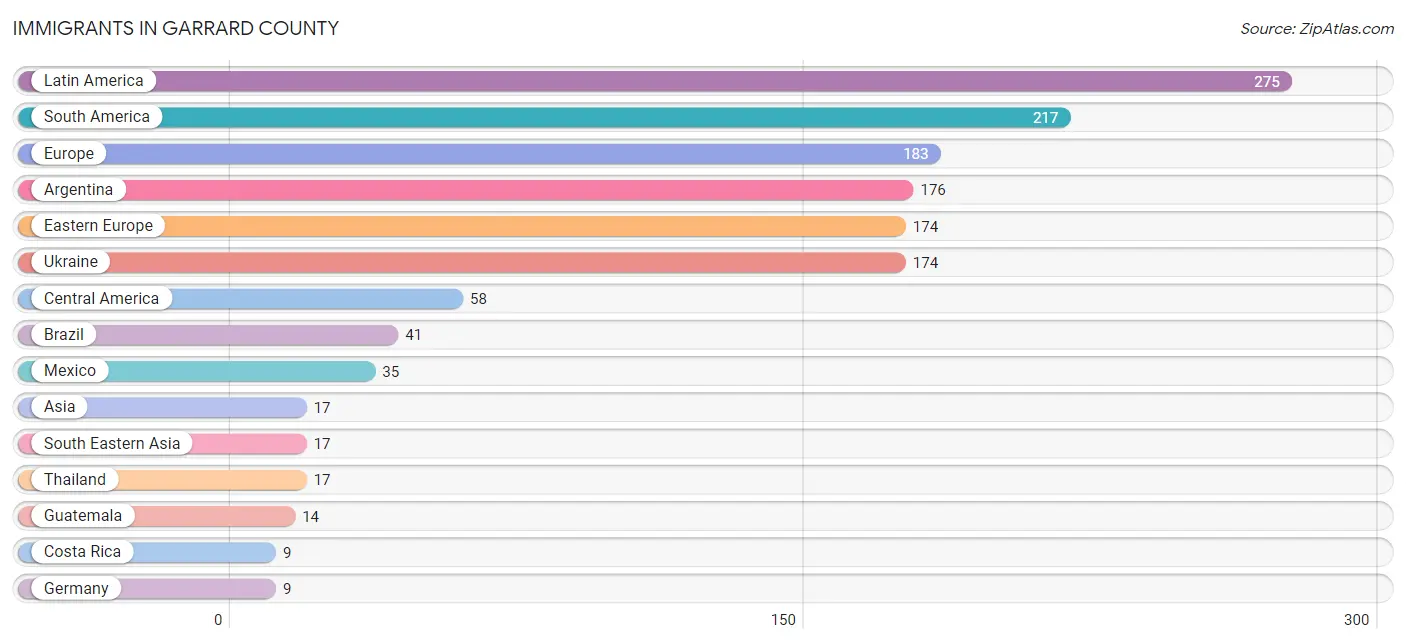
Immigrants in Garrard County
The most numerous immigrant groups reported in Garrard County came from Latin America (275 | 1.6%), South America (217 | 1.3%), Europe (183 | 1.1%), Argentina (176 | 1.0%), and Eastern Europe (174 | 1.0%), together accounting for 6.0% of all Garrard County residents.
| Immigration Origin | # Population | % Population |
| Argentina | 176 | 1.0% |
| Asia | 17 | 0.1% |
| Brazil | 41 | 0.2% |
| Central America | 58 | 0.3% |
| Costa Rica | 9 | 0.1% |
| Eastern Europe | 174 | 1.0% |
| Europe | 183 | 1.1% |
| Germany | 9 | 0.1% |
| Guatemala | 14 | 0.1% |
| Latin America | 275 | 1.6% |
| Mexico | 35 | 0.2% |
| South America | 217 | 1.3% |
| South Eastern Asia | 17 | 0.1% |
| Thailand | 17 | 0.1% |
| Ukraine | 174 | 1.0% |
| Western Europe | 9 | 0.1% | View All 16 Rows |
Sex and Age in Garrard County
Sex and Age in Garrard County
The most populous age groups in Garrard County are 55 to 59 Years (692 | 8.2%) for men and 60 to 64 Years (755 | 8.6%) for women.
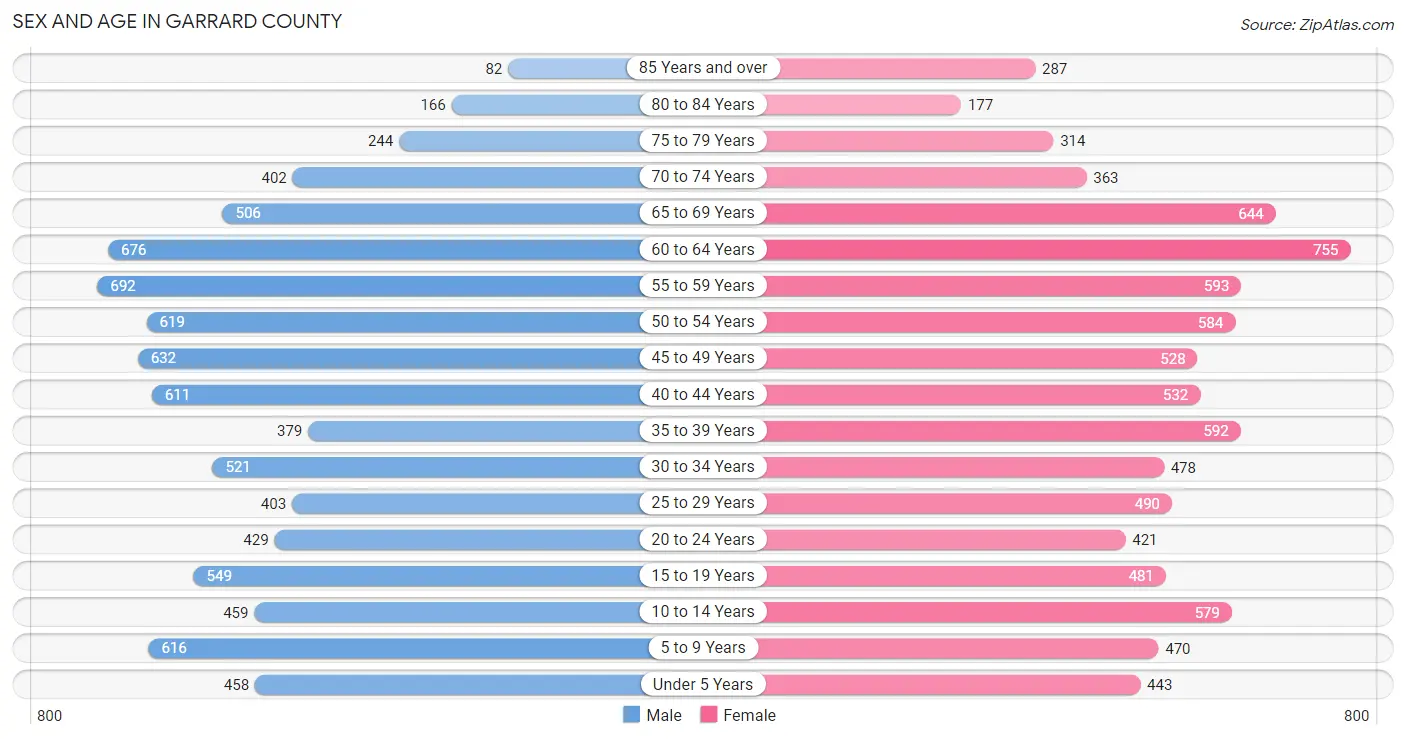
| Age Bracket | Male | Female |
| Under 5 Years | 458 (5.4%) | 443 (5.1%) |
| 5 to 9 Years | 616 (7.3%) | 470 (5.4%) |
| 10 to 14 Years | 459 (5.4%) | 579 (6.6%) |
| 15 to 19 Years | 549 (6.5%) | 481 (5.5%) |
| 20 to 24 Years | 429 (5.1%) | 421 (4.8%) |
| 25 to 29 Years | 403 (4.8%) | 490 (5.6%) |
| 30 to 34 Years | 521 (6.2%) | 478 (5.5%) |
| 35 to 39 Years | 379 (4.5%) | 592 (6.8%) |
| 40 to 44 Years | 611 (7.2%) | 532 (6.1%) |
| 45 to 49 Years | 632 (7.5%) | 528 (6.0%) |
| 50 to 54 Years | 619 (7.3%) | 584 (6.7%) |
| 55 to 59 Years | 692 (8.2%) | 593 (6.8%) |
| 60 to 64 Years | 676 (8.0%) | 755 (8.6%) |
| 65 to 69 Years | 506 (6.0%) | 644 (7.4%) |
| 70 to 74 Years | 402 (4.8%) | 363 (4.2%) |
| 75 to 79 Years | 244 (2.9%) | 314 (3.6%) |
| 80 to 84 Years | 166 (2.0%) | 177 (2.0%) |
| 85 Years and over | 82 (1.0%) | 287 (3.3%) |
| Total | 8,444 (100.0%) | 8,731 (100.0%) |
Families and Households in Garrard County
Median Family Size in Garrard County
The median family size in Garrard County is 3.06 persons per family, with single female/mother families (743 | 15.8%) accounting for the largest median family size of 3.34 persons per family. On the other hand, single male/father families (239 | 5.1%) represent the smallest median family size with 2.64 persons per family.
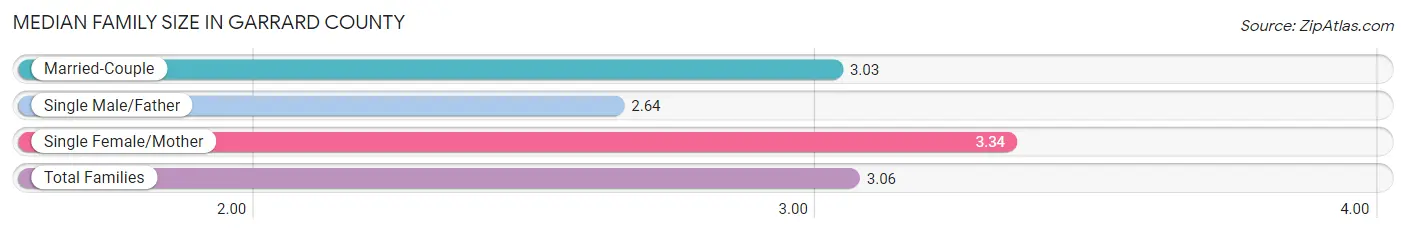
| Family Type | # Families | Family Size |
| Married-Couple | 3,723 (79.1%) | 3.03 |
| Single Male/Father | 239 (5.1%) | 2.64 |
| Single Female/Mother | 743 (15.8%) | 3.34 |
| Total Families | 4,705 (100.0%) | 3.06 |
Median Household Size in Garrard County
The median household size in Garrard County is 2.63 persons per household, with single female/mother households (743 | 11.5%) accounting for the largest median household size of 3.65 persons per household. non-family households (1,783 | 27.5%) represent the smallest median household size with 1.29 persons per household.
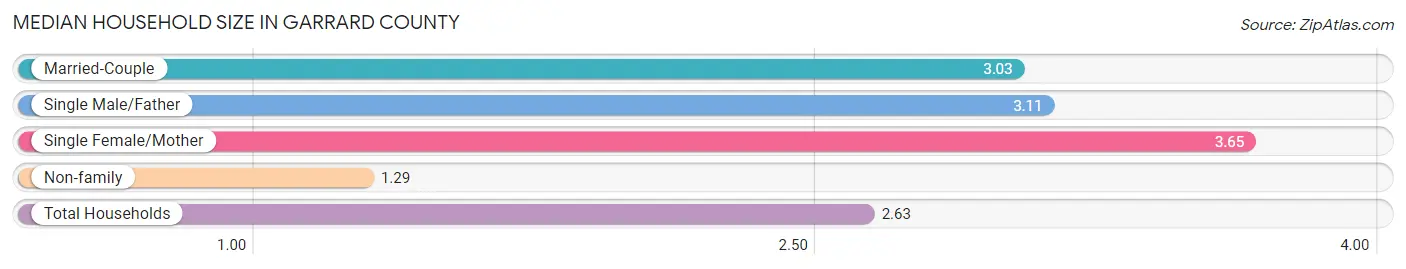
| Household Type | # Households | Household Size |
| Married-Couple | 3,723 (57.4%) | 3.03 |
| Single Male/Father | 239 (3.7%) | 3.11 |
| Single Female/Mother | 743 (11.5%) | 3.65 |
| Non-family | 1,783 (27.5%) | 1.29 |
| Total Households | 6,488 (100.0%) | 2.63 |
Household Size by Marriage Status in Garrard County
Out of a total of 6,488 households in Garrard County, 4,705 (72.5%) are family households, while 1,783 (27.5%) are nonfamily households. The most numerous type of family households are 2-person households, comprising 2,048, and the most common type of nonfamily households are 1-person households, comprising 1,495.
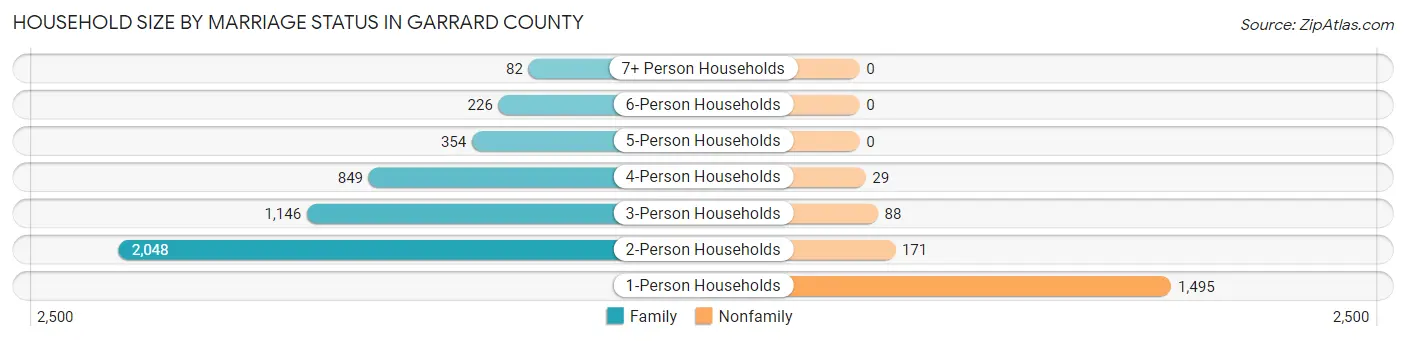
| Household Size | Family Households | Nonfamily Households |
| 1-Person Households | - | 1,495 (23.0%) |
| 2-Person Households | 2,048 (31.6%) | 171 (2.6%) |
| 3-Person Households | 1,146 (17.7%) | 88 (1.4%) |
| 4-Person Households | 849 (13.1%) | 29 (0.4%) |
| 5-Person Households | 354 (5.5%) | 0 (0.0%) |
| 6-Person Households | 226 (3.5%) | 0 (0.0%) |
| 7+ Person Households | 82 (1.3%) | 0 (0.0%) |
| Total | 4,705 (72.5%) | 1,783 (27.5%) |
Female Fertility in Garrard County
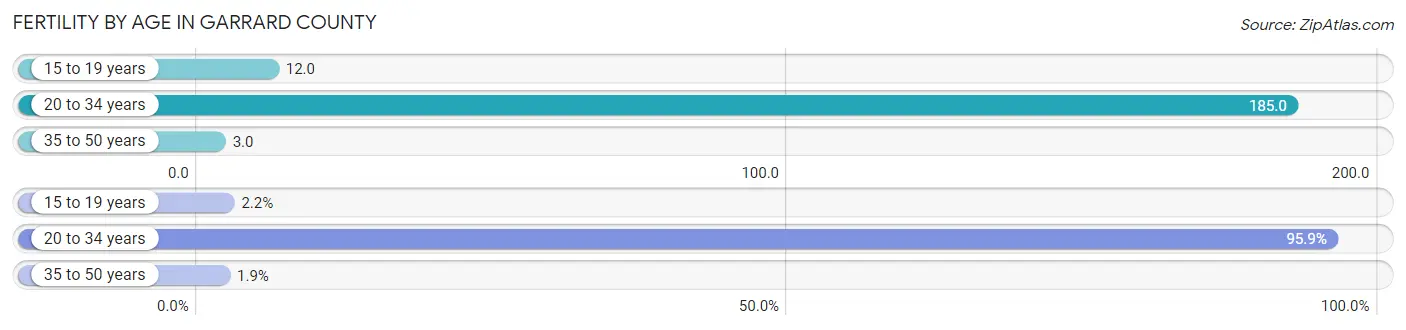
Fertility by Age in Garrard County
Average fertility rate in Garrard County is 73.0 births per 1,000 women. Women in the age bracket of 20 to 34 years have the highest fertility rate with 185.0 births per 1,000 women. Women in the age bracket of 20 to 34 years acount for 95.9% of all women with births.
| Age Bracket | Women with Births | Births / 1,000 Women |
| 15 to 19 years | 6 (2.2%) | 12.0 |
| 20 to 34 years | 257 (95.9%) | 185.0 |
| 35 to 50 years | 5 (1.9%) | 3.0 |
| Total | 268 (100.0%) | 73.0 |
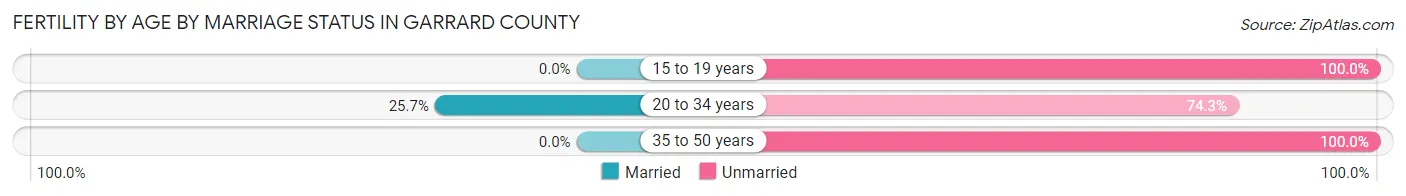
Fertility by Age by Marriage Status in Garrard County
24.6% of women with births (268) in Garrard County are married. The highest percentage of unmarried women with births falls into 15 to 19 years age bracket with 100.0% of them unmarried at the time of birth, while the lowest percentage of unmarried women with births belong to 20 to 34 years age bracket with 74.3% of them unmarried.
| Age Bracket | Married | Unmarried |
| 15 to 19 years | 0 (0.0%) | 6 (100.0%) |
| 20 to 34 years | 66 (25.7%) | 191 (74.3%) |
| 35 to 50 years | 0 (0.0%) | 5 (100.0%) |
| Total | 66 (24.6%) | 202 (75.4%) |
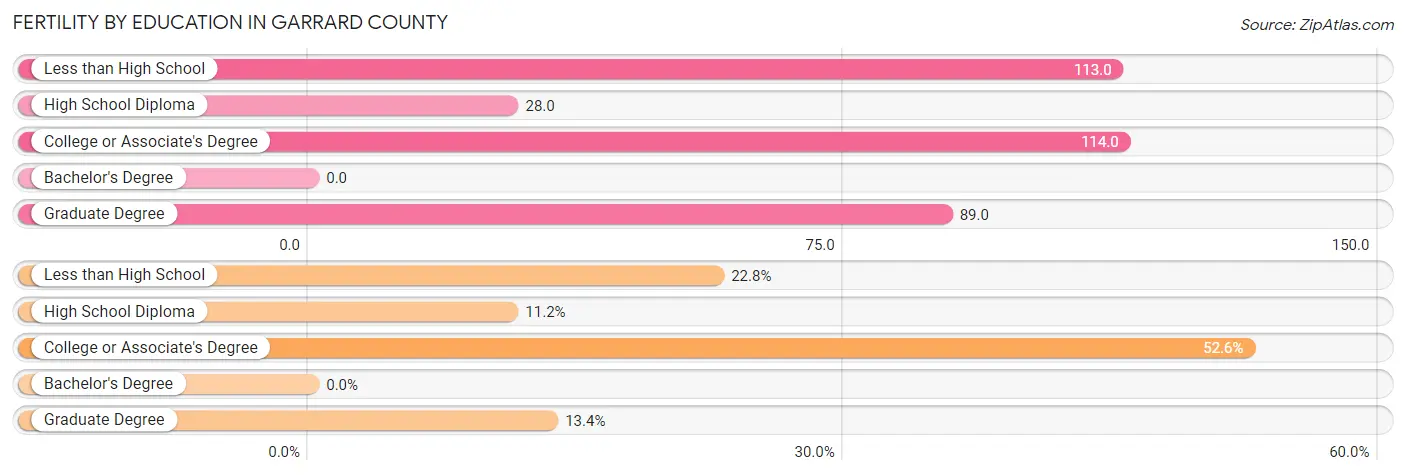
Fertility by Education in Garrard County
| Educational Attainment | Women with Births | Births / 1,000 Women |
| Less than High School | 61 (22.8%) | 113.0 |
| High School Diploma | 30 (11.2%) | 28.0 |
| College or Associate's Degree | 141 (52.6%) | 114.0 |
| Bachelor's Degree | 0 (0.0%) | 0.0 |
| Graduate Degree | 36 (13.4%) | 89.0 |
| Total | 268 (100.0%) | 73.0 |
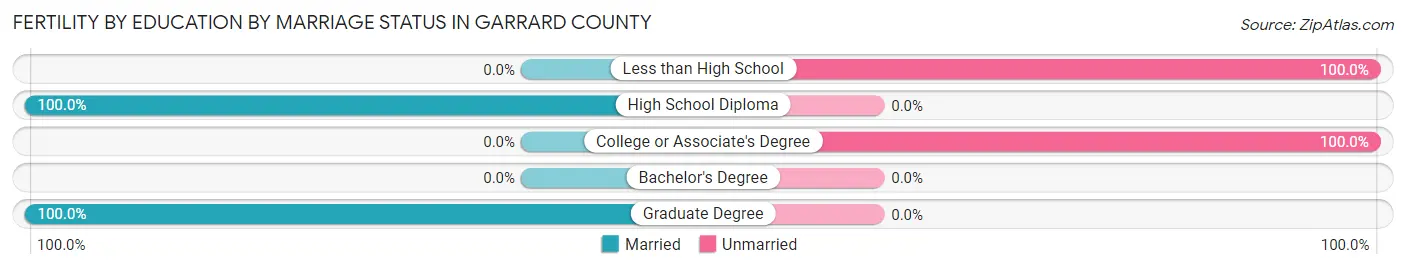
Fertility by Education by Marriage Status in Garrard County
75.4% of women with births in Garrard County are unmarried. Women with the educational attainment of high school diploma are most likely to be married with 100.0% of them married at childbirth, while women with the educational attainment of less than high school are least likely to be married with 100.0% of them unmarried at childbirth.
| Educational Attainment | Married | Unmarried |
| Less than High School | 0 (0.0%) | 61 (100.0%) |
| High School Diploma | 30 (100.0%) | 0 (0.0%) |
| College or Associate's Degree | 0 (0.0%) | 141 (100.0%) |
| Bachelor's Degree | 0 (0.0%) | 0 (0.0%) |
| Graduate Degree | 36 (100.0%) | 0 (0.0%) |
| Total | 66 (24.6%) | 202 (75.4%) |
Employment Characteristics in Garrard County
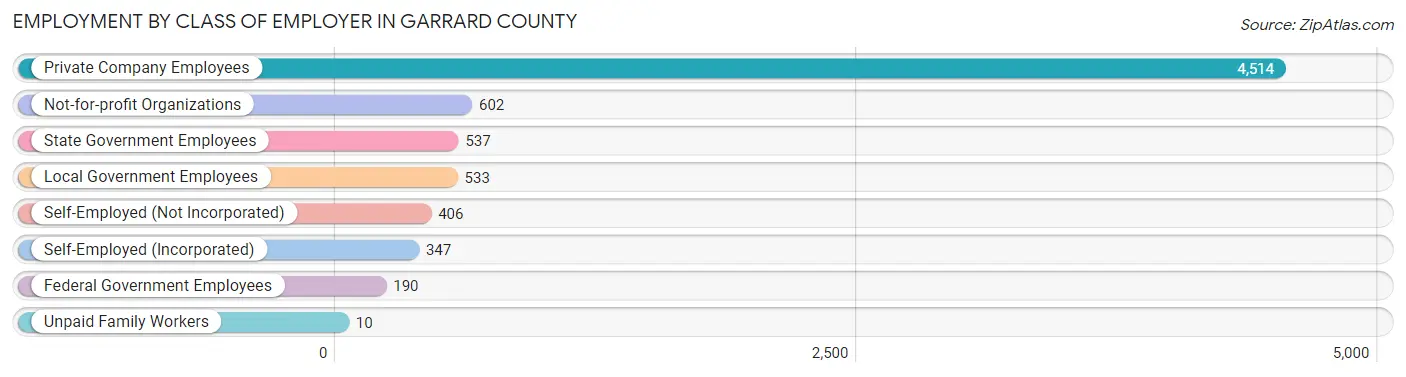
Employment by Class of Employer in Garrard County
Among the 7,139 employed individuals in Garrard County, private company employees (4,514 | 63.2%), not-for-profit organizations (602 | 8.4%), and state government employees (537 | 7.5%) make up the most common classes of employment.
| Employer Class | # Employees | % Employees |
| Private Company Employees | 4,514 | 63.2% |
| Self-Employed (Incorporated) | 347 | 4.9% |
| Self-Employed (Not Incorporated) | 406 | 5.7% |
| Not-for-profit Organizations | 602 | 8.4% |
| Local Government Employees | 533 | 7.5% |
| State Government Employees | 537 | 7.5% |
| Federal Government Employees | 190 | 2.7% |
| Unpaid Family Workers | 10 | 0.1% |
| Total | 7,139 | 100.0% |
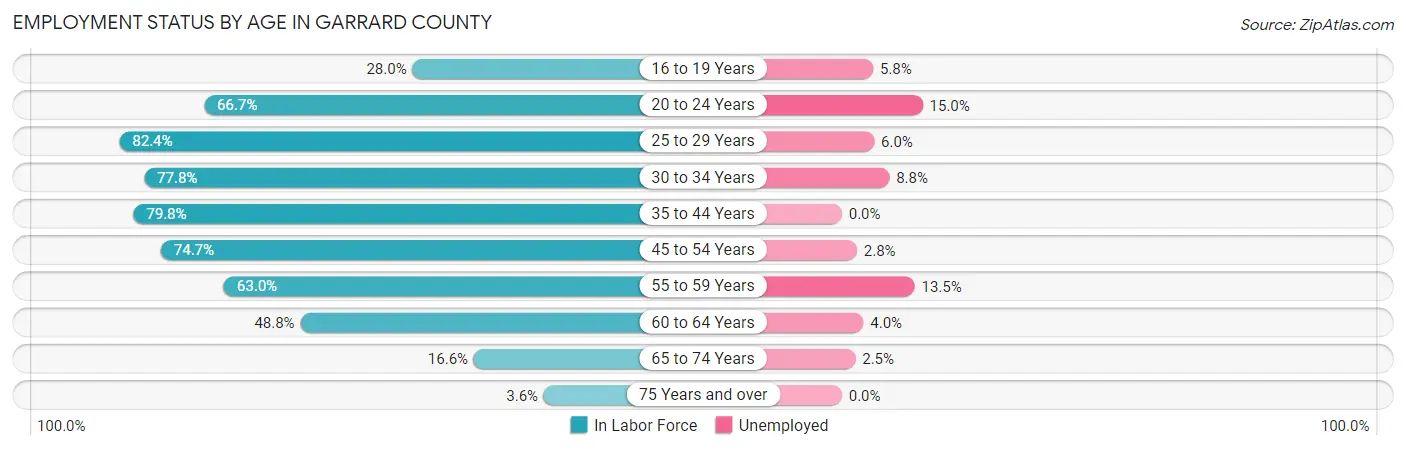
Employment Status by Age in Garrard County
According to the labor force statistics for Garrard County, out of the total population over 16 years of age (13,864), 54.9% or 7,611 individuals are in the labor force, with 5.3% or 403 of them unemployed. The age group with the highest labor force participation rate is 25 to 29 years, with 82.4% or 736 individuals in the labor force. Within the labor force, the 20 to 24 years age range has the highest percentage of unemployed individuals, with 15.0% or 85 of them being unemployed.
| Age Bracket | In Labor Force | Unemployed |
| 16 to 19 Years | 208 (28.0%) | 12 (5.8%) |
| 20 to 24 Years | 567 (66.7%) | 85 (15.0%) |
| 25 to 29 Years | 736 (82.4%) | 44 (6.0%) |
| 30 to 34 Years | 777 (77.8%) | 68 (8.8%) |
| 35 to 44 Years | 1,687 (79.8%) | 0 (0.0%) |
| 45 to 54 Years | 1,765 (74.7%) | 49 (2.8%) |
| 55 to 59 Years | 810 (63.0%) | 109 (13.5%) |
| 60 to 64 Years | 698 (48.8%) | 28 (4.0%) |
| 65 to 74 Years | 318 (16.6%) | 8 (2.5%) |
| 75 Years and over | 46 (3.6%) | 0 (0.0%) |
| Total | 7,611 (54.9%) | 403 (5.3%) |
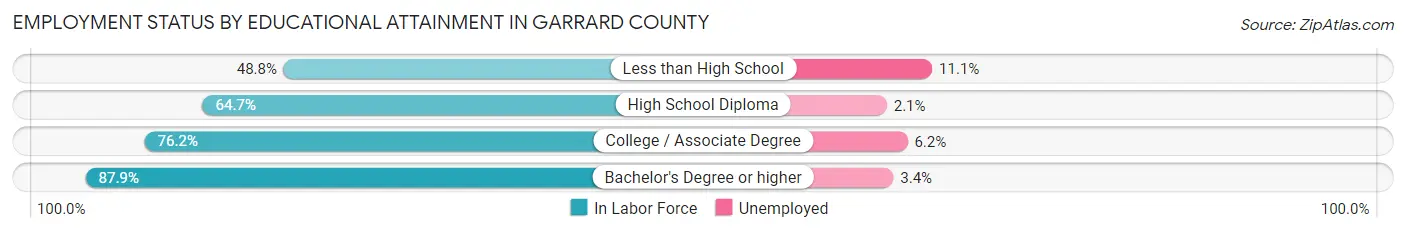
Employment Status by Educational Attainment in Garrard County
According to labor force statistics for Garrard County, 71.2% of individuals (6,469) out of the total population between 25 and 64 years of age (9,085) are in the labor force, with 4.6% or 298 of them being unemployed. The group with the highest labor force participation rate are those with the educational attainment of bachelor's degree or higher, with 87.9% or 1,757 individuals in the labor force. Within the labor force, individuals with less than high school education have the highest percentage of unemployment, with 11.1% or 65 of them being unemployed.
| Educational Attainment | In Labor Force | Unemployed |
| Less than High School | 584 (48.8%) | 133 (11.1%) |
| High School Diploma | 2,001 (64.7%) | 65 (2.1%) |
| College / Associate Degree | 2,131 (76.2%) | 173 (6.2%) |
| Bachelor's Degree or higher | 1,757 (87.9%) | 68 (3.4%) |
| Total | 6,469 (71.2%) | 418 (4.6%) |
Employment Occupations by Sex in Garrard County
Management, Business, Science and Arts Occupations
The most common Management, Business, Science and Arts occupations in Garrard County are Management (826 | 11.5%), Community & Social Service (611 | 8.5%), Health Diagnosing & Treating (551 | 7.6%), Education Instruction & Library (420 | 5.8%), and Health Technologists (412 | 5.7%).
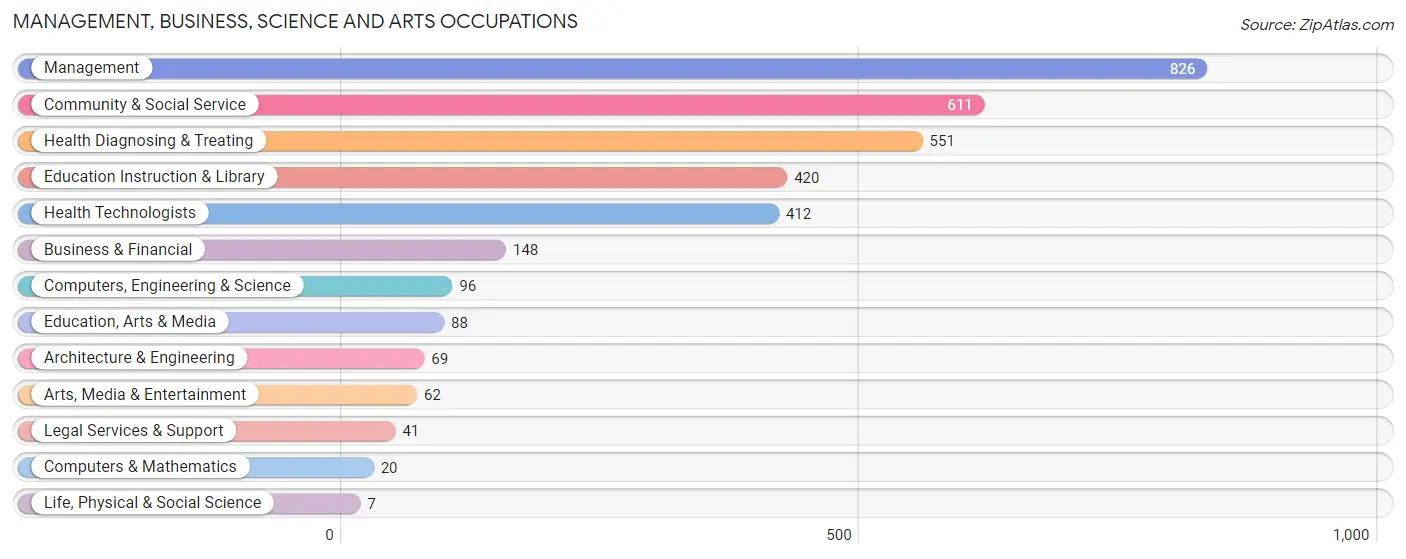
Management, Business, Science and Arts Occupations by Sex
Within the Management, Business, Science and Arts occupations in Garrard County, the most male-oriented occupations are Computers & Mathematics (100.0%), Architecture & Engineering (95.7%), and Computers, Engineering & Science (89.6%), while the most female-oriented occupations are Life, Physical & Social Science (100.0%), Health Diagnosing & Treating (87.1%), and Health Technologists (84.2%).
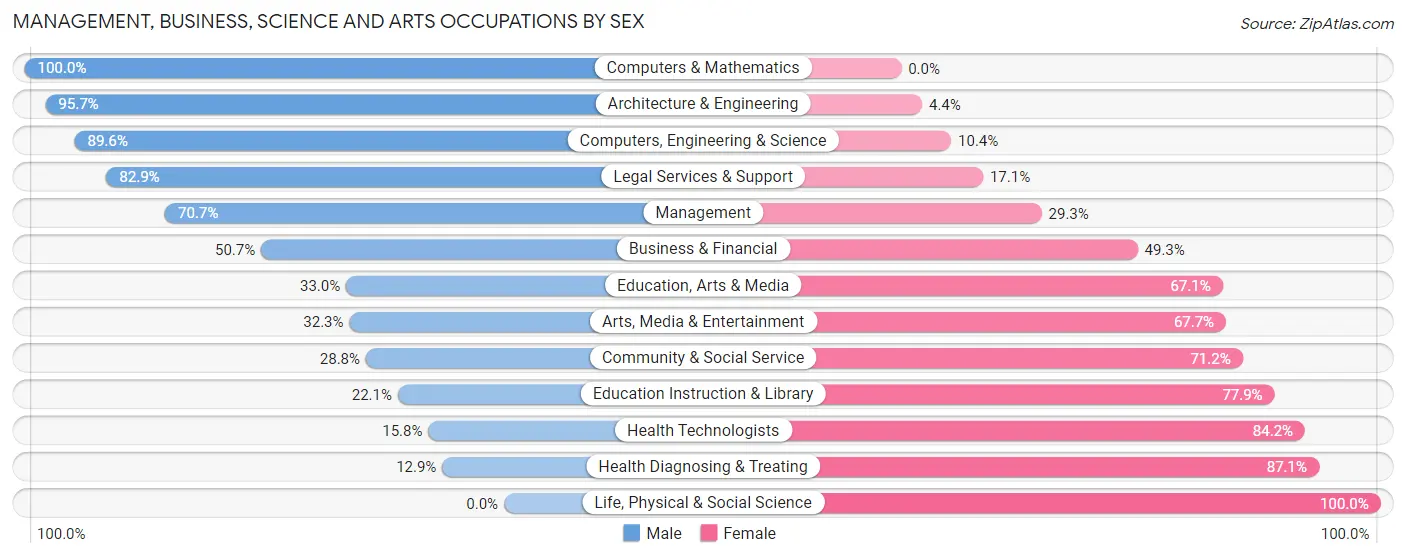
| Occupation | Male | Female |
| Management | 584 (70.7%) | 242 (29.3%) |
| Business & Financial | 75 (50.7%) | 73 (49.3%) |
| Computers, Engineering & Science | 86 (89.6%) | 10 (10.4%) |
| Computers & Mathematics | 20 (100.0%) | 0 (0.0%) |
| Architecture & Engineering | 66 (95.7%) | 3 (4.3%) |
| Life, Physical & Social Science | 0 (0.0%) | 7 (100.0%) |
| Community & Social Service | 176 (28.8%) | 435 (71.2%) |
| Education, Arts & Media | 29 (33.0%) | 59 (67.0%) |
| Legal Services & Support | 34 (82.9%) | 7 (17.1%) |
| Education Instruction & Library | 93 (22.1%) | 327 (77.9%) |
| Arts, Media & Entertainment | 20 (32.3%) | 42 (67.7%) |
| Health Diagnosing & Treating | 71 (12.9%) | 480 (87.1%) |
| Health Technologists | 65 (15.8%) | 347 (84.2%) |
| Total (Category) | 992 (44.4%) | 1,240 (55.6%) |
| Total (Overall) | 3,971 (55.1%) | 3,238 (44.9%) |
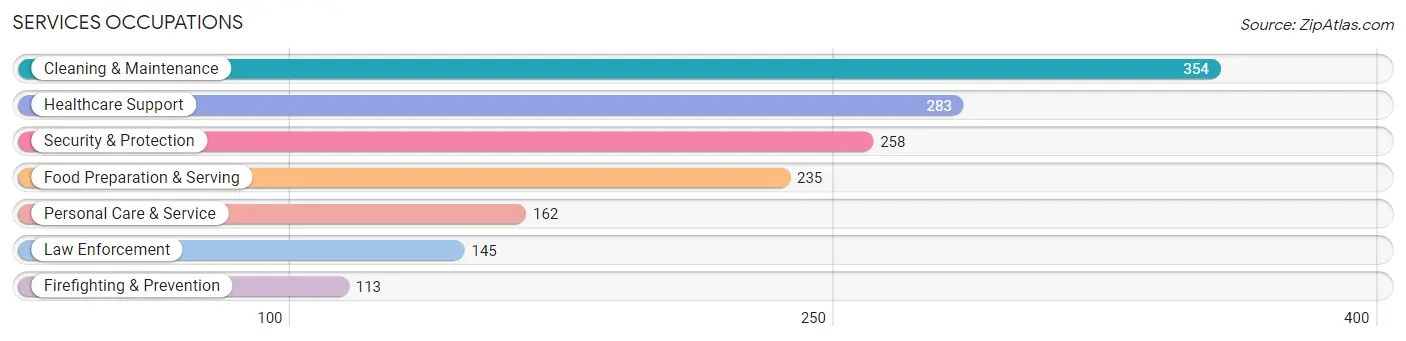
Services Occupations
The most common Services occupations in Garrard County are Cleaning & Maintenance (354 | 4.9%), Healthcare Support (283 | 3.9%), Security & Protection (258 | 3.6%), Food Preparation & Serving (235 | 3.3%), and Personal Care & Service (162 | 2.2%).
Services Occupations by Sex
Within the Services occupations in Garrard County, the most male-oriented occupations are Law Enforcement (89.7%), Security & Protection (80.6%), and Cleaning & Maintenance (79.9%), while the most female-oriented occupations are Healthcare Support (92.6%), Food Preparation & Serving (81.3%), and Personal Care & Service (77.8%).
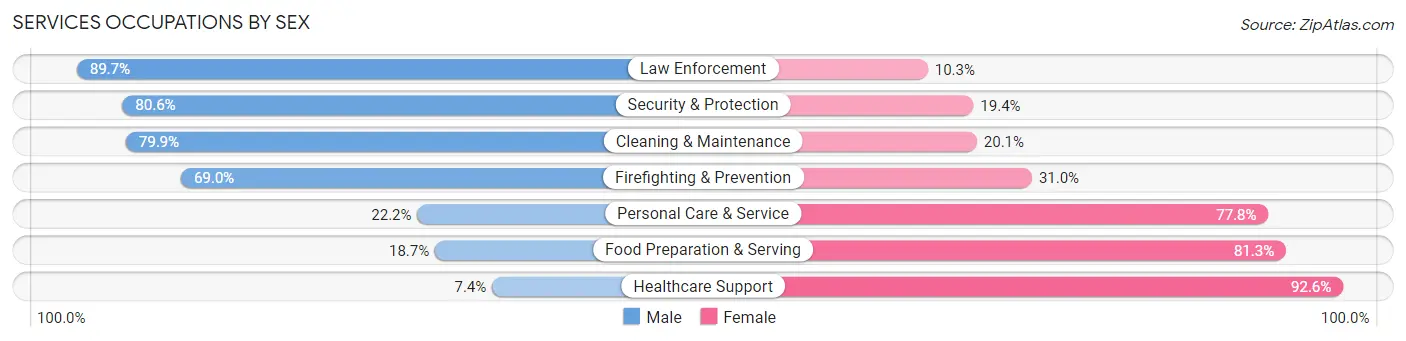
| Occupation | Male | Female |
| Healthcare Support | 21 (7.4%) | 262 (92.6%) |
| Security & Protection | 208 (80.6%) | 50 (19.4%) |
| Firefighting & Prevention | 78 (69.0%) | 35 (31.0%) |
| Law Enforcement | 130 (89.7%) | 15 (10.3%) |
| Food Preparation & Serving | 44 (18.7%) | 191 (81.3%) |
| Cleaning & Maintenance | 283 (79.9%) | 71 (20.1%) |
| Personal Care & Service | 36 (22.2%) | 126 (77.8%) |
| Total (Category) | 592 (45.8%) | 700 (54.2%) |
| Total (Overall) | 3,971 (55.1%) | 3,238 (44.9%) |
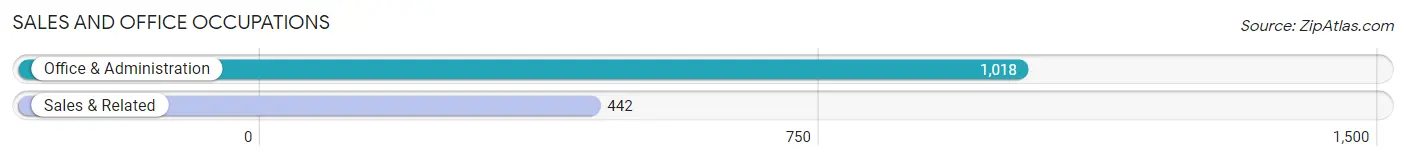
Sales and Office Occupations
The most common Sales and Office occupations in Garrard County are Office & Administration (1,018 | 14.1%), and Sales & Related (442 | 6.1%).
Sales and Office Occupations by Sex
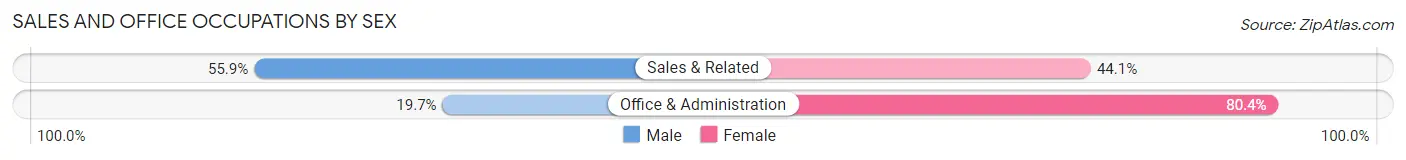
| Occupation | Male | Female |
| Sales & Related | 247 (55.9%) | 195 (44.1%) |
| Office & Administration | 200 (19.7%) | 818 (80.3%) |
| Total (Category) | 447 (30.6%) | 1,013 (69.4%) |
| Total (Overall) | 3,971 (55.1%) | 3,238 (44.9%) |
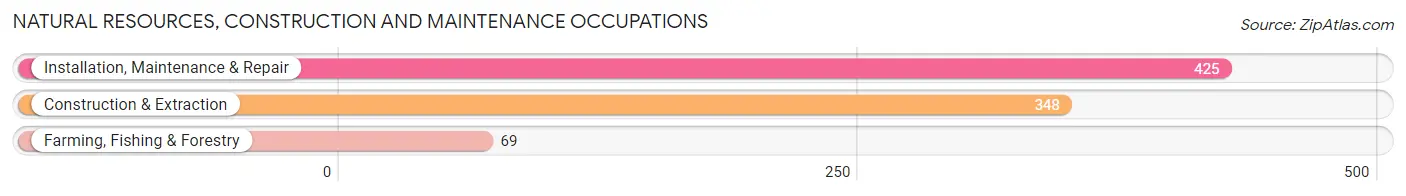
Natural Resources, Construction and Maintenance Occupations
The most common Natural Resources, Construction and Maintenance occupations in Garrard County are Installation, Maintenance & Repair (425 | 5.9%), Construction & Extraction (348 | 4.8%), and Farming, Fishing & Forestry (69 | 1.0%).
Natural Resources, Construction and Maintenance Occupations by Sex
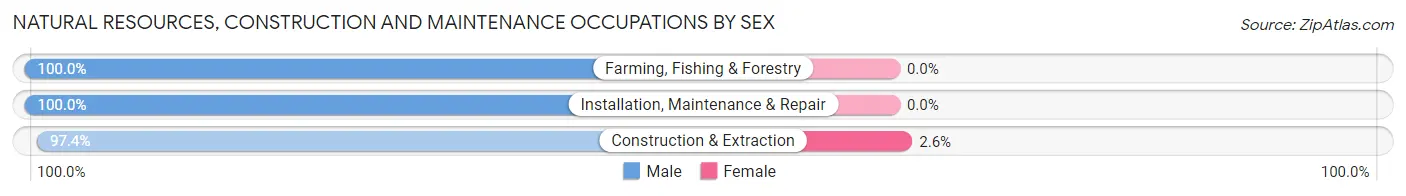
| Occupation | Male | Female |
| Farming, Fishing & Forestry | 69 (100.0%) | 0 (0.0%) |
| Construction & Extraction | 339 (97.4%) | 9 (2.6%) |
| Installation, Maintenance & Repair | 425 (100.0%) | 0 (0.0%) |
| Total (Category) | 833 (98.9%) | 9 (1.1%) |
| Total (Overall) | 3,971 (55.1%) | 3,238 (44.9%) |
Production, Transportation and Moving Occupations
The most common Production, Transportation and Moving occupations in Garrard County are Production (781 | 10.8%), Transportation (336 | 4.7%), and Material Moving (266 | 3.7%).
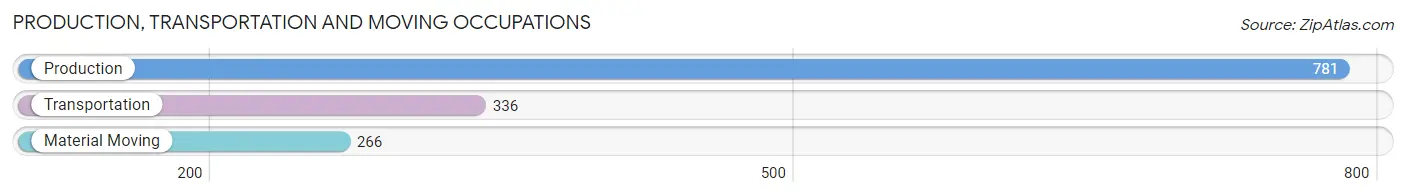
Production, Transportation and Moving Occupations by Sex
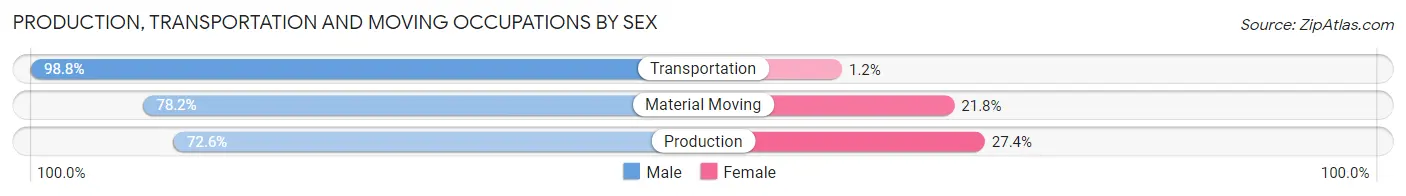
| Occupation | Male | Female |
| Production | 567 (72.6%) | 214 (27.4%) |
| Transportation | 332 (98.8%) | 4 (1.2%) |
| Material Moving | 208 (78.2%) | 58 (21.8%) |
| Total (Category) | 1,107 (80.0%) | 276 (20.0%) |
| Total (Overall) | 3,971 (55.1%) | 3,238 (44.9%) |
Employment Industries by Sex in Garrard County
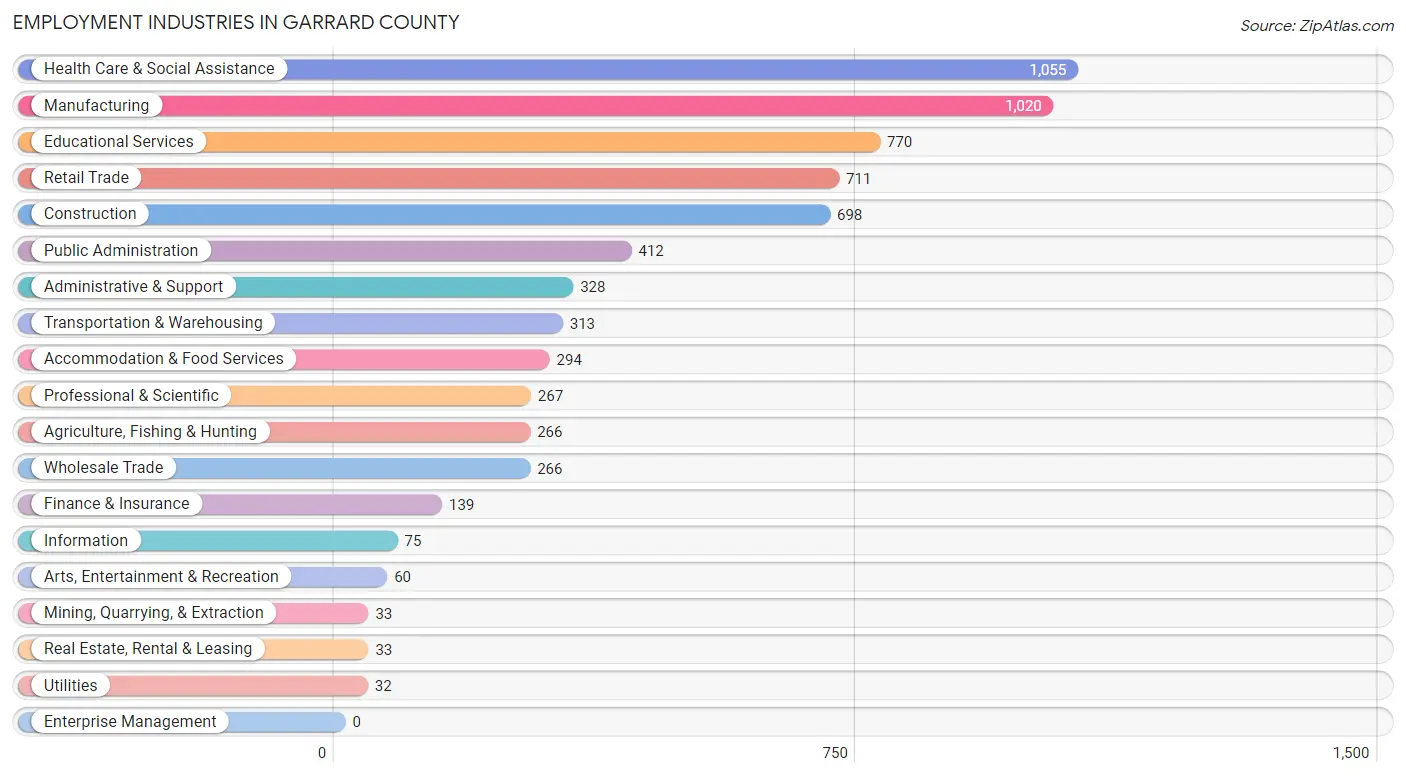
Employment Industries in Garrard County
The major employment industries in Garrard County include Health Care & Social Assistance (1,055 | 14.6%), Manufacturing (1,020 | 14.1%), Educational Services (770 | 10.7%), Retail Trade (711 | 9.9%), and Construction (698 | 9.7%).
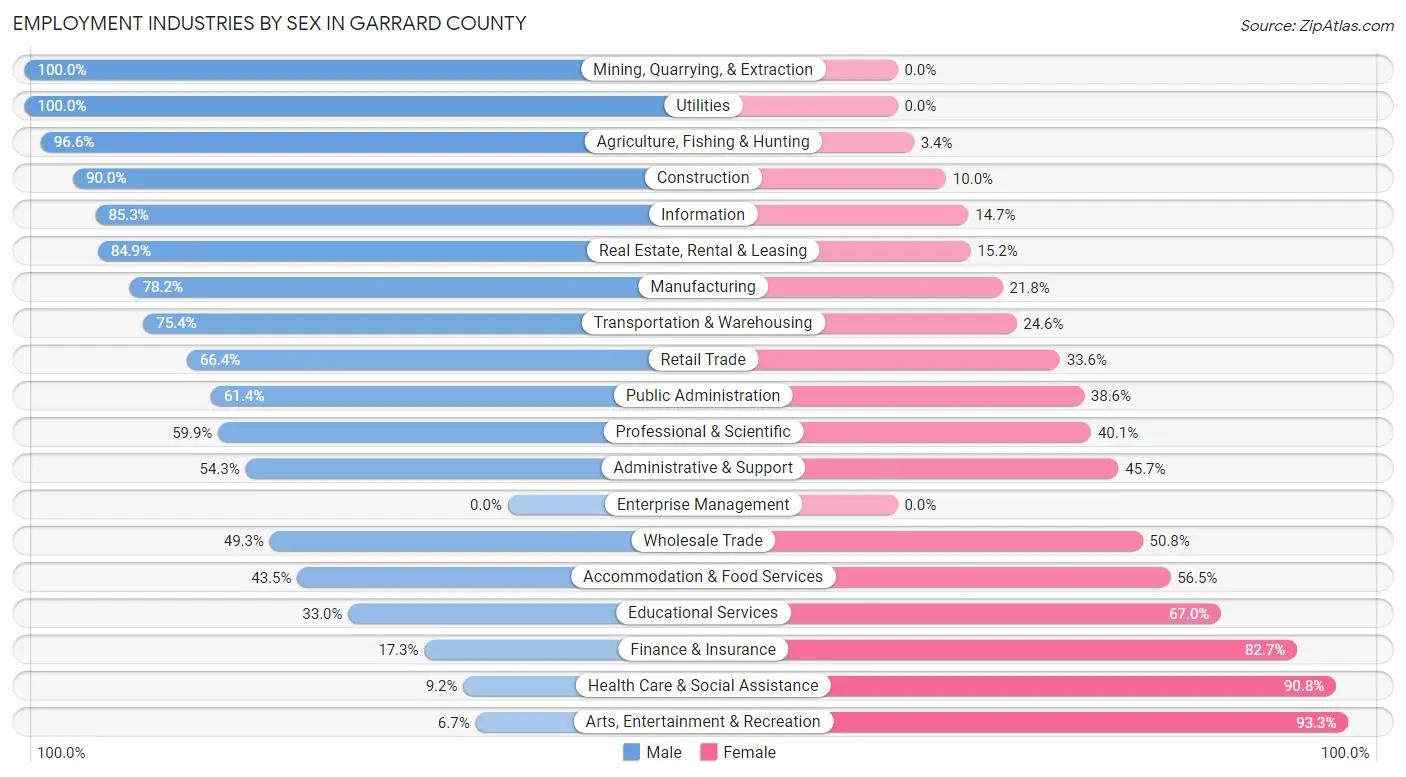
Employment Industries by Sex in Garrard County
The Garrard County industries that see more men than women are Mining, Quarrying, & Extraction (100.0%), Utilities (100.0%), and Agriculture, Fishing & Hunting (96.6%), whereas the industries that tend to have a higher number of women are Arts, Entertainment & Recreation (93.3%), Health Care & Social Assistance (90.8%), and Finance & Insurance (82.7%).
| Industry | Male | Female |
| Agriculture, Fishing & Hunting | 257 (96.6%) | 9 (3.4%) |
| Mining, Quarrying, & Extraction | 33 (100.0%) | 0 (0.0%) |
| Construction | 628 (90.0%) | 70 (10.0%) |
| Manufacturing | 798 (78.2%) | 222 (21.8%) |
| Wholesale Trade | 131 (49.2%) | 135 (50.7%) |
| Retail Trade | 472 (66.4%) | 239 (33.6%) |
| Transportation & Warehousing | 236 (75.4%) | 77 (24.6%) |
| Utilities | 32 (100.0%) | 0 (0.0%) |
| Information | 64 (85.3%) | 11 (14.7%) |
| Finance & Insurance | 24 (17.3%) | 115 (82.7%) |
| Real Estate, Rental & Leasing | 28 (84.9%) | 5 (15.1%) |
| Professional & Scientific | 160 (59.9%) | 107 (40.1%) |
| Enterprise Management | 0 (0.0%) | 0 (0.0%) |
| Administrative & Support | 178 (54.3%) | 150 (45.7%) |
| Educational Services | 254 (33.0%) | 516 (67.0%) |
| Health Care & Social Assistance | 97 (9.2%) | 958 (90.8%) |
| Arts, Entertainment & Recreation | 4 (6.7%) | 56 (93.3%) |
| Accommodation & Food Services | 128 (43.5%) | 166 (56.5%) |
| Public Administration | 253 (61.4%) | 159 (38.6%) |
| Total | 3,971 (55.1%) | 3,238 (44.9%) |
Education in Garrard County
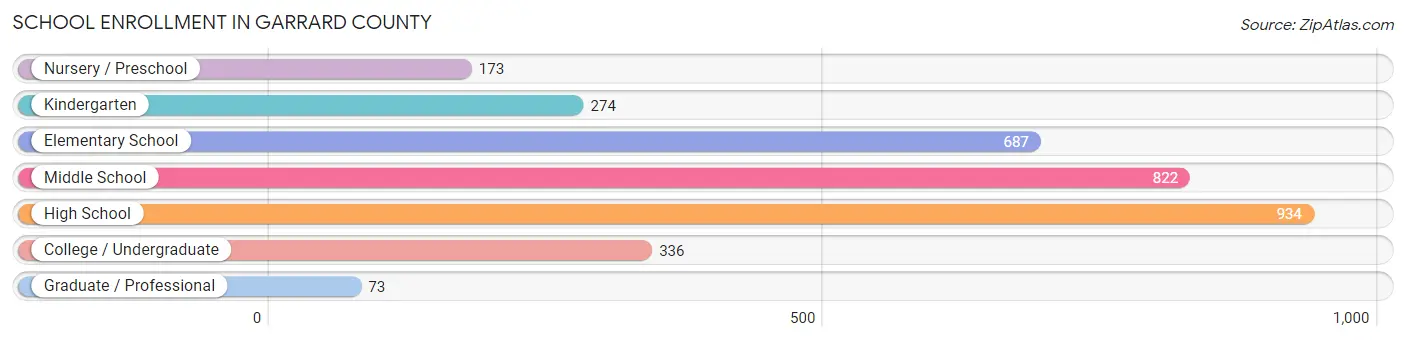
School Enrollment in Garrard County
The most common levels of schooling among the 3,299 students in Garrard County are high school (934 | 28.3%), middle school (822 | 24.9%), and elementary school (687 | 20.8%).
| School Level | # Students | % Students |
| Nursery / Preschool | 173 | 5.2% |
| Kindergarten | 274 | 8.3% |
| Elementary School | 687 | 20.8% |
| Middle School | 822 | 24.9% |
| High School | 934 | 28.3% |
| College / Undergraduate | 336 | 10.2% |
| Graduate / Professional | 73 | 2.2% |
| Total | 3,299 | 100.0% |
School Enrollment by Age by Funding Source in Garrard County
Out of a total of 3,299 students who are enrolled in schools in Garrard County, 402 (12.2%) attend a private institution, while the remaining 2,897 (87.8%) are enrolled in public schools. The age group of 25 to 34 year olds has the highest likelihood of being enrolled in private schools, with 12 (16.7% in the age bracket) enrolled. Conversely, the age group of 20 to 24 year olds has the lowest likelihood of being enrolled in a private school, with 195 (96.1% in the age bracket) attending a public institution.
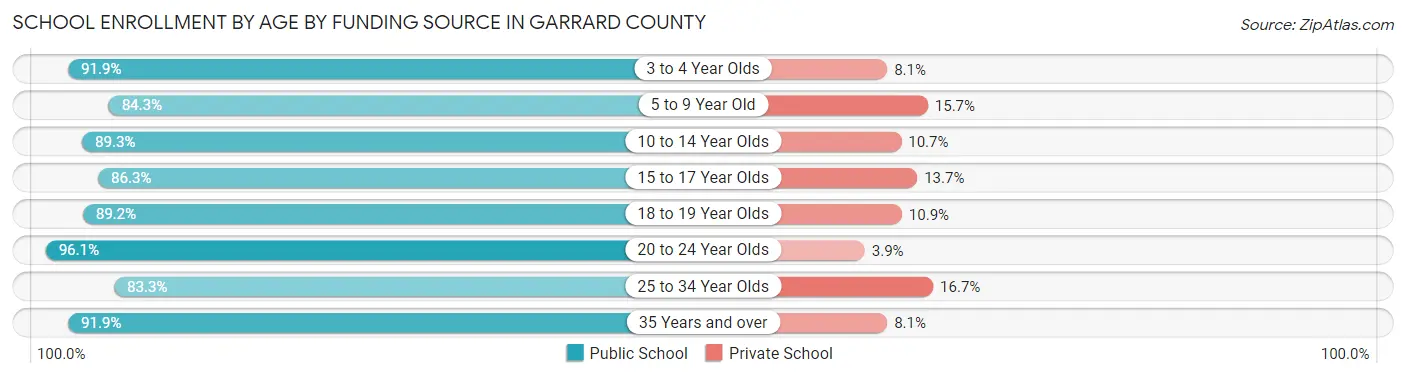
| Age Bracket | Public School | Private School |
| 3 to 4 Year Olds | 136 (91.9%) | 12 (8.1%) |
| 5 to 9 Year Old | 780 (84.3%) | 145 (15.7%) |
| 10 to 14 Year Olds | 865 (89.3%) | 104 (10.7%) |
| 15 to 17 Year Olds | 529 (86.3%) | 84 (13.7%) |
| 18 to 19 Year Olds | 230 (89.1%) | 28 (10.8%) |
| 20 to 24 Year Olds | 195 (96.1%) | 8 (3.9%) |
| 25 to 34 Year Olds | 60 (83.3%) | 12 (16.7%) |
| 35 Years and over | 102 (91.9%) | 9 (8.1%) |
| Total | 2,897 (87.8%) | 402 (12.2%) |
Educational Attainment by Field of Study in Garrard County
Education (646 | 24.1%), science & technology (429 | 16.0%), business (342 | 12.8%), arts & humanities (205 | 7.6%), and bio, nature & agricultural (182 | 6.8%) are the most common fields of study among 2,678 individuals in Garrard County who have obtained a bachelor's degree or higher.
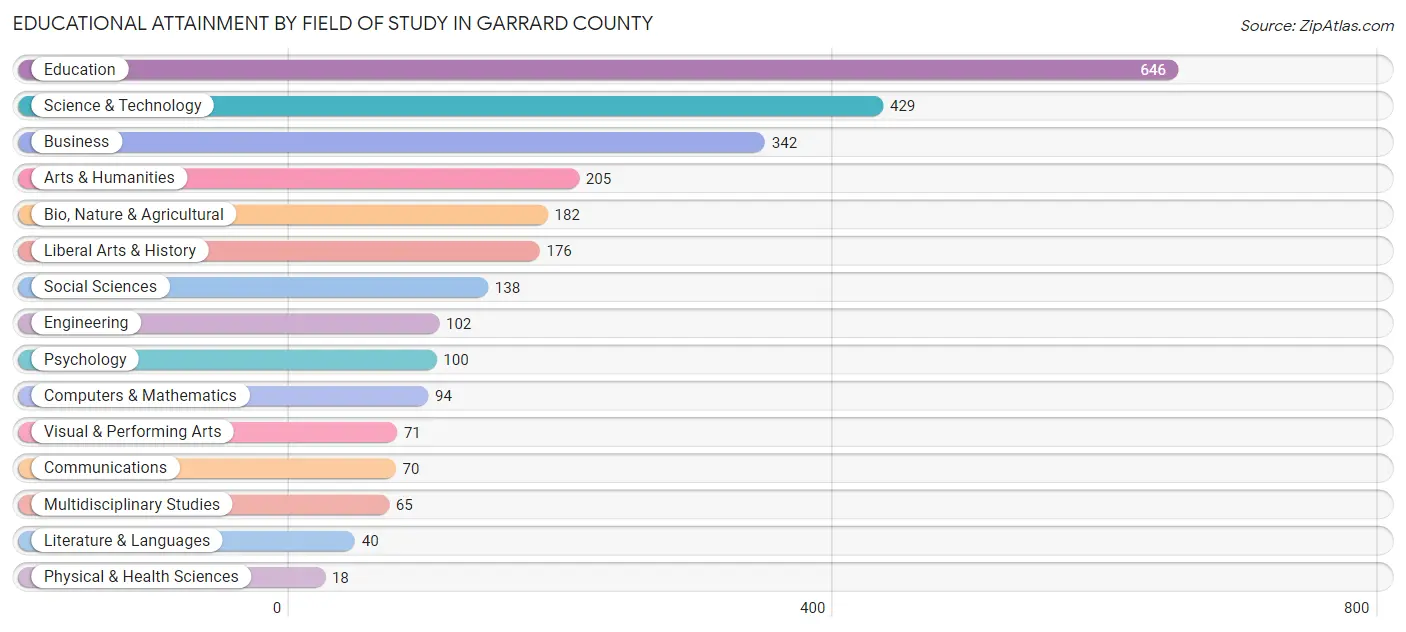
| Field of Study | # Graduates | % Graduates |
| Computers & Mathematics | 94 | 3.5% |
| Bio, Nature & Agricultural | 182 | 6.8% |
| Physical & Health Sciences | 18 | 0.7% |
| Psychology | 100 | 3.7% |
| Social Sciences | 138 | 5.1% |
| Engineering | 102 | 3.8% |
| Multidisciplinary Studies | 65 | 2.4% |
| Science & Technology | 429 | 16.0% |
| Business | 342 | 12.8% |
| Education | 646 | 24.1% |
| Literature & Languages | 40 | 1.5% |
| Liberal Arts & History | 176 | 6.6% |
| Visual & Performing Arts | 71 | 2.6% |
| Communications | 70 | 2.6% |
| Arts & Humanities | 205 | 7.6% |
| Total | 2,678 | 100.0% |
Transportation & Commute in Garrard County
Vehicle Availability by Sex in Garrard County
The most prevalent vehicle ownership categories in Garrard County are males with 2 vehicles (1,447, accounting for 37.0%) and females with 2 vehicles (1,206, making up 45.1%).
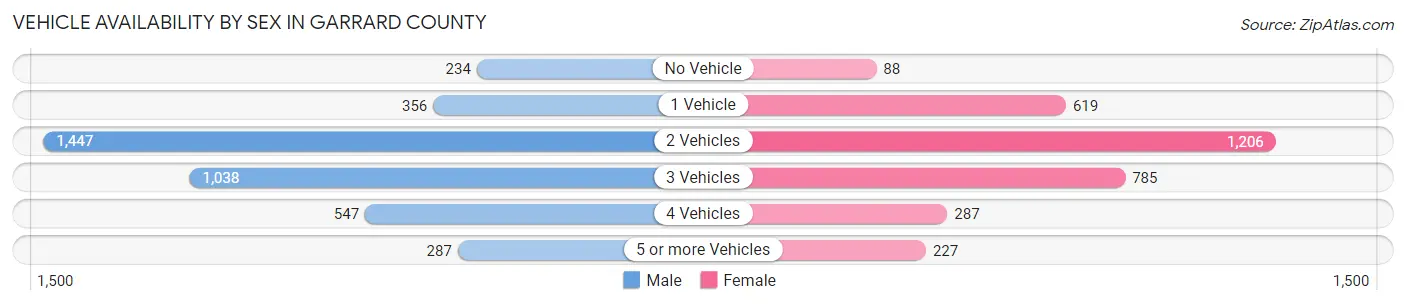
| Vehicles Available | Male | Female |
| No Vehicle | 234 (6.0%) | 88 (2.7%) |
| 1 Vehicle | 356 (9.1%) | 619 (19.3%) |
| 2 Vehicles | 1,447 (37.0%) | 1,206 (37.6%) |
| 3 Vehicles | 1,038 (26.6%) | 785 (24.4%) |
| 4 Vehicles | 547 (14.0%) | 287 (8.9%) |
| 5 or more Vehicles | 287 (7.3%) | 227 (7.1%) |
| Total | 3,909 (100.0%) | 3,212 (100.0%) |
Commute Time in Garrard County
The most frequently occuring commute durations in Garrard County are 45 to 59 minutes (961 commuters, 15.0%), 30 to 34 minutes (797 commuters, 12.5%), and 20 to 24 minutes (730 commuters, 11.4%).
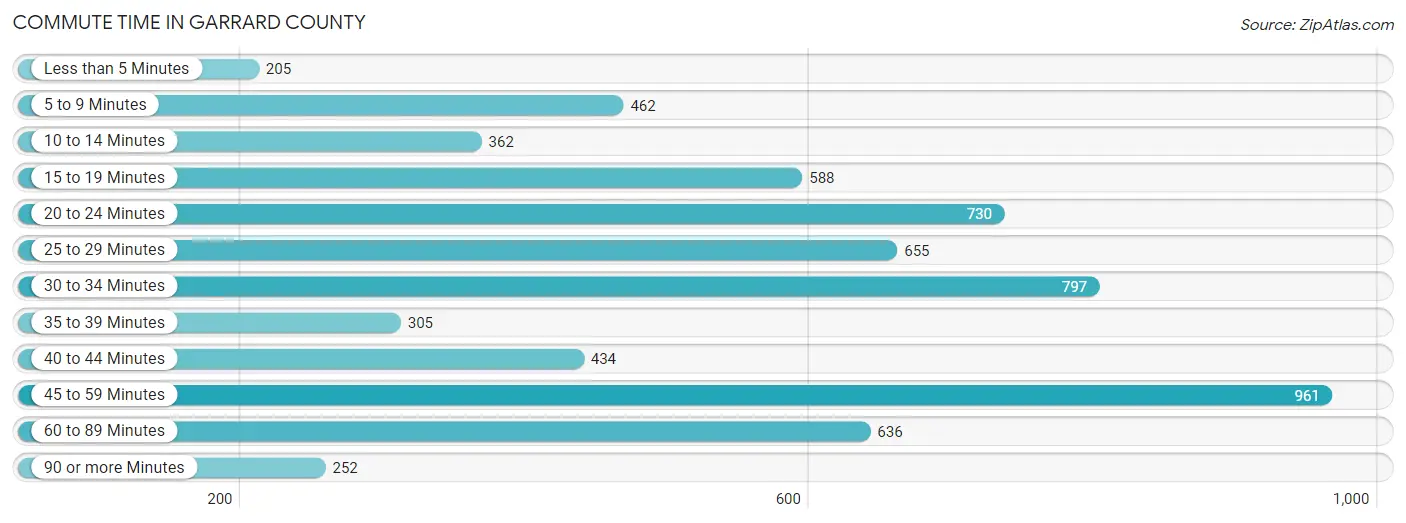
| Commute Time | # Commuters | % Commuters |
| Less than 5 Minutes | 205 | 3.2% |
| 5 to 9 Minutes | 462 | 7.2% |
| 10 to 14 Minutes | 362 | 5.7% |
| 15 to 19 Minutes | 588 | 9.2% |
| 20 to 24 Minutes | 730 | 11.4% |
| 25 to 29 Minutes | 655 | 10.3% |
| 30 to 34 Minutes | 797 | 12.5% |
| 35 to 39 Minutes | 305 | 4.8% |
| 40 to 44 Minutes | 434 | 6.8% |
| 45 to 59 Minutes | 961 | 15.0% |
| 60 to 89 Minutes | 636 | 10.0% |
| 90 or more Minutes | 252 | 4.0% |
Commute Time by Sex in Garrard County
The most common commute times in Garrard County are 30 to 34 minutes (481 commuters, 13.9%) for males and 45 to 59 minutes (494 commuters, 16.9%) for females.
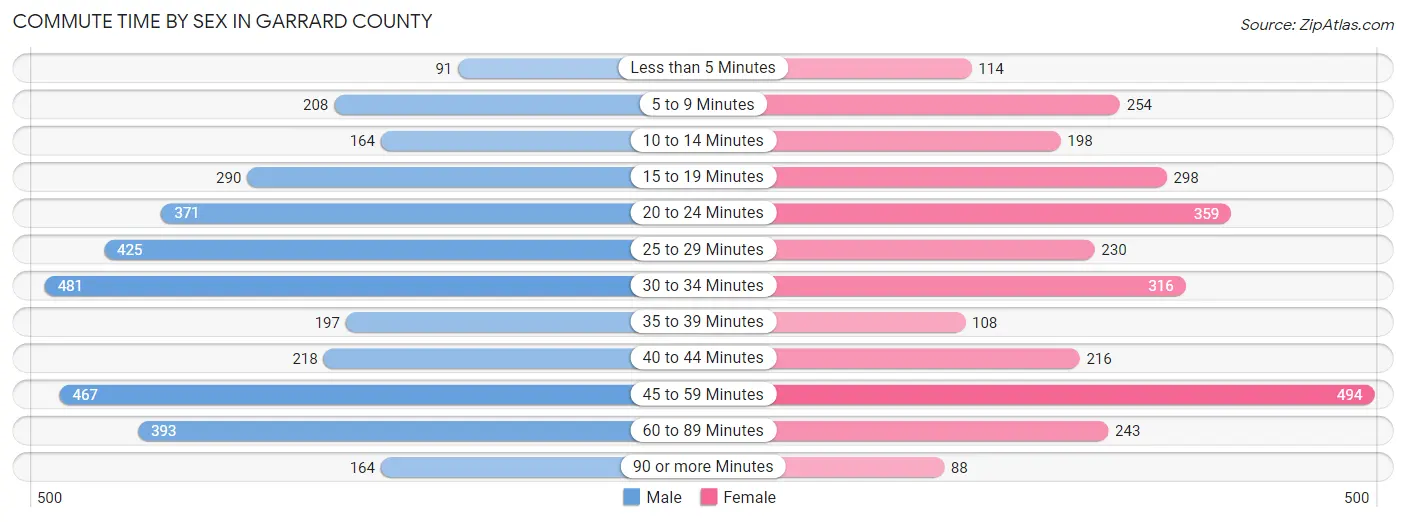
| Commute Time | Male | Female |
| Less than 5 Minutes | 91 (2.6%) | 114 (3.9%) |
| 5 to 9 Minutes | 208 (6.0%) | 254 (8.7%) |
| 10 to 14 Minutes | 164 (4.7%) | 198 (6.8%) |
| 15 to 19 Minutes | 290 (8.4%) | 298 (10.2%) |
| 20 to 24 Minutes | 371 (10.7%) | 359 (12.3%) |
| 25 to 29 Minutes | 425 (12.2%) | 230 (7.9%) |
| 30 to 34 Minutes | 481 (13.9%) | 316 (10.8%) |
| 35 to 39 Minutes | 197 (5.7%) | 108 (3.7%) |
| 40 to 44 Minutes | 218 (6.3%) | 216 (7.4%) |
| 45 to 59 Minutes | 467 (13.5%) | 494 (16.9%) |
| 60 to 89 Minutes | 393 (11.3%) | 243 (8.3%) |
| 90 or more Minutes | 164 (4.7%) | 88 (3.0%) |
Time of Departure to Work by Sex in Garrard County
The most frequent times of departure to work in Garrard County are 7:00 AM to 7:29 AM (707, 20.4%) for males and 7:00 AM to 7:29 AM (673, 23.1%) for females.
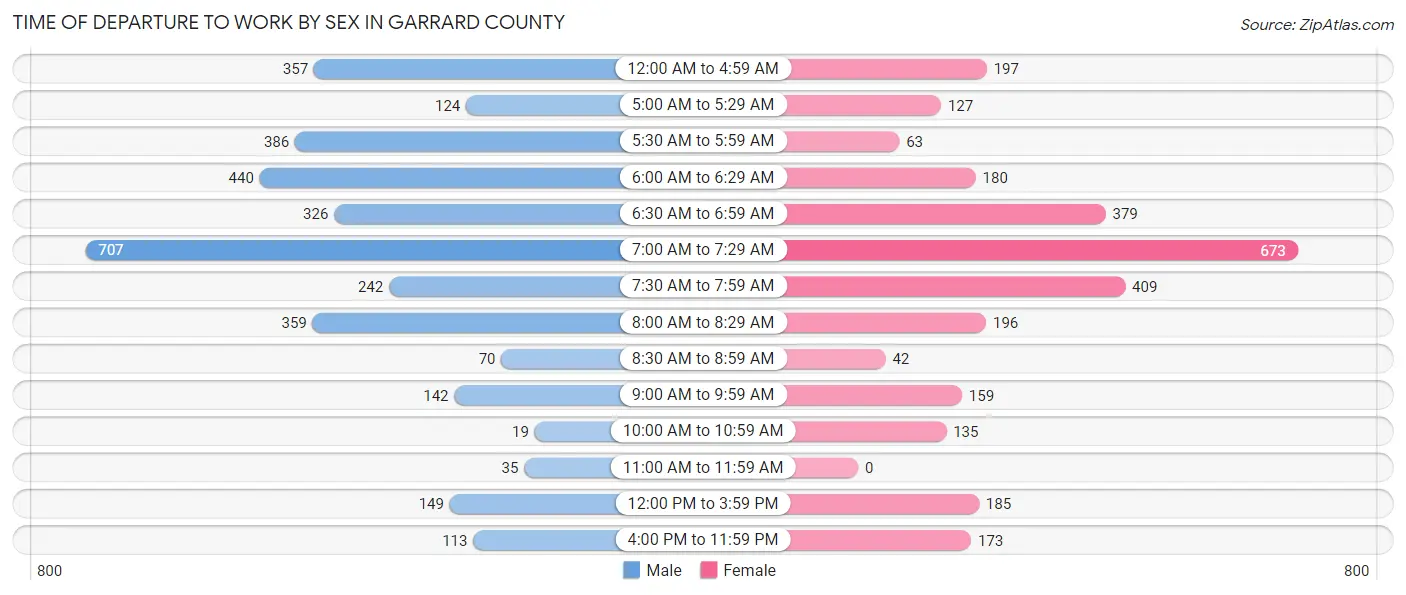
| Time of Departure | Male | Female |
| 12:00 AM to 4:59 AM | 357 (10.3%) | 197 (6.8%) |
| 5:00 AM to 5:29 AM | 124 (3.6%) | 127 (4.3%) |
| 5:30 AM to 5:59 AM | 386 (11.1%) | 63 (2.2%) |
| 6:00 AM to 6:29 AM | 440 (12.7%) | 180 (6.2%) |
| 6:30 AM to 6:59 AM | 326 (9.4%) | 379 (13.0%) |
| 7:00 AM to 7:29 AM | 707 (20.4%) | 673 (23.1%) |
| 7:30 AM to 7:59 AM | 242 (7.0%) | 409 (14.0%) |
| 8:00 AM to 8:29 AM | 359 (10.3%) | 196 (6.7%) |
| 8:30 AM to 8:59 AM | 70 (2.0%) | 42 (1.4%) |
| 9:00 AM to 9:59 AM | 142 (4.1%) | 159 (5.4%) |
| 10:00 AM to 10:59 AM | 19 (0.5%) | 135 (4.6%) |
| 11:00 AM to 11:59 AM | 35 (1.0%) | 0 (0.0%) |
| 12:00 PM to 3:59 PM | 149 (4.3%) | 185 (6.3%) |
| 4:00 PM to 11:59 PM | 113 (3.3%) | 173 (5.9%) |
| Total | 3,469 (100.0%) | 2,918 (100.0%) |
Housing Occupancy in Garrard County
Occupancy by Ownership in Garrard County
Of the total 6,488 dwellings in Garrard County, owner-occupied units account for 5,248 (80.9%), while renter-occupied units make up 1,240 (19.1%).

| Occupancy | # Housing Units | % Housing Units |
| Owner Occupied Housing Units | 5,248 | 80.9% |
| Renter-Occupied Housing Units | 1,240 | 19.1% |
| Total Occupied Housing Units | 6,488 | 100.0% |
Occupancy by Household Size in Garrard County
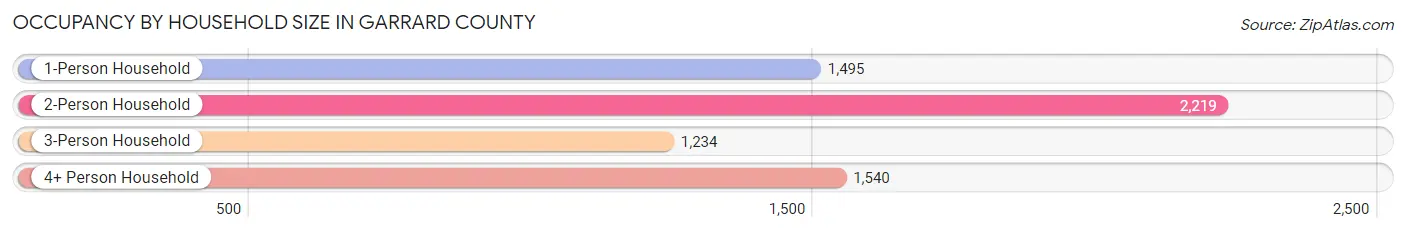
| Household Size | # Housing Units | % Housing Units |
| 1-Person Household | 1,495 | 23.0% |
| 2-Person Household | 2,219 | 34.2% |
| 3-Person Household | 1,234 | 19.0% |
| 4+ Person Household | 1,540 | 23.7% |
| Total Housing Units | 6,488 | 100.0% |
Occupancy by Ownership by Household Size in Garrard County
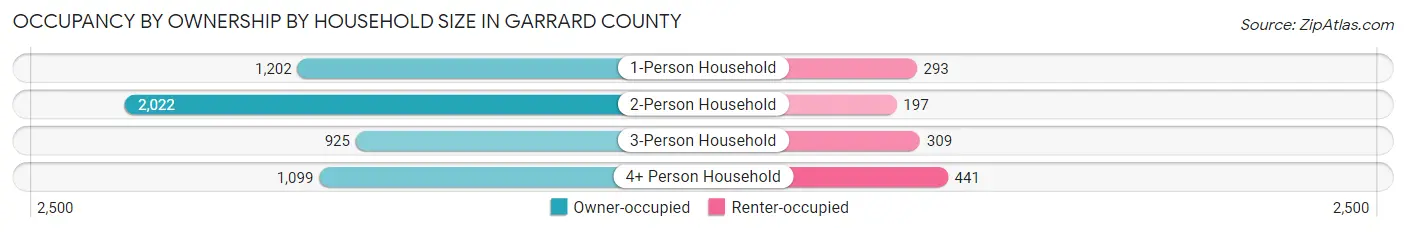
| Household Size | Owner-occupied | Renter-occupied |
| 1-Person Household | 1,202 (80.4%) | 293 (19.6%) |
| 2-Person Household | 2,022 (91.1%) | 197 (8.9%) |
| 3-Person Household | 925 (75.0%) | 309 (25.0%) |
| 4+ Person Household | 1,099 (71.4%) | 441 (28.6%) |
| Total Housing Units | 5,248 (80.9%) | 1,240 (19.1%) |
Occupancy by Educational Attainment in Garrard County
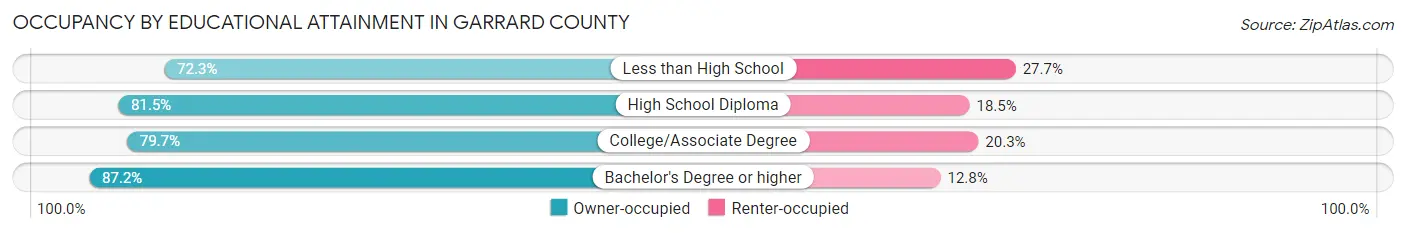
| Household Size | Owner-occupied | Renter-occupied |
| Less than High School | 698 (72.3%) | 267 (27.7%) |
| High School Diploma | 1,849 (81.5%) | 420 (18.5%) |
| College/Associate Degree | 1,463 (79.7%) | 372 (20.3%) |
| Bachelor's Degree or higher | 1,238 (87.2%) | 181 (12.8%) |
Occupancy by Age of Householder in Garrard County
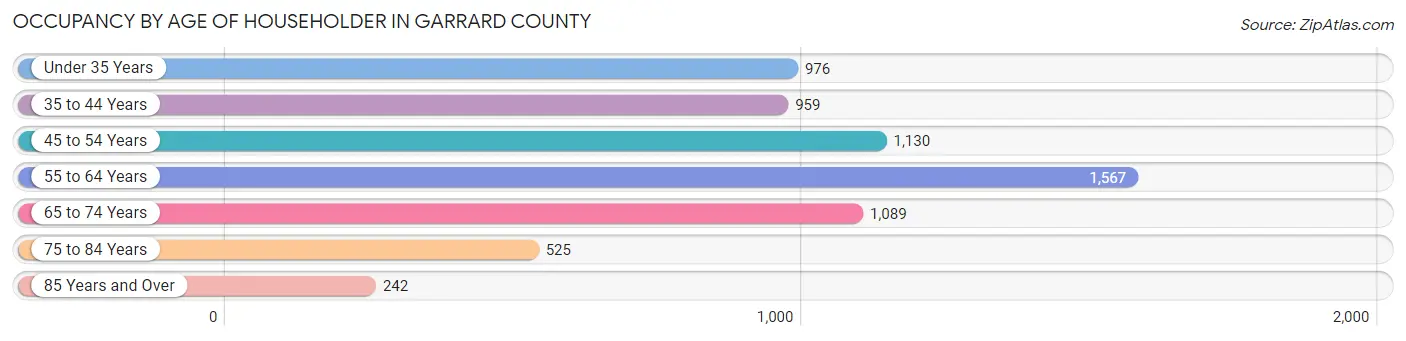
| Age Bracket | # Households | % Households |
| Under 35 Years | 976 | 15.0% |
| 35 to 44 Years | 959 | 14.8% |
| 45 to 54 Years | 1,130 | 17.4% |
| 55 to 64 Years | 1,567 | 24.1% |
| 65 to 74 Years | 1,089 | 16.8% |
| 75 to 84 Years | 525 | 8.1% |
| 85 Years and Over | 242 | 3.7% |
| Total | 6,488 | 100.0% |
Housing Finances in Garrard County
Median Income by Occupancy in Garrard County
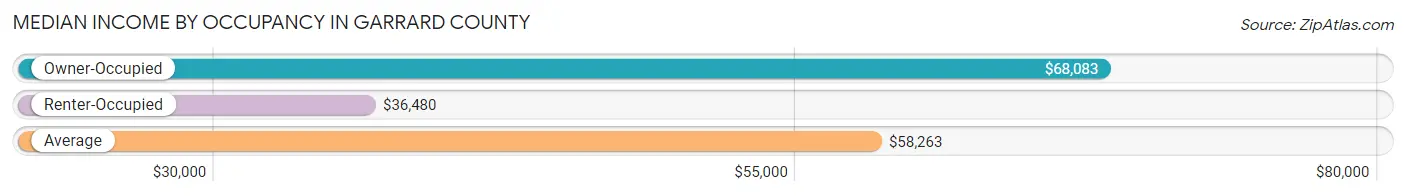
| Occupancy Type | # Households | Median Income |
| Owner-Occupied | 5,248 (80.9%) | $68,083 |
| Renter-Occupied | 1,240 (19.1%) | $36,480 |
| Average | 6,488 (100.0%) | $58,263 |
Occupancy by Householder Income Bracket in Garrard County
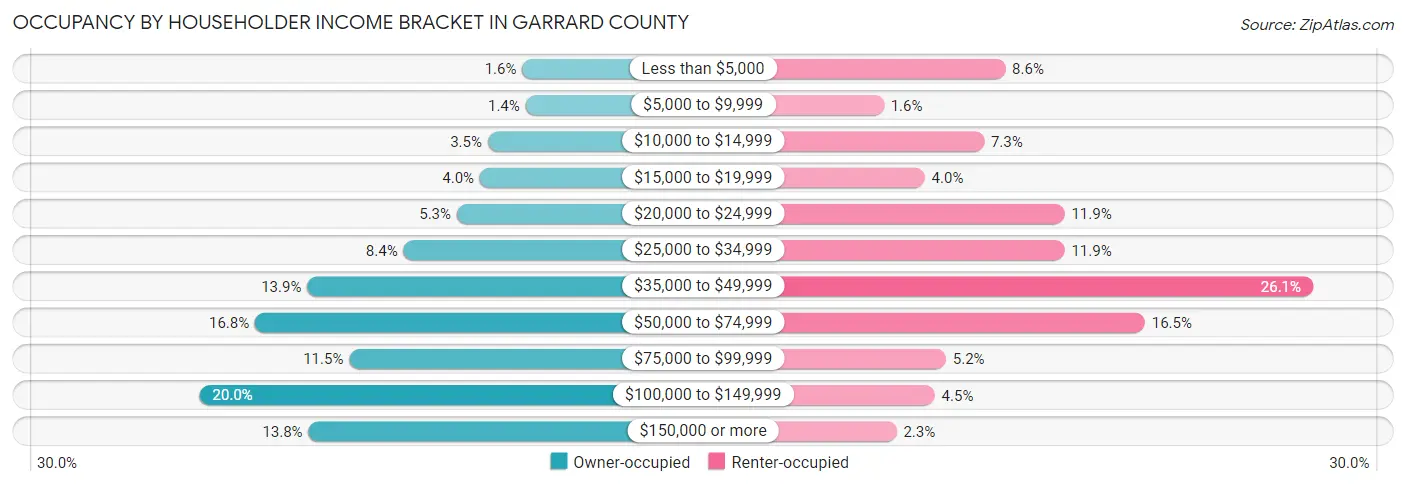
| Income Bracket | Owner-occupied | Renter-occupied |
| Less than $5,000 | 82 (1.6%) | 106 (8.6%) |
| $5,000 to $9,999 | 72 (1.4%) | 20 (1.6%) |
| $10,000 to $14,999 | 185 (3.5%) | 91 (7.3%) |
| $15,000 to $19,999 | 209 (4.0%) | 49 (4.0%) |
| $20,000 to $24,999 | 278 (5.3%) | 148 (11.9%) |
| $25,000 to $34,999 | 438 (8.4%) | 148 (11.9%) |
| $35,000 to $49,999 | 727 (13.9%) | 324 (26.1%) |
| $50,000 to $74,999 | 883 (16.8%) | 205 (16.5%) |
| $75,000 to $99,999 | 601 (11.5%) | 64 (5.2%) |
| $100,000 to $149,999 | 1,050 (20.0%) | 56 (4.5%) |
| $150,000 or more | 723 (13.8%) | 29 (2.3%) |
| Total | 5,248 (100.0%) | 1,240 (100.0%) |
Monthly Housing Cost Tiers in Garrard County
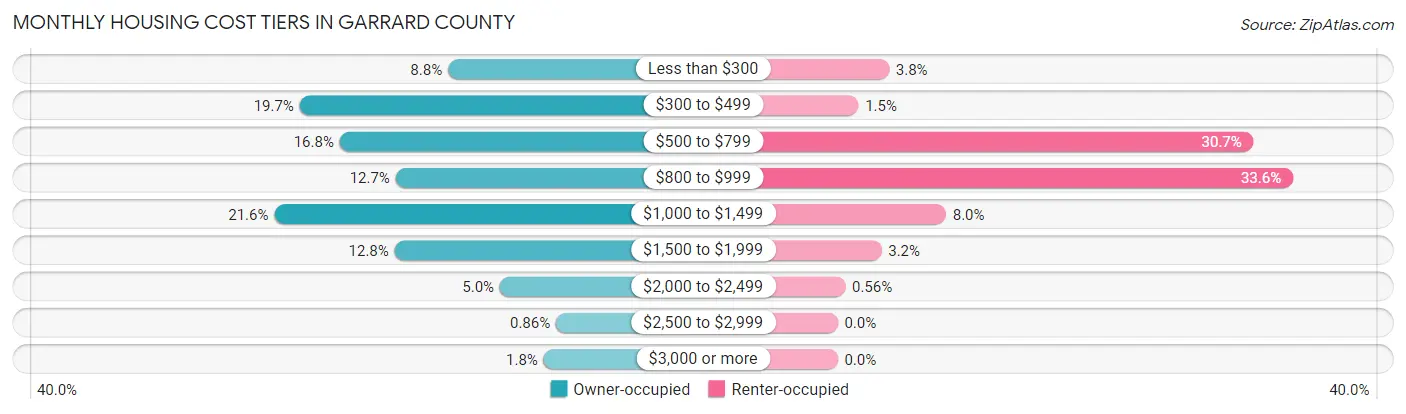
| Monthly Cost | Owner-occupied | Renter-occupied |
| Less than $300 | 463 (8.8%) | 47 (3.8%) |
| $300 to $499 | 1,036 (19.7%) | 19 (1.5%) |
| $500 to $799 | 881 (16.8%) | 380 (30.6%) |
| $800 to $999 | 665 (12.7%) | 416 (33.6%) |
| $1,000 to $1,499 | 1,134 (21.6%) | 99 (8.0%) |
| $1,500 to $1,999 | 669 (12.8%) | 40 (3.2%) |
| $2,000 to $2,499 | 262 (5.0%) | 7 (0.6%) |
| $2,500 to $2,999 | 45 (0.9%) | 0 (0.0%) |
| $3,000 or more | 93 (1.8%) | 0 (0.0%) |
| Total | 5,248 (100.0%) | 1,240 (100.0%) |
Physical Housing Characteristics in Garrard County
Housing Structures in Garrard County
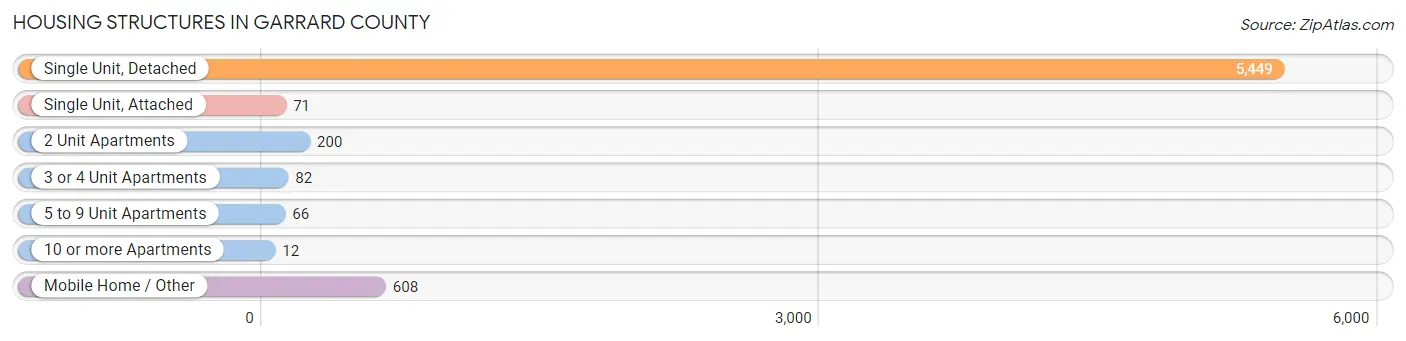
| Structure Type | # Housing Units | % Housing Units |
| Single Unit, Detached | 5,449 | 84.0% |
| Single Unit, Attached | 71 | 1.1% |
| 2 Unit Apartments | 200 | 3.1% |
| 3 or 4 Unit Apartments | 82 | 1.3% |
| 5 to 9 Unit Apartments | 66 | 1.0% |
| 10 or more Apartments | 12 | 0.2% |
| Mobile Home / Other | 608 | 9.4% |
| Total | 6,488 | 100.0% |
Housing Structures by Occupancy in Garrard County
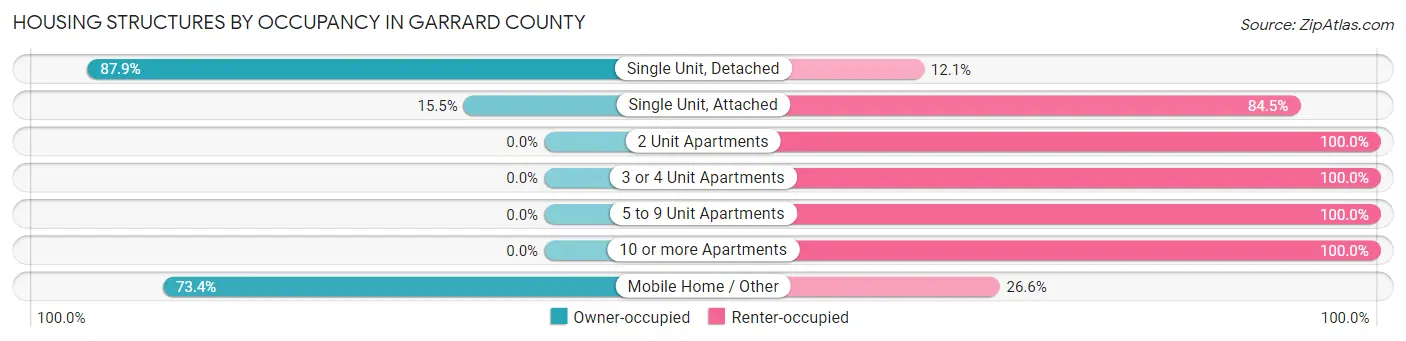
| Structure Type | Owner-occupied | Renter-occupied |
| Single Unit, Detached | 4,791 (87.9%) | 658 (12.1%) |
| Single Unit, Attached | 11 (15.5%) | 60 (84.5%) |
| 2 Unit Apartments | 0 (0.0%) | 200 (100.0%) |
| 3 or 4 Unit Apartments | 0 (0.0%) | 82 (100.0%) |
| 5 to 9 Unit Apartments | 0 (0.0%) | 66 (100.0%) |
| 10 or more Apartments | 0 (0.0%) | 12 (100.0%) |
| Mobile Home / Other | 446 (73.4%) | 162 (26.6%) |
| Total | 5,248 (80.9%) | 1,240 (19.1%) |
Housing Structures by Number of Rooms in Garrard County
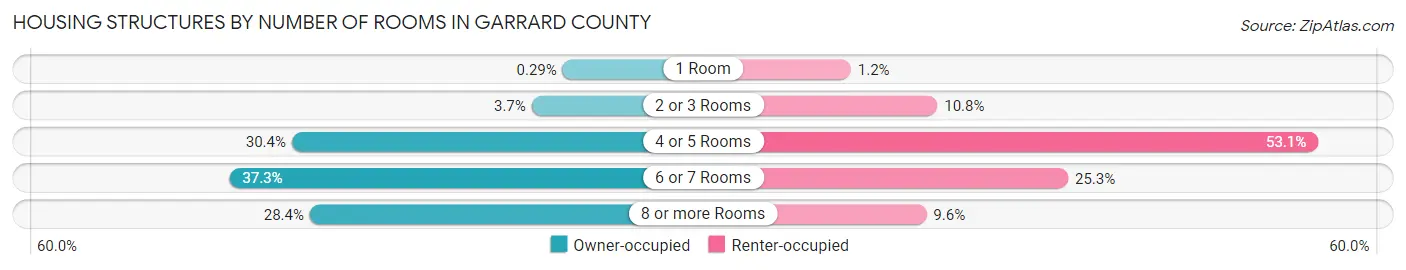
| Number of Rooms | Owner-occupied | Renter-occupied |
| 1 Room | 15 (0.3%) | 15 (1.2%) |
| 2 or 3 Rooms | 196 (3.7%) | 134 (10.8%) |
| 4 or 5 Rooms | 1,593 (30.3%) | 658 (53.1%) |
| 6 or 7 Rooms | 1,956 (37.3%) | 314 (25.3%) |
| 8 or more Rooms | 1,488 (28.3%) | 119 (9.6%) |
| Total | 5,248 (100.0%) | 1,240 (100.0%) |
Housing Structure by Heating Type in Garrard County
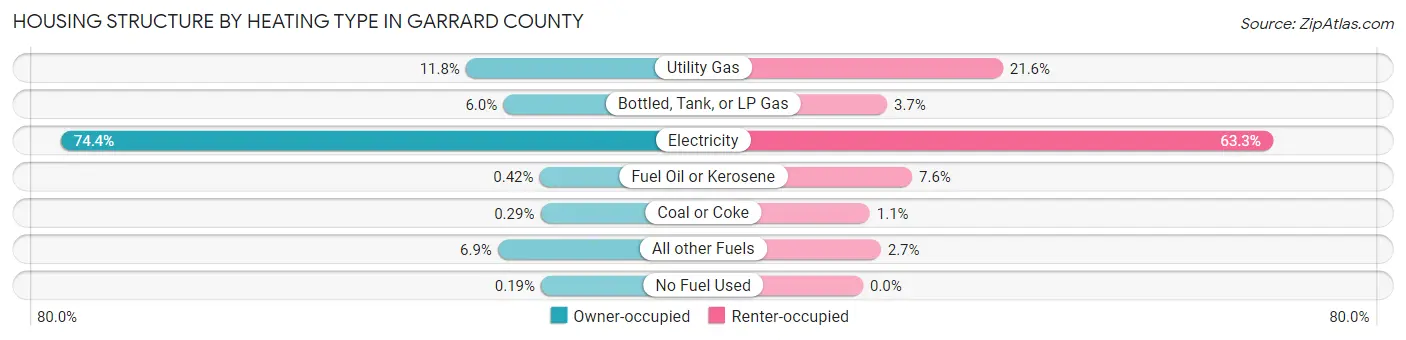
| Heating Type | Owner-occupied | Renter-occupied |
| Utility Gas | 620 (11.8%) | 268 (21.6%) |
| Bottled, Tank, or LP Gas | 317 (6.0%) | 46 (3.7%) |
| Electricity | 3,904 (74.4%) | 785 (63.3%) |
| Fuel Oil or Kerosene | 22 (0.4%) | 94 (7.6%) |
| Coal or Coke | 15 (0.3%) | 13 (1.1%) |
| All other Fuels | 360 (6.9%) | 34 (2.7%) |
| No Fuel Used | 10 (0.2%) | 0 (0.0%) |
| Total | 5,248 (100.0%) | 1,240 (100.0%) |
Household Vehicle Usage in Garrard County
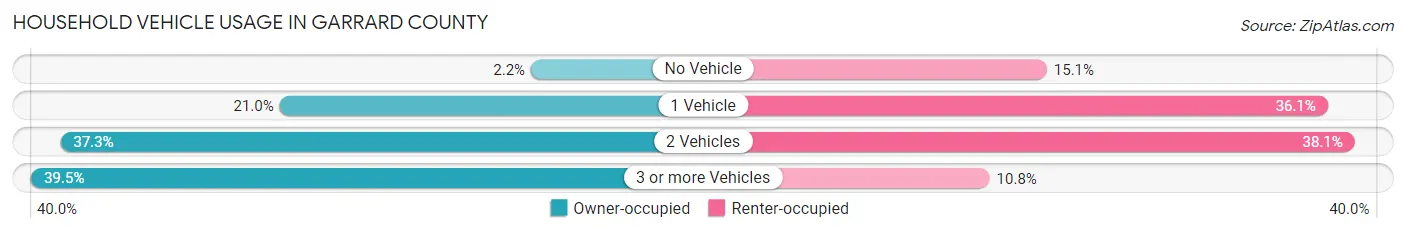
| Vehicles per Household | Owner-occupied | Renter-occupied |
| No Vehicle | 115 (2.2%) | 187 (15.1%) |
| 1 Vehicle | 1,100 (21.0%) | 447 (36.0%) |
| 2 Vehicles | 1,959 (37.3%) | 472 (38.1%) |
| 3 or more Vehicles | 2,074 (39.5%) | 134 (10.8%) |
| Total | 5,248 (100.0%) | 1,240 (100.0%) |
Real Estate & Mortgages in Garrard County
Real Estate and Mortgage Overview in Garrard County
| Characteristic | Without Mortgage | With Mortgage |
| Housing Units | 2,000 | 3,248 |
| Median Property Value | $153,400 | $191,500 |
| Median Household Income | $52,065 | $563 |
| Monthly Housing Costs | $424 | $85 |
| Real Estate Taxes | $1,151 | $32 |
Property Value by Mortgage Status in Garrard County
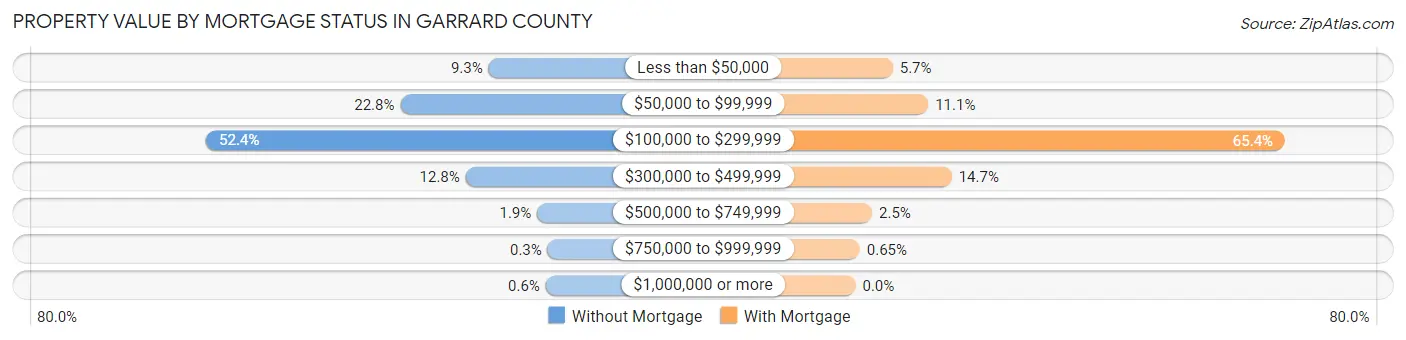
| Property Value | Without Mortgage | With Mortgage |
| Less than $50,000 | 186 (9.3%) | 184 (5.7%) |
| $50,000 to $99,999 | 455 (22.8%) | 360 (11.1%) |
| $100,000 to $299,999 | 1,047 (52.3%) | 2,125 (65.4%) |
| $300,000 to $499,999 | 256 (12.8%) | 476 (14.7%) |
| $500,000 to $749,999 | 38 (1.9%) | 82 (2.5%) |
| $750,000 to $999,999 | 6 (0.3%) | 21 (0.6%) |
| $1,000,000 or more | 12 (0.6%) | 0 (0.0%) |
| Total | 2,000 (100.0%) | 3,248 (100.0%) |
Household Income by Mortgage Status in Garrard County
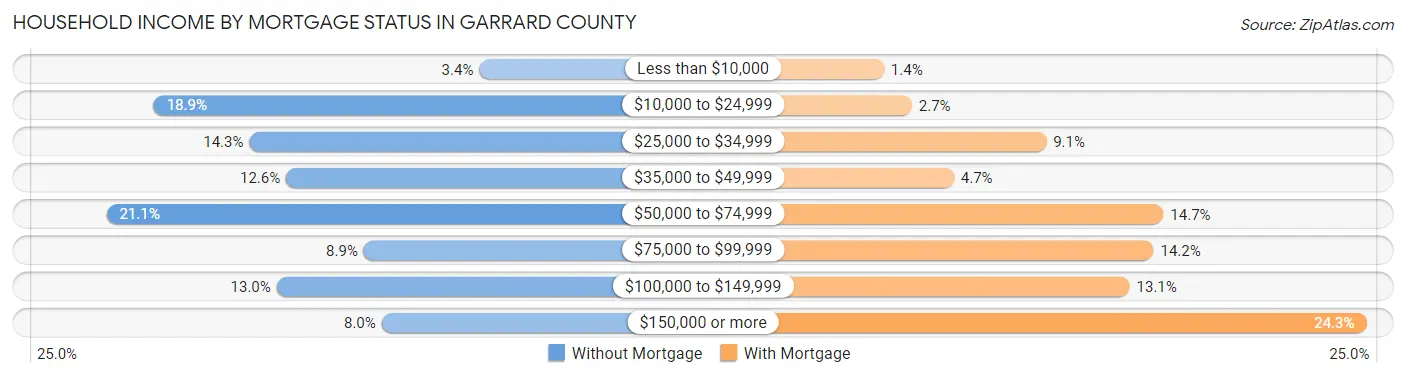
| Household Income | Without Mortgage | With Mortgage |
| Less than $10,000 | 67 (3.4%) | 44 (1.3%) |
| $10,000 to $24,999 | 377 (18.9%) | 87 (2.7%) |
| $25,000 to $34,999 | 286 (14.3%) | 295 (9.1%) |
| $35,000 to $49,999 | 251 (12.6%) | 152 (4.7%) |
| $50,000 to $74,999 | 422 (21.1%) | 476 (14.7%) |
| $75,000 to $99,999 | 177 (8.8%) | 461 (14.2%) |
| $100,000 to $149,999 | 260 (13.0%) | 424 (13.1%) |
| $150,000 or more | 160 (8.0%) | 790 (24.3%) |
| Total | 2,000 (100.0%) | 3,248 (100.0%) |
Property Value to Household Income Ratio in Garrard County
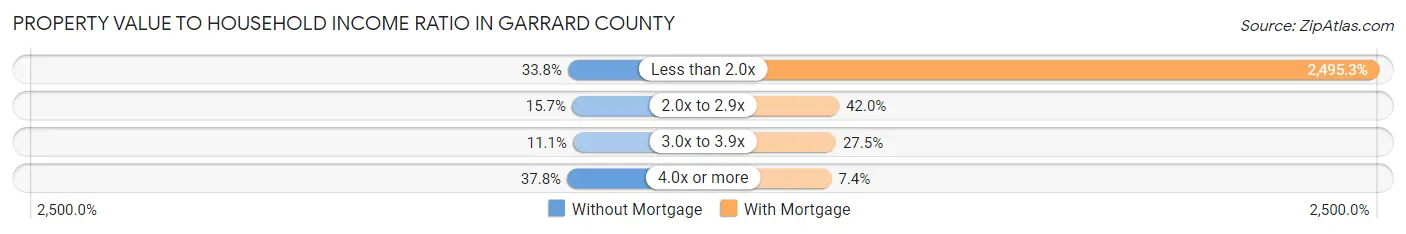
| Value-to-Income Ratio | Without Mortgage | With Mortgage |
| Less than 2.0x | 675 (33.8%) | 81,048 (2,495.3%) |
| 2.0x to 2.9x | 314 (15.7%) | 1,365 (42.0%) |
| 3.0x to 3.9x | 221 (11.1%) | 894 (27.5%) |
| 4.0x or more | 755 (37.8%) | 239 (7.4%) |
| Total | 2,000 (100.0%) | 3,248 (100.0%) |
Real Estate Taxes by Mortgage Status in Garrard County
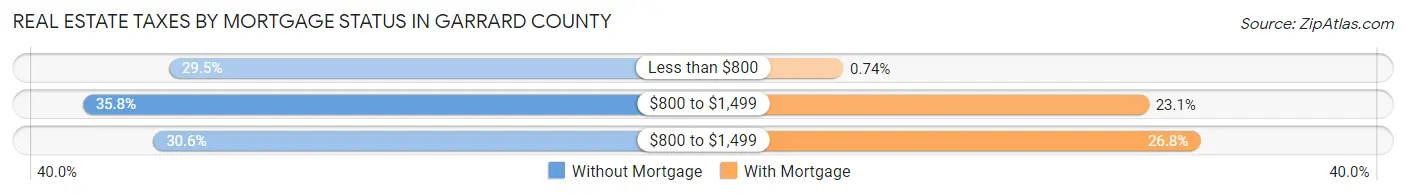
| Property Taxes | Without Mortgage | With Mortgage |
| Less than $800 | 589 (29.4%) | 24 (0.7%) |
| $800 to $1,499 | 715 (35.7%) | 749 (23.1%) |
| $800 to $1,499 | 612 (30.6%) | 871 (26.8%) |
| Total | 2,000 (100.0%) | 3,248 (100.0%) |
Health & Disability in Garrard County
Health Insurance Coverage by Age in Garrard County
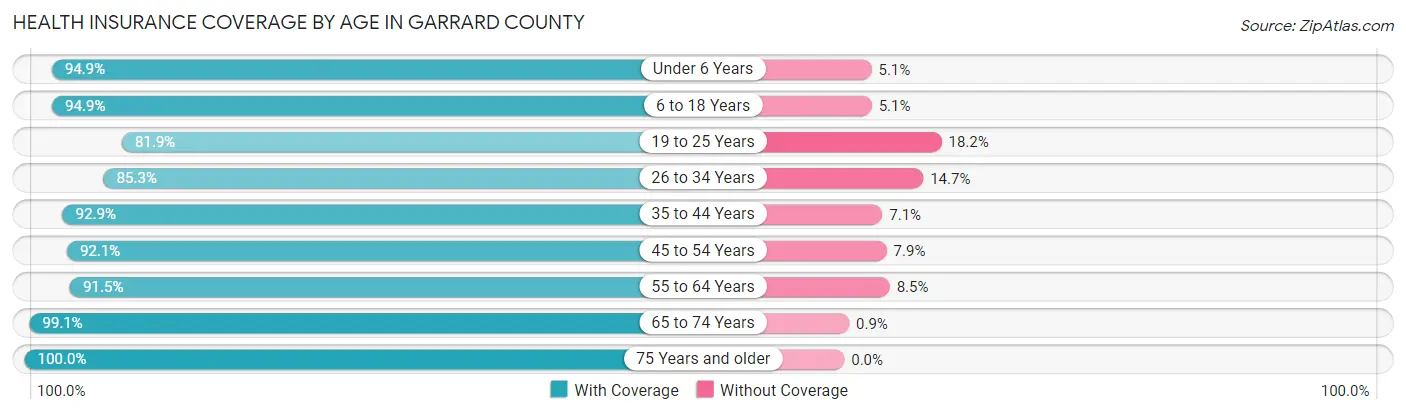
| Age Bracket | With Coverage | Without Coverage |
| Under 6 Years | 1,121 (94.9%) | 60 (5.1%) |
| 6 to 18 Years | 2,629 (94.9%) | 142 (5.1%) |
| 19 to 25 Years | 911 (81.9%) | 202 (18.1%) |
| 26 to 34 Years | 1,477 (85.3%) | 255 (14.7%) |
| 35 to 44 Years | 1,964 (92.9%) | 150 (7.1%) |
| 45 to 54 Years | 2,168 (92.1%) | 186 (7.9%) |
| 55 to 64 Years | 2,486 (91.5%) | 230 (8.5%) |
| 65 to 74 Years | 1,868 (99.1%) | 17 (0.9%) |
| 75 Years and older | 1,209 (100.0%) | 0 (0.0%) |
| Total | 15,833 (92.7%) | 1,242 (7.3%) |
Health Insurance Coverage by Citizenship Status in Garrard County
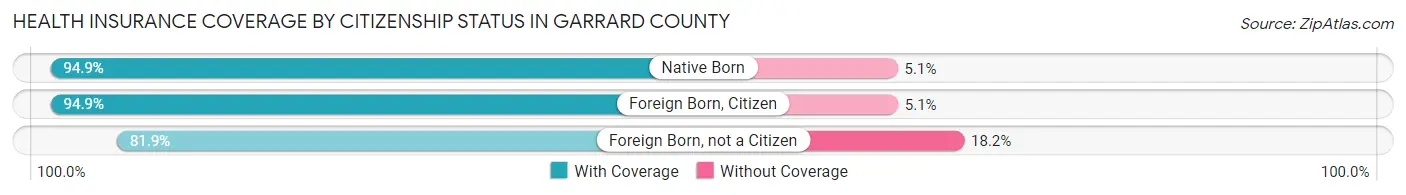
| Citizenship Status | With Coverage | Without Coverage |
| Native Born | 1,121 (94.9%) | 60 (5.1%) |
| Foreign Born, Citizen | 2,629 (94.9%) | 142 (5.1%) |
| Foreign Born, not a Citizen | 911 (81.9%) | 202 (18.1%) |
Health Insurance Coverage by Household Income in Garrard County
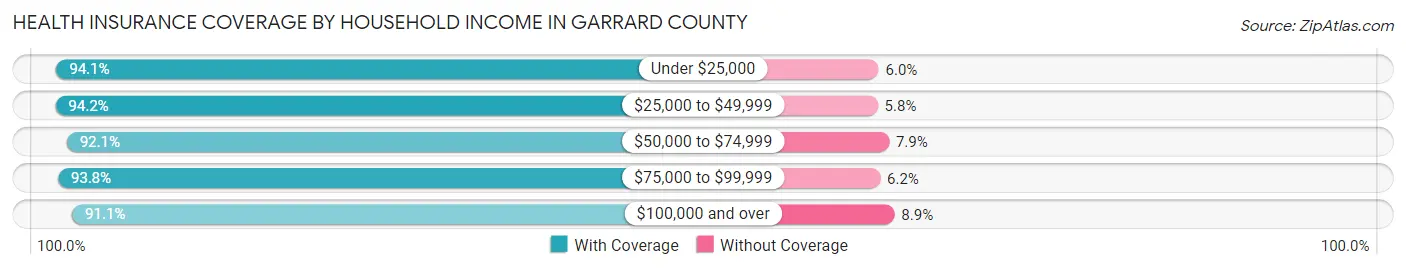
| Household Income | With Coverage | Without Coverage |
| Under $25,000 | 2,577 (94.1%) | 163 (5.9%) |
| $25,000 to $49,999 | 3,539 (94.2%) | 217 (5.8%) |
| $50,000 to $74,999 | 2,622 (92.1%) | 225 (7.9%) |
| $75,000 to $99,999 | 1,757 (93.8%) | 117 (6.2%) |
| $100,000 and over | 5,310 (91.1%) | 520 (8.9%) |
Public vs Private Health Insurance Coverage by Age in Garrard County
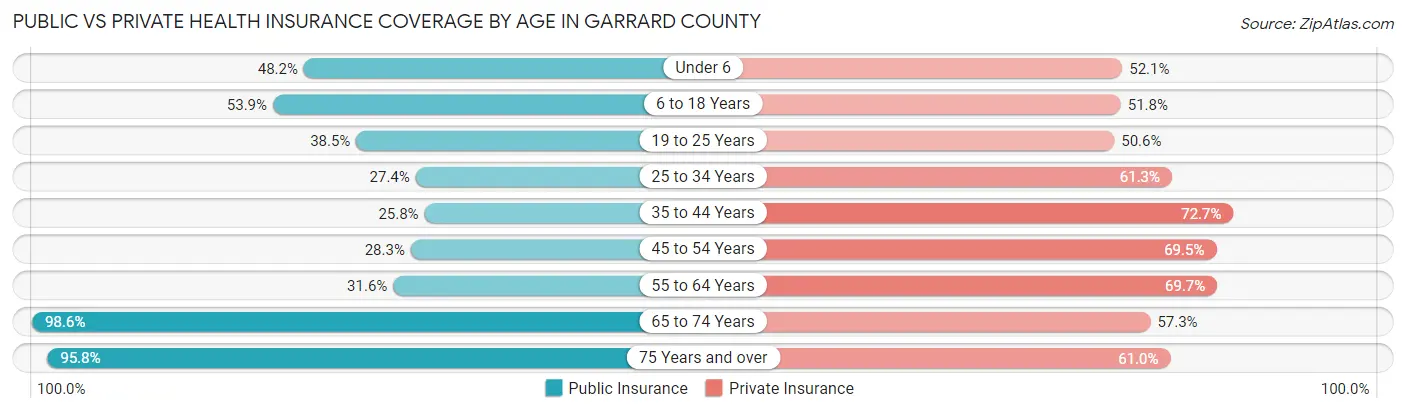
| Age Bracket | Public Insurance | Private Insurance |
| Under 6 | 569 (48.2%) | 615 (52.1%) |
| 6 to 18 Years | 1,494 (53.9%) | 1,435 (51.8%) |
| 19 to 25 Years | 428 (38.5%) | 563 (50.6%) |
| 25 to 34 Years | 475 (27.4%) | 1,061 (61.3%) |
| 35 to 44 Years | 545 (25.8%) | 1,536 (72.7%) |
| 45 to 54 Years | 667 (28.3%) | 1,636 (69.5%) |
| 55 to 64 Years | 858 (31.6%) | 1,892 (69.7%) |
| 65 to 74 Years | 1,859 (98.6%) | 1,080 (57.3%) |
| 75 Years and over | 1,158 (95.8%) | 737 (61.0%) |
| Total | 8,053 (47.2%) | 10,555 (61.8%) |
Disability Status by Sex by Age in Garrard County
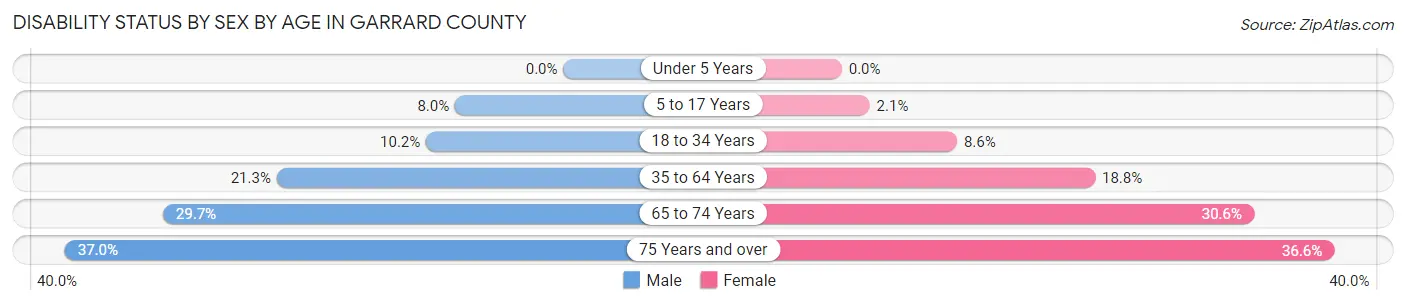
| Age Bracket | Male | Female |
| Under 5 Years | 0 (0.0%) | 0 (0.0%) |
| 5 to 17 Years | 117 (8.0%) | 28 (2.1%) |
| 18 to 34 Years | 155 (10.2%) | 134 (8.6%) |
| 35 to 64 Years | 768 (21.3%) | 672 (18.8%) |
| 65 to 74 Years | 264 (29.7%) | 305 (30.6%) |
| 75 Years and over | 171 (37.0%) | 273 (36.5%) |
Disability Class by Sex by Age in Garrard County
Disability Class: Hearing Difficulty
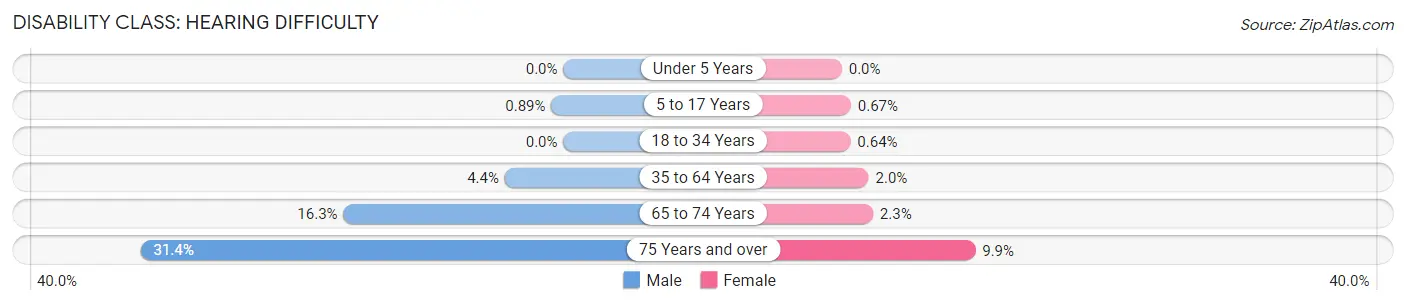
| Age Bracket | Male | Female |
| Under 5 Years | 0 (0.0%) | 0 (0.0%) |
| 5 to 17 Years | 13 (0.9%) | 9 (0.7%) |
| 18 to 34 Years | 0 (0.0%) | 10 (0.6%) |
| 35 to 64 Years | 157 (4.3%) | 71 (2.0%) |
| 65 to 74 Years | 145 (16.3%) | 23 (2.3%) |
| 75 Years and over | 145 (31.4%) | 74 (9.9%) |
Disability Class: Vision Difficulty
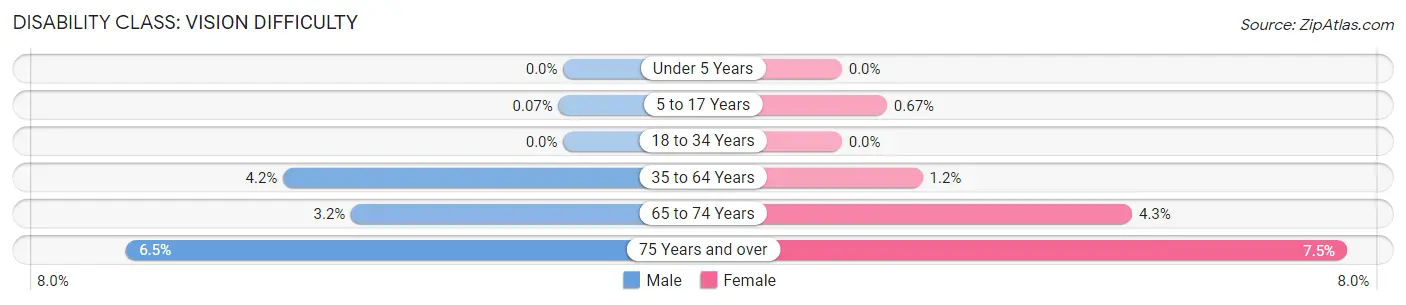
| Age Bracket | Male | Female |
| Under 5 Years | 0 (0.0%) | 0 (0.0%) |
| 5 to 17 Years | 1 (0.1%) | 9 (0.7%) |
| 18 to 34 Years | 0 (0.0%) | 0 (0.0%) |
| 35 to 64 Years | 150 (4.2%) | 43 (1.2%) |
| 65 to 74 Years | 28 (3.2%) | 43 (4.3%) |
| 75 Years and over | 30 (6.5%) | 56 (7.5%) |
Disability Class: Cognitive Difficulty
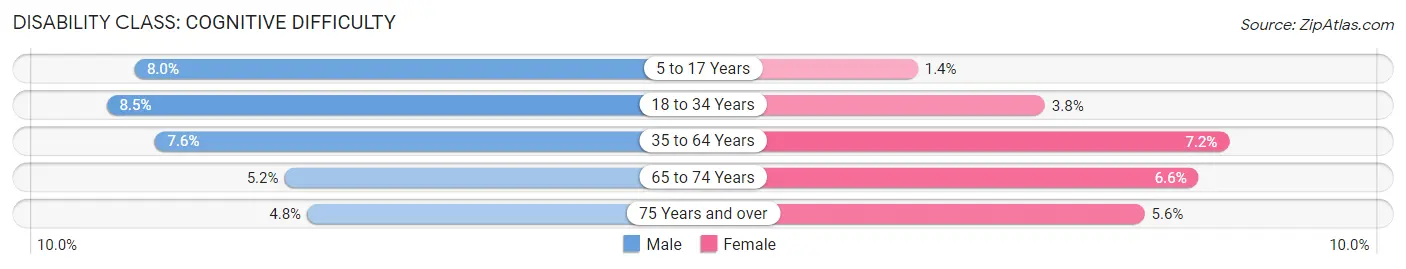
| Age Bracket | Male | Female |
| 5 to 17 Years | 116 (8.0%) | 19 (1.4%) |
| 18 to 34 Years | 129 (8.5%) | 59 (3.8%) |
| 35 to 64 Years | 274 (7.6%) | 257 (7.2%) |
| 65 to 74 Years | 46 (5.2%) | 66 (6.6%) |
| 75 Years and over | 22 (4.8%) | 42 (5.6%) |
Disability Class: Ambulatory Difficulty
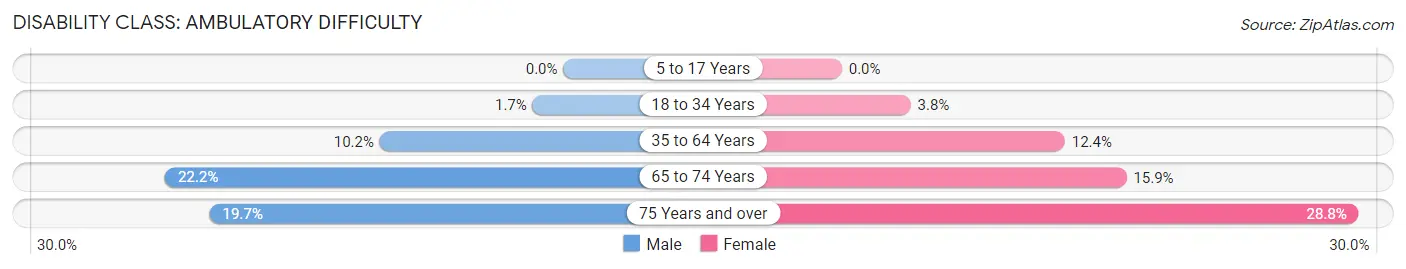
| Age Bracket | Male | Female |
| 5 to 17 Years | 0 (0.0%) | 0 (0.0%) |
| 18 to 34 Years | 26 (1.7%) | 60 (3.8%) |
| 35 to 64 Years | 369 (10.2%) | 444 (12.4%) |
| 65 to 74 Years | 197 (22.2%) | 158 (15.9%) |
| 75 Years and over | 91 (19.7%) | 215 (28.8%) |
Disability Class: Self-Care Difficulty
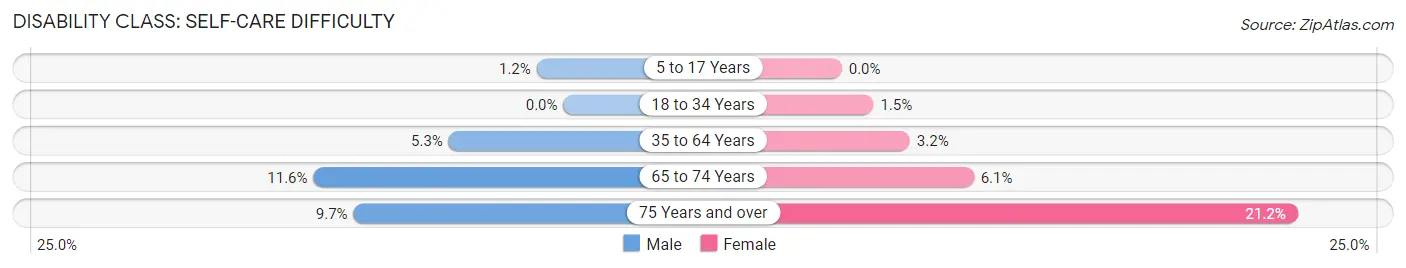
| Age Bracket | Male | Female |
| 5 to 17 Years | 18 (1.2%) | 0 (0.0%) |
| 18 to 34 Years | 0 (0.0%) | 23 (1.5%) |
| 35 to 64 Years | 192 (5.3%) | 113 (3.2%) |
| 65 to 74 Years | 103 (11.6%) | 61 (6.1%) |
| 75 Years and over | 45 (9.7%) | 158 (21.1%) |
Technology Access in Garrard County
Computing Device Access in Garrard County
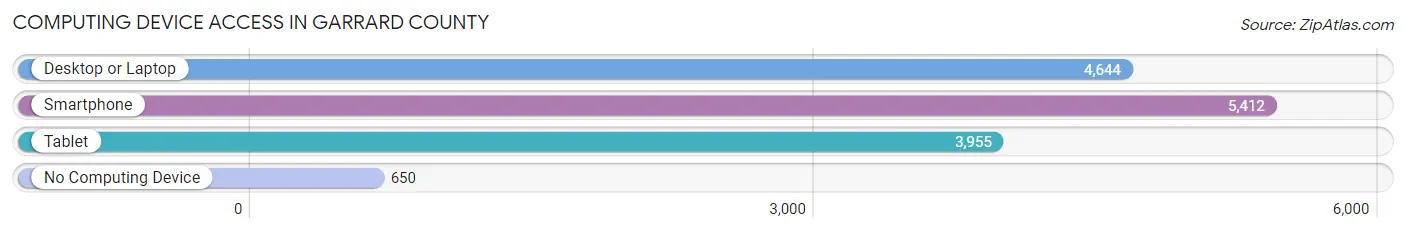
| Device Type | # Households | % Households |
| Desktop or Laptop | 4,644 | 71.6% |
| Smartphone | 5,412 | 83.4% |
| Tablet | 3,955 | 61.0% |
| No Computing Device | 650 | 10.0% |
| Total | 6,488 | 100.0% |
Internet Access in Garrard County
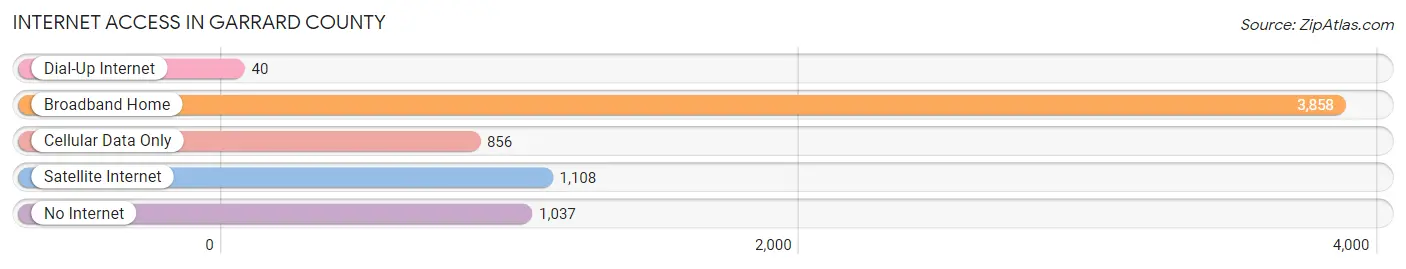
| Internet Type | # Households | % Households |
| Dial-Up Internet | 40 | 0.6% |
| Broadband Home | 3,858 | 59.5% |
| Cellular Data Only | 856 | 13.2% |
| Satellite Internet | 1,108 | 17.1% |
| No Internet | 1,037 | 16.0% |
| Total | 6,488 | 100.0% |
Garrard County Summary
Garrard County is a county located in the Bluegrass region of the U.S. state of Kentucky. As of the 2010 census, the population was 16,912. The county seat is Lancaster. The county was formed in 1796 and is named for James Garrard, the second Governor of Kentucky.
History
Garrard County was formed in 1796 from parts of Lincoln and Madison counties. It was named for James Garrard, the second Governor of Kentucky. The county was originally part of a larger area known as Kentucky County, Virginia, which was formed in 1776. The county was divided into three smaller counties in 1780, and Garrard County was one of them.
The first settlers in the area were mostly Scots-Irish immigrants who arrived in the late 1700s. They were attracted to the area by its fertile soil and abundant wildlife. The county was largely agricultural, with tobacco, corn, and wheat being the main crops.
In the early 1800s, the county was home to several distilleries, which produced whiskey and other spirits. The county was also home to several gristmills, which ground grain into flour.
In the mid-1800s, the county was home to several iron furnaces, which produced iron for use in the construction of buildings and other structures. The county was also home to several coal mines, which provided fuel for the furnaces.
In the late 1800s, the county was home to several tobacco warehouses, which processed and sold tobacco. The county was also home to several sawmills, which produced lumber for use in the construction of buildings and other structures.
Geography
Garrard County is located in the Bluegrass region of Kentucky. It is bordered by Madison County to the north, Lincoln County to the east, Boyle County to the south, and Jessamine County to the west.
The county has a total area of 441 square miles, of which 439 square miles is land and 2 square miles is water. The county is mostly flat, with some rolling hills in the northern and eastern parts of the county. The highest point in the county is located in the northern part of the county, near the Madison County line, and is 1,068 feet above sea level.
The county is drained by the Dix River, which flows through the county from north to south. The county is also home to several small lakes, including Herrington Lake, which is located in the northern part of the county.
Economy
Garrard County is largely agricultural, with tobacco, corn, and wheat being the main crops. The county is also home to several manufacturing companies, including a furniture factory, a plastics factory, and a metal fabrication plant.
The county is also home to several small businesses, including restaurants, retail stores, and service providers. The county is also home to several tourist attractions, including the Kentucky Horse Park and the Kentucky Railway Museum.
Demographics
As of the 2010 census, there were 16,912 people, 6,717 households, and 4,717 families living in the county. The population density was 38.4 people per square mile. There were 7,541 housing units at an average density of 17.1 per square mile.
The racial makeup of the county was 95.2% White, 2.3% Black or African American, 0.3% Native American, 0.3% Asian, 0.1% Pacific Islander, 0.7% from other races, and 1.3% from two or more races. 1.7% of the population were Hispanic or Latino of any race.
There were 6,717 households, out of which 30.2% had children under the age of 18 living with them, 54.2% were married couples living together, 11.2% had a female householder with no husband present, and 30.2% were non-families. 25.7% of all households were made up of individuals, and 10.3% had someone living alone who was 65 years of age or older. The average household size was 2.48 and the average family size was 2.95.
In the county, the population was spread out, with 24.2% under the age of 18, 8.2% from 18 to 24, 28.2% from 25 to 44, 25.2% from 45 to 64, and 14.2% who were 65 years of age or older. The median age was 38 years. For every 100 females, there were 95.2 males. For every 100 females age 18 and over, there were 92.2 males.
The median income for a household in the county was $37,845, and the median income for a family was $45,845. Males had a median income of $33,906 versus $25,921 for females. The per capita income for the county was $19,845. About 11.2% of families and 14.2% of the population were below the poverty line, including 19.2% of those under age 18 and 13.2% of those age 65 or over.
Common Questions
What is Per Capita Income in Garrard County?
Per Capita income in Garrard County is $30,728.
What is the Median Family Income in Garrard County?
Median Family Income in Garrard County is $68,351.
What is the Median Household income in Garrard County?
Median Household Income in Garrard County is $58,263.
What is Income or Wage Gap in Garrard County?
Income or Wage Gap in Garrard County is 28.4%.
Women in Garrard County earn 71.6 cents for every dollar earned by a man.
What is Inequality or Gini Index in Garrard County?
Inequality or Gini Index in Garrard County is 0.45.
What is the Total Population of Garrard County?
Total Population of Garrard County is 17,175.
What is the Total Male Population of Garrard County?
Total Male Population of Garrard County is 8,444.
What is the Total Female Population of Garrard County?
Total Female Population of Garrard County is 8,731.
What is the Ratio of Males per 100 Females in Garrard County?
There are 96.71 Males per 100 Females in Garrard County.
What is the Ratio of Females per 100 Males in Garrard County?
There are 103.40 Females per 100 Males in Garrard County.
What is the Median Population Age in Garrard County?
Median Population Age in Garrard County is 43.5 Years.
What is the Average Family Size in Garrard County
Average Family Size in Garrard County is 3.1 People.
What is the Average Household Size in Garrard County
Average Household Size in Garrard County is 2.6 People.
How Large is the Labor Force in Garrard County?
There are 7,611 People in the Labor Forcein in Garrard County.
What is the Percentage of People in the Labor Force in Garrard County?
54.9% of People are in the Labor Force in Garrard County.
What is the Unemployment Rate in Garrard County?
Unemployment Rate in Garrard County is 5.3%.