Gallatin County, KY Map & Demographics
Gallatin County Map
Gallatin County Overview
$27,398
PER CAPITA INCOME
$64,229
AVG FAMILY INCOME
$58,641
AVG HOUSEHOLD INCOME
34.4%
WAGE / INCOME GAP [ % ]
65.6¢/ $1
WAGE / INCOME GAP [ $ ]
$11,295
FAMILY INCOME DEFICIT
0.41
INEQUALITY / GINI INDEX
8,720
TOTAL POPULATION
4,514
MALE POPULATION
4,206
FEMALE POPULATION
107.32
MALES / 100 FEMALES
93.18
FEMALES / 100 MALES
38.7
MEDIAN AGE
3.3
AVG FAMILY SIZE
2.8
AVG HOUSEHOLD SIZE
4,104
LABOR FORCE [ PEOPLE ]
58.7%
PERCENT IN LABOR FORCE
3.7%
UNEMPLOYMENT RATE
Income in Gallatin County
Income Overview in Gallatin County
Per Capita Income in Gallatin County is $27,398, while median incomes of families and households are $64,229 and $58,641 respectively.
| Characteristic | Number | Measure |
| Per Capita Income | 8,720 | $27,398 |
| Median Family Income | 2,154 | $64,229 |
| Mean Family Income | 2,154 | $78,991 |
| Median Household Income | 3,108 | $58,641 |
| Mean Household Income | 3,108 | $72,527 |
| Income Deficit | 2,154 | $11,295 |
| Wage / Income Gap (%) | 8,720 | 34.36% |
| Wage / Income Gap ($) | 8,720 | 65.64¢ per $1 |
| Gini / Inequality Index | 8,720 | 0.41 |
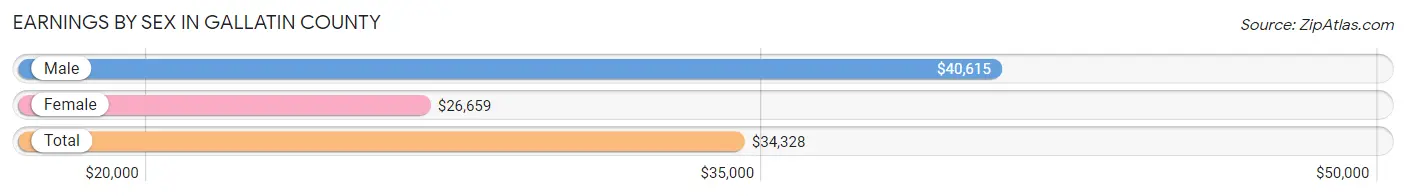
Earnings by Sex in Gallatin County
Average Earnings in Gallatin County are $34,328, $40,615 for men and $26,659 for women, a difference of 34.4%.
| Sex | Number | Average Earnings |
| Male | 2,362 (55.1%) | $40,615 |
| Female | 1,921 (44.9%) | $26,659 |
| Total | 4,283 (100.0%) | $34,328 |
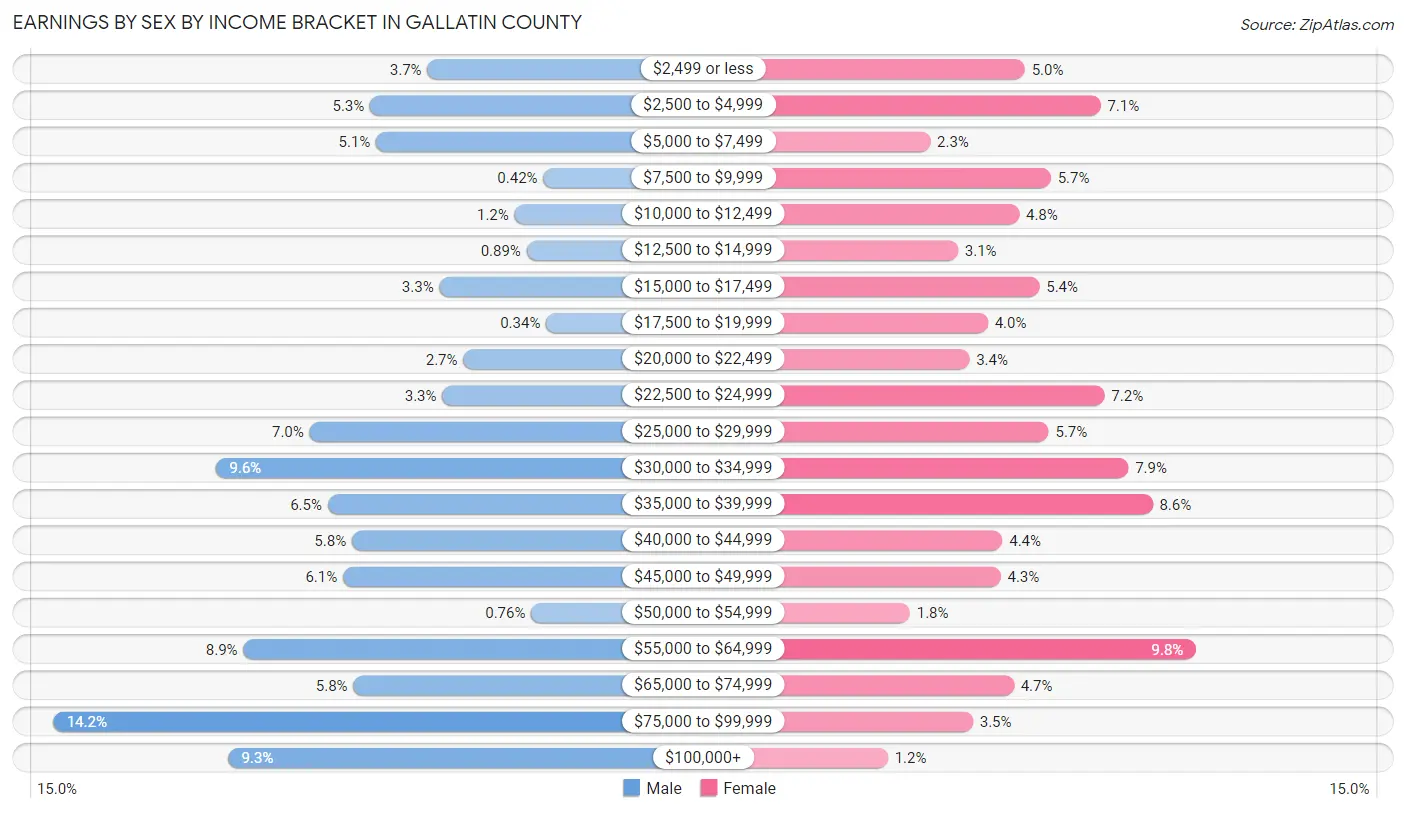
Earnings by Sex by Income Bracket in Gallatin County
The most common earnings brackets in Gallatin County are $75,000 to $99,999 for men (335 | 14.2%) and $55,000 to $64,999 for women (188 | 9.8%).
| Income | Male | Female |
| $2,499 or less | 87 (3.7%) | 96 (5.0%) |
| $2,500 to $4,999 | 125 (5.3%) | 137 (7.1%) |
| $5,000 to $7,499 | 121 (5.1%) | 45 (2.3%) |
| $7,500 to $9,999 | 10 (0.4%) | 110 (5.7%) |
| $10,000 to $12,499 | 29 (1.2%) | 93 (4.8%) |
| $12,500 to $14,999 | 21 (0.9%) | 60 (3.1%) |
| $15,000 to $17,499 | 79 (3.3%) | 104 (5.4%) |
| $17,500 to $19,999 | 8 (0.3%) | 76 (4.0%) |
| $20,000 to $22,499 | 63 (2.7%) | 66 (3.4%) |
| $22,500 to $24,999 | 77 (3.3%) | 139 (7.2%) |
| $25,000 to $29,999 | 165 (7.0%) | 109 (5.7%) |
| $30,000 to $34,999 | 227 (9.6%) | 152 (7.9%) |
| $35,000 to $39,999 | 153 (6.5%) | 165 (8.6%) |
| $40,000 to $44,999 | 137 (5.8%) | 84 (4.4%) |
| $45,000 to $49,999 | 143 (6.0%) | 83 (4.3%) |
| $50,000 to $54,999 | 18 (0.8%) | 34 (1.8%) |
| $55,000 to $64,999 | 209 (8.8%) | 188 (9.8%) |
| $65,000 to $74,999 | 136 (5.8%) | 90 (4.7%) |
| $75,000 to $99,999 | 335 (14.2%) | 68 (3.5%) |
| $100,000+ | 219 (9.3%) | 22 (1.1%) |
| Total | 2,362 (100.0%) | 1,921 (100.0%) |
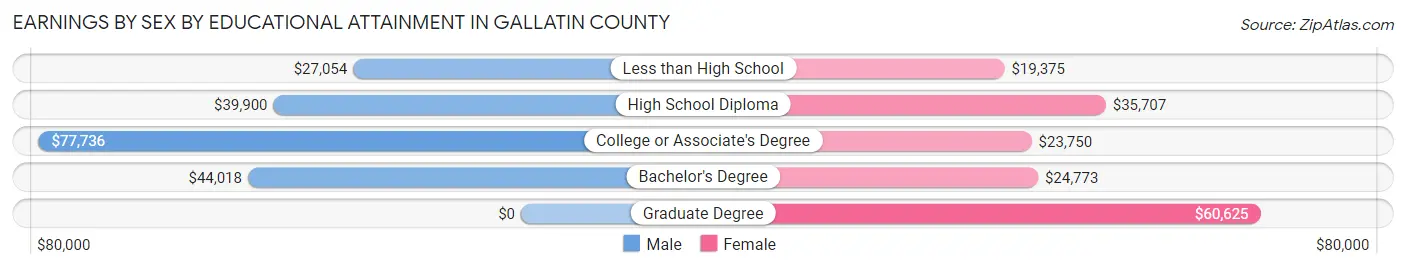
Earnings by Sex by Educational Attainment in Gallatin County
Average earnings in Gallatin County are $44,167 for men and $30,643 for women, a difference of 30.6%. Men with an educational attainment of college or associate's degree enjoy the highest average annual earnings of $77,736, while those with less than high school education earn the least with $27,054. Women with an educational attainment of graduate degree earn the most with the average annual earnings of $60,625, while those with less than high school education have the smallest earnings of $19,375.
| Educational Attainment | Male Income | Female Income |
| Less than High School | $27,054 | $19,375 |
| High School Diploma | $39,900 | $35,707 |
| College or Associate's Degree | $77,736 | $23,750 |
| Bachelor's Degree | $44,018 | $24,773 |
| Graduate Degree | - | - |
| Total | $44,167 | $30,643 |
Family Income in Gallatin County
Family Income Brackets in Gallatin County
According to the Gallatin County family income data, there are 480 families falling into the $100,000 to $149,999 income range, which is the most common income bracket and makes up 22.3% of all families. Conversely, the $150,000 to $199,999 income bracket is the least frequent group with only 56 families (2.6%) belonging to this category.
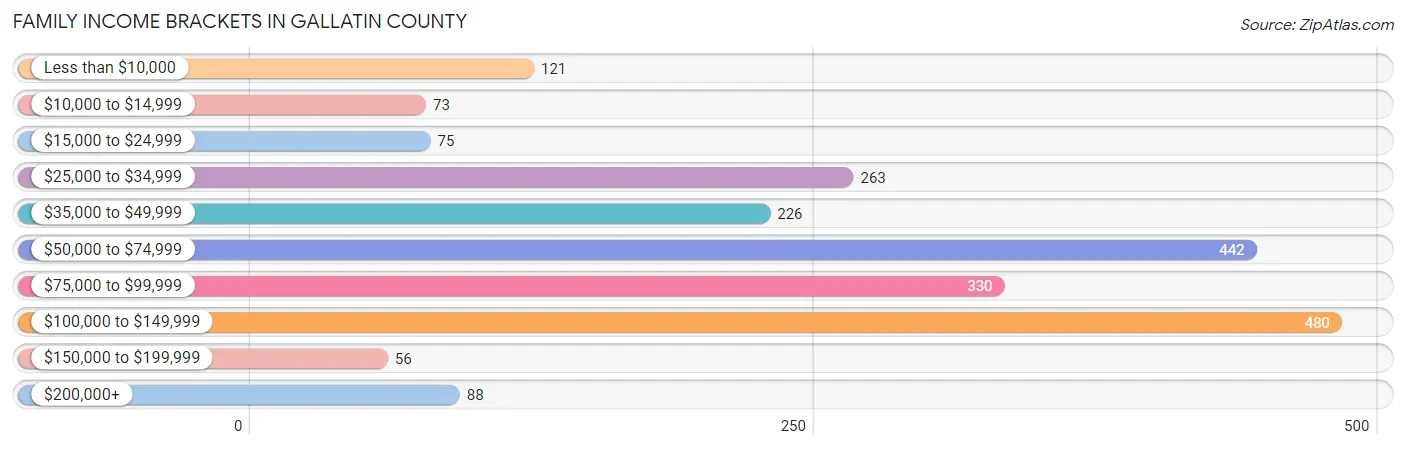
| Income Bracket | # Families | % Families |
| Less than $10,000 | 121 | 5.6% |
| $10,000 to $14,999 | 73 | 3.4% |
| $15,000 to $24,999 | 75 | 3.5% |
| $25,000 to $34,999 | 263 | 12.2% |
| $35,000 to $49,999 | 226 | 10.5% |
| $50,000 to $74,999 | 442 | 20.5% |
| $75,000 to $99,999 | 330 | 15.3% |
| $100,000 to $149,999 | 480 | 22.3% |
| $150,000 to $199,999 | 56 | 2.6% |
| $200,000+ | 88 | 4.1% |
Family Income by Famaliy Size in Gallatin County
7+ person families (83 | 3.8%) account for the highest median family income in Gallatin County with $139,712 per family, while 2-person families (990 | 46.0%) have the highest median income of $31,652 per family member.
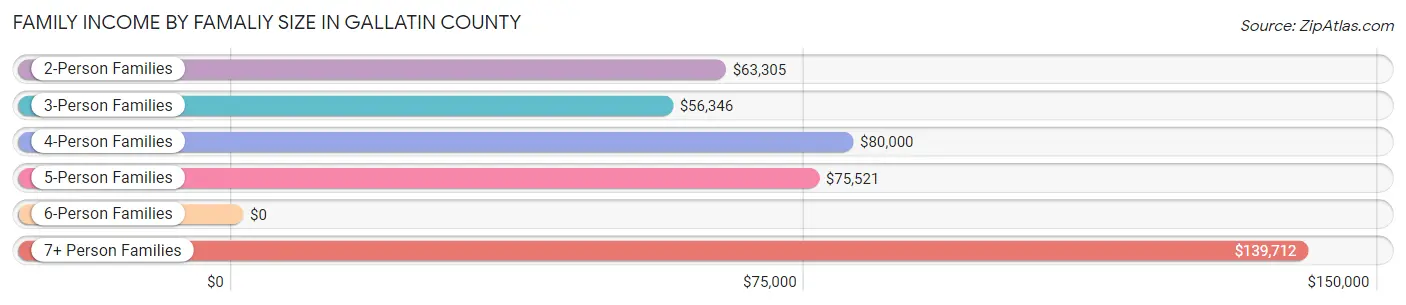
| Income Bracket | # Families | Median Income |
| 2-Person Families | 990 (46.0%) | $63,305 |
| 3-Person Families | 470 (21.8%) | $56,346 |
| 4-Person Families | 436 (20.2%) | $80,000 |
| 5-Person Families | 163 (7.6%) | $75,521 |
| 6-Person Families | 12 (0.6%) | $0 |
| 7+ Person Families | 83 (3.8%) | $139,712 |
| Total | 2,154 (100.0%) | $64,229 |
Family Income by Number of Earners in Gallatin County
The median family income in Gallatin County is $64,229, with families comprising 3+ earners (186) having the highest median family income of $116,607, while families with no earners (281) have the lowest median family income of $24,107, accounting for 8.6% and 13.1% of families, respectively.
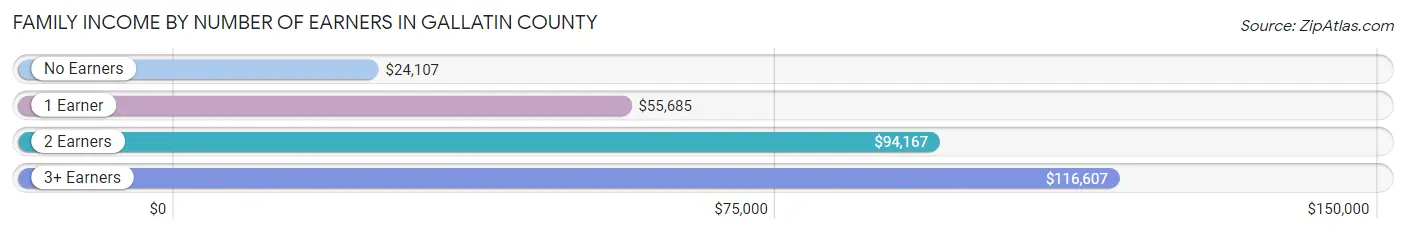
| Number of Earners | # Families | Median Income |
| No Earners | 281 (13.1%) | $24,107 |
| 1 Earner | 863 (40.1%) | $55,685 |
| 2 Earners | 824 (38.3%) | $94,167 |
| 3+ Earners | 186 (8.6%) | $116,607 |
| Total | 2,154 (100.0%) | $64,229 |
Household Income in Gallatin County
Household Income Brackets in Gallatin County
With 615 households falling in the category, the $50,000 to $74,999 income range is the most frequent in Gallatin County, accounting for 19.8% of all households. In contrast, only 109 households (3.5%) fall into the $150,000 to $199,999 income bracket, making it the least populous group.
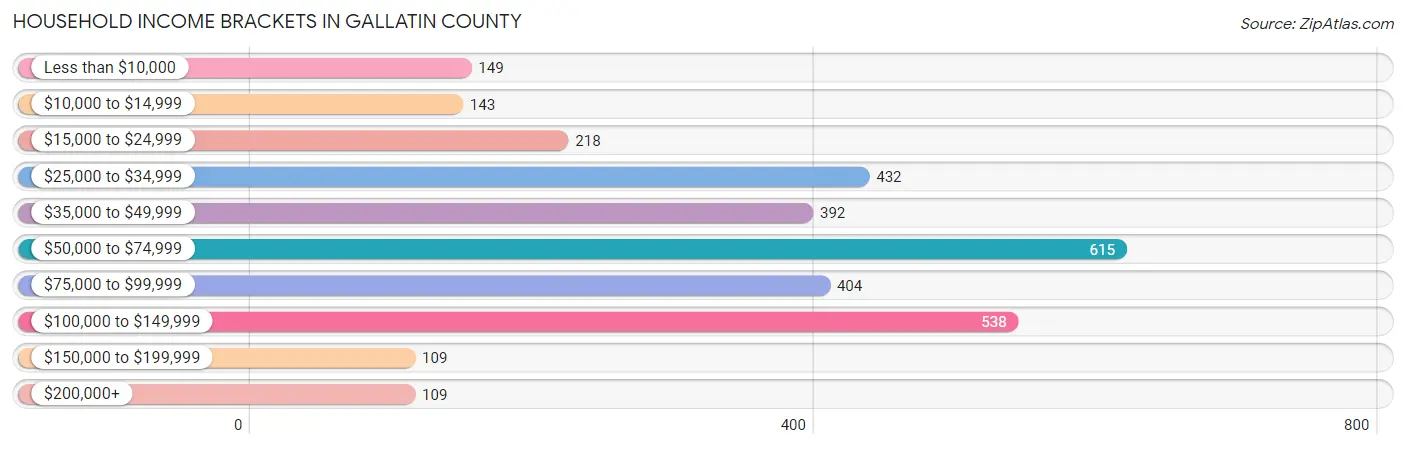
| Income Bracket | # Households | % Households |
| Less than $10,000 | 149 | 4.8% |
| $10,000 to $14,999 | 143 | 4.6% |
| $15,000 to $24,999 | 218 | 7.0% |
| $25,000 to $34,999 | 432 | 13.9% |
| $35,000 to $49,999 | 392 | 12.6% |
| $50,000 to $74,999 | 615 | 19.8% |
| $75,000 to $99,999 | 404 | 13.0% |
| $100,000 to $149,999 | 538 | 17.3% |
| $150,000 to $199,999 | 109 | 3.5% |
| $200,000+ | 109 | 3.5% |
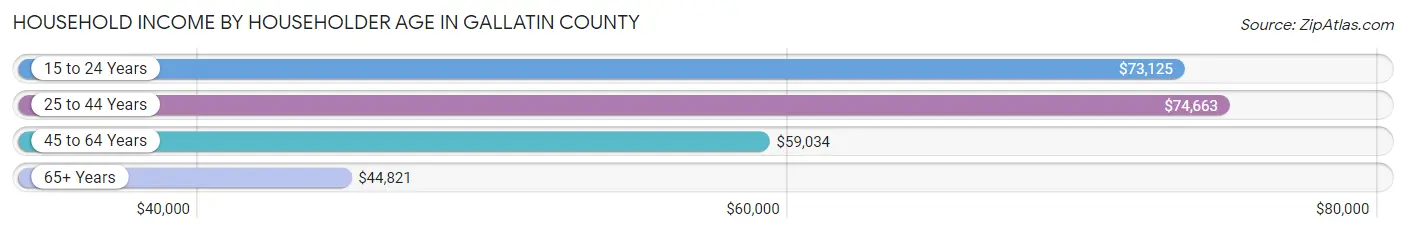
Household Income by Householder Age in Gallatin County
The median household income in Gallatin County is $58,641, with the highest median household income of $74,663 found in the 25 to 44 years age bracket for the primary householder. A total of 847 households (27.3%) fall into this category. Meanwhile, the 65+ years age bracket for the primary householder has the lowest median household income of $44,821, with 748 households (24.1%) in this group.
| Income Bracket | # Households | Median Income |
| 15 to 24 Years | 90 (2.9%) | $73,125 |
| 25 to 44 Years | 847 (27.3%) | $74,663 |
| 45 to 64 Years | 1,423 (45.8%) | $59,034 |
| 65+ Years | 748 (24.1%) | $44,821 |
| Total | 3,108 (100.0%) | $58,641 |
Poverty in Gallatin County
Income Below Poverty by Sex and Age in Gallatin County
With 17.0% poverty level for males and 16.6% for females among the residents of Gallatin County, 12 to 14 year old males and 5 year old females are the most vulnerable to poverty, with 112 males (47.5%) and 27 females (32.1%) in their respective age groups living below the poverty level.
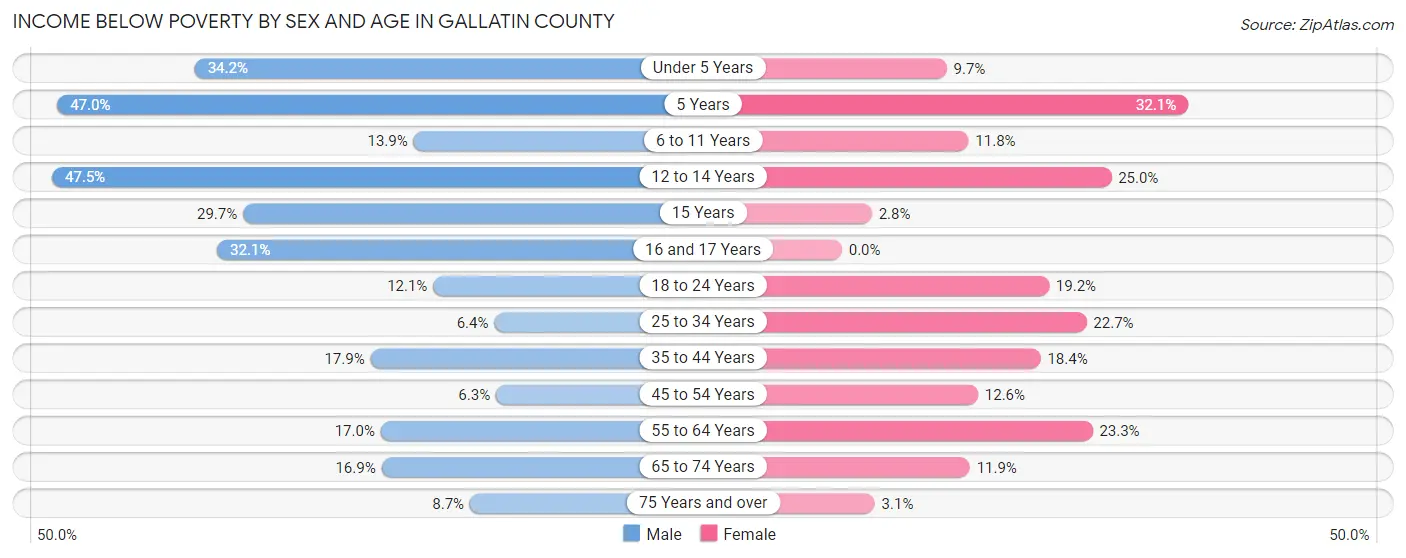
| Age Bracket | Male | Female |
| Under 5 Years | 91 (34.2%) | 18 (9.7%) |
| 5 Years | 31 (47.0%) | 27 (32.1%) |
| 6 to 11 Years | 31 (13.9%) | 39 (11.7%) |
| 12 to 14 Years | 112 (47.5%) | 27 (25.0%) |
| 15 Years | 11 (29.7%) | 3 (2.8%) |
| 16 and 17 Years | 54 (32.1%) | 0 (0.0%) |
| 18 to 24 Years | 65 (12.1%) | 64 (19.2%) |
| 25 to 34 Years | 38 (6.4%) | 128 (22.7%) |
| 35 to 44 Years | 97 (17.9%) | 90 (18.4%) |
| 45 to 54 Years | 35 (6.2%) | 73 (12.6%) |
| 55 to 64 Years | 108 (17.0%) | 170 (23.3%) |
| 65 to 74 Years | 67 (16.9%) | 45 (11.9%) |
| 75 Years and over | 15 (8.7%) | 6 (3.0%) |
| Total | 755 (17.0%) | 690 (16.6%) |
Income Above Poverty by Sex and Age in Gallatin County
According to the poverty statistics in Gallatin County, males aged 45 to 54 years and females aged 16 and 17 years are the age groups that are most secure financially, with 93.8% of males and 100.0% of females in these age groups living above the poverty line.
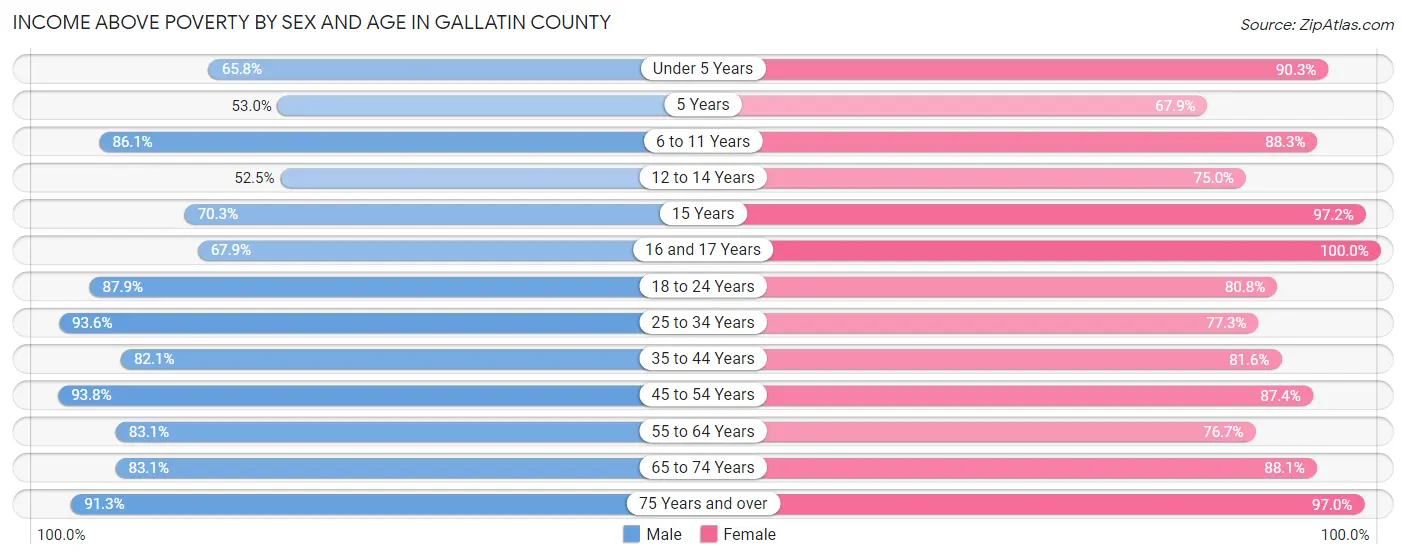
| Age Bracket | Male | Female |
| Under 5 Years | 175 (65.8%) | 167 (90.3%) |
| 5 Years | 35 (53.0%) | 57 (67.9%) |
| 6 to 11 Years | 192 (86.1%) | 293 (88.2%) |
| 12 to 14 Years | 124 (52.5%) | 81 (75.0%) |
| 15 Years | 26 (70.3%) | 105 (97.2%) |
| 16 and 17 Years | 114 (67.9%) | 67 (100.0%) |
| 18 to 24 Years | 473 (87.9%) | 269 (80.8%) |
| 25 to 34 Years | 555 (93.6%) | 436 (77.3%) |
| 35 to 44 Years | 445 (82.1%) | 398 (81.6%) |
| 45 to 54 Years | 525 (93.8%) | 505 (87.4%) |
| 55 to 64 Years | 529 (83.1%) | 561 (76.7%) |
| 65 to 74 Years | 330 (83.1%) | 334 (88.1%) |
| 75 Years and over | 158 (91.3%) | 191 (97.0%) |
| Total | 3,681 (83.0%) | 3,464 (83.4%) |
Income Below Poverty Among Married-Couple Families in Gallatin County
The poverty statistics for married-couple families in Gallatin County show that 8.2% or 132 of the total 1,606 families live below the poverty line. Families with 3 or 4 children have the highest poverty rate of 20.3%, comprising of 30 families. On the other hand, families with 5 or more children have the lowest poverty rate of 0.0%, which includes 0 families.
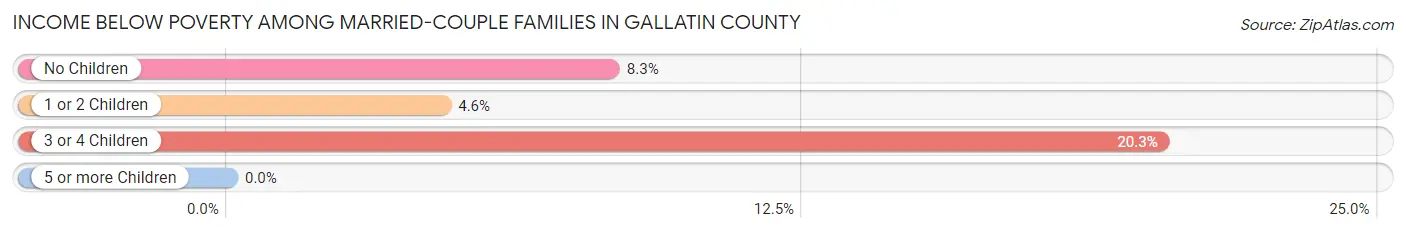
| Children | Above Poverty | Below Poverty |
| No Children | 905 (91.7%) | 82 (8.3%) |
| 1 or 2 Children | 411 (95.4%) | 20 (4.6%) |
| 3 or 4 Children | 118 (79.7%) | 30 (20.3%) |
| 5 or more Children | 40 (100.0%) | 0 (0.0%) |
| Total | 1,474 (91.8%) | 132 (8.2%) |
Income Below Poverty Among Single-Parent Households in Gallatin County
According to the poverty data in Gallatin County, 9.6% or 15 single-father households and 39.5% or 155 single-mother households are living below the poverty line. Among single-father households, those with 1 or 2 children have the highest poverty rate, with 10 households (11.6%) experiencing poverty. Likewise, among single-mother households, those with 3 or 4 children have the highest poverty rate, with 72 households (90.0%) falling below the poverty line.
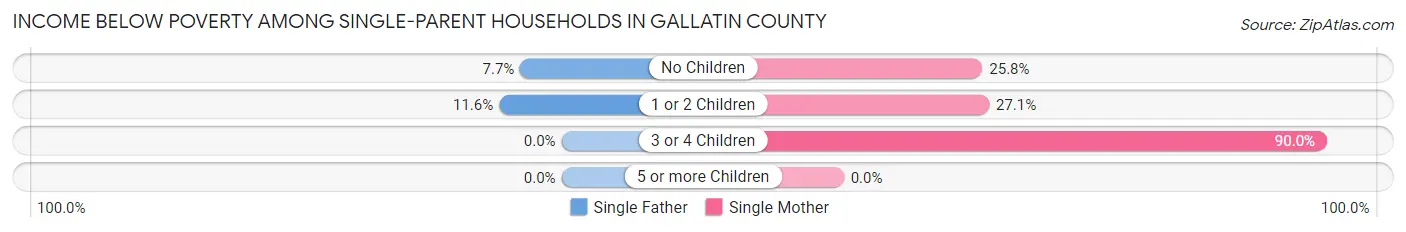
| Children | Single Father | Single Mother |
| No Children | 5 (7.7%) | 31 (25.8%) |
| 1 or 2 Children | 10 (11.6%) | 52 (27.1%) |
| 3 or 4 Children | 0 (0.0%) | 72 (90.0%) |
| 5 or more Children | 0 (0.0%) | 0 (0.0%) |
| Total | 15 (9.6%) | 155 (39.5%) |
Income Below Poverty Among Married-Couple vs Single-Parent Households in Gallatin County
The poverty data for Gallatin County shows that 132 of the married-couple family households (8.2%) and 170 of the single-parent households (31.0%) are living below the poverty level. Within the married-couple family households, those with 3 or 4 children have the highest poverty rate, with 30 households (20.3%) falling below the poverty line. Among the single-parent households, those with 3 or 4 children have the highest poverty rate, with 72 household (84.7%) living below poverty.
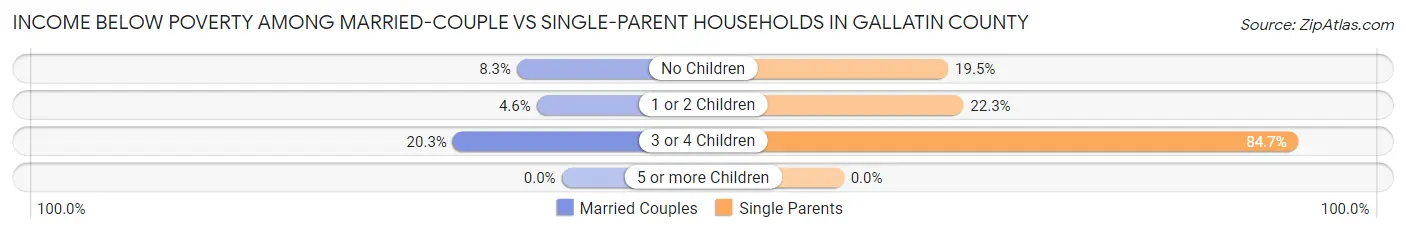
| Children | Married-Couple Families | Single-Parent Households |
| No Children | 82 (8.3%) | 36 (19.5%) |
| 1 or 2 Children | 20 (4.6%) | 62 (22.3%) |
| 3 or 4 Children | 30 (20.3%) | 72 (84.7%) |
| 5 or more Children | 0 (0.0%) | 0 (0.0%) |
| Total | 132 (8.2%) | 170 (31.0%) |
Race in Gallatin County
The most populous races in Gallatin County are White / Caucasian (7,700 | 88.3%), Two or more Races (540 | 6.2%), and Hispanic or Latino (511 | 5.9%).
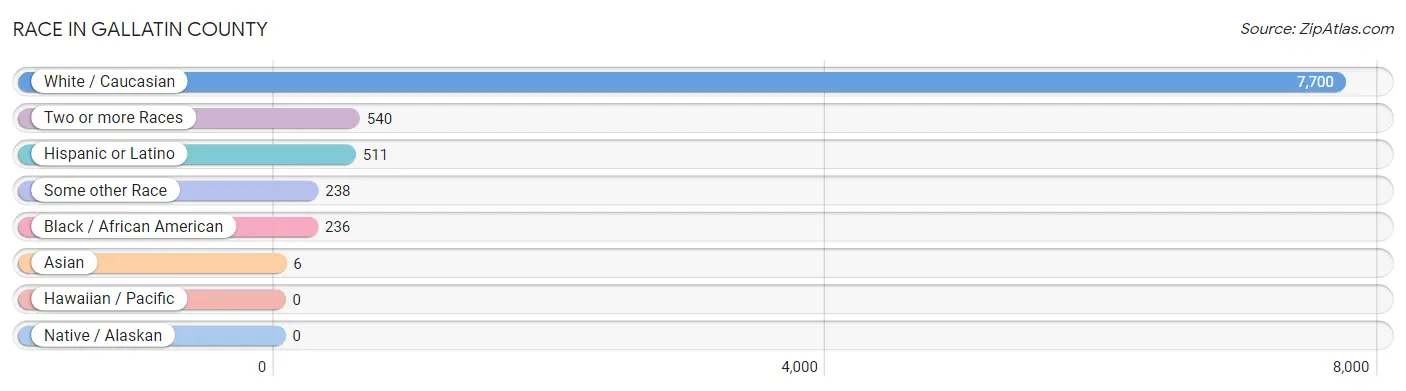
| Race | # Population | % Population |
| Asian | 6 | 0.1% |
| Black / African American | 236 | 2.7% |
| Hawaiian / Pacific | 0 | 0.0% |
| Hispanic or Latino | 511 | 5.9% |
| Native / Alaskan | 0 | 0.0% |
| White / Caucasian | 7,700 | 88.3% |
| Two or more Races | 540 | 6.2% |
| Some other Race | 238 | 2.7% |
| Total | 8,720 | 100.0% |
Ancestry in Gallatin County
The most populous ancestries reported in Gallatin County are German (1,363 | 15.6%), Irish (1,067 | 12.2%), English (978 | 11.2%), American (653 | 7.5%), and Italian (319 | 3.7%), together accounting for 50.2% of all Gallatin County residents.
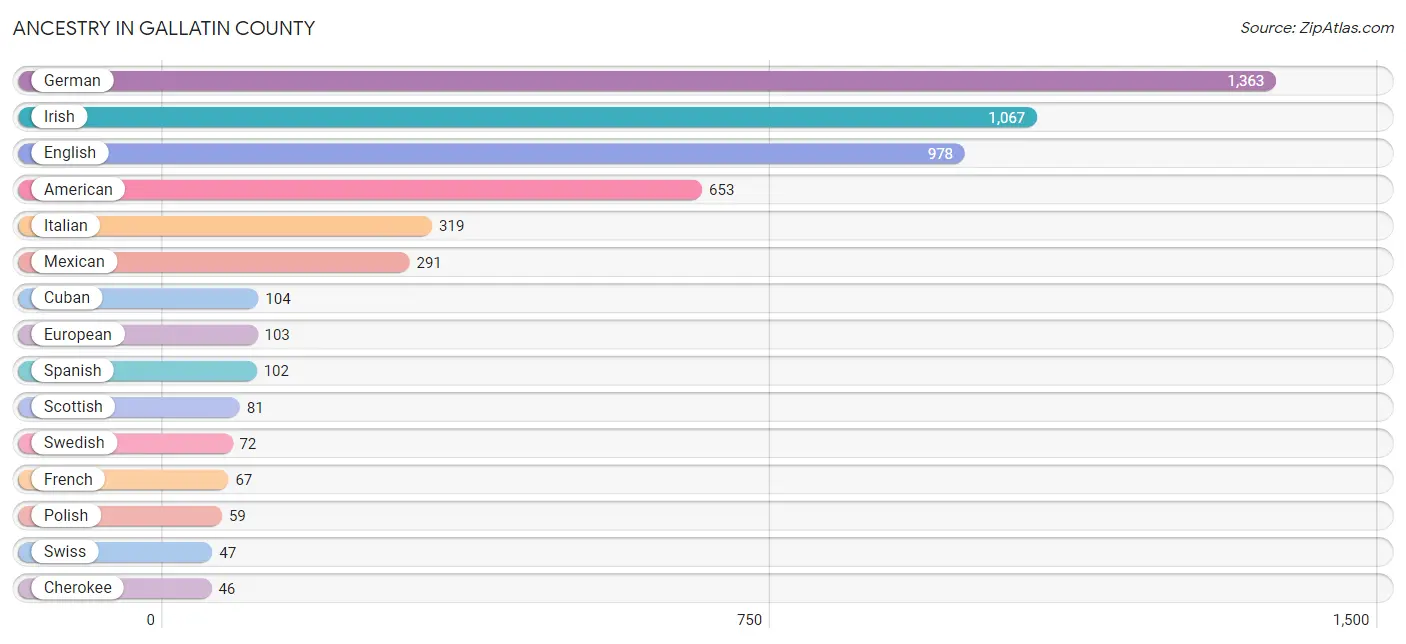
| Ancestry | # Population | % Population |
| African | 42 | 0.5% |
| American | 653 | 7.5% |
| Blackfeet | 27 | 0.3% |
| British | 13 | 0.2% |
| Burmese | 34 | 0.4% |
| Canadian | 15 | 0.2% |
| Central American | 14 | 0.2% |
| Cherokee | 46 | 0.5% |
| Cuban | 104 | 1.2% |
| Czechoslovakian | 6 | 0.1% |
| Dutch | 18 | 0.2% |
| English | 978 | 11.2% |
| European | 103 | 1.2% |
| Finnish | 10 | 0.1% |
| French | 67 | 0.8% |
| German | 1,363 | 15.6% |
| Greek | 6 | 0.1% |
| Guatemalan | 14 | 0.2% |
| Irish | 1,067 | 12.2% |
| Iroquois | 5 | 0.1% |
| Italian | 319 | 3.7% |
| Korean | 13 | 0.2% |
| Mexican | 291 | 3.3% |
| Polish | 59 | 0.7% |
| Scandinavian | 32 | 0.4% |
| Scotch-Irish | 37 | 0.4% |
| Scottish | 81 | 0.9% |
| Spanish | 102 | 1.2% |
| Subsaharan African | 42 | 0.5% |
| Swedish | 72 | 0.8% |
| Swiss | 47 | 0.5% |
| Welsh | 12 | 0.1% | View All 32 Rows |
Immigrants in Gallatin County
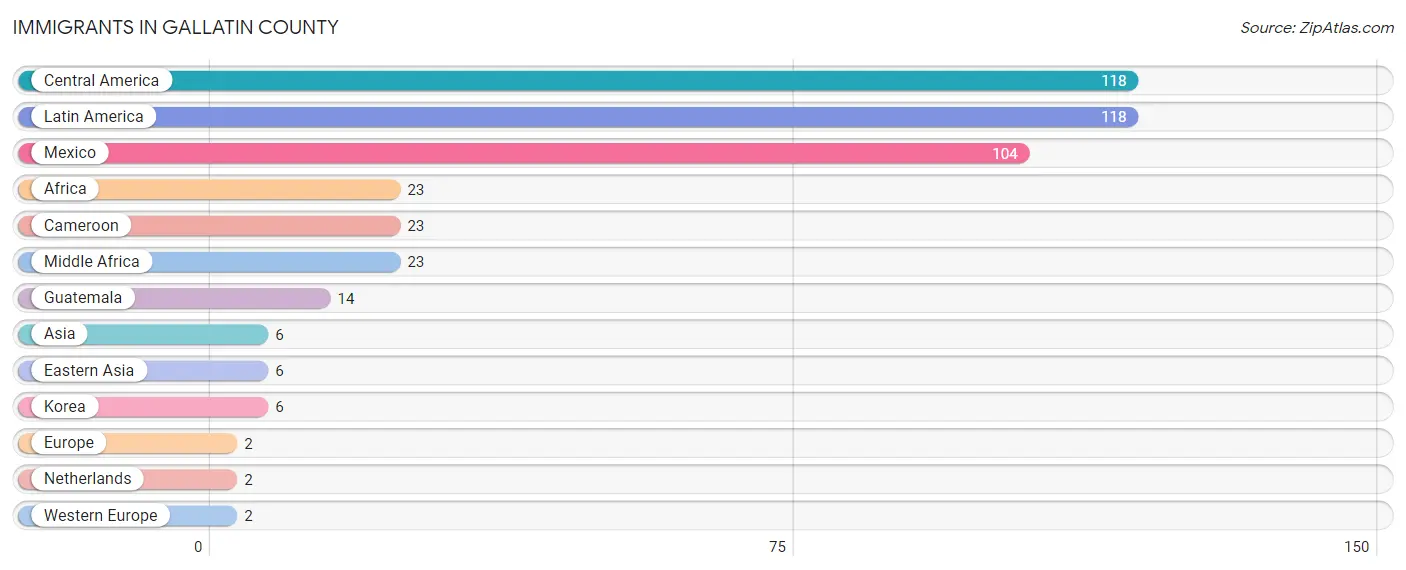
The most numerous immigrant groups reported in Gallatin County came from Central America (118 | 1.3%), Latin America (118 | 1.3%), Mexico (104 | 1.2%), Africa (23 | 0.3%), and Cameroon (23 | 0.3%), together accounting for 4.4% of all Gallatin County residents.
| Immigration Origin | # Population | % Population |
| Africa | 23 | 0.3% |
| Asia | 6 | 0.1% |
| Cameroon | 23 | 0.3% |
| Central America | 118 | 1.3% |
| Eastern Asia | 6 | 0.1% |
| Europe | 2 | 0.0% |
| Guatemala | 14 | 0.2% |
| Korea | 6 | 0.1% |
| Latin America | 118 | 1.3% |
| Mexico | 104 | 1.2% |
| Middle Africa | 23 | 0.3% |
| Netherlands | 2 | 0.0% |
| Western Europe | 2 | 0.0% | View All 13 Rows |
Sex and Age in Gallatin County
Sex and Age in Gallatin County
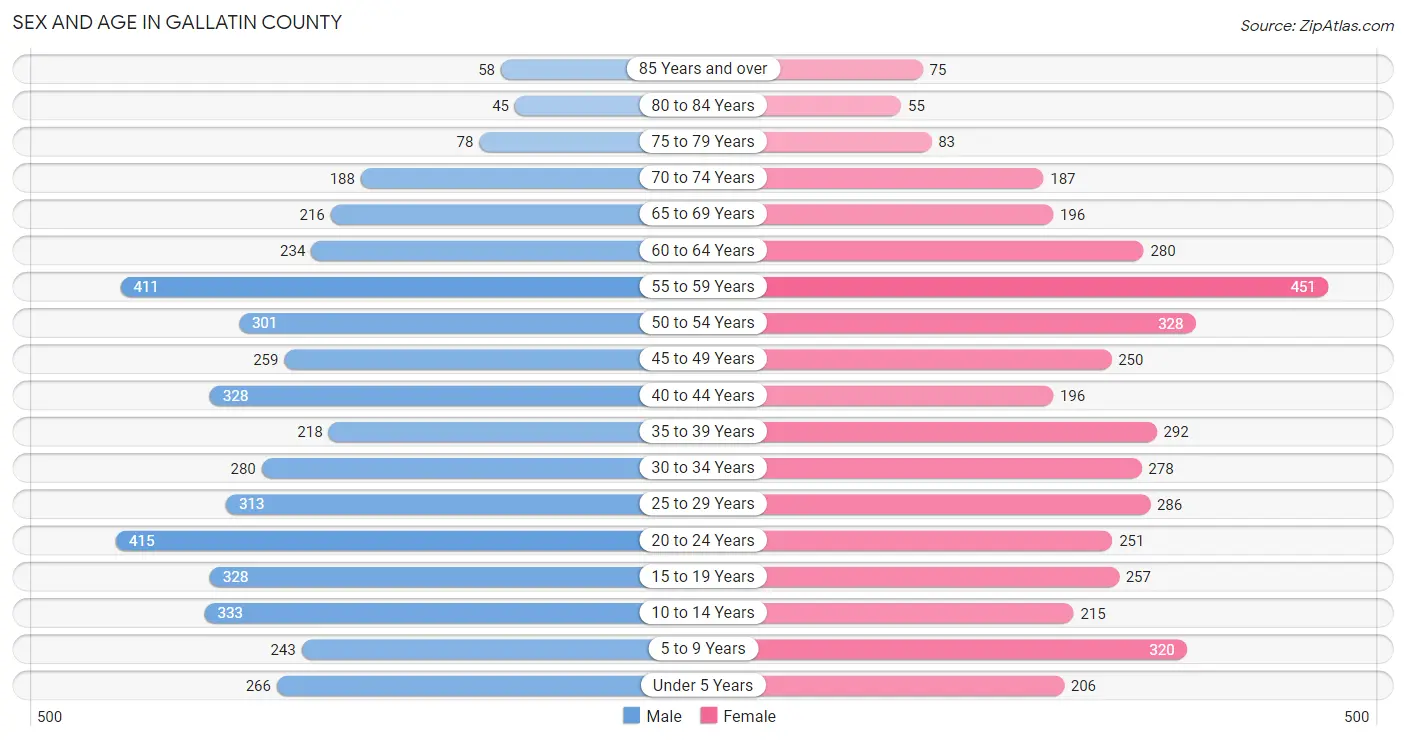
The most populous age groups in Gallatin County are 20 to 24 Years (415 | 9.2%) for men and 55 to 59 Years (451 | 10.7%) for women.
| Age Bracket | Male | Female |
| Under 5 Years | 266 (5.9%) | 206 (4.9%) |
| 5 to 9 Years | 243 (5.4%) | 320 (7.6%) |
| 10 to 14 Years | 333 (7.4%) | 215 (5.1%) |
| 15 to 19 Years | 328 (7.3%) | 257 (6.1%) |
| 20 to 24 Years | 415 (9.2%) | 251 (6.0%) |
| 25 to 29 Years | 313 (6.9%) | 286 (6.8%) |
| 30 to 34 Years | 280 (6.2%) | 278 (6.6%) |
| 35 to 39 Years | 218 (4.8%) | 292 (6.9%) |
| 40 to 44 Years | 328 (7.3%) | 196 (4.7%) |
| 45 to 49 Years | 259 (5.7%) | 250 (5.9%) |
| 50 to 54 Years | 301 (6.7%) | 328 (7.8%) |
| 55 to 59 Years | 411 (9.1%) | 451 (10.7%) |
| 60 to 64 Years | 234 (5.2%) | 280 (6.7%) |
| 65 to 69 Years | 216 (4.8%) | 196 (4.7%) |
| 70 to 74 Years | 188 (4.2%) | 187 (4.4%) |
| 75 to 79 Years | 78 (1.7%) | 83 (2.0%) |
| 80 to 84 Years | 45 (1.0%) | 55 (1.3%) |
| 85 Years and over | 58 (1.3%) | 75 (1.8%) |
| Total | 4,514 (100.0%) | 4,206 (100.0%) |
Families and Households in Gallatin County
Median Family Size in Gallatin County
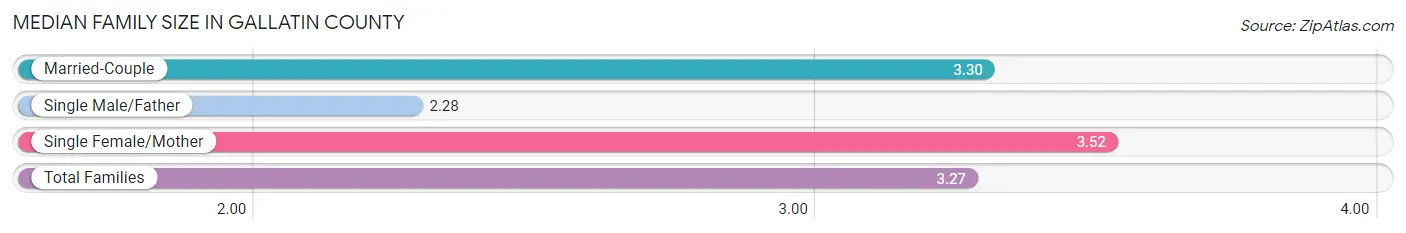
The median family size in Gallatin County is 3.27 persons per family, with single female/mother families (392 | 18.2%) accounting for the largest median family size of 3.52 persons per family. On the other hand, single male/father families (156 | 7.2%) represent the smallest median family size with 2.28 persons per family.
| Family Type | # Families | Family Size |
| Married-Couple | 1,606 (74.6%) | 3.30 |
| Single Male/Father | 156 (7.2%) | 2.28 |
| Single Female/Mother | 392 (18.2%) | 3.52 |
| Total Families | 2,154 (100.0%) | 3.27 |
Median Household Size in Gallatin County
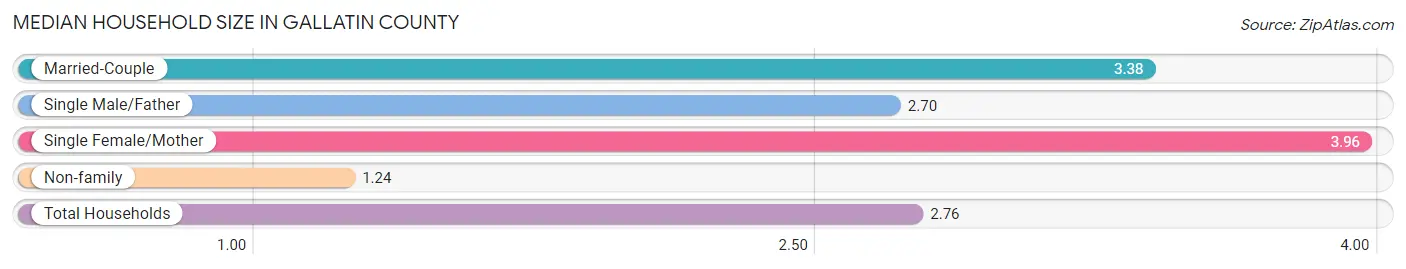
The median household size in Gallatin County is 2.76 persons per household, with single female/mother households (392 | 12.6%) accounting for the largest median household size of 3.96 persons per household. non-family households (954 | 30.7%) represent the smallest median household size with 1.24 persons per household.
| Household Type | # Households | Household Size |
| Married-Couple | 1,606 (51.7%) | 3.38 |
| Single Male/Father | 156 (5.0%) | 2.70 |
| Single Female/Mother | 392 (12.6%) | 3.96 |
| Non-family | 954 (30.7%) | 1.24 |
| Total Households | 3,108 (100.0%) | 2.76 |
Household Size by Marriage Status in Gallatin County
Out of a total of 3,108 households in Gallatin County, 2,154 (69.3%) are family households, while 954 (30.7%) are nonfamily households. The most numerous type of family households are 2-person households, comprising 881, and the most common type of nonfamily households are 1-person households, comprising 794.
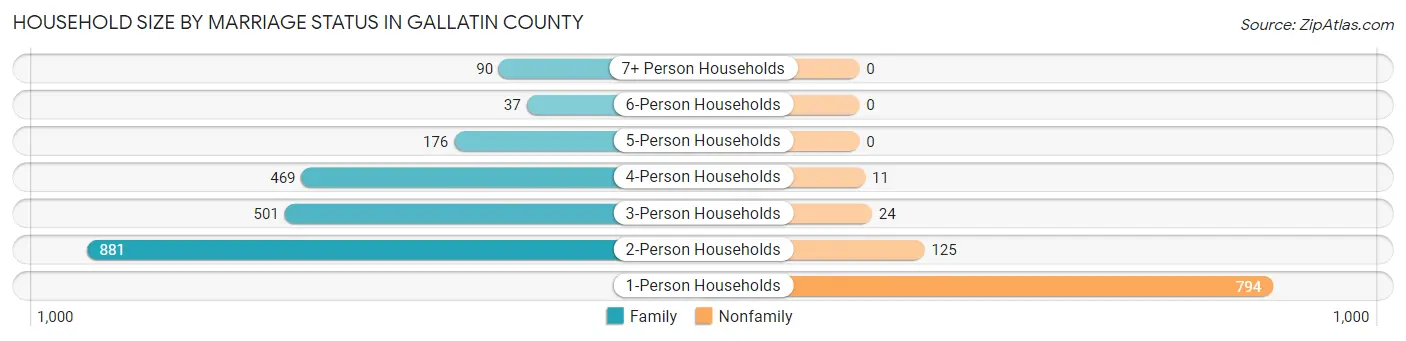
| Household Size | Family Households | Nonfamily Households |
| 1-Person Households | - | 794 (25.6%) |
| 2-Person Households | 881 (28.3%) | 125 (4.0%) |
| 3-Person Households | 501 (16.1%) | 24 (0.8%) |
| 4-Person Households | 469 (15.1%) | 11 (0.4%) |
| 5-Person Households | 176 (5.7%) | 0 (0.0%) |
| 6-Person Households | 37 (1.2%) | 0 (0.0%) |
| 7+ Person Households | 90 (2.9%) | 0 (0.0%) |
| Total | 2,154 (69.3%) | 954 (30.7%) |
Female Fertility in Gallatin County
Fertility by Age in Gallatin County
Average fertility rate in Gallatin County is 54.0 births per 1,000 women. Women in the age bracket of 20 to 34 years have the highest fertility rate with 129.0 births per 1,000 women. Women in the age bracket of 20 to 34 years acount for 99.1% of all women with births.
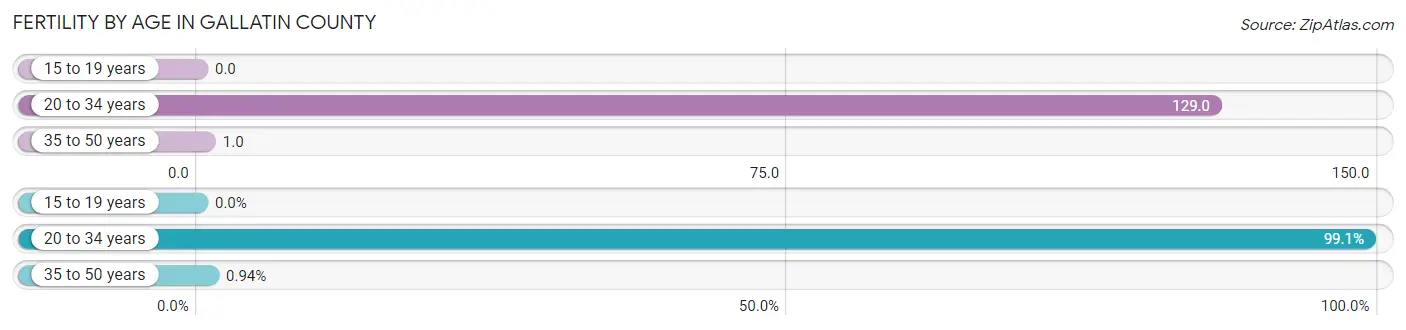
| Age Bracket | Women with Births | Births / 1,000 Women |
| 15 to 19 years | 0 (0.0%) | 0.0 |
| 20 to 34 years | 105 (99.1%) | 129.0 |
| 35 to 50 years | 1 (0.9%) | 1.0 |
| Total | 106 (100.0%) | 54.0 |
Fertility by Age by Marriage Status in Gallatin County
29.2% of women with births (106) in Gallatin County are married. The highest percentage of unmarried women with births falls into 20 to 34 years age bracket with 71.4% of them unmarried at the time of birth, while the lowest percentage of unmarried women with births belong to 35 to 50 years age bracket with 0.0% of them unmarried.
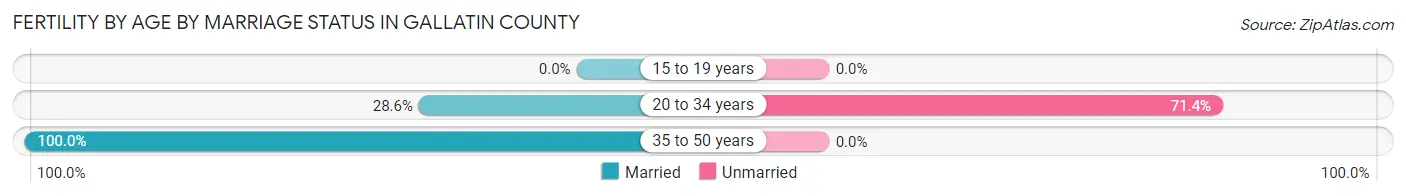
| Age Bracket | Married | Unmarried |
| 15 to 19 years | 0 (0.0%) | 0 (0.0%) |
| 20 to 34 years | 30 (28.6%) | 75 (71.4%) |
| 35 to 50 years | 1 (100.0%) | 0 (0.0%) |
| Total | 31 (29.2%) | 75 (70.8%) |
Fertility by Education in Gallatin County
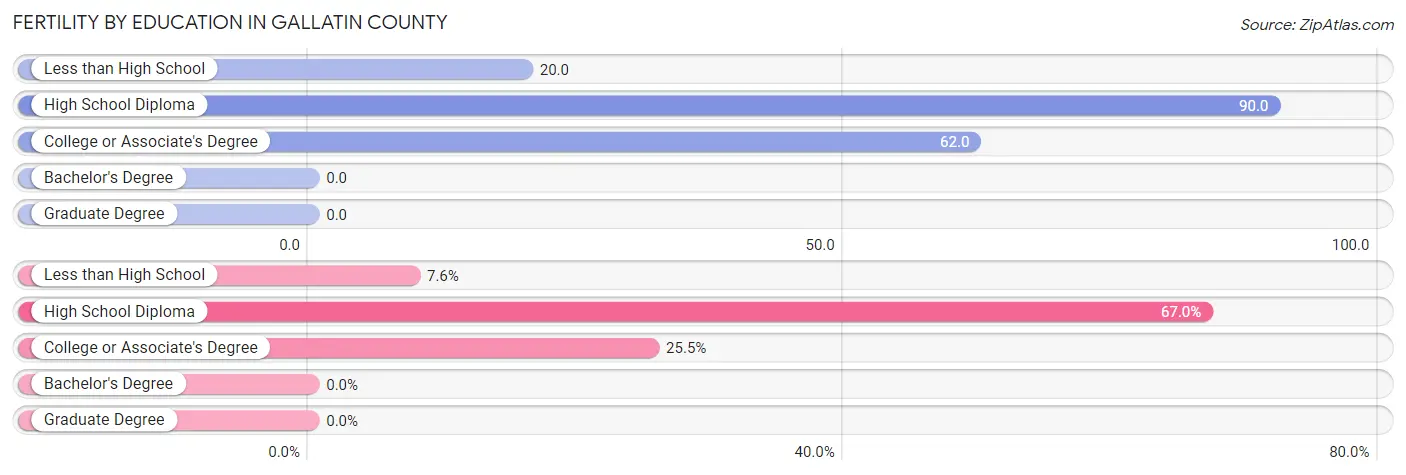
| Educational Attainment | Women with Births | Births / 1,000 Women |
| Less than High School | 8 (7.5%) | 20.0 |
| High School Diploma | 71 (67.0%) | 90.0 |
| College or Associate's Degree | 27 (25.5%) | 62.0 |
| Bachelor's Degree | 0 (0.0%) | 0.0 |
| Graduate Degree | 0 (0.0%) | 0.0 |
| Total | 106 (100.0%) | 54.0 |
Fertility by Education by Marriage Status in Gallatin County
70.8% of women with births in Gallatin County are unmarried. Women with the educational attainment of high school diploma are most likely to be married with 43.7% of them married at childbirth, while women with the educational attainment of less than high school are least likely to be married with 100.0% of them unmarried at childbirth.
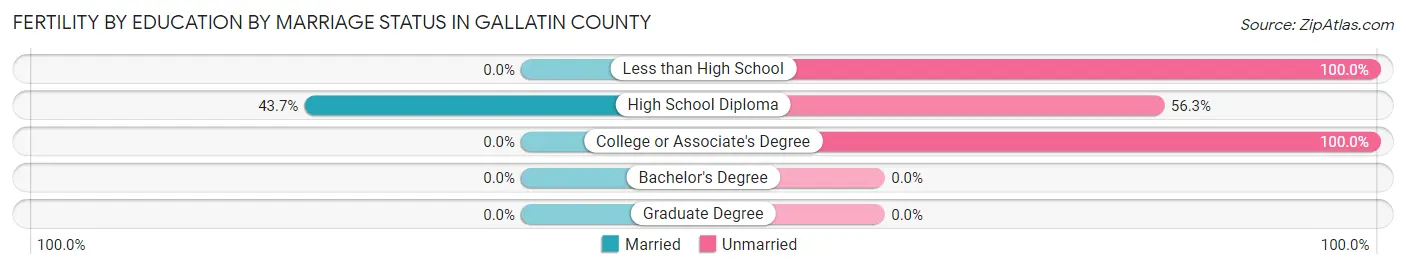
| Educational Attainment | Married | Unmarried |
| Less than High School | 0 (0.0%) | 8 (100.0%) |
| High School Diploma | 31 (43.7%) | 40 (56.3%) |
| College or Associate's Degree | 0 (0.0%) | 27 (100.0%) |
| Bachelor's Degree | 0 (0.0%) | 0 (0.0%) |
| Graduate Degree | 0 (0.0%) | 0 (0.0%) |
| Total | 31 (29.2%) | 75 (70.8%) |
Employment Characteristics in Gallatin County
Employment by Class of Employer in Gallatin County
Among the 3,908 employed individuals in Gallatin County, private company employees (3,124 | 79.9%), local government employees (224 | 5.7%), and not-for-profit organizations (167 | 4.3%) make up the most common classes of employment.
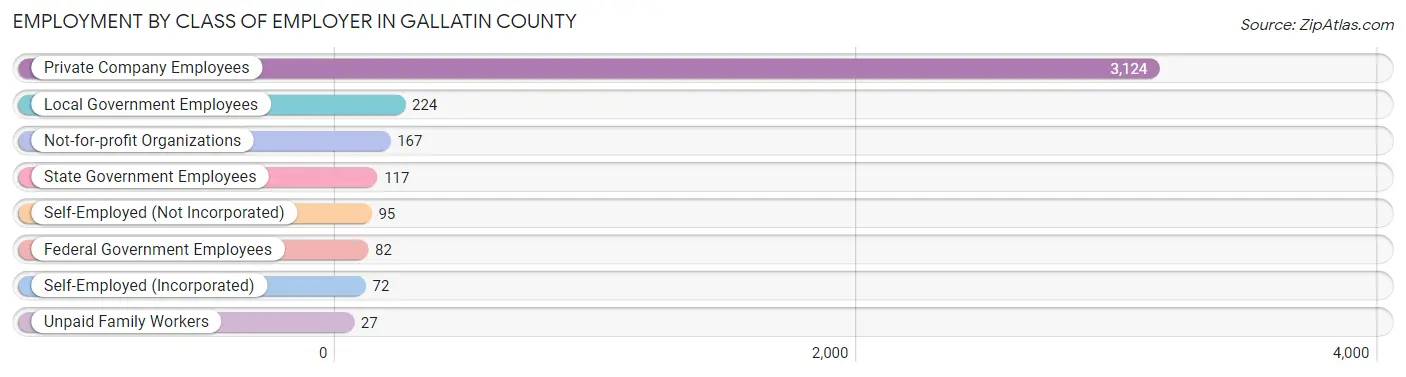
| Employer Class | # Employees | % Employees |
| Private Company Employees | 3,124 | 79.9% |
| Self-Employed (Incorporated) | 72 | 1.8% |
| Self-Employed (Not Incorporated) | 95 | 2.4% |
| Not-for-profit Organizations | 167 | 4.3% |
| Local Government Employees | 224 | 5.7% |
| State Government Employees | 117 | 3.0% |
| Federal Government Employees | 82 | 2.1% |
| Unpaid Family Workers | 27 | 0.7% |
| Total | 3,908 | 100.0% |
Employment Status by Age in Gallatin County
According to the labor force statistics for Gallatin County, out of the total population over 16 years of age (6,992), 58.7% or 4,104 individuals are in the labor force, with 3.7% or 152 of them unemployed. The age group with the highest labor force participation rate is 30 to 34 years, with 91.8% or 512 individuals in the labor force. Within the labor force, the 75 years and over age range has the highest percentage of unemployed individuals, with 70.0% or 21 of them being unemployed.
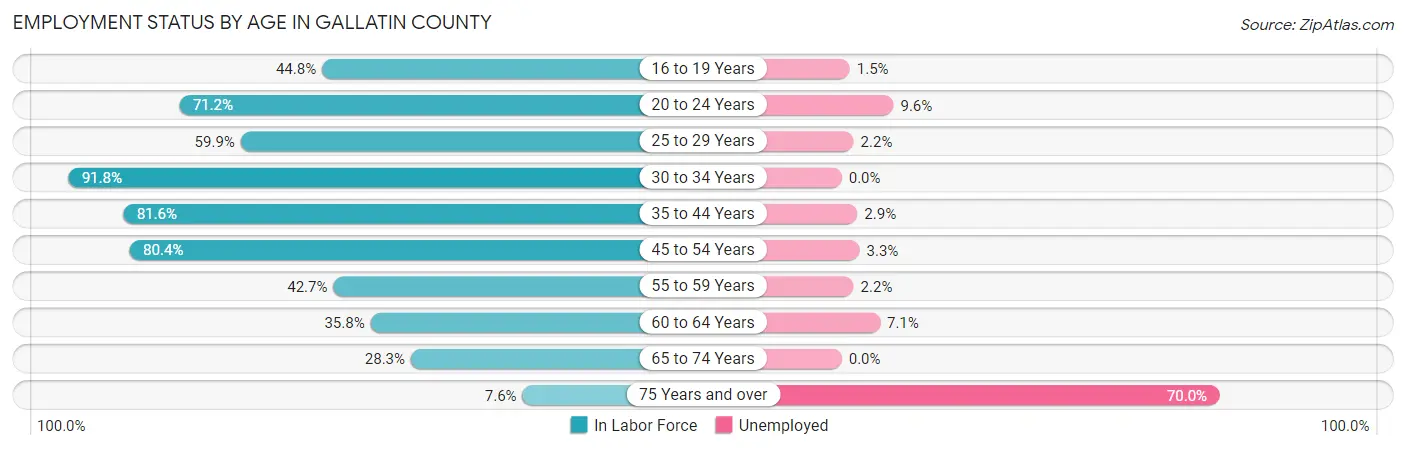
| Age Bracket | In Labor Force | Unemployed |
| 16 to 19 Years | 197 (44.8%) | 3 (1.5%) |
| 20 to 24 Years | 474 (71.2%) | 46 (9.6%) |
| 25 to 29 Years | 359 (59.9%) | 8 (2.2%) |
| 30 to 34 Years | 512 (91.8%) | 0 (0.0%) |
| 35 to 44 Years | 844 (81.6%) | 24 (2.9%) |
| 45 to 54 Years | 915 (80.4%) | 30 (3.3%) |
| 55 to 59 Years | 368 (42.7%) | 8 (2.2%) |
| 60 to 64 Years | 184 (35.8%) | 13 (7.1%) |
| 65 to 74 Years | 223 (28.3%) | 0 (0.0%) |
| 75 Years and over | 30 (7.6%) | 21 (70.0%) |
| Total | 4,104 (58.7%) | 152 (3.7%) |
Employment Status by Educational Attainment in Gallatin County
According to labor force statistics for Gallatin County, 67.6% of individuals (3,181) out of the total population between 25 and 64 years of age (4,705) are in the labor force, with 2.6% or 83 of them being unemployed. The group with the highest labor force participation rate are those with the educational attainment of college / associate degree, with 83.2% or 1,013 individuals in the labor force. Within the labor force, individuals with bachelor's degree or higher education have the highest percentage of unemployment, with 5.4% or 24 of them being unemployed.
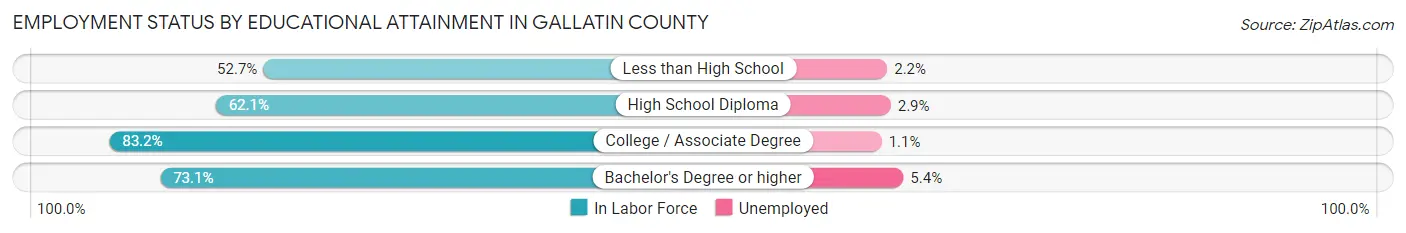
| Educational Attainment | In Labor Force | Unemployed |
| Less than High School | 360 (52.7%) | 15 (2.2%) |
| High School Diploma | 1,363 (62.1%) | 64 (2.9%) |
| College / Associate Degree | 1,013 (83.2%) | 13 (1.1%) |
| Bachelor's Degree or higher | 446 (73.1%) | 33 (5.4%) |
| Total | 3,181 (67.6%) | 122 (2.6%) |
Employment Occupations by Sex in Gallatin County
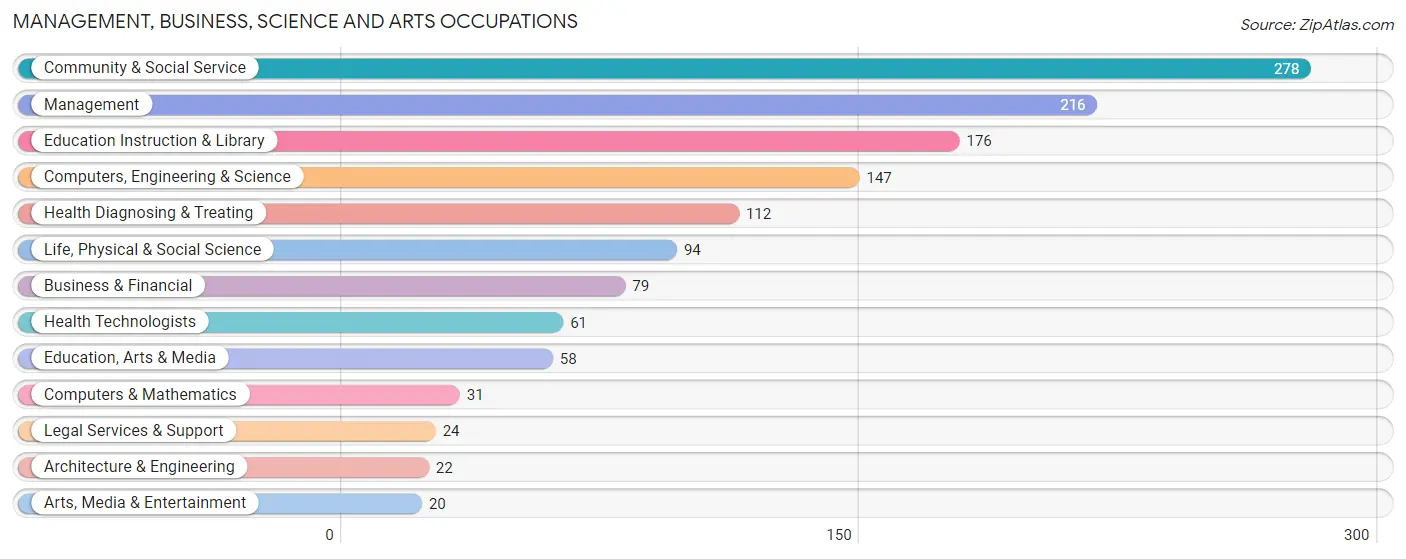
Management, Business, Science and Arts Occupations
The most common Management, Business, Science and Arts occupations in Gallatin County are Community & Social Service (278 | 7.1%), Management (216 | 5.5%), Education Instruction & Library (176 | 4.5%), Computers, Engineering & Science (147 | 3.7%), and Health Diagnosing & Treating (112 | 2.8%).
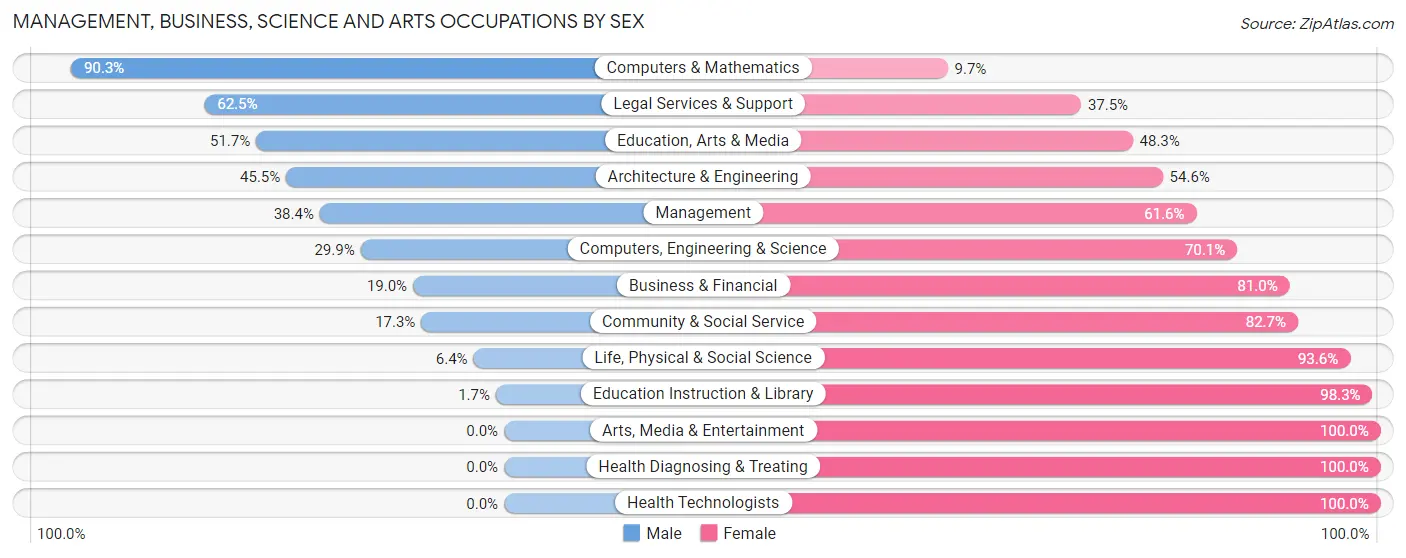
Management, Business, Science and Arts Occupations by Sex
Within the Management, Business, Science and Arts occupations in Gallatin County, the most male-oriented occupations are Computers & Mathematics (90.3%), Legal Services & Support (62.5%), and Education, Arts & Media (51.7%), while the most female-oriented occupations are Arts, Media & Entertainment (100.0%), Health Diagnosing & Treating (100.0%), and Health Technologists (100.0%).
| Occupation | Male | Female |
| Management | 83 (38.4%) | 133 (61.6%) |
| Business & Financial | 15 (19.0%) | 64 (81.0%) |
| Computers, Engineering & Science | 44 (29.9%) | 103 (70.1%) |
| Computers & Mathematics | 28 (90.3%) | 3 (9.7%) |
| Architecture & Engineering | 10 (45.5%) | 12 (54.5%) |
| Life, Physical & Social Science | 6 (6.4%) | 88 (93.6%) |
| Community & Social Service | 48 (17.3%) | 230 (82.7%) |
| Education, Arts & Media | 30 (51.7%) | 28 (48.3%) |
| Legal Services & Support | 15 (62.5%) | 9 (37.5%) |
| Education Instruction & Library | 3 (1.7%) | 173 (98.3%) |
| Arts, Media & Entertainment | 0 (0.0%) | 20 (100.0%) |
| Health Diagnosing & Treating | 0 (0.0%) | 112 (100.0%) |
| Health Technologists | 0 (0.0%) | 61 (100.0%) |
| Total (Category) | 190 (22.8%) | 642 (77.2%) |
| Total (Overall) | 2,210 (56.1%) | 1,730 (43.9%) |
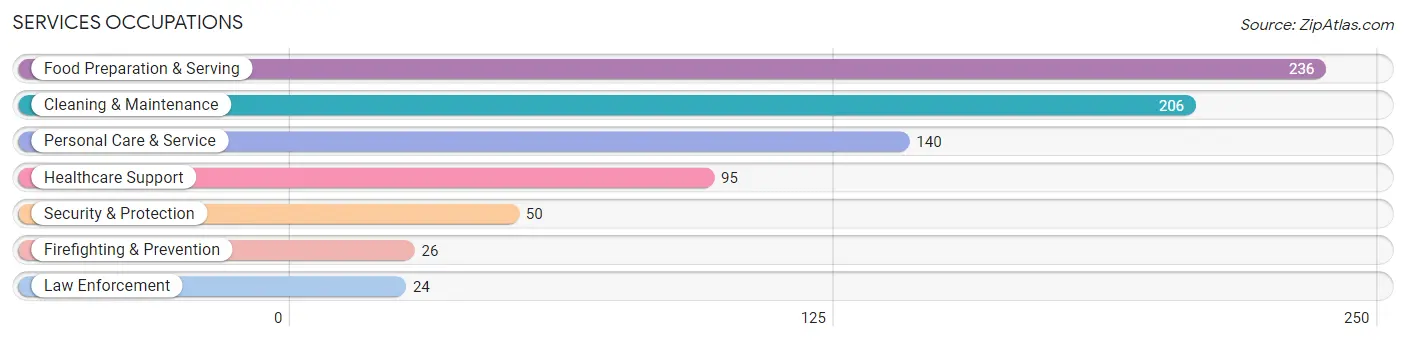
Services Occupations
The most common Services occupations in Gallatin County are Food Preparation & Serving (236 | 6.0%), Cleaning & Maintenance (206 | 5.2%), Personal Care & Service (140 | 3.5%), Healthcare Support (95 | 2.4%), and Security & Protection (50 | 1.3%).
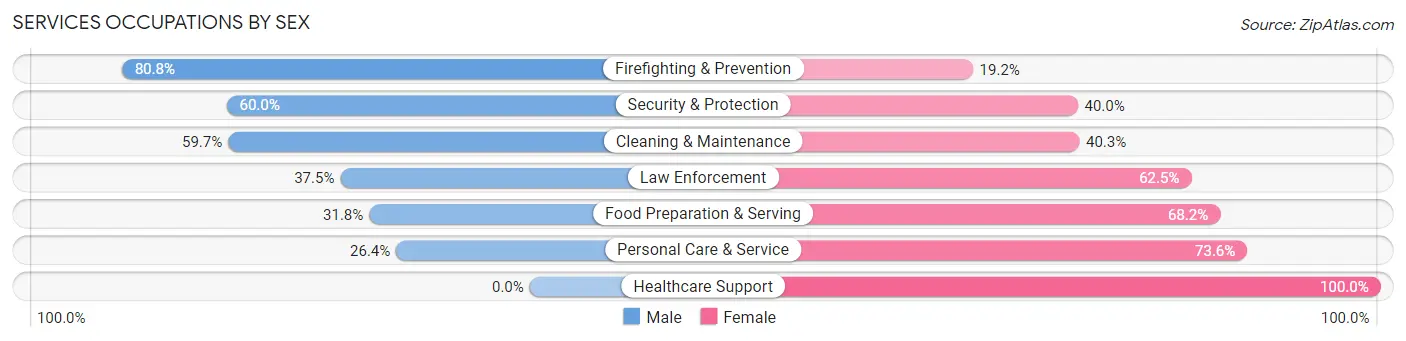
Services Occupations by Sex
Within the Services occupations in Gallatin County, the most male-oriented occupations are Firefighting & Prevention (80.8%), Security & Protection (60.0%), and Cleaning & Maintenance (59.7%), while the most female-oriented occupations are Healthcare Support (100.0%), Personal Care & Service (73.6%), and Food Preparation & Serving (68.2%).
| Occupation | Male | Female |
| Healthcare Support | 0 (0.0%) | 95 (100.0%) |
| Security & Protection | 30 (60.0%) | 20 (40.0%) |
| Firefighting & Prevention | 21 (80.8%) | 5 (19.2%) |
| Law Enforcement | 9 (37.5%) | 15 (62.5%) |
| Food Preparation & Serving | 75 (31.8%) | 161 (68.2%) |
| Cleaning & Maintenance | 123 (59.7%) | 83 (40.3%) |
| Personal Care & Service | 37 (26.4%) | 103 (73.6%) |
| Total (Category) | 265 (36.4%) | 462 (63.5%) |
| Total (Overall) | 2,210 (56.1%) | 1,730 (43.9%) |
Sales and Office Occupations
The most common Sales and Office occupations in Gallatin County are Office & Administration (309 | 7.8%), and Sales & Related (268 | 6.8%).
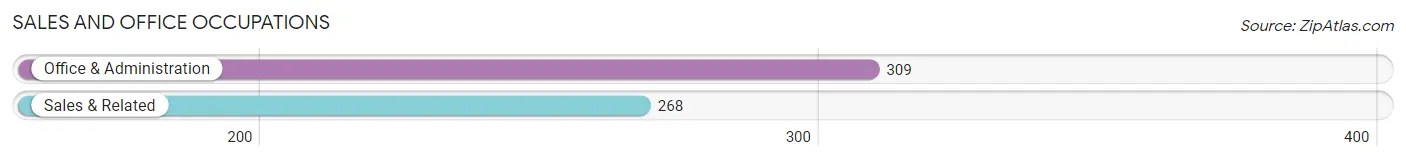
Sales and Office Occupations by Sex
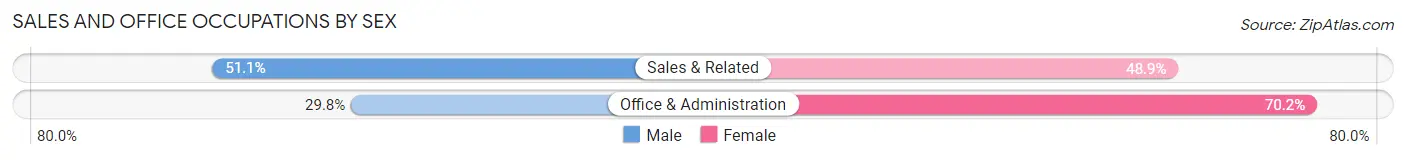
| Occupation | Male | Female |
| Sales & Related | 137 (51.1%) | 131 (48.9%) |
| Office & Administration | 92 (29.8%) | 217 (70.2%) |
| Total (Category) | 229 (39.7%) | 348 (60.3%) |
| Total (Overall) | 2,210 (56.1%) | 1,730 (43.9%) |
Natural Resources, Construction and Maintenance Occupations
The most common Natural Resources, Construction and Maintenance occupations in Gallatin County are Construction & Extraction (280 | 7.1%), Installation, Maintenance & Repair (197 | 5.0%), and Farming, Fishing & Forestry (27 | 0.7%).
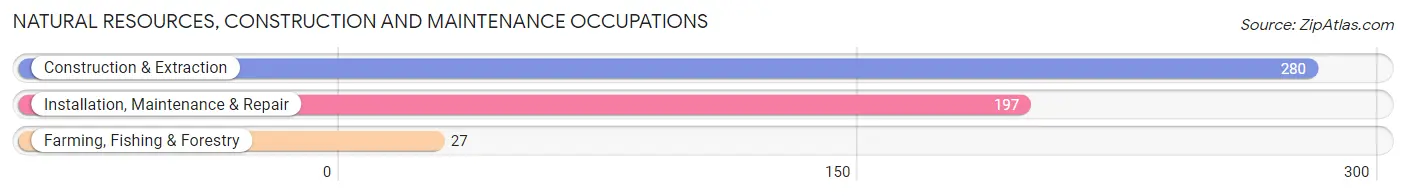
Natural Resources, Construction and Maintenance Occupations by Sex
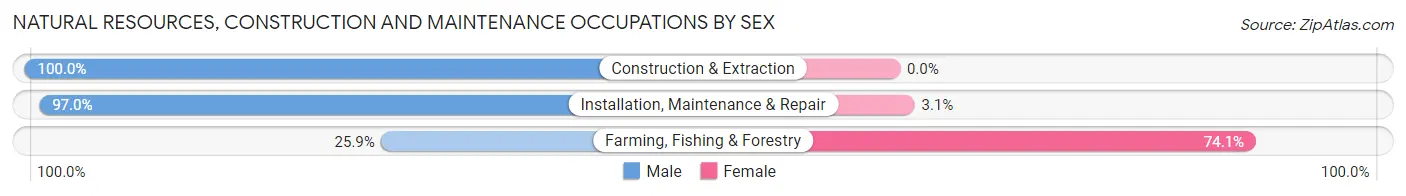
| Occupation | Male | Female |
| Farming, Fishing & Forestry | 7 (25.9%) | 20 (74.1%) |
| Construction & Extraction | 280 (100.0%) | 0 (0.0%) |
| Installation, Maintenance & Repair | 191 (97.0%) | 6 (3.0%) |
| Total (Category) | 478 (94.8%) | 26 (5.2%) |
| Total (Overall) | 2,210 (56.1%) | 1,730 (43.9%) |
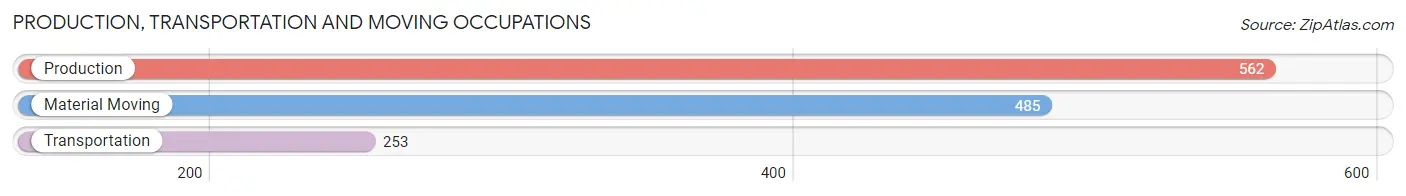
Production, Transportation and Moving Occupations
The most common Production, Transportation and Moving occupations in Gallatin County are Production (562 | 14.3%), Material Moving (485 | 12.3%), and Transportation (253 | 6.4%).
Production, Transportation and Moving Occupations by Sex
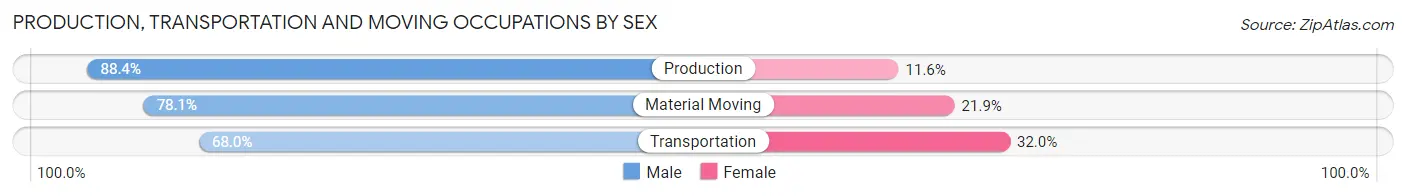
| Occupation | Male | Female |
| Production | 497 (88.4%) | 65 (11.6%) |
| Transportation | 172 (68.0%) | 81 (32.0%) |
| Material Moving | 379 (78.1%) | 106 (21.9%) |
| Total (Category) | 1,048 (80.6%) | 252 (19.4%) |
| Total (Overall) | 2,210 (56.1%) | 1,730 (43.9%) |
Employment Industries by Sex in Gallatin County
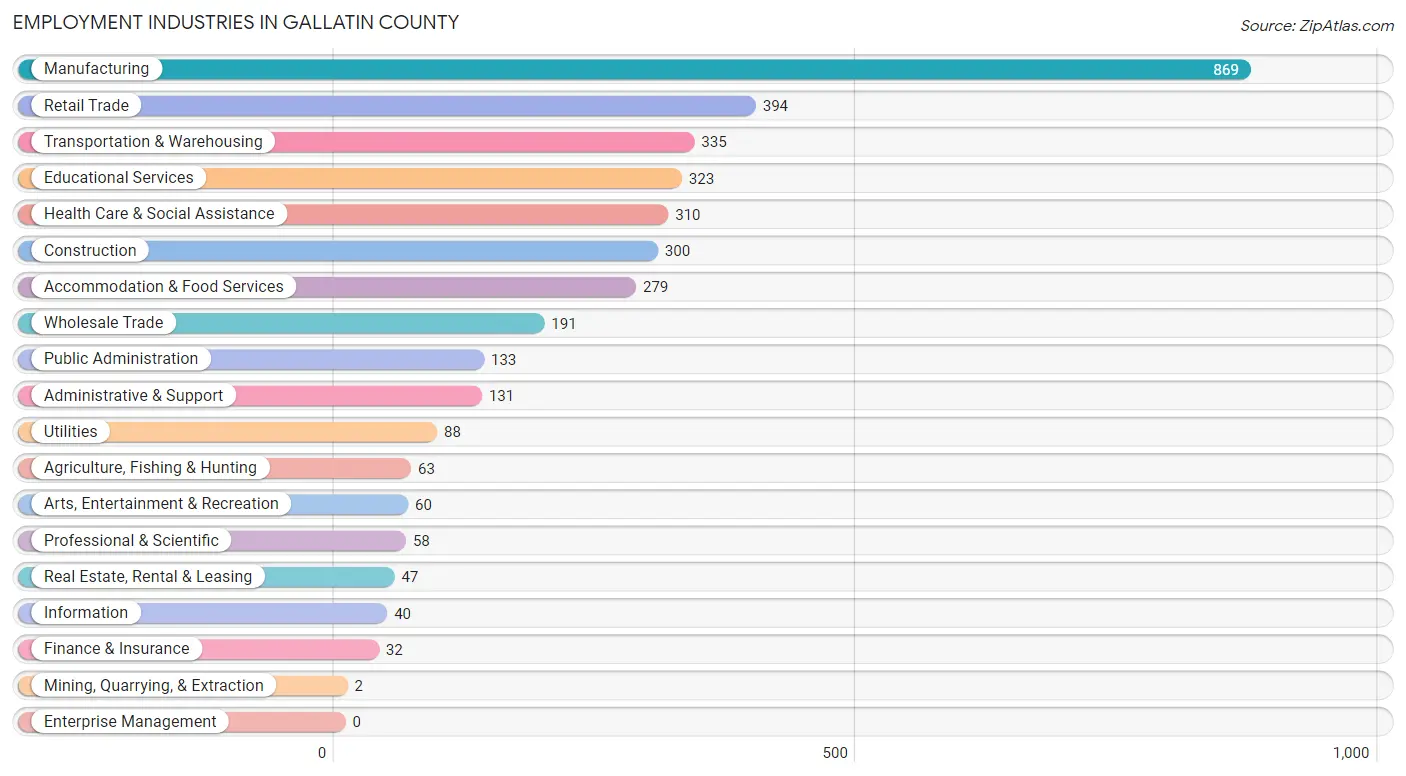
Employment Industries in Gallatin County
The major employment industries in Gallatin County include Manufacturing (869 | 22.1%), Retail Trade (394 | 10.0%), Transportation & Warehousing (335 | 8.5%), Educational Services (323 | 8.2%), and Health Care & Social Assistance (310 | 7.9%).
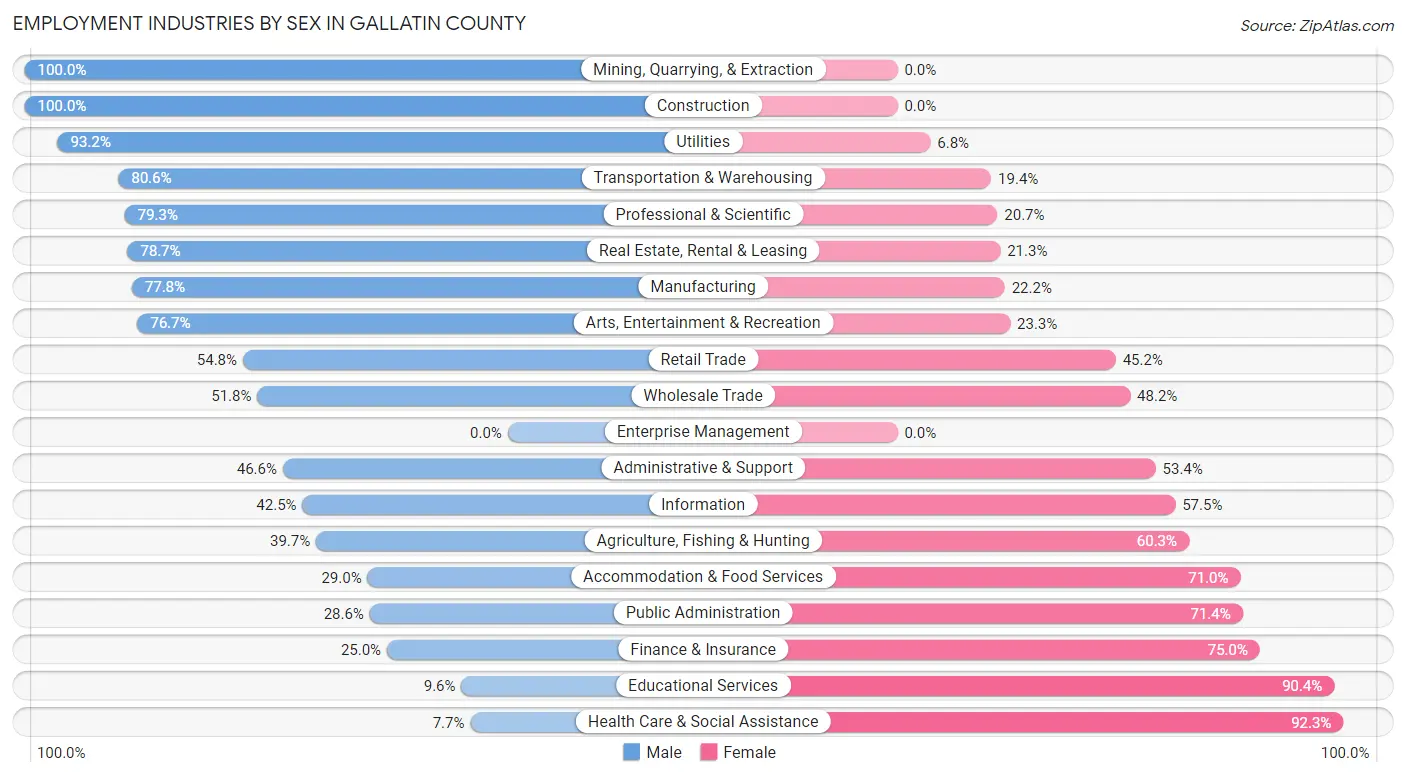
Employment Industries by Sex in Gallatin County
The Gallatin County industries that see more men than women are Mining, Quarrying, & Extraction (100.0%), Construction (100.0%), and Utilities (93.2%), whereas the industries that tend to have a higher number of women are Health Care & Social Assistance (92.3%), Educational Services (90.4%), and Finance & Insurance (75.0%).
| Industry | Male | Female |
| Agriculture, Fishing & Hunting | 25 (39.7%) | 38 (60.3%) |
| Mining, Quarrying, & Extraction | 2 (100.0%) | 0 (0.0%) |
| Construction | 300 (100.0%) | 0 (0.0%) |
| Manufacturing | 676 (77.8%) | 193 (22.2%) |
| Wholesale Trade | 99 (51.8%) | 92 (48.2%) |
| Retail Trade | 216 (54.8%) | 178 (45.2%) |
| Transportation & Warehousing | 270 (80.6%) | 65 (19.4%) |
| Utilities | 82 (93.2%) | 6 (6.8%) |
| Information | 17 (42.5%) | 23 (57.5%) |
| Finance & Insurance | 8 (25.0%) | 24 (75.0%) |
| Real Estate, Rental & Leasing | 37 (78.7%) | 10 (21.3%) |
| Professional & Scientific | 46 (79.3%) | 12 (20.7%) |
| Enterprise Management | 0 (0.0%) | 0 (0.0%) |
| Administrative & Support | 61 (46.6%) | 70 (53.4%) |
| Educational Services | 31 (9.6%) | 292 (90.4%) |
| Health Care & Social Assistance | 24 (7.7%) | 286 (92.3%) |
| Arts, Entertainment & Recreation | 46 (76.7%) | 14 (23.3%) |
| Accommodation & Food Services | 81 (29.0%) | 198 (71.0%) |
| Public Administration | 38 (28.6%) | 95 (71.4%) |
| Total | 2,210 (56.1%) | 1,730 (43.9%) |
Education in Gallatin County
School Enrollment in Gallatin County
The most common levels of schooling among the 1,808 students in Gallatin County are high school (484 | 26.8%), middle school (438 | 24.2%), and elementary school (296 | 16.4%).
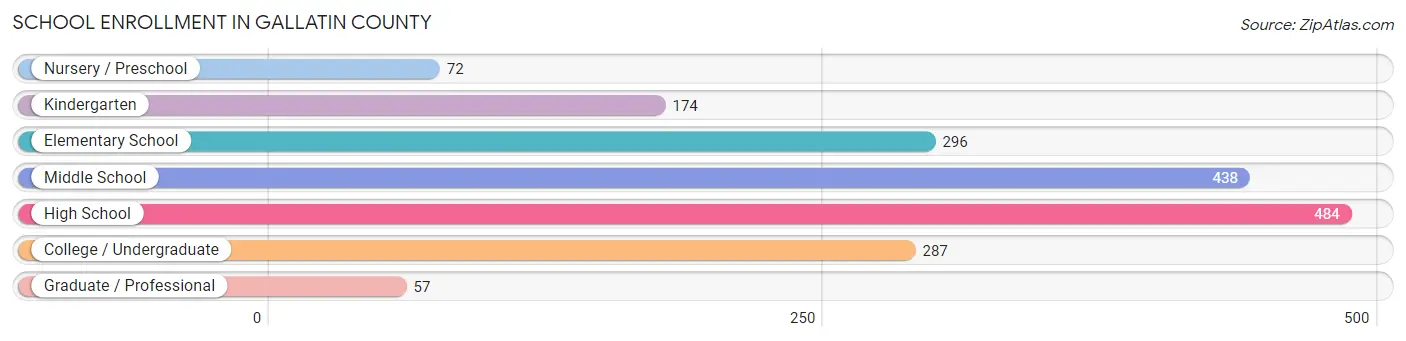
| School Level | # Students | % Students |
| Nursery / Preschool | 72 | 4.0% |
| Kindergarten | 174 | 9.6% |
| Elementary School | 296 | 16.4% |
| Middle School | 438 | 24.2% |
| High School | 484 | 26.8% |
| College / Undergraduate | 287 | 15.9% |
| Graduate / Professional | 57 | 3.2% |
| Total | 1,808 | 100.0% |
School Enrollment by Age by Funding Source in Gallatin County
Out of a total of 1,808 students who are enrolled in schools in Gallatin County, 199 (11.0%) attend a private institution, while the remaining 1,609 (89.0%) are enrolled in public schools. The age group of 3 to 4 year olds has the highest likelihood of being enrolled in private schools, with 19 (40.4% in the age bracket) enrolled. Conversely, the age group of 10 to 14 year olds has the lowest likelihood of being enrolled in a private school, with 486 (96.4% in the age bracket) attending a public institution.
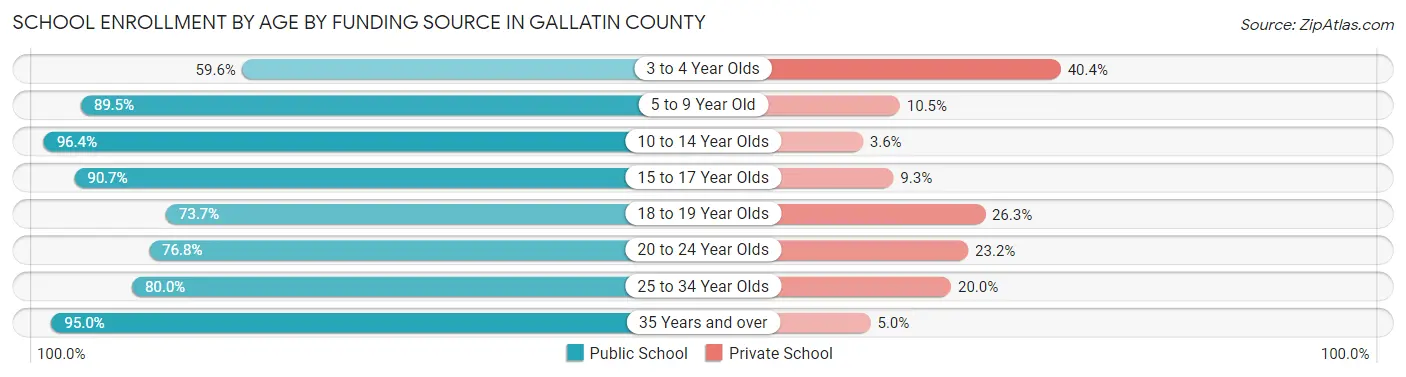
| Age Bracket | Public School | Private School |
| 3 to 4 Year Olds | 28 (59.6%) | 19 (40.4%) |
| 5 to 9 Year Old | 436 (89.5%) | 51 (10.5%) |
| 10 to 14 Year Olds | 486 (96.4%) | 18 (3.6%) |
| 15 to 17 Year Olds | 333 (90.7%) | 34 (9.3%) |
| 18 to 19 Year Olds | 56 (73.7%) | 20 (26.3%) |
| 20 to 24 Year Olds | 159 (76.8%) | 48 (23.2%) |
| 25 to 34 Year Olds | 16 (80.0%) | 4 (20.0%) |
| 35 Years and over | 95 (95.0%) | 5 (5.0%) |
| Total | 1,609 (89.0%) | 199 (11.0%) |
Educational Attainment by Field of Study in Gallatin County
Science & technology (184 | 22.0%), business (131 | 15.6%), education (130 | 15.5%), arts & humanities (78 | 9.3%), and liberal arts & history (58 | 6.9%) are the most common fields of study among 838 individuals in Gallatin County who have obtained a bachelor's degree or higher.
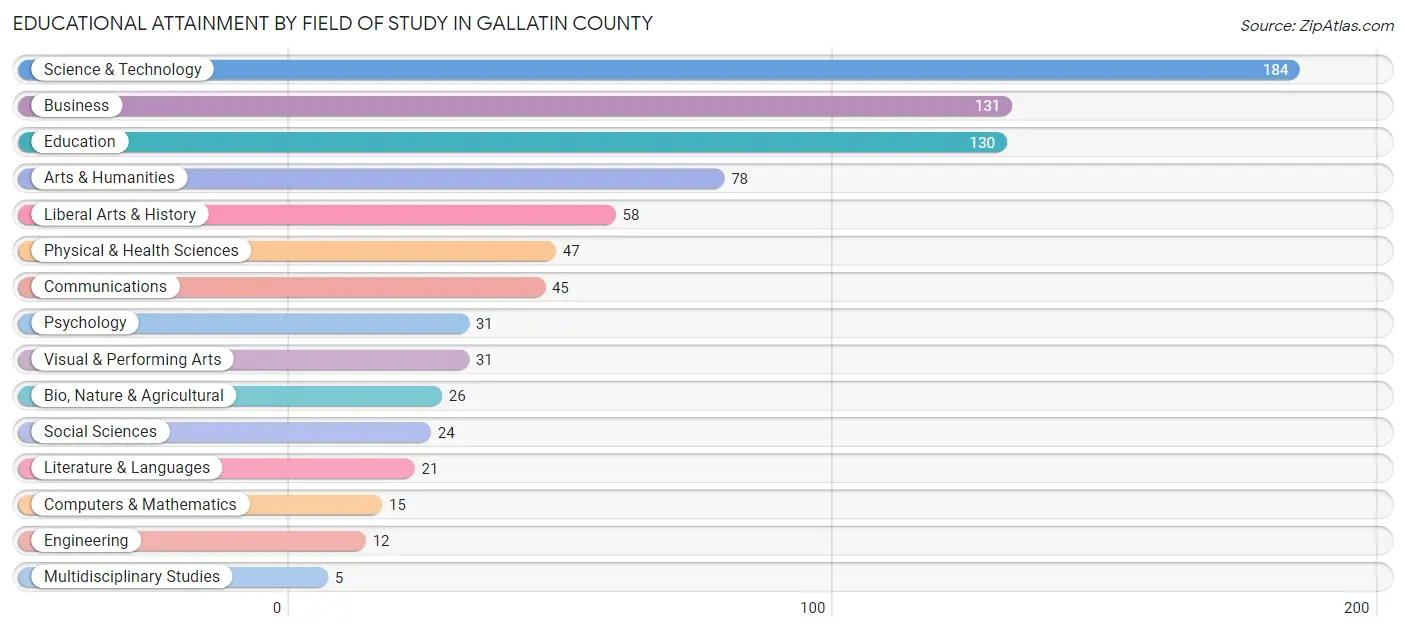
| Field of Study | # Graduates | % Graduates |
| Computers & Mathematics | 15 | 1.8% |
| Bio, Nature & Agricultural | 26 | 3.1% |
| Physical & Health Sciences | 47 | 5.6% |
| Psychology | 31 | 3.7% |
| Social Sciences | 24 | 2.9% |
| Engineering | 12 | 1.4% |
| Multidisciplinary Studies | 5 | 0.6% |
| Science & Technology | 184 | 22.0% |
| Business | 131 | 15.6% |
| Education | 130 | 15.5% |
| Literature & Languages | 21 | 2.5% |
| Liberal Arts & History | 58 | 6.9% |
| Visual & Performing Arts | 31 | 3.7% |
| Communications | 45 | 5.4% |
| Arts & Humanities | 78 | 9.3% |
| Total | 838 | 100.0% |
Transportation & Commute in Gallatin County
Vehicle Availability by Sex in Gallatin County
The most prevalent vehicle ownership categories in Gallatin County are males with 3 vehicles (780, accounting for 35.6%) and females with 3 vehicles (578, making up 45.5%).
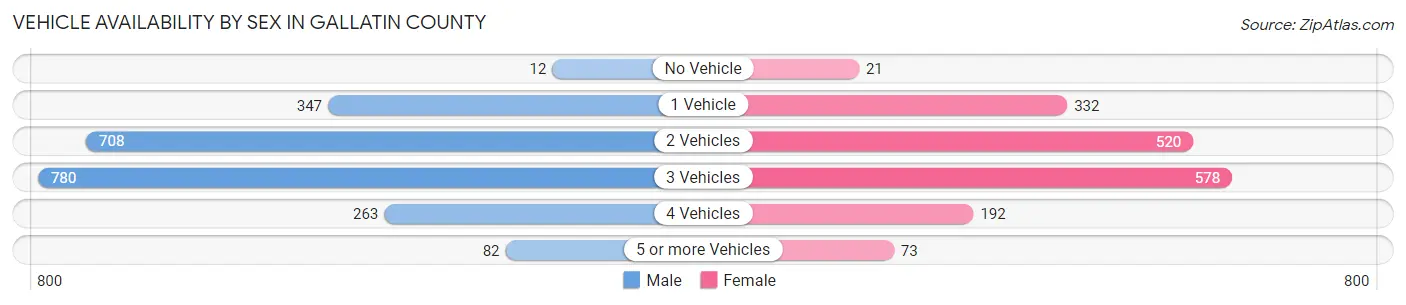
| Vehicles Available | Male | Female |
| No Vehicle | 12 (0.5%) | 21 (1.2%) |
| 1 Vehicle | 347 (15.8%) | 332 (19.4%) |
| 2 Vehicles | 708 (32.3%) | 520 (30.3%) |
| 3 Vehicles | 780 (35.6%) | 578 (33.7%) |
| 4 Vehicles | 263 (12.0%) | 192 (11.2%) |
| 5 or more Vehicles | 82 (3.7%) | 73 (4.3%) |
| Total | 2,192 (100.0%) | 1,716 (100.0%) |
Commute Time in Gallatin County
The most frequently occuring commute durations in Gallatin County are 30 to 34 minutes (632 commuters, 16.7%), 20 to 24 minutes (427 commuters, 11.3%), and 45 to 59 minutes (393 commuters, 10.4%).
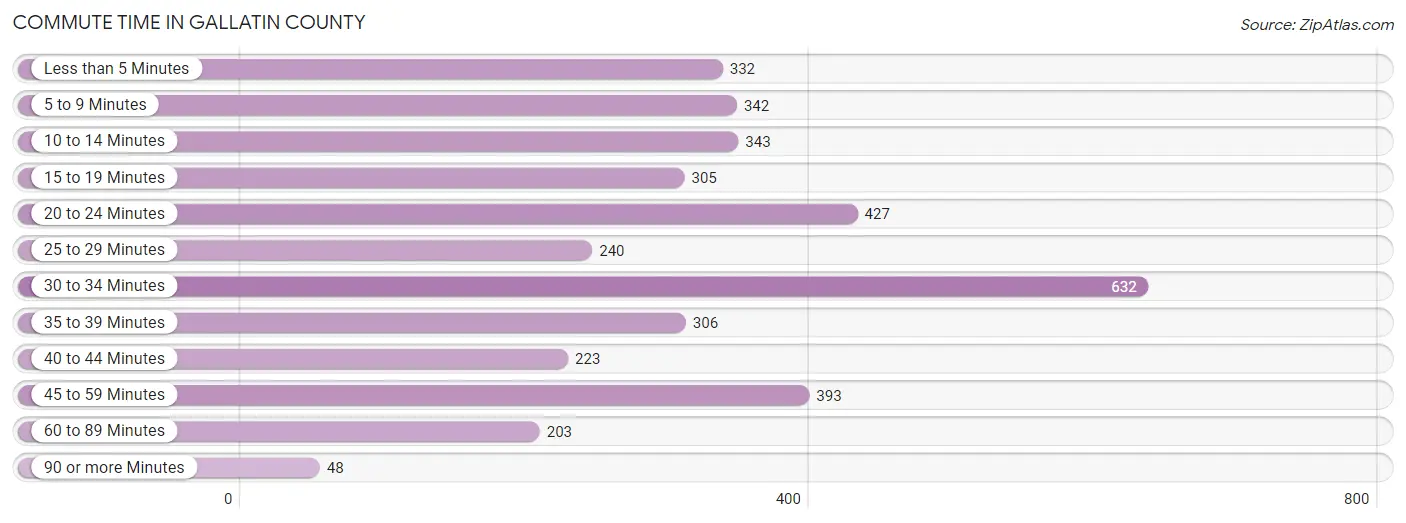
| Commute Time | # Commuters | % Commuters |
| Less than 5 Minutes | 332 | 8.7% |
| 5 to 9 Minutes | 342 | 9.0% |
| 10 to 14 Minutes | 343 | 9.0% |
| 15 to 19 Minutes | 305 | 8.0% |
| 20 to 24 Minutes | 427 | 11.3% |
| 25 to 29 Minutes | 240 | 6.3% |
| 30 to 34 Minutes | 632 | 16.7% |
| 35 to 39 Minutes | 306 | 8.1% |
| 40 to 44 Minutes | 223 | 5.9% |
| 45 to 59 Minutes | 393 | 10.4% |
| 60 to 89 Minutes | 203 | 5.3% |
| 90 or more Minutes | 48 | 1.3% |
Commute Time by Sex in Gallatin County
The most common commute times in Gallatin County are 20 to 24 minutes (313 commuters, 14.6%) for males and 30 to 34 minutes (344 commuters, 20.8%) for females.
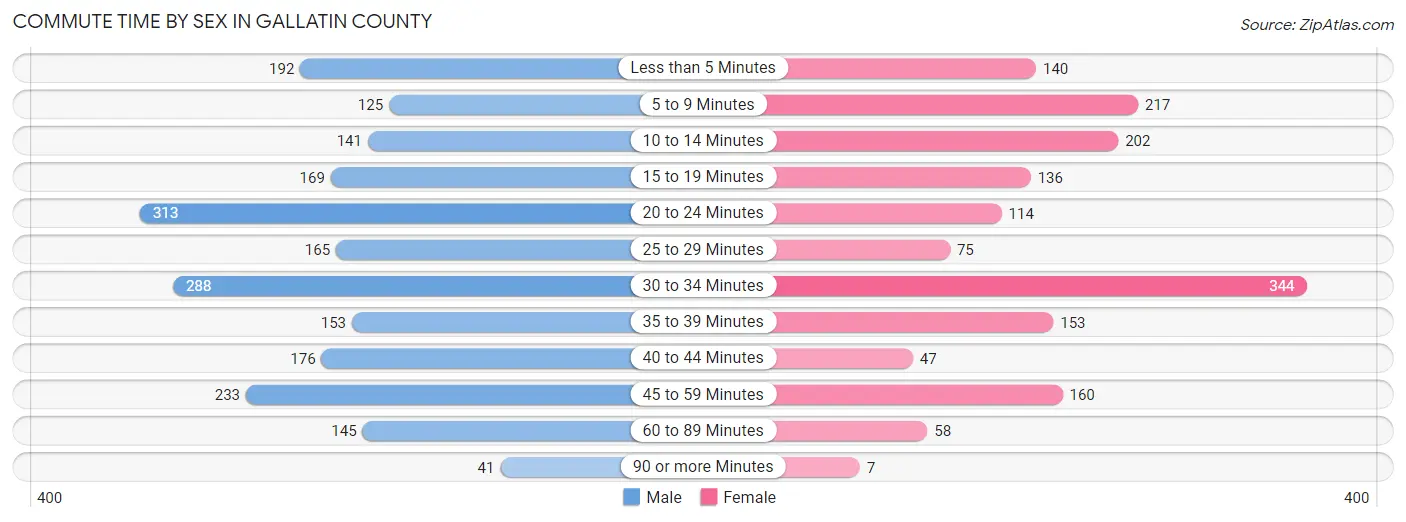
| Commute Time | Male | Female |
| Less than 5 Minutes | 192 (9.0%) | 140 (8.5%) |
| 5 to 9 Minutes | 125 (5.8%) | 217 (13.1%) |
| 10 to 14 Minutes | 141 (6.6%) | 202 (12.2%) |
| 15 to 19 Minutes | 169 (7.9%) | 136 (8.2%) |
| 20 to 24 Minutes | 313 (14.6%) | 114 (6.9%) |
| 25 to 29 Minutes | 165 (7.7%) | 75 (4.5%) |
| 30 to 34 Minutes | 288 (13.5%) | 344 (20.8%) |
| 35 to 39 Minutes | 153 (7.1%) | 153 (9.3%) |
| 40 to 44 Minutes | 176 (8.2%) | 47 (2.8%) |
| 45 to 59 Minutes | 233 (10.9%) | 160 (9.7%) |
| 60 to 89 Minutes | 145 (6.8%) | 58 (3.5%) |
| 90 or more Minutes | 41 (1.9%) | 7 (0.4%) |
Time of Departure to Work by Sex in Gallatin County
The most frequent times of departure to work in Gallatin County are 7:00 AM to 7:29 AM (426, 19.9%) for males and 7:30 AM to 7:59 AM (272, 16.5%) for females.
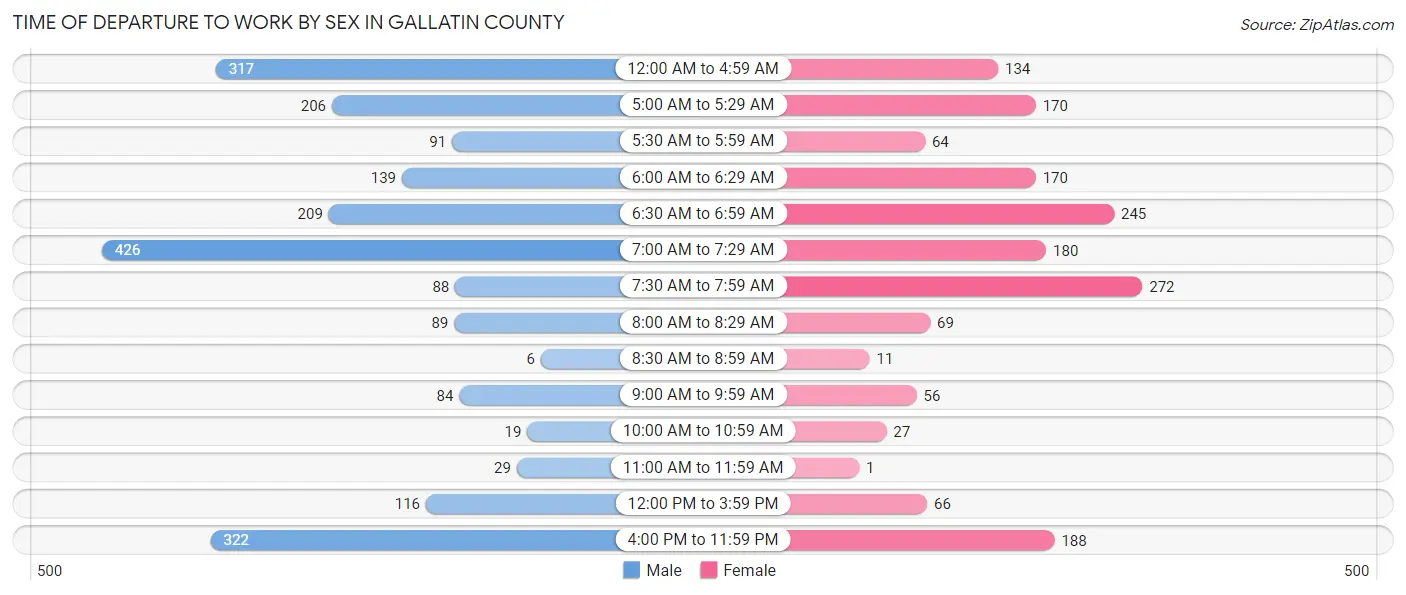
| Time of Departure | Male | Female |
| 12:00 AM to 4:59 AM | 317 (14.8%) | 134 (8.1%) |
| 5:00 AM to 5:29 AM | 206 (9.6%) | 170 (10.3%) |
| 5:30 AM to 5:59 AM | 91 (4.3%) | 64 (3.9%) |
| 6:00 AM to 6:29 AM | 139 (6.5%) | 170 (10.3%) |
| 6:30 AM to 6:59 AM | 209 (9.8%) | 245 (14.8%) |
| 7:00 AM to 7:29 AM | 426 (19.9%) | 180 (10.9%) |
| 7:30 AM to 7:59 AM | 88 (4.1%) | 272 (16.5%) |
| 8:00 AM to 8:29 AM | 89 (4.2%) | 69 (4.2%) |
| 8:30 AM to 8:59 AM | 6 (0.3%) | 11 (0.7%) |
| 9:00 AM to 9:59 AM | 84 (3.9%) | 56 (3.4%) |
| 10:00 AM to 10:59 AM | 19 (0.9%) | 27 (1.6%) |
| 11:00 AM to 11:59 AM | 29 (1.3%) | 1 (0.1%) |
| 12:00 PM to 3:59 PM | 116 (5.4%) | 66 (4.0%) |
| 4:00 PM to 11:59 PM | 322 (15.0%) | 188 (11.4%) |
| Total | 2,141 (100.0%) | 1,653 (100.0%) |
Housing Occupancy in Gallatin County
Occupancy by Ownership in Gallatin County
Of the total 3,108 dwellings in Gallatin County, owner-occupied units account for 2,192 (70.5%), while renter-occupied units make up 916 (29.5%).
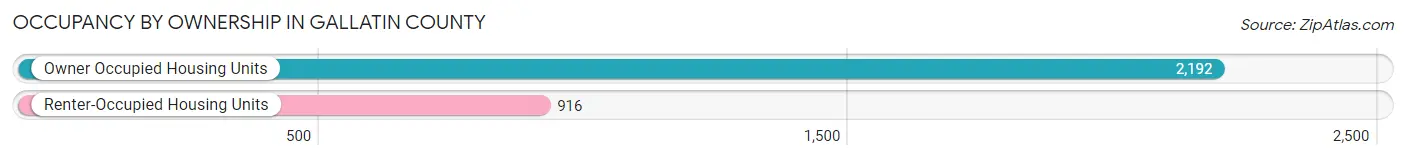
| Occupancy | # Housing Units | % Housing Units |
| Owner Occupied Housing Units | 2,192 | 70.5% |
| Renter-Occupied Housing Units | 916 | 29.5% |
| Total Occupied Housing Units | 3,108 | 100.0% |
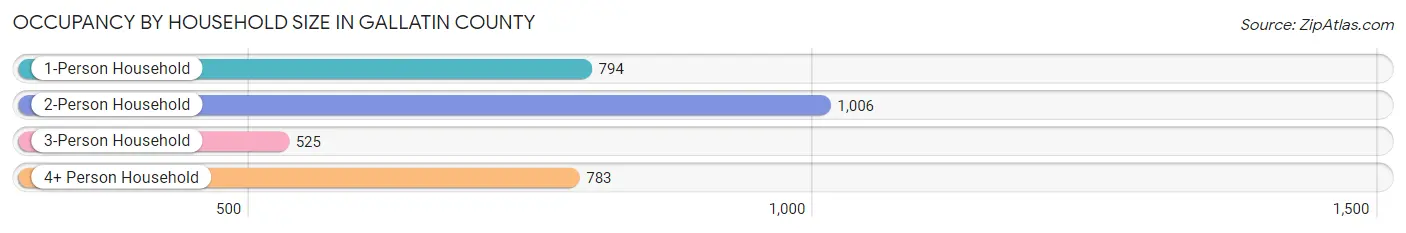
Occupancy by Household Size in Gallatin County
| Household Size | # Housing Units | % Housing Units |
| 1-Person Household | 794 | 25.6% |
| 2-Person Household | 1,006 | 32.4% |
| 3-Person Household | 525 | 16.9% |
| 4+ Person Household | 783 | 25.2% |
| Total Housing Units | 3,108 | 100.0% |
Occupancy by Ownership by Household Size in Gallatin County
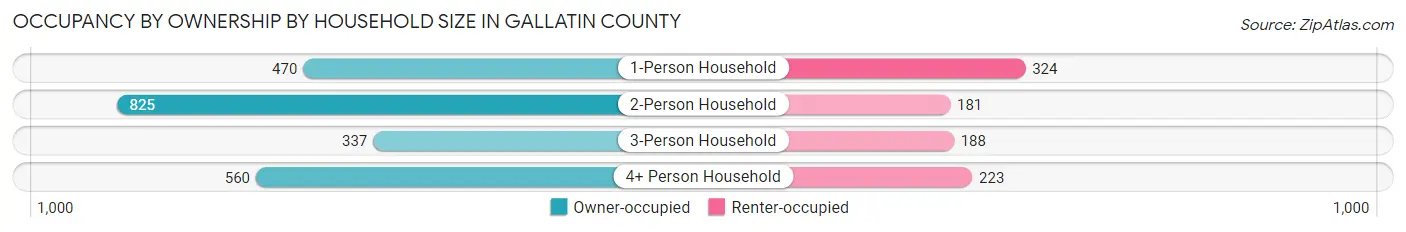
| Household Size | Owner-occupied | Renter-occupied |
| 1-Person Household | 470 (59.2%) | 324 (40.8%) |
| 2-Person Household | 825 (82.0%) | 181 (18.0%) |
| 3-Person Household | 337 (64.2%) | 188 (35.8%) |
| 4+ Person Household | 560 (71.5%) | 223 (28.5%) |
| Total Housing Units | 2,192 (70.5%) | 916 (29.5%) |
Occupancy by Educational Attainment in Gallatin County
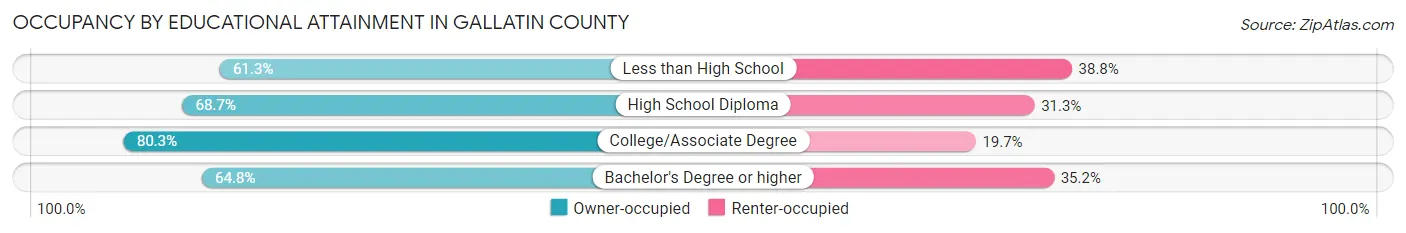
| Household Size | Owner-occupied | Renter-occupied |
| Less than High School | 275 (61.3%) | 174 (38.8%) |
| High School Diploma | 881 (68.7%) | 402 (31.3%) |
| College/Associate Degree | 747 (80.3%) | 183 (19.7%) |
| Bachelor's Degree or higher | 289 (64.8%) | 157 (35.2%) |
Occupancy by Age of Householder in Gallatin County
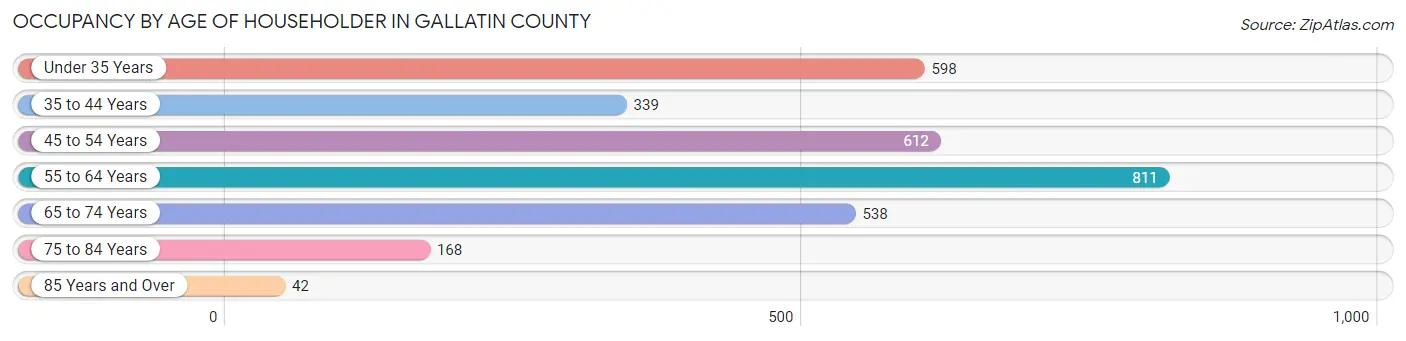
| Age Bracket | # Households | % Households |
| Under 35 Years | 598 | 19.2% |
| 35 to 44 Years | 339 | 10.9% |
| 45 to 54 Years | 612 | 19.7% |
| 55 to 64 Years | 811 | 26.1% |
| 65 to 74 Years | 538 | 17.3% |
| 75 to 84 Years | 168 | 5.4% |
| 85 Years and Over | 42 | 1.3% |
| Total | 3,108 | 100.0% |
Housing Finances in Gallatin County
Median Income by Occupancy in Gallatin County
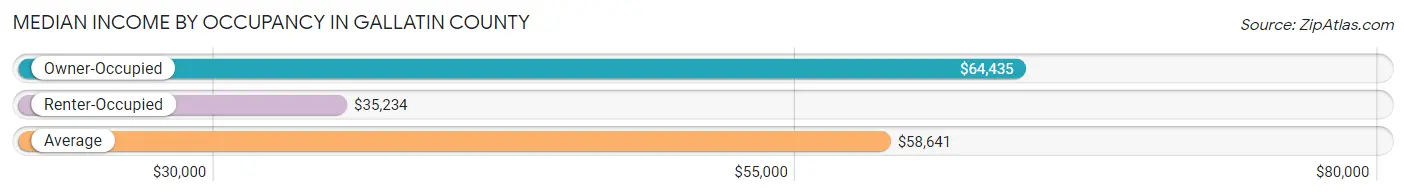
| Occupancy Type | # Households | Median Income |
| Owner-Occupied | 2,192 (70.5%) | $64,435 |
| Renter-Occupied | 916 (29.5%) | $35,234 |
| Average | 3,108 (100.0%) | $58,641 |
Occupancy by Householder Income Bracket in Gallatin County
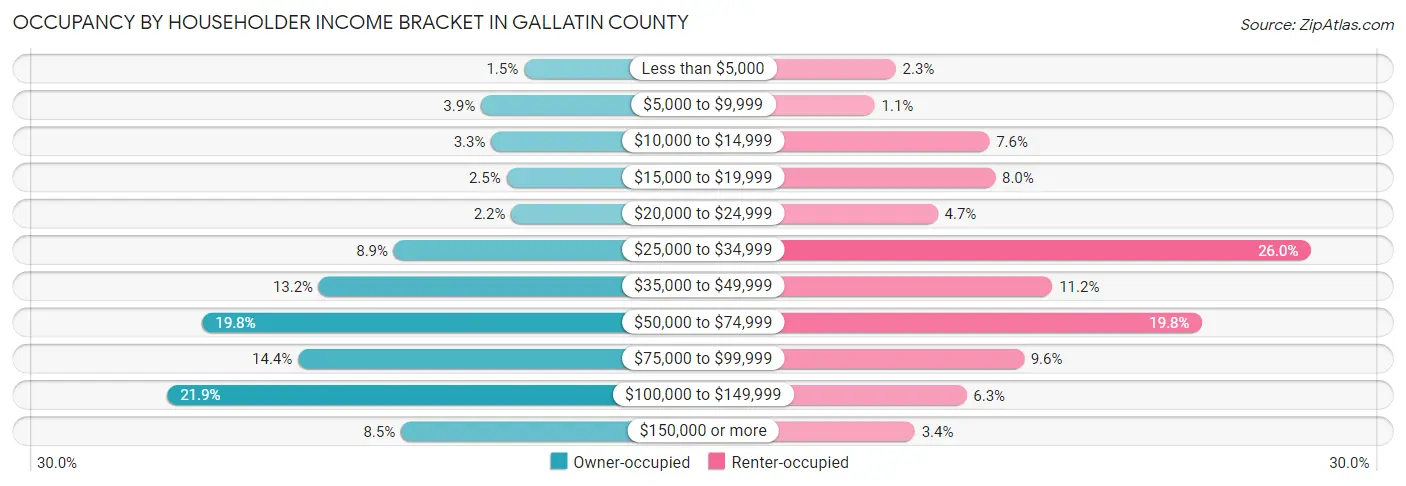
| Income Bracket | Owner-occupied | Renter-occupied |
| Less than $5,000 | 32 (1.5%) | 21 (2.3%) |
| $5,000 to $9,999 | 86 (3.9%) | 10 (1.1%) |
| $10,000 to $14,999 | 73 (3.3%) | 70 (7.6%) |
| $15,000 to $19,999 | 54 (2.5%) | 73 (8.0%) |
| $20,000 to $24,999 | 48 (2.2%) | 43 (4.7%) |
| $25,000 to $34,999 | 195 (8.9%) | 238 (26.0%) |
| $35,000 to $49,999 | 289 (13.2%) | 103 (11.2%) |
| $50,000 to $74,999 | 435 (19.8%) | 181 (19.8%) |
| $75,000 to $99,999 | 315 (14.4%) | 88 (9.6%) |
| $100,000 to $149,999 | 479 (21.8%) | 58 (6.3%) |
| $150,000 or more | 186 (8.5%) | 31 (3.4%) |
| Total | 2,192 (100.0%) | 916 (100.0%) |
Monthly Housing Cost Tiers in Gallatin County
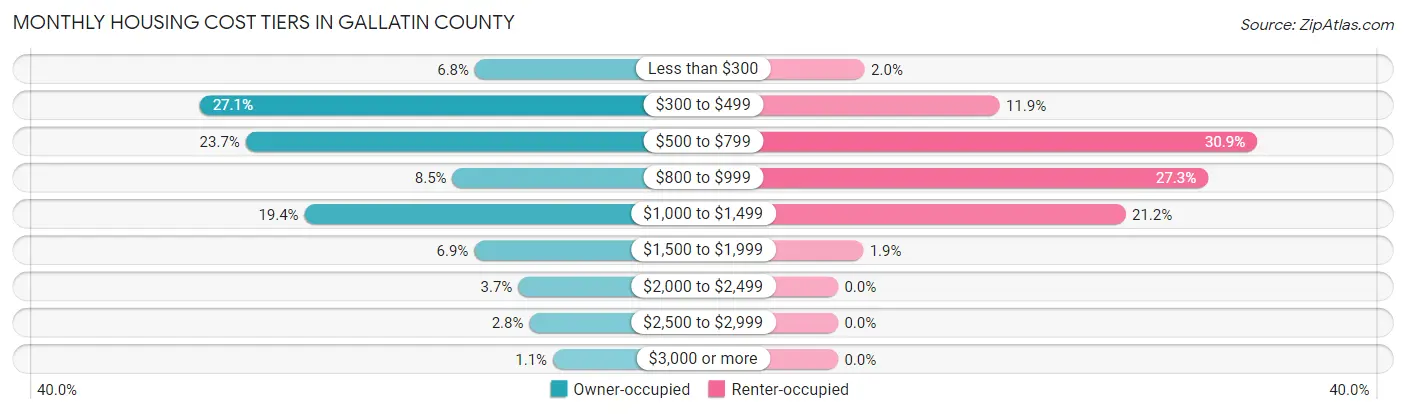
| Monthly Cost | Owner-occupied | Renter-occupied |
| Less than $300 | 150 (6.8%) | 18 (2.0%) |
| $300 to $499 | 594 (27.1%) | 109 (11.9%) |
| $500 to $799 | 520 (23.7%) | 283 (30.9%) |
| $800 to $999 | 186 (8.5%) | 250 (27.3%) |
| $1,000 to $1,499 | 425 (19.4%) | 194 (21.2%) |
| $1,500 to $1,999 | 151 (6.9%) | 17 (1.9%) |
| $2,000 to $2,499 | 80 (3.6%) | 0 (0.0%) |
| $2,500 to $2,999 | 62 (2.8%) | 0 (0.0%) |
| $3,000 or more | 24 (1.1%) | 0 (0.0%) |
| Total | 2,192 (100.0%) | 916 (100.0%) |
Physical Housing Characteristics in Gallatin County
Housing Structures in Gallatin County
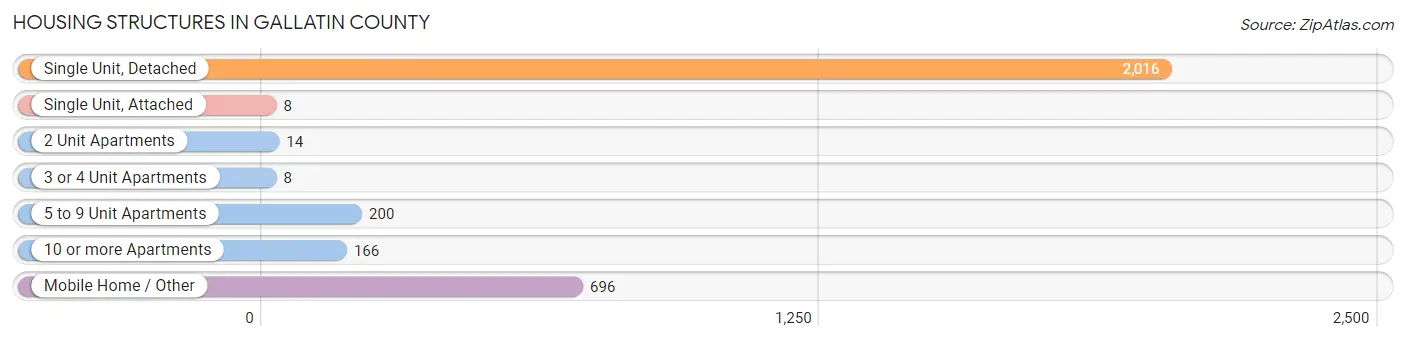
| Structure Type | # Housing Units | % Housing Units |
| Single Unit, Detached | 2,016 | 64.9% |
| Single Unit, Attached | 8 | 0.3% |
| 2 Unit Apartments | 14 | 0.4% |
| 3 or 4 Unit Apartments | 8 | 0.3% |
| 5 to 9 Unit Apartments | 200 | 6.4% |
| 10 or more Apartments | 166 | 5.3% |
| Mobile Home / Other | 696 | 22.4% |
| Total | 3,108 | 100.0% |
Housing Structures by Occupancy in Gallatin County
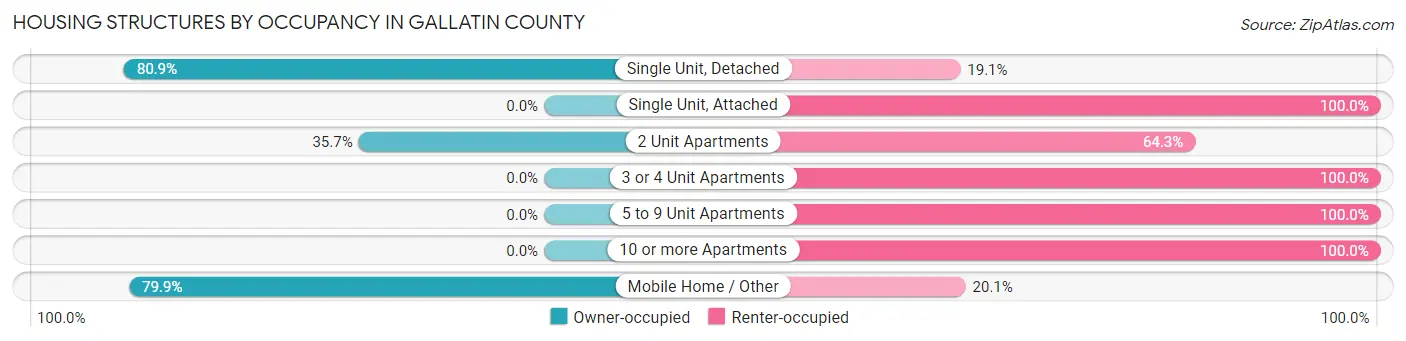
| Structure Type | Owner-occupied | Renter-occupied |
| Single Unit, Detached | 1,631 (80.9%) | 385 (19.1%) |
| Single Unit, Attached | 0 (0.0%) | 8 (100.0%) |
| 2 Unit Apartments | 5 (35.7%) | 9 (64.3%) |
| 3 or 4 Unit Apartments | 0 (0.0%) | 8 (100.0%) |
| 5 to 9 Unit Apartments | 0 (0.0%) | 200 (100.0%) |
| 10 or more Apartments | 0 (0.0%) | 166 (100.0%) |
| Mobile Home / Other | 556 (79.9%) | 140 (20.1%) |
| Total | 2,192 (70.5%) | 916 (29.5%) |
Housing Structures by Number of Rooms in Gallatin County
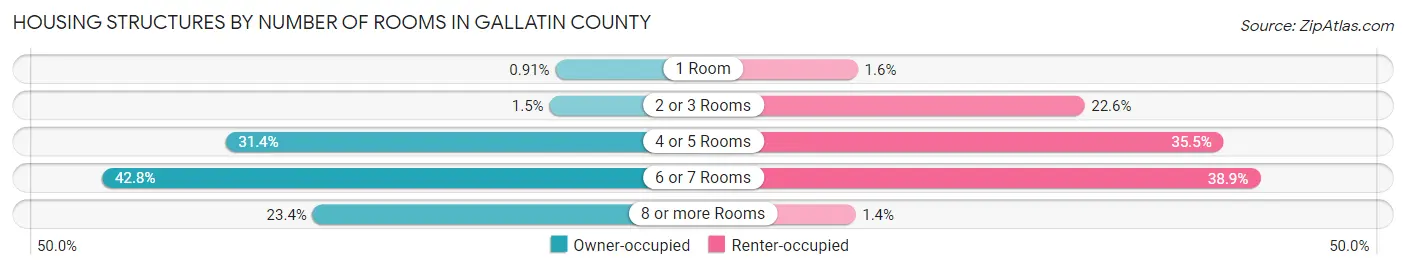
| Number of Rooms | Owner-occupied | Renter-occupied |
| 1 Room | 20 (0.9%) | 15 (1.6%) |
| 2 or 3 Rooms | 32 (1.5%) | 207 (22.6%) |
| 4 or 5 Rooms | 689 (31.4%) | 325 (35.5%) |
| 6 or 7 Rooms | 939 (42.8%) | 356 (38.9%) |
| 8 or more Rooms | 512 (23.4%) | 13 (1.4%) |
| Total | 2,192 (100.0%) | 916 (100.0%) |
Housing Structure by Heating Type in Gallatin County
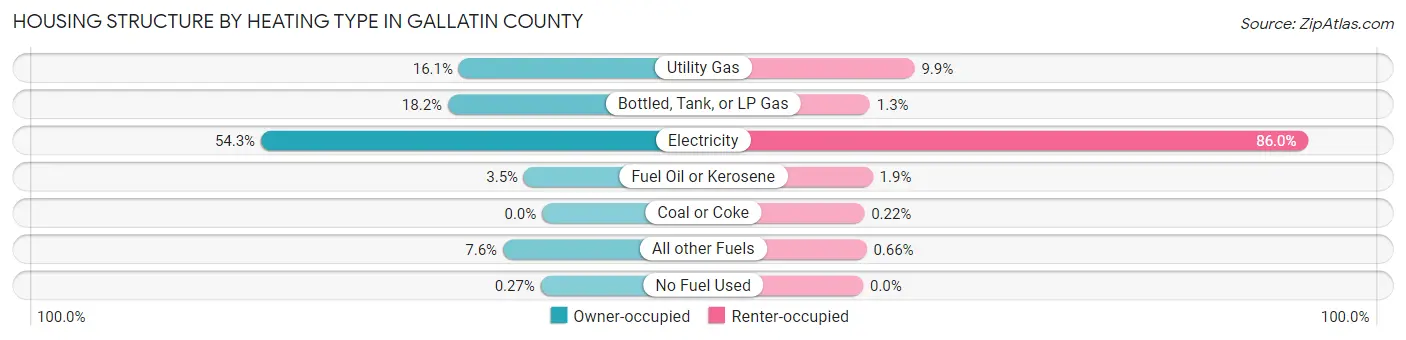
| Heating Type | Owner-occupied | Renter-occupied |
| Utility Gas | 353 (16.1%) | 91 (9.9%) |
| Bottled, Tank, or LP Gas | 399 (18.2%) | 12 (1.3%) |
| Electricity | 1,191 (54.3%) | 788 (86.0%) |
| Fuel Oil or Kerosene | 77 (3.5%) | 17 (1.9%) |
| Coal or Coke | 0 (0.0%) | 2 (0.2%) |
| All other Fuels | 166 (7.6%) | 6 (0.7%) |
| No Fuel Used | 6 (0.3%) | 0 (0.0%) |
| Total | 2,192 (100.0%) | 916 (100.0%) |
Household Vehicle Usage in Gallatin County
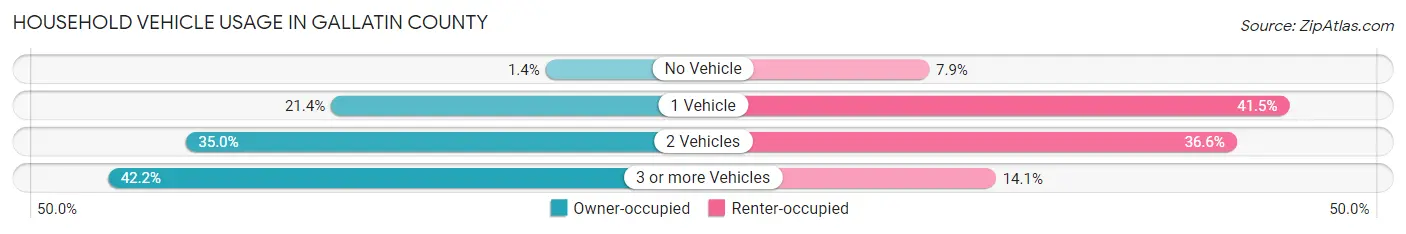
| Vehicles per Household | Owner-occupied | Renter-occupied |
| No Vehicle | 30 (1.4%) | 72 (7.9%) |
| 1 Vehicle | 469 (21.4%) | 380 (41.5%) |
| 2 Vehicles | 767 (35.0%) | 335 (36.6%) |
| 3 or more Vehicles | 926 (42.2%) | 129 (14.1%) |
| Total | 2,192 (100.0%) | 916 (100.0%) |
Real Estate & Mortgages in Gallatin County
Real Estate and Mortgage Overview in Gallatin County
| Characteristic | Without Mortgage | With Mortgage |
| Housing Units | 1,188 | 1,004 |
| Median Property Value | $145,300 | $166,300 |
| Median Household Income | $60,556 | $99 |
| Monthly Housing Costs | $457 | $24 |
| Real Estate Taxes | $1,233 | $0 |
Property Value by Mortgage Status in Gallatin County
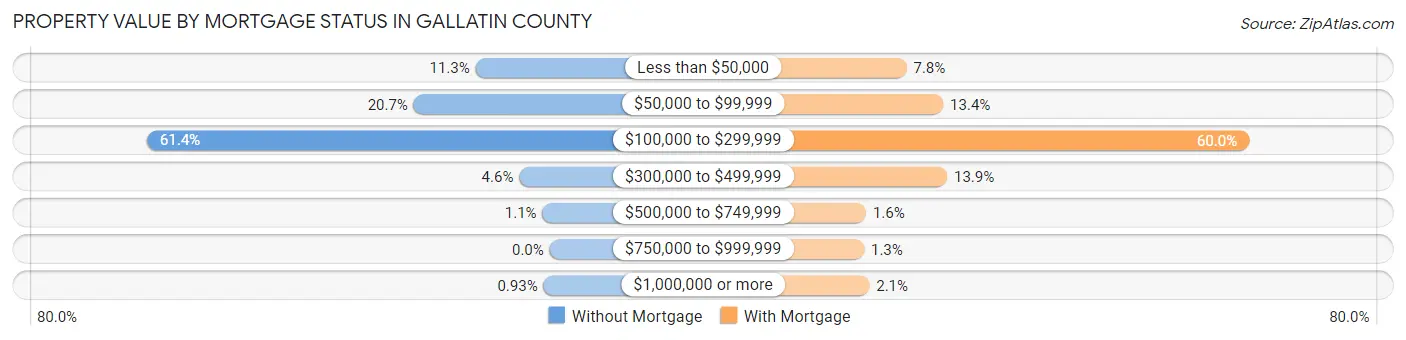
| Property Value | Without Mortgage | With Mortgage |
| Less than $50,000 | 134 (11.3%) | 78 (7.8%) |
| $50,000 to $99,999 | 246 (20.7%) | 134 (13.4%) |
| $100,000 to $299,999 | 729 (61.4%) | 602 (60.0%) |
| $300,000 to $499,999 | 55 (4.6%) | 140 (13.9%) |
| $500,000 to $749,999 | 13 (1.1%) | 16 (1.6%) |
| $750,000 to $999,999 | 0 (0.0%) | 13 (1.3%) |
| $1,000,000 or more | 11 (0.9%) | 21 (2.1%) |
| Total | 1,188 (100.0%) | 1,004 (100.0%) |
Household Income by Mortgage Status in Gallatin County
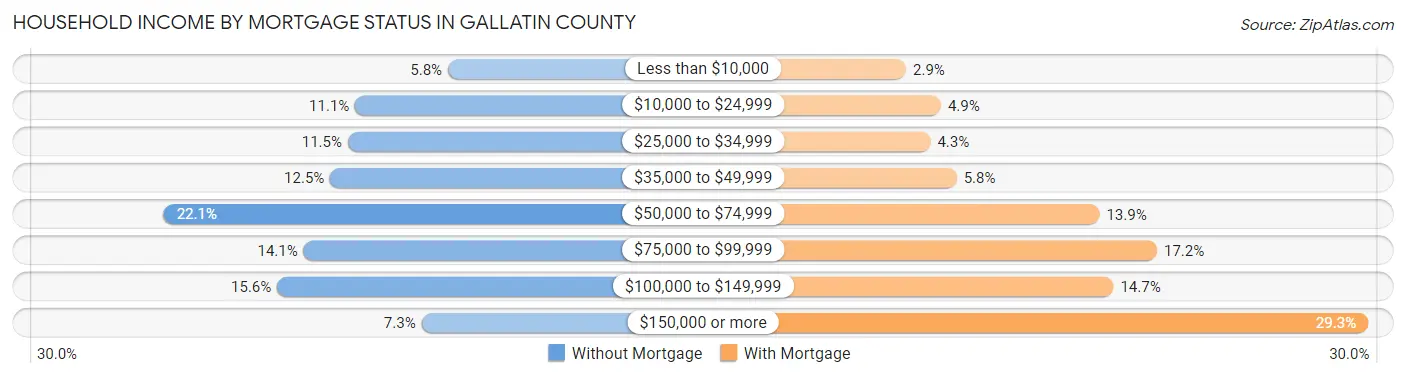
| Household Income | Without Mortgage | With Mortgage |
| Less than $10,000 | 69 (5.8%) | 29 (2.9%) |
| $10,000 to $24,999 | 132 (11.1%) | 49 (4.9%) |
| $25,000 to $34,999 | 137 (11.5%) | 43 (4.3%) |
| $35,000 to $49,999 | 149 (12.5%) | 58 (5.8%) |
| $50,000 to $74,999 | 262 (22.1%) | 140 (13.9%) |
| $75,000 to $99,999 | 167 (14.1%) | 173 (17.2%) |
| $100,000 to $149,999 | 185 (15.6%) | 148 (14.7%) |
| $150,000 or more | 87 (7.3%) | 294 (29.3%) |
| Total | 1,188 (100.0%) | 1,004 (100.0%) |
Property Value to Household Income Ratio in Gallatin County
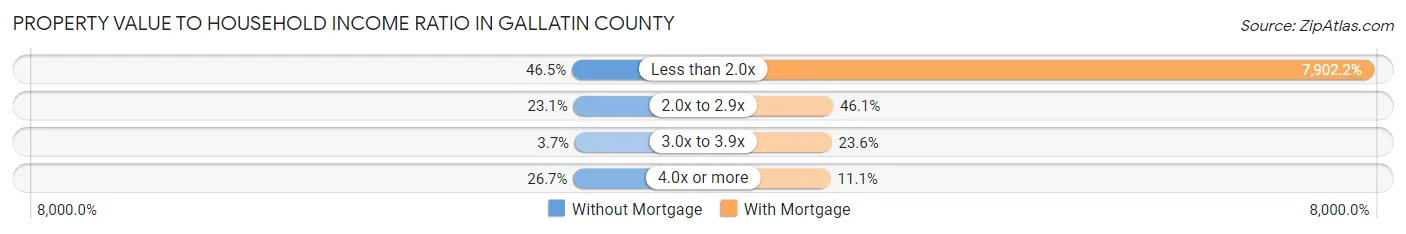
| Value-to-Income Ratio | Without Mortgage | With Mortgage |
| Less than 2.0x | 552 (46.5%) | 79,338 (7,902.2%) |
| 2.0x to 2.9x | 274 (23.1%) | 463 (46.1%) |
| 3.0x to 3.9x | 44 (3.7%) | 237 (23.6%) |
| 4.0x or more | 317 (26.7%) | 111 (11.1%) |
| Total | 1,188 (100.0%) | 1,004 (100.0%) |
Real Estate Taxes by Mortgage Status in Gallatin County
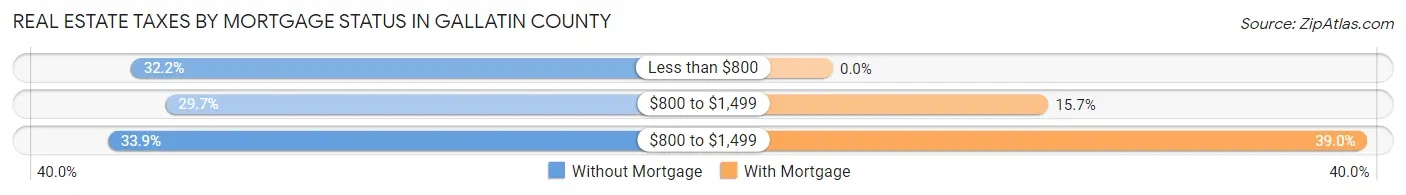
| Property Taxes | Without Mortgage | With Mortgage |
| Less than $800 | 383 (32.2%) | 0 (0.0%) |
| $800 to $1,499 | 353 (29.7%) | 158 (15.7%) |
| $800 to $1,499 | 403 (33.9%) | 392 (39.0%) |
| Total | 1,188 (100.0%) | 1,004 (100.0%) |
Health & Disability in Gallatin County
Health Insurance Coverage by Age in Gallatin County
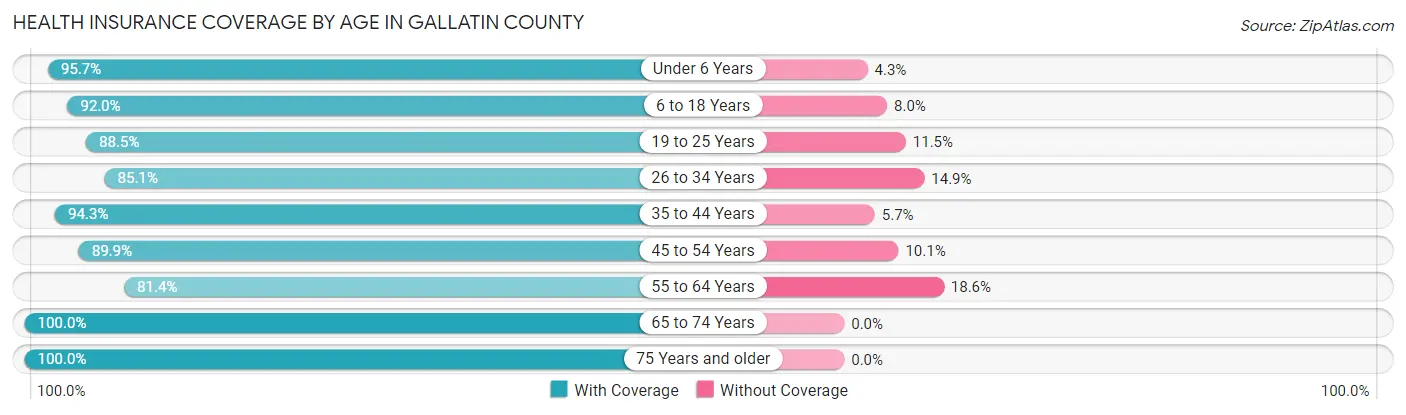
| Age Bracket | With Coverage | Without Coverage |
| Under 6 Years | 617 (95.7%) | 28 (4.3%) |
| 6 to 18 Years | 1,327 (92.0%) | 115 (8.0%) |
| 19 to 25 Years | 740 (88.5%) | 96 (11.5%) |
| 26 to 34 Years | 906 (85.1%) | 159 (14.9%) |
| 35 to 44 Years | 961 (94.3%) | 58 (5.7%) |
| 45 to 54 Years | 1,023 (89.9%) | 115 (10.1%) |
| 55 to 64 Years | 1,114 (81.4%) | 254 (18.6%) |
| 65 to 74 Years | 776 (100.0%) | 0 (0.0%) |
| 75 Years and older | 370 (100.0%) | 0 (0.0%) |
| Total | 7,834 (90.5%) | 825 (9.5%) |
Health Insurance Coverage by Citizenship Status in Gallatin County
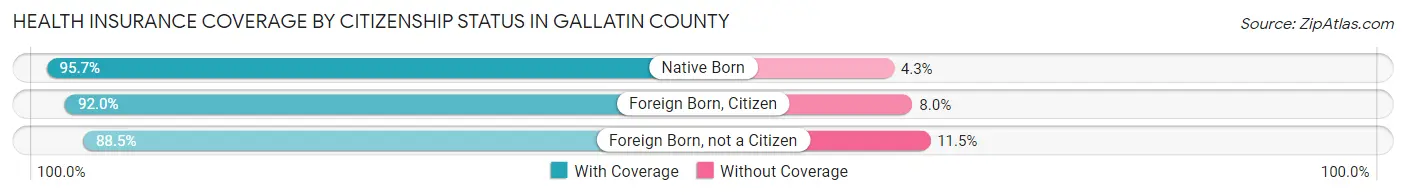
| Citizenship Status | With Coverage | Without Coverage |
| Native Born | 617 (95.7%) | 28 (4.3%) |
| Foreign Born, Citizen | 1,327 (92.0%) | 115 (8.0%) |
| Foreign Born, not a Citizen | 740 (88.5%) | 96 (11.5%) |
Health Insurance Coverage by Household Income in Gallatin County
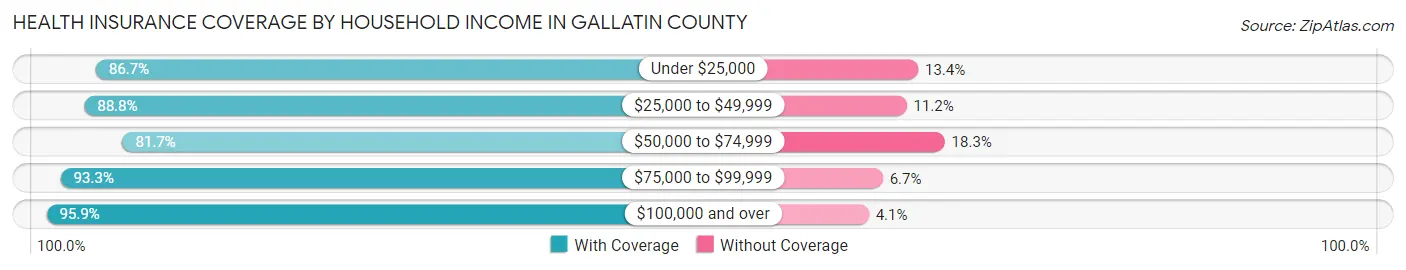
| Household Income | With Coverage | Without Coverage |
| Under $25,000 | 915 (86.7%) | 141 (13.4%) |
| $25,000 to $49,999 | 1,754 (88.8%) | 221 (11.2%) |
| $50,000 to $74,999 | 1,144 (81.7%) | 257 (18.3%) |
| $75,000 to $99,999 | 1,288 (93.3%) | 93 (6.7%) |
| $100,000 and over | 2,641 (95.9%) | 113 (4.1%) |
Public vs Private Health Insurance Coverage by Age in Gallatin County
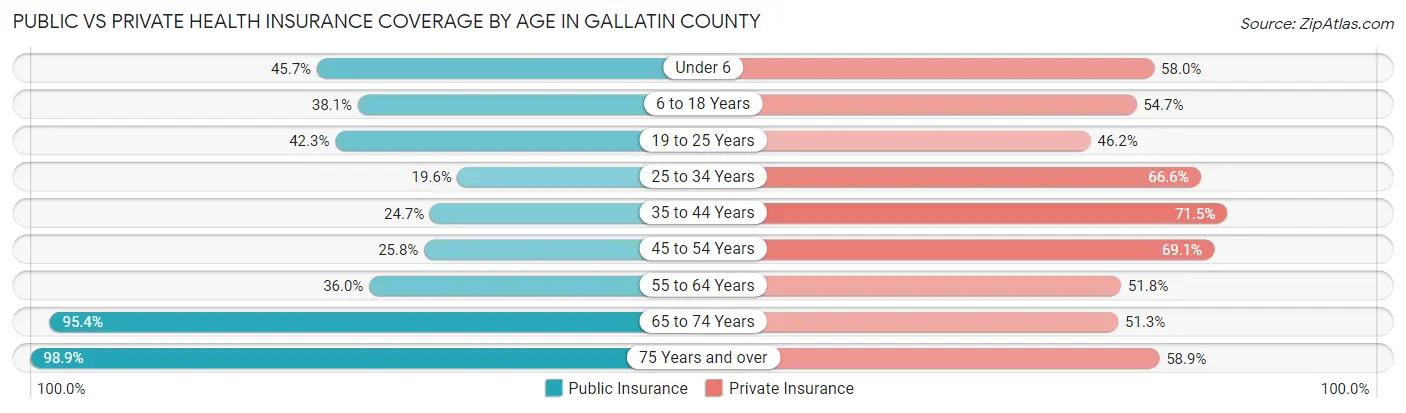
| Age Bracket | Public Insurance | Private Insurance |
| Under 6 | 295 (45.7%) | 374 (58.0%) |
| 6 to 18 Years | 550 (38.1%) | 788 (54.6%) |
| 19 to 25 Years | 354 (42.3%) | 386 (46.2%) |
| 25 to 34 Years | 209 (19.6%) | 709 (66.6%) |
| 35 to 44 Years | 252 (24.7%) | 729 (71.5%) |
| 45 to 54 Years | 294 (25.8%) | 786 (69.1%) |
| 55 to 64 Years | 493 (36.0%) | 709 (51.8%) |
| 65 to 74 Years | 740 (95.4%) | 398 (51.3%) |
| 75 Years and over | 366 (98.9%) | 218 (58.9%) |
| Total | 3,553 (41.0%) | 5,097 (58.9%) |
Disability Status by Sex by Age in Gallatin County
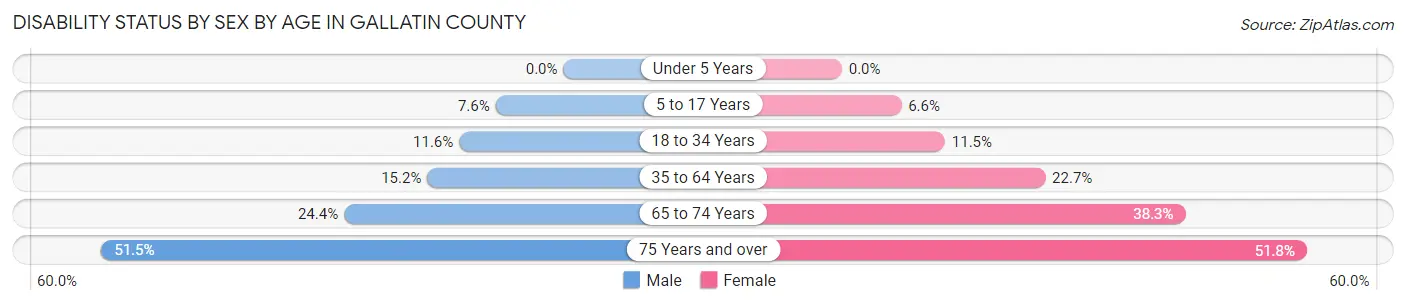
| Age Bracket | Male | Female |
| Under 5 Years | 0 (0.0%) | 0 (0.0%) |
| 5 to 17 Years | 59 (7.5%) | 47 (6.6%) |
| 18 to 34 Years | 131 (11.6%) | 103 (11.5%) |
| 35 to 64 Years | 262 (15.2%) | 407 (22.7%) |
| 65 to 74 Years | 97 (24.4%) | 145 (38.3%) |
| 75 Years and over | 89 (51.4%) | 102 (51.8%) |
Disability Class by Sex by Age in Gallatin County
Disability Class: Hearing Difficulty
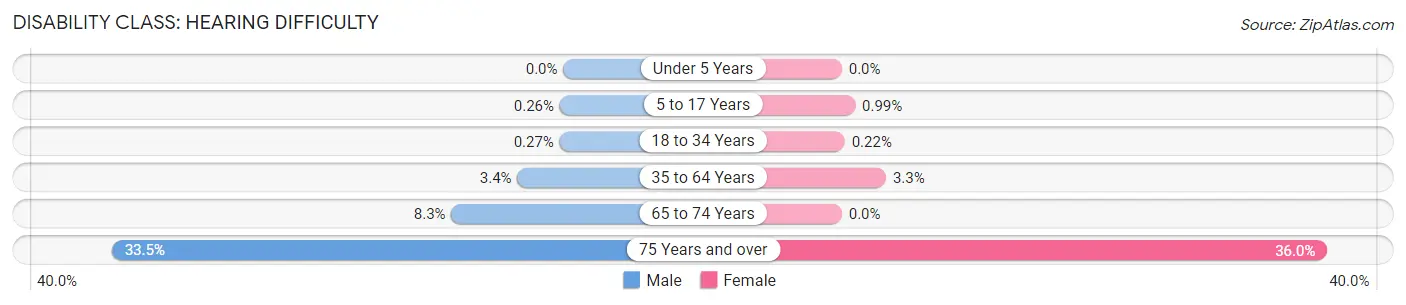
| Age Bracket | Male | Female |
| Under 5 Years | 0 (0.0%) | 0 (0.0%) |
| 5 to 17 Years | 2 (0.3%) | 7 (1.0%) |
| 18 to 34 Years | 3 (0.3%) | 2 (0.2%) |
| 35 to 64 Years | 59 (3.4%) | 59 (3.3%) |
| 65 to 74 Years | 33 (8.3%) | 0 (0.0%) |
| 75 Years and over | 58 (33.5%) | 71 (36.0%) |
Disability Class: Vision Difficulty
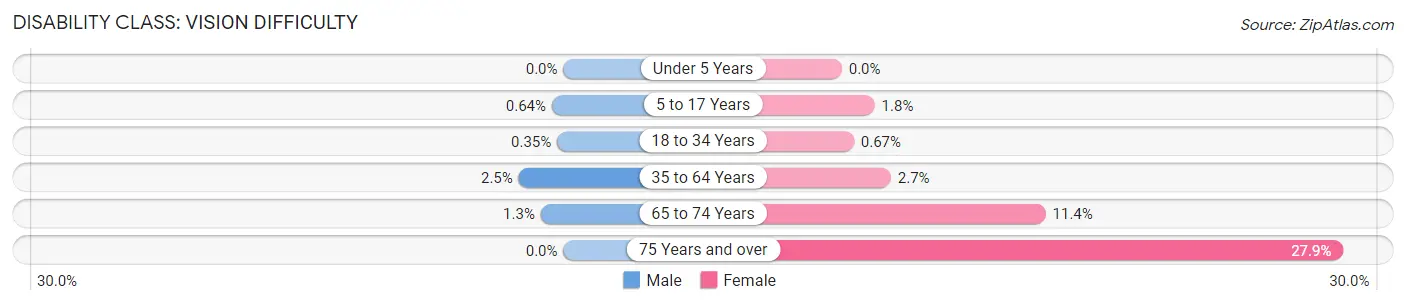
| Age Bracket | Male | Female |
| Under 5 Years | 0 (0.0%) | 0 (0.0%) |
| 5 to 17 Years | 5 (0.6%) | 13 (1.8%) |
| 18 to 34 Years | 4 (0.4%) | 6 (0.7%) |
| 35 to 64 Years | 43 (2.5%) | 49 (2.7%) |
| 65 to 74 Years | 5 (1.3%) | 43 (11.4%) |
| 75 Years and over | 0 (0.0%) | 55 (27.9%) |
Disability Class: Cognitive Difficulty
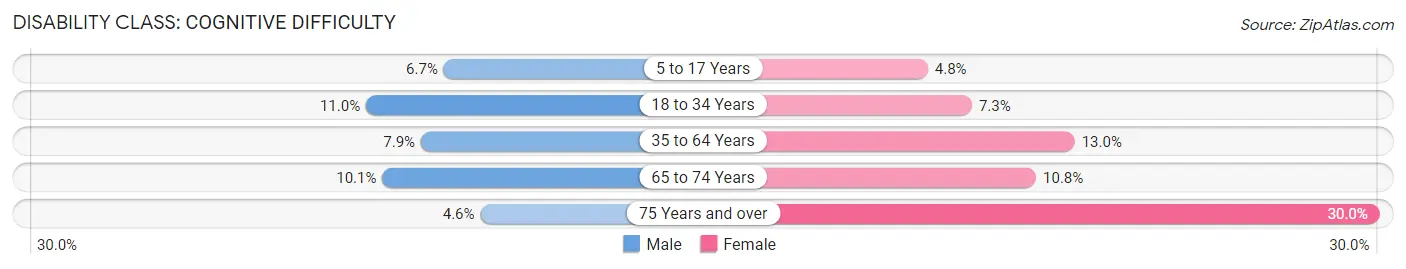
| Age Bracket | Male | Female |
| 5 to 17 Years | 52 (6.7%) | 34 (4.8%) |
| 18 to 34 Years | 124 (11.0%) | 65 (7.2%) |
| 35 to 64 Years | 137 (7.9%) | 233 (13.0%) |
| 65 to 74 Years | 40 (10.1%) | 41 (10.8%) |
| 75 Years and over | 8 (4.6%) | 59 (29.9%) |
Disability Class: Ambulatory Difficulty
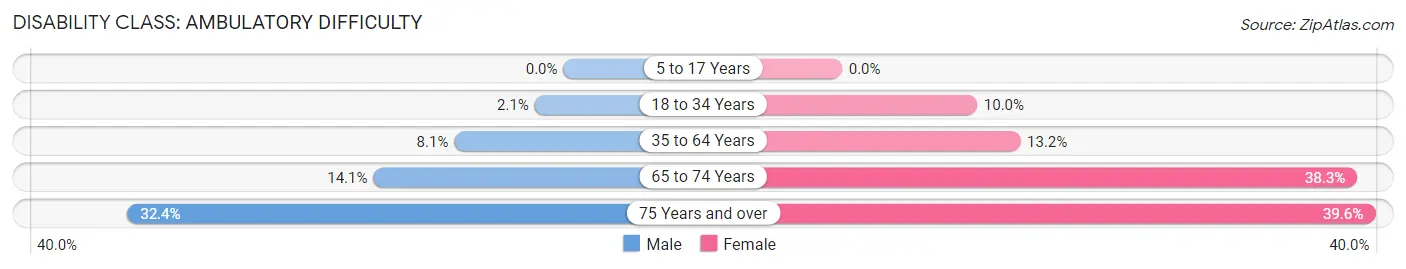
| Age Bracket | Male | Female |
| 5 to 17 Years | 0 (0.0%) | 0 (0.0%) |
| 18 to 34 Years | 24 (2.1%) | 90 (10.0%) |
| 35 to 64 Years | 140 (8.1%) | 238 (13.2%) |
| 65 to 74 Years | 56 (14.1%) | 145 (38.3%) |
| 75 Years and over | 56 (32.4%) | 78 (39.6%) |
Disability Class: Self-Care Difficulty
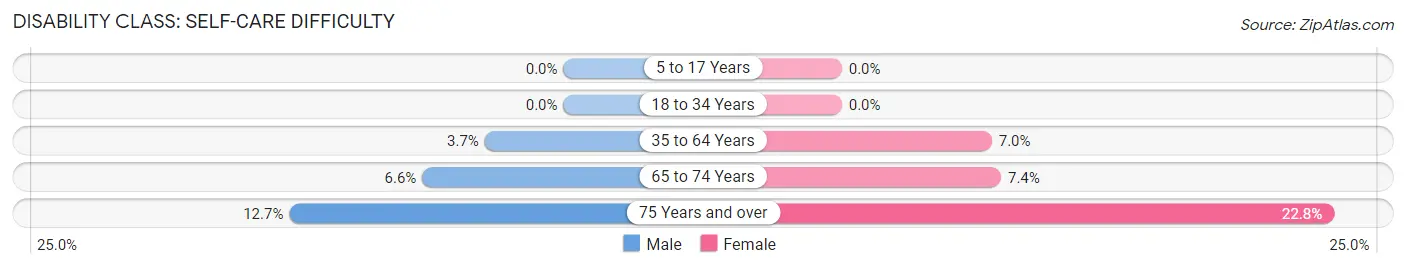
| Age Bracket | Male | Female |
| 5 to 17 Years | 0 (0.0%) | 0 (0.0%) |
| 18 to 34 Years | 0 (0.0%) | 0 (0.0%) |
| 35 to 64 Years | 63 (3.6%) | 125 (7.0%) |
| 65 to 74 Years | 26 (6.6%) | 28 (7.4%) |
| 75 Years and over | 22 (12.7%) | 45 (22.8%) |
Technology Access in Gallatin County
Computing Device Access in Gallatin County
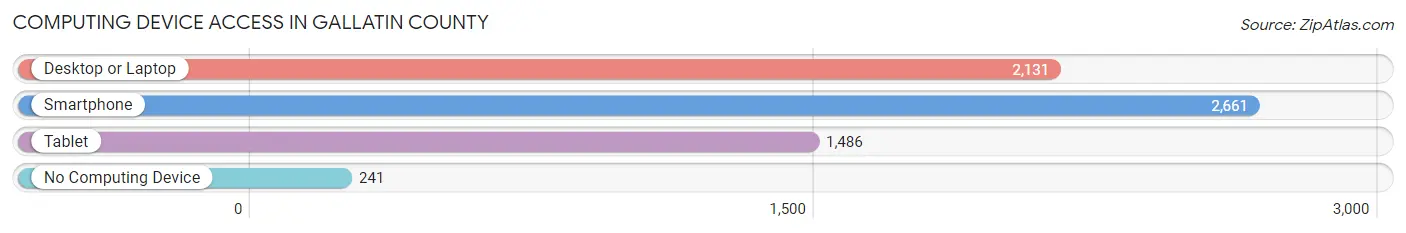
| Device Type | # Households | % Households |
| Desktop or Laptop | 2,131 | 68.6% |
| Smartphone | 2,661 | 85.6% |
| Tablet | 1,486 | 47.8% |
| No Computing Device | 241 | 7.7% |
| Total | 3,108 | 100.0% |
Internet Access in Gallatin County
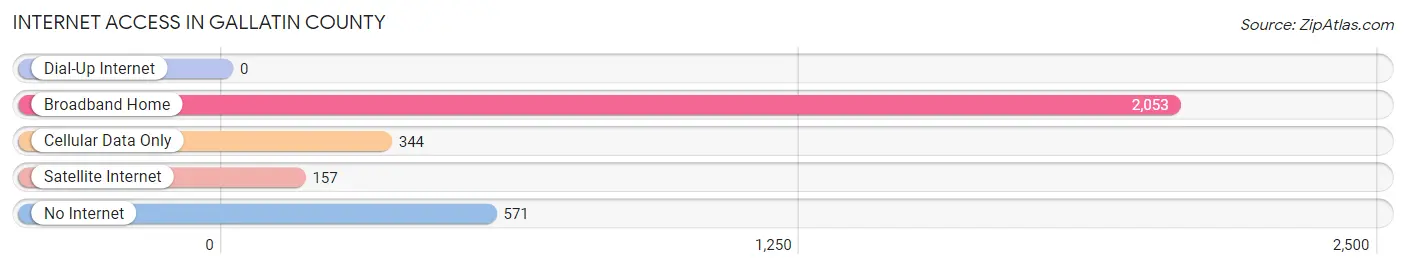
| Internet Type | # Households | % Households |
| Dial-Up Internet | 0 | 0.0% |
| Broadband Home | 2,053 | 66.1% |
| Cellular Data Only | 344 | 11.1% |
| Satellite Internet | 157 | 5.1% |
| No Internet | 571 | 18.4% |
| Total | 3,108 | 100.0% |
Gallatin County Summary
History
The area now known as Gallatin County, Kentucky was first settled by Native Americans in the late 1700s. The first European settlers arrived in the area in the early 1800s, and the county was officially established in 1803. The county was named after Albert Gallatin, the Secretary of the Treasury under President Thomas Jefferson.
Gallatin County was originally part of Franklin County, and the first county seat was located in the town of Warsaw. In 1809, the county seat was moved to Sparta, which is still the county seat today.
The county was largely agricultural in the early years, with tobacco, corn, and wheat being the main crops. The county also had a thriving timber industry, with many sawmills located along the banks of the Ohio River.
In the late 1800s, the county began to experience a period of industrialization. The Louisville and Nashville Railroad was built through the county, and several coal mines were opened. The county also had a number of brickyards and other manufacturing businesses.
Geography
Gallatin County is located in northern Kentucky, and is bordered by the Ohio River to the north and the Kentucky River to the south. The county covers an area of approximately 437 square miles, and is home to a number of small towns and villages. The county seat is Sparta, which is located in the center of the county.
The terrain of Gallatin County is mostly flat, with some rolling hills in the western part of the county. The county is home to several small lakes and streams, as well as the Ohio and Kentucky Rivers.
Economy
The economy of Gallatin County is largely based on agriculture and manufacturing. The county is home to a number of small farms, which produce a variety of crops including corn, wheat, soybeans, and tobacco. The county also has a number of manufacturing businesses, including a number of brickyards and other industrial businesses.
The county is also home to a number of tourist attractions, including the Kentucky Speedway and the Kentucky Horse Park. The county is also home to a number of wineries and distilleries, which attract visitors from all over the state.
Demographics
As of the 2010 census, the population of Gallatin County was 8,589. The population is largely white (94.3%), with small percentages of African American (2.7%), Hispanic (1.2%), and Asian (0.7%) residents. The median household income in the county is $41,945, and the median home value is $117,400.
The largest city in the county is Warsaw, which has a population of 1,845. Other cities in the county include Sparta (population 1,717), Glencoe (population 1,068), and Ghent (population 890).
Conclusion
Gallatin County, Kentucky is a rural county located in northern Kentucky. The county has a long history, and was originally settled by Native Americans in the late 1700s. The county is largely agricultural, with a number of small farms producing a variety of crops. The county also has a number of manufacturing businesses, as well as a number of tourist attractions. The population of the county is largely white, with small percentages of African American, Hispanic, and Asian residents. The median household income in the county is $41,945, and the median home value is $117,400.
Common Questions
What is Per Capita Income in Gallatin County?
Per Capita income in Gallatin County is $27,398.
What is the Median Family Income in Gallatin County?
Median Family Income in Gallatin County is $64,229.
What is the Median Household income in Gallatin County?
Median Household Income in Gallatin County is $58,641.
What is Income or Wage Gap in Gallatin County?
Income or Wage Gap in Gallatin County is 34.4%.
Women in Gallatin County earn 65.6 cents for every dollar earned by a man.
What is Family Income Deficit in Gallatin County?
Family Income Deficit in Gallatin County is $11,295.
Families that are below poverty line in Gallatin County earn $11,295 less on average than the poverty threshold level.
What is Inequality or Gini Index in Gallatin County?
Inequality or Gini Index in Gallatin County is 0.41.
What is the Total Population of Gallatin County?
Total Population of Gallatin County is 8,720.
What is the Total Male Population of Gallatin County?
Total Male Population of Gallatin County is 4,514.
What is the Total Female Population of Gallatin County?
Total Female Population of Gallatin County is 4,206.
What is the Ratio of Males per 100 Females in Gallatin County?
There are 107.32 Males per 100 Females in Gallatin County.
What is the Ratio of Females per 100 Males in Gallatin County?
There are 93.18 Females per 100 Males in Gallatin County.
What is the Median Population Age in Gallatin County?
Median Population Age in Gallatin County is 38.7 Years.
What is the Average Family Size in Gallatin County
Average Family Size in Gallatin County is 3.3 People.
What is the Average Household Size in Gallatin County
Average Household Size in Gallatin County is 2.8 People.
How Large is the Labor Force in Gallatin County?
There are 4,104 People in the Labor Forcein in Gallatin County.
What is the Percentage of People in the Labor Force in Gallatin County?
58.7% of People are in the Labor Force in Gallatin County.
What is the Unemployment Rate in Gallatin County?
Unemployment Rate in Gallatin County is 3.7%.