Fulton County, KY Map & Demographics
Fulton County Map
Fulton County Overview
$19,960
PER CAPITA INCOME
$44,534
AVG FAMILY INCOME
$35,449
AVG HOUSEHOLD INCOME
20.8%
WAGE / INCOME GAP [ % ]
79.2¢/ $1
WAGE / INCOME GAP [ $ ]
$12,942
FAMILY INCOME DEFICIT
0.42
INEQUALITY / GINI INDEX
6,480
TOTAL POPULATION
3,359
MALE POPULATION
3,121
FEMALE POPULATION
107.63
MALES / 100 FEMALES
92.91
FEMALES / 100 MALES
39.2
MEDIAN AGE
3.3
AVG FAMILY SIZE
2.5
AVG HOUSEHOLD SIZE
2,352
LABOR FORCE [ PEOPLE ]
44.6%
PERCENT IN LABOR FORCE
5.6%
UNEMPLOYMENT RATE
Fulton County Area Codes
Income in Fulton County
Income Overview in Fulton County
Per Capita Income in Fulton County is $19,960, while median incomes of families and households are $44,534 and $35,449 respectively.
| Characteristic | Number | Measure |
| Per Capita Income | 6,480 | $19,960 |
| Median Family Income | 1,409 | $44,534 |
| Mean Family Income | 1,409 | $55,208 |
| Median Household Income | 2,378 | $35,449 |
| Mean Household Income | 2,378 | $46,463 |
| Income Deficit | 1,409 | $12,942 |
| Wage / Income Gap (%) | 6,480 | 20.83% |
| Wage / Income Gap ($) | 6,480 | 79.17¢ per $1 |
| Gini / Inequality Index | 6,480 | 0.42 |
Earnings by Sex in Fulton County
Average Earnings in Fulton County are $29,392, $31,186 for men and $24,691 for women, a difference of 20.8%.
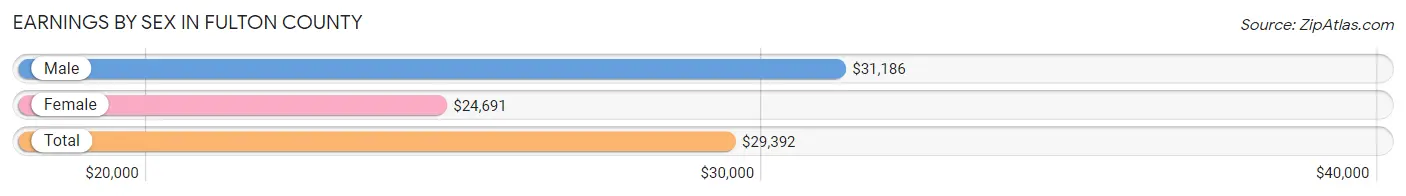
| Sex | Number | Average Earnings |
| Male | 1,374 (52.8%) | $31,186 |
| Female | 1,230 (47.2%) | $24,691 |
| Total | 2,604 (100.0%) | $29,392 |
Earnings by Sex by Income Bracket in Fulton County
The most common earnings brackets in Fulton County are $30,000 to $34,999 for men (216 | 15.7%) and $50,000 to $54,999 for women (159 | 12.9%).
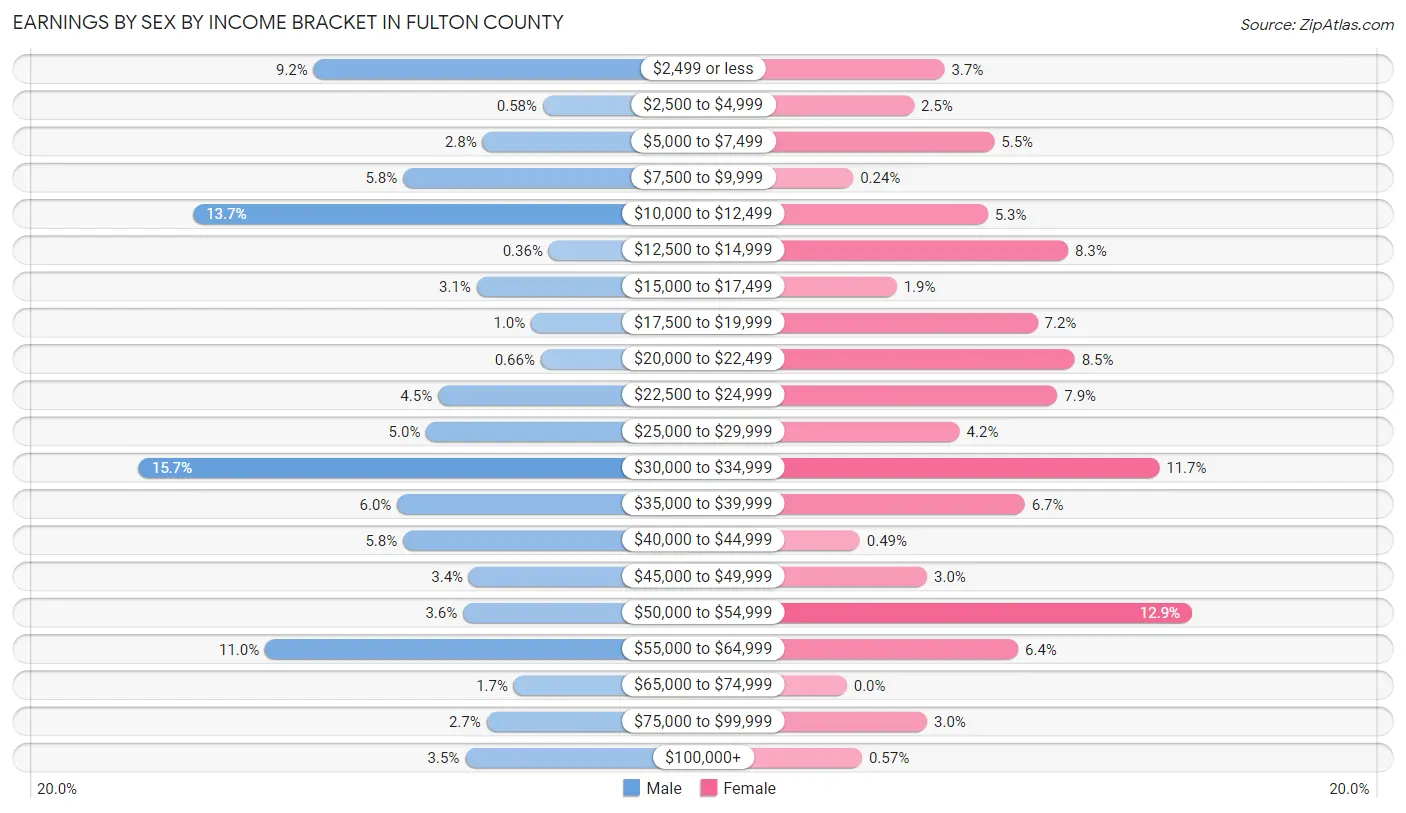
| Income | Male | Female |
| $2,499 or less | 126 (9.2%) | 45 (3.7%) |
| $2,500 to $4,999 | 8 (0.6%) | 31 (2.5%) |
| $5,000 to $7,499 | 39 (2.8%) | 68 (5.5%) |
| $7,500 to $9,999 | 80 (5.8%) | 3 (0.2%) |
| $10,000 to $12,499 | 188 (13.7%) | 65 (5.3%) |
| $12,500 to $14,999 | 5 (0.4%) | 102 (8.3%) |
| $15,000 to $17,499 | 42 (3.1%) | 23 (1.9%) |
| $17,500 to $19,999 | 14 (1.0%) | 88 (7.1%) |
| $20,000 to $22,499 | 9 (0.7%) | 105 (8.5%) |
| $22,500 to $24,999 | 62 (4.5%) | 97 (7.9%) |
| $25,000 to $29,999 | 68 (5.0%) | 52 (4.2%) |
| $30,000 to $34,999 | 216 (15.7%) | 144 (11.7%) |
| $35,000 to $39,999 | 83 (6.0%) | 82 (6.7%) |
| $40,000 to $44,999 | 80 (5.8%) | 6 (0.5%) |
| $45,000 to $49,999 | 46 (3.4%) | 37 (3.0%) |
| $50,000 to $54,999 | 49 (3.6%) | 159 (12.9%) |
| $55,000 to $64,999 | 151 (11.0%) | 79 (6.4%) |
| $65,000 to $74,999 | 23 (1.7%) | 0 (0.0%) |
| $75,000 to $99,999 | 37 (2.7%) | 37 (3.0%) |
| $100,000+ | 48 (3.5%) | 7 (0.6%) |
| Total | 1,374 (100.0%) | 1,230 (100.0%) |
Earnings by Sex by Educational Attainment in Fulton County
Average earnings in Fulton County are $33,310 for men and $24,716 for women, a difference of 25.8%. Men with an educational attainment of bachelor's degree enjoy the highest average annual earnings of $50,179, while those with less than high school education earn the least with $29,250. Women with an educational attainment of graduate degree earn the most with the average annual earnings of $50,260, while those with high school diploma education have the smallest earnings of $22,137.
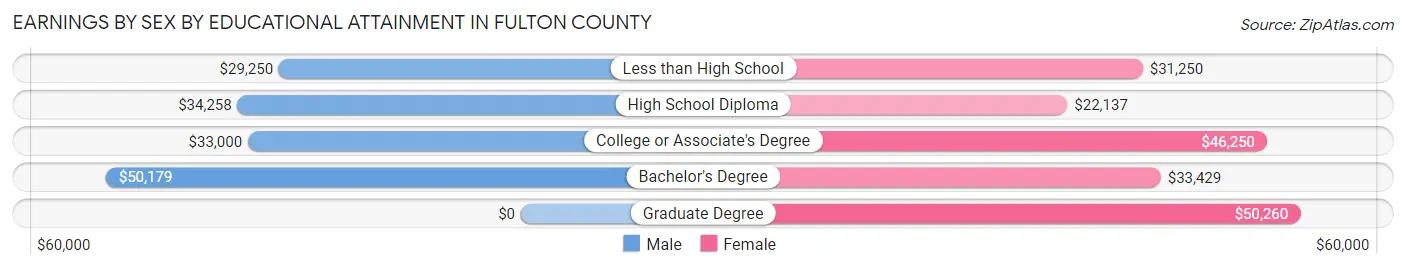
| Educational Attainment | Male Income | Female Income |
| Less than High School | $29,250 | $31,250 |
| High School Diploma | $34,258 | $22,137 |
| College or Associate's Degree | $33,000 | $46,250 |
| Bachelor's Degree | $50,179 | $33,429 |
| Graduate Degree | - | - |
| Total | $33,310 | $24,716 |
Family Income in Fulton County
Family Income Brackets in Fulton County
According to the Fulton County family income data, there are 310 families falling into the $50,000 to $74,999 income range, which is the most common income bracket and makes up 22.0% of all families. Conversely, the $200,000+ income bracket is the least frequent group with only 7 families (0.5%) belonging to this category.
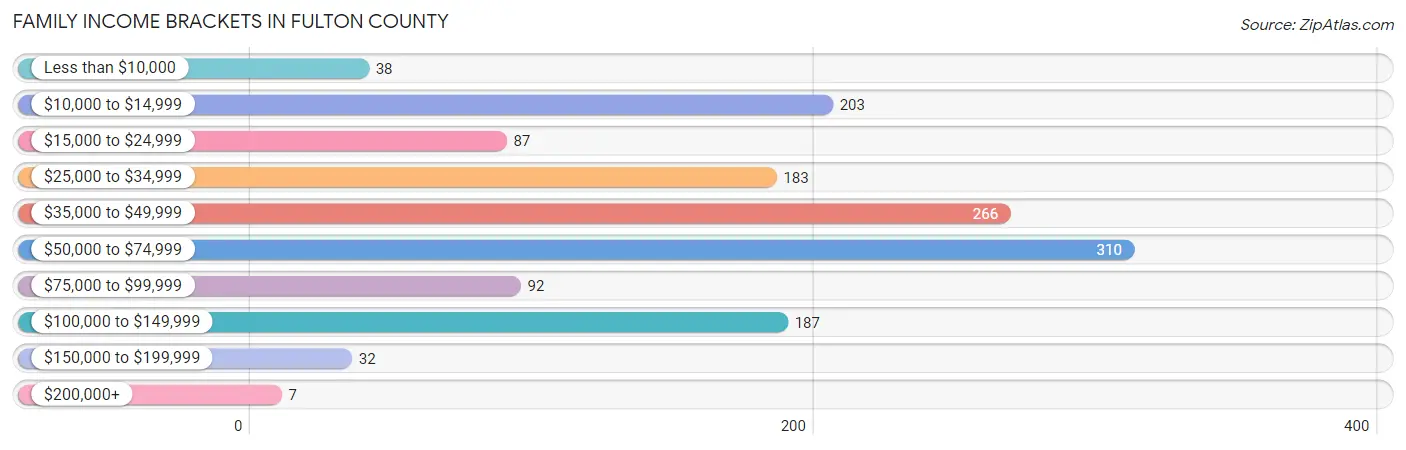
| Income Bracket | # Families | % Families |
| Less than $10,000 | 38 | 2.7% |
| $10,000 to $14,999 | 203 | 14.4% |
| $15,000 to $24,999 | 87 | 6.2% |
| $25,000 to $34,999 | 183 | 13.0% |
| $35,000 to $49,999 | 266 | 18.9% |
| $50,000 to $74,999 | 310 | 22.0% |
| $75,000 to $99,999 | 92 | 6.5% |
| $100,000 to $149,999 | 187 | 13.3% |
| $150,000 to $199,999 | 32 | 2.3% |
| $200,000+ | 7 | 0.5% |
Family Income by Famaliy Size in Fulton County
2-person families (861 | 61.1%) account for the highest median family income in Fulton County with $50,148 per family, while 2-person families (861 | 61.1%) have the highest median income of $25,074 per family member.
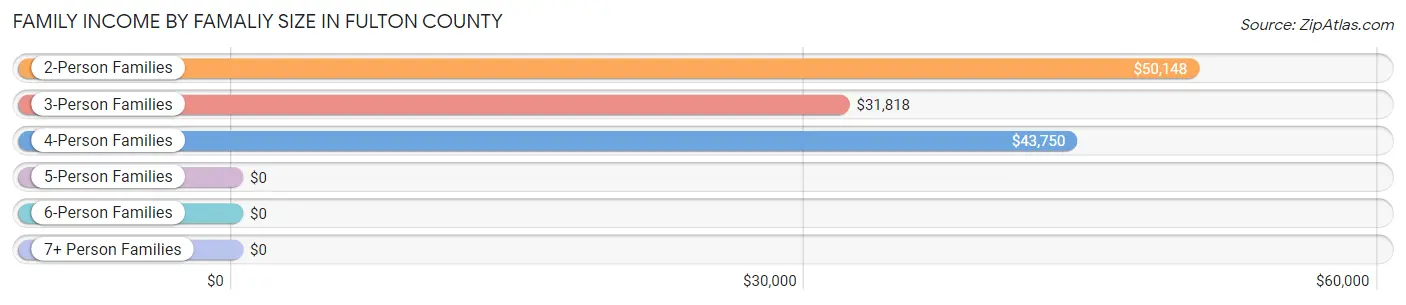
| Income Bracket | # Families | Median Income |
| 2-Person Families | 861 (61.1%) | $50,148 |
| 3-Person Families | 268 (19.0%) | $31,818 |
| 4-Person Families | 52 (3.7%) | $43,750 |
| 5-Person Families | 183 (13.0%) | $0 |
| 6-Person Families | 28 (2.0%) | $0 |
| 7+ Person Families | 17 (1.2%) | $0 |
| Total | 1,409 (100.0%) | $44,534 |
Family Income by Number of Earners in Fulton County
The median family income in Fulton County is $44,534, with families comprising 3+ earners (51) having the highest median family income of $152,417, while families with no earners (380) have the lowest median family income of $35,672, accounting for 3.6% and 27.0% of families, respectively.
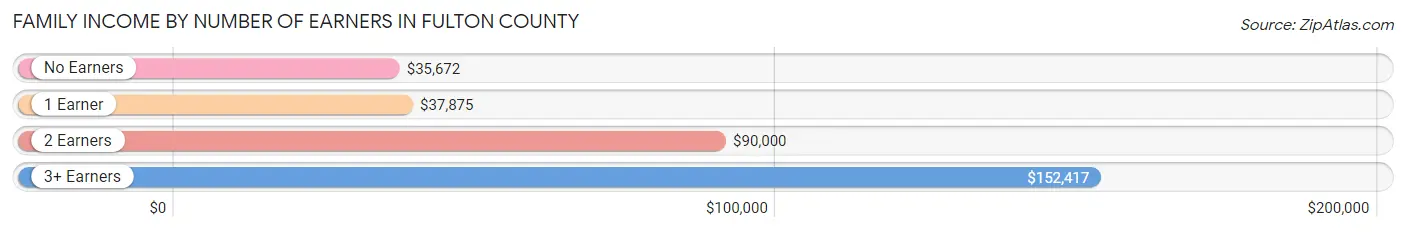
| Number of Earners | # Families | Median Income |
| No Earners | 380 (27.0%) | $35,672 |
| 1 Earner | 718 (51.0%) | $37,875 |
| 2 Earners | 260 (18.4%) | $90,000 |
| 3+ Earners | 51 (3.6%) | $152,417 |
| Total | 1,409 (100.0%) | $44,534 |
Household Income in Fulton County
Household Income Brackets in Fulton County
With 442 households falling in the category, the $25,000 to $34,999 income range is the most frequent in Fulton County, accounting for 18.6% of all households. In contrast, only 19 households (0.8%) fall into the $200,000+ income bracket, making it the least populous group.
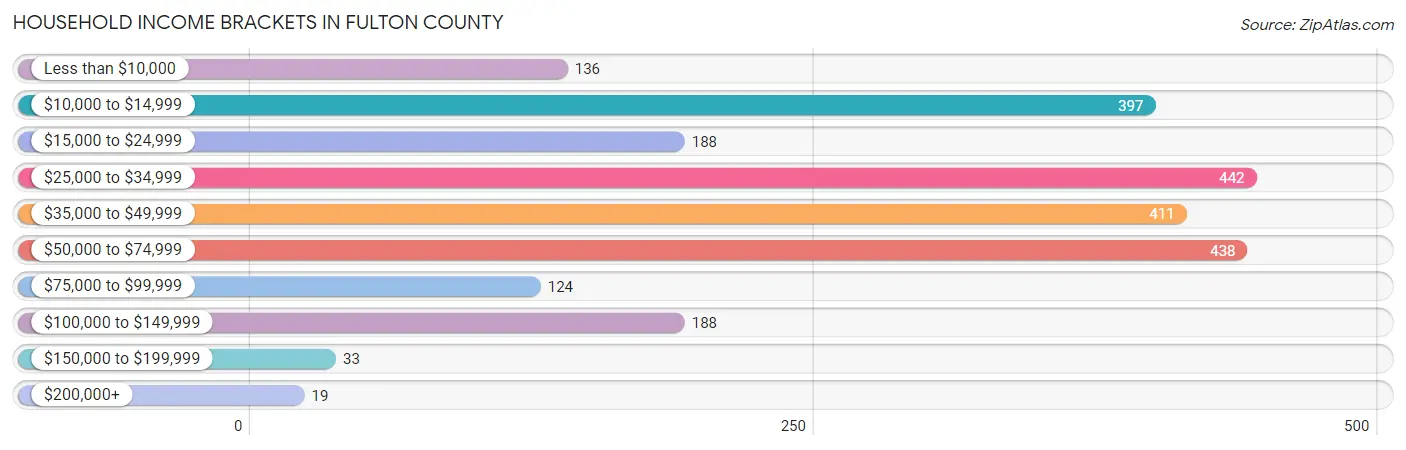
| Income Bracket | # Households | % Households |
| Less than $10,000 | 136 | 5.7% |
| $10,000 to $14,999 | 397 | 16.7% |
| $15,000 to $24,999 | 188 | 7.9% |
| $25,000 to $34,999 | 442 | 18.6% |
| $35,000 to $49,999 | 411 | 17.3% |
| $50,000 to $74,999 | 438 | 18.4% |
| $75,000 to $99,999 | 124 | 5.2% |
| $100,000 to $149,999 | 188 | 7.9% |
| $150,000 to $199,999 | 33 | 1.4% |
| $200,000+ | 19 | 0.8% |
Household Income by Householder Age in Fulton County
The median household income in Fulton County is $35,449, with the highest median household income of $36,875 found in the 65+ years age bracket for the primary householder. A total of 822 households (34.6%) fall into this category. Meanwhile, the 15 to 24 years age bracket for the primary householder has the lowest median household income of $0, with 78 households (3.3%) in this group.
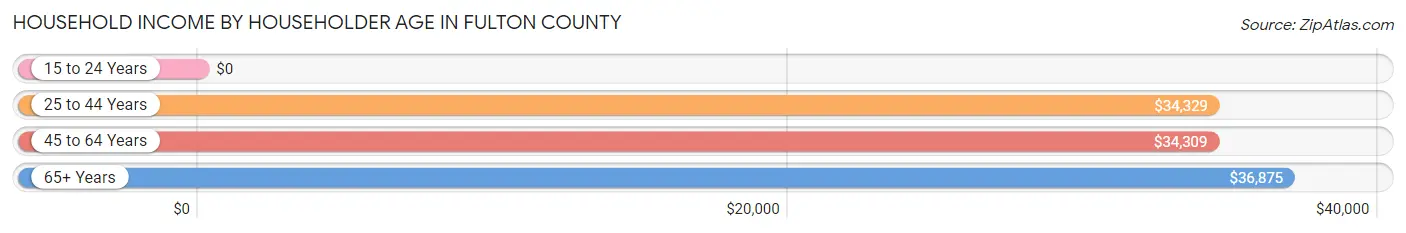
| Income Bracket | # Households | Median Income |
| 15 to 24 Years | 78 (3.3%) | $0 |
| 25 to 44 Years | 686 (28.8%) | $34,329 |
| 45 to 64 Years | 792 (33.3%) | $34,309 |
| 65+ Years | 822 (34.6%) | $36,875 |
| Total | 2,378 (100.0%) | $35,449 |
Poverty in Fulton County
Income Below Poverty by Sex and Age in Fulton County
With 28.3% poverty level for males and 26.5% for females among the residents of Fulton County, 5 year old males and 15 year old females are the most vulnerable to poverty, with 17 males (58.6%) and 13 females (65.0%) in their respective age groups living below the poverty level.
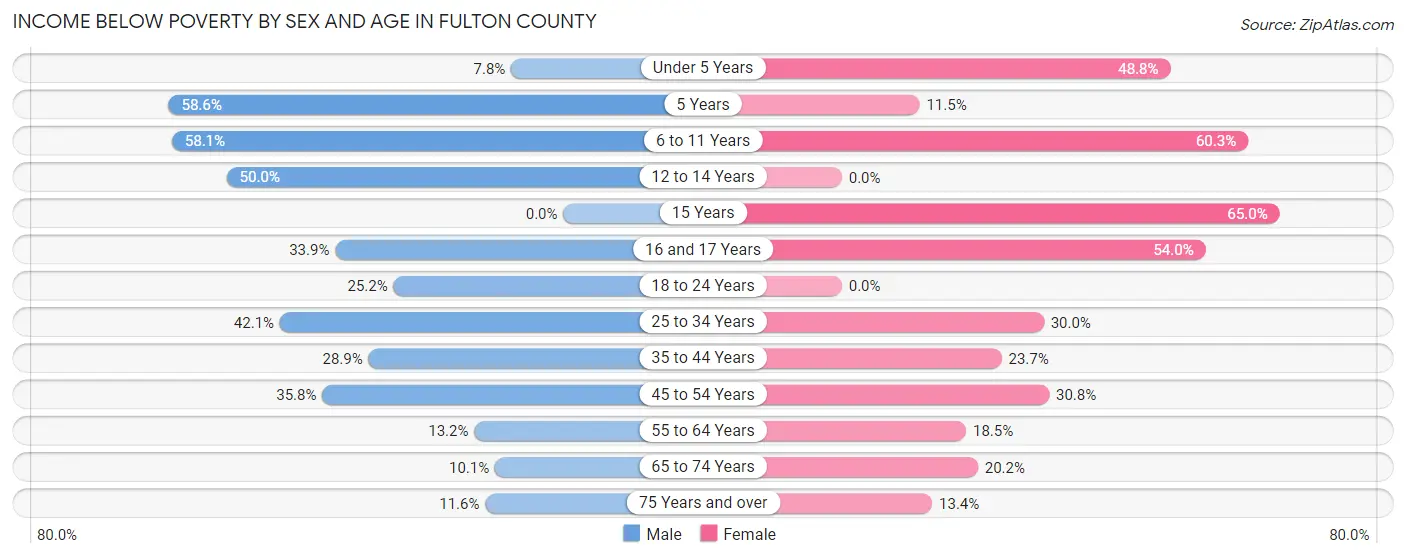
| Age Bracket | Male | Female |
| Under 5 Years | 10 (7.7%) | 80 (48.8%) |
| 5 Years | 17 (58.6%) | 3 (11.5%) |
| 6 to 11 Years | 193 (58.1%) | 155 (60.3%) |
| 12 to 14 Years | 57 (50.0%) | 0 (0.0%) |
| 15 Years | 0 (0.0%) | 13 (65.0%) |
| 16 and 17 Years | 42 (33.9%) | 27 (54.0%) |
| 18 to 24 Years | 87 (25.2%) | 0 (0.0%) |
| 25 to 34 Years | 141 (42.1%) | 149 (30.0%) |
| 35 to 44 Years | 70 (28.9%) | 74 (23.7%) |
| 45 to 54 Years | 97 (35.8%) | 92 (30.8%) |
| 55 to 64 Years | 52 (13.2%) | 86 (18.4%) |
| 65 to 74 Years | 35 (10.1%) | 80 (20.2%) |
| 75 Years and over | 27 (11.6%) | 46 (13.4%) |
| Total | 828 (28.3%) | 805 (26.5%) |
Income Above Poverty by Sex and Age in Fulton County
According to the poverty statistics in Fulton County, males aged 15 years and females aged 12 to 14 years are the age groups that are most secure financially, with 100.0% of males and 100.0% of females in these age groups living above the poverty line.
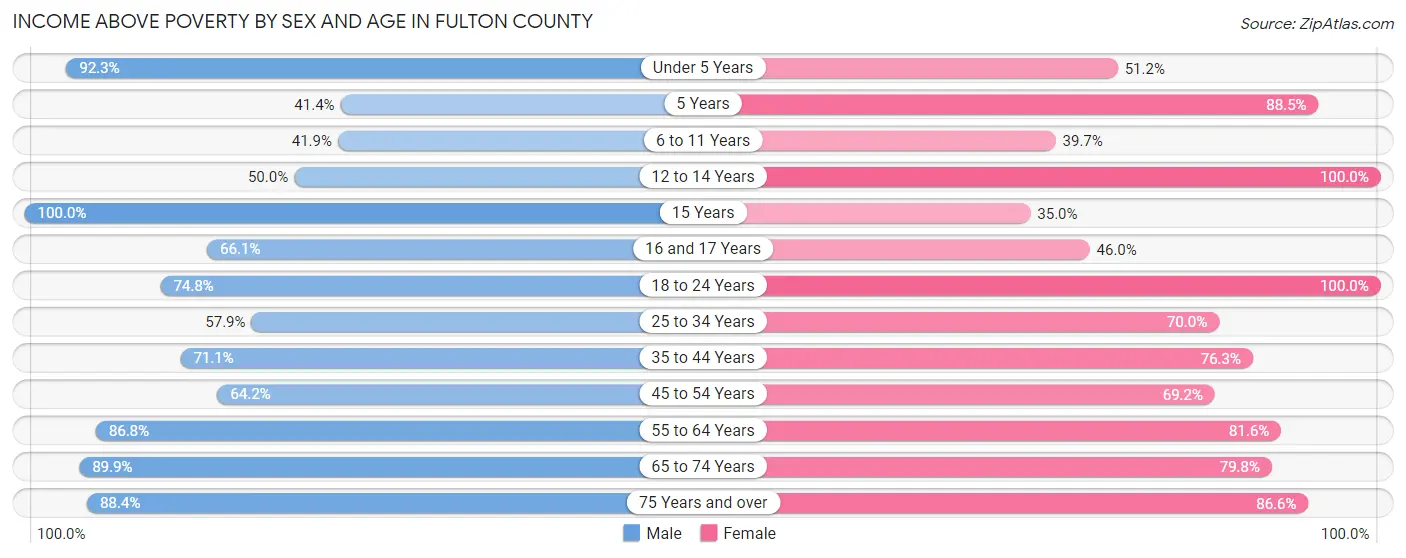
| Age Bracket | Male | Female |
| Under 5 Years | 119 (92.2%) | 84 (51.2%) |
| 5 Years | 12 (41.4%) | 23 (88.5%) |
| 6 to 11 Years | 139 (41.9%) | 102 (39.7%) |
| 12 to 14 Years | 57 (50.0%) | 64 (100.0%) |
| 15 Years | 36 (100.0%) | 7 (35.0%) |
| 16 and 17 Years | 82 (66.1%) | 23 (46.0%) |
| 18 to 24 Years | 258 (74.8%) | 143 (100.0%) |
| 25 to 34 Years | 194 (57.9%) | 348 (70.0%) |
| 35 to 44 Years | 172 (71.1%) | 238 (76.3%) |
| 45 to 54 Years | 174 (64.2%) | 207 (69.2%) |
| 55 to 64 Years | 341 (86.8%) | 380 (81.6%) |
| 65 to 74 Years | 310 (89.9%) | 316 (79.8%) |
| 75 Years and over | 206 (88.4%) | 297 (86.6%) |
| Total | 2,100 (71.7%) | 2,232 (73.5%) |
Income Below Poverty Among Married-Couple Families in Fulton County
The poverty statistics for married-couple families in Fulton County show that 6.8% or 58 of the total 856 families live below the poverty line. Families with 5 or more children have the highest poverty rate of 100.0%, comprising of 17 families. On the other hand, families with 1 or 2 children have the lowest poverty rate of 0.0%, which includes 0 families.
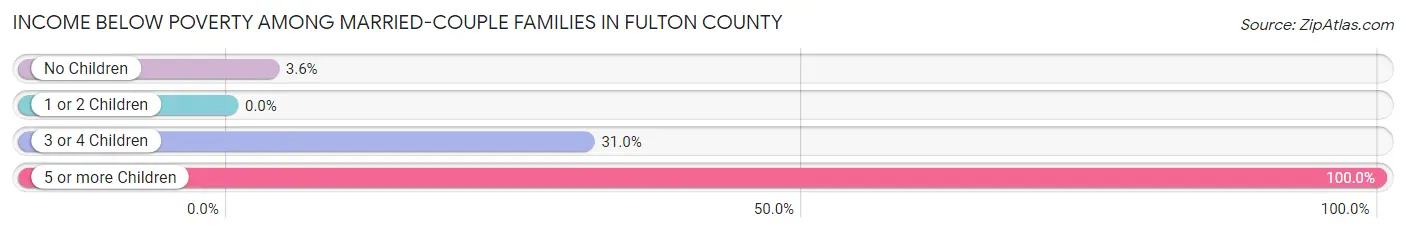
| Children | Above Poverty | Below Poverty |
| No Children | 624 (96.5%) | 23 (3.5%) |
| 1 or 2 Children | 134 (100.0%) | 0 (0.0%) |
| 3 or 4 Children | 40 (69.0%) | 18 (31.0%) |
| 5 or more Children | 0 (0.0%) | 17 (100.0%) |
| Total | 798 (93.2%) | 58 (6.8%) |
Income Below Poverty Among Single-Parent Households in Fulton County
According to the poverty data in Fulton County, 59.2% or 106 single-father households and 39.3% or 147 single-mother households are living below the poverty line. Among single-father households, those with 3 or 4 children have the highest poverty rate, with 85 households (100.0%) experiencing poverty. Likewise, among single-mother households, those with 1 or 2 children have the highest poverty rate, with 96 households (43.4%) falling below the poverty line.
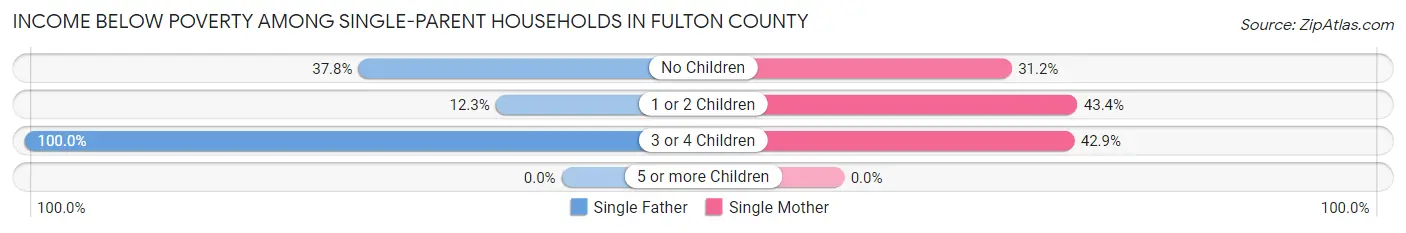
| Children | Single Father | Single Mother |
| No Children | 14 (37.8%) | 39 (31.2%) |
| 1 or 2 Children | 7 (12.3%) | 96 (43.4%) |
| 3 or 4 Children | 85 (100.0%) | 12 (42.9%) |
| 5 or more Children | 0 (0.0%) | 0 (0.0%) |
| Total | 106 (59.2%) | 147 (39.3%) |
Income Below Poverty Among Married-Couple vs Single-Parent Households in Fulton County
The poverty data for Fulton County shows that 58 of the married-couple family households (6.8%) and 253 of the single-parent households (45.8%) are living below the poverty level. Within the married-couple family households, those with 5 or more children have the highest poverty rate, with 17 households (100.0%) falling below the poverty line. Among the single-parent households, those with 3 or 4 children have the highest poverty rate, with 97 household (85.8%) living below poverty.
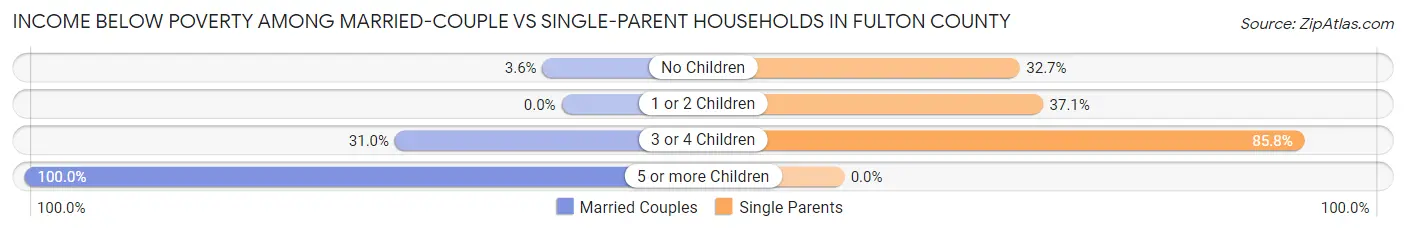
| Children | Married-Couple Families | Single-Parent Households |
| No Children | 23 (3.5%) | 53 (32.7%) |
| 1 or 2 Children | 0 (0.0%) | 103 (37.0%) |
| 3 or 4 Children | 18 (31.0%) | 97 (85.8%) |
| 5 or more Children | 17 (100.0%) | 0 (0.0%) |
| Total | 58 (6.8%) | 253 (45.8%) |
Race in Fulton County
The most populous races in Fulton County are White / Caucasian (4,601 | 71.0%), Black / African American (1,531 | 23.6%), and Two or more Races (260 | 4.0%).
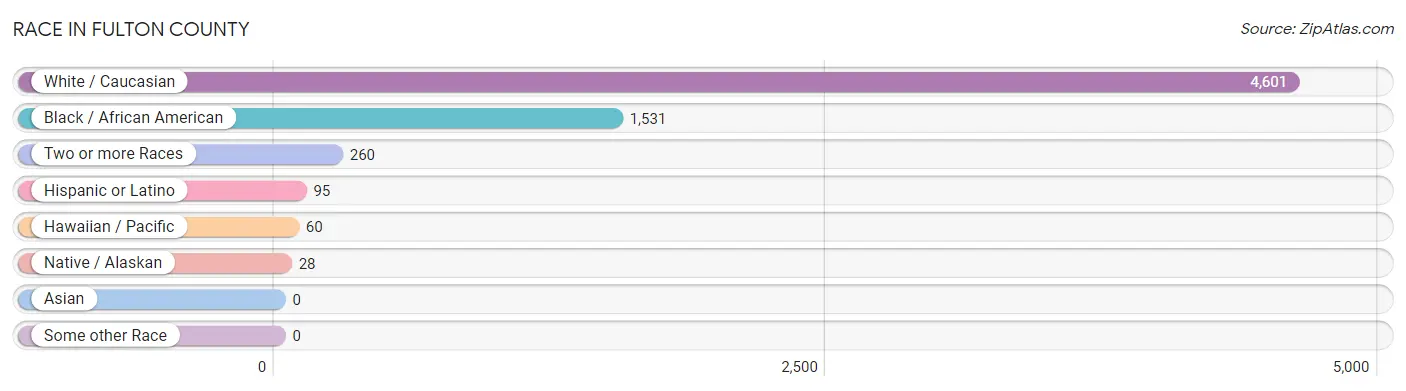
| Race | # Population | % Population |
| Asian | 0 | 0.0% |
| Black / African American | 1,531 | 23.6% |
| Hawaiian / Pacific | 60 | 0.9% |
| Hispanic or Latino | 95 | 1.5% |
| Native / Alaskan | 28 | 0.4% |
| White / Caucasian | 4,601 | 71.0% |
| Two or more Races | 260 | 4.0% |
| Some other Race | 0 | 0.0% |
| Total | 6,480 | 100.0% |
Ancestry in Fulton County
The most populous ancestries reported in Fulton County are English (1,544 | 23.8%), American (965 | 14.9%), African (595 | 9.2%), Subsaharan African (595 | 9.2%), and Irish (487 | 7.5%), together accounting for 64.6% of all Fulton County residents.
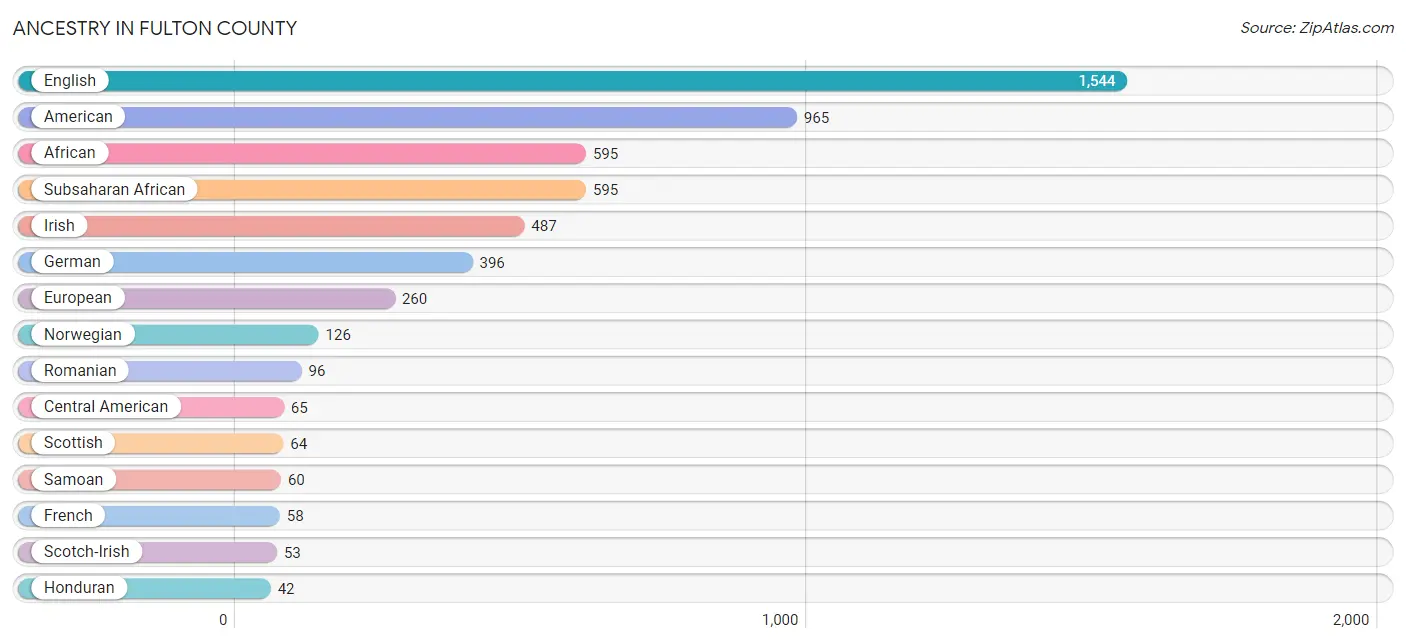
| Ancestry | # Population | % Population |
| African | 595 | 9.2% |
| American | 965 | 14.9% |
| Apache | 18 | 0.3% |
| Arab | 37 | 0.6% |
| Belgian | 20 | 0.3% |
| Blackfeet | 15 | 0.2% |
| British | 5 | 0.1% |
| Cajun | 6 | 0.1% |
| Central American | 65 | 1.0% |
| Cherokee | 4 | 0.1% |
| Chickasaw | 5 | 0.1% |
| Choctaw | 14 | 0.2% |
| Creek | 1 | 0.0% |
| Dutch | 20 | 0.3% |
| English | 1,544 | 23.8% |
| European | 260 | 4.0% |
| French | 58 | 0.9% |
| German | 396 | 6.1% |
| German Russian | 32 | 0.5% |
| Honduran | 42 | 0.6% |
| Irish | 487 | 7.5% |
| Italian | 21 | 0.3% |
| Lebanese | 13 | 0.2% |
| Mexican | 10 | 0.2% |
| Native Hawaiian | 13 | 0.2% |
| Navajo | 2 | 0.0% |
| Northern European | 4 | 0.1% |
| Norwegian | 126 | 1.9% |
| Palestinian | 12 | 0.2% |
| Polish | 41 | 0.6% |
| Portuguese | 13 | 0.2% |
| Puerto Rican | 13 | 0.2% |
| Romanian | 96 | 1.5% |
| Russian | 4 | 0.1% |
| Salvadoran | 23 | 0.4% |
| Samoan | 60 | 0.9% |
| Scandinavian | 4 | 0.1% |
| Scotch-Irish | 53 | 0.8% |
| Scottish | 64 | 1.0% |
| South American | 1 | 0.0% |
| Subsaharan African | 595 | 9.2% |
| Swedish | 18 | 0.3% |
| Trinidadian and Tobagonian | 1 | 0.0% |
| Venezuelan | 1 | 0.0% | View All 44 Rows |
Immigrants in Fulton County
The most numerous immigrant groups reported in Fulton County came from Africa (8 | 0.1%), Europe (8 | 0.1%), Germany (8 | 0.1%), Ghana (8 | 0.1%), and Western Africa (8 | 0.1%), together accounting for 0.6% of all Fulton County residents.
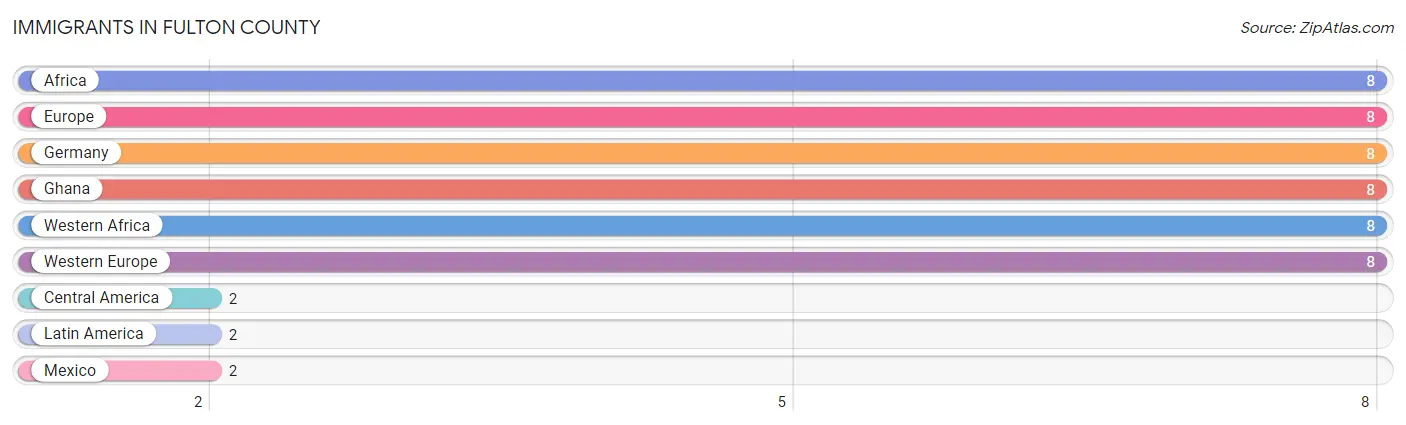
| Immigration Origin | # Population | % Population |
| Africa | 8 | 0.1% |
| Central America | 2 | 0.0% |
| Europe | 8 | 0.1% |
| Germany | 8 | 0.1% |
| Ghana | 8 | 0.1% |
| Latin America | 2 | 0.0% |
| Mexico | 2 | 0.0% |
| Western Africa | 8 | 0.1% |
| Western Europe | 8 | 0.1% | View All 9 Rows |
Sex and Age in Fulton County
Sex and Age in Fulton County
The most populous age groups in Fulton County are 20 to 24 Years (361 | 10.7%) for men and 65 to 69 Years (321 | 10.3%) for women.
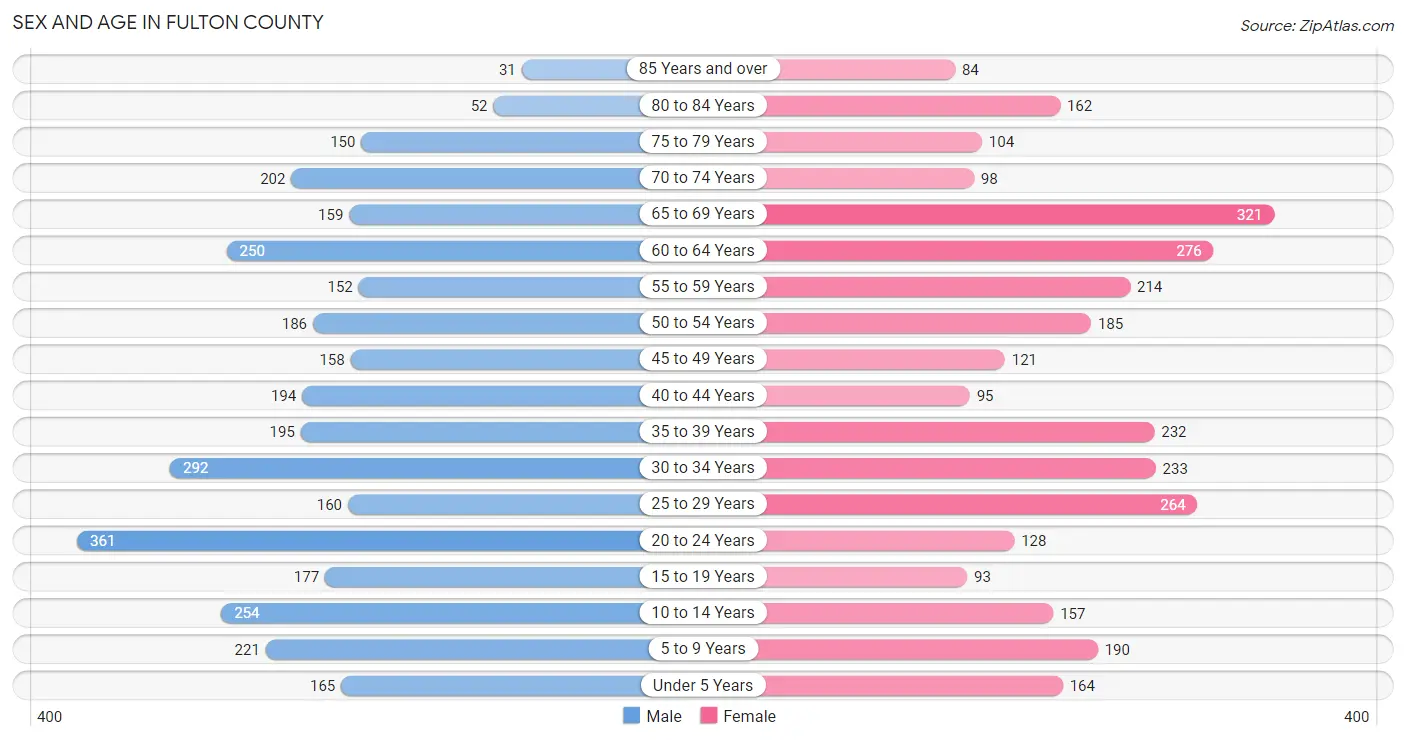
| Age Bracket | Male | Female |
| Under 5 Years | 165 (4.9%) | 164 (5.2%) |
| 5 to 9 Years | 221 (6.6%) | 190 (6.1%) |
| 10 to 14 Years | 254 (7.6%) | 157 (5.0%) |
| 15 to 19 Years | 177 (5.3%) | 93 (3.0%) |
| 20 to 24 Years | 361 (10.7%) | 128 (4.1%) |
| 25 to 29 Years | 160 (4.8%) | 264 (8.5%) |
| 30 to 34 Years | 292 (8.7%) | 233 (7.5%) |
| 35 to 39 Years | 195 (5.8%) | 232 (7.4%) |
| 40 to 44 Years | 194 (5.8%) | 95 (3.0%) |
| 45 to 49 Years | 158 (4.7%) | 121 (3.9%) |
| 50 to 54 Years | 186 (5.5%) | 185 (5.9%) |
| 55 to 59 Years | 152 (4.5%) | 214 (6.9%) |
| 60 to 64 Years | 250 (7.4%) | 276 (8.8%) |
| 65 to 69 Years | 159 (4.7%) | 321 (10.3%) |
| 70 to 74 Years | 202 (6.0%) | 98 (3.1%) |
| 75 to 79 Years | 150 (4.5%) | 104 (3.3%) |
| 80 to 84 Years | 52 (1.5%) | 162 (5.2%) |
| 85 Years and over | 31 (0.9%) | 84 (2.7%) |
| Total | 3,359 (100.0%) | 3,121 (100.0%) |
Families and Households in Fulton County
Median Family Size in Fulton County
The median family size in Fulton County is 3.32 persons per family, with single female/mother families (374 | 26.5%) accounting for the largest median family size of 3.58 persons per family. On the other hand, single male/father families (179 | 12.7%) represent the smallest median family size with 3.15 persons per family.
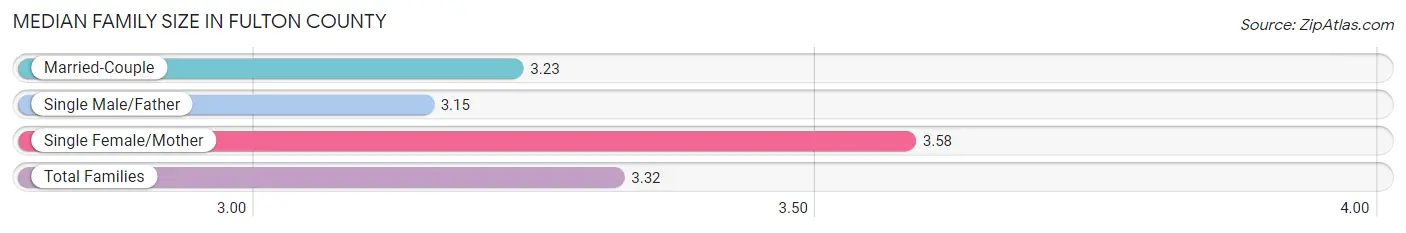
| Family Type | # Families | Family Size |
| Married-Couple | 856 (60.8%) | 3.23 |
| Single Male/Father | 179 (12.7%) | 3.15 |
| Single Female/Mother | 374 (26.5%) | 3.58 |
| Total Families | 1,409 (100.0%) | 3.32 |
Median Household Size in Fulton County
The median household size in Fulton County is 2.52 persons per household, with single female/mother households (374 | 15.7%) accounting for the largest median household size of 3.66 persons per household. non-family households (969 | 40.7%) represent the smallest median household size with 1.27 persons per household.
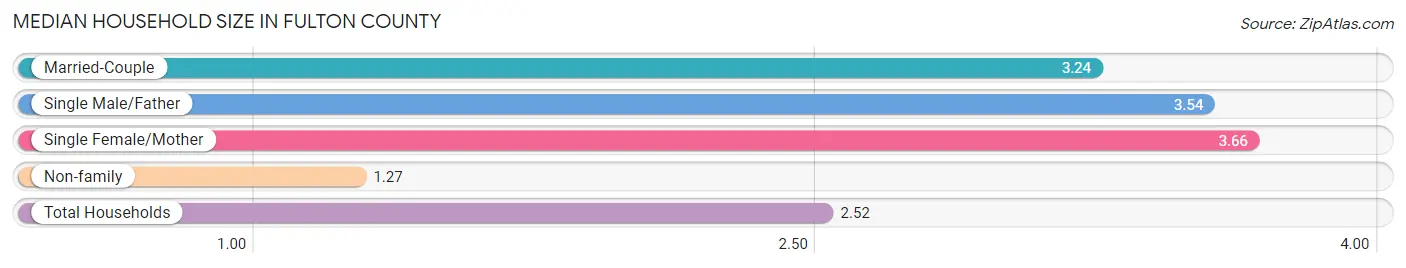
| Household Type | # Households | Household Size |
| Married-Couple | 856 (36.0%) | 3.24 |
| Single Male/Father | 179 (7.5%) | 3.54 |
| Single Female/Mother | 374 (15.7%) | 3.66 |
| Non-family | 969 (40.7%) | 1.27 |
| Total Households | 2,378 (100.0%) | 2.52 |
Household Size by Marriage Status in Fulton County
Out of a total of 2,378 households in Fulton County, 1,409 (59.3%) are family households, while 969 (40.7%) are nonfamily households. The most numerous type of family households are 2-person households, comprising 849, and the most common type of nonfamily households are 1-person households, comprising 778.
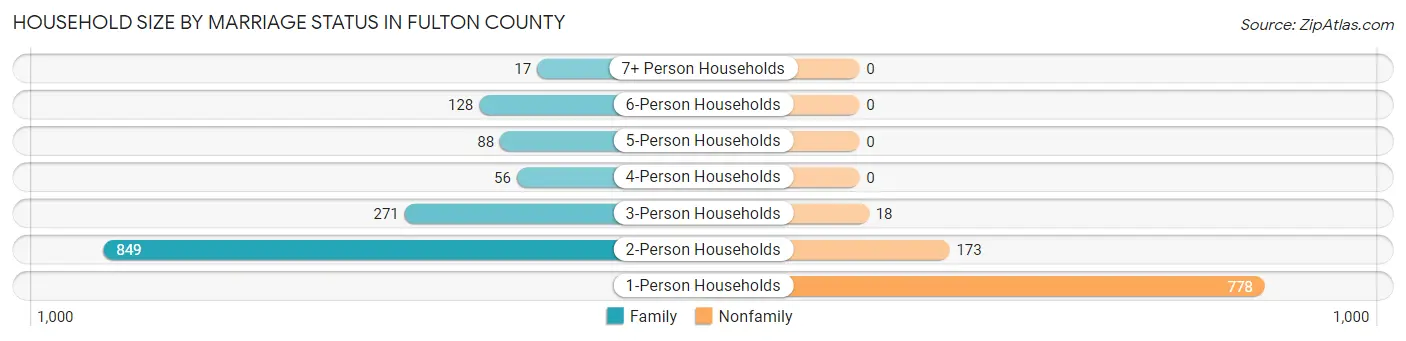
| Household Size | Family Households | Nonfamily Households |
| 1-Person Households | - | 778 (32.7%) |
| 2-Person Households | 849 (35.7%) | 173 (7.3%) |
| 3-Person Households | 271 (11.4%) | 18 (0.8%) |
| 4-Person Households | 56 (2.4%) | 0 (0.0%) |
| 5-Person Households | 88 (3.7%) | 0 (0.0%) |
| 6-Person Households | 128 (5.4%) | 0 (0.0%) |
| 7+ Person Households | 17 (0.7%) | 0 (0.0%) |
| Total | 1,409 (59.3%) | 969 (40.7%) |
Female Fertility in Fulton County
Fertility by Age in Fulton County
Average fertility rate in Fulton County is 23.0 births per 1,000 women. Women in the age bracket of 20 to 34 years have the highest fertility rate with 26.0 births per 1,000 women. Women in the age bracket of 20 to 34 years acount for 59.3% of all women with births.
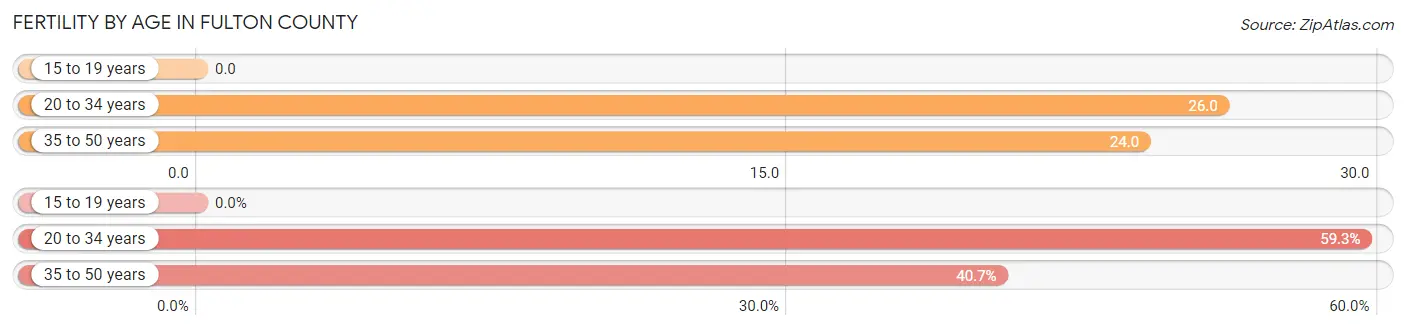
| Age Bracket | Women with Births | Births / 1,000 Women |
| 15 to 19 years | 0 (0.0%) | 0.0 |
| 20 to 34 years | 16 (59.3%) | 26.0 |
| 35 to 50 years | 11 (40.7%) | 24.0 |
| Total | 27 (100.0%) | 23.0 |
Fertility by Age by Marriage Status in Fulton County
66.7% of women with births (27) in Fulton County are married. The highest percentage of unmarried women with births falls into 20 to 34 years age bracket with 56.2% of them unmarried at the time of birth, while the lowest percentage of unmarried women with births belong to 35 to 50 years age bracket with 0.0% of them unmarried.
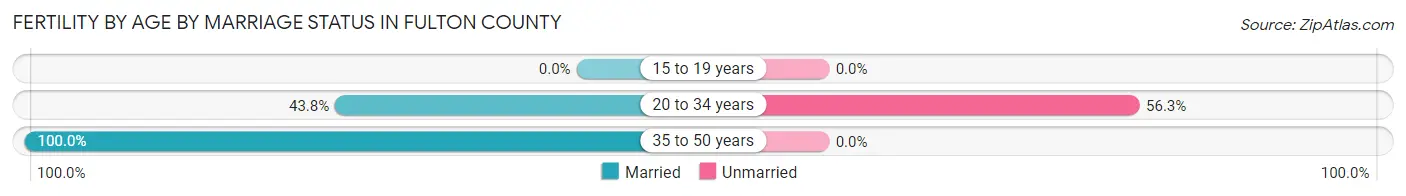
| Age Bracket | Married | Unmarried |
| 15 to 19 years | 0 (0.0%) | 0 (0.0%) |
| 20 to 34 years | 7 (43.8%) | 9 (56.2%) |
| 35 to 50 years | 11 (100.0%) | 0 (0.0%) |
| Total | 18 (66.7%) | 9 (33.3%) |
Fertility by Education in Fulton County
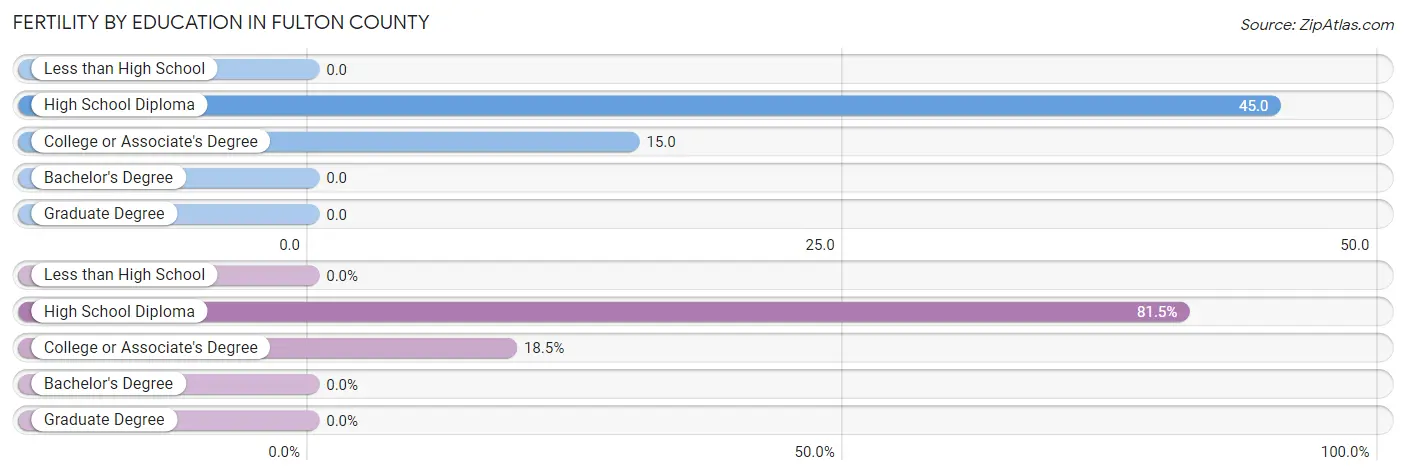
| Educational Attainment | Women with Births | Births / 1,000 Women |
| Less than High School | 0 (0.0%) | 0.0 |
| High School Diploma | 22 (81.5%) | 45.0 |
| College or Associate's Degree | 5 (18.5%) | 15.0 |
| Bachelor's Degree | 0 (0.0%) | 0.0 |
| Graduate Degree | 0 (0.0%) | 0.0 |
| Total | 27 (100.0%) | 23.0 |
Fertility by Education by Marriage Status in Fulton County
33.3% of women with births in Fulton County are unmarried. Women with the educational attainment of college or associate's degree are most likely to be married with 100.0% of them married at childbirth, while women with the educational attainment of high school diploma are least likely to be married with 40.9% of them unmarried at childbirth.
| Educational Attainment | Married | Unmarried |
| Less than High School | 0 (0.0%) | 0 (0.0%) |
| High School Diploma | 13 (59.1%) | 9 (40.9%) |
| College or Associate's Degree | 5 (100.0%) | 0 (0.0%) |
| Bachelor's Degree | 0 (0.0%) | 0 (0.0%) |
| Graduate Degree | 0 (0.0%) | 0 (0.0%) |
| Total | 18 (66.7%) | 9 (33.3%) |
Employment Characteristics in Fulton County
Employment by Class of Employer in Fulton County
Among the 2,160 employed individuals in Fulton County, private company employees (1,689 | 78.2%), local government employees (135 | 6.2%), and self-employed (not incorporated) (134 | 6.2%) make up the most common classes of employment.
| Employer Class | # Employees | % Employees |
| Private Company Employees | 1,689 | 78.2% |
| Self-Employed (Incorporated) | 53 | 2.5% |
| Self-Employed (Not Incorporated) | 134 | 6.2% |
| Not-for-profit Organizations | 22 | 1.0% |
| Local Government Employees | 135 | 6.2% |
| State Government Employees | 92 | 4.3% |
| Federal Government Employees | 33 | 1.5% |
| Unpaid Family Workers | 2 | 0.1% |
| Total | 2,160 | 100.0% |
Employment Status by Age in Fulton County
According to the labor force statistics for Fulton County, out of the total population over 16 years of age (5,273), 44.6% or 2,352 individuals are in the labor force, with 5.6% or 132 of them unemployed. The age group with the highest labor force participation rate is 25 to 29 years, with 73.1% or 310 individuals in the labor force. Within the labor force, the 16 to 19 years age range has the highest percentage of unemployed individuals, with 11.3% or 7 of them being unemployed.
| Age Bracket | In Labor Force | Unemployed |
| 16 to 19 Years | 62 (29.0%) | 7 (11.3%) |
| 20 to 24 Years | 327 (66.9%) | 0 (0.0%) |
| 25 to 29 Years | 310 (73.1%) | 34 (11.0%) |
| 30 to 34 Years | 371 (70.7%) | 19 (5.1%) |
| 35 to 44 Years | 417 (58.2%) | 20 (4.8%) |
| 45 to 54 Years | 330 (50.8%) | 36 (10.9%) |
| 55 to 59 Years | 176 (48.1%) | 11 (6.3%) |
| 60 to 64 Years | 197 (37.5%) | 4 (2.0%) |
| 65 to 74 Years | 151 (19.4%) | 0 (0.0%) |
| 75 Years and over | 11 (1.9%) | 0 (0.0%) |
| Total | 2,352 (44.6%) | 132 (5.6%) |
Employment Status by Educational Attainment in Fulton County
According to labor force statistics for Fulton County, 56.2% of individuals (1,802) out of the total population between 25 and 64 years of age (3,207) are in the labor force, with 6.9% or 124 of them being unemployed. The group with the highest labor force participation rate are those with the educational attainment of bachelor's degree or higher, with 76.7% or 316 individuals in the labor force. Within the labor force, individuals with less than high school education have the highest percentage of unemployment, with 21.5% or 31 of them being unemployed.
| Educational Attainment | In Labor Force | Unemployed |
| Less than High School | 144 (26.2%) | 118 (21.5%) |
| High School Diploma | 901 (64.1%) | 91 (6.5%) |
| College / Associate Degree | 441 (52.4%) | 15 (1.8%) |
| Bachelor's Degree or higher | 316 (76.7%) | 35 (8.6%) |
| Total | 1,802 (56.2%) | 221 (6.9%) |
Employment Occupations by Sex in Fulton County
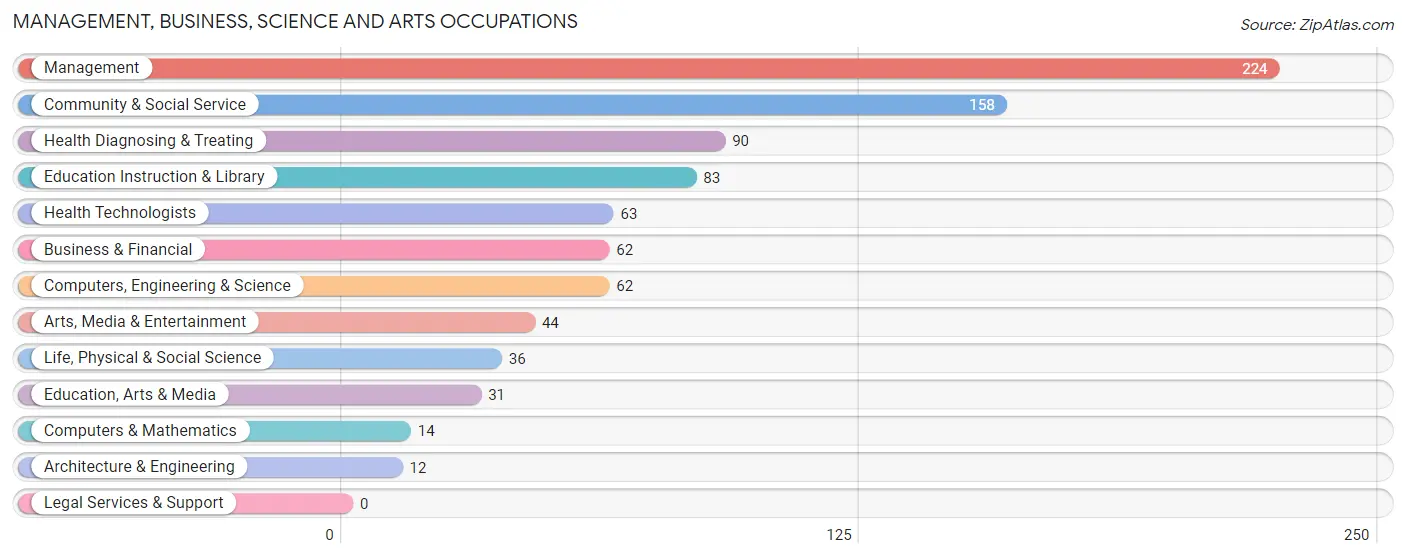
Management, Business, Science and Arts Occupations
The most common Management, Business, Science and Arts occupations in Fulton County are Management (224 | 10.2%), Community & Social Service (158 | 7.2%), Health Diagnosing & Treating (90 | 4.1%), Education Instruction & Library (83 | 3.8%), and Health Technologists (63 | 2.9%).
Management, Business, Science and Arts Occupations by Sex
Within the Management, Business, Science and Arts occupations in Fulton County, the most male-oriented occupations are Computers & Mathematics (100.0%), Architecture & Engineering (100.0%), and Management (70.5%), while the most female-oriented occupations are Life, Physical & Social Science (100.0%), Education, Arts & Media (100.0%), and Health Diagnosing & Treating (100.0%).
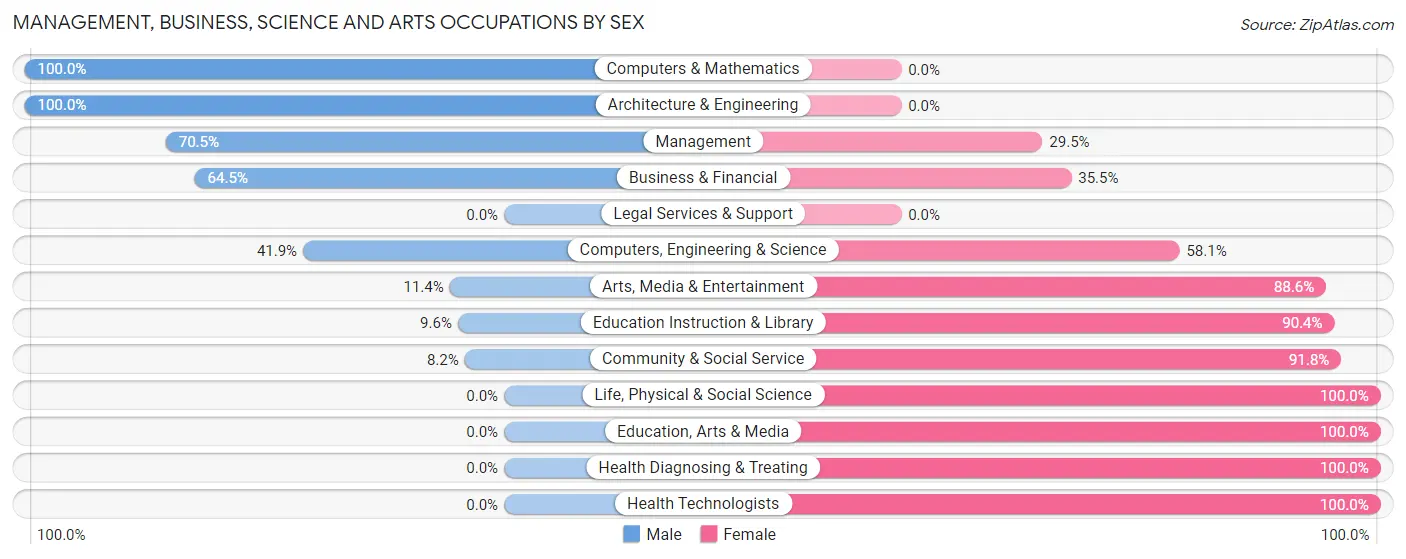
| Occupation | Male | Female |
| Management | 158 (70.5%) | 66 (29.5%) |
| Business & Financial | 40 (64.5%) | 22 (35.5%) |
| Computers, Engineering & Science | 26 (41.9%) | 36 (58.1%) |
| Computers & Mathematics | 14 (100.0%) | 0 (0.0%) |
| Architecture & Engineering | 12 (100.0%) | 0 (0.0%) |
| Life, Physical & Social Science | 0 (0.0%) | 36 (100.0%) |
| Community & Social Service | 13 (8.2%) | 145 (91.8%) |
| Education, Arts & Media | 0 (0.0%) | 31 (100.0%) |
| Legal Services & Support | 0 (0.0%) | 0 (0.0%) |
| Education Instruction & Library | 8 (9.6%) | 75 (90.4%) |
| Arts, Media & Entertainment | 5 (11.4%) | 39 (88.6%) |
| Health Diagnosing & Treating | 0 (0.0%) | 90 (100.0%) |
| Health Technologists | 0 (0.0%) | 63 (100.0%) |
| Total (Category) | 237 (39.8%) | 359 (60.2%) |
| Total (Overall) | 1,024 (46.6%) | 1,172 (53.4%) |
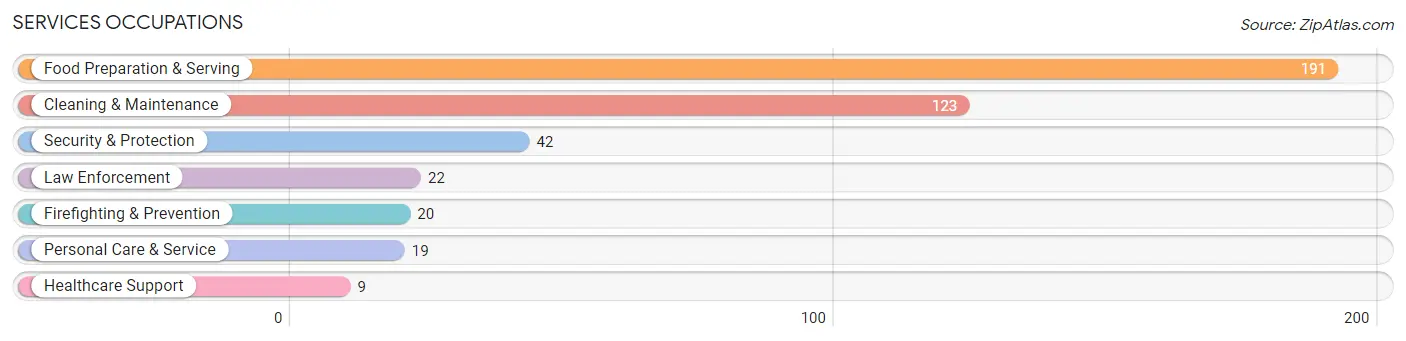
Services Occupations
The most common Services occupations in Fulton County are Food Preparation & Serving (191 | 8.7%), Cleaning & Maintenance (123 | 5.6%), Security & Protection (42 | 1.9%), Law Enforcement (22 | 1.0%), and Firefighting & Prevention (20 | 0.9%).
Services Occupations by Sex
Within the Services occupations in Fulton County, the most male-oriented occupations are Security & Protection (100.0%), Firefighting & Prevention (100.0%), and Law Enforcement (100.0%), while the most female-oriented occupations are Healthcare Support (100.0%), Personal Care & Service (100.0%), and Food Preparation & Serving (72.3%).
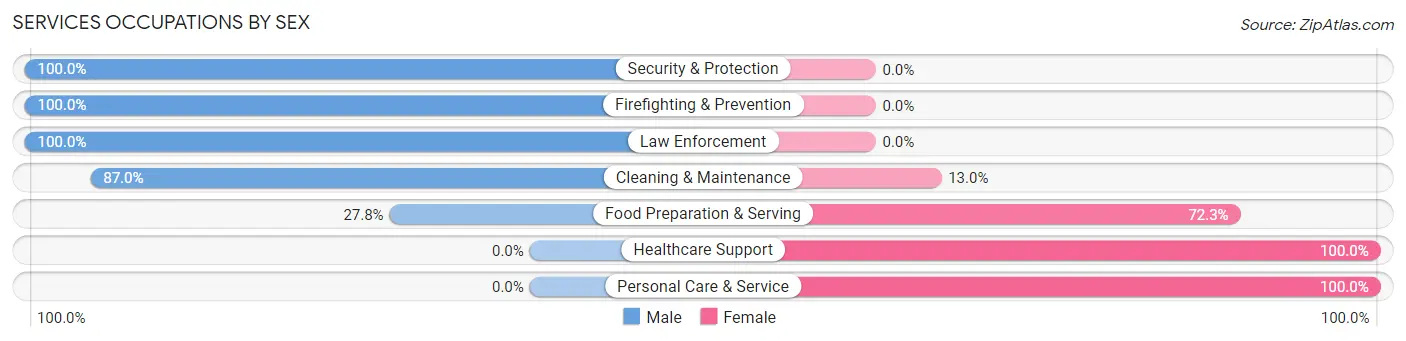
| Occupation | Male | Female |
| Healthcare Support | 0 (0.0%) | 9 (100.0%) |
| Security & Protection | 42 (100.0%) | 0 (0.0%) |
| Firefighting & Prevention | 20 (100.0%) | 0 (0.0%) |
| Law Enforcement | 22 (100.0%) | 0 (0.0%) |
| Food Preparation & Serving | 53 (27.8%) | 138 (72.3%) |
| Cleaning & Maintenance | 107 (87.0%) | 16 (13.0%) |
| Personal Care & Service | 0 (0.0%) | 19 (100.0%) |
| Total (Category) | 202 (52.6%) | 182 (47.4%) |
| Total (Overall) | 1,024 (46.6%) | 1,172 (53.4%) |
Sales and Office Occupations
The most common Sales and Office occupations in Fulton County are Office & Administration (300 | 13.7%), and Sales & Related (134 | 6.1%).
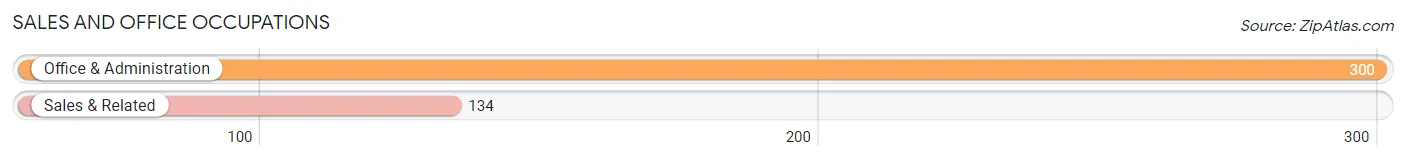
Sales and Office Occupations by Sex

| Occupation | Male | Female |
| Sales & Related | 42 (31.3%) | 92 (68.7%) |
| Office & Administration | 49 (16.3%) | 251 (83.7%) |
| Total (Category) | 91 (21.0%) | 343 (79.0%) |
| Total (Overall) | 1,024 (46.6%) | 1,172 (53.4%) |
Natural Resources, Construction and Maintenance Occupations
The most common Natural Resources, Construction and Maintenance occupations in Fulton County are Construction & Extraction (102 | 4.6%), Installation, Maintenance & Repair (72 | 3.3%), and Farming, Fishing & Forestry (18 | 0.8%).
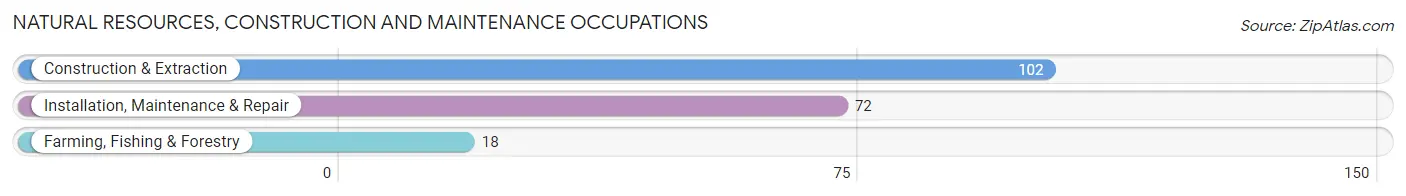
Natural Resources, Construction and Maintenance Occupations by Sex
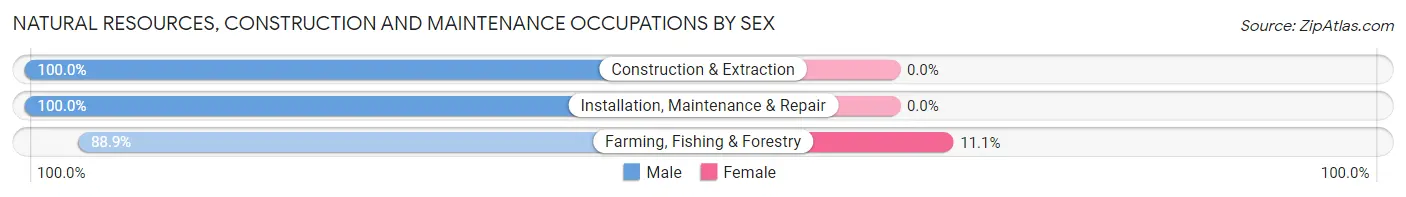
| Occupation | Male | Female |
| Farming, Fishing & Forestry | 16 (88.9%) | 2 (11.1%) |
| Construction & Extraction | 102 (100.0%) | 0 (0.0%) |
| Installation, Maintenance & Repair | 72 (100.0%) | 0 (0.0%) |
| Total (Category) | 190 (99.0%) | 2 (1.0%) |
| Total (Overall) | 1,024 (46.6%) | 1,172 (53.4%) |
Production, Transportation and Moving Occupations
The most common Production, Transportation and Moving occupations in Fulton County are Production (377 | 17.2%), Material Moving (163 | 7.4%), and Transportation (50 | 2.3%).
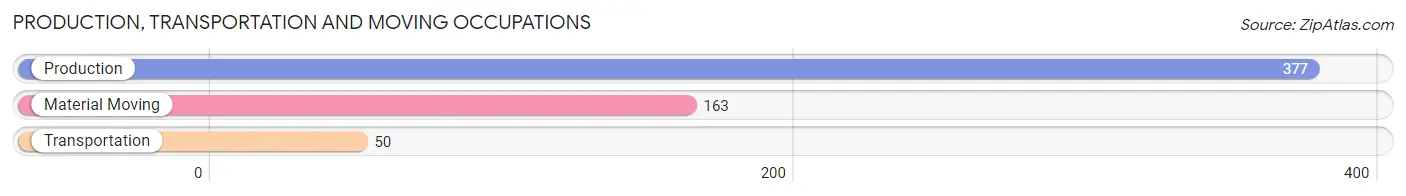
Production, Transportation and Moving Occupations by Sex
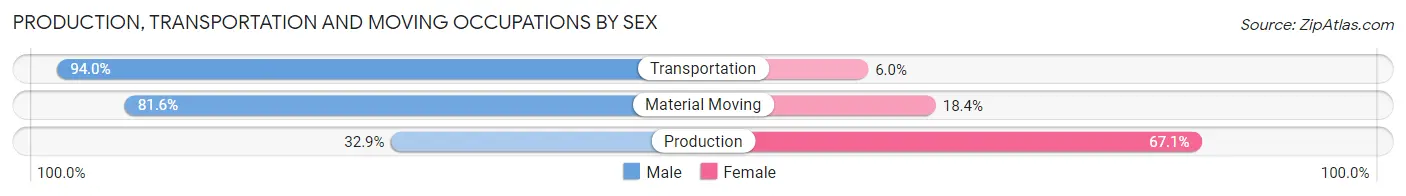
| Occupation | Male | Female |
| Production | 124 (32.9%) | 253 (67.1%) |
| Transportation | 47 (94.0%) | 3 (6.0%) |
| Material Moving | 133 (81.6%) | 30 (18.4%) |
| Total (Category) | 304 (51.5%) | 286 (48.5%) |
| Total (Overall) | 1,024 (46.6%) | 1,172 (53.4%) |
Employment Industries by Sex in Fulton County
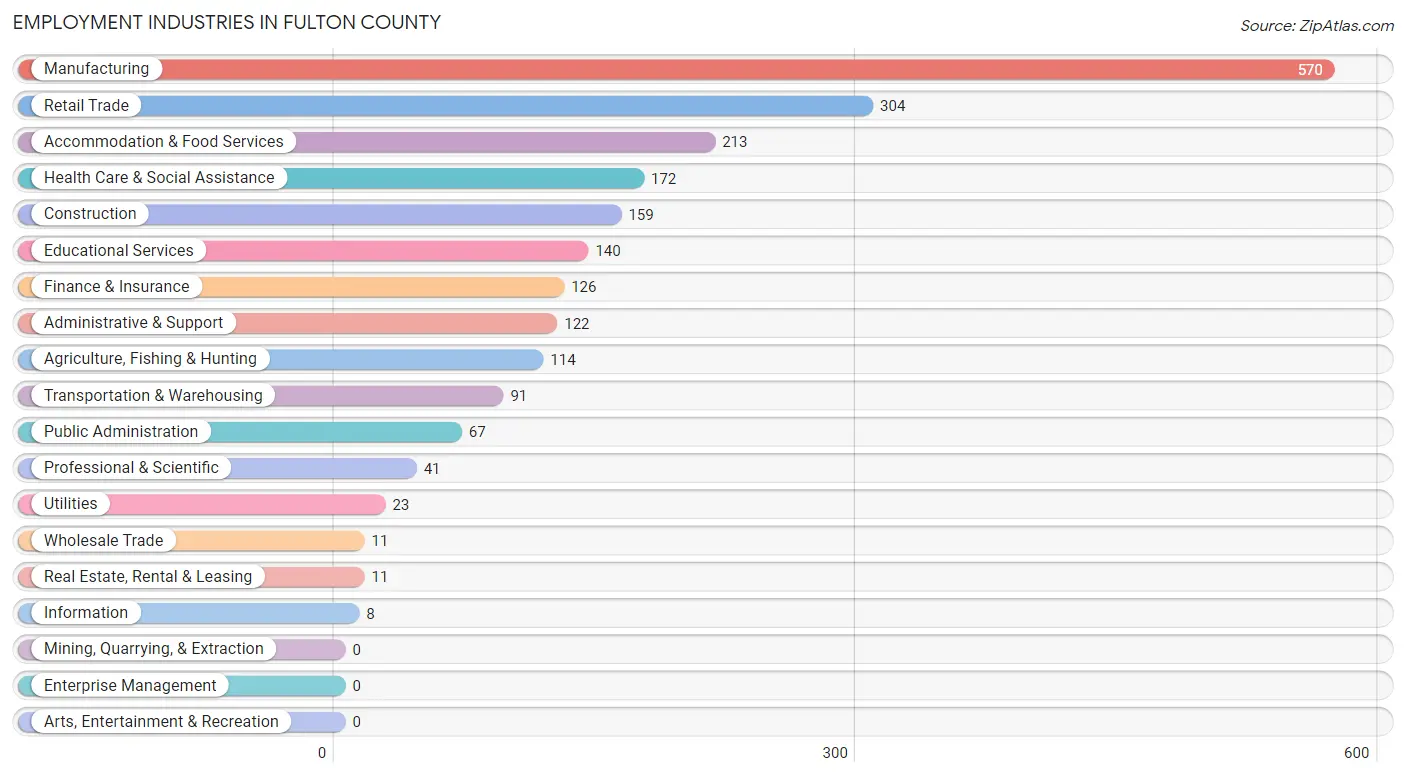
Employment Industries in Fulton County
The major employment industries in Fulton County include Manufacturing (570 | 26.0%), Retail Trade (304 | 13.8%), Accommodation & Food Services (213 | 9.7%), Health Care & Social Assistance (172 | 7.8%), and Construction (159 | 7.2%).
Employment Industries by Sex in Fulton County
The Fulton County industries that see more men than women are Wholesale Trade (100.0%), Transportation & Warehousing (93.4%), and Agriculture, Fishing & Hunting (87.7%), whereas the industries that tend to have a higher number of women are Health Care & Social Assistance (98.8%), Educational Services (80.7%), and Finance & Insurance (66.7%).
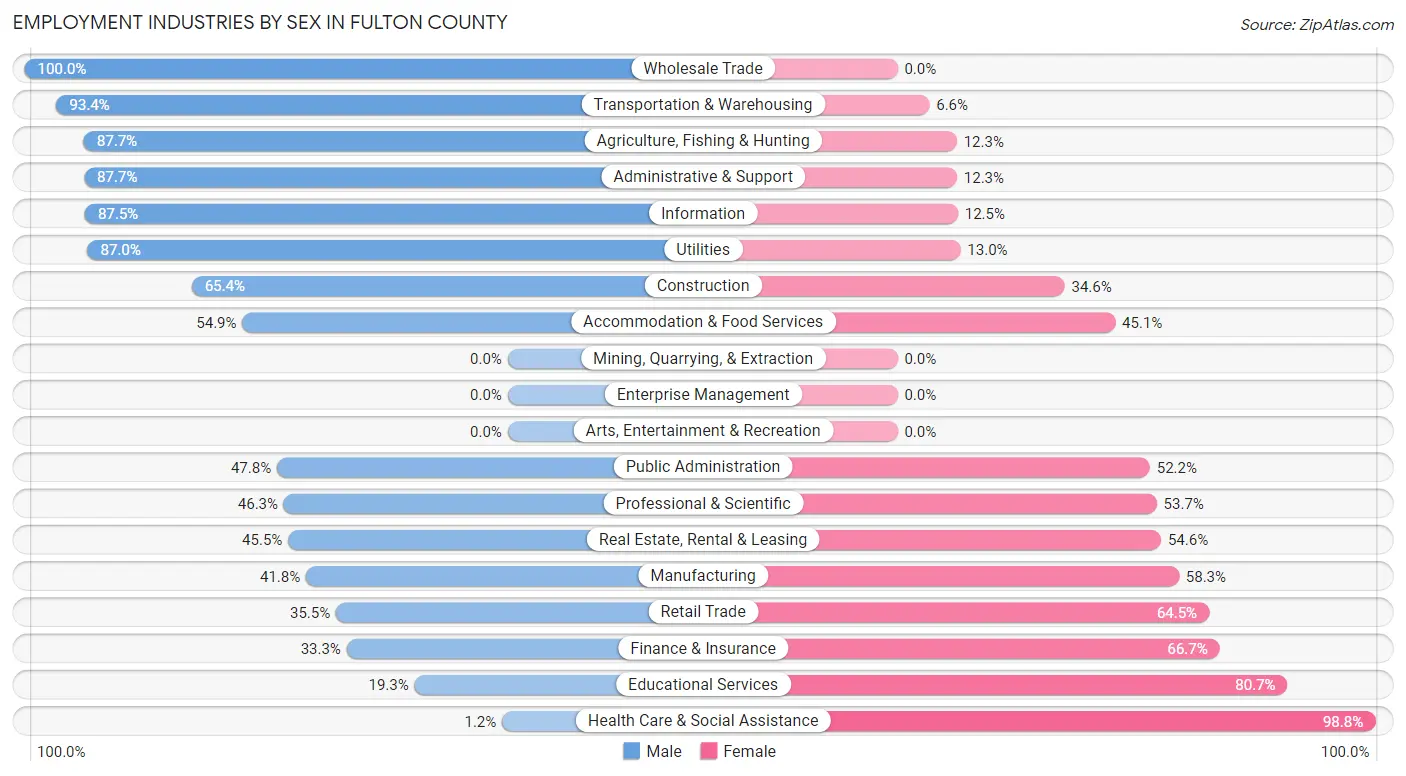
| Industry | Male | Female |
| Agriculture, Fishing & Hunting | 100 (87.7%) | 14 (12.3%) |
| Mining, Quarrying, & Extraction | 0 (0.0%) | 0 (0.0%) |
| Construction | 104 (65.4%) | 55 (34.6%) |
| Manufacturing | 238 (41.7%) | 332 (58.3%) |
| Wholesale Trade | 11 (100.0%) | 0 (0.0%) |
| Retail Trade | 108 (35.5%) | 196 (64.5%) |
| Transportation & Warehousing | 85 (93.4%) | 6 (6.6%) |
| Utilities | 20 (87.0%) | 3 (13.0%) |
| Information | 7 (87.5%) | 1 (12.5%) |
| Finance & Insurance | 42 (33.3%) | 84 (66.7%) |
| Real Estate, Rental & Leasing | 5 (45.5%) | 6 (54.5%) |
| Professional & Scientific | 19 (46.3%) | 22 (53.7%) |
| Enterprise Management | 0 (0.0%) | 0 (0.0%) |
| Administrative & Support | 107 (87.7%) | 15 (12.3%) |
| Educational Services | 27 (19.3%) | 113 (80.7%) |
| Health Care & Social Assistance | 2 (1.2%) | 170 (98.8%) |
| Arts, Entertainment & Recreation | 0 (0.0%) | 0 (0.0%) |
| Accommodation & Food Services | 117 (54.9%) | 96 (45.1%) |
| Public Administration | 32 (47.8%) | 35 (52.2%) |
| Total | 1,024 (46.6%) | 1,172 (53.4%) |
Education in Fulton County
School Enrollment in Fulton County
The most common levels of schooling among the 1,305 students in Fulton County are elementary school (371 | 28.4%), middle school (329 | 25.2%), and high school (251 | 19.2%).
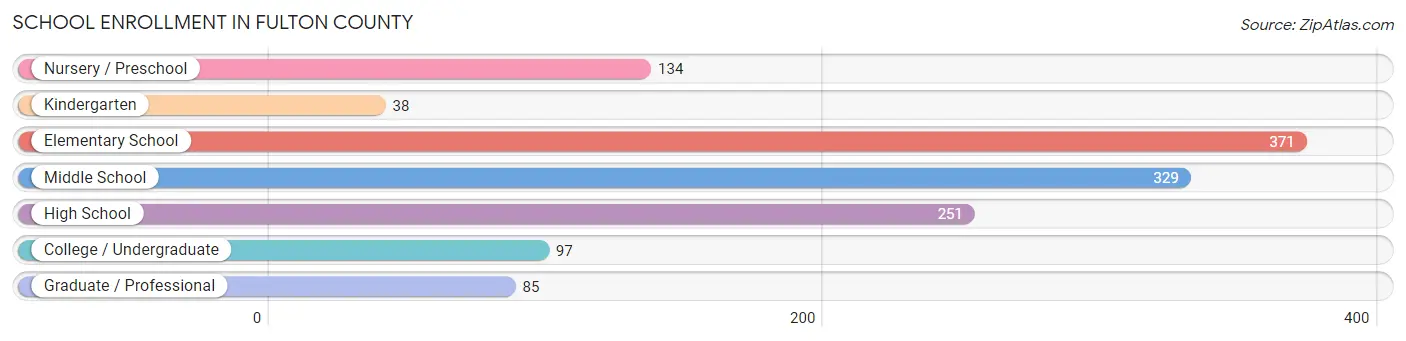
| School Level | # Students | % Students |
| Nursery / Preschool | 134 | 10.3% |
| Kindergarten | 38 | 2.9% |
| Elementary School | 371 | 28.4% |
| Middle School | 329 | 25.2% |
| High School | 251 | 19.2% |
| College / Undergraduate | 97 | 7.4% |
| Graduate / Professional | 85 | 6.5% |
| Total | 1,305 | 100.0% |
School Enrollment by Age by Funding Source in Fulton County
Out of a total of 1,305 students who are enrolled in schools in Fulton County, 124 (9.5%) attend a private institution, while the remaining 1,181 (90.5%) are enrolled in public schools. The age group of 35 years and over has the highest likelihood of being enrolled in private schools, with 5 (23.8% in the age bracket) enrolled. Conversely, the age group of 3 to 4 year olds has the lowest likelihood of being enrolled in a private school, with 134 (100.0% in the age bracket) attending a public institution.
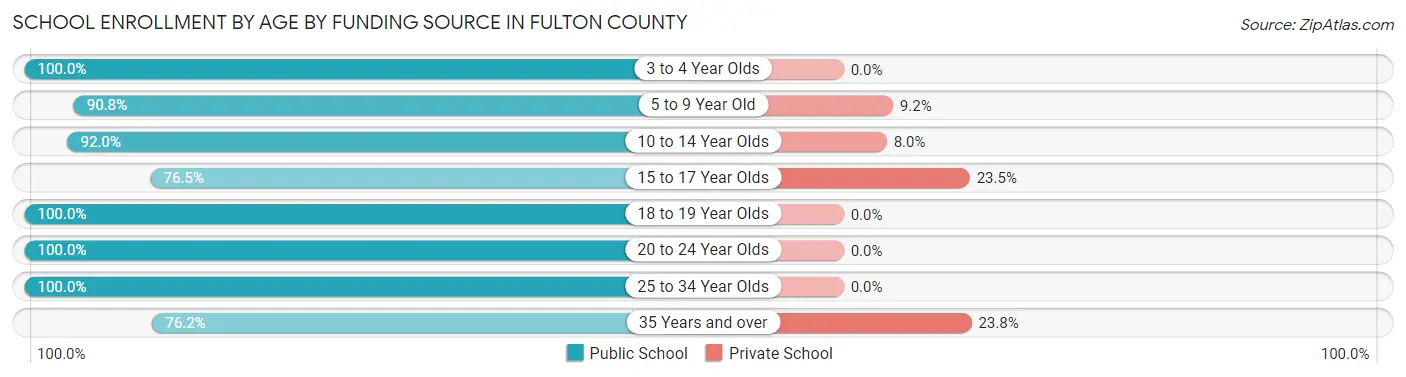
| Age Bracket | Public School | Private School |
| 3 to 4 Year Olds | 134 (100.0%) | 0 (0.0%) |
| 5 to 9 Year Old | 327 (90.8%) | 33 (9.2%) |
| 10 to 14 Year Olds | 367 (92.0%) | 32 (8.0%) |
| 15 to 17 Year Olds | 176 (76.5%) | 54 (23.5%) |
| 18 to 19 Year Olds | 21 (100.0%) | 0 (0.0%) |
| 20 to 24 Year Olds | 118 (100.0%) | 0 (0.0%) |
| 25 to 34 Year Olds | 22 (100.0%) | 0 (0.0%) |
| 35 Years and over | 16 (76.2%) | 5 (23.8%) |
| Total | 1,181 (90.5%) | 124 (9.5%) |
Educational Attainment by Field of Study in Fulton County
Business (188 | 25.4%), education (124 | 16.7%), arts & humanities (96 | 13.0%), bio, nature & agricultural (72 | 9.7%), and communications (64 | 8.6%) are the most common fields of study among 741 individuals in Fulton County who have obtained a bachelor's degree or higher.
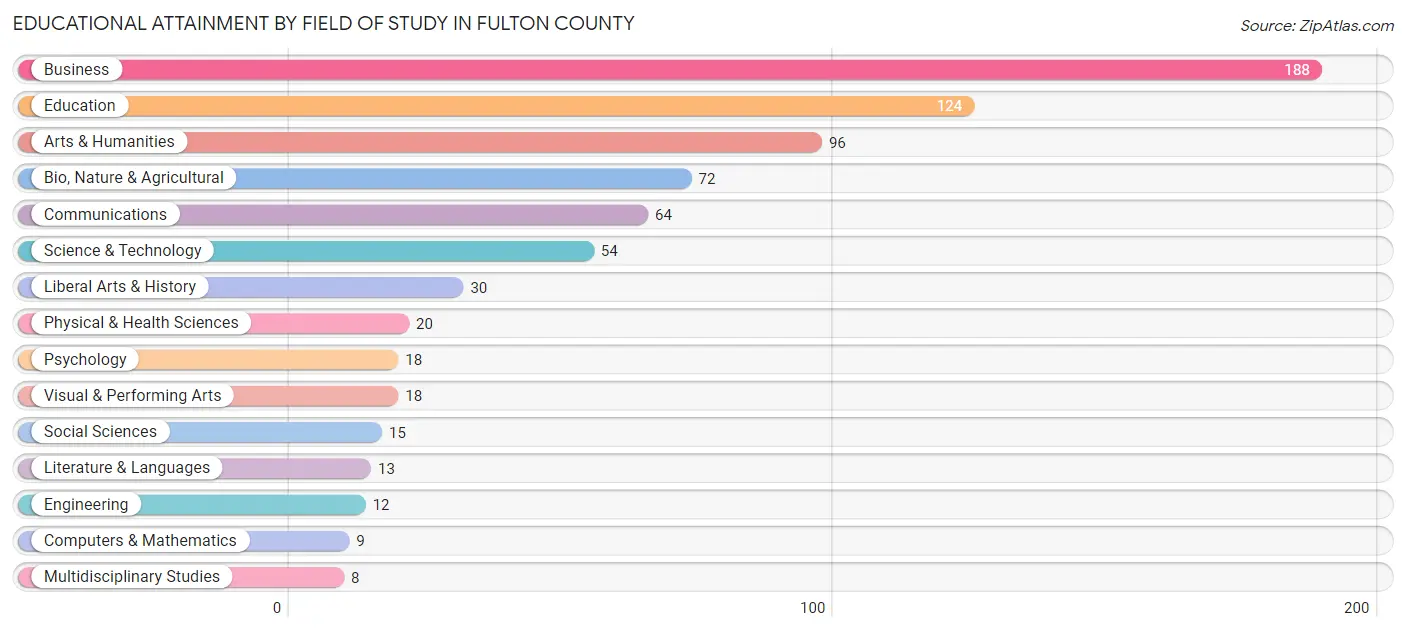
| Field of Study | # Graduates | % Graduates |
| Computers & Mathematics | 9 | 1.2% |
| Bio, Nature & Agricultural | 72 | 9.7% |
| Physical & Health Sciences | 20 | 2.7% |
| Psychology | 18 | 2.4% |
| Social Sciences | 15 | 2.0% |
| Engineering | 12 | 1.6% |
| Multidisciplinary Studies | 8 | 1.1% |
| Science & Technology | 54 | 7.3% |
| Business | 188 | 25.4% |
| Education | 124 | 16.7% |
| Literature & Languages | 13 | 1.8% |
| Liberal Arts & History | 30 | 4.1% |
| Visual & Performing Arts | 18 | 2.4% |
| Communications | 64 | 8.6% |
| Arts & Humanities | 96 | 13.0% |
| Total | 741 | 100.0% |
Transportation & Commute in Fulton County
Vehicle Availability by Sex in Fulton County
The most prevalent vehicle ownership categories in Fulton County are males with 2 vehicles (363, accounting for 34.8%) and females with 2 vehicles (301, making up 32.5%).
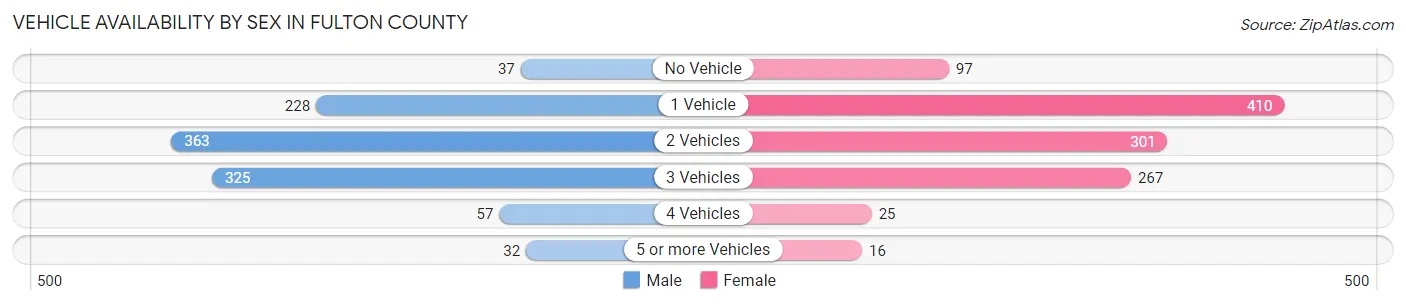
| Vehicles Available | Male | Female |
| No Vehicle | 37 (3.5%) | 97 (8.7%) |
| 1 Vehicle | 228 (21.9%) | 410 (36.7%) |
| 2 Vehicles | 363 (34.8%) | 301 (27.0%) |
| 3 Vehicles | 325 (31.2%) | 267 (23.9%) |
| 4 Vehicles | 57 (5.5%) | 25 (2.2%) |
| 5 or more Vehicles | 32 (3.1%) | 16 (1.4%) |
| Total | 1,042 (100.0%) | 1,116 (100.0%) |
Commute Time in Fulton County
The most frequently occuring commute durations in Fulton County are 10 to 14 minutes (444 commuters, 21.5%), 5 to 9 minutes (349 commuters, 16.9%), and 30 to 34 minutes (288 commuters, 13.9%).
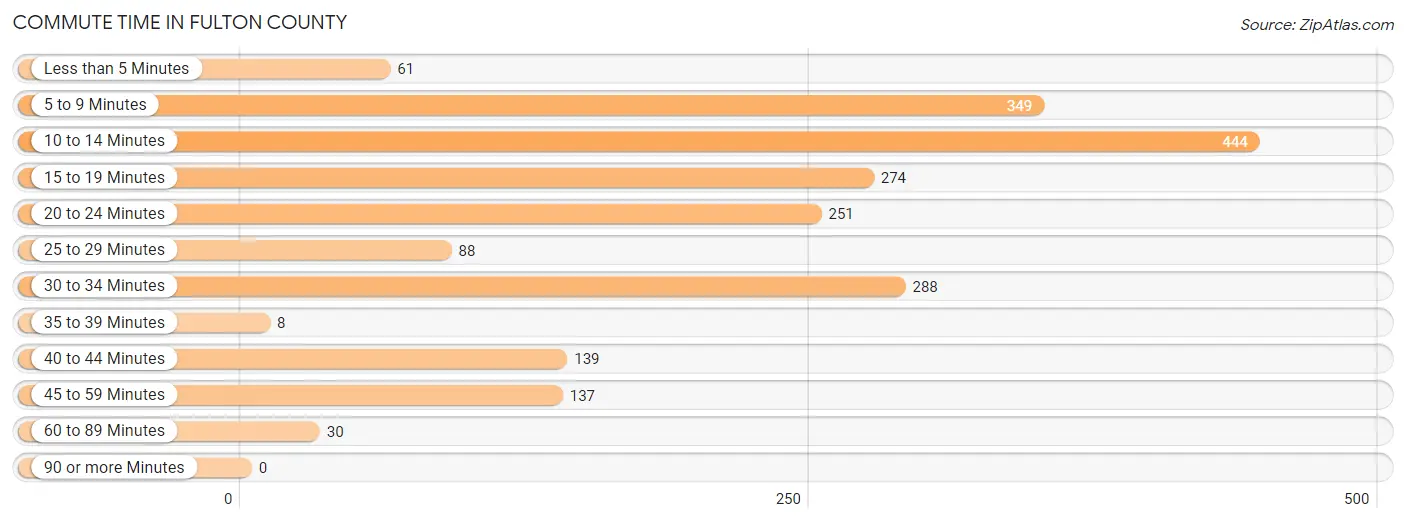
| Commute Time | # Commuters | % Commuters |
| Less than 5 Minutes | 61 | 2.9% |
| 5 to 9 Minutes | 349 | 16.9% |
| 10 to 14 Minutes | 444 | 21.5% |
| 15 to 19 Minutes | 274 | 13.2% |
| 20 to 24 Minutes | 251 | 12.1% |
| 25 to 29 Minutes | 88 | 4.3% |
| 30 to 34 Minutes | 288 | 13.9% |
| 35 to 39 Minutes | 8 | 0.4% |
| 40 to 44 Minutes | 139 | 6.7% |
| 45 to 59 Minutes | 137 | 6.6% |
| 60 to 89 Minutes | 30 | 1.5% |
| 90 or more Minutes | 0 | 0.0% |
Commute Time by Sex in Fulton County
The most common commute times in Fulton County are 15 to 19 minutes (212 commuters, 21.2%) for males and 10 to 14 minutes (260 commuters, 24.3%) for females.
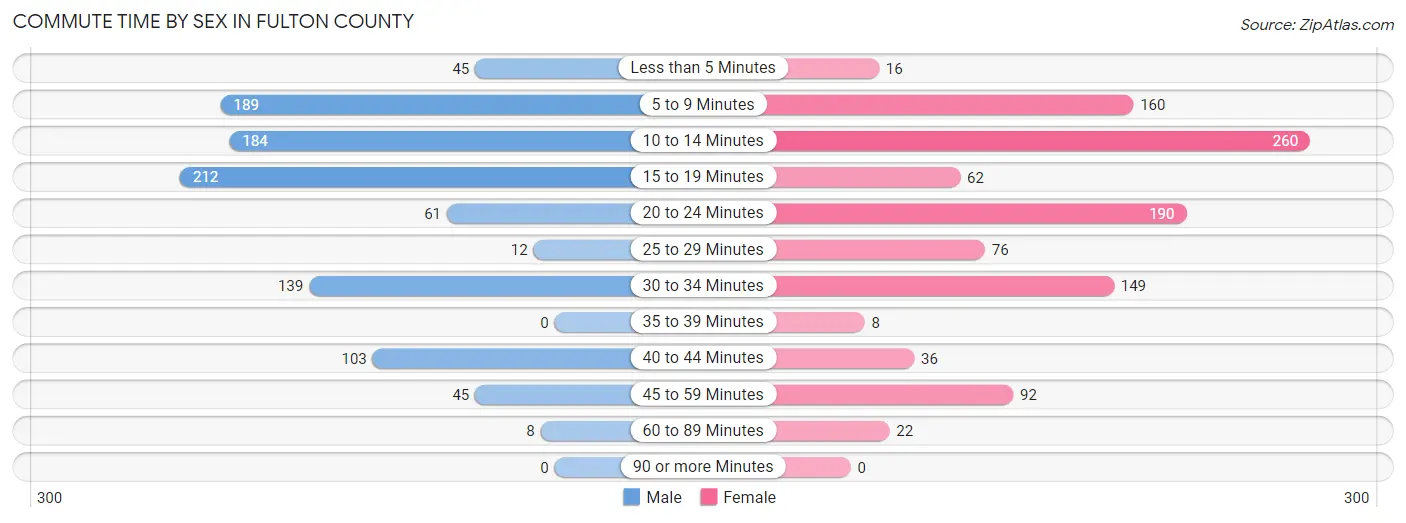
| Commute Time | Male | Female |
| Less than 5 Minutes | 45 (4.5%) | 16 (1.5%) |
| 5 to 9 Minutes | 189 (18.9%) | 160 (14.9%) |
| 10 to 14 Minutes | 184 (18.4%) | 260 (24.3%) |
| 15 to 19 Minutes | 212 (21.2%) | 62 (5.8%) |
| 20 to 24 Minutes | 61 (6.1%) | 190 (17.7%) |
| 25 to 29 Minutes | 12 (1.2%) | 76 (7.1%) |
| 30 to 34 Minutes | 139 (13.9%) | 149 (13.9%) |
| 35 to 39 Minutes | 0 (0.0%) | 8 (0.7%) |
| 40 to 44 Minutes | 103 (10.3%) | 36 (3.4%) |
| 45 to 59 Minutes | 45 (4.5%) | 92 (8.6%) |
| 60 to 89 Minutes | 8 (0.8%) | 22 (2.1%) |
| 90 or more Minutes | 0 (0.0%) | 0 (0.0%) |
Time of Departure to Work by Sex in Fulton County
The most frequent times of departure to work in Fulton County are 7:00 AM to 7:29 AM (216, 21.6%) for males and 7:00 AM to 7:29 AM (237, 22.1%) for females.
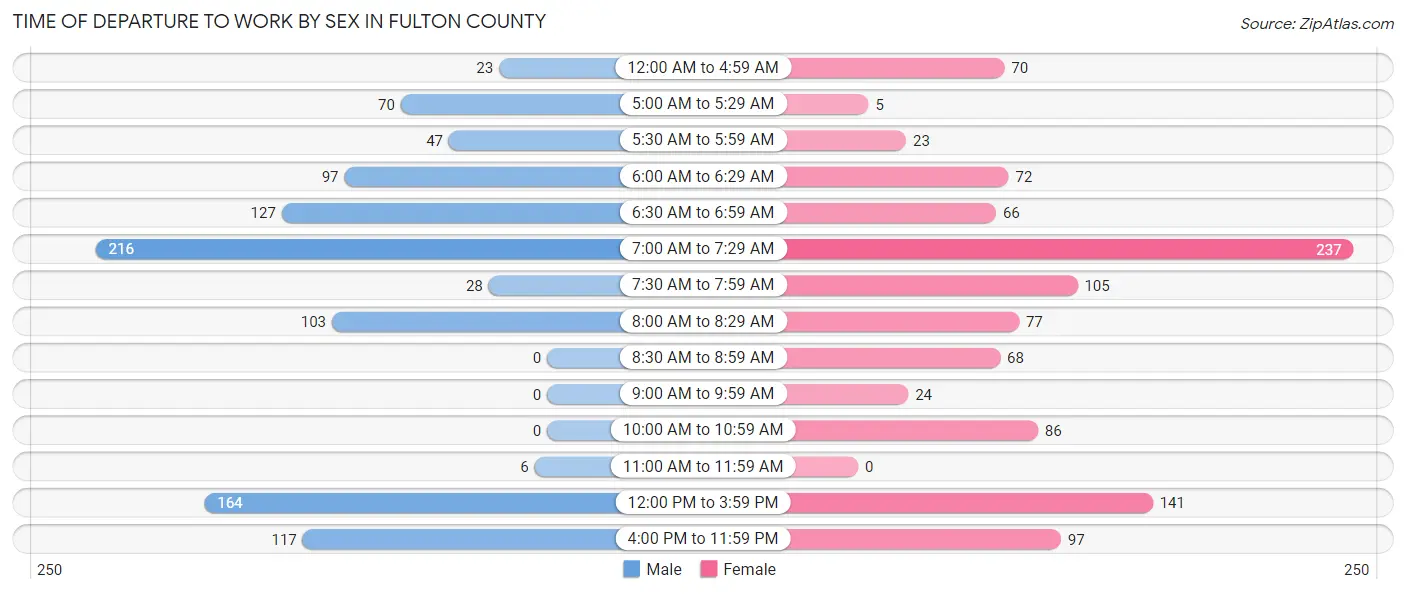
| Time of Departure | Male | Female |
| 12:00 AM to 4:59 AM | 23 (2.3%) | 70 (6.5%) |
| 5:00 AM to 5:29 AM | 70 (7.0%) | 5 (0.5%) |
| 5:30 AM to 5:59 AM | 47 (4.7%) | 23 (2.1%) |
| 6:00 AM to 6:29 AM | 97 (9.7%) | 72 (6.7%) |
| 6:30 AM to 6:59 AM | 127 (12.7%) | 66 (6.2%) |
| 7:00 AM to 7:29 AM | 216 (21.6%) | 237 (22.1%) |
| 7:30 AM to 7:59 AM | 28 (2.8%) | 105 (9.8%) |
| 8:00 AM to 8:29 AM | 103 (10.3%) | 77 (7.2%) |
| 8:30 AM to 8:59 AM | 0 (0.0%) | 68 (6.4%) |
| 9:00 AM to 9:59 AM | 0 (0.0%) | 24 (2.2%) |
| 10:00 AM to 10:59 AM | 0 (0.0%) | 86 (8.0%) |
| 11:00 AM to 11:59 AM | 6 (0.6%) | 0 (0.0%) |
| 12:00 PM to 3:59 PM | 164 (16.4%) | 141 (13.2%) |
| 4:00 PM to 11:59 PM | 117 (11.7%) | 97 (9.1%) |
| Total | 998 (100.0%) | 1,071 (100.0%) |
Housing Occupancy in Fulton County
Occupancy by Ownership in Fulton County
Of the total 2,378 dwellings in Fulton County, owner-occupied units account for 1,525 (64.1%), while renter-occupied units make up 853 (35.9%).
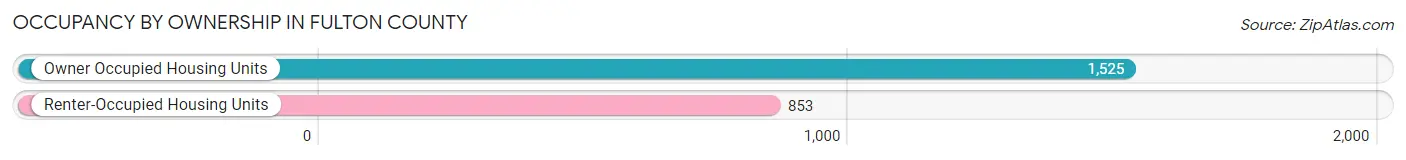
| Occupancy | # Housing Units | % Housing Units |
| Owner Occupied Housing Units | 1,525 | 64.1% |
| Renter-Occupied Housing Units | 853 | 35.9% |
| Total Occupied Housing Units | 2,378 | 100.0% |
Occupancy by Household Size in Fulton County
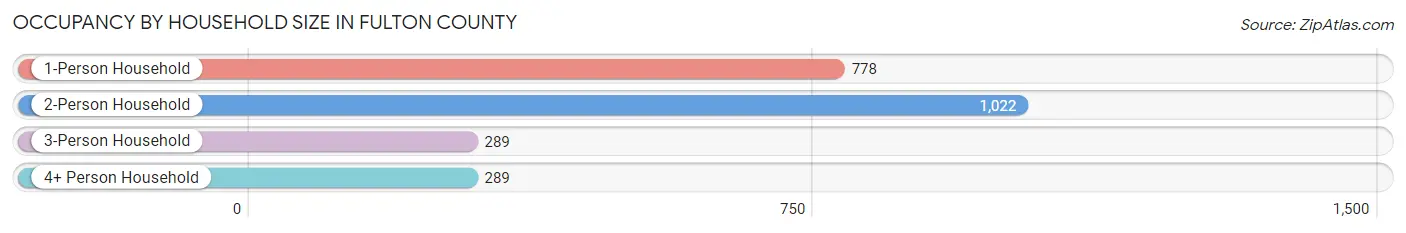
| Household Size | # Housing Units | % Housing Units |
| 1-Person Household | 778 | 32.7% |
| 2-Person Household | 1,022 | 43.0% |
| 3-Person Household | 289 | 12.1% |
| 4+ Person Household | 289 | 12.1% |
| Total Housing Units | 2,378 | 100.0% |
Occupancy by Ownership by Household Size in Fulton County
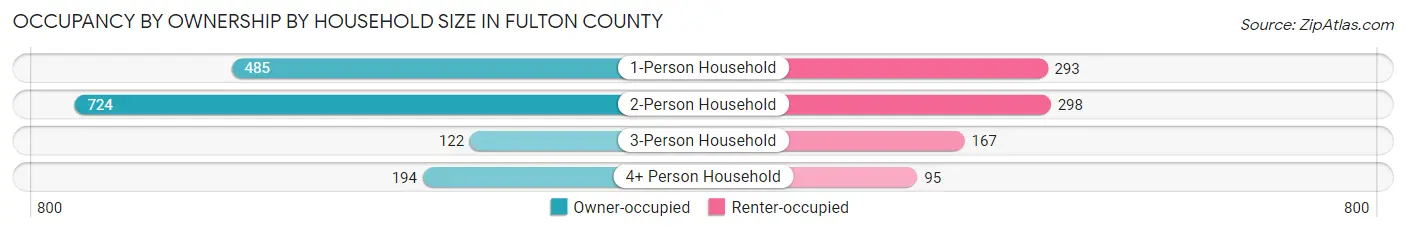
| Household Size | Owner-occupied | Renter-occupied |
| 1-Person Household | 485 (62.3%) | 293 (37.7%) |
| 2-Person Household | 724 (70.8%) | 298 (29.2%) |
| 3-Person Household | 122 (42.2%) | 167 (57.8%) |
| 4+ Person Household | 194 (67.1%) | 95 (32.9%) |
| Total Housing Units | 1,525 (64.1%) | 853 (35.9%) |
Occupancy by Educational Attainment in Fulton County
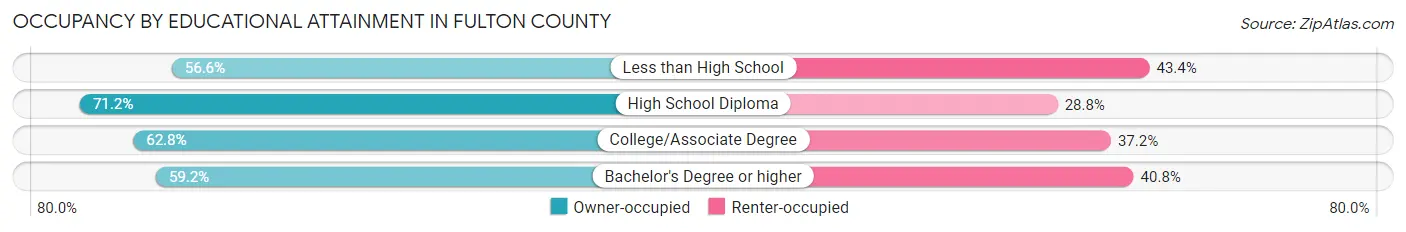
| Household Size | Owner-occupied | Renter-occupied |
| Less than High School | 226 (56.6%) | 173 (43.4%) |
| High School Diploma | 596 (71.2%) | 241 (28.8%) |
| College/Associate Degree | 477 (62.8%) | 283 (37.2%) |
| Bachelor's Degree or higher | 226 (59.2%) | 156 (40.8%) |
Occupancy by Age of Householder in Fulton County
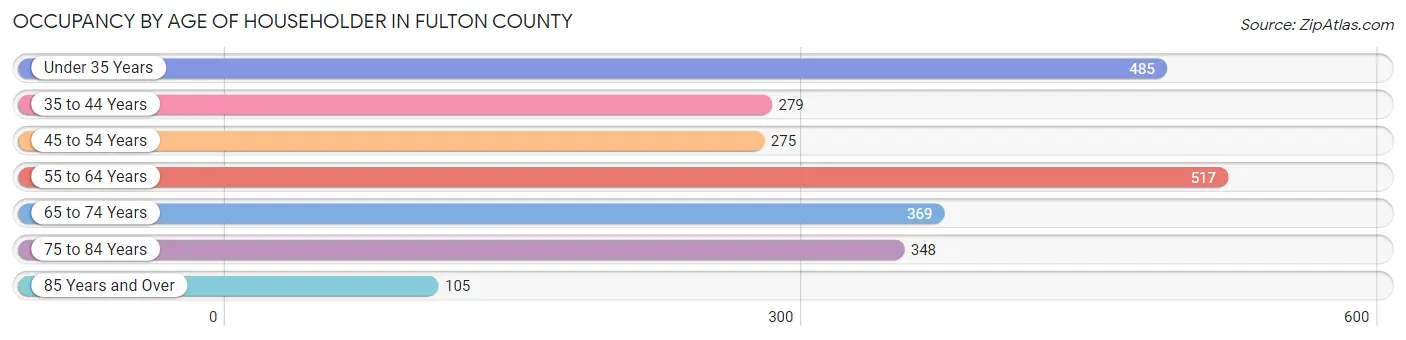
| Age Bracket | # Households | % Households |
| Under 35 Years | 485 | 20.4% |
| 35 to 44 Years | 279 | 11.7% |
| 45 to 54 Years | 275 | 11.6% |
| 55 to 64 Years | 517 | 21.7% |
| 65 to 74 Years | 369 | 15.5% |
| 75 to 84 Years | 348 | 14.6% |
| 85 Years and Over | 105 | 4.4% |
| Total | 2,378 | 100.0% |
Housing Finances in Fulton County
Median Income by Occupancy in Fulton County
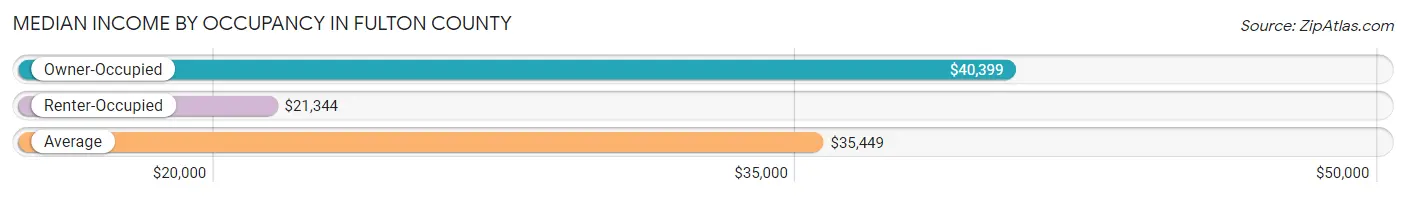
| Occupancy Type | # Households | Median Income |
| Owner-Occupied | 1,525 (64.1%) | $40,399 |
| Renter-Occupied | 853 (35.9%) | $21,344 |
| Average | 2,378 (100.0%) | $35,449 |
Occupancy by Householder Income Bracket in Fulton County
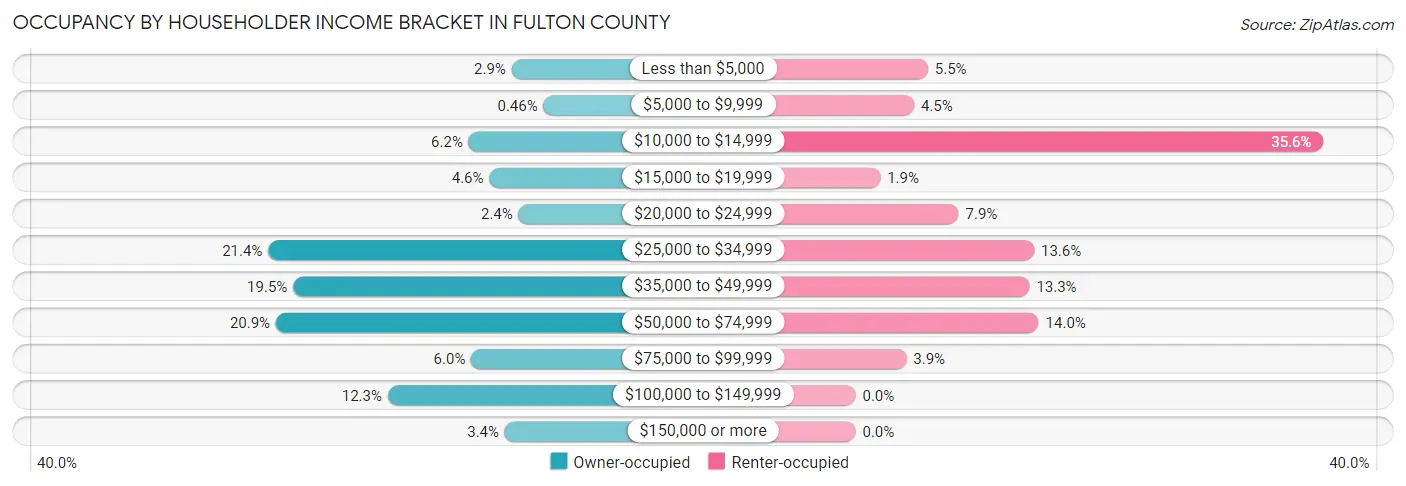
| Income Bracket | Owner-occupied | Renter-occupied |
| Less than $5,000 | 44 (2.9%) | 47 (5.5%) |
| $5,000 to $9,999 | 7 (0.5%) | 38 (4.4%) |
| $10,000 to $14,999 | 94 (6.2%) | 304 (35.6%) |
| $15,000 to $19,999 | 70 (4.6%) | 16 (1.9%) |
| $20,000 to $24,999 | 36 (2.4%) | 67 (7.9%) |
| $25,000 to $34,999 | 327 (21.4%) | 116 (13.6%) |
| $35,000 to $49,999 | 298 (19.5%) | 113 (13.3%) |
| $50,000 to $74,999 | 318 (20.8%) | 119 (14.0%) |
| $75,000 to $99,999 | 91 (6.0%) | 33 (3.9%) |
| $100,000 to $149,999 | 188 (12.3%) | 0 (0.0%) |
| $150,000 or more | 52 (3.4%) | 0 (0.0%) |
| Total | 1,525 (100.0%) | 853 (100.0%) |
Monthly Housing Cost Tiers in Fulton County
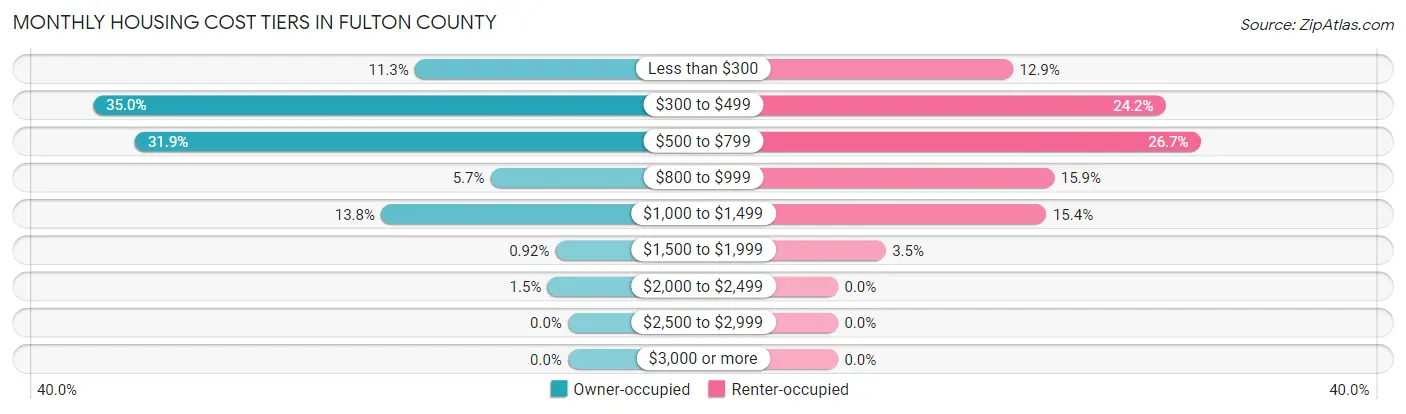
| Monthly Cost | Owner-occupied | Renter-occupied |
| Less than $300 | 172 (11.3%) | 110 (12.9%) |
| $300 to $499 | 533 (34.9%) | 206 (24.1%) |
| $500 to $799 | 486 (31.9%) | 228 (26.7%) |
| $800 to $999 | 87 (5.7%) | 136 (15.9%) |
| $1,000 to $1,499 | 210 (13.8%) | 131 (15.4%) |
| $1,500 to $1,999 | 14 (0.9%) | 30 (3.5%) |
| $2,000 to $2,499 | 23 (1.5%) | 0 (0.0%) |
| $2,500 to $2,999 | 0 (0.0%) | 0 (0.0%) |
| $3,000 or more | 0 (0.0%) | 0 (0.0%) |
| Total | 1,525 (100.0%) | 853 (100.0%) |
Physical Housing Characteristics in Fulton County
Housing Structures in Fulton County
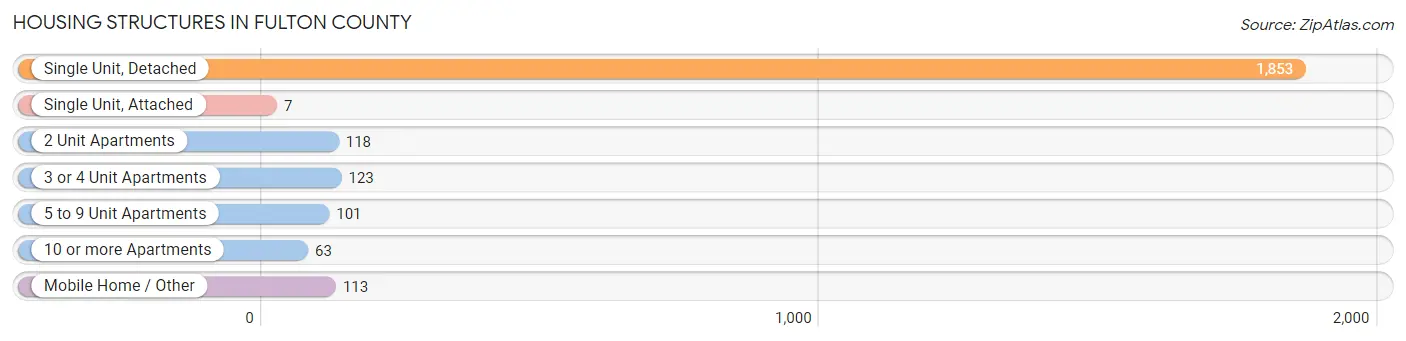
| Structure Type | # Housing Units | % Housing Units |
| Single Unit, Detached | 1,853 | 77.9% |
| Single Unit, Attached | 7 | 0.3% |
| 2 Unit Apartments | 118 | 5.0% |
| 3 or 4 Unit Apartments | 123 | 5.2% |
| 5 to 9 Unit Apartments | 101 | 4.3% |
| 10 or more Apartments | 63 | 2.6% |
| Mobile Home / Other | 113 | 4.8% |
| Total | 2,378 | 100.0% |
Housing Structures by Occupancy in Fulton County
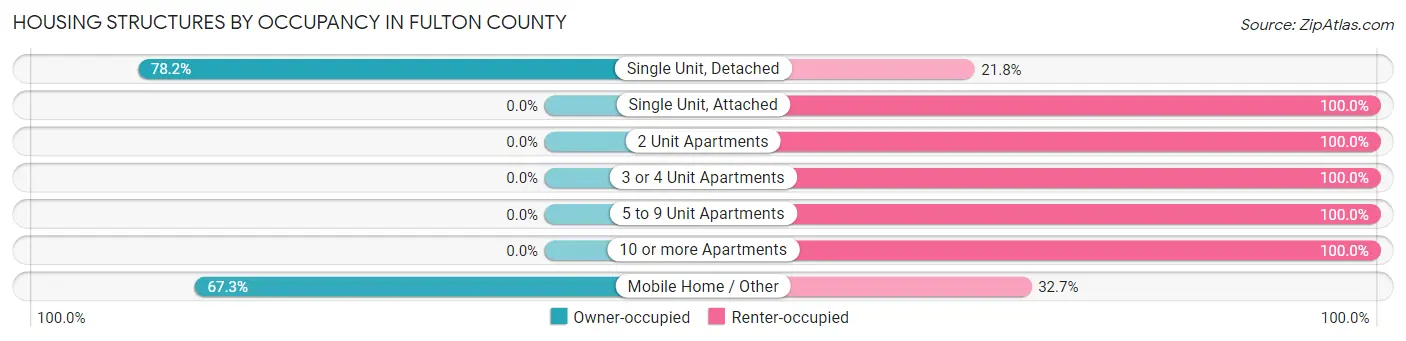
| Structure Type | Owner-occupied | Renter-occupied |
| Single Unit, Detached | 1,449 (78.2%) | 404 (21.8%) |
| Single Unit, Attached | 0 (0.0%) | 7 (100.0%) |
| 2 Unit Apartments | 0 (0.0%) | 118 (100.0%) |
| 3 or 4 Unit Apartments | 0 (0.0%) | 123 (100.0%) |
| 5 to 9 Unit Apartments | 0 (0.0%) | 101 (100.0%) |
| 10 or more Apartments | 0 (0.0%) | 63 (100.0%) |
| Mobile Home / Other | 76 (67.3%) | 37 (32.7%) |
| Total | 1,525 (64.1%) | 853 (35.9%) |
Housing Structures by Number of Rooms in Fulton County
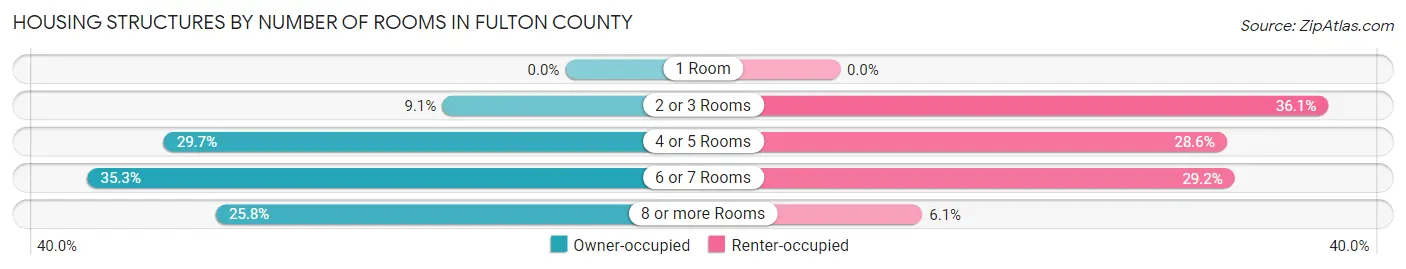
| Number of Rooms | Owner-occupied | Renter-occupied |
| 1 Room | 0 (0.0%) | 0 (0.0%) |
| 2 or 3 Rooms | 139 (9.1%) | 308 (36.1%) |
| 4 or 5 Rooms | 453 (29.7%) | 244 (28.6%) |
| 6 or 7 Rooms | 539 (35.3%) | 249 (29.2%) |
| 8 or more Rooms | 394 (25.8%) | 52 (6.1%) |
| Total | 1,525 (100.0%) | 853 (100.0%) |
Housing Structure by Heating Type in Fulton County
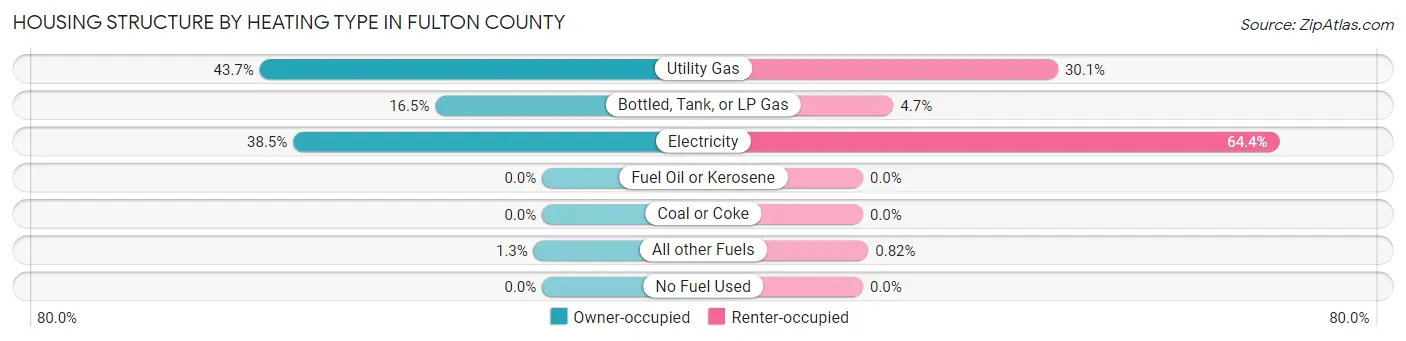
| Heating Type | Owner-occupied | Renter-occupied |
| Utility Gas | 666 (43.7%) | 257 (30.1%) |
| Bottled, Tank, or LP Gas | 252 (16.5%) | 40 (4.7%) |
| Electricity | 587 (38.5%) | 549 (64.4%) |
| Fuel Oil or Kerosene | 0 (0.0%) | 0 (0.0%) |
| Coal or Coke | 0 (0.0%) | 0 (0.0%) |
| All other Fuels | 20 (1.3%) | 7 (0.8%) |
| No Fuel Used | 0 (0.0%) | 0 (0.0%) |
| Total | 1,525 (100.0%) | 853 (100.0%) |
Household Vehicle Usage in Fulton County
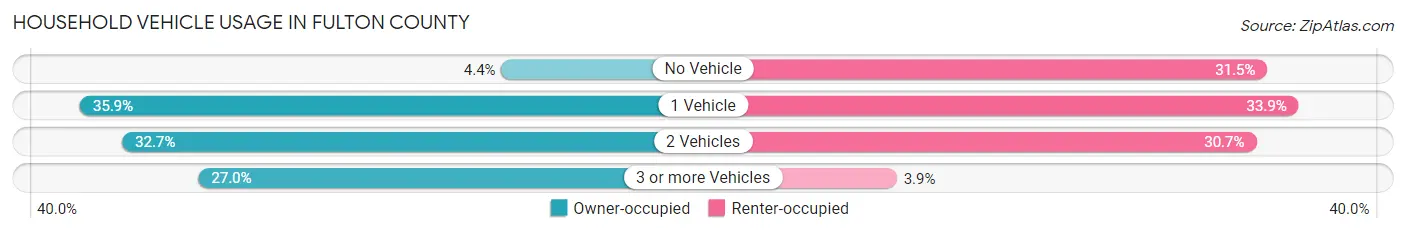
| Vehicles per Household | Owner-occupied | Renter-occupied |
| No Vehicle | 67 (4.4%) | 269 (31.5%) |
| 1 Vehicle | 547 (35.9%) | 289 (33.9%) |
| 2 Vehicles | 499 (32.7%) | 262 (30.7%) |
| 3 or more Vehicles | 412 (27.0%) | 33 (3.9%) |
| Total | 1,525 (100.0%) | 853 (100.0%) |
Real Estate & Mortgages in Fulton County
Real Estate and Mortgage Overview in Fulton County
| Characteristic | Without Mortgage | With Mortgage |
| Housing Units | 1,092 | 433 |
| Median Property Value | $67,400 | $148,400 |
| Median Household Income | $35,386 | $33 |
| Monthly Housing Costs | $413 | $0 |
| Real Estate Taxes | $456 | $5 |
Property Value by Mortgage Status in Fulton County
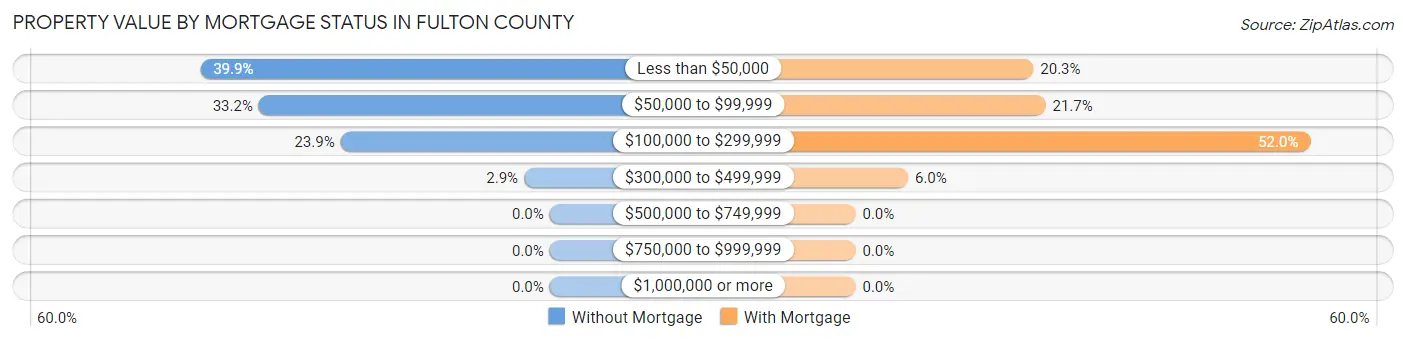
| Property Value | Without Mortgage | With Mortgage |
| Less than $50,000 | 436 (39.9%) | 88 (20.3%) |
| $50,000 to $99,999 | 363 (33.2%) | 94 (21.7%) |
| $100,000 to $299,999 | 261 (23.9%) | 225 (52.0%) |
| $300,000 to $499,999 | 32 (2.9%) | 26 (6.0%) |
| $500,000 to $749,999 | 0 (0.0%) | 0 (0.0%) |
| $750,000 to $999,999 | 0 (0.0%) | 0 (0.0%) |
| $1,000,000 or more | 0 (0.0%) | 0 (0.0%) |
| Total | 1,092 (100.0%) | 433 (100.0%) |
Household Income by Mortgage Status in Fulton County
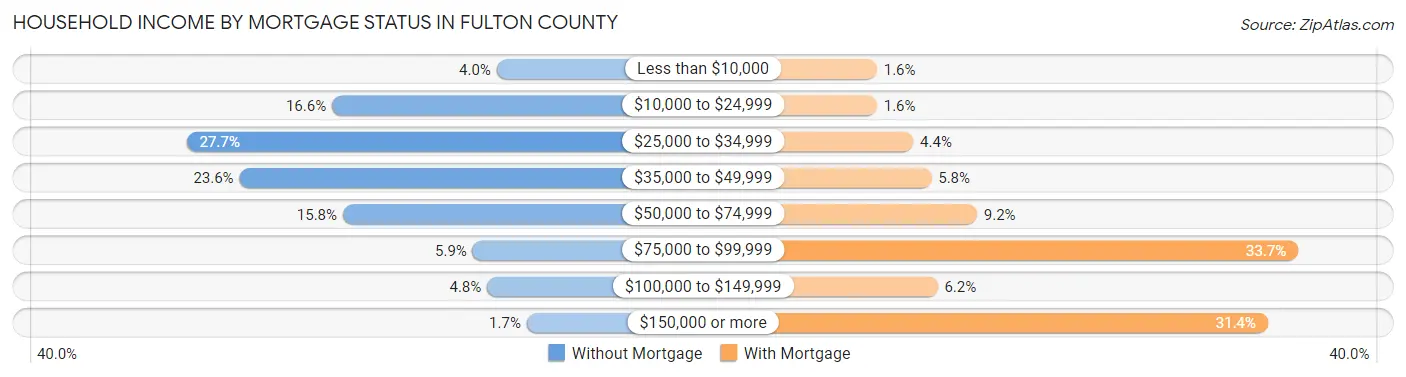
| Household Income | Without Mortgage | With Mortgage |
| Less than $10,000 | 44 (4.0%) | 7 (1.6%) |
| $10,000 to $24,999 | 181 (16.6%) | 7 (1.6%) |
| $25,000 to $34,999 | 302 (27.7%) | 19 (4.4%) |
| $35,000 to $49,999 | 258 (23.6%) | 25 (5.8%) |
| $50,000 to $74,999 | 172 (15.8%) | 40 (9.2%) |
| $75,000 to $99,999 | 64 (5.9%) | 146 (33.7%) |
| $100,000 to $149,999 | 52 (4.8%) | 27 (6.2%) |
| $150,000 or more | 19 (1.7%) | 136 (31.4%) |
| Total | 1,092 (100.0%) | 433 (100.0%) |
Property Value to Household Income Ratio in Fulton County
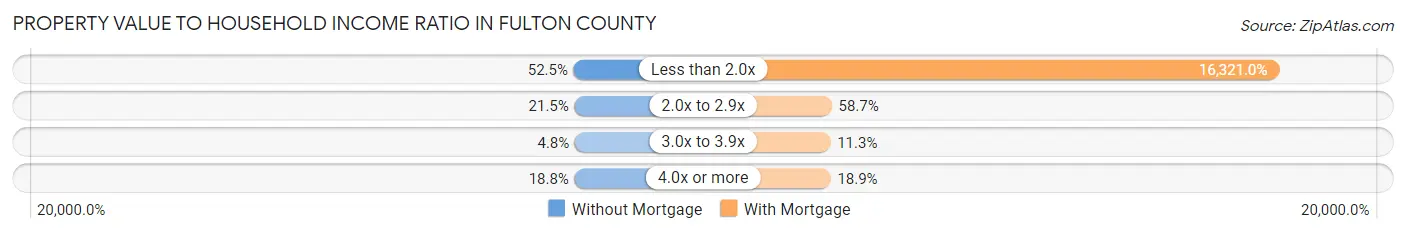
| Value-to-Income Ratio | Without Mortgage | With Mortgage |
| Less than 2.0x | 573 (52.5%) | 70,670 (16,321.0%) |
| 2.0x to 2.9x | 235 (21.5%) | 254 (58.7%) |
| 3.0x to 3.9x | 52 (4.8%) | 49 (11.3%) |
| 4.0x or more | 205 (18.8%) | 82 (18.9%) |
| Total | 1,092 (100.0%) | 433 (100.0%) |
Real Estate Taxes by Mortgage Status in Fulton County
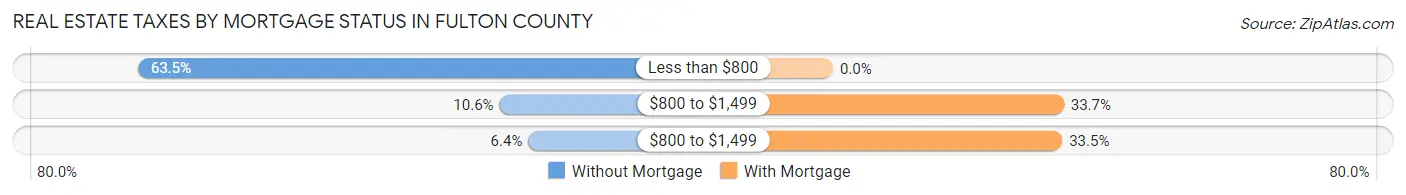
| Property Taxes | Without Mortgage | With Mortgage |
| Less than $800 | 693 (63.5%) | 0 (0.0%) |
| $800 to $1,499 | 116 (10.6%) | 146 (33.7%) |
| $800 to $1,499 | 70 (6.4%) | 145 (33.5%) |
| Total | 1,092 (100.0%) | 433 (100.0%) |
Health & Disability in Fulton County
Health Insurance Coverage by Age in Fulton County
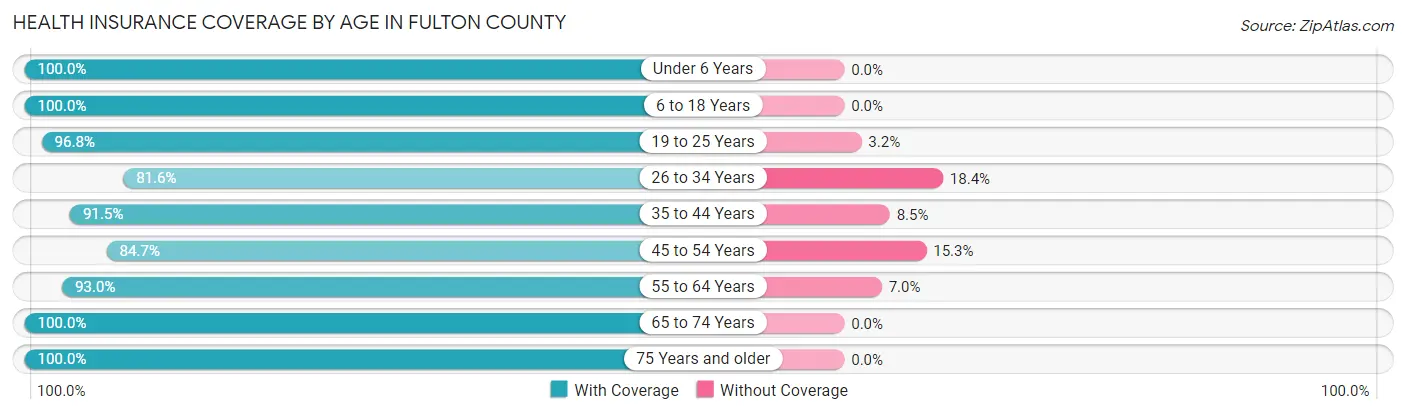
| Age Bracket | With Coverage | Without Coverage |
| Under 6 Years | 384 (100.0%) | 0 (0.0%) |
| 6 to 18 Years | 997 (100.0%) | 0 (0.0%) |
| 19 to 25 Years | 546 (96.8%) | 18 (3.2%) |
| 26 to 34 Years | 617 (81.6%) | 139 (18.4%) |
| 35 to 44 Years | 486 (91.5%) | 45 (8.5%) |
| 45 to 54 Years | 482 (84.7%) | 87 (15.3%) |
| 55 to 64 Years | 799 (93.0%) | 60 (7.0%) |
| 65 to 74 Years | 741 (100.0%) | 0 (0.0%) |
| 75 Years and older | 576 (100.0%) | 0 (0.0%) |
| Total | 5,628 (94.2%) | 349 (5.8%) |
Health Insurance Coverage by Citizenship Status in Fulton County
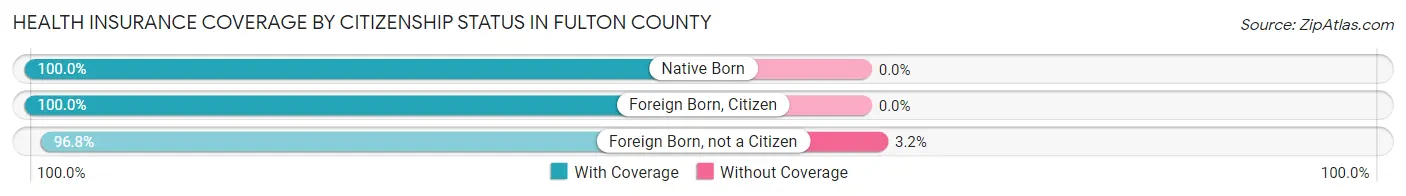
| Citizenship Status | With Coverage | Without Coverage |
| Native Born | 384 (100.0%) | 0 (0.0%) |
| Foreign Born, Citizen | 997 (100.0%) | 0 (0.0%) |
| Foreign Born, not a Citizen | 546 (96.8%) | 18 (3.2%) |
Health Insurance Coverage by Household Income in Fulton County
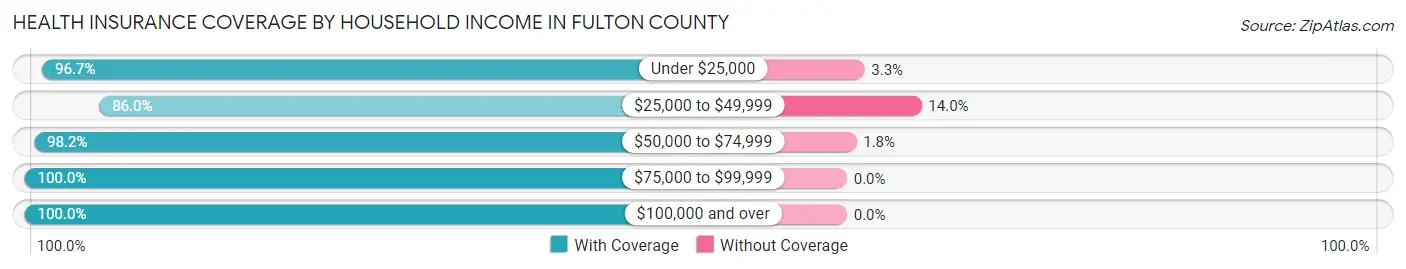
| Household Income | With Coverage | Without Coverage |
| Under $25,000 | 1,441 (96.7%) | 49 (3.3%) |
| $25,000 to $49,999 | 1,704 (86.0%) | 277 (14.0%) |
| $50,000 to $74,999 | 1,266 (98.2%) | 23 (1.8%) |
| $75,000 to $99,999 | 354 (100.0%) | 0 (0.0%) |
| $100,000 and over | 863 (100.0%) | 0 (0.0%) |
Public vs Private Health Insurance Coverage by Age in Fulton County
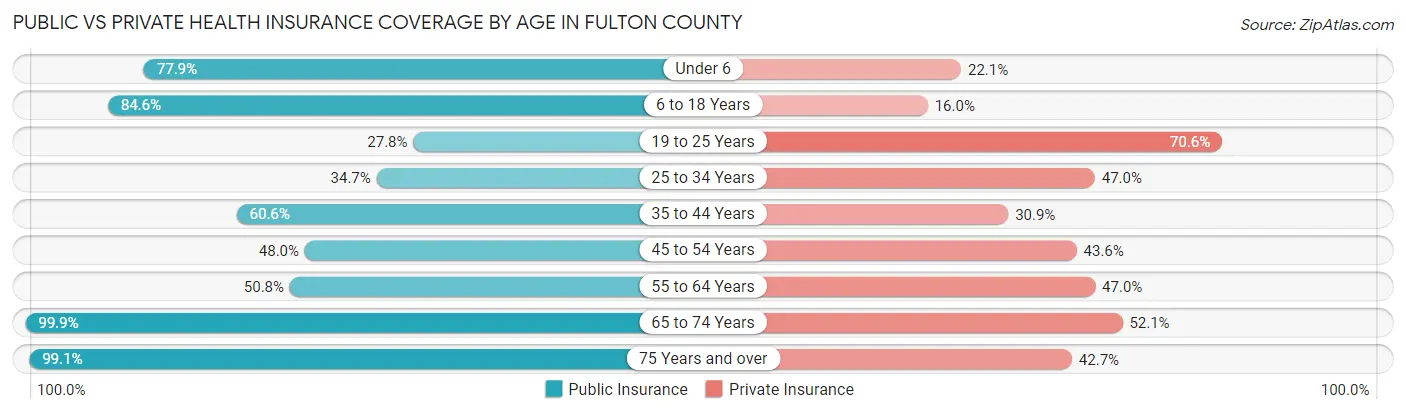
| Age Bracket | Public Insurance | Private Insurance |
| Under 6 | 299 (77.9%) | 85 (22.1%) |
| 6 to 18 Years | 843 (84.6%) | 159 (16.0%) |
| 19 to 25 Years | 157 (27.8%) | 398 (70.6%) |
| 25 to 34 Years | 262 (34.7%) | 355 (47.0%) |
| 35 to 44 Years | 322 (60.6%) | 164 (30.9%) |
| 45 to 54 Years | 273 (48.0%) | 248 (43.6%) |
| 55 to 64 Years | 436 (50.8%) | 404 (47.0%) |
| 65 to 74 Years | 740 (99.9%) | 386 (52.1%) |
| 75 Years and over | 571 (99.1%) | 246 (42.7%) |
| Total | 3,903 (65.3%) | 2,445 (40.9%) |
Disability Status by Sex by Age in Fulton County
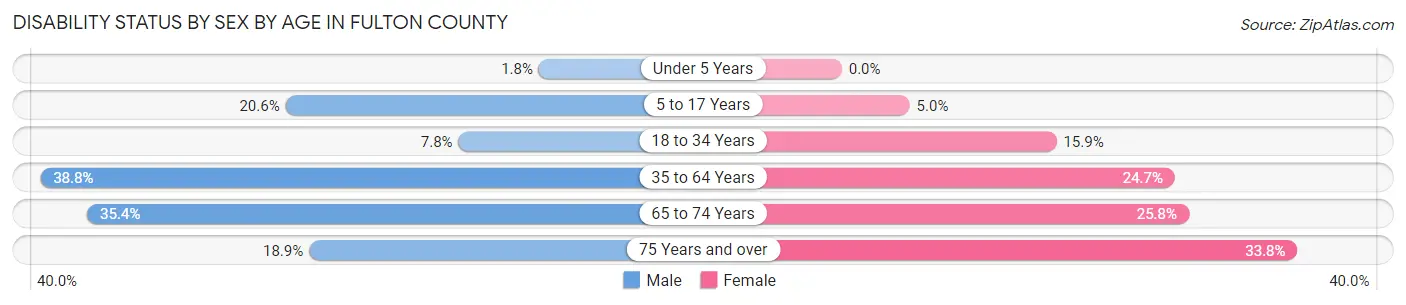
| Age Bracket | Male | Female |
| Under 5 Years | 3 (1.8%) | 0 (0.0%) |
| 5 to 17 Years | 131 (20.6%) | 21 (5.0%) |
| 18 to 34 Years | 53 (7.8%) | 102 (15.9%) |
| 35 to 64 Years | 343 (38.8%) | 266 (24.7%) |
| 65 to 74 Years | 122 (35.4%) | 102 (25.8%) |
| 75 Years and over | 44 (18.9%) | 116 (33.8%) |
Disability Class by Sex by Age in Fulton County
Disability Class: Hearing Difficulty
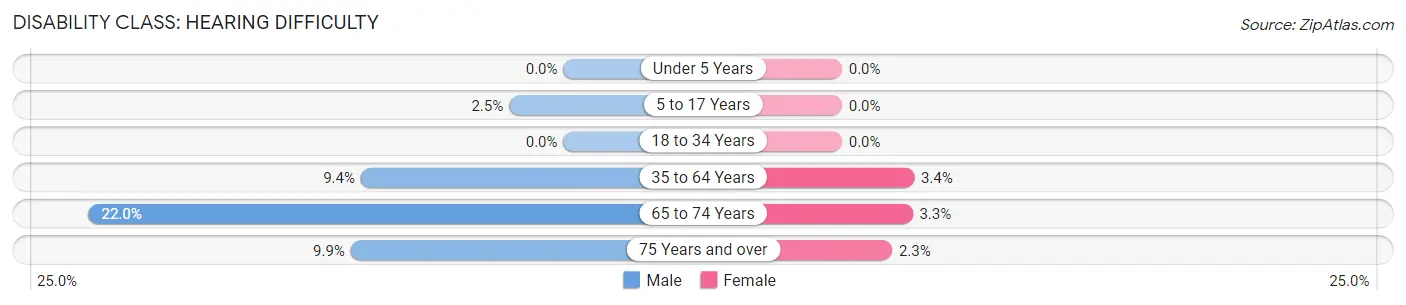
| Age Bracket | Male | Female |
| Under 5 Years | 0 (0.0%) | 0 (0.0%) |
| 5 to 17 Years | 16 (2.5%) | 0 (0.0%) |
| 18 to 34 Years | 0 (0.0%) | 0 (0.0%) |
| 35 to 64 Years | 83 (9.4%) | 36 (3.4%) |
| 65 to 74 Years | 76 (22.0%) | 13 (3.3%) |
| 75 Years and over | 23 (9.9%) | 8 (2.3%) |
Disability Class: Vision Difficulty
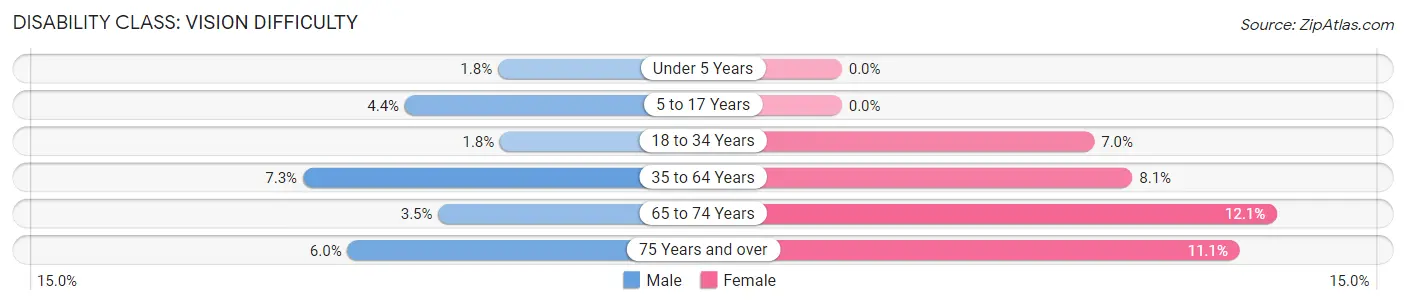
| Age Bracket | Male | Female |
| Under 5 Years | 3 (1.8%) | 0 (0.0%) |
| 5 to 17 Years | 28 (4.4%) | 0 (0.0%) |
| 18 to 34 Years | 12 (1.8%) | 45 (7.0%) |
| 35 to 64 Years | 64 (7.2%) | 87 (8.1%) |
| 65 to 74 Years | 12 (3.5%) | 48 (12.1%) |
| 75 Years and over | 14 (6.0%) | 38 (11.1%) |
Disability Class: Cognitive Difficulty
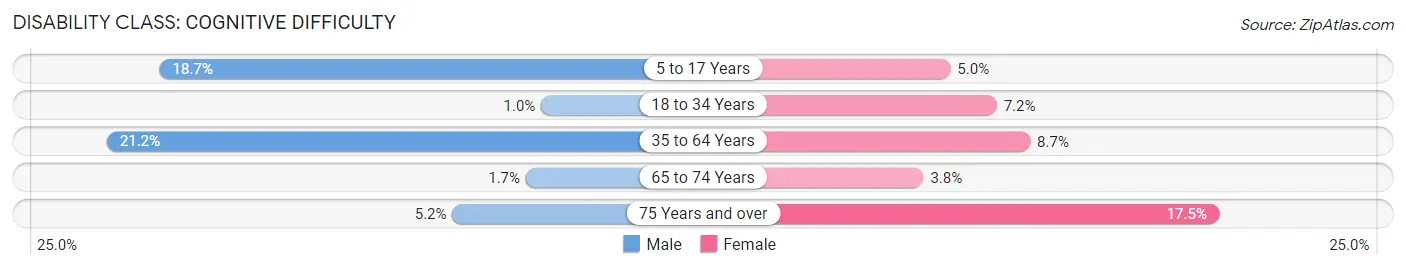
| Age Bracket | Male | Female |
| 5 to 17 Years | 119 (18.7%) | 21 (5.0%) |
| 18 to 34 Years | 7 (1.0%) | 46 (7.2%) |
| 35 to 64 Years | 187 (21.2%) | 94 (8.7%) |
| 65 to 74 Years | 6 (1.7%) | 15 (3.8%) |
| 75 Years and over | 12 (5.1%) | 60 (17.5%) |
Disability Class: Ambulatory Difficulty
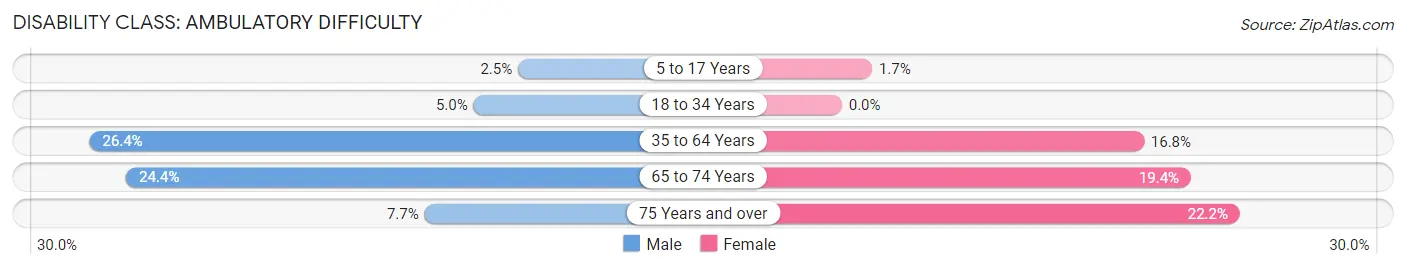
| Age Bracket | Male | Female |
| 5 to 17 Years | 16 (2.5%) | 7 (1.7%) |
| 18 to 34 Years | 34 (5.0%) | 0 (0.0%) |
| 35 to 64 Years | 233 (26.4%) | 181 (16.8%) |
| 65 to 74 Years | 84 (24.3%) | 77 (19.4%) |
| 75 Years and over | 18 (7.7%) | 76 (22.2%) |
Disability Class: Self-Care Difficulty
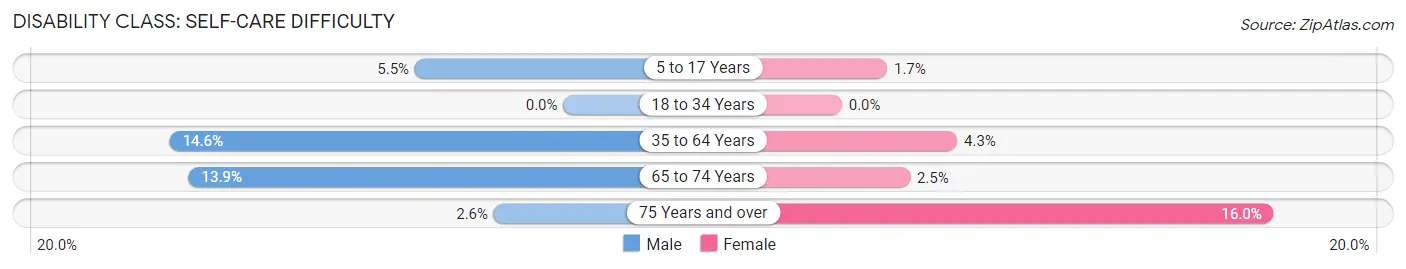
| Age Bracket | Male | Female |
| 5 to 17 Years | 35 (5.5%) | 7 (1.7%) |
| 18 to 34 Years | 0 (0.0%) | 0 (0.0%) |
| 35 to 64 Years | 129 (14.6%) | 46 (4.3%) |
| 65 to 74 Years | 48 (13.9%) | 10 (2.5%) |
| 75 Years and over | 6 (2.6%) | 55 (16.0%) |
Technology Access in Fulton County
Computing Device Access in Fulton County
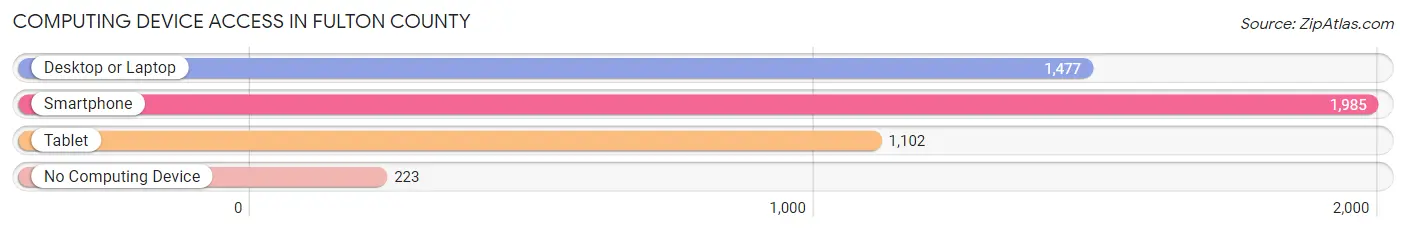
| Device Type | # Households | % Households |
| Desktop or Laptop | 1,477 | 62.1% |
| Smartphone | 1,985 | 83.5% |
| Tablet | 1,102 | 46.3% |
| No Computing Device | 223 | 9.4% |
| Total | 2,378 | 100.0% |
Internet Access in Fulton County
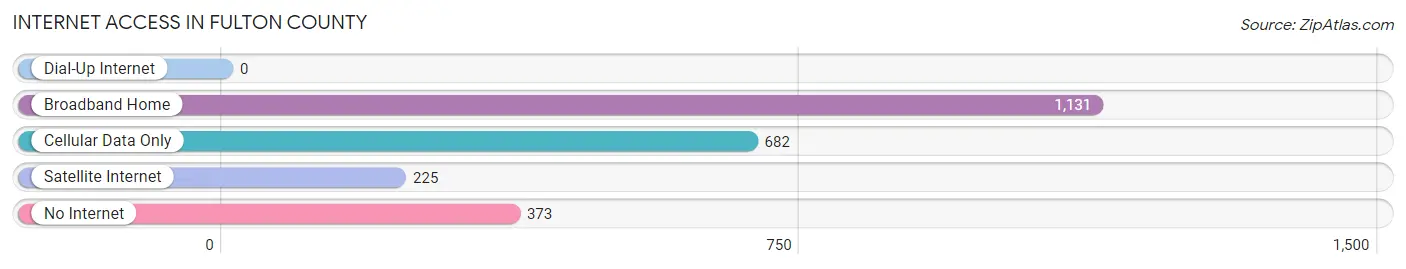
| Internet Type | # Households | % Households |
| Dial-Up Internet | 0 | 0.0% |
| Broadband Home | 1,131 | 47.6% |
| Cellular Data Only | 682 | 28.7% |
| Satellite Internet | 225 | 9.5% |
| No Internet | 373 | 15.7% |
| Total | 2,378 | 100.0% |
Fulton County Summary
Fulton County, Kentucky is located in the western part of the state, bordering the states of Tennessee and Missouri. It is part of the Jackson Purchase region of Kentucky, and is the second-smallest county in the state. The county seat is Hickman, and the county was formed in 1845 from Hickman County.
Geography
Fulton County is located in the western part of Kentucky, and is bordered by the states of Tennessee and Missouri. It is part of the Jackson Purchase region of Kentucky, and is the second-smallest county in the state. The county has a total area of only 145 square miles, of which 144 square miles is land and 1 square mile is water. The county is mostly flat, with some rolling hills in the northern part. The highest point in the county is located in the northern part, at an elevation of 545 feet. The county is drained by the Obion River, which flows through the county from north to south.
The county is home to several state parks, including Kentucky Lake State Park, which is located on the shores of Kentucky Lake. The lake is the largest man-made lake in the United States, and is a popular destination for fishing, boating, and other outdoor activities. Other parks in the county include Reelfoot Lake State Park, which is located on the shores of Reelfoot Lake, and the Land Between the Lakes National Recreation Area, which is located between Kentucky Lake and Lake Barkley.
Demographics
As of the 2010 census, there were 6,813 people, 2,717 households, and 1,845 families residing in the county. The population density was 47 people per square mile. There were 3,093 housing units at an average density of 21 per square mile. The racial makeup of the county was 95.2% White, 2.7% Black or African American, 0.2% Native American, 0.2% Asian, 0.2% from other races, and 1.7% from two or more races. Hispanic or Latino of any race were 0.7% of the population.
There were 2,717 households, out of which 28.2% had children under the age of 18 living with them, 51.2% were married couples living together, 12.2% had a female householder with no husband present, and 32.2% were non-families. 28.2% of all households were made up of individuals, and 13.2% had someone living alone who was 65 years of age or older. The average household size was 2.41 and the average family size was 2.93.
In the county, the population was spread out, with 23.2% under the age of 18, 8.2% from 18 to 24, 25.2% from 25 to 44, 26.2% from 45 to 64, and 17.2% who were 65 years of age or older. The median age was 40 years. For every 100 females, there were 93.2 males. For every 100 females age 18 and over, there were 90.2 males.
The median income for a household in the county was $30,938, and the median income for a family was $37,917. Males had a median income of $30,000 versus $20,000 for females. The per capita income for the county was $16,845. About 13.2% of families and 17.2% of the population were below the poverty line, including 22.2% of those under age 18 and 16.2% of those age 65 or over.
Economy
Fulton County’s economy is largely based on agriculture, with the main crops being corn, soybeans, and wheat. The county is also home to several manufacturing companies, including a paper mill, a furniture factory, and a plastics plant. The county is also home to several tourist attractions, including Kentucky Lake State Park, Reelfoot Lake State Park, and the Land Between the Lakes National Recreation Area.
The county is served by two major highways, US Highway 51 and Kentucky Route 94. The county is also served by the Fulton County Airport, which is located in the city of Hickman. The airport offers general aviation services, as well as charter flights.
Conclusion
Fulton County, Kentucky is a small county located in the western part of the state, bordering the states of Tennessee and Missouri. It is part of the Jackson Purchase region of Kentucky, and is the second-smallest county in the state. The county is mostly flat, with some rolling hills in the northern part. The county is home to several state parks, including Kentucky Lake State Park, Reelfoot Lake State Park, and the Land Between the Lakes National Recreation Area. The county’s economy is largely based on agriculture, with the main crops being corn, soybeans, and wheat. The county is also home to several manufacturing companies, as well as several tourist attractions. The county is served by two major highways, US Highway 51 and Kentucky Route 94, as well as the Fulton County Airport.
Common Questions
What is Per Capita Income in Fulton County?
Per Capita income in Fulton County is $19,960.
What is the Median Family Income in Fulton County?
Median Family Income in Fulton County is $44,534.
What is the Median Household income in Fulton County?
Median Household Income in Fulton County is $35,449.
What is Income or Wage Gap in Fulton County?
Income or Wage Gap in Fulton County is 20.8%.
Women in Fulton County earn 79.2 cents for every dollar earned by a man.
What is Family Income Deficit in Fulton County?
Family Income Deficit in Fulton County is $12,942.
Families that are below poverty line in Fulton County earn $12,942 less on average than the poverty threshold level.
What is Inequality or Gini Index in Fulton County?
Inequality or Gini Index in Fulton County is 0.42.
What is the Total Population of Fulton County?
Total Population of Fulton County is 6,480.
What is the Total Male Population of Fulton County?
Total Male Population of Fulton County is 3,359.
What is the Total Female Population of Fulton County?
Total Female Population of Fulton County is 3,121.
What is the Ratio of Males per 100 Females in Fulton County?
There are 107.63 Males per 100 Females in Fulton County.
What is the Ratio of Females per 100 Males in Fulton County?
There are 92.91 Females per 100 Males in Fulton County.
What is the Median Population Age in Fulton County?
Median Population Age in Fulton County is 39.2 Years.
What is the Average Family Size in Fulton County
Average Family Size in Fulton County is 3.3 People.
What is the Average Household Size in Fulton County
Average Household Size in Fulton County is 2.5 People.
How Large is the Labor Force in Fulton County?
There are 2,352 People in the Labor Forcein in Fulton County.
What is the Percentage of People in the Labor Force in Fulton County?
44.6% of People are in the Labor Force in Fulton County.
What is the Unemployment Rate in Fulton County?
Unemployment Rate in Fulton County is 5.6%.