Estill County, KY Map & Demographics
Estill County Map
Estill County Overview
$21,880
PER CAPITA INCOME
$54,479
AVG FAMILY INCOME
$39,980
AVG HOUSEHOLD INCOME
22.3%
WAGE / INCOME GAP [ % ]
77.7¢/ $1
WAGE / INCOME GAP [ $ ]
$11,604
FAMILY INCOME DEFICIT
0.46
INEQUALITY / GINI INDEX
14,138
TOTAL POPULATION
7,158
MALE POPULATION
6,980
FEMALE POPULATION
102.55
MALES / 100 FEMALES
97.51
FEMALES / 100 MALES
43.7
MEDIAN AGE
3.0
AVG FAMILY SIZE
2.4
AVG HOUSEHOLD SIZE
5,272
LABOR FORCE [ PEOPLE ]
46.1%
PERCENT IN LABOR FORCE
8.7%
UNEMPLOYMENT RATE
Estill County Area Codes
Income in Estill County
Income Overview in Estill County
Per Capita Income in Estill County is $21,880, while median incomes of families and households are $54,479 and $39,980 respectively.
| Characteristic | Number | Measure |
| Per Capita Income | 14,138 | $21,880 |
| Median Family Income | 3,934 | $54,479 |
| Mean Family Income | 3,934 | $62,198 |
| Median Household Income | 5,740 | $39,980 |
| Mean Household Income | 5,740 | $52,548 |
| Income Deficit | 3,934 | $11,604 |
| Wage / Income Gap (%) | 14,138 | 22.30% |
| Wage / Income Gap ($) | 14,138 | 77.70¢ per $1 |
| Gini / Inequality Index | 14,138 | 0.46 |
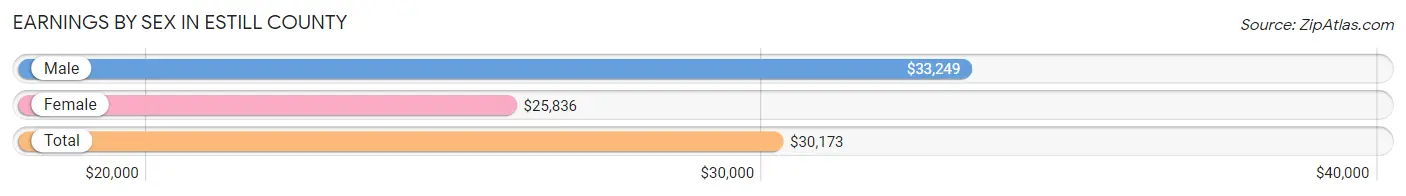
Earnings by Sex in Estill County
Average Earnings in Estill County are $30,173, $33,249 for men and $25,836 for women, a difference of 22.3%.
| Sex | Number | Average Earnings |
| Male | 2,980 (53.8%) | $33,249 |
| Female | 2,563 (46.2%) | $25,836 |
| Total | 5,543 (100.0%) | $30,173 |
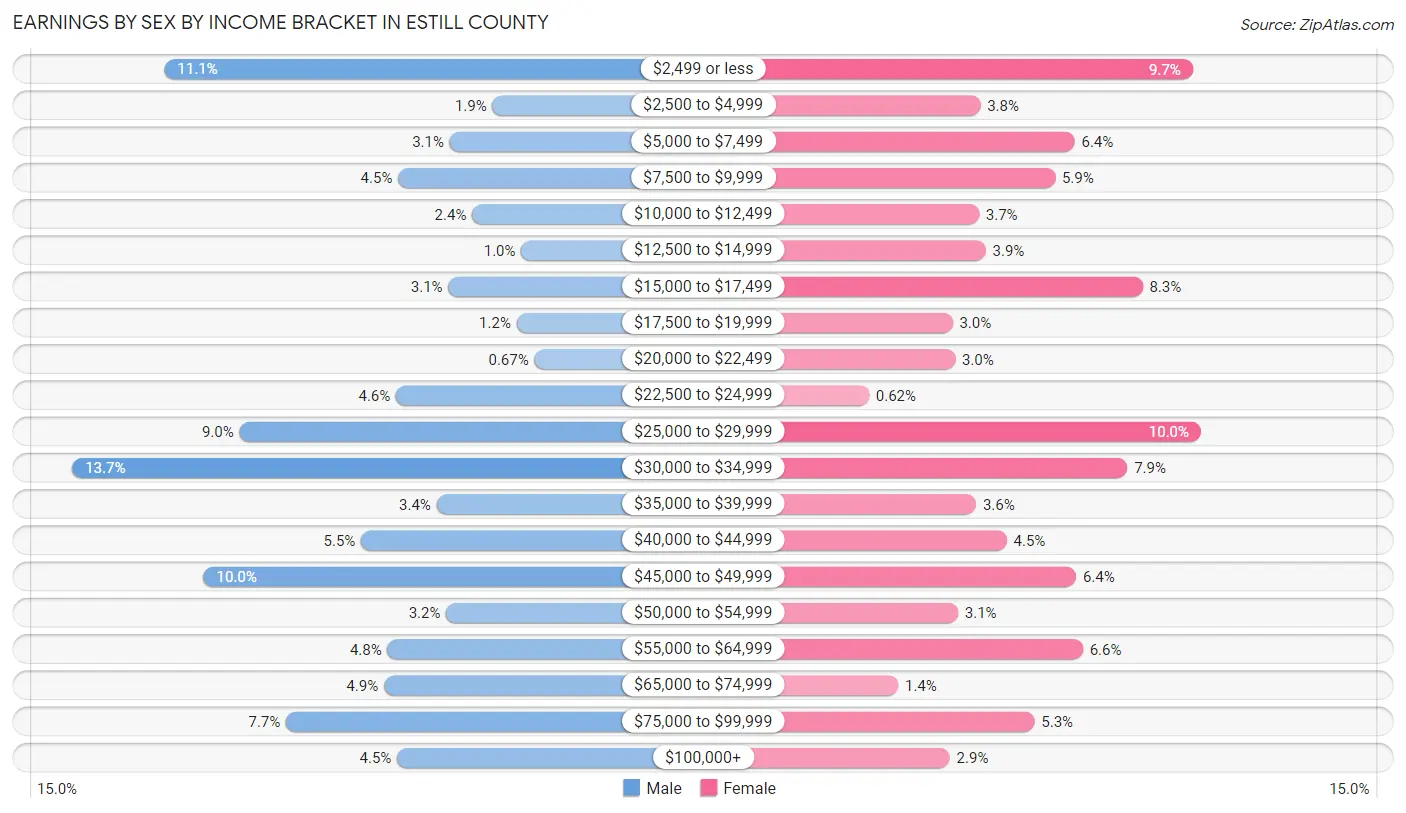
Earnings by Sex by Income Bracket in Estill County
The most common earnings brackets in Estill County are $30,000 to $34,999 for men (407 | 13.7%) and $25,000 to $29,999 for women (255 | 10.0%).
| Income | Male | Female |
| $2,499 or less | 330 (11.1%) | 249 (9.7%) |
| $2,500 to $4,999 | 55 (1.8%) | 96 (3.7%) |
| $5,000 to $7,499 | 91 (3.0%) | 164 (6.4%) |
| $7,500 to $9,999 | 134 (4.5%) | 150 (5.9%) |
| $10,000 to $12,499 | 72 (2.4%) | 95 (3.7%) |
| $12,500 to $14,999 | 31 (1.0%) | 100 (3.9%) |
| $15,000 to $17,499 | 92 (3.1%) | 213 (8.3%) |
| $17,500 to $19,999 | 35 (1.2%) | 76 (3.0%) |
| $20,000 to $22,499 | 20 (0.7%) | 78 (3.0%) |
| $22,500 to $24,999 | 136 (4.6%) | 16 (0.6%) |
| $25,000 to $29,999 | 267 (9.0%) | 255 (10.0%) |
| $30,000 to $34,999 | 407 (13.7%) | 202 (7.9%) |
| $35,000 to $39,999 | 102 (3.4%) | 93 (3.6%) |
| $40,000 to $44,999 | 165 (5.5%) | 115 (4.5%) |
| $45,000 to $49,999 | 297 (10.0%) | 165 (6.4%) |
| $50,000 to $54,999 | 94 (3.2%) | 80 (3.1%) |
| $55,000 to $64,999 | 143 (4.8%) | 170 (6.6%) |
| $65,000 to $74,999 | 146 (4.9%) | 37 (1.4%) |
| $75,000 to $99,999 | 228 (7.6%) | 135 (5.3%) |
| $100,000+ | 135 (4.5%) | 74 (2.9%) |
| Total | 2,980 (100.0%) | 2,563 (100.0%) |
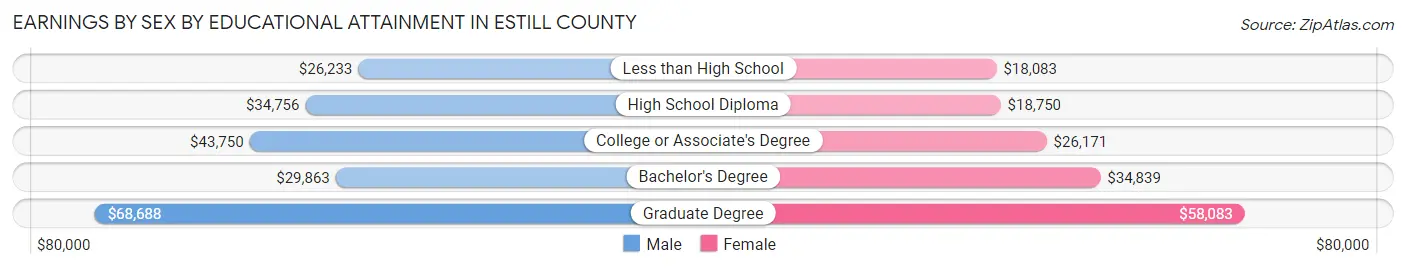
Earnings by Sex by Educational Attainment in Estill County
Average earnings in Estill County are $38,139 for men and $27,227 for women, a difference of 28.6%. Men with an educational attainment of graduate degree enjoy the highest average annual earnings of $68,688, while those with less than high school education earn the least with $26,233. Women with an educational attainment of graduate degree earn the most with the average annual earnings of $58,083, while those with less than high school education have the smallest earnings of $18,083.
| Educational Attainment | Male Income | Female Income |
| Less than High School | $26,233 | $18,083 |
| High School Diploma | $34,756 | $18,750 |
| College or Associate's Degree | $43,750 | $26,171 |
| Bachelor's Degree | $29,863 | $34,839 |
| Graduate Degree | $68,688 | $58,083 |
| Total | $38,139 | $27,227 |
Family Income in Estill County
Family Income Brackets in Estill County
According to the Estill County family income data, there are 869 families falling into the $50,000 to $74,999 income range, which is the most common income bracket and makes up 22.1% of all families. Conversely, the $200,000+ income bracket is the least frequent group with only 98 families (2.5%) belonging to this category.
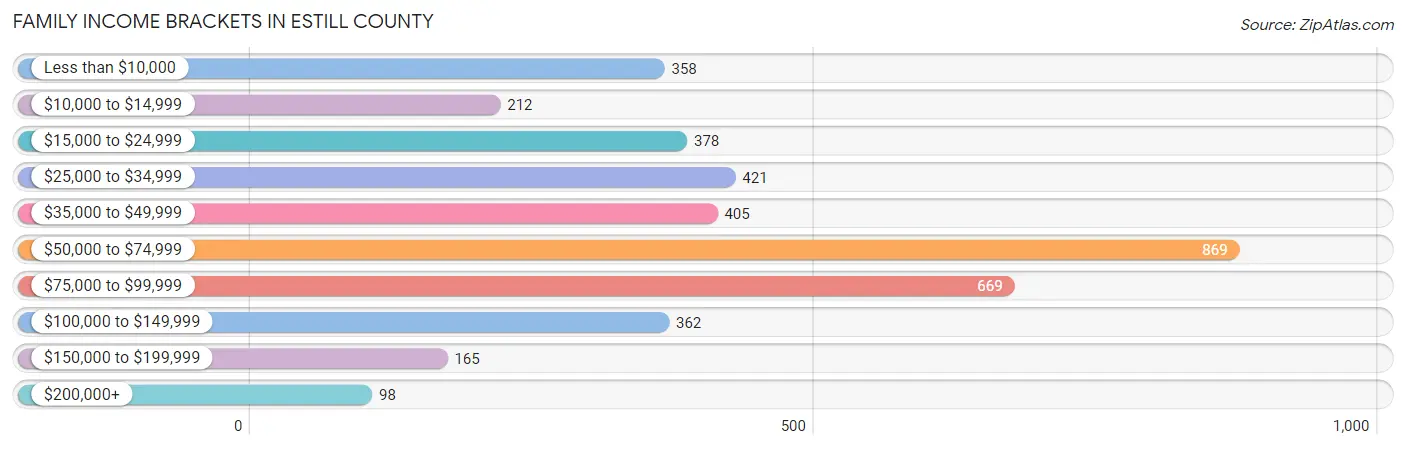
| Income Bracket | # Families | % Families |
| Less than $10,000 | 358 | 9.1% |
| $10,000 to $14,999 | 212 | 5.4% |
| $15,000 to $24,999 | 378 | 9.6% |
| $25,000 to $34,999 | 421 | 10.7% |
| $35,000 to $49,999 | 405 | 10.3% |
| $50,000 to $74,999 | 869 | 22.1% |
| $75,000 to $99,999 | 669 | 17.0% |
| $100,000 to $149,999 | 362 | 9.2% |
| $150,000 to $199,999 | 165 | 4.2% |
| $200,000+ | 98 | 2.5% |
Family Income by Famaliy Size in Estill County
5-person families (316 | 8.0%) account for the highest median family income in Estill County with $99,265 per family, while 2-person families (2,073 | 52.7%) have the highest median income of $26,160 per family member.
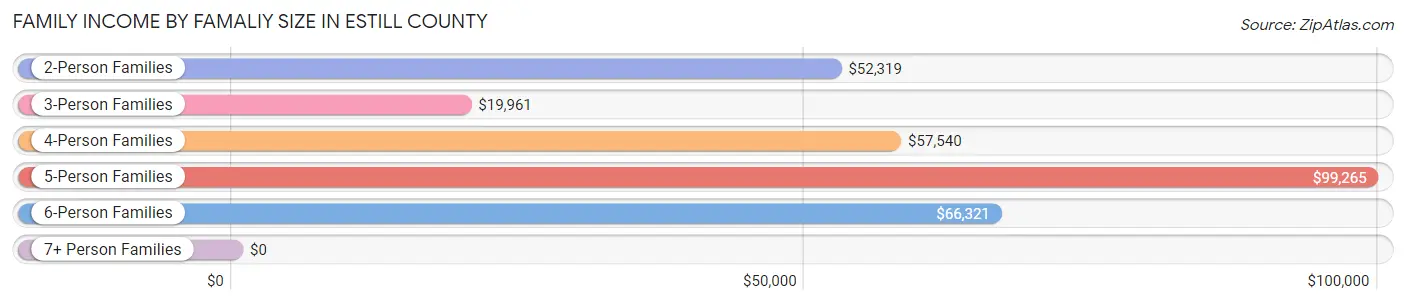
| Income Bracket | # Families | Median Income |
| 2-Person Families | 2,073 (52.7%) | $52,319 |
| 3-Person Families | 861 (21.9%) | $19,961 |
| 4-Person Families | 597 (15.2%) | $57,540 |
| 5-Person Families | 316 (8.0%) | $99,265 |
| 6-Person Families | 87 (2.2%) | $66,321 |
| 7+ Person Families | 0 (0.0%) | $0 |
| Total | 3,934 (100.0%) | $54,479 |
Family Income by Number of Earners in Estill County
The median family income in Estill County is $54,479, with families comprising 3+ earners (114) having the highest median family income of $111,471, while families with no earners (1,166) have the lowest median family income of $29,464, accounting for 2.9% and 29.6% of families, respectively.
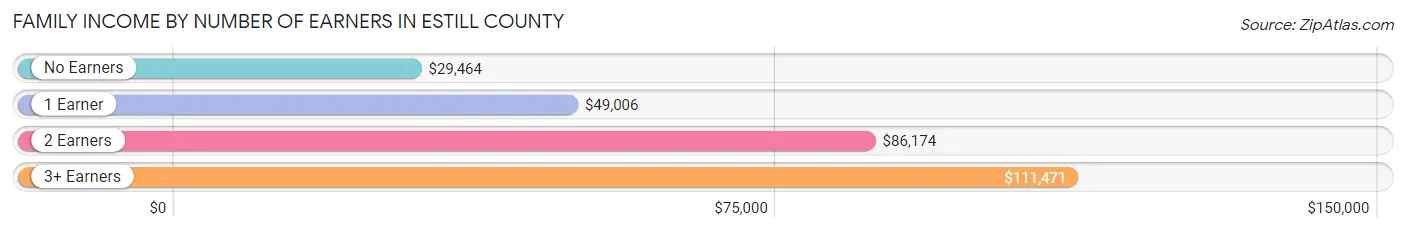
| Number of Earners | # Families | Median Income |
| No Earners | 1,166 (29.6%) | $29,464 |
| 1 Earner | 1,595 (40.5%) | $49,006 |
| 2 Earners | 1,059 (26.9%) | $86,174 |
| 3+ Earners | 114 (2.9%) | $111,471 |
| Total | 3,934 (100.0%) | $54,479 |
Household Income in Estill County
Household Income Brackets in Estill County
With 1,027 households falling in the category, the $50,000 to $74,999 income range is the most frequent in Estill County, accounting for 17.9% of all households. In contrast, only 103 households (1.8%) fall into the $200,000+ income bracket, making it the least populous group.
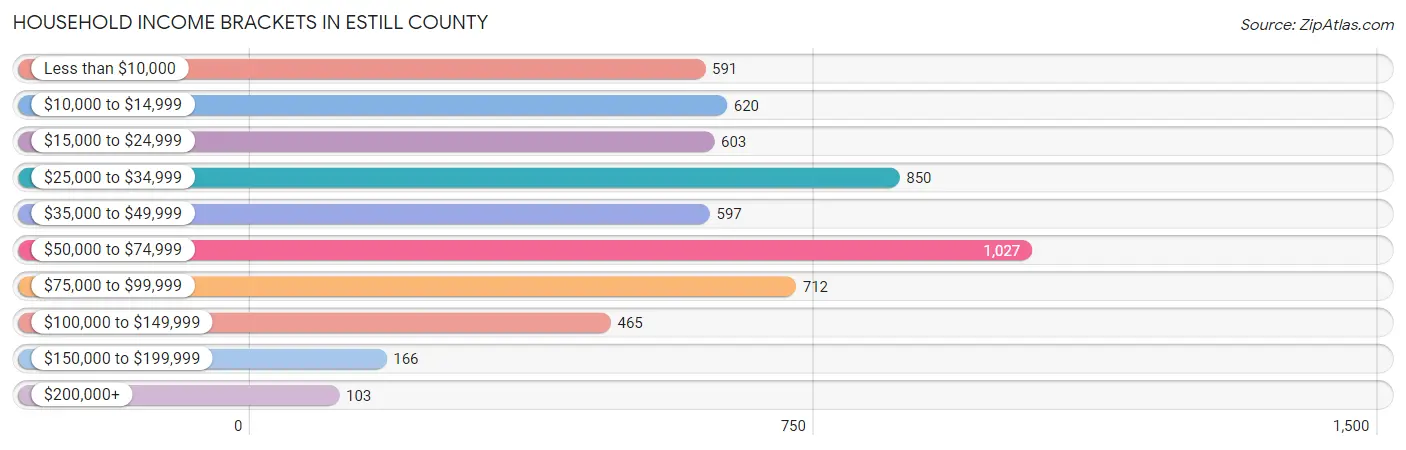
| Income Bracket | # Households | % Households |
| Less than $10,000 | 591 | 10.3% |
| $10,000 to $14,999 | 620 | 10.8% |
| $15,000 to $24,999 | 603 | 10.5% |
| $25,000 to $34,999 | 850 | 14.8% |
| $35,000 to $49,999 | 597 | 10.4% |
| $50,000 to $74,999 | 1,027 | 17.9% |
| $75,000 to $99,999 | 712 | 12.4% |
| $100,000 to $149,999 | 465 | 8.1% |
| $150,000 to $199,999 | 166 | 2.9% |
| $200,000+ | 103 | 1.8% |
Household Income by Householder Age in Estill County
The median household income in Estill County is $39,980, with the highest median household income of $46,250 found in the 15 to 24 years age bracket for the primary householder. A total of 157 households (2.7%) fall into this category. Meanwhile, the 25 to 44 years age bracket for the primary householder has the lowest median household income of $35,000, with 1,448 households (25.2%) in this group.
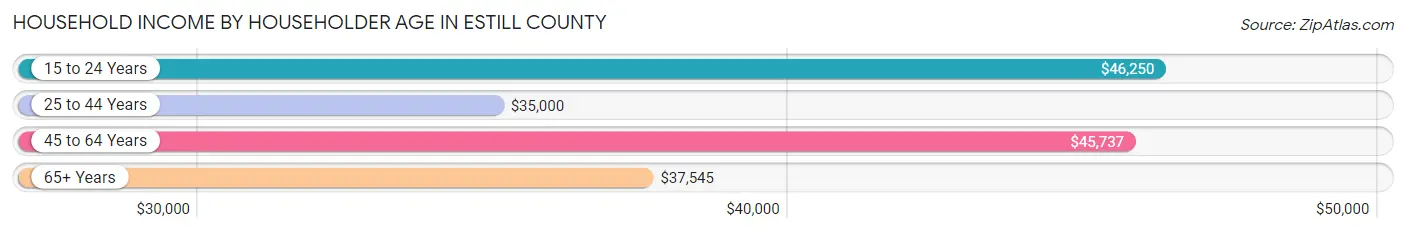
| Income Bracket | # Households | Median Income |
| 15 to 24 Years | 157 (2.7%) | $46,250 |
| 25 to 44 Years | 1,448 (25.2%) | $35,000 |
| 45 to 64 Years | 2,450 (42.7%) | $45,737 |
| 65+ Years | 1,685 (29.4%) | $37,545 |
| Total | 5,740 (100.0%) | $39,980 |
Poverty in Estill County
Income Below Poverty by Sex and Age in Estill County
With 18.6% poverty level for males and 29.4% for females among the residents of Estill County, 15 year old males and 25 to 34 year old females are the most vulnerable to poverty, with 120 males (63.5%) and 404 females (52.7%) in their respective age groups living below the poverty level.
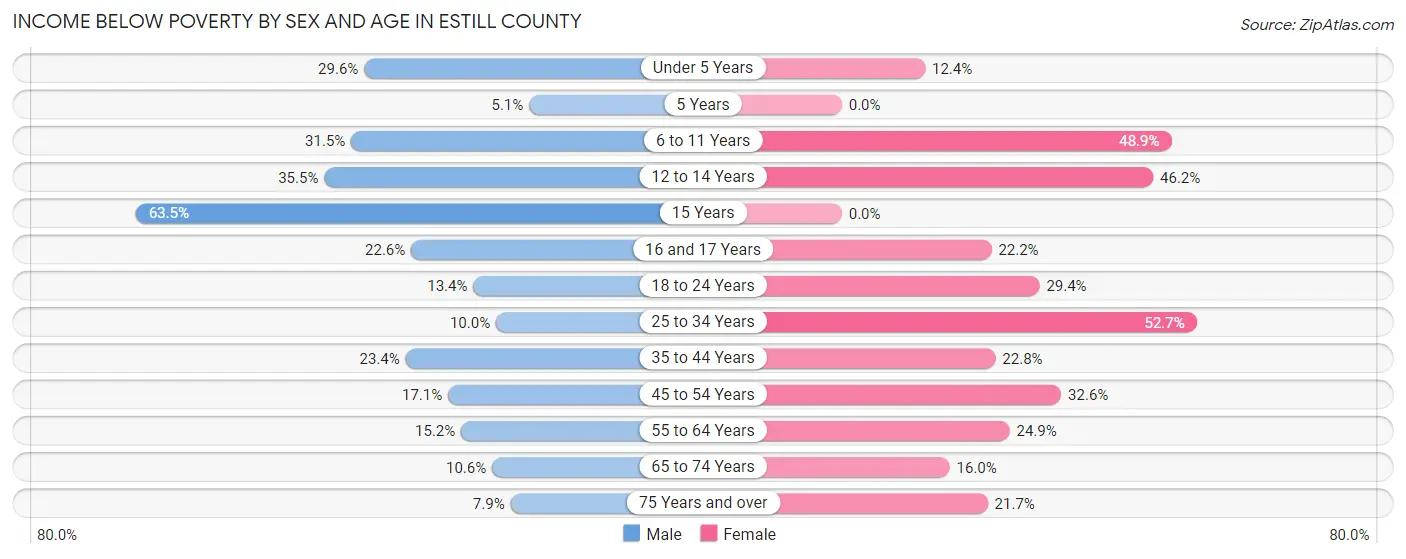
| Age Bracket | Male | Female |
| Under 5 Years | 105 (29.6%) | 43 (12.4%) |
| 5 Years | 10 (5.1%) | 0 (0.0%) |
| 6 to 11 Years | 173 (31.5%) | 272 (48.9%) |
| 12 to 14 Years | 76 (35.5%) | 98 (46.2%) |
| 15 Years | 120 (63.5%) | 0 (0.0%) |
| 16 and 17 Years | 45 (22.6%) | 38 (22.2%) |
| 18 to 24 Years | 67 (13.4%) | 135 (29.3%) |
| 25 to 34 Years | 82 (10.0%) | 404 (52.7%) |
| 35 to 44 Years | 198 (23.4%) | 180 (22.8%) |
| 45 to 54 Years | 178 (17.1%) | 325 (32.6%) |
| 55 to 64 Years | 153 (15.2%) | 270 (24.9%) |
| 65 to 74 Years | 77 (10.6%) | 142 (16.0%) |
| 75 Years and over | 34 (7.9%) | 128 (21.7%) |
| Total | 1,318 (18.6%) | 2,035 (29.4%) |
Income Above Poverty by Sex and Age in Estill County
According to the poverty statistics in Estill County, males aged 5 years and females aged 5 years are the age groups that are most secure financially, with 94.9% of males and 100.0% of females in these age groups living above the poverty line.
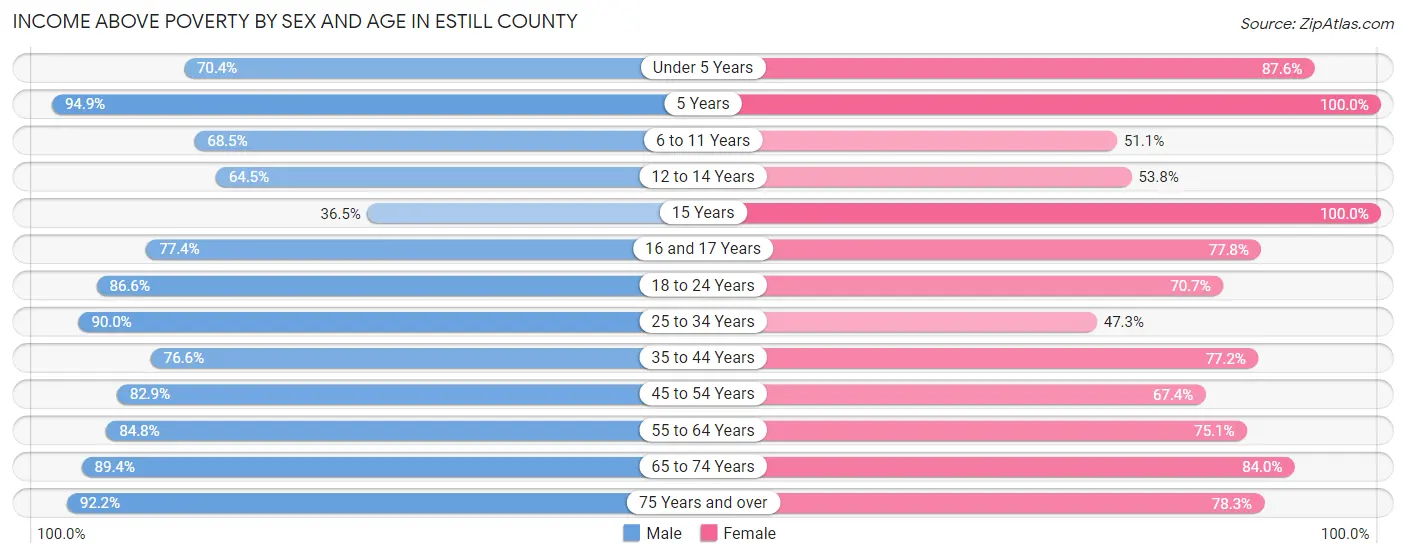
| Age Bracket | Male | Female |
| Under 5 Years | 250 (70.4%) | 305 (87.6%) |
| 5 Years | 187 (94.9%) | 38 (100.0%) |
| 6 to 11 Years | 376 (68.5%) | 284 (51.1%) |
| 12 to 14 Years | 138 (64.5%) | 114 (53.8%) |
| 15 Years | 69 (36.5%) | 17 (100.0%) |
| 16 and 17 Years | 154 (77.4%) | 133 (77.8%) |
| 18 to 24 Years | 434 (86.6%) | 325 (70.7%) |
| 25 to 34 Years | 738 (90.0%) | 363 (47.3%) |
| 35 to 44 Years | 647 (76.6%) | 609 (77.2%) |
| 45 to 54 Years | 862 (82.9%) | 673 (67.4%) |
| 55 to 64 Years | 855 (84.8%) | 814 (75.1%) |
| 65 to 74 Years | 650 (89.4%) | 745 (84.0%) |
| 75 Years and over | 399 (92.1%) | 463 (78.3%) |
| Total | 5,759 (81.4%) | 4,883 (70.6%) |
Income Below Poverty Among Married-Couple Families in Estill County
The poverty statistics for married-couple families in Estill County show that 7.9% or 206 of the total 2,620 families live below the poverty line. Families with 1 or 2 children have the highest poverty rate of 13.1%, comprising of 101 families. On the other hand, families with no children have the lowest poverty rate of 5.4%, which includes 90 families.
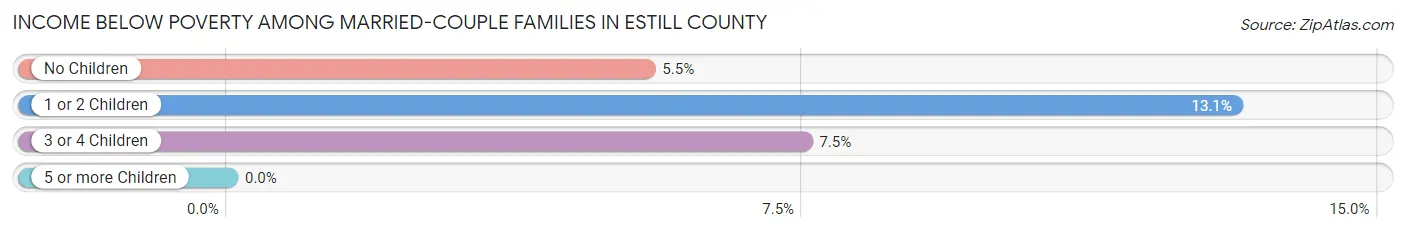
| Children | Above Poverty | Below Poverty |
| No Children | 1,561 (94.6%) | 90 (5.4%) |
| 1 or 2 Children | 668 (86.9%) | 101 (13.1%) |
| 3 or 4 Children | 185 (92.5%) | 15 (7.5%) |
| 5 or more Children | 0 (0.0%) | 0 (0.0%) |
| Total | 2,414 (92.1%) | 206 (7.9%) |
Income Below Poverty Among Single-Parent Households in Estill County
According to the poverty data in Estill County, 21.0% or 83 single-father households and 64.0% or 588 single-mother households are living below the poverty line. Among single-father households, those with 1 or 2 children have the highest poverty rate, with 67 households (28.5%) experiencing poverty. Likewise, among single-mother households, those with 1 or 2 children have the highest poverty rate, with 469 households (83.3%) falling below the poverty line.
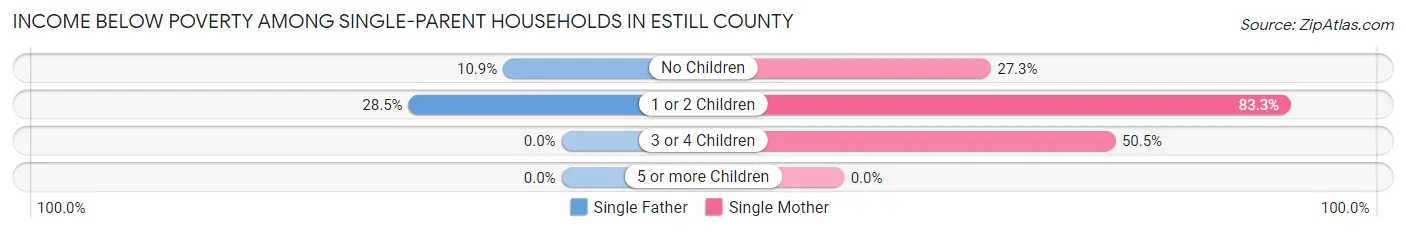
| Children | Single Father | Single Mother |
| No Children | 16 (10.9%) | 71 (27.3%) |
| 1 or 2 Children | 67 (28.5%) | 469 (83.3%) |
| 3 or 4 Children | 0 (0.0%) | 48 (50.5%) |
| 5 or more Children | 0 (0.0%) | 0 (0.0%) |
| Total | 83 (21.0%) | 588 (64.0%) |
Income Below Poverty Among Married-Couple vs Single-Parent Households in Estill County
The poverty data for Estill County shows that 206 of the married-couple family households (7.9%) and 671 of the single-parent households (51.1%) are living below the poverty level. Within the married-couple family households, those with 1 or 2 children have the highest poverty rate, with 101 households (13.1%) falling below the poverty line. Among the single-parent households, those with 1 or 2 children have the highest poverty rate, with 536 household (67.2%) living below poverty.
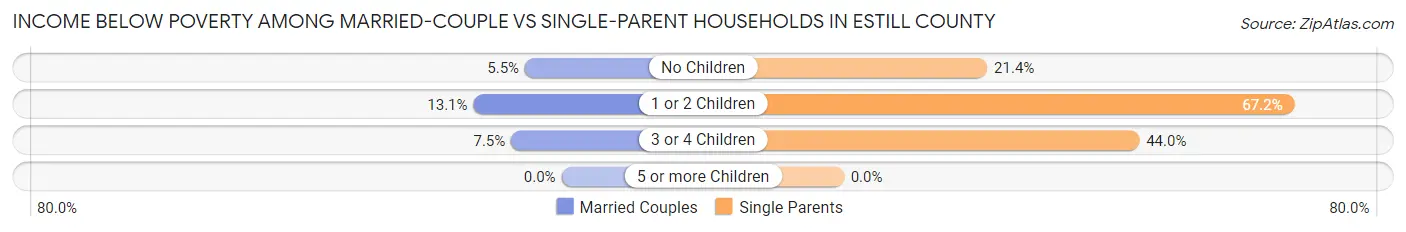
| Children | Married-Couple Families | Single-Parent Households |
| No Children | 90 (5.4%) | 87 (21.4%) |
| 1 or 2 Children | 101 (13.1%) | 536 (67.2%) |
| 3 or 4 Children | 15 (7.5%) | 48 (44.0%) |
| 5 or more Children | 0 (0.0%) | 0 (0.0%) |
| Total | 206 (7.9%) | 671 (51.1%) |
Race in Estill County
The most populous races in Estill County are White / Caucasian (13,599 | 96.2%), Two or more Races (411 | 2.9%), and Hispanic or Latino (118 | 0.8%).
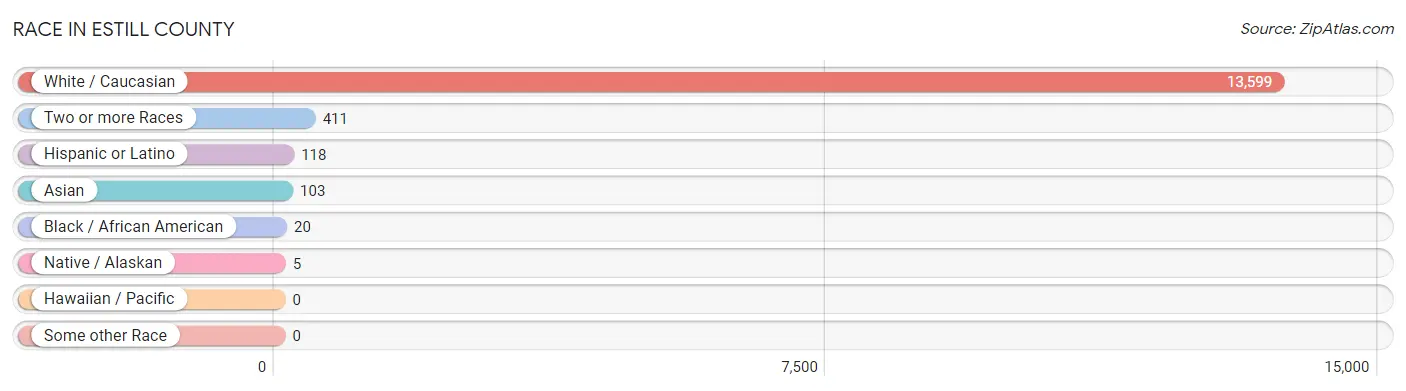
| Race | # Population | % Population |
| Asian | 103 | 0.7% |
| Black / African American | 20 | 0.1% |
| Hawaiian / Pacific | 0 | 0.0% |
| Hispanic or Latino | 118 | 0.8% |
| Native / Alaskan | 5 | 0.0% |
| White / Caucasian | 13,599 | 96.2% |
| Two or more Races | 411 | 2.9% |
| Some other Race | 0 | 0.0% |
| Total | 14,138 | 100.0% |
Ancestry in Estill County
The most populous ancestries reported in Estill County are American (1,854 | 13.1%), English (1,712 | 12.1%), Irish (1,349 | 9.5%), German (964 | 6.8%), and European (304 | 2.1%), together accounting for 43.7% of all Estill County residents.
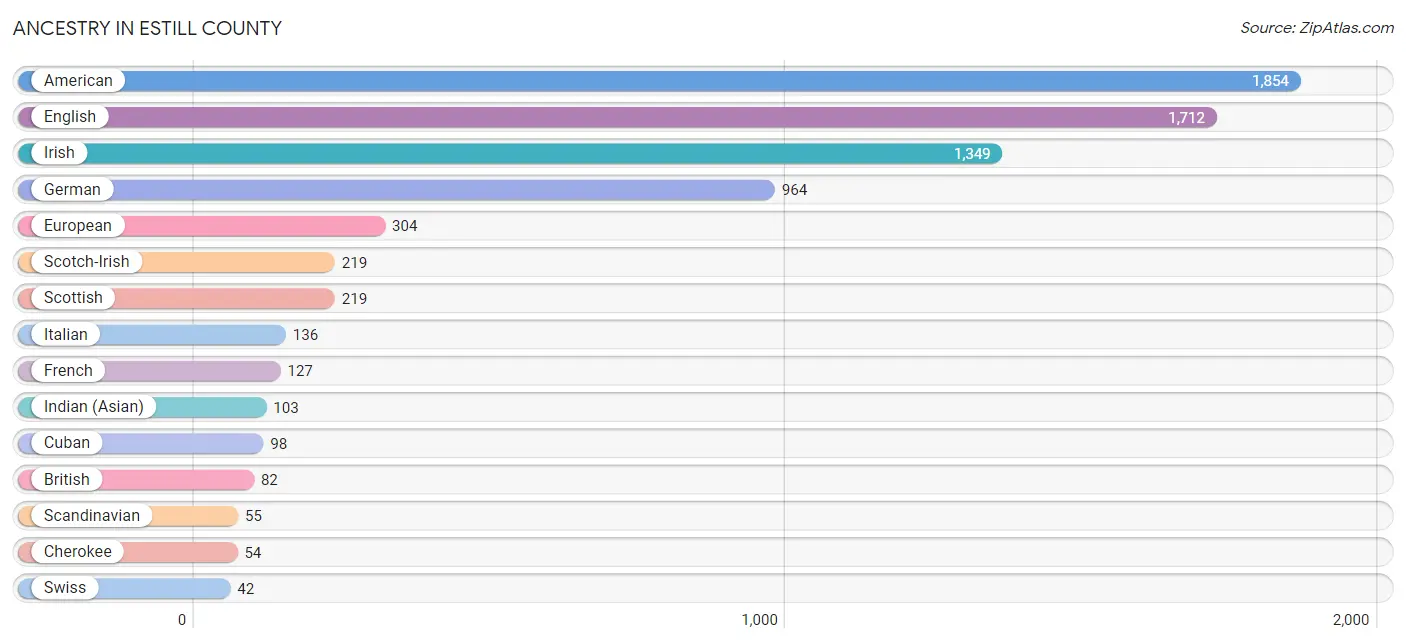
| Ancestry | # Population | % Population |
| Alsatian | 3 | 0.0% |
| American | 1,854 | 13.1% |
| Austrian | 4 | 0.0% |
| British | 82 | 0.6% |
| Canadian | 8 | 0.1% |
| Celtic | 4 | 0.0% |
| Cherokee | 54 | 0.4% |
| Croatian | 8 | 0.1% |
| Cuban | 98 | 0.7% |
| Dutch | 24 | 0.2% |
| English | 1,712 | 12.1% |
| European | 304 | 2.1% |
| French | 127 | 0.9% |
| French Canadian | 31 | 0.2% |
| German | 964 | 6.8% |
| Indian (Asian) | 103 | 0.7% |
| Irish | 1,349 | 9.5% |
| Italian | 136 | 1.0% |
| Lithuanian | 14 | 0.1% |
| Mexican | 20 | 0.1% |
| Norwegian | 15 | 0.1% |
| Polish | 19 | 0.1% |
| Scandinavian | 55 | 0.4% |
| Scotch-Irish | 219 | 1.5% |
| Scottish | 219 | 1.5% |
| Swedish | 15 | 0.1% |
| Swiss | 42 | 0.3% | View All 27 Rows |
Immigrants in Estill County
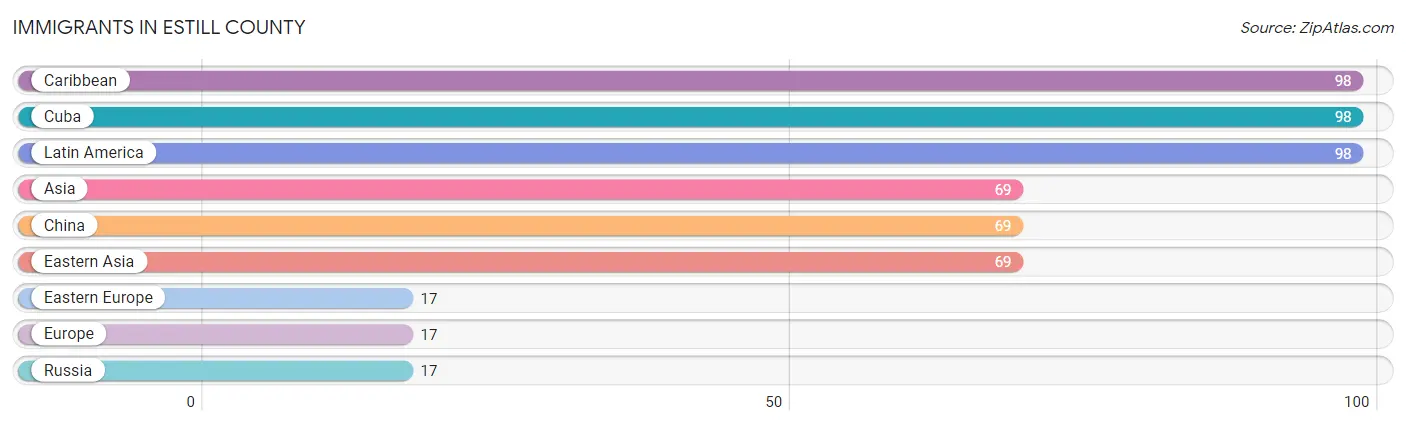
The most numerous immigrant groups reported in Estill County came from Caribbean (98 | 0.7%), Cuba (98 | 0.7%), Latin America (98 | 0.7%), Asia (69 | 0.5%), and China (69 | 0.5%), together accounting for 3.0% of all Estill County residents.
| Immigration Origin | # Population | % Population |
| Asia | 69 | 0.5% |
| Caribbean | 98 | 0.7% |
| China | 69 | 0.5% |
| Cuba | 98 | 0.7% |
| Eastern Asia | 69 | 0.5% |
| Eastern Europe | 17 | 0.1% |
| Europe | 17 | 0.1% |
| Latin America | 98 | 0.7% |
| Russia | 17 | 0.1% | View All 9 Rows |
Sex and Age in Estill County
Sex and Age in Estill County
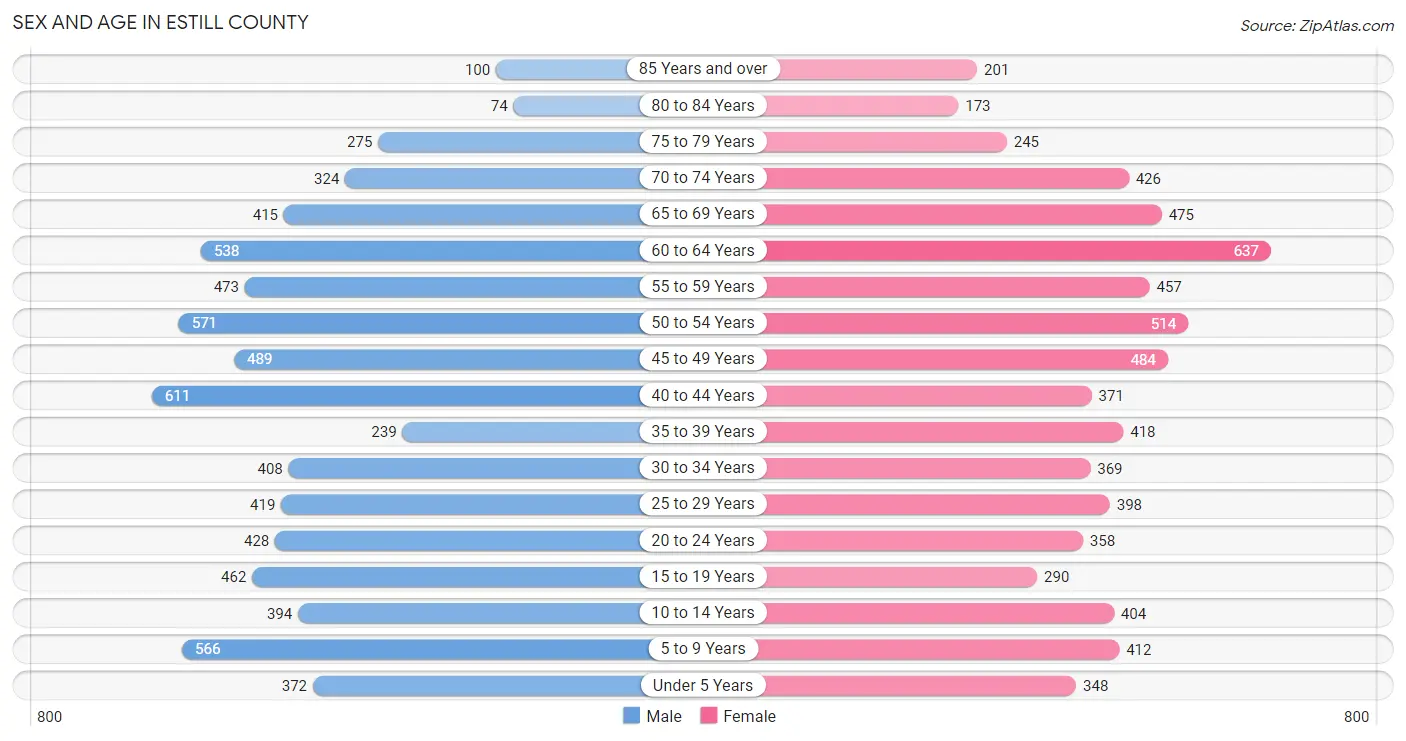
The most populous age groups in Estill County are 40 to 44 Years (611 | 8.5%) for men and 60 to 64 Years (637 | 9.1%) for women.
| Age Bracket | Male | Female |
| Under 5 Years | 372 (5.2%) | 348 (5.0%) |
| 5 to 9 Years | 566 (7.9%) | 412 (5.9%) |
| 10 to 14 Years | 394 (5.5%) | 404 (5.8%) |
| 15 to 19 Years | 462 (6.5%) | 290 (4.2%) |
| 20 to 24 Years | 428 (6.0%) | 358 (5.1%) |
| 25 to 29 Years | 419 (5.9%) | 398 (5.7%) |
| 30 to 34 Years | 408 (5.7%) | 369 (5.3%) |
| 35 to 39 Years | 239 (3.3%) | 418 (6.0%) |
| 40 to 44 Years | 611 (8.5%) | 371 (5.3%) |
| 45 to 49 Years | 489 (6.8%) | 484 (6.9%) |
| 50 to 54 Years | 571 (8.0%) | 514 (7.4%) |
| 55 to 59 Years | 473 (6.6%) | 457 (6.6%) |
| 60 to 64 Years | 538 (7.5%) | 637 (9.1%) |
| 65 to 69 Years | 415 (5.8%) | 475 (6.8%) |
| 70 to 74 Years | 324 (4.5%) | 426 (6.1%) |
| 75 to 79 Years | 275 (3.8%) | 245 (3.5%) |
| 80 to 84 Years | 74 (1.0%) | 173 (2.5%) |
| 85 Years and over | 100 (1.4%) | 201 (2.9%) |
| Total | 7,158 (100.0%) | 6,980 (100.0%) |
Families and Households in Estill County
Median Family Size in Estill County
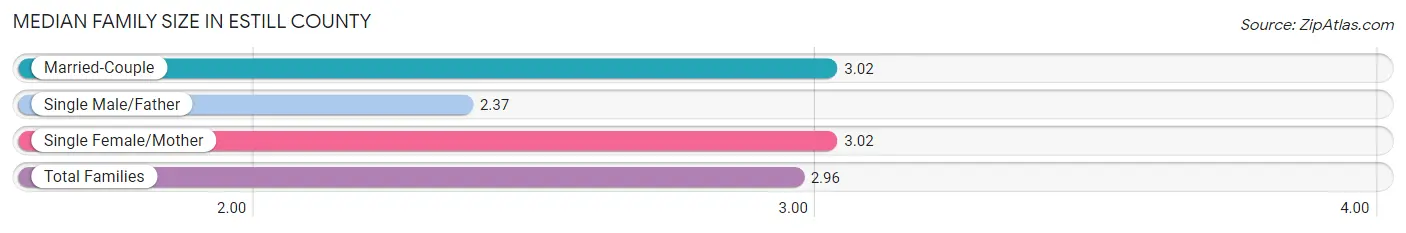
The median family size in Estill County is 2.96 persons per family, with married-couple families (2,620 | 66.6%) accounting for the largest median family size of 3.02 persons per family. On the other hand, single male/father families (396 | 10.1%) represent the smallest median family size with 2.37 persons per family.
| Family Type | # Families | Family Size |
| Married-Couple | 2,620 (66.6%) | 3.02 |
| Single Male/Father | 396 (10.1%) | 2.37 |
| Single Female/Mother | 918 (23.3%) | 3.02 |
| Total Families | 3,934 (100.0%) | 2.96 |
Median Household Size in Estill County
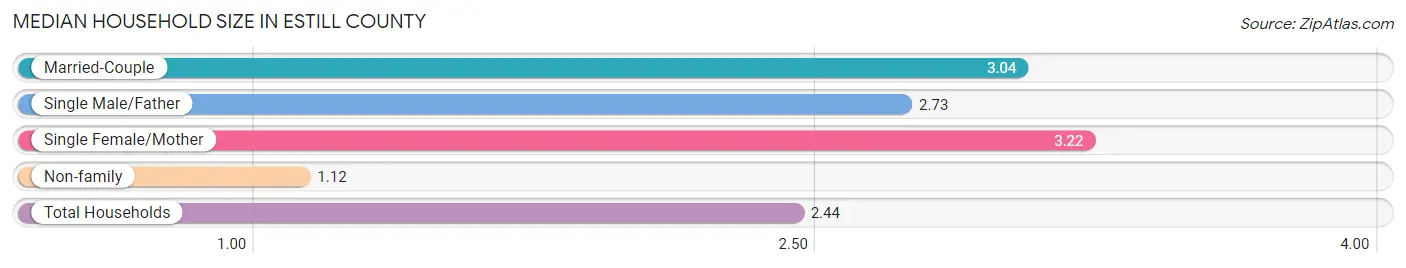
The median household size in Estill County is 2.44 persons per household, with single female/mother households (918 | 16.0%) accounting for the largest median household size of 3.22 persons per household. non-family households (1,806 | 31.5%) represent the smallest median household size with 1.12 persons per household.
| Household Type | # Households | Household Size |
| Married-Couple | 2,620 (45.6%) | 3.04 |
| Single Male/Father | 396 (6.9%) | 2.73 |
| Single Female/Mother | 918 (16.0%) | 3.22 |
| Non-family | 1,806 (31.5%) | 1.12 |
| Total Households | 5,740 (100.0%) | 2.44 |
Household Size by Marriage Status in Estill County
Out of a total of 5,740 households in Estill County, 3,934 (68.5%) are family households, while 1,806 (31.5%) are nonfamily households. The most numerous type of family households are 2-person households, comprising 1,951, and the most common type of nonfamily households are 1-person households, comprising 1,583.
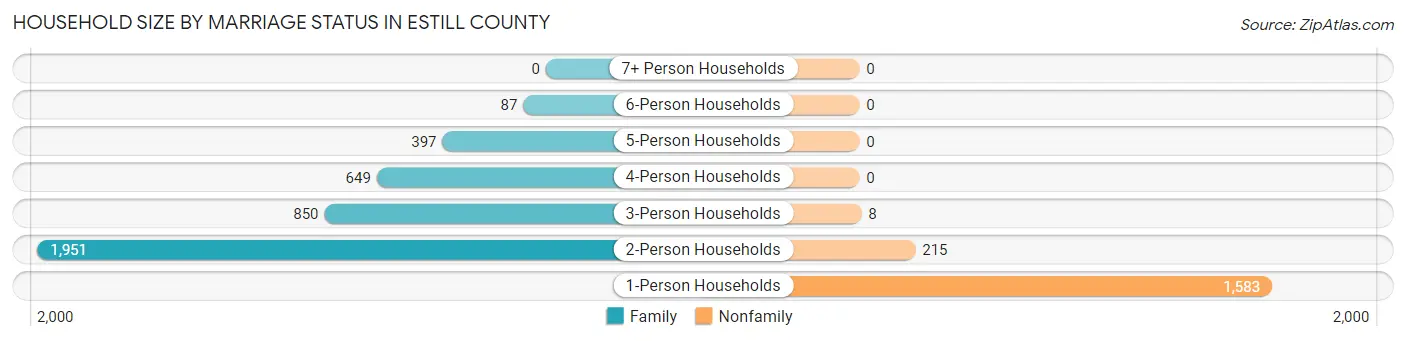
| Household Size | Family Households | Nonfamily Households |
| 1-Person Households | - | 1,583 (27.6%) |
| 2-Person Households | 1,951 (34.0%) | 215 (3.7%) |
| 3-Person Households | 850 (14.8%) | 8 (0.1%) |
| 4-Person Households | 649 (11.3%) | 0 (0.0%) |
| 5-Person Households | 397 (6.9%) | 0 (0.0%) |
| 6-Person Households | 87 (1.5%) | 0 (0.0%) |
| 7+ Person Households | 0 (0.0%) | 0 (0.0%) |
| Total | 3,934 (68.5%) | 1,806 (31.5%) |
Female Fertility in Estill County
Fertility by Age in Estill County
Average fertility rate in Estill County is 30.0 births per 1,000 women. Women in the age bracket of 20 to 34 years have the highest fertility rate with 74.0 births per 1,000 women. Women in the age bracket of 20 to 34 years acount for 100.0% of all women with births.
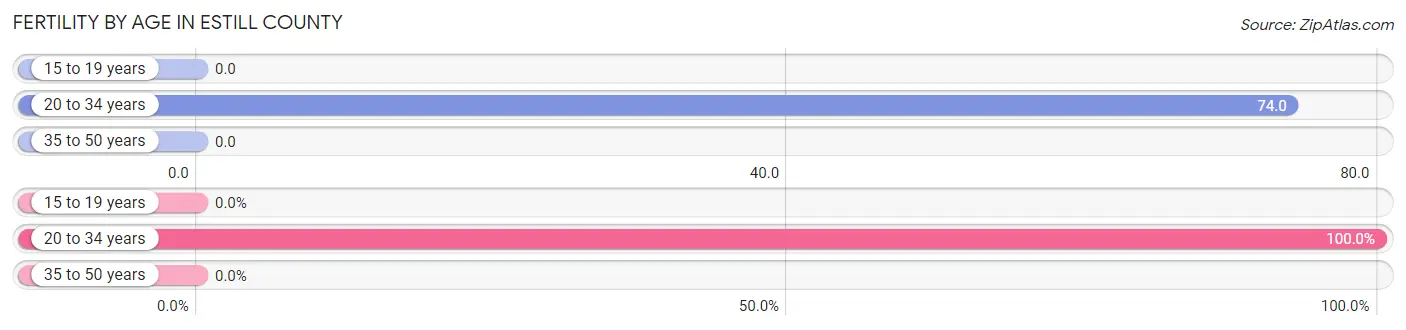
| Age Bracket | Women with Births | Births / 1,000 Women |
| 15 to 19 years | 0 (0.0%) | 0.0 |
| 20 to 34 years | 83 (100.0%) | 74.0 |
| 35 to 50 years | 0 (0.0%) | 0.0 |
| Total | 83 (100.0%) | 30.0 |
Fertility by Age by Marriage Status in Estill County
24.1% of women with births (83) in Estill County are married. The highest percentage of unmarried women with births falls into 20 to 34 years age bracket with 75.9% of them unmarried at the time of birth, while the lowest percentage of unmarried women with births belong to 20 to 34 years age bracket with 75.9% of them unmarried.
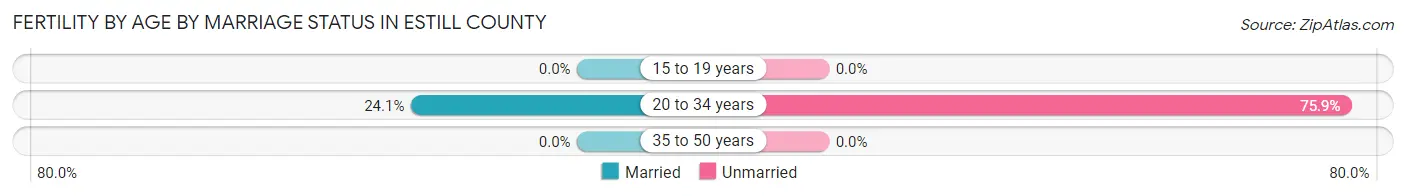
| Age Bracket | Married | Unmarried |
| 15 to 19 years | 0 (0.0%) | 0 (0.0%) |
| 20 to 34 years | 20 (24.1%) | 63 (75.9%) |
| 35 to 50 years | 0 (0.0%) | 0 (0.0%) |
| Total | 20 (24.1%) | 63 (75.9%) |
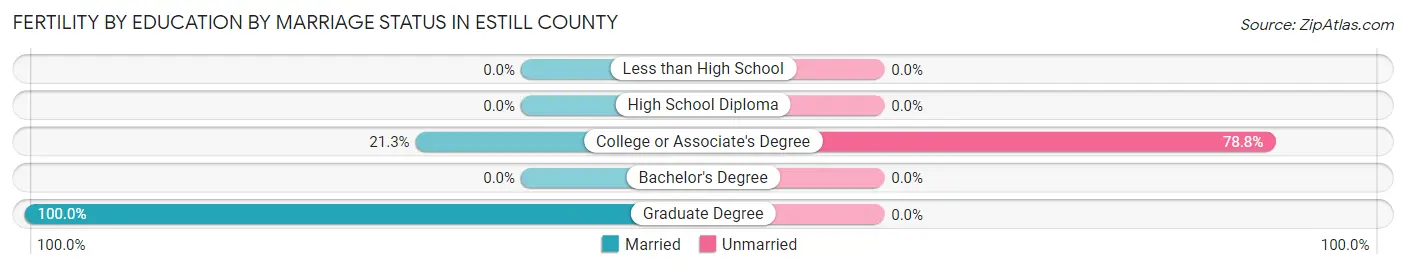
Fertility by Education in Estill County
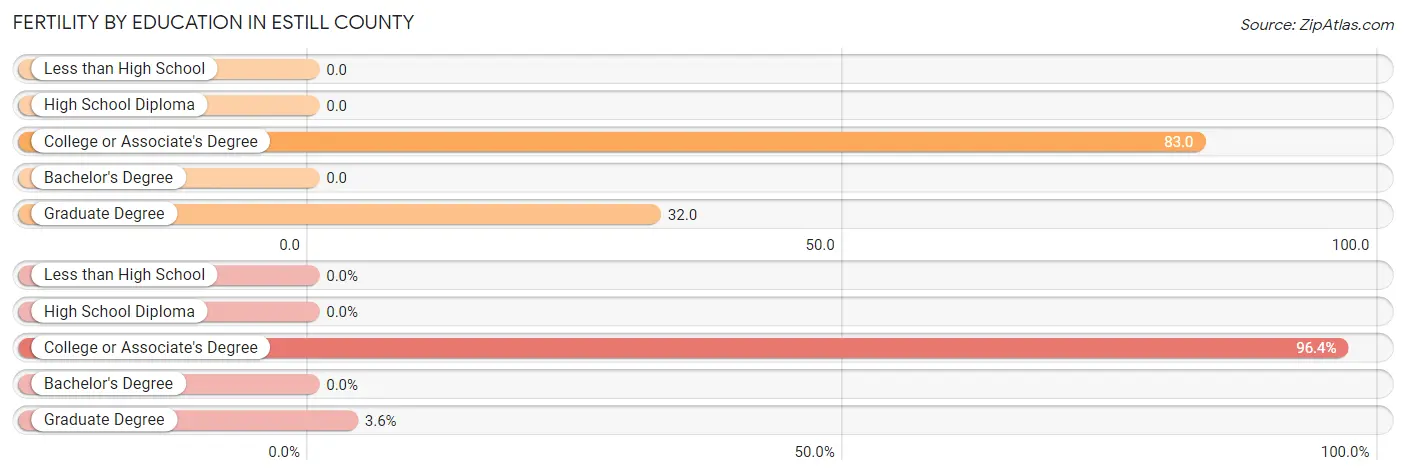
| Educational Attainment | Women with Births | Births / 1,000 Women |
| Less than High School | 0 (0.0%) | 0.0 |
| High School Diploma | 0 (0.0%) | 0.0 |
| College or Associate's Degree | 80 (96.4%) | 83.0 |
| Bachelor's Degree | 0 (0.0%) | 0.0 |
| Graduate Degree | 3 (3.6%) | 32.0 |
| Total | 83 (100.0%) | 30.0 |
Fertility by Education by Marriage Status in Estill County
75.9% of women with births in Estill County are unmarried. Women with the educational attainment of graduate degree are most likely to be married with 100.0% of them married at childbirth, while women with the educational attainment of college or associate's degree are least likely to be married with 78.7% of them unmarried at childbirth.
| Educational Attainment | Married | Unmarried |
| Less than High School | 0 (0.0%) | 0 (0.0%) |
| High School Diploma | 0 (0.0%) | 0 (0.0%) |
| College or Associate's Degree | 17 (21.2%) | 63 (78.7%) |
| Bachelor's Degree | 0 (0.0%) | 0 (0.0%) |
| Graduate Degree | 3 (100.0%) | 0 (0.0%) |
| Total | 20 (24.1%) | 63 (75.9%) |
Employment Characteristics in Estill County
Employment by Class of Employer in Estill County
Among the 4,572 employed individuals in Estill County, private company employees (3,054 | 66.8%), not-for-profit organizations (425 | 9.3%), and local government employees (394 | 8.6%) make up the most common classes of employment.
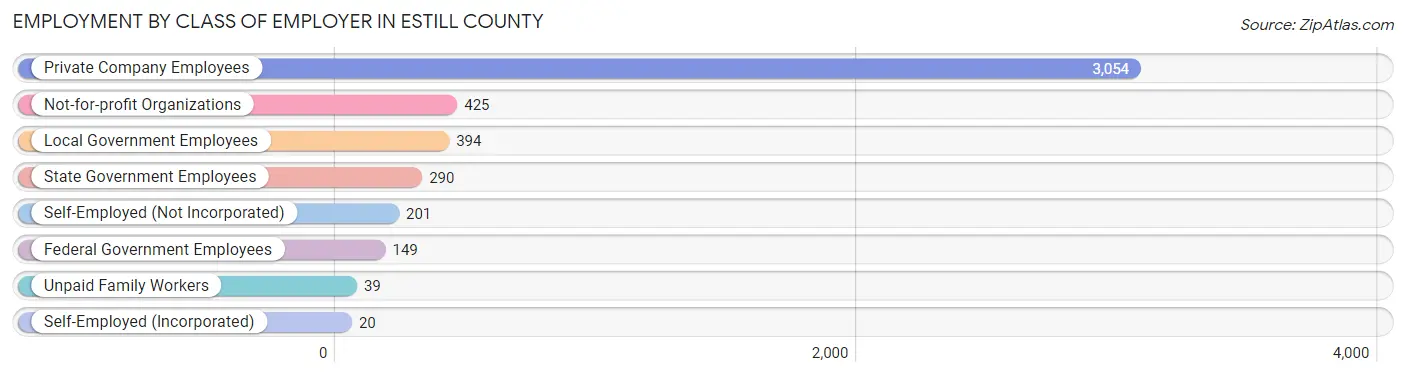
| Employer Class | # Employees | % Employees |
| Private Company Employees | 3,054 | 66.8% |
| Self-Employed (Incorporated) | 20 | 0.4% |
| Self-Employed (Not Incorporated) | 201 | 4.4% |
| Not-for-profit Organizations | 425 | 9.3% |
| Local Government Employees | 394 | 8.6% |
| State Government Employees | 290 | 6.3% |
| Federal Government Employees | 149 | 3.3% |
| Unpaid Family Workers | 39 | 0.9% |
| Total | 4,572 | 100.0% |
Employment Status by Age in Estill County
According to the labor force statistics for Estill County, out of the total population over 16 years of age (11,436), 46.1% or 5,272 individuals are in the labor force, with 8.7% or 459 of them unemployed. The age group with the highest labor force participation rate is 25 to 29 years, with 89.5% or 731 individuals in the labor force. Within the labor force, the 16 to 19 years age range has the highest percentage of unemployed individuals, with 48.0% or 61 of them being unemployed.
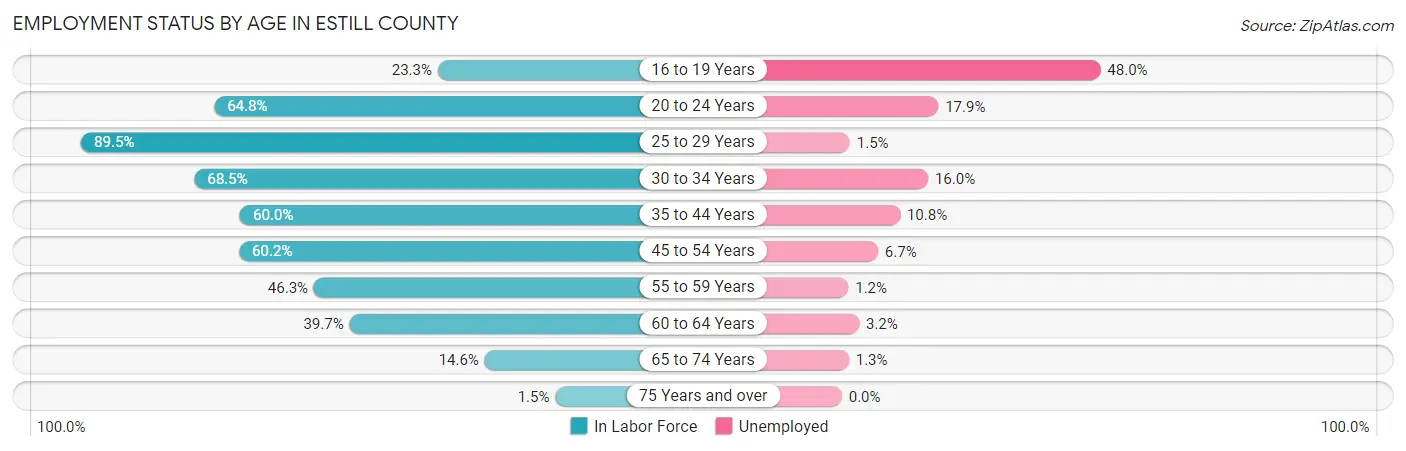
| Age Bracket | In Labor Force | Unemployed |
| 16 to 19 Years | 127 (23.3%) | 61 (48.0%) |
| 20 to 24 Years | 509 (64.8%) | 91 (17.9%) |
| 25 to 29 Years | 731 (89.5%) | 11 (1.5%) |
| 30 to 34 Years | 532 (68.5%) | 85 (16.0%) |
| 35 to 44 Years | 983 (60.0%) | 106 (10.8%) |
| 45 to 54 Years | 1,239 (60.2%) | 83 (6.7%) |
| 55 to 59 Years | 431 (46.3%) | 5 (1.2%) |
| 60 to 64 Years | 466 (39.7%) | 15 (3.2%) |
| 65 to 74 Years | 239 (14.6%) | 3 (1.3%) |
| 75 Years and over | 16 (1.5%) | 0 (0.0%) |
| Total | 5,272 (46.1%) | 459 (8.7%) |
Employment Status by Educational Attainment in Estill County
According to labor force statistics for Estill County, 59.3% of individuals (4,386) out of the total population between 25 and 64 years of age (7,396) are in the labor force, with 7.0% or 307 of them being unemployed. The group with the highest labor force participation rate are those with the educational attainment of bachelor's degree or higher, with 81.0% or 744 individuals in the labor force. Within the labor force, individuals with high school diploma education have the highest percentage of unemployment, with 12.3% or 244 of them being unemployed.
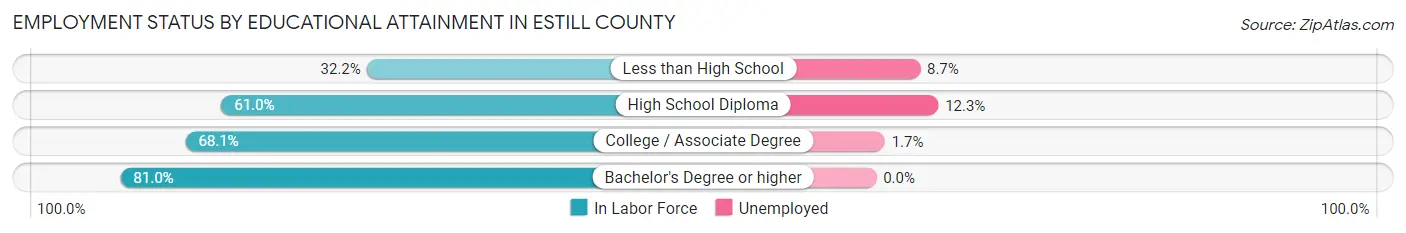
| Educational Attainment | In Labor Force | Unemployed |
| Less than High School | 484 (32.2%) | 131 (8.7%) |
| High School Diploma | 1,984 (61.0%) | 400 (12.3%) |
| College / Associate Degree | 1,172 (68.1%) | 29 (1.7%) |
| Bachelor's Degree or higher | 744 (81.0%) | 0 (0.0%) |
| Total | 4,386 (59.3%) | 518 (7.0%) |
Employment Occupations by Sex in Estill County
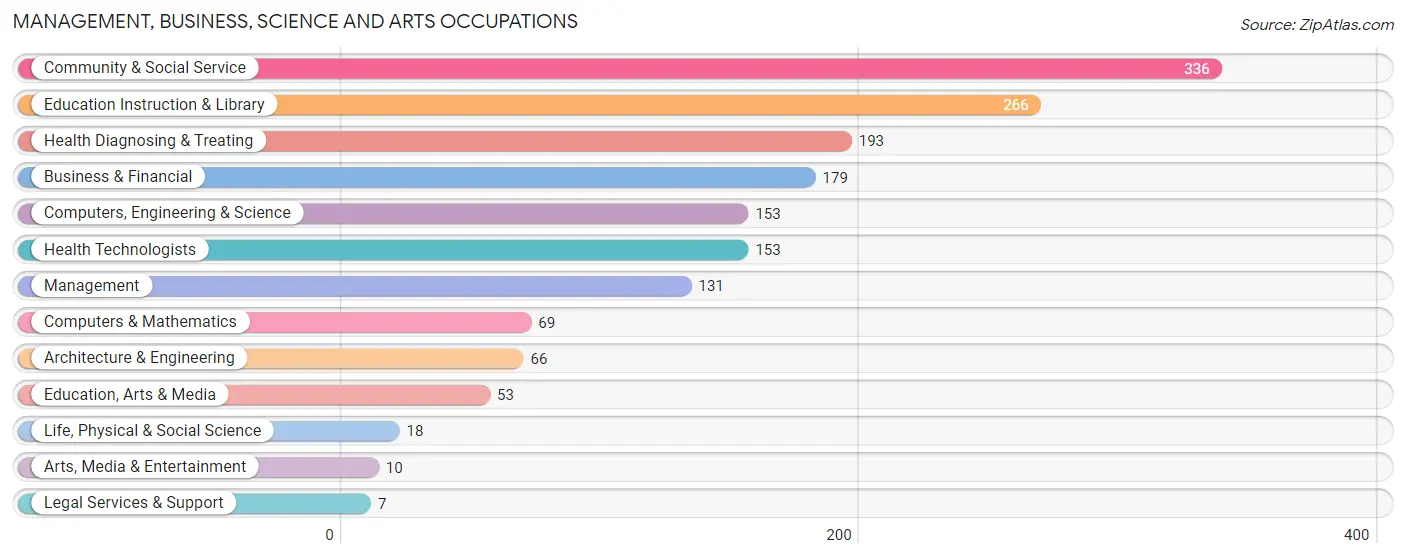
Management, Business, Science and Arts Occupations
The most common Management, Business, Science and Arts occupations in Estill County are Community & Social Service (336 | 7.0%), Education Instruction & Library (266 | 5.5%), Health Diagnosing & Treating (193 | 4.0%), Business & Financial (179 | 3.7%), and Computers, Engineering & Science (153 | 3.2%).
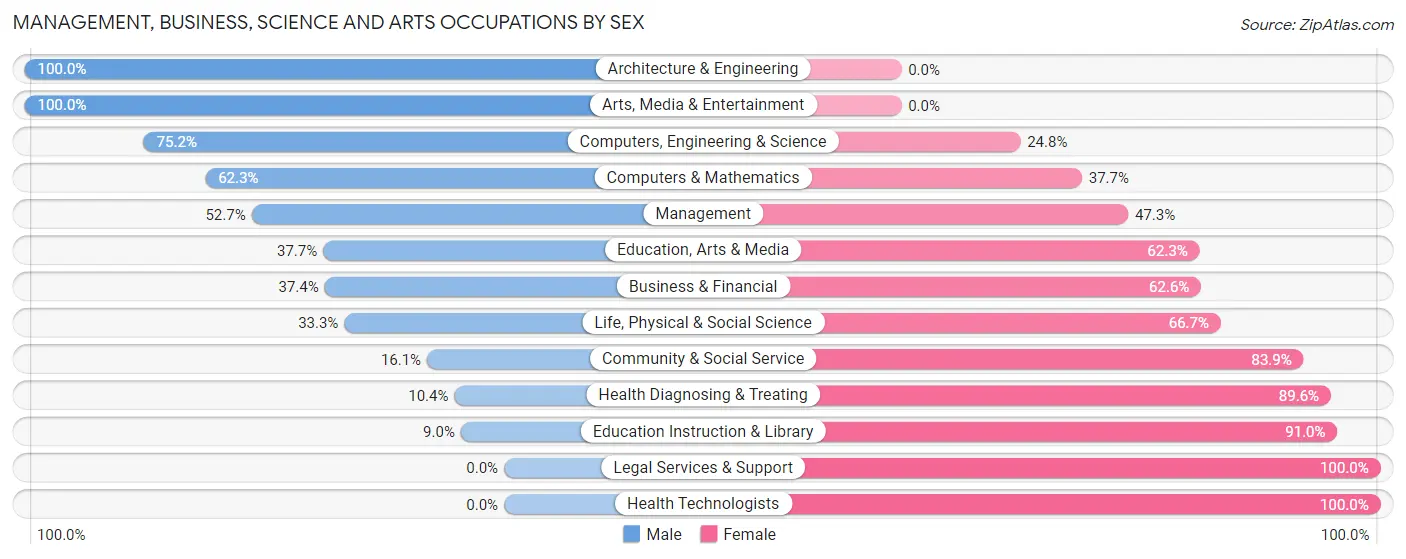
Management, Business, Science and Arts Occupations by Sex
Within the Management, Business, Science and Arts occupations in Estill County, the most male-oriented occupations are Architecture & Engineering (100.0%), Arts, Media & Entertainment (100.0%), and Computers, Engineering & Science (75.2%), while the most female-oriented occupations are Legal Services & Support (100.0%), Health Technologists (100.0%), and Education Instruction & Library (91.0%).
| Occupation | Male | Female |
| Management | 69 (52.7%) | 62 (47.3%) |
| Business & Financial | 67 (37.4%) | 112 (62.6%) |
| Computers, Engineering & Science | 115 (75.2%) | 38 (24.8%) |
| Computers & Mathematics | 43 (62.3%) | 26 (37.7%) |
| Architecture & Engineering | 66 (100.0%) | 0 (0.0%) |
| Life, Physical & Social Science | 6 (33.3%) | 12 (66.7%) |
| Community & Social Service | 54 (16.1%) | 282 (83.9%) |
| Education, Arts & Media | 20 (37.7%) | 33 (62.3%) |
| Legal Services & Support | 0 (0.0%) | 7 (100.0%) |
| Education Instruction & Library | 24 (9.0%) | 242 (91.0%) |
| Arts, Media & Entertainment | 10 (100.0%) | 0 (0.0%) |
| Health Diagnosing & Treating | 20 (10.4%) | 173 (89.6%) |
| Health Technologists | 0 (0.0%) | 153 (100.0%) |
| Total (Category) | 325 (32.8%) | 667 (67.2%) |
| Total (Overall) | 2,593 (53.8%) | 2,222 (46.2%) |
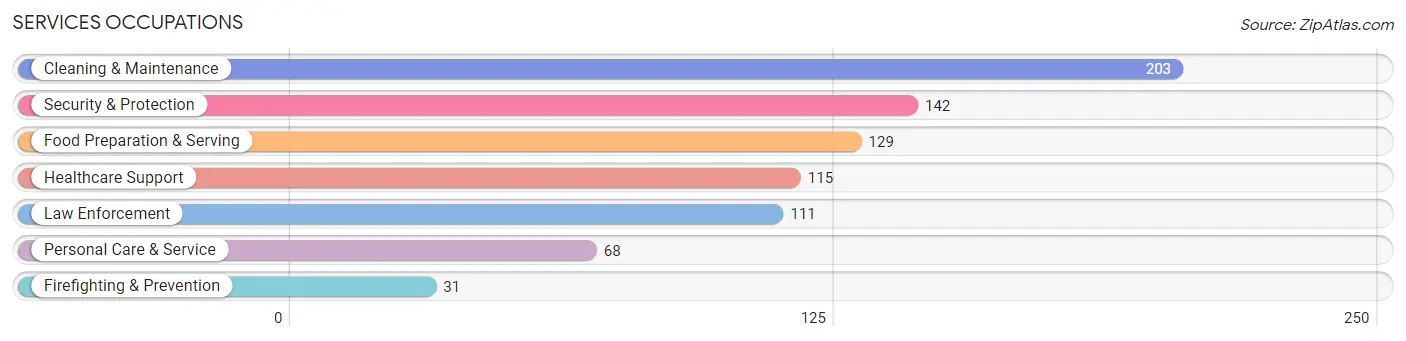
Services Occupations
The most common Services occupations in Estill County are Cleaning & Maintenance (203 | 4.2%), Security & Protection (142 | 2.9%), Food Preparation & Serving (129 | 2.7%), Healthcare Support (115 | 2.4%), and Law Enforcement (111 | 2.3%).
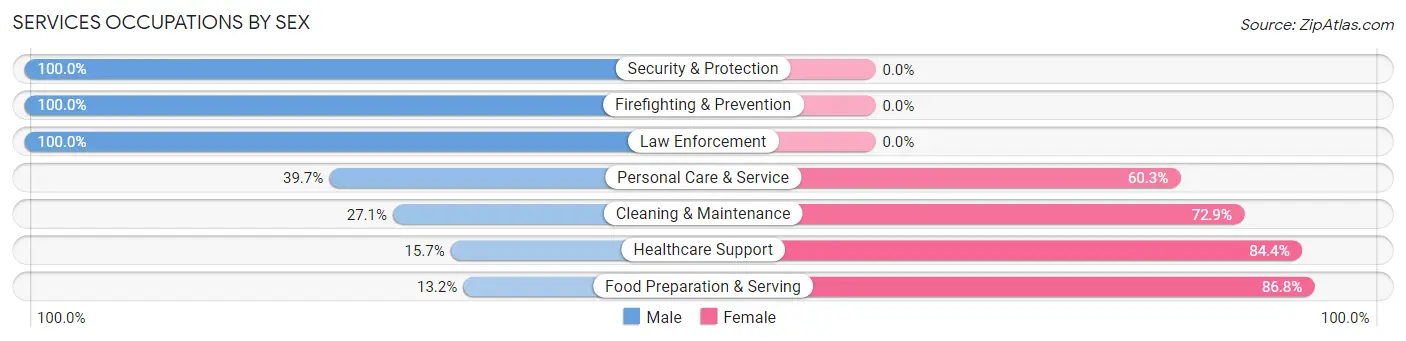
Services Occupations by Sex
Within the Services occupations in Estill County, the most male-oriented occupations are Security & Protection (100.0%), Firefighting & Prevention (100.0%), and Law Enforcement (100.0%), while the most female-oriented occupations are Food Preparation & Serving (86.8%), Healthcare Support (84.4%), and Cleaning & Maintenance (72.9%).
| Occupation | Male | Female |
| Healthcare Support | 18 (15.7%) | 97 (84.4%) |
| Security & Protection | 142 (100.0%) | 0 (0.0%) |
| Firefighting & Prevention | 31 (100.0%) | 0 (0.0%) |
| Law Enforcement | 111 (100.0%) | 0 (0.0%) |
| Food Preparation & Serving | 17 (13.2%) | 112 (86.8%) |
| Cleaning & Maintenance | 55 (27.1%) | 148 (72.9%) |
| Personal Care & Service | 27 (39.7%) | 41 (60.3%) |
| Total (Category) | 259 (39.4%) | 398 (60.6%) |
| Total (Overall) | 2,593 (53.8%) | 2,222 (46.2%) |
Sales and Office Occupations
The most common Sales and Office occupations in Estill County are Office & Administration (634 | 13.2%), and Sales & Related (537 | 11.2%).

Sales and Office Occupations by Sex
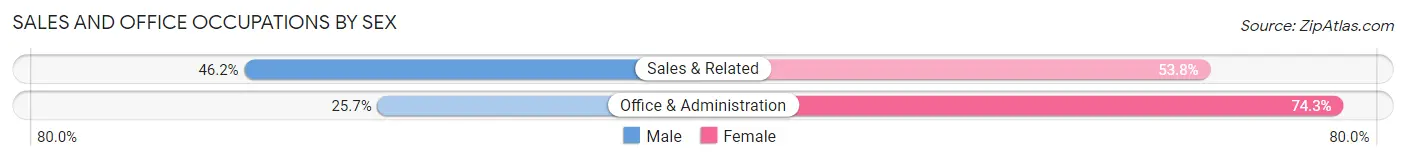
| Occupation | Male | Female |
| Sales & Related | 248 (46.2%) | 289 (53.8%) |
| Office & Administration | 163 (25.7%) | 471 (74.3%) |
| Total (Category) | 411 (35.1%) | 760 (64.9%) |
| Total (Overall) | 2,593 (53.8%) | 2,222 (46.2%) |
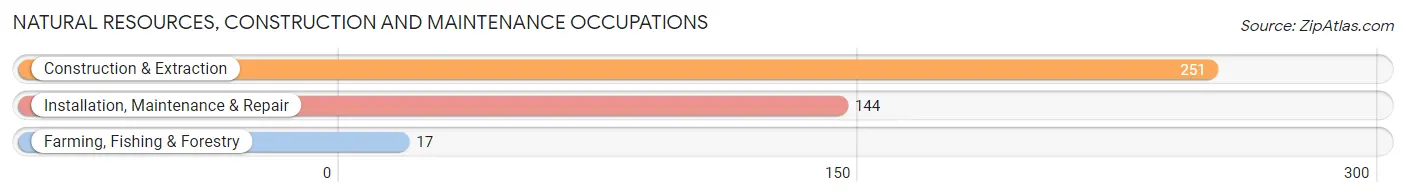
Natural Resources, Construction and Maintenance Occupations
The most common Natural Resources, Construction and Maintenance occupations in Estill County are Construction & Extraction (251 | 5.2%), Installation, Maintenance & Repair (144 | 3.0%), and Farming, Fishing & Forestry (17 | 0.4%).
Natural Resources, Construction and Maintenance Occupations by Sex
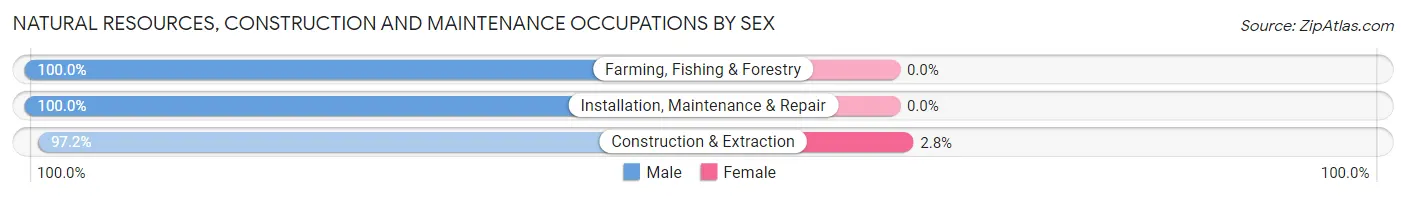
| Occupation | Male | Female |
| Farming, Fishing & Forestry | 17 (100.0%) | 0 (0.0%) |
| Construction & Extraction | 244 (97.2%) | 7 (2.8%) |
| Installation, Maintenance & Repair | 144 (100.0%) | 0 (0.0%) |
| Total (Category) | 405 (98.3%) | 7 (1.7%) |
| Total (Overall) | 2,593 (53.8%) | 2,222 (46.2%) |
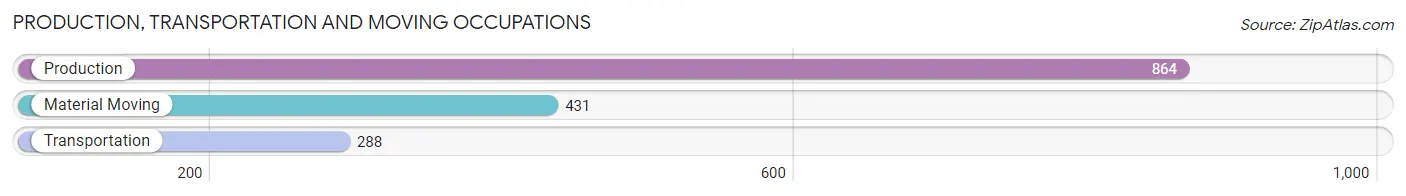
Production, Transportation and Moving Occupations
The most common Production, Transportation and Moving occupations in Estill County are Production (864 | 17.9%), Material Moving (431 | 8.9%), and Transportation (288 | 6.0%).
Production, Transportation and Moving Occupations by Sex
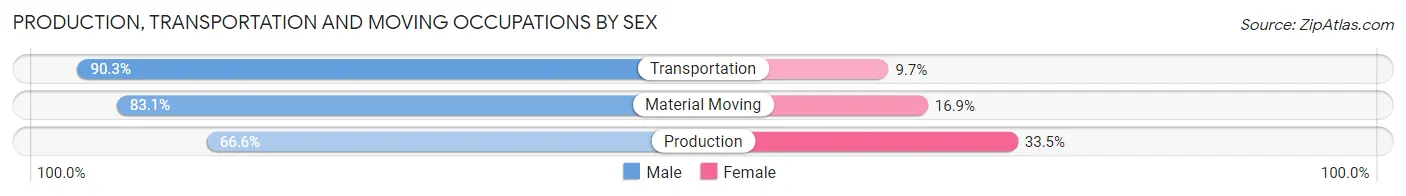
| Occupation | Male | Female |
| Production | 575 (66.5%) | 289 (33.5%) |
| Transportation | 260 (90.3%) | 28 (9.7%) |
| Material Moving | 358 (83.1%) | 73 (16.9%) |
| Total (Category) | 1,193 (75.4%) | 390 (24.6%) |
| Total (Overall) | 2,593 (53.8%) | 2,222 (46.2%) |
Employment Industries by Sex in Estill County
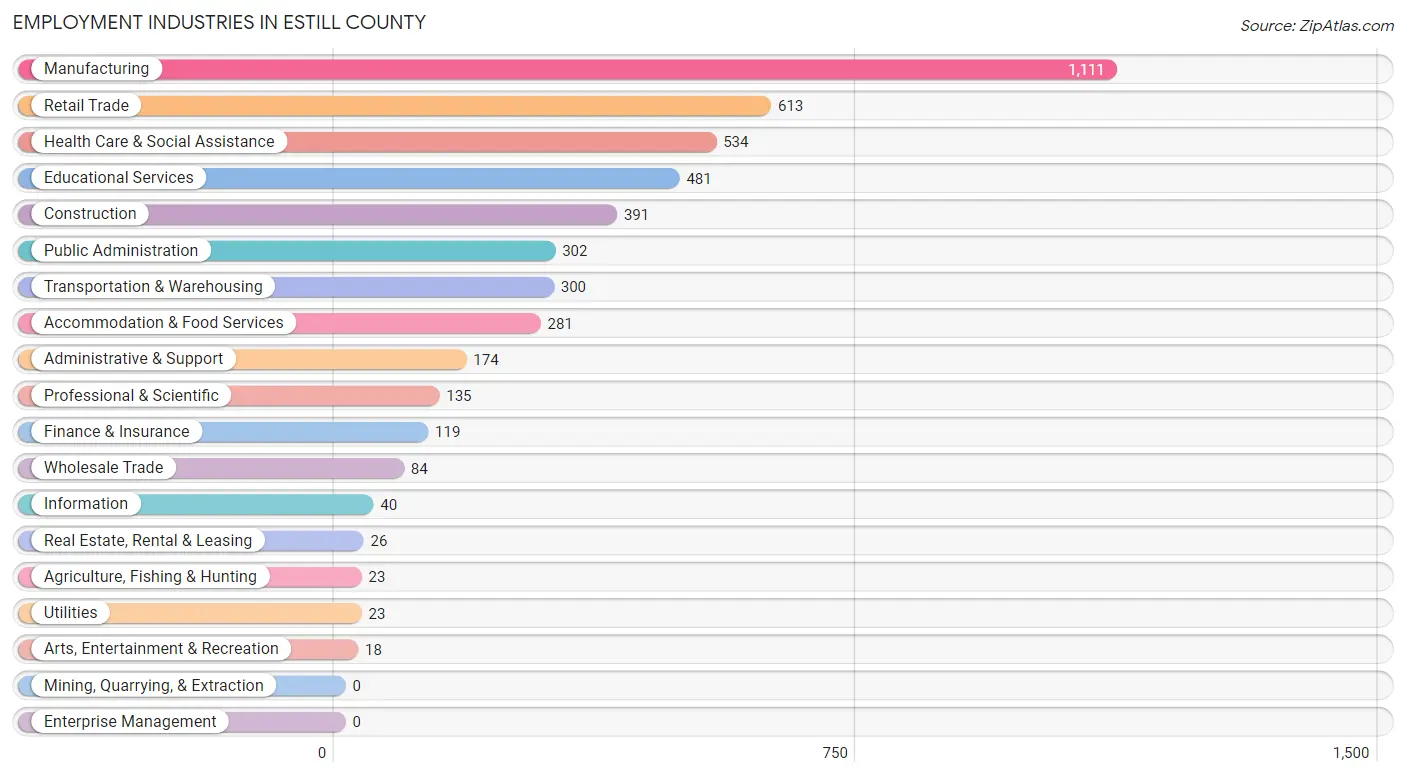
Employment Industries in Estill County
The major employment industries in Estill County include Manufacturing (1,111 | 23.1%), Retail Trade (613 | 12.7%), Health Care & Social Assistance (534 | 11.1%), Educational Services (481 | 10.0%), and Construction (391 | 8.1%).
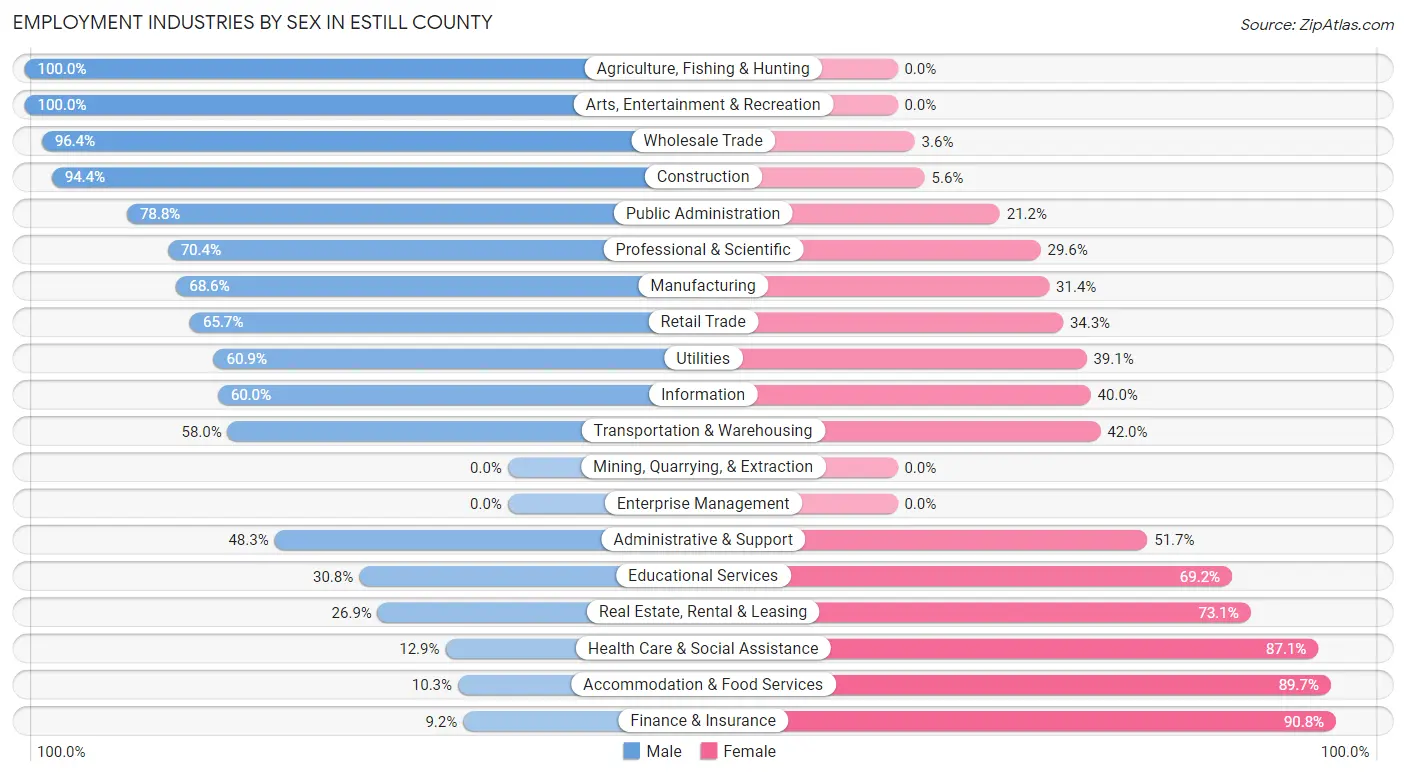
Employment Industries by Sex in Estill County
The Estill County industries that see more men than women are Agriculture, Fishing & Hunting (100.0%), Arts, Entertainment & Recreation (100.0%), and Wholesale Trade (96.4%), whereas the industries that tend to have a higher number of women are Finance & Insurance (90.8%), Accommodation & Food Services (89.7%), and Health Care & Social Assistance (87.1%).
| Industry | Male | Female |
| Agriculture, Fishing & Hunting | 23 (100.0%) | 0 (0.0%) |
| Mining, Quarrying, & Extraction | 0 (0.0%) | 0 (0.0%) |
| Construction | 369 (94.4%) | 22 (5.6%) |
| Manufacturing | 762 (68.6%) | 349 (31.4%) |
| Wholesale Trade | 81 (96.4%) | 3 (3.6%) |
| Retail Trade | 403 (65.7%) | 210 (34.3%) |
| Transportation & Warehousing | 174 (58.0%) | 126 (42.0%) |
| Utilities | 14 (60.9%) | 9 (39.1%) |
| Information | 24 (60.0%) | 16 (40.0%) |
| Finance & Insurance | 11 (9.2%) | 108 (90.8%) |
| Real Estate, Rental & Leasing | 7 (26.9%) | 19 (73.1%) |
| Professional & Scientific | 95 (70.4%) | 40 (29.6%) |
| Enterprise Management | 0 (0.0%) | 0 (0.0%) |
| Administrative & Support | 84 (48.3%) | 90 (51.7%) |
| Educational Services | 148 (30.8%) | 333 (69.2%) |
| Health Care & Social Assistance | 69 (12.9%) | 465 (87.1%) |
| Arts, Entertainment & Recreation | 18 (100.0%) | 0 (0.0%) |
| Accommodation & Food Services | 29 (10.3%) | 252 (89.7%) |
| Public Administration | 238 (78.8%) | 64 (21.2%) |
| Total | 2,593 (53.8%) | 2,222 (46.2%) |
Education in Estill County
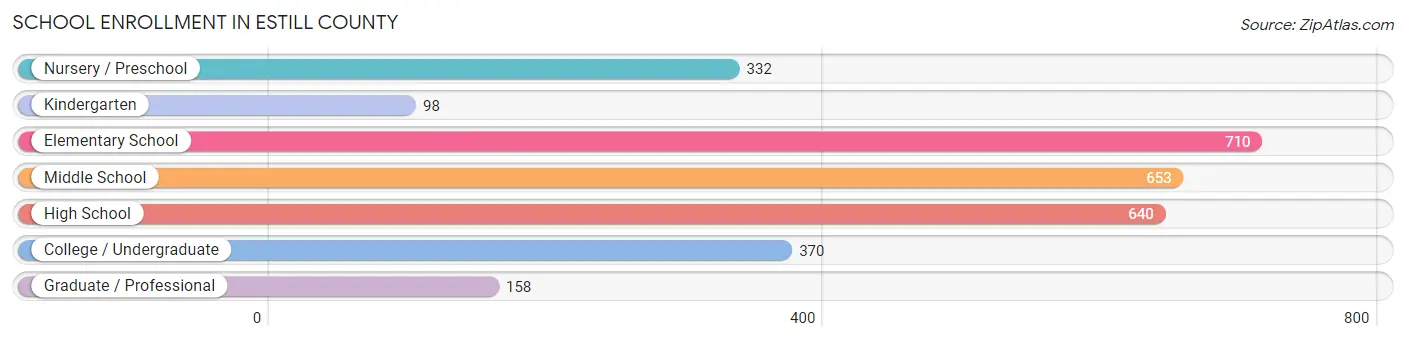
School Enrollment in Estill County
The most common levels of schooling among the 2,961 students in Estill County are elementary school (710 | 24.0%), middle school (653 | 22.1%), and high school (640 | 21.6%).
| School Level | # Students | % Students |
| Nursery / Preschool | 332 | 11.2% |
| Kindergarten | 98 | 3.3% |
| Elementary School | 710 | 24.0% |
| Middle School | 653 | 22.1% |
| High School | 640 | 21.6% |
| College / Undergraduate | 370 | 12.5% |
| Graduate / Professional | 158 | 5.3% |
| Total | 2,961 | 100.0% |
School Enrollment by Age by Funding Source in Estill County
Out of a total of 2,961 students who are enrolled in schools in Estill County, 266 (9.0%) attend a private institution, while the remaining 2,695 (91.0%) are enrolled in public schools. The age group of 35 years and over has the highest likelihood of being enrolled in private schools, with 89 (38.7% in the age bracket) enrolled. Conversely, the age group of 3 to 4 year olds has the lowest likelihood of being enrolled in a private school, with 127 (100.0% in the age bracket) attending a public institution.
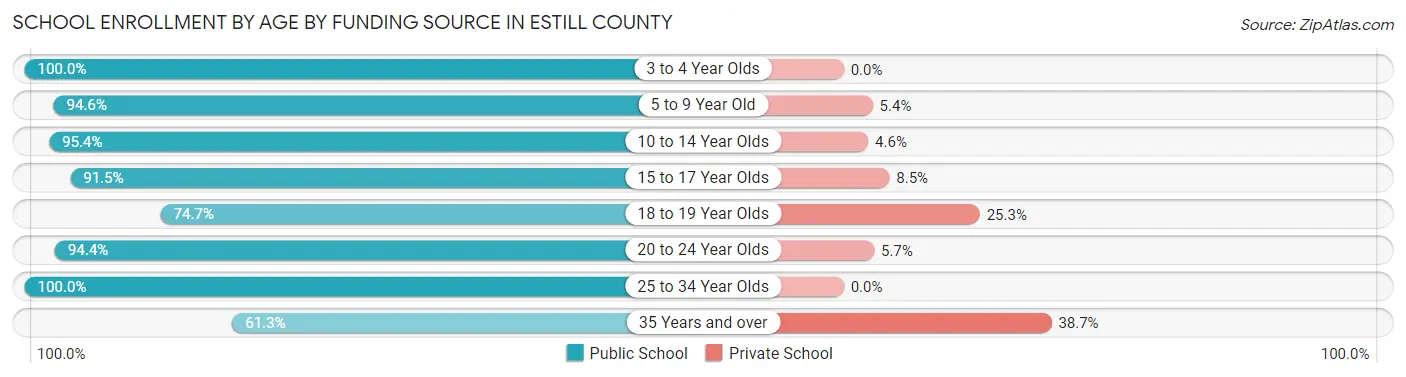
| Age Bracket | Public School | Private School |
| 3 to 4 Year Olds | 127 (100.0%) | 0 (0.0%) |
| 5 to 9 Year Old | 911 (94.6%) | 52 (5.4%) |
| 10 to 14 Year Olds | 669 (95.4%) | 32 (4.6%) |
| 15 to 17 Year Olds | 527 (91.5%) | 49 (8.5%) |
| 18 to 19 Year Olds | 109 (74.7%) | 37 (25.3%) |
| 20 to 24 Year Olds | 117 (94.4%) | 7 (5.7%) |
| 25 to 34 Year Olds | 94 (100.0%) | 0 (0.0%) |
| 35 Years and over | 141 (61.3%) | 89 (38.7%) |
| Total | 2,695 (91.0%) | 266 (9.0%) |
Educational Attainment by Field of Study in Estill County
Science & technology (370 | 29.9%), education (200 | 16.2%), business (152 | 12.3%), arts & humanities (117 | 9.5%), and bio, nature & agricultural (61 | 4.9%) are the most common fields of study among 1,238 individuals in Estill County who have obtained a bachelor's degree or higher.
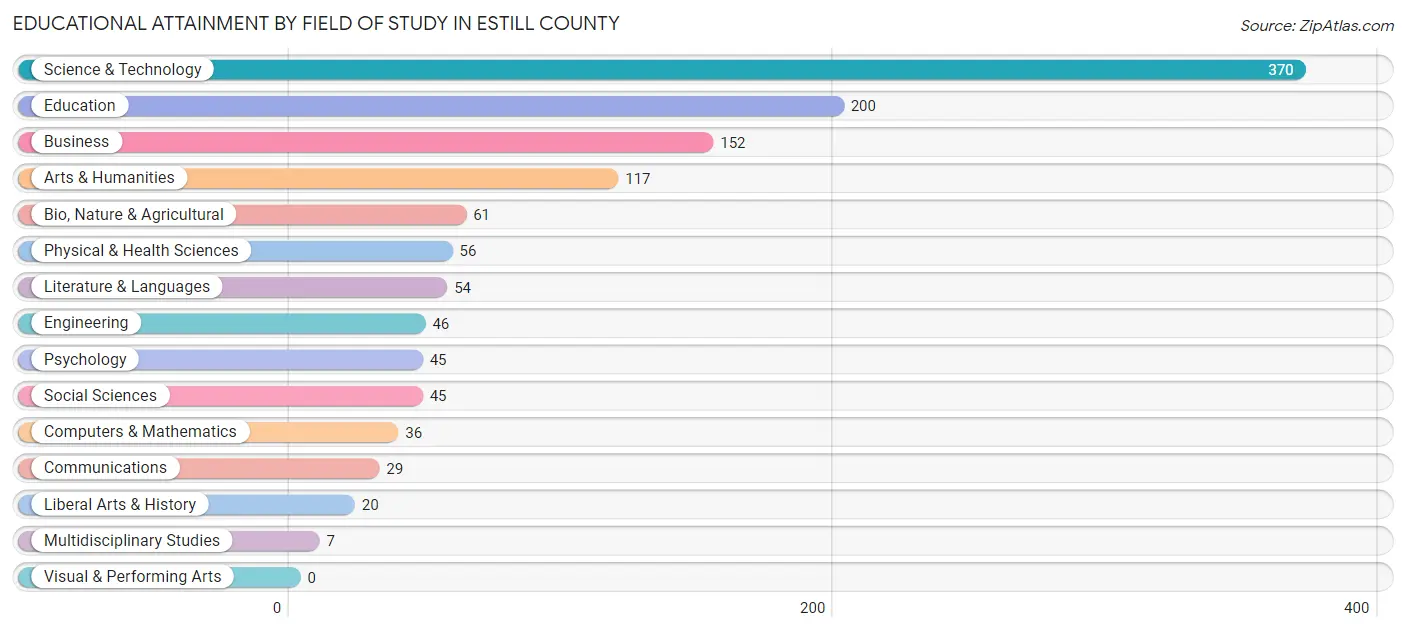
| Field of Study | # Graduates | % Graduates |
| Computers & Mathematics | 36 | 2.9% |
| Bio, Nature & Agricultural | 61 | 4.9% |
| Physical & Health Sciences | 56 | 4.5% |
| Psychology | 45 | 3.6% |
| Social Sciences | 45 | 3.6% |
| Engineering | 46 | 3.7% |
| Multidisciplinary Studies | 7 | 0.6% |
| Science & Technology | 370 | 29.9% |
| Business | 152 | 12.3% |
| Education | 200 | 16.2% |
| Literature & Languages | 54 | 4.4% |
| Liberal Arts & History | 20 | 1.6% |
| Visual & Performing Arts | 0 | 0.0% |
| Communications | 29 | 2.3% |
| Arts & Humanities | 117 | 9.5% |
| Total | 1,238 | 100.0% |
Transportation & Commute in Estill County
Vehicle Availability by Sex in Estill County
The most prevalent vehicle ownership categories in Estill County are males with 2 vehicles (1,027, accounting for 41.6%) and females with 2 vehicles (938, making up 48.9%).
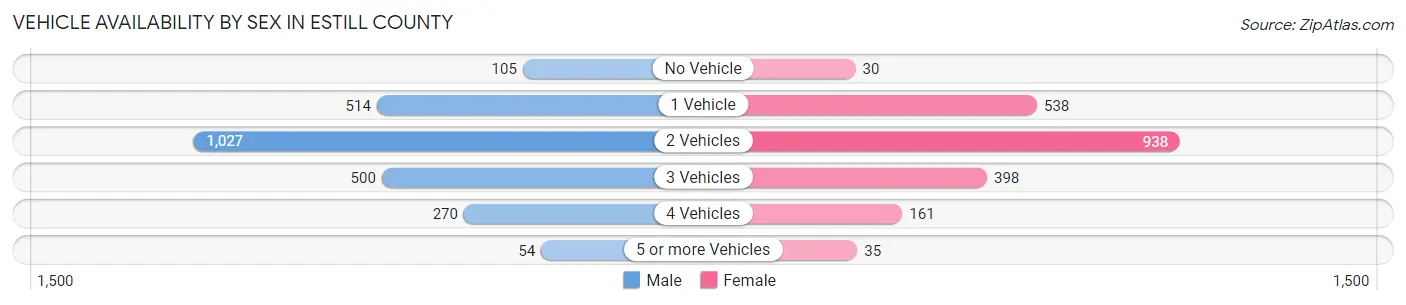
| Vehicles Available | Male | Female |
| No Vehicle | 105 (4.3%) | 30 (1.4%) |
| 1 Vehicle | 514 (20.8%) | 538 (25.6%) |
| 2 Vehicles | 1,027 (41.6%) | 938 (44.7%) |
| 3 Vehicles | 500 (20.2%) | 398 (19.0%) |
| 4 Vehicles | 270 (10.9%) | 161 (7.7%) |
| 5 or more Vehicles | 54 (2.2%) | 35 (1.7%) |
| Total | 2,470 (100.0%) | 2,100 (100.0%) |
Commute Time in Estill County
The most frequently occuring commute durations in Estill County are 30 to 34 minutes (520 commuters, 12.0%), 5 to 9 minutes (472 commuters, 10.9%), and 60 to 89 minutes (436 commuters, 10.0%).
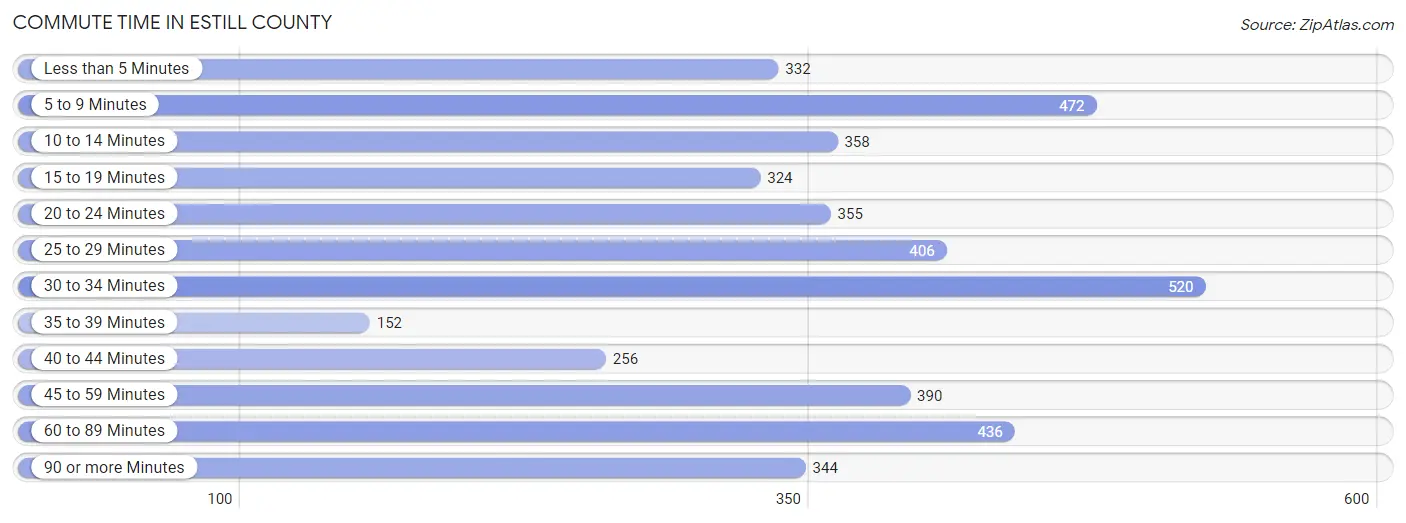
| Commute Time | # Commuters | % Commuters |
| Less than 5 Minutes | 332 | 7.6% |
| 5 to 9 Minutes | 472 | 10.9% |
| 10 to 14 Minutes | 358 | 8.2% |
| 15 to 19 Minutes | 324 | 7.5% |
| 20 to 24 Minutes | 355 | 8.2% |
| 25 to 29 Minutes | 406 | 9.3% |
| 30 to 34 Minutes | 520 | 12.0% |
| 35 to 39 Minutes | 152 | 3.5% |
| 40 to 44 Minutes | 256 | 5.9% |
| 45 to 59 Minutes | 390 | 9.0% |
| 60 to 89 Minutes | 436 | 10.0% |
| 90 or more Minutes | 344 | 7.9% |
Commute Time by Sex in Estill County
The most common commute times in Estill County are 30 to 34 minutes (355 commuters, 15.0%) for males and 25 to 29 minutes (245 commuters, 12.4%) for females.
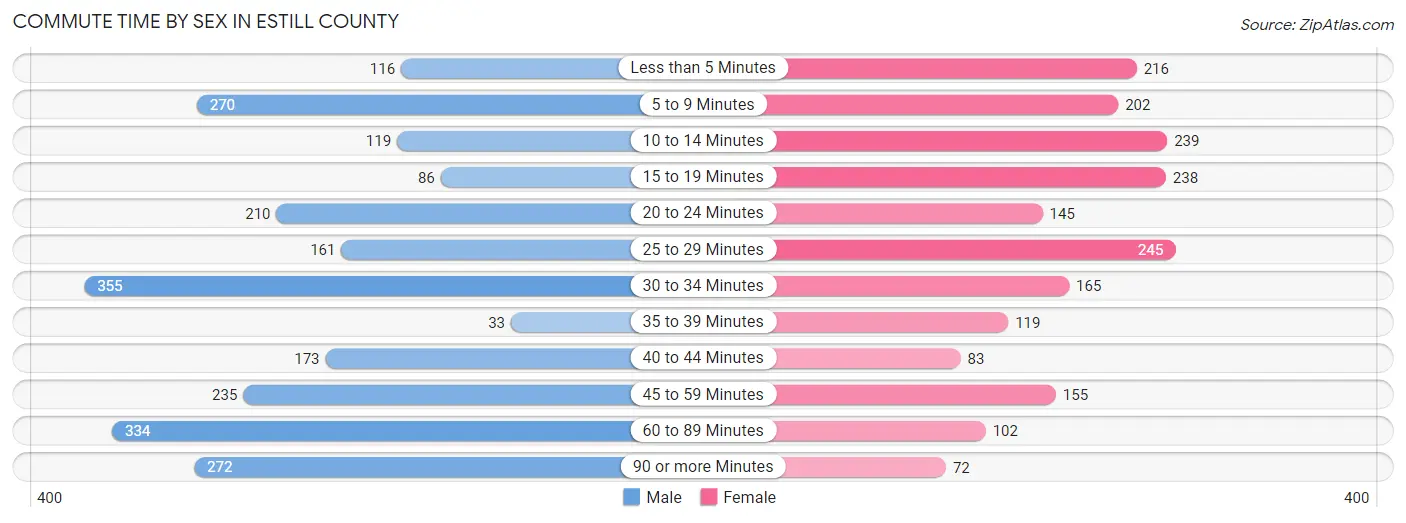
| Commute Time | Male | Female |
| Less than 5 Minutes | 116 (4.9%) | 216 (10.9%) |
| 5 to 9 Minutes | 270 (11.4%) | 202 (10.2%) |
| 10 to 14 Minutes | 119 (5.0%) | 239 (12.1%) |
| 15 to 19 Minutes | 86 (3.6%) | 238 (12.0%) |
| 20 to 24 Minutes | 210 (8.9%) | 145 (7.3%) |
| 25 to 29 Minutes | 161 (6.8%) | 245 (12.4%) |
| 30 to 34 Minutes | 355 (15.0%) | 165 (8.3%) |
| 35 to 39 Minutes | 33 (1.4%) | 119 (6.0%) |
| 40 to 44 Minutes | 173 (7.3%) | 83 (4.2%) |
| 45 to 59 Minutes | 235 (9.9%) | 155 (7.8%) |
| 60 to 89 Minutes | 334 (14.1%) | 102 (5.1%) |
| 90 or more Minutes | 272 (11.5%) | 72 (3.6%) |
Time of Departure to Work by Sex in Estill County
The most frequent times of departure to work in Estill County are 6:30 AM to 6:59 AM (393, 16.6%) for males and 7:00 AM to 7:29 AM (410, 20.7%) for females.
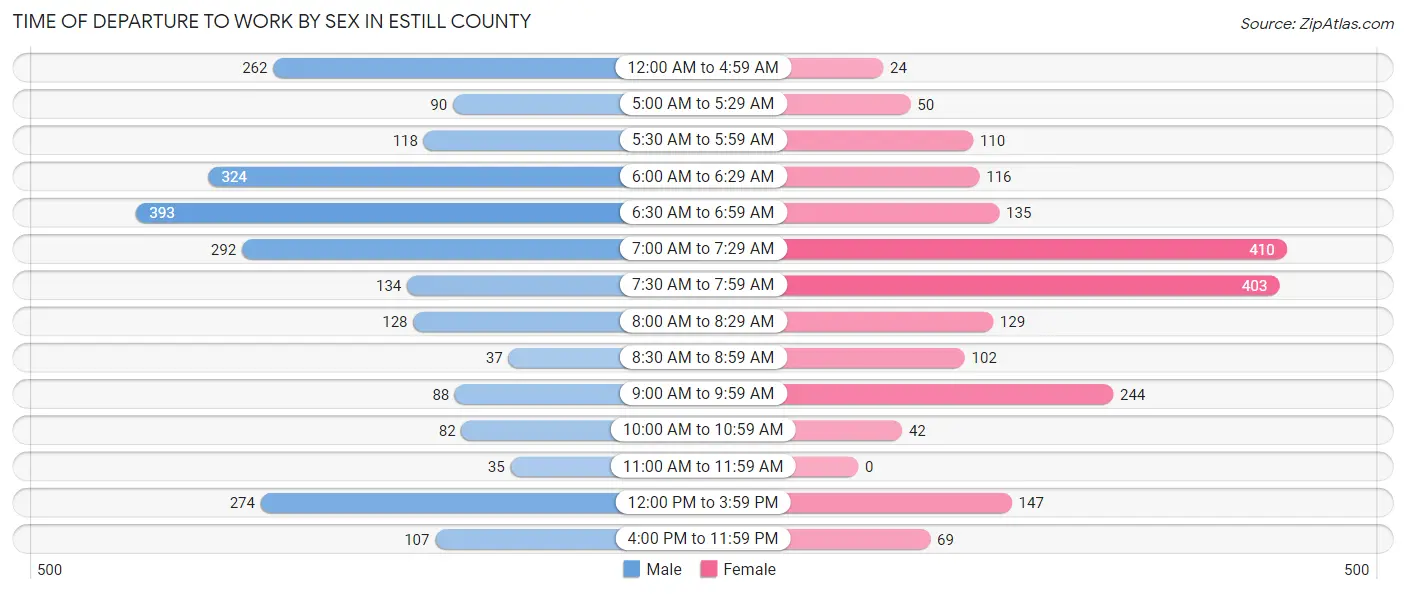
| Time of Departure | Male | Female |
| 12:00 AM to 4:59 AM | 262 (11.1%) | 24 (1.2%) |
| 5:00 AM to 5:29 AM | 90 (3.8%) | 50 (2.5%) |
| 5:30 AM to 5:59 AM | 118 (5.0%) | 110 (5.6%) |
| 6:00 AM to 6:29 AM | 324 (13.7%) | 116 (5.9%) |
| 6:30 AM to 6:59 AM | 393 (16.6%) | 135 (6.8%) |
| 7:00 AM to 7:29 AM | 292 (12.3%) | 410 (20.7%) |
| 7:30 AM to 7:59 AM | 134 (5.7%) | 403 (20.3%) |
| 8:00 AM to 8:29 AM | 128 (5.4%) | 129 (6.5%) |
| 8:30 AM to 8:59 AM | 37 (1.6%) | 102 (5.1%) |
| 9:00 AM to 9:59 AM | 88 (3.7%) | 244 (12.3%) |
| 10:00 AM to 10:59 AM | 82 (3.5%) | 42 (2.1%) |
| 11:00 AM to 11:59 AM | 35 (1.5%) | 0 (0.0%) |
| 12:00 PM to 3:59 PM | 274 (11.6%) | 147 (7.4%) |
| 4:00 PM to 11:59 PM | 107 (4.5%) | 69 (3.5%) |
| Total | 2,364 (100.0%) | 1,981 (100.0%) |
Housing Occupancy in Estill County
Occupancy by Ownership in Estill County
Of the total 5,740 dwellings in Estill County, owner-occupied units account for 4,239 (73.9%), while renter-occupied units make up 1,501 (26.2%).
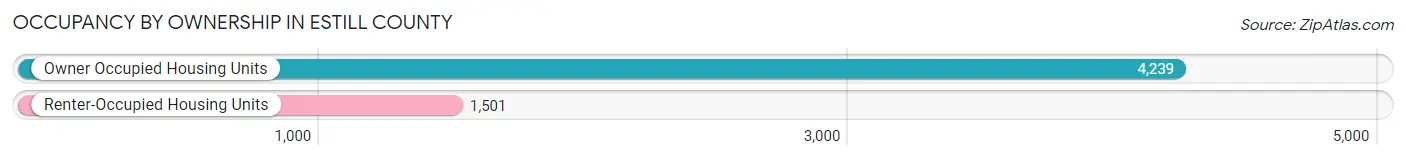
| Occupancy | # Housing Units | % Housing Units |
| Owner Occupied Housing Units | 4,239 | 73.9% |
| Renter-Occupied Housing Units | 1,501 | 26.2% |
| Total Occupied Housing Units | 5,740 | 100.0% |
Occupancy by Household Size in Estill County
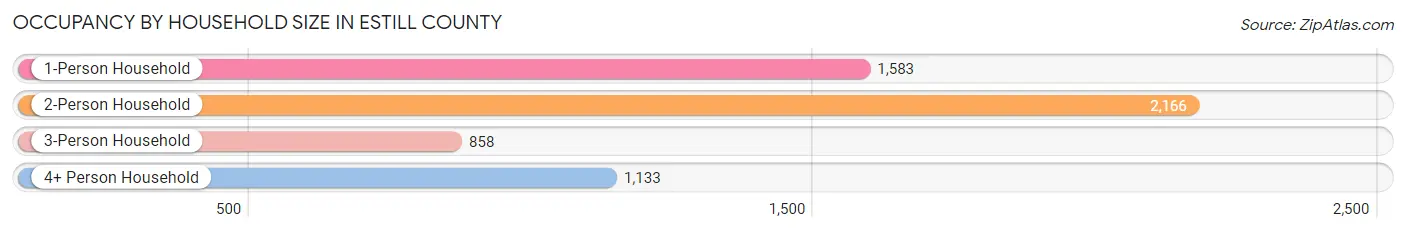
| Household Size | # Housing Units | % Housing Units |
| 1-Person Household | 1,583 | 27.6% |
| 2-Person Household | 2,166 | 37.7% |
| 3-Person Household | 858 | 14.9% |
| 4+ Person Household | 1,133 | 19.7% |
| Total Housing Units | 5,740 | 100.0% |
Occupancy by Ownership by Household Size in Estill County
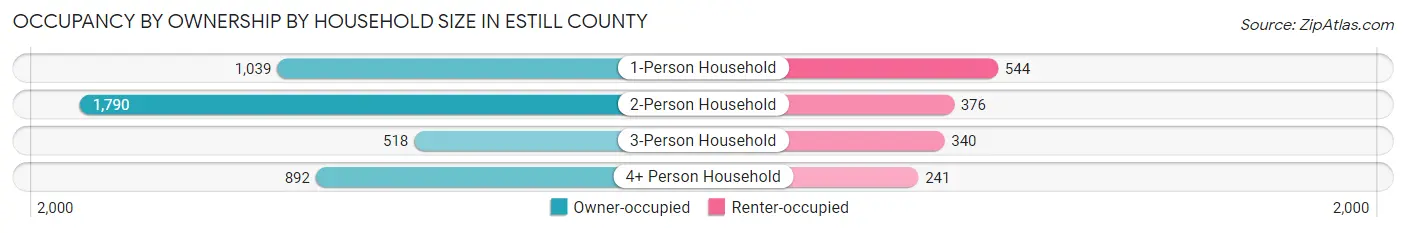
| Household Size | Owner-occupied | Renter-occupied |
| 1-Person Household | 1,039 (65.6%) | 544 (34.4%) |
| 2-Person Household | 1,790 (82.6%) | 376 (17.4%) |
| 3-Person Household | 518 (60.4%) | 340 (39.6%) |
| 4+ Person Household | 892 (78.7%) | 241 (21.3%) |
| Total Housing Units | 4,239 (73.9%) | 1,501 (26.2%) |
Occupancy by Educational Attainment in Estill County
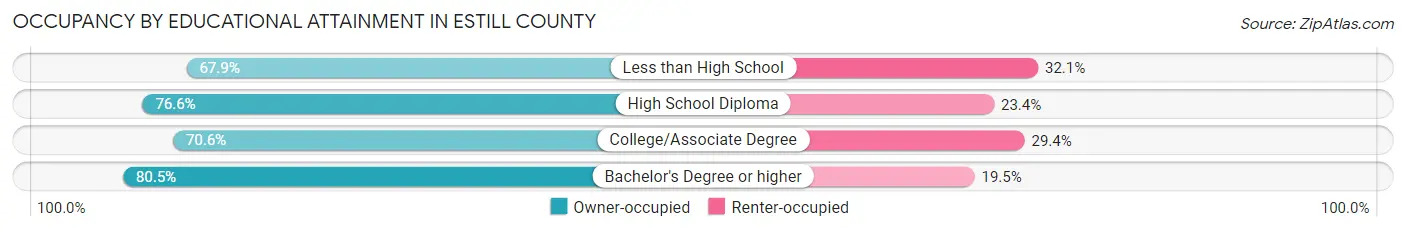
| Household Size | Owner-occupied | Renter-occupied |
| Less than High School | 825 (67.9%) | 390 (32.1%) |
| High School Diploma | 1,984 (76.6%) | 605 (23.4%) |
| College/Associate Degree | 914 (70.6%) | 381 (29.4%) |
| Bachelor's Degree or higher | 516 (80.5%) | 125 (19.5%) |
Occupancy by Age of Householder in Estill County
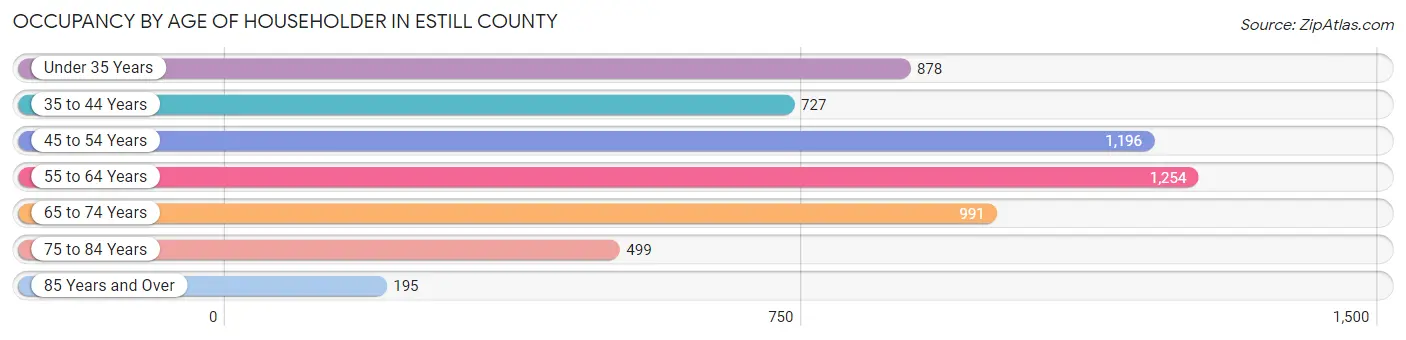
| Age Bracket | # Households | % Households |
| Under 35 Years | 878 | 15.3% |
| 35 to 44 Years | 727 | 12.7% |
| 45 to 54 Years | 1,196 | 20.8% |
| 55 to 64 Years | 1,254 | 21.8% |
| 65 to 74 Years | 991 | 17.3% |
| 75 to 84 Years | 499 | 8.7% |
| 85 Years and Over | 195 | 3.4% |
| Total | 5,740 | 100.0% |
Housing Finances in Estill County
Median Income by Occupancy in Estill County
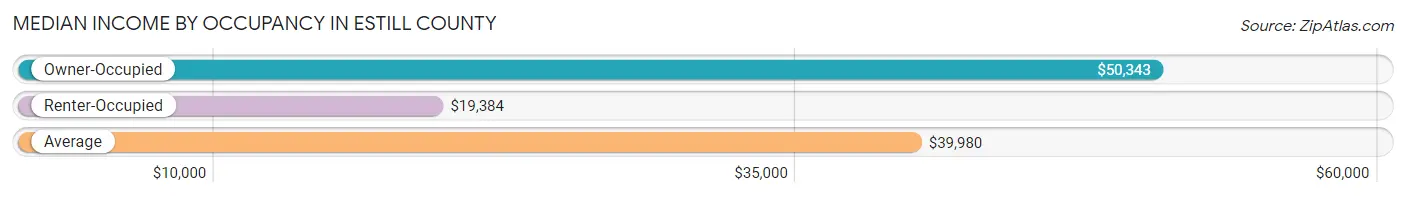
| Occupancy Type | # Households | Median Income |
| Owner-Occupied | 4,239 (73.9%) | $50,343 |
| Renter-Occupied | 1,501 (26.2%) | $19,384 |
| Average | 5,740 (100.0%) | $39,980 |
Occupancy by Householder Income Bracket in Estill County
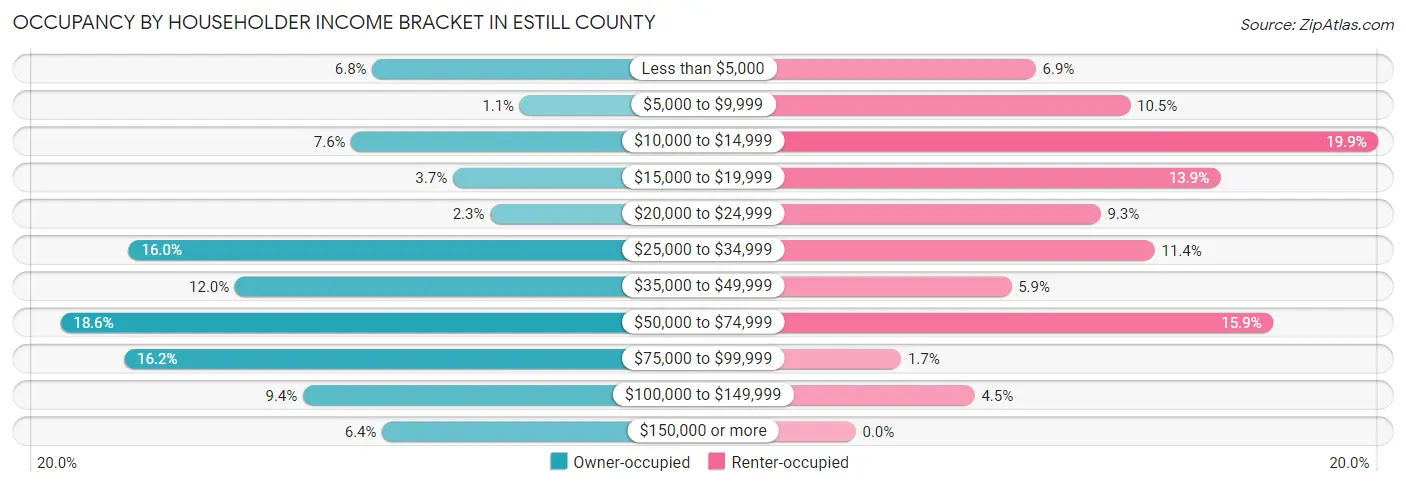
| Income Bracket | Owner-occupied | Renter-occupied |
| Less than $5,000 | 286 (6.8%) | 103 (6.9%) |
| $5,000 to $9,999 | 48 (1.1%) | 157 (10.5%) |
| $10,000 to $14,999 | 320 (7.5%) | 299 (19.9%) |
| $15,000 to $19,999 | 156 (3.7%) | 209 (13.9%) |
| $20,000 to $24,999 | 96 (2.3%) | 140 (9.3%) |
| $25,000 to $34,999 | 680 (16.0%) | 171 (11.4%) |
| $35,000 to $49,999 | 508 (12.0%) | 89 (5.9%) |
| $50,000 to $74,999 | 790 (18.6%) | 239 (15.9%) |
| $75,000 to $99,999 | 687 (16.2%) | 26 (1.7%) |
| $100,000 to $149,999 | 398 (9.4%) | 68 (4.5%) |
| $150,000 or more | 270 (6.4%) | 0 (0.0%) |
| Total | 4,239 (100.0%) | 1,501 (100.0%) |
Monthly Housing Cost Tiers in Estill County
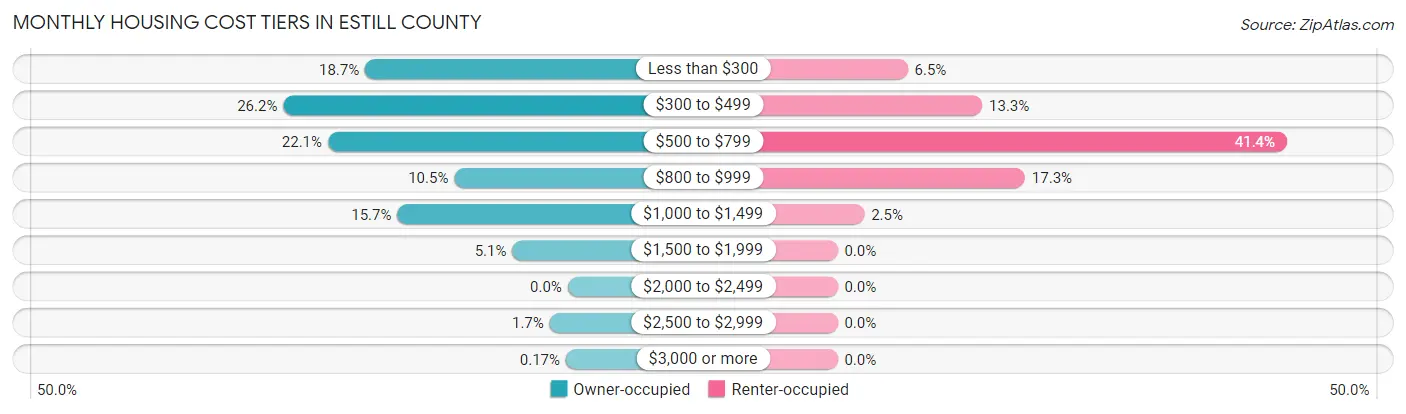
| Monthly Cost | Owner-occupied | Renter-occupied |
| Less than $300 | 791 (18.7%) | 97 (6.5%) |
| $300 to $499 | 1,110 (26.2%) | 200 (13.3%) |
| $500 to $799 | 936 (22.1%) | 621 (41.4%) |
| $800 to $999 | 443 (10.4%) | 259 (17.3%) |
| $1,000 to $1,499 | 665 (15.7%) | 37 (2.5%) |
| $1,500 to $1,999 | 216 (5.1%) | 0 (0.0%) |
| $2,000 to $2,499 | 0 (0.0%) | 0 (0.0%) |
| $2,500 to $2,999 | 71 (1.7%) | 0 (0.0%) |
| $3,000 or more | 7 (0.2%) | 0 (0.0%) |
| Total | 4,239 (100.0%) | 1,501 (100.0%) |
Physical Housing Characteristics in Estill County
Housing Structures in Estill County
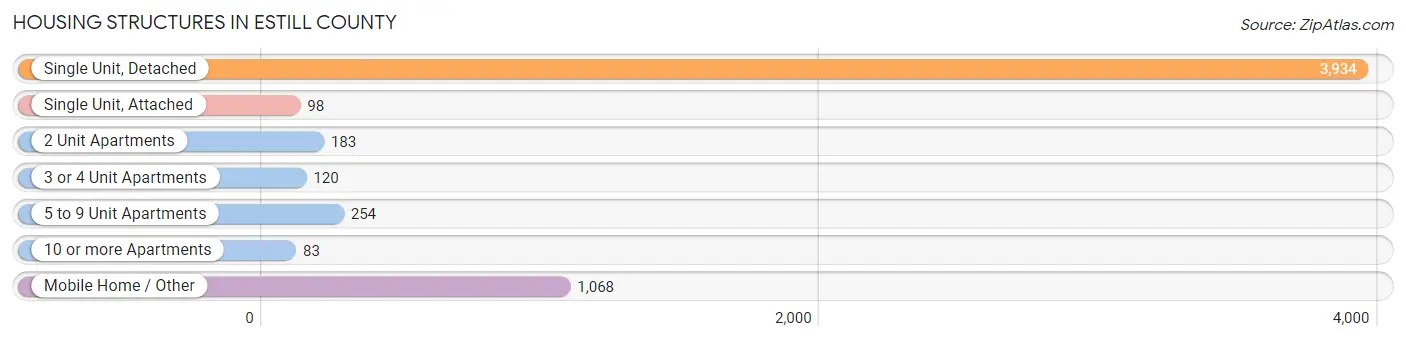
| Structure Type | # Housing Units | % Housing Units |
| Single Unit, Detached | 3,934 | 68.5% |
| Single Unit, Attached | 98 | 1.7% |
| 2 Unit Apartments | 183 | 3.2% |
| 3 or 4 Unit Apartments | 120 | 2.1% |
| 5 to 9 Unit Apartments | 254 | 4.4% |
| 10 or more Apartments | 83 | 1.5% |
| Mobile Home / Other | 1,068 | 18.6% |
| Total | 5,740 | 100.0% |
Housing Structures by Occupancy in Estill County
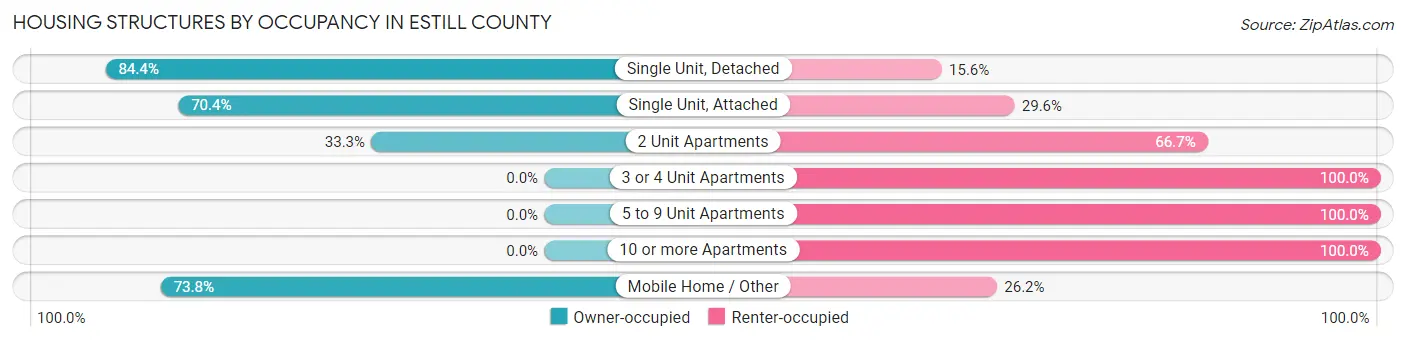
| Structure Type | Owner-occupied | Renter-occupied |
| Single Unit, Detached | 3,321 (84.4%) | 613 (15.6%) |
| Single Unit, Attached | 69 (70.4%) | 29 (29.6%) |
| 2 Unit Apartments | 61 (33.3%) | 122 (66.7%) |
| 3 or 4 Unit Apartments | 0 (0.0%) | 120 (100.0%) |
| 5 to 9 Unit Apartments | 0 (0.0%) | 254 (100.0%) |
| 10 or more Apartments | 0 (0.0%) | 83 (100.0%) |
| Mobile Home / Other | 788 (73.8%) | 280 (26.2%) |
| Total | 4,239 (73.9%) | 1,501 (26.2%) |
Housing Structures by Number of Rooms in Estill County
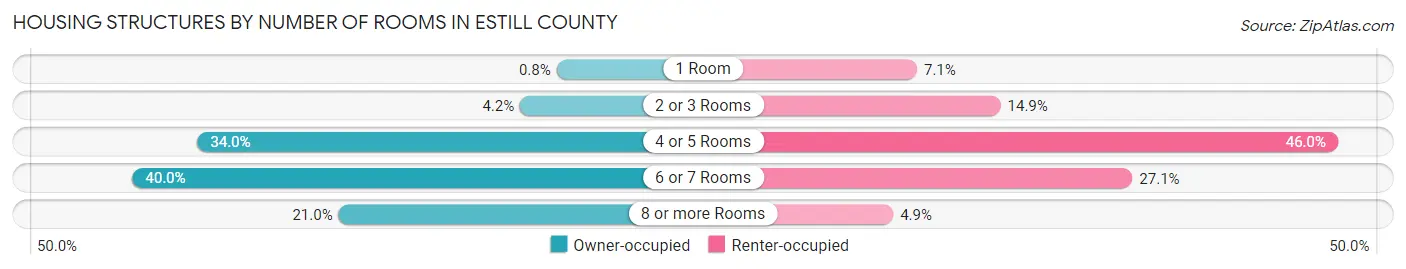
| Number of Rooms | Owner-occupied | Renter-occupied |
| 1 Room | 34 (0.8%) | 107 (7.1%) |
| 2 or 3 Rooms | 177 (4.2%) | 223 (14.9%) |
| 4 or 5 Rooms | 1,442 (34.0%) | 691 (46.0%) |
| 6 or 7 Rooms | 1,697 (40.0%) | 406 (27.1%) |
| 8 or more Rooms | 889 (21.0%) | 74 (4.9%) |
| Total | 4,239 (100.0%) | 1,501 (100.0%) |
Housing Structure by Heating Type in Estill County
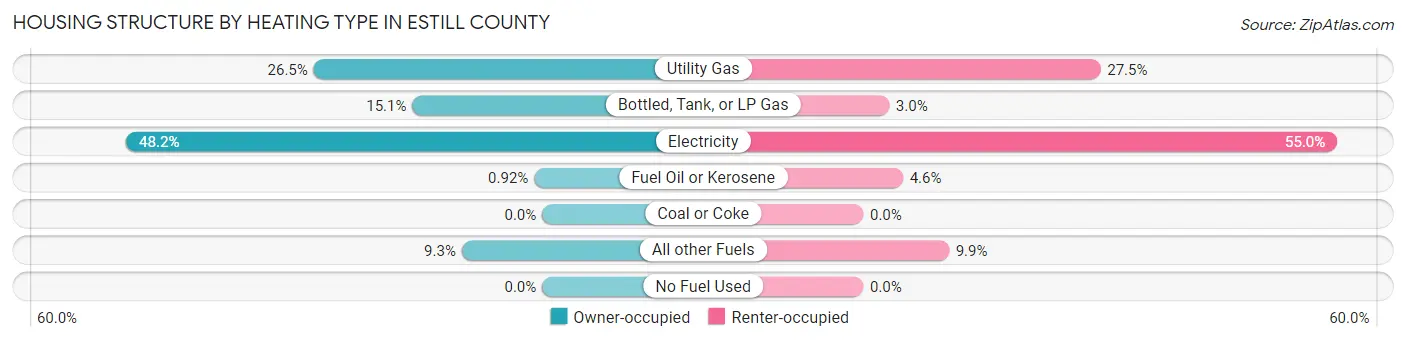
| Heating Type | Owner-occupied | Renter-occupied |
| Utility Gas | 1,123 (26.5%) | 413 (27.5%) |
| Bottled, Tank, or LP Gas | 638 (15.0%) | 45 (3.0%) |
| Electricity | 2,044 (48.2%) | 825 (55.0%) |
| Fuel Oil or Kerosene | 39 (0.9%) | 69 (4.6%) |
| Coal or Coke | 0 (0.0%) | 0 (0.0%) |
| All other Fuels | 395 (9.3%) | 149 (9.9%) |
| No Fuel Used | 0 (0.0%) | 0 (0.0%) |
| Total | 4,239 (100.0%) | 1,501 (100.0%) |
Household Vehicle Usage in Estill County
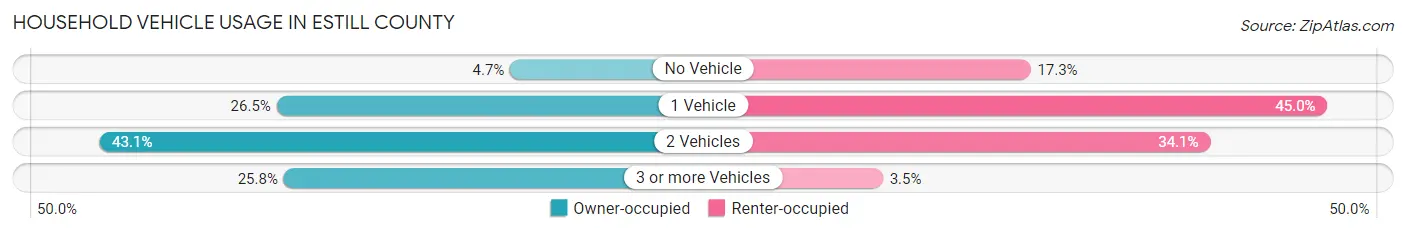
| Vehicles per Household | Owner-occupied | Renter-occupied |
| No Vehicle | 198 (4.7%) | 260 (17.3%) |
| 1 Vehicle | 1,122 (26.5%) | 676 (45.0%) |
| 2 Vehicles | 1,825 (43.0%) | 512 (34.1%) |
| 3 or more Vehicles | 1,094 (25.8%) | 53 (3.5%) |
| Total | 4,239 (100.0%) | 1,501 (100.0%) |
Real Estate & Mortgages in Estill County
Real Estate and Mortgage Overview in Estill County
| Characteristic | Without Mortgage | With Mortgage |
| Housing Units | 2,477 | 1,762 |
| Median Property Value | $86,000 | $126,000 |
| Median Household Income | $38,497 | $123 |
| Monthly Housing Costs | $377 | $7 |
| Real Estate Taxes | $539 | $84 |
Property Value by Mortgage Status in Estill County
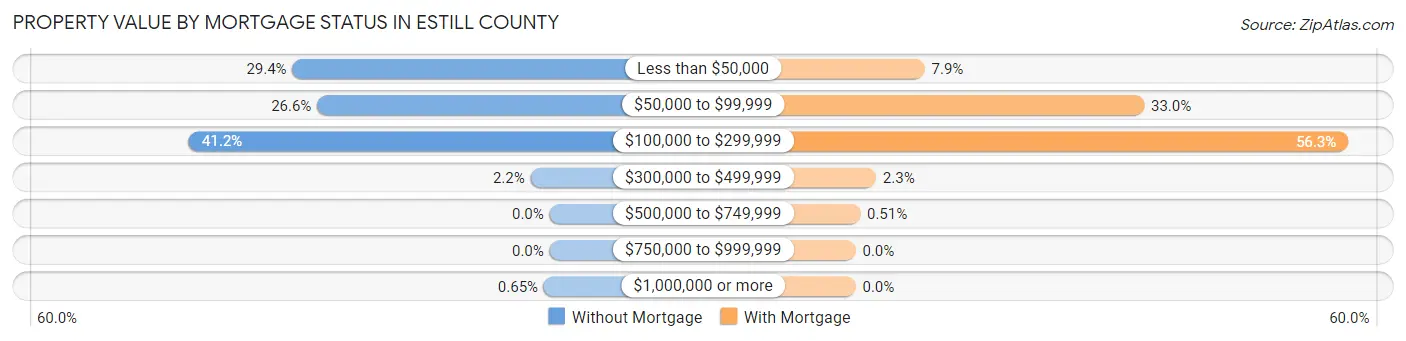
| Property Value | Without Mortgage | With Mortgage |
| Less than $50,000 | 728 (29.4%) | 139 (7.9%) |
| $50,000 to $99,999 | 658 (26.6%) | 581 (33.0%) |
| $100,000 to $299,999 | 1,021 (41.2%) | 992 (56.3%) |
| $300,000 to $499,999 | 54 (2.2%) | 41 (2.3%) |
| $500,000 to $749,999 | 0 (0.0%) | 9 (0.5%) |
| $750,000 to $999,999 | 0 (0.0%) | 0 (0.0%) |
| $1,000,000 or more | 16 (0.6%) | 0 (0.0%) |
| Total | 2,477 (100.0%) | 1,762 (100.0%) |
Household Income by Mortgage Status in Estill County
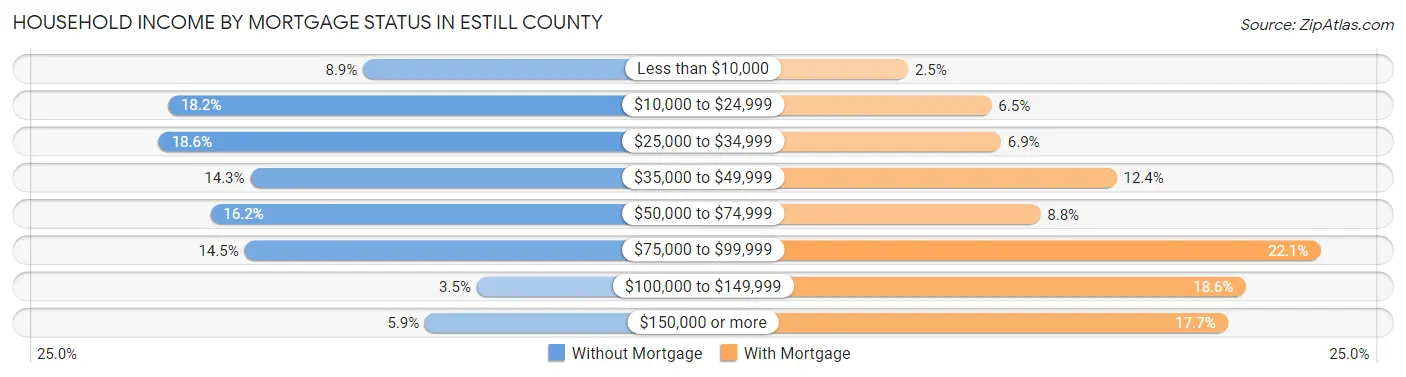
| Household Income | Without Mortgage | With Mortgage |
| Less than $10,000 | 220 (8.9%) | 44 (2.5%) |
| $10,000 to $24,999 | 450 (18.2%) | 114 (6.5%) |
| $25,000 to $34,999 | 461 (18.6%) | 122 (6.9%) |
| $35,000 to $49,999 | 353 (14.2%) | 219 (12.4%) |
| $50,000 to $74,999 | 400 (16.2%) | 155 (8.8%) |
| $75,000 to $99,999 | 360 (14.5%) | 390 (22.1%) |
| $100,000 to $149,999 | 86 (3.5%) | 327 (18.6%) |
| $150,000 or more | 147 (5.9%) | 312 (17.7%) |
| Total | 2,477 (100.0%) | 1,762 (100.0%) |
Property Value to Household Income Ratio in Estill County
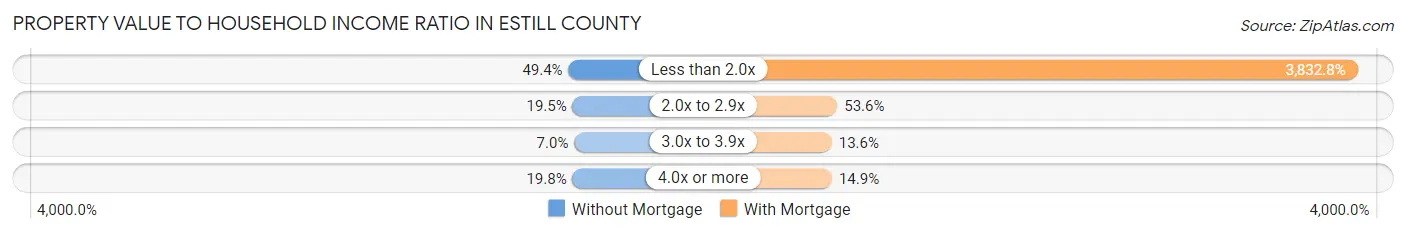
| Value-to-Income Ratio | Without Mortgage | With Mortgage |
| Less than 2.0x | 1,223 (49.4%) | 67,534 (3,832.8%) |
| 2.0x to 2.9x | 484 (19.5%) | 944 (53.6%) |
| 3.0x to 3.9x | 173 (7.0%) | 240 (13.6%) |
| 4.0x or more | 490 (19.8%) | 263 (14.9%) |
| Total | 2,477 (100.0%) | 1,762 (100.0%) |
Real Estate Taxes by Mortgage Status in Estill County
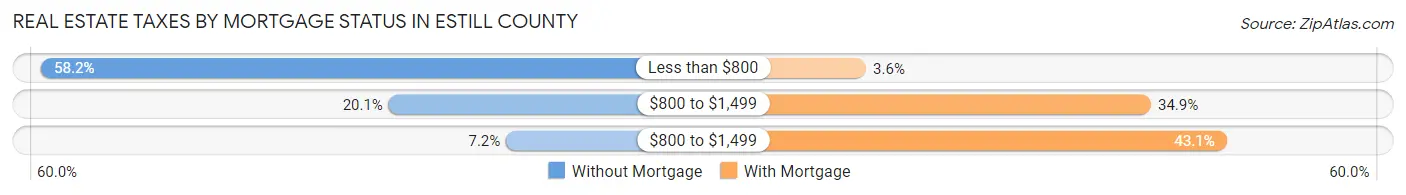
| Property Taxes | Without Mortgage | With Mortgage |
| Less than $800 | 1,441 (58.2%) | 64 (3.6%) |
| $800 to $1,499 | 498 (20.1%) | 614 (34.8%) |
| $800 to $1,499 | 179 (7.2%) | 760 (43.1%) |
| Total | 2,477 (100.0%) | 1,762 (100.0%) |
Health & Disability in Estill County
Health Insurance Coverage by Age in Estill County
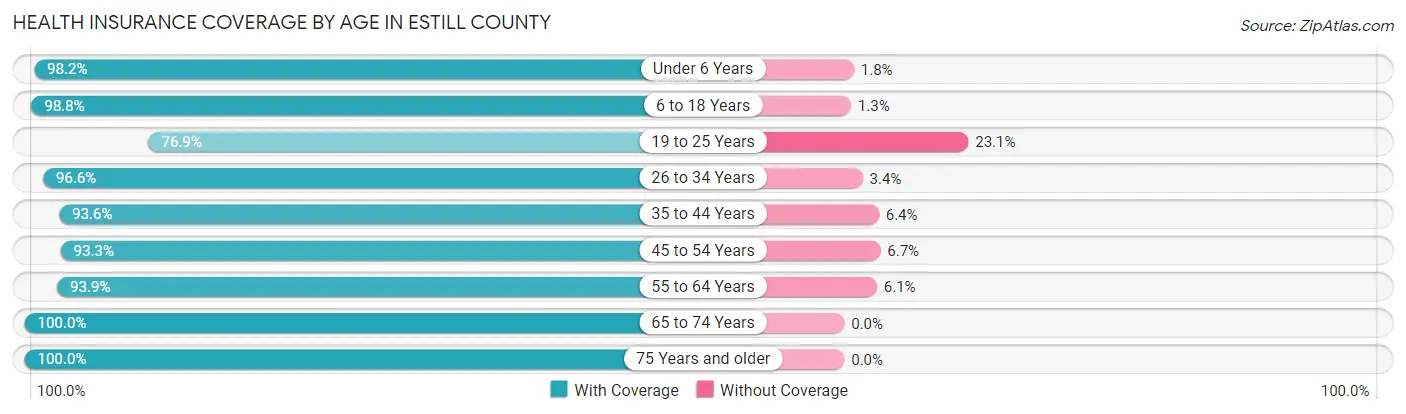
| Age Bracket | With Coverage | Without Coverage |
| Under 6 Years | 938 (98.2%) | 17 (1.8%) |
| 6 to 18 Years | 2,218 (98.8%) | 28 (1.3%) |
| 19 to 25 Years | 735 (76.9%) | 221 (23.1%) |
| 26 to 34 Years | 1,414 (96.6%) | 50 (3.4%) |
| 35 to 44 Years | 1,529 (93.6%) | 105 (6.4%) |
| 45 to 54 Years | 1,901 (93.3%) | 137 (6.7%) |
| 55 to 64 Years | 1,965 (93.9%) | 127 (6.1%) |
| 65 to 74 Years | 1,614 (100.0%) | 0 (0.0%) |
| 75 Years and older | 1,024 (100.0%) | 0 (0.0%) |
| Total | 13,338 (95.1%) | 685 (4.9%) |
Health Insurance Coverage by Citizenship Status in Estill County
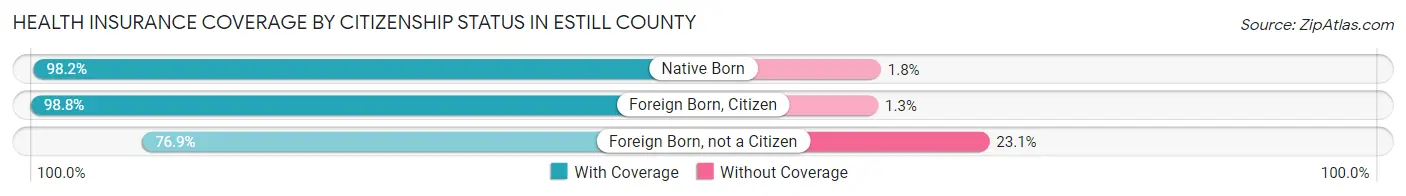
| Citizenship Status | With Coverage | Without Coverage |
| Native Born | 938 (98.2%) | 17 (1.8%) |
| Foreign Born, Citizen | 2,218 (98.8%) | 28 (1.3%) |
| Foreign Born, not a Citizen | 735 (76.9%) | 221 (23.1%) |
Health Insurance Coverage by Household Income in Estill County
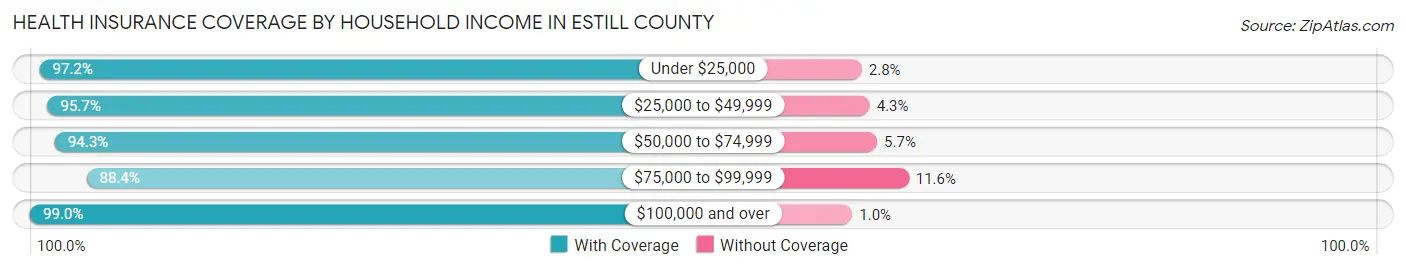
| Household Income | With Coverage | Without Coverage |
| Under $25,000 | 3,169 (97.2%) | 92 (2.8%) |
| $25,000 to $49,999 | 3,155 (95.7%) | 142 (4.3%) |
| $50,000 to $74,999 | 2,736 (94.3%) | 165 (5.7%) |
| $75,000 to $99,999 | 1,993 (88.4%) | 262 (11.6%) |
| $100,000 and over | 2,280 (99.0%) | 24 (1.0%) |
Public vs Private Health Insurance Coverage by Age in Estill County
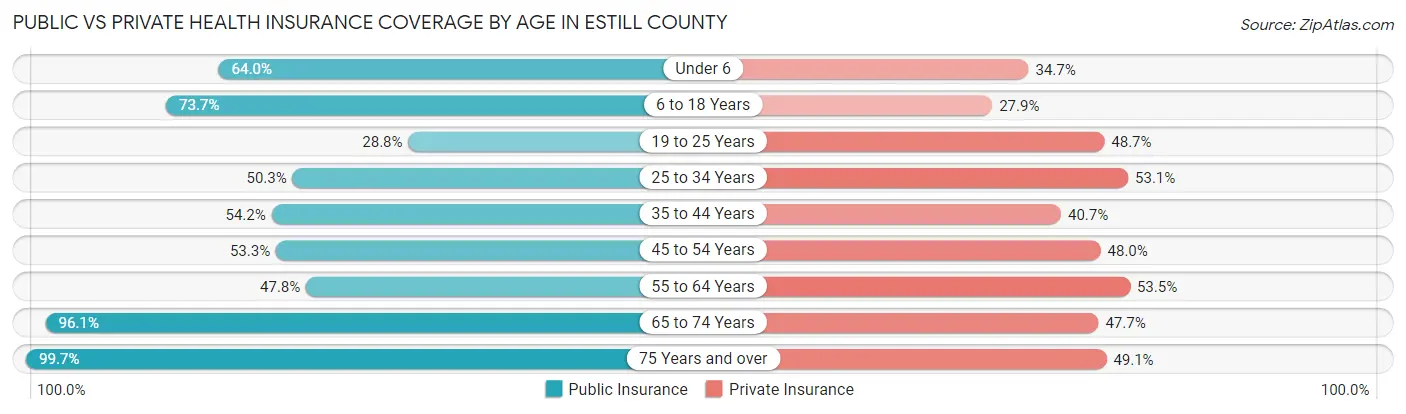
| Age Bracket | Public Insurance | Private Insurance |
| Under 6 | 611 (64.0%) | 331 (34.7%) |
| 6 to 18 Years | 1,656 (73.7%) | 627 (27.9%) |
| 19 to 25 Years | 275 (28.8%) | 466 (48.7%) |
| 25 to 34 Years | 736 (50.3%) | 778 (53.1%) |
| 35 to 44 Years | 885 (54.2%) | 665 (40.7%) |
| 45 to 54 Years | 1,087 (53.3%) | 979 (48.0%) |
| 55 to 64 Years | 999 (47.7%) | 1,119 (53.5%) |
| 65 to 74 Years | 1,551 (96.1%) | 769 (47.6%) |
| 75 Years and over | 1,021 (99.7%) | 503 (49.1%) |
| Total | 8,821 (62.9%) | 6,237 (44.5%) |
Disability Status by Sex by Age in Estill County
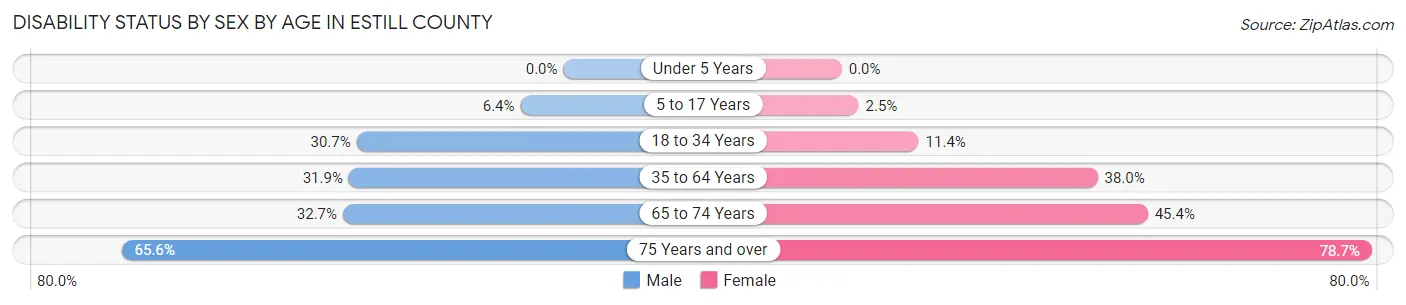
| Age Bracket | Male | Female |
| Under 5 Years | 0 (0.0%) | 0 (0.0%) |
| 5 to 17 Years | 86 (6.4%) | 25 (2.5%) |
| 18 to 34 Years | 406 (30.7%) | 140 (11.4%) |
| 35 to 64 Years | 922 (31.9%) | 1,090 (38.0%) |
| 65 to 74 Years | 238 (32.7%) | 403 (45.4%) |
| 75 Years and over | 284 (65.6%) | 465 (78.7%) |
Disability Class by Sex by Age in Estill County
Disability Class: Hearing Difficulty
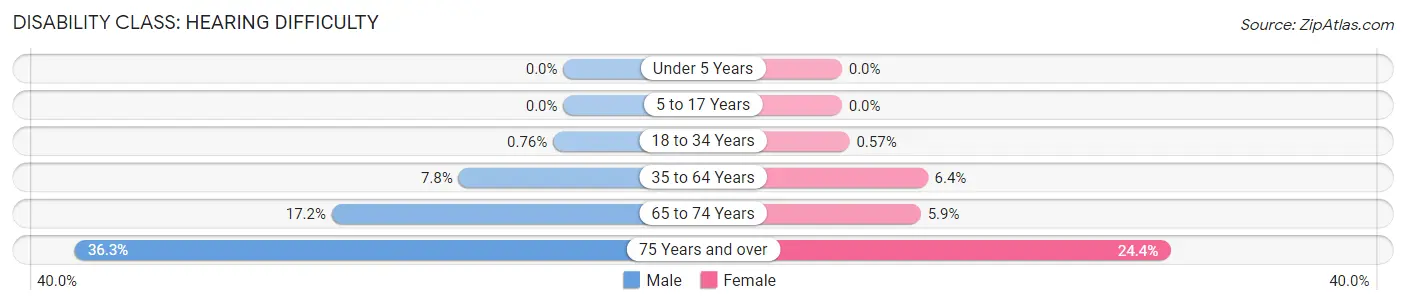
| Age Bracket | Male | Female |
| Under 5 Years | 0 (0.0%) | 0 (0.0%) |
| 5 to 17 Years | 0 (0.0%) | 0 (0.0%) |
| 18 to 34 Years | 10 (0.8%) | 7 (0.6%) |
| 35 to 64 Years | 225 (7.8%) | 183 (6.4%) |
| 65 to 74 Years | 125 (17.2%) | 52 (5.9%) |
| 75 Years and over | 157 (36.3%) | 144 (24.4%) |
Disability Class: Vision Difficulty
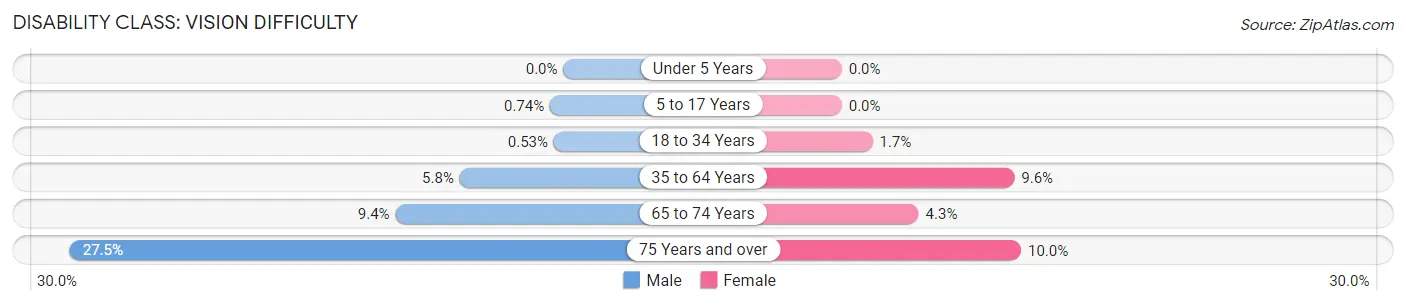
| Age Bracket | Male | Female |
| Under 5 Years | 0 (0.0%) | 0 (0.0%) |
| 5 to 17 Years | 10 (0.7%) | 0 (0.0%) |
| 18 to 34 Years | 7 (0.5%) | 21 (1.7%) |
| 35 to 64 Years | 167 (5.8%) | 276 (9.6%) |
| 65 to 74 Years | 68 (9.3%) | 38 (4.3%) |
| 75 Years and over | 119 (27.5%) | 59 (10.0%) |
Disability Class: Cognitive Difficulty
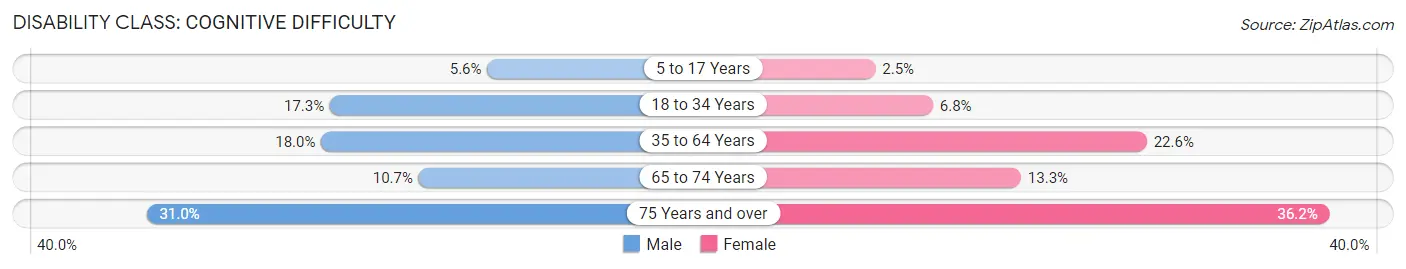
| Age Bracket | Male | Female |
| 5 to 17 Years | 76 (5.6%) | 25 (2.5%) |
| 18 to 34 Years | 229 (17.3%) | 83 (6.8%) |
| 35 to 64 Years | 520 (18.0%) | 650 (22.6%) |
| 65 to 74 Years | 78 (10.7%) | 118 (13.3%) |
| 75 Years and over | 134 (30.9%) | 214 (36.2%) |
Disability Class: Ambulatory Difficulty
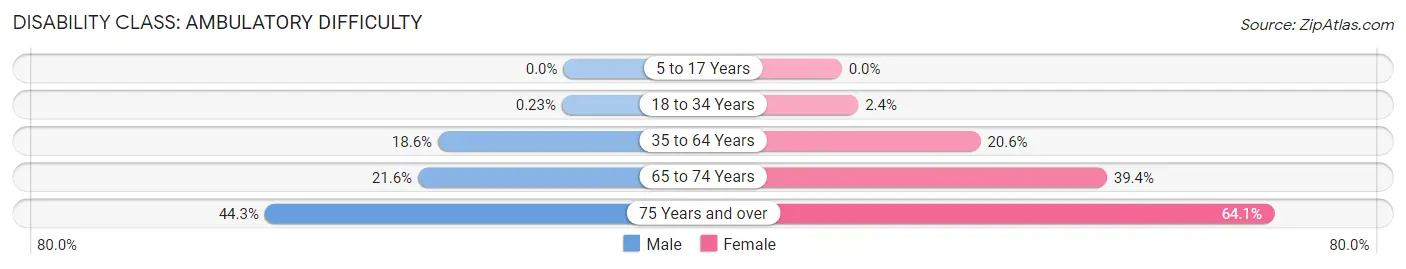
| Age Bracket | Male | Female |
| 5 to 17 Years | 0 (0.0%) | 0 (0.0%) |
| 18 to 34 Years | 3 (0.2%) | 30 (2.4%) |
| 35 to 64 Years | 539 (18.6%) | 591 (20.6%) |
| 65 to 74 Years | 157 (21.6%) | 349 (39.4%) |
| 75 Years and over | 192 (44.3%) | 379 (64.1%) |
Disability Class: Self-Care Difficulty
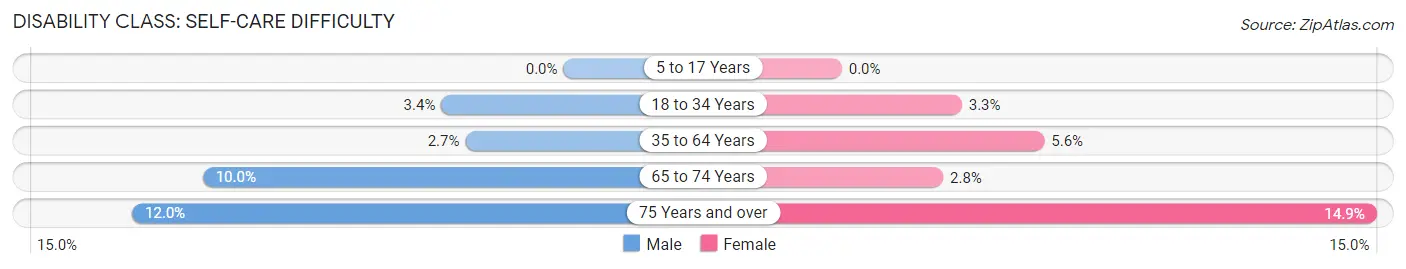
| Age Bracket | Male | Female |
| 5 to 17 Years | 0 (0.0%) | 0 (0.0%) |
| 18 to 34 Years | 45 (3.4%) | 41 (3.3%) |
| 35 to 64 Years | 79 (2.7%) | 162 (5.6%) |
| 65 to 74 Years | 73 (10.0%) | 25 (2.8%) |
| 75 Years and over | 52 (12.0%) | 88 (14.9%) |
Technology Access in Estill County
Computing Device Access in Estill County
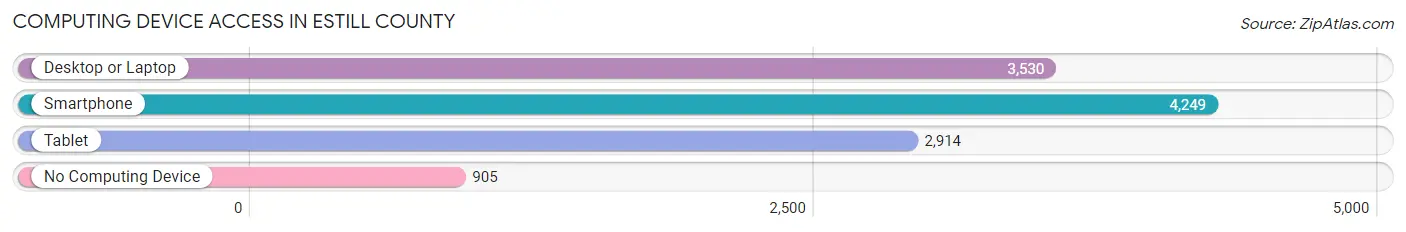
| Device Type | # Households | % Households |
| Desktop or Laptop | 3,530 | 61.5% |
| Smartphone | 4,249 | 74.0% |
| Tablet | 2,914 | 50.8% |
| No Computing Device | 905 | 15.8% |
| Total | 5,740 | 100.0% |
Internet Access in Estill County
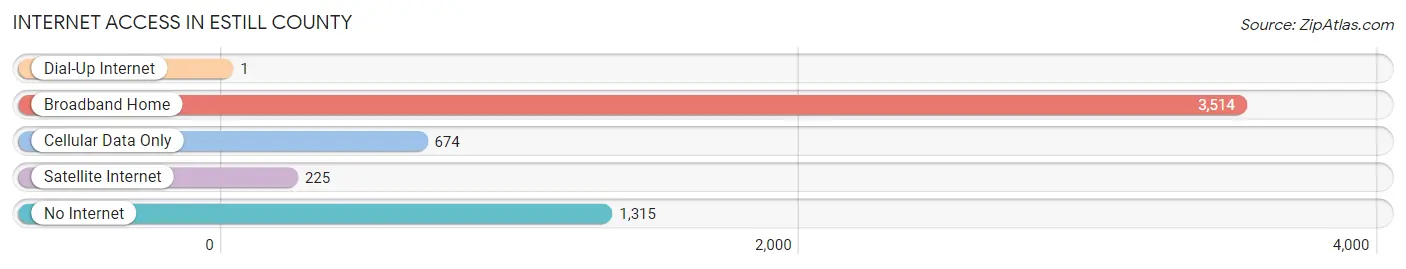
| Internet Type | # Households | % Households |
| Dial-Up Internet | 1 | 0.0% |
| Broadband Home | 3,514 | 61.2% |
| Cellular Data Only | 674 | 11.7% |
| Satellite Internet | 225 | 3.9% |
| No Internet | 1,315 | 22.9% |
| Total | 5,740 | 100.0% |
Estill County Summary
Estill County is a county located in the eastern part of the U.S. state of Kentucky. It is part of the Bluegrass region of the state and is bordered by Madison County to the north, Powell County to the east, Lee County to the south, and Clark County to the west. As of the 2010 census, the population was 14,672. The county seat is Irvine.
History
Estill County was formed in 1808 from parts of Clark and Madison counties. It was named for Captain James Estill, a Revolutionary War soldier and early settler of the area. The county was a center of the Civil War in Kentucky, with both Union and Confederate forces occupying the county at various times.
Geography
Estill County is located in the eastern part of Kentucky, in the foothills of the Appalachian Mountains. It is bordered by Madison County to the north, Powell County to the east, Lee County to the south, and Clark County to the west. The county has a total area of 437 square miles, of which 434 square miles is land and 3 square miles (0.7%) is water.
The county is mostly hilly, with the highest point being the summit of Pilot Knob at 1,845 feet above sea level. The Kentucky River forms the northern border of the county, and the Red River forms the western border.
Economy
Estill County's economy is largely based on agriculture and manufacturing. The county is home to several large farms, as well as several small family farms. The county is also home to several manufacturing plants, including a large paper mill in Irvine.
The county is also home to several tourist attractions, including the Estill County Historical Museum, the Estill County Fairgrounds, and the Estill County Arts Council.
Demographics
As of the 2010 census, there were 14,672 people, 5,845 households, and 4,093 families living in the county. The population density was 33.7 people per square mile. The racial makeup of the county was 97.2% White, 0.9% Black or African American, 0.2% Native American, 0.2% Asian, 0.1% Pacific Islander, 0.3% from other races, and 1.1% from two or more races. 1.6% of the population were Hispanic or Latino of any race.
The median income for a household in the county was $30,945, and the median income for a family was $37,945. The per capita income for the county was $16,845. About 17.2% of families and 20.7% of the population were below the poverty line, including 28.2% of those under age 18 and 16.2% of those age 65 or over.
Estill County is served by the Estill County School District, which operates seven elementary schools, two middle schools, and one high school. The county is also home to several private schools, including Estill Christian Academy and Estill Springs Christian Academy.
Common Questions
What is Per Capita Income in Estill County?
Per Capita income in Estill County is $21,880.
What is the Median Family Income in Estill County?
Median Family Income in Estill County is $54,479.
What is the Median Household income in Estill County?
Median Household Income in Estill County is $39,980.
What is Income or Wage Gap in Estill County?
Income or Wage Gap in Estill County is 22.3%.
Women in Estill County earn 77.7 cents for every dollar earned by a man.
What is Family Income Deficit in Estill County?
Family Income Deficit in Estill County is $11,604.
Families that are below poverty line in Estill County earn $11,604 less on average than the poverty threshold level.
What is Inequality or Gini Index in Estill County?
Inequality or Gini Index in Estill County is 0.46.
What is the Total Population of Estill County?
Total Population of Estill County is 14,138.
What is the Total Male Population of Estill County?
Total Male Population of Estill County is 7,158.
What is the Total Female Population of Estill County?
Total Female Population of Estill County is 6,980.
What is the Ratio of Males per 100 Females in Estill County?
There are 102.55 Males per 100 Females in Estill County.
What is the Ratio of Females per 100 Males in Estill County?
There are 97.51 Females per 100 Males in Estill County.
What is the Median Population Age in Estill County?
Median Population Age in Estill County is 43.7 Years.
What is the Average Family Size in Estill County
Average Family Size in Estill County is 3.0 People.
What is the Average Household Size in Estill County
Average Household Size in Estill County is 2.4 People.
How Large is the Labor Force in Estill County?
There are 5,272 People in the Labor Forcein in Estill County.
What is the Percentage of People in the Labor Force in Estill County?
46.1% of People are in the Labor Force in Estill County.
What is the Unemployment Rate in Estill County?
Unemployment Rate in Estill County is 8.7%.