Elliott County, KY Map & Demographics
Elliott County Map

Elliott County Overview
$17,242
PER CAPITA INCOME
$62,241
AVG FAMILY INCOME
$39,469
AVG HOUSEHOLD INCOME
21.8%
WAGE / INCOME GAP [ % ]
78.2¢/ $1
WAGE / INCOME GAP [ $ ]
$10,412
FAMILY INCOME DEFICIT
0.43
INEQUALITY / GINI INDEX
7,378
TOTAL POPULATION
4,229
MALE POPULATION
3,149
FEMALE POPULATION
134.30
MALES / 100 FEMALES
74.46
FEMALES / 100 MALES
43.6
MEDIAN AGE
3.3
AVG FAMILY SIZE
2.7
AVG HOUSEHOLD SIZE
2,008
LABOR FORCE [ PEOPLE ]
32.6%
PERCENT IN LABOR FORCE
6.0%
UNEMPLOYMENT RATE
Elliott County Area Codes
Income in Elliott County
Income Overview in Elliott County
Per Capita Income in Elliott County is $17,242, while median incomes of families and households are $62,241 and $39,469 respectively.
| Characteristic | Number | Measure |
| Per Capita Income | 7,378 | $17,242 |
| Median Family Income | 1,524 | $62,241 |
| Mean Family Income | 1,524 | $62,150 |
| Median Household Income | 2,263 | $39,469 |
| Mean Household Income | 2,263 | $51,370 |
| Income Deficit | 1,524 | $10,412 |
| Wage / Income Gap (%) | 7,378 | 21.83% |
| Wage / Income Gap ($) | 7,378 | 78.17¢ per $1 |
| Gini / Inequality Index | 7,378 | 0.43 |
Earnings by Sex in Elliott County
Average Earnings in Elliott County are $29,194, $31,118 for men and $24,326 for women, a difference of 21.8%.

| Sex | Number | Average Earnings |
| Male | 1,235 (55.1%) | $31,118 |
| Female | 1,007 (44.9%) | $24,326 |
| Total | 2,242 (100.0%) | $29,194 |
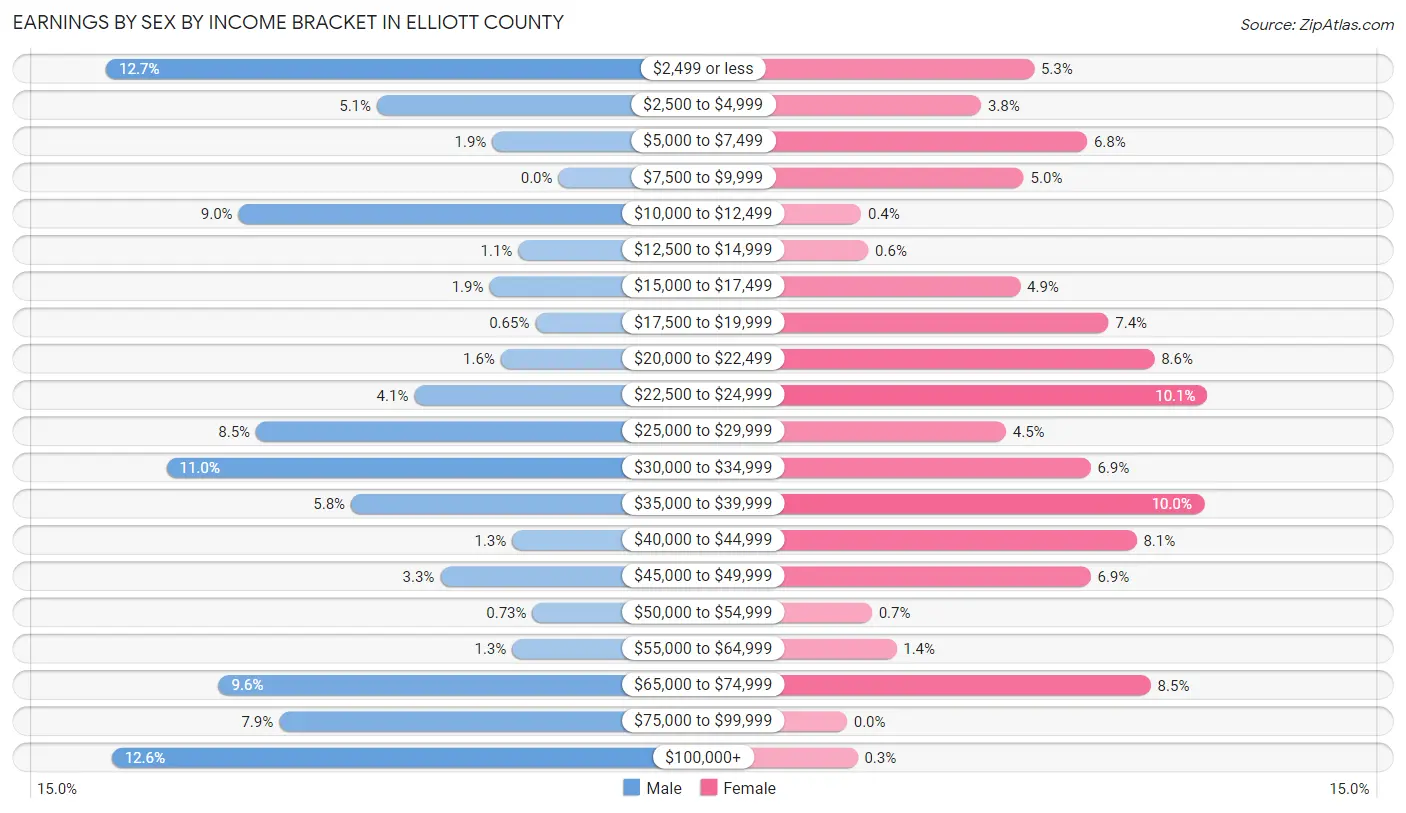
Earnings by Sex by Income Bracket in Elliott County
The most common earnings brackets in Elliott County are $2,499 or less for men (157 | 12.7%) and $22,500 to $24,999 for women (102 | 10.1%).
| Income | Male | Female |
| $2,499 or less | 157 (12.7%) | 53 (5.3%) |
| $2,500 to $4,999 | 63 (5.1%) | 38 (3.8%) |
| $5,000 to $7,499 | 23 (1.9%) | 68 (6.8%) |
| $7,500 to $9,999 | 0 (0.0%) | 50 (5.0%) |
| $10,000 to $12,499 | 111 (9.0%) | 4 (0.4%) |
| $12,500 to $14,999 | 14 (1.1%) | 6 (0.6%) |
| $15,000 to $17,499 | 24 (1.9%) | 49 (4.9%) |
| $17,500 to $19,999 | 8 (0.6%) | 74 (7.3%) |
| $20,000 to $22,499 | 20 (1.6%) | 87 (8.6%) |
| $22,500 to $24,999 | 50 (4.1%) | 102 (10.1%) |
| $25,000 to $29,999 | 105 (8.5%) | 45 (4.5%) |
| $30,000 to $34,999 | 136 (11.0%) | 69 (6.9%) |
| $35,000 to $39,999 | 72 (5.8%) | 101 (10.0%) |
| $40,000 to $44,999 | 16 (1.3%) | 82 (8.1%) |
| $45,000 to $49,999 | 41 (3.3%) | 69 (6.9%) |
| $50,000 to $54,999 | 9 (0.7%) | 7 (0.7%) |
| $55,000 to $64,999 | 16 (1.3%) | 14 (1.4%) |
| $65,000 to $74,999 | 118 (9.6%) | 86 (8.5%) |
| $75,000 to $99,999 | 97 (7.9%) | 0 (0.0%) |
| $100,000+ | 155 (12.6%) | 3 (0.3%) |
| Total | 1,235 (100.0%) | 1,007 (100.0%) |
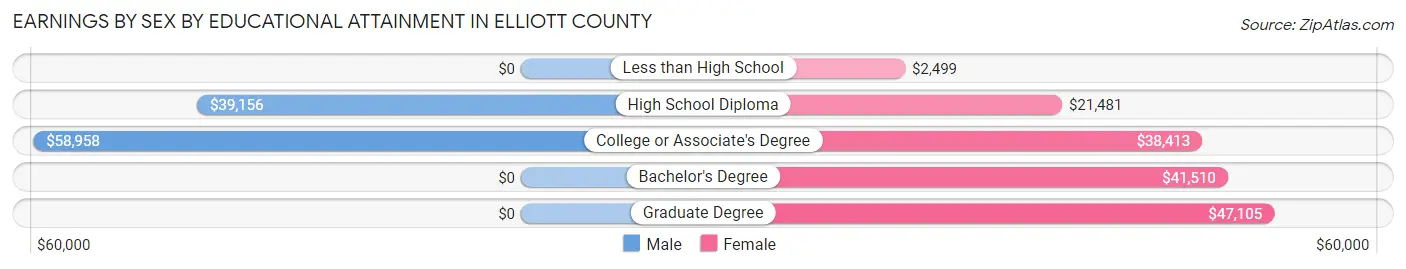
Earnings by Sex by Educational Attainment in Elliott County
Average earnings in Elliott County are $38,321 for men and $32,647 for women, a difference of 14.8%. Men with an educational attainment of college or associate's degree enjoy the highest average annual earnings of $58,958, while those with high school diploma education earn the least with $39,156. Women with an educational attainment of graduate degree earn the most with the average annual earnings of $47,105, while those with less than high school education have the smallest earnings of $2,499.
| Educational Attainment | Male Income | Female Income |
| Less than High School | - | - |
| High School Diploma | $39,156 | $21,481 |
| College or Associate's Degree | $58,958 | $38,413 |
| Bachelor's Degree | - | - |
| Graduate Degree | - | - |
| Total | $38,321 | $32,647 |
Family Income in Elliott County
Family Income Brackets in Elliott County
According to the Elliott County family income data, there are 367 families falling into the $50,000 to $74,999 income range, which is the most common income bracket and makes up 24.1% of all families. Conversely, the $200,000+ income bracket is the least frequent group with only 11 families (0.7%) belonging to this category.

| Income Bracket | # Families | % Families |
| Less than $10,000 | 72 | 4.7% |
| $10,000 to $14,999 | 79 | 5.2% |
| $15,000 to $24,999 | 203 | 13.3% |
| $25,000 to $34,999 | 154 | 10.1% |
| $35,000 to $49,999 | 175 | 11.5% |
| $50,000 to $74,999 | 367 | 24.1% |
| $75,000 to $99,999 | 207 | 13.6% |
| $100,000 to $149,999 | 235 | 15.4% |
| $150,000 to $199,999 | 18 | 1.2% |
| $200,000+ | 11 | 0.7% |
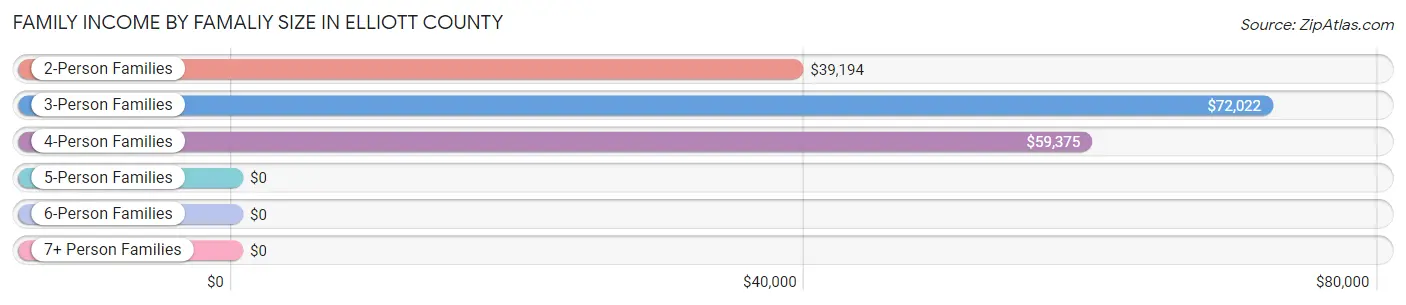
Family Income by Famaliy Size in Elliott County
3-person families (626 | 41.1%) account for the highest median family income in Elliott County with $72,022 per family, while 3-person families (626 | 41.1%) have the highest median income of $24,007 per family member.
| Income Bracket | # Families | Median Income |
| 2-Person Families | 709 (46.5%) | $39,194 |
| 3-Person Families | 626 (41.1%) | $72,022 |
| 4-Person Families | 81 (5.3%) | $59,375 |
| 5-Person Families | 93 (6.1%) | $0 |
| 6-Person Families | 6 (0.4%) | $0 |
| 7+ Person Families | 9 (0.6%) | $0 |
| Total | 1,524 (100.0%) | $62,241 |
Family Income by Number of Earners in Elliott County
The median family income in Elliott County is $62,241, with families comprising 3+ earners (44) having the highest median family income of $121,667, while families with no earners (513) have the lowest median family income of $23,479, accounting for 2.9% and 33.7% of families, respectively.

| Number of Earners | # Families | Median Income |
| No Earners | 513 (33.7%) | $23,479 |
| 1 Earner | 468 (30.7%) | $55,208 |
| 2 Earners | 499 (32.7%) | $74,562 |
| 3+ Earners | 44 (2.9%) | $121,667 |
| Total | 1,524 (100.0%) | $62,241 |
Household Income in Elliott County
Household Income Brackets in Elliott County
With 362 households falling in the category, the $50,000 to $74,999 income range is the most frequent in Elliott County, accounting for 16.0% of all households. In contrast, only 11 households (0.5%) fall into the $200,000+ income bracket, making it the least populous group.

| Income Bracket | # Households | % Households |
| Less than $10,000 | 208 | 9.2% |
| $10,000 to $14,999 | 244 | 10.8% |
| $15,000 to $24,999 | 290 | 12.8% |
| $25,000 to $34,999 | 274 | 12.1% |
| $35,000 to $49,999 | 349 | 15.4% |
| $50,000 to $74,999 | 362 | 16.0% |
| $75,000 to $99,999 | 222 | 9.8% |
| $100,000 to $149,999 | 285 | 12.6% |
| $150,000 to $199,999 | 20 | 0.9% |
| $200,000+ | 11 | 0.5% |
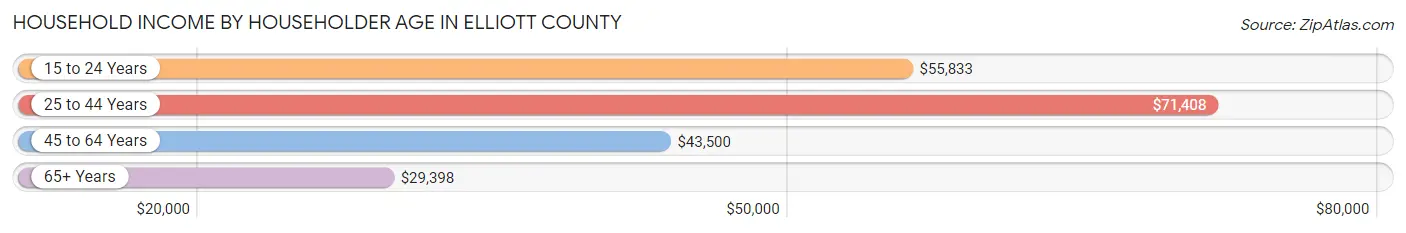
Household Income by Householder Age in Elliott County
The median household income in Elliott County is $39,469, with the highest median household income of $71,408 found in the 25 to 44 years age bracket for the primary householder. A total of 508 households (22.5%) fall into this category. Meanwhile, the 65+ years age bracket for the primary householder has the lowest median household income of $29,398, with 853 households (37.7%) in this group.
| Income Bracket | # Households | Median Income |
| 15 to 24 Years | 14 (0.6%) | $55,833 |
| 25 to 44 Years | 508 (22.5%) | $71,408 |
| 45 to 64 Years | 888 (39.2%) | $43,500 |
| 65+ Years | 853 (37.7%) | $29,398 |
| Total | 2,263 (100.0%) | $39,469 |
Poverty in Elliott County
Income Below Poverty by Sex and Age in Elliott County
With 23.0% poverty level for males and 26.3% for females among the residents of Elliott County, 15 year old males and 5 year old females are the most vulnerable to poverty, with 46 males (100.0%) and 36 females (85.7%) in their respective age groups living below the poverty level.

| Age Bracket | Male | Female |
| Under 5 Years | 51 (31.7%) | 14 (10.5%) |
| 5 Years | 74 (85.1%) | 36 (85.7%) |
| 6 to 11 Years | 87 (46.0%) | 68 (25.2%) |
| 12 to 14 Years | 45 (40.5%) | 10 (32.3%) |
| 15 Years | 46 (100.0%) | 20 (16.3%) |
| 16 and 17 Years | 0 (0.0%) | 30 (85.7%) |
| 18 to 24 Years | 22 (7.3%) | 9 (4.9%) |
| 25 to 34 Years | 10 (3.1%) | 61 (17.8%) |
| 35 to 44 Years | 84 (35.1%) | 104 (29.5%) |
| 45 to 54 Years | 14 (3.3%) | 121 (30.6%) |
| 55 to 64 Years | 129 (33.3%) | 169 (39.6%) |
| 65 to 74 Years | 79 (20.1%) | 83 (19.5%) |
| 75 Years and over | 42 (14.7%) | 84 (26.8%) |
| Total | 683 (23.0%) | 809 (26.3%) |
Income Above Poverty by Sex and Age in Elliott County
According to the poverty statistics in Elliott County, males aged 16 and 17 years and females aged 18 to 24 years are the age groups that are most secure financially, with 100.0% of males and 95.1% of females in these age groups living above the poverty line.

| Age Bracket | Male | Female |
| Under 5 Years | 110 (68.3%) | 119 (89.5%) |
| 5 Years | 13 (14.9%) | 6 (14.3%) |
| 6 to 11 Years | 102 (54.0%) | 202 (74.8%) |
| 12 to 14 Years | 66 (59.5%) | 21 (67.7%) |
| 15 Years | 0 (0.0%) | 103 (83.7%) |
| 16 and 17 Years | 24 (100.0%) | 5 (14.3%) |
| 18 to 24 Years | 281 (92.7%) | 175 (95.1%) |
| 25 to 34 Years | 312 (96.9%) | 282 (82.2%) |
| 35 to 44 Years | 155 (64.8%) | 248 (70.5%) |
| 45 to 54 Years | 411 (96.7%) | 274 (69.4%) |
| 55 to 64 Years | 259 (66.7%) | 258 (60.4%) |
| 65 to 74 Years | 314 (79.9%) | 342 (80.5%) |
| 75 Years and over | 243 (85.3%) | 229 (73.2%) |
| Total | 2,290 (77.0%) | 2,264 (73.7%) |
Income Below Poverty Among Married-Couple Families in Elliott County
The poverty statistics for married-couple families in Elliott County show that 10.1% or 122 of the total 1,205 families live below the poverty line. Families with 3 or 4 children have the highest poverty rate of 34.8%, comprising of 8 families. On the other hand, families with 1 or 2 children have the lowest poverty rate of 6.0%, which includes 26 families.
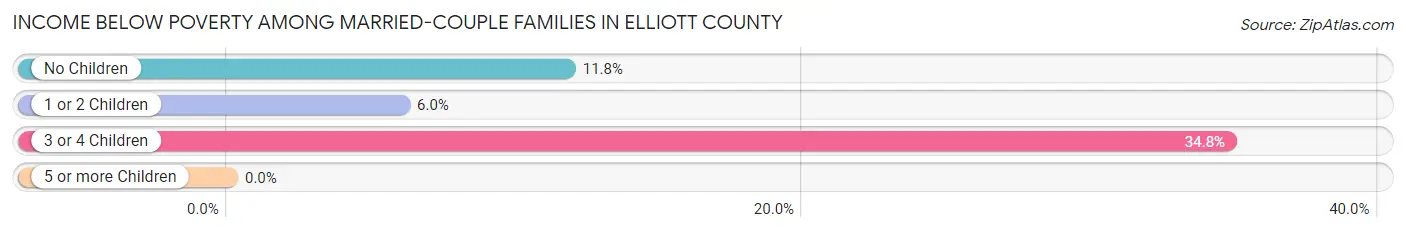
| Children | Above Poverty | Below Poverty |
| No Children | 660 (88.2%) | 88 (11.8%) |
| 1 or 2 Children | 408 (94.0%) | 26 (6.0%) |
| 3 or 4 Children | 15 (65.2%) | 8 (34.8%) |
| 5 or more Children | 0 (0.0%) | 0 (0.0%) |
| Total | 1,083 (89.9%) | 122 (10.1%) |
Income Below Poverty Among Single-Parent Households in Elliott County
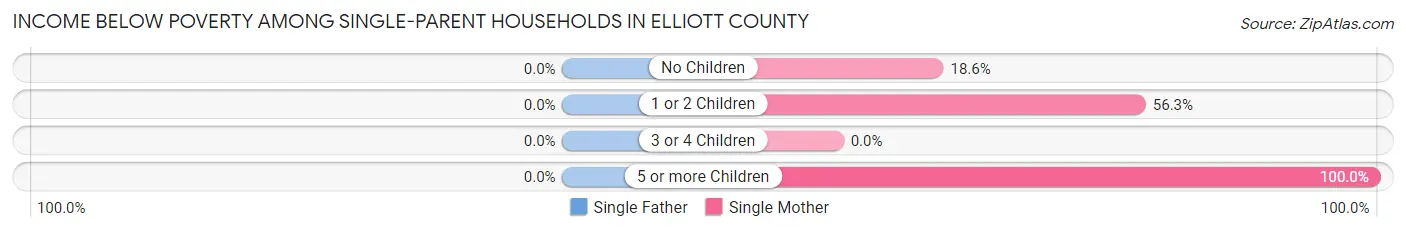
| Children | Single Father | Single Mother |
| No Children | 0 (0.0%) | 16 (18.6%) |
| 1 or 2 Children | 0 (0.0%) | 94 (56.3%) |
| 3 or 4 Children | 0 (0.0%) | 0 (0.0%) |
| 5 or more Children | 0 (0.0%) | 9 (100.0%) |
| Total | 0 (0.0%) | 119 (45.4%) |
Income Below Poverty Among Married-Couple vs Single-Parent Households in Elliott County
The poverty data for Elliott County shows that 122 of the married-couple family households (10.1%) and 119 of the single-parent households (37.3%) are living below the poverty level. Within the married-couple family households, those with 3 or 4 children have the highest poverty rate, with 8 households (34.8%) falling below the poverty line. Among the single-parent households, those with 5 or more children have the highest poverty rate, with 9 household (100.0%) living below poverty.
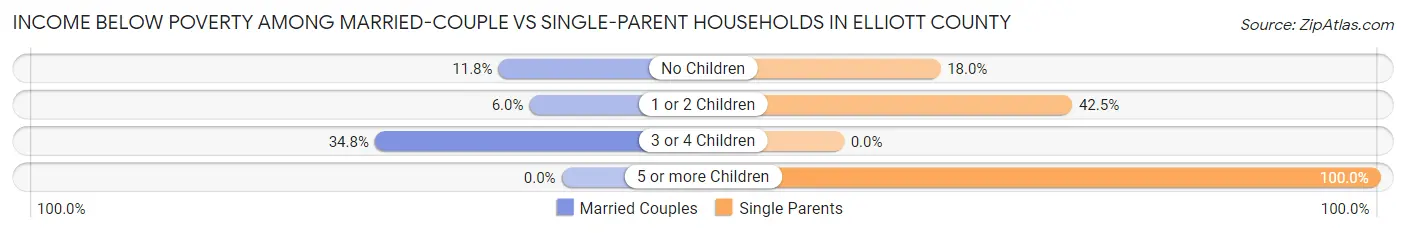
| Children | Married-Couple Families | Single-Parent Households |
| No Children | 88 (11.8%) | 16 (18.0%) |
| 1 or 2 Children | 26 (6.0%) | 94 (42.5%) |
| 3 or 4 Children | 8 (34.8%) | 0 (0.0%) |
| 5 or more Children | 0 (0.0%) | 9 (100.0%) |
| Total | 122 (10.1%) | 119 (37.3%) |
Race in Elliott County
The most populous races in Elliott County are White / Caucasian (7,080 | 96.0%), Black / African American (213 | 2.9%), and Two or more Races (76 | 1.0%).

| Race | # Population | % Population |
| Asian | 0 | 0.0% |
| Black / African American | 213 | 2.9% |
| Hawaiian / Pacific | 0 | 0.0% |
| Hispanic or Latino | 70 | 0.9% |
| Native / Alaskan | 0 | 0.0% |
| White / Caucasian | 7,080 | 96.0% |
| Two or more Races | 76 | 1.0% |
| Some other Race | 9 | 0.1% |
| Total | 7,378 | 100.0% |
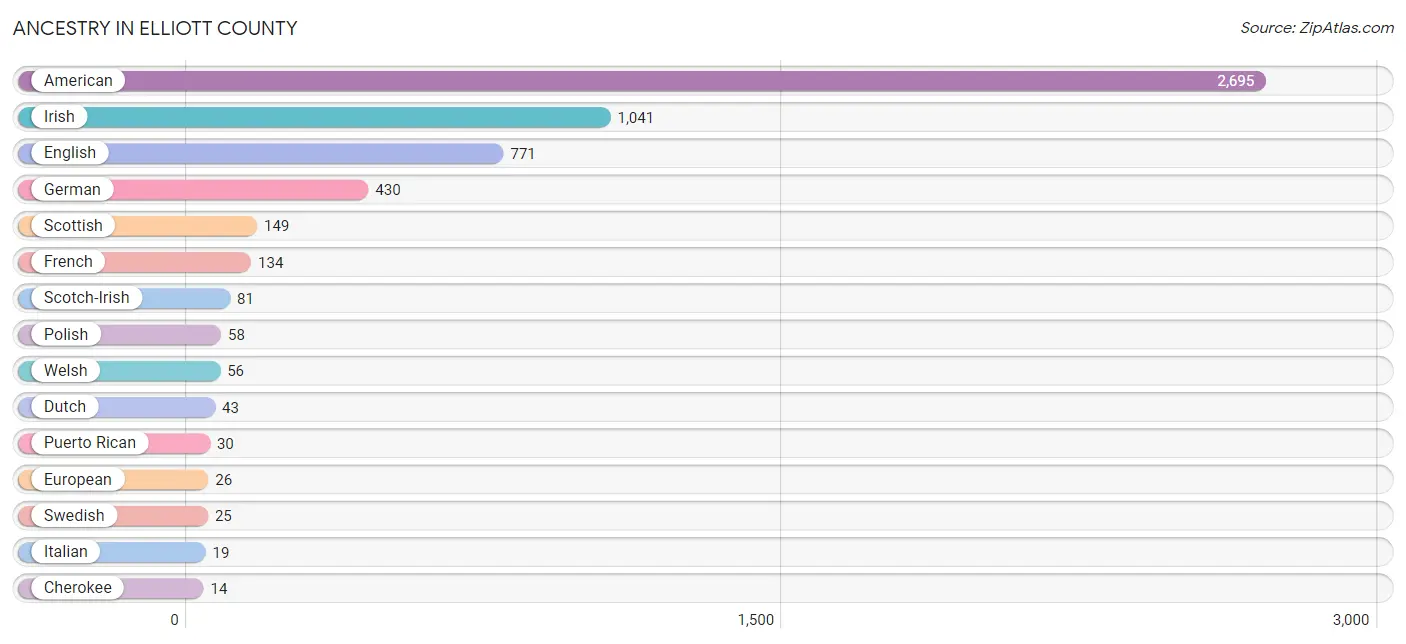
Ancestry in Elliott County
The most populous ancestries reported in Elliott County are American (2,695 | 36.5%), Irish (1,041 | 14.1%), English (771 | 10.4%), German (430 | 5.8%), and Scottish (149 | 2.0%), together accounting for 68.9% of all Elliott County residents.
| Ancestry | # Population | % Population |
| African | 8 | 0.1% |
| American | 2,695 | 36.5% |
| British | 13 | 0.2% |
| Cherokee | 14 | 0.2% |
| Dutch | 43 | 0.6% |
| Eastern European | 14 | 0.2% |
| English | 771 | 10.4% |
| European | 26 | 0.4% |
| French | 134 | 1.8% |
| German | 430 | 5.8% |
| Irish | 1,041 | 14.1% |
| Italian | 19 | 0.3% |
| Mexican | 5 | 0.1% |
| Polish | 58 | 0.8% |
| Puerto Rican | 30 | 0.4% |
| Romanian | 4 | 0.1% |
| Scotch-Irish | 81 | 1.1% |
| Scottish | 149 | 2.0% |
| Subsaharan African | 8 | 0.1% |
| Swedish | 25 | 0.3% |
| Welsh | 56 | 0.8% | View All 21 Rows |
Immigrants in Elliott County
The most numerous immigrant groups reported in Elliott County came from Central America (5 | 0.1%), Latin America (5 | 0.1%), Mexico (5 | 0.1%), and Canada (4 | 0.1%), together accounting for 0.3% of all Elliott County residents.

| Immigration Origin | # Population | % Population |
| Canada | 4 | 0.1% |
| Central America | 5 | 0.1% |
| Latin America | 5 | 0.1% |
| Mexico | 5 | 0.1% | View All 4 Rows |
Sex and Age in Elliott County
Sex and Age in Elliott County
The most populous age groups in Elliott County are 25 to 29 Years (411 | 9.7%) for men and 40 to 44 Years (257 | 8.2%) for women.

| Age Bracket | Male | Female |
| Under 5 Years | 161 (3.8%) | 144 (4.6%) |
| 5 to 9 Years | 154 (3.6%) | 199 (6.3%) |
| 10 to 14 Years | 233 (5.5%) | 160 (5.1%) |
| 15 to 19 Years | 241 (5.7%) | 158 (5.0%) |
| 20 to 24 Years | 183 (4.3%) | 184 (5.8%) |
| 25 to 29 Years | 411 (9.7%) | 182 (5.8%) |
| 30 to 34 Years | 287 (6.8%) | 161 (5.1%) |
| 35 to 39 Years | 391 (9.2%) | 101 (3.2%) |
| 40 to 44 Years | 281 (6.6%) | 257 (8.2%) |
| 45 to 49 Years | 344 (8.1%) | 207 (6.6%) |
| 50 to 54 Years | 301 (7.1%) | 188 (6.0%) |
| 55 to 59 Years | 299 (7.1%) | 217 (6.9%) |
| 60 to 64 Years | 214 (5.1%) | 210 (6.7%) |
| 65 to 69 Years | 194 (4.6%) | 256 (8.1%) |
| 70 to 74 Years | 250 (5.9%) | 169 (5.4%) |
| 75 to 79 Years | 187 (4.4%) | 165 (5.2%) |
| 80 to 84 Years | 72 (1.7%) | 94 (3.0%) |
| 85 Years and over | 26 (0.6%) | 97 (3.1%) |
| Total | 4,229 (100.0%) | 3,149 (100.0%) |
Families and Households in Elliott County
Median Family Size in Elliott County
The median family size in Elliott County is 3.27 persons per family, with single female/mother families (262 | 17.2%) accounting for the largest median family size of 3.99 persons per family. On the other hand, married-couple families (1,205 | 79.1%) represent the smallest median family size with 3.08 persons per family.

| Family Type | # Families | Family Size |
| Married-Couple | 1,205 (79.1%) | 3.08 |
| Single Male/Father | 57 (3.7%) | 3.88 |
| Single Female/Mother | 262 (17.2%) | 3.99 |
| Total Families | 1,524 (100.0%) | 3.27 |
Median Household Size in Elliott County
The median household size in Elliott County is 2.68 persons per household, with single male/father households (57 | 2.5%) accounting for the largest median household size of 4.93 persons per household. non-family households (739 | 32.7%) represent the smallest median household size with 1.26 persons per household.
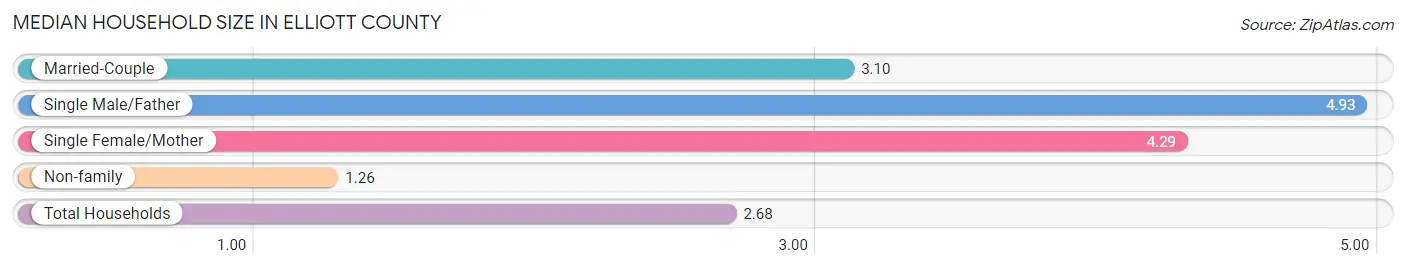
| Household Type | # Households | Household Size |
| Married-Couple | 1,205 (53.2%) | 3.10 |
| Single Male/Father | 57 (2.5%) | 4.93 |
| Single Female/Mother | 262 (11.6%) | 4.29 |
| Non-family | 739 (32.7%) | 1.26 |
| Total Households | 2,263 (100.0%) | 2.68 |
Household Size by Marriage Status in Elliott County
Out of a total of 2,263 households in Elliott County, 1,524 (67.3%) are family households, while 739 (32.7%) are nonfamily households. The most numerous type of family households are 2-person households, comprising 682, and the most common type of nonfamily households are 1-person households, comprising 621.
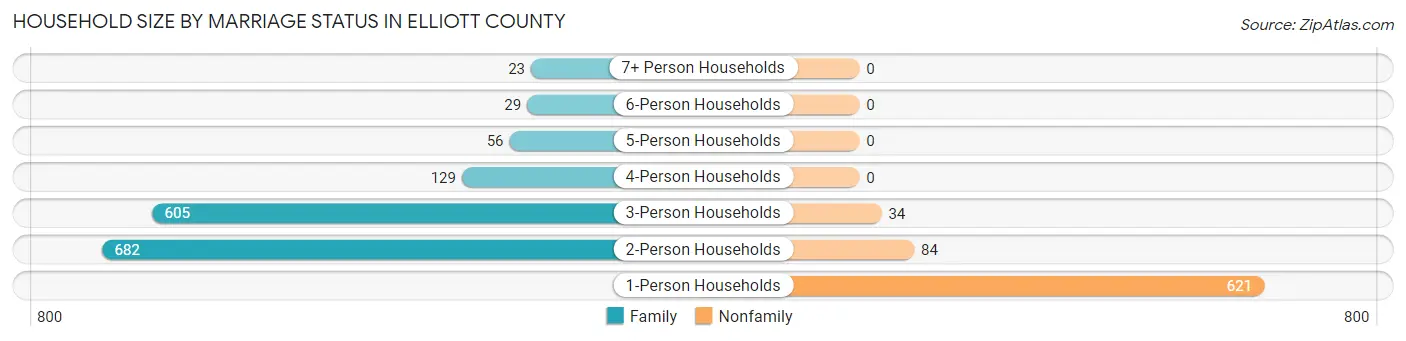
| Household Size | Family Households | Nonfamily Households |
| 1-Person Households | - | 621 (27.4%) |
| 2-Person Households | 682 (30.1%) | 84 (3.7%) |
| 3-Person Households | 605 (26.7%) | 34 (1.5%) |
| 4-Person Households | 129 (5.7%) | 0 (0.0%) |
| 5-Person Households | 56 (2.5%) | 0 (0.0%) |
| 6-Person Households | 29 (1.3%) | 0 (0.0%) |
| 7+ Person Households | 23 (1.0%) | 0 (0.0%) |
| Total | 1,524 (67.3%) | 739 (32.7%) |
Female Fertility in Elliott County
Fertility by Age in Elliott County
Average fertility rate in Elliott County is 59.0 births per 1,000 women. Women in the age bracket of 20 to 34 years have the highest fertility rate with 140.0 births per 1,000 women. Women in the age bracket of 20 to 34 years acount for 100.0% of all women with births.

| Age Bracket | Women with Births | Births / 1,000 Women |
| 15 to 19 years | 0 (0.0%) | 0.0 |
| 20 to 34 years | 74 (100.0%) | 140.0 |
| 35 to 50 years | 0 (0.0%) | 0.0 |
| Total | 74 (100.0%) | 59.0 |
Fertility by Age by Marriage Status in Elliott County

| Age Bracket | Married | Unmarried |
| 15 to 19 years | 0 (0.0%) | 0 (0.0%) |
| 20 to 34 years | 74 (100.0%) | 0 (0.0%) |
| 35 to 50 years | 0 (0.0%) | 0 (0.0%) |
| Total | 74 (100.0%) | 0 (0.0%) |
Fertility by Education in Elliott County
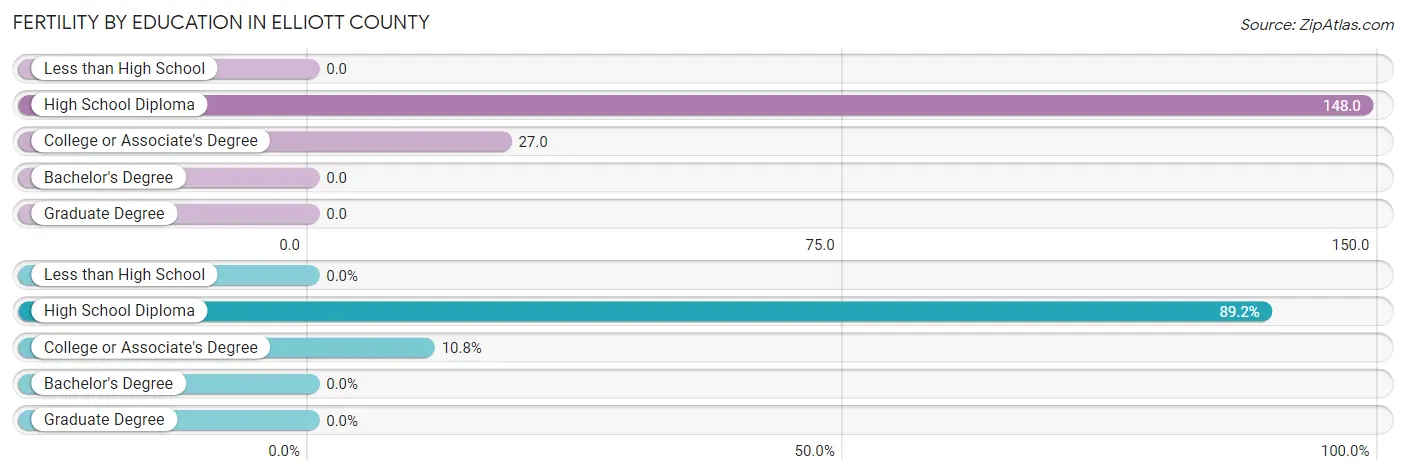
| Educational Attainment | Women with Births | Births / 1,000 Women |
| Less than High School | 0 (0.0%) | 0.0 |
| High School Diploma | 66 (89.2%) | 148.0 |
| College or Associate's Degree | 8 (10.8%) | 27.0 |
| Bachelor's Degree | 0 (0.0%) | 0.0 |
| Graduate Degree | 0 (0.0%) | 0.0 |
| Total | 74 (100.0%) | 59.0 |
Fertility by Education by Marriage Status in Elliott County

| Educational Attainment | Married | Unmarried |
| Less than High School | 0 (0.0%) | 0 (0.0%) |
| High School Diploma | 66 (100.0%) | 0 (0.0%) |
| College or Associate's Degree | 8 (100.0%) | 0 (0.0%) |
| Bachelor's Degree | 0 (0.0%) | 0 (0.0%) |
| Graduate Degree | 0 (0.0%) | 0 (0.0%) |
| Total | 74 (100.0%) | 0 (0.0%) |
Employment Characteristics in Elliott County
Employment by Class of Employer in Elliott County
Among the 1,818 employed individuals in Elliott County, private company employees (1,021 | 56.2%), self-employed (not incorporated) (293 | 16.1%), and state government employees (273 | 15.0%) make up the most common classes of employment.
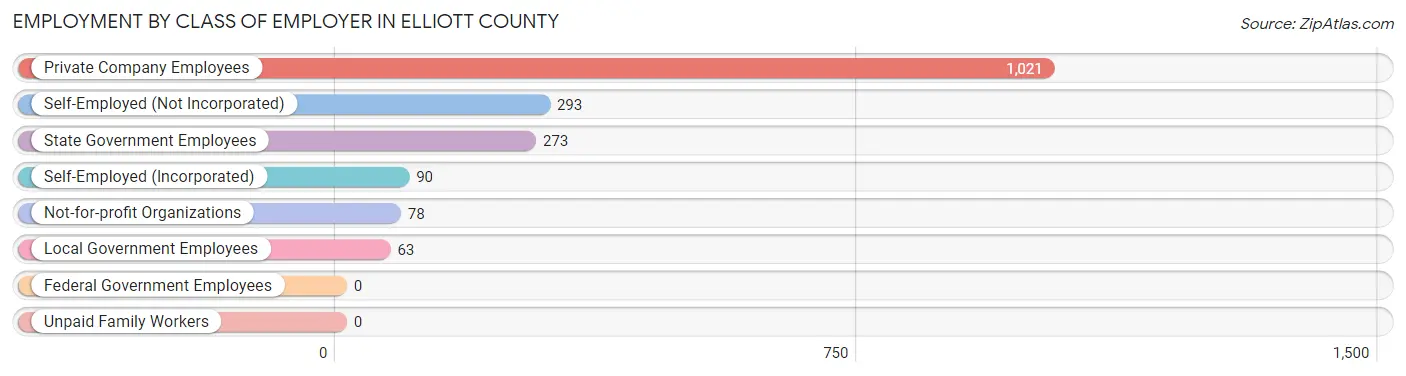
| Employer Class | # Employees | % Employees |
| Private Company Employees | 1,021 | 56.2% |
| Self-Employed (Incorporated) | 90 | 5.0% |
| Self-Employed (Not Incorporated) | 293 | 16.1% |
| Not-for-profit Organizations | 78 | 4.3% |
| Local Government Employees | 63 | 3.5% |
| State Government Employees | 273 | 15.0% |
| Federal Government Employees | 0 | 0.0% |
| Unpaid Family Workers | 0 | 0.0% |
| Total | 1,818 | 100.0% |
Employment Status by Age in Elliott County
According to the labor force statistics for Elliott County, out of the total population over 16 years of age (6,158), 32.6% or 2,008 individuals are in the labor force, with 6.0% or 120 of them unemployed. The age group with the highest labor force participation rate is 20 to 24 years, with 70.8% or 260 individuals in the labor force. Within the labor force, the 30 to 34 years age range has the highest percentage of unemployed individuals, with 27.1% or 45 of them being unemployed.

| Age Bracket | In Labor Force | Unemployed |
| 16 to 19 Years | 143 (62.2%) | 5 (3.5%) |
| 20 to 24 Years | 260 (70.8%) | 0 (0.0%) |
| 25 to 29 Years | 333 (56.2%) | 29 (8.7%) |
| 30 to 34 Years | 166 (37.1%) | 45 (27.1%) |
| 35 to 44 Years | 308 (29.9%) | 12 (3.9%) |
| 45 to 54 Years | 469 (45.1%) | 25 (5.3%) |
| 55 to 59 Years | 123 (23.8%) | 0 (0.0%) |
| 60 to 64 Years | 109 (25.7%) | 5 (4.6%) |
| 65 to 74 Years | 64 (7.4%) | 0 (0.0%) |
| 75 Years and over | 30 (4.7%) | 0 (0.0%) |
| Total | 2,008 (32.6%) | 120 (6.0%) |
Employment Status by Educational Attainment in Elliott County
According to labor force statistics for Elliott County, 37.2% of individuals (1,507) out of the total population between 25 and 64 years of age (4,051) are in the labor force, with 7.7% or 116 of them being unemployed. The group with the highest labor force participation rate are those with the educational attainment of bachelor's degree or higher, with 92.3% or 409 individuals in the labor force. Within the labor force, individuals with less than high school education have the highest percentage of unemployment, with 12.8% or 11 of them being unemployed.

| Educational Attainment | In Labor Force | Unemployed |
| Less than High School | 86 (10.8%) | 102 (12.8%) |
| High School Diploma | 652 (35.3%) | 212 (11.5%) |
| College / Associate Degree | 361 (37.4%) | 14 (1.4%) |
| Bachelor's Degree or higher | 409 (92.3%) | 27 (6.1%) |
| Total | 1,507 (37.2%) | 312 (7.7%) |
Employment Occupations by Sex in Elliott County
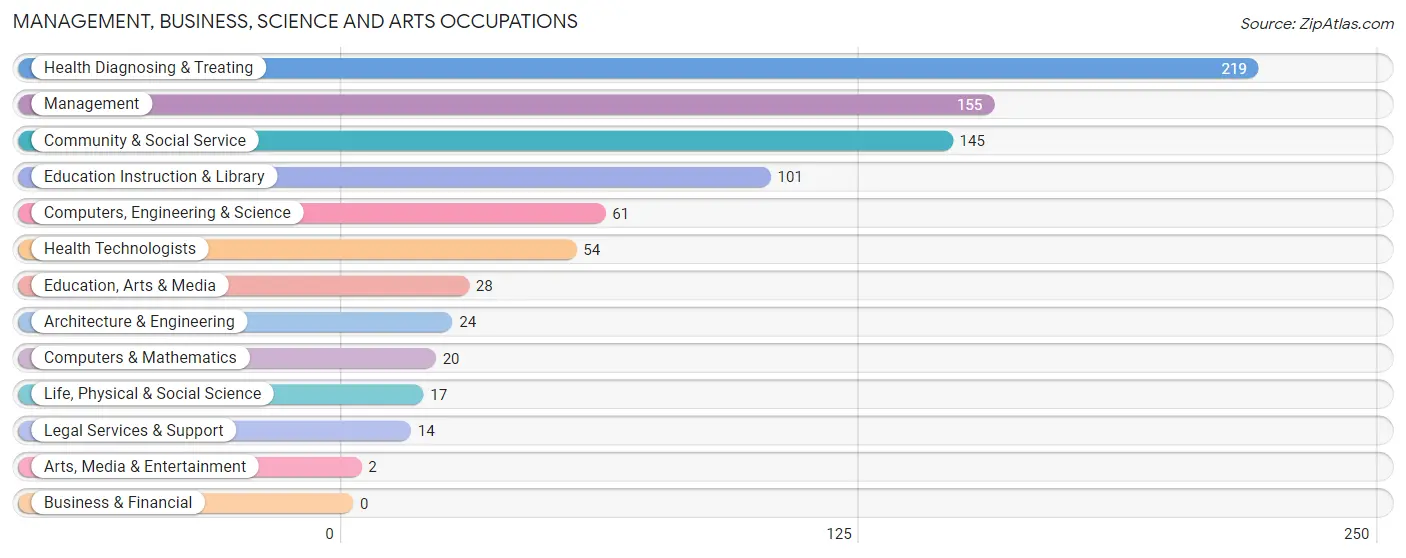
Management, Business, Science and Arts Occupations
The most common Management, Business, Science and Arts occupations in Elliott County are Health Diagnosing & Treating (219 | 11.6%), Management (155 | 8.2%), Community & Social Service (145 | 7.7%), Education Instruction & Library (101 | 5.4%), and Computers, Engineering & Science (61 | 3.2%).
Management, Business, Science and Arts Occupations by Sex
Within the Management, Business, Science and Arts occupations in Elliott County, the most male-oriented occupations are Computers, Engineering & Science (100.0%), Computers & Mathematics (100.0%), and Architecture & Engineering (100.0%), while the most female-oriented occupations are Health Diagnosing & Treating (99.1%), Health Technologists (96.3%), and Management (81.3%).

| Occupation | Male | Female |
| Management | 29 (18.7%) | 126 (81.3%) |
| Business & Financial | 0 (0.0%) | 0 (0.0%) |
| Computers, Engineering & Science | 61 (100.0%) | 0 (0.0%) |
| Computers & Mathematics | 20 (100.0%) | 0 (0.0%) |
| Architecture & Engineering | 24 (100.0%) | 0 (0.0%) |
| Life, Physical & Social Science | 17 (100.0%) | 0 (0.0%) |
| Community & Social Service | 77 (53.1%) | 68 (46.9%) |
| Education, Arts & Media | 6 (21.4%) | 22 (78.6%) |
| Legal Services & Support | 14 (100.0%) | 0 (0.0%) |
| Education Instruction & Library | 55 (54.5%) | 46 (45.5%) |
| Arts, Media & Entertainment | 2 (100.0%) | 0 (0.0%) |
| Health Diagnosing & Treating | 2 (0.9%) | 217 (99.1%) |
| Health Technologists | 2 (3.7%) | 52 (96.3%) |
| Total (Category) | 169 (29.1%) | 411 (70.9%) |
| Total (Overall) | 1,031 (54.7%) | 853 (45.3%) |
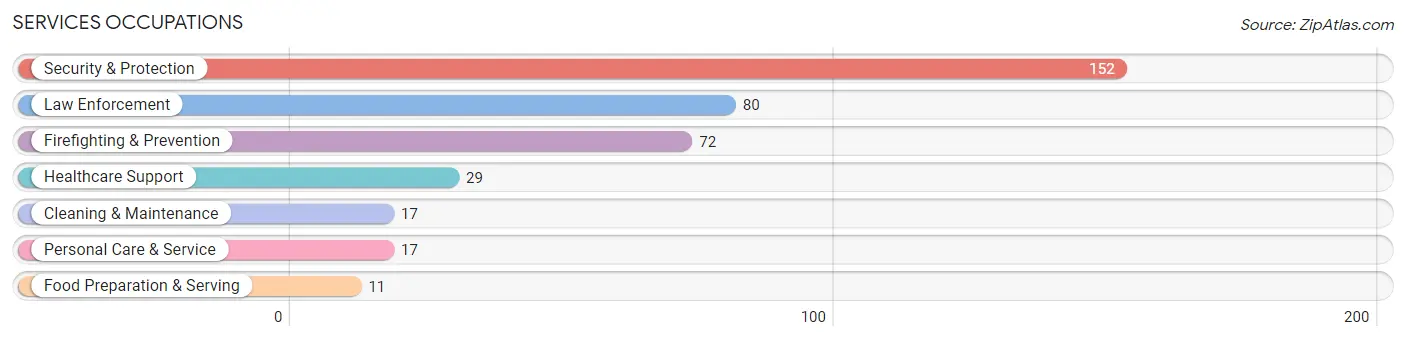
Services Occupations
The most common Services occupations in Elliott County are Security & Protection (152 | 8.1%), Law Enforcement (80 | 4.3%), Firefighting & Prevention (72 | 3.8%), Healthcare Support (29 | 1.5%), and Cleaning & Maintenance (17 | 0.9%).
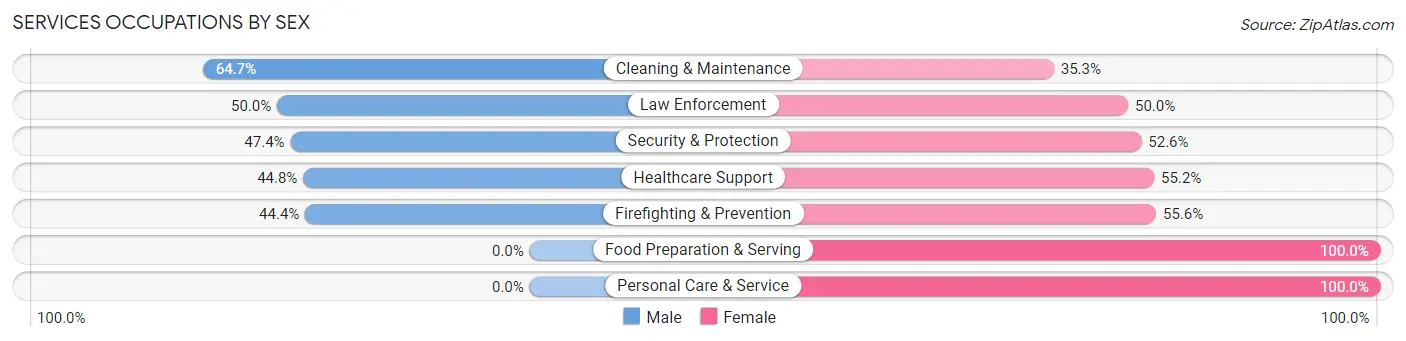
Services Occupations by Sex
Within the Services occupations in Elliott County, the most male-oriented occupations are Cleaning & Maintenance (64.7%), Law Enforcement (50.0%), and Security & Protection (47.4%), while the most female-oriented occupations are Food Preparation & Serving (100.0%), Personal Care & Service (100.0%), and Firefighting & Prevention (55.6%).
| Occupation | Male | Female |
| Healthcare Support | 13 (44.8%) | 16 (55.2%) |
| Security & Protection | 72 (47.4%) | 80 (52.6%) |
| Firefighting & Prevention | 32 (44.4%) | 40 (55.6%) |
| Law Enforcement | 40 (50.0%) | 40 (50.0%) |
| Food Preparation & Serving | 0 (0.0%) | 11 (100.0%) |
| Cleaning & Maintenance | 11 (64.7%) | 6 (35.3%) |
| Personal Care & Service | 0 (0.0%) | 17 (100.0%) |
| Total (Category) | 96 (42.5%) | 130 (57.5%) |
| Total (Overall) | 1,031 (54.7%) | 853 (45.3%) |
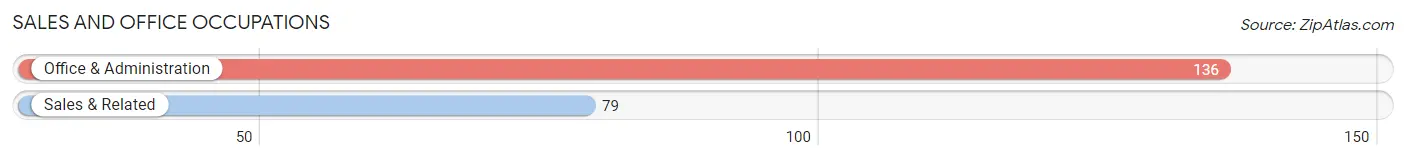
Sales and Office Occupations
The most common Sales and Office occupations in Elliott County are Office & Administration (136 | 7.2%), and Sales & Related (79 | 4.2%).
Sales and Office Occupations by Sex
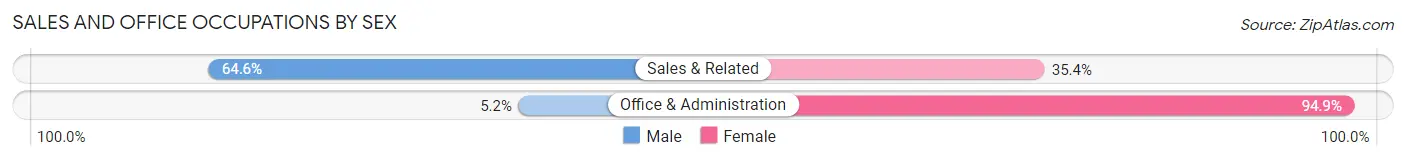
| Occupation | Male | Female |
| Sales & Related | 51 (64.6%) | 28 (35.4%) |
| Office & Administration | 7 (5.1%) | 129 (94.9%) |
| Total (Category) | 58 (27.0%) | 157 (73.0%) |
| Total (Overall) | 1,031 (54.7%) | 853 (45.3%) |
Natural Resources, Construction and Maintenance Occupations
The most common Natural Resources, Construction and Maintenance occupations in Elliott County are Construction & Extraction (255 | 13.5%), Installation, Maintenance & Repair (111 | 5.9%), and Farming, Fishing & Forestry (34 | 1.8%).

Natural Resources, Construction and Maintenance Occupations by Sex

| Occupation | Male | Female |
| Farming, Fishing & Forestry | 34 (100.0%) | 0 (0.0%) |
| Construction & Extraction | 205 (80.4%) | 50 (19.6%) |
| Installation, Maintenance & Repair | 111 (100.0%) | 0 (0.0%) |
| Total (Category) | 350 (87.5%) | 50 (12.5%) |
| Total (Overall) | 1,031 (54.7%) | 853 (45.3%) |
Production, Transportation and Moving Occupations
The most common Production, Transportation and Moving occupations in Elliott County are Material Moving (227 | 12.0%), Production (158 | 8.4%), and Transportation (78 | 4.1%).
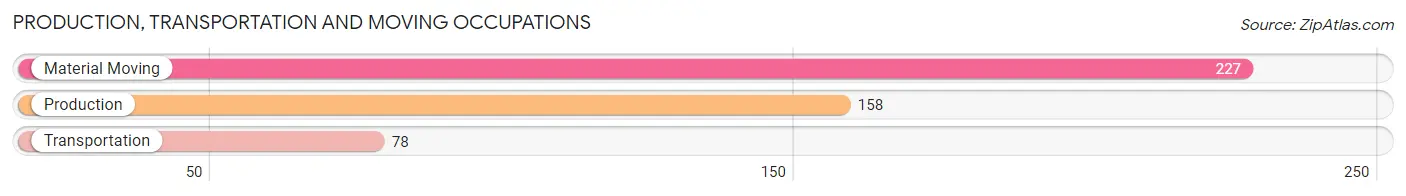
Production, Transportation and Moving Occupations by Sex

| Occupation | Male | Female |
| Production | 74 (46.8%) | 84 (53.2%) |
| Transportation | 78 (100.0%) | 0 (0.0%) |
| Material Moving | 206 (90.7%) | 21 (9.2%) |
| Total (Category) | 358 (77.3%) | 105 (22.7%) |
| Total (Overall) | 1,031 (54.7%) | 853 (45.3%) |
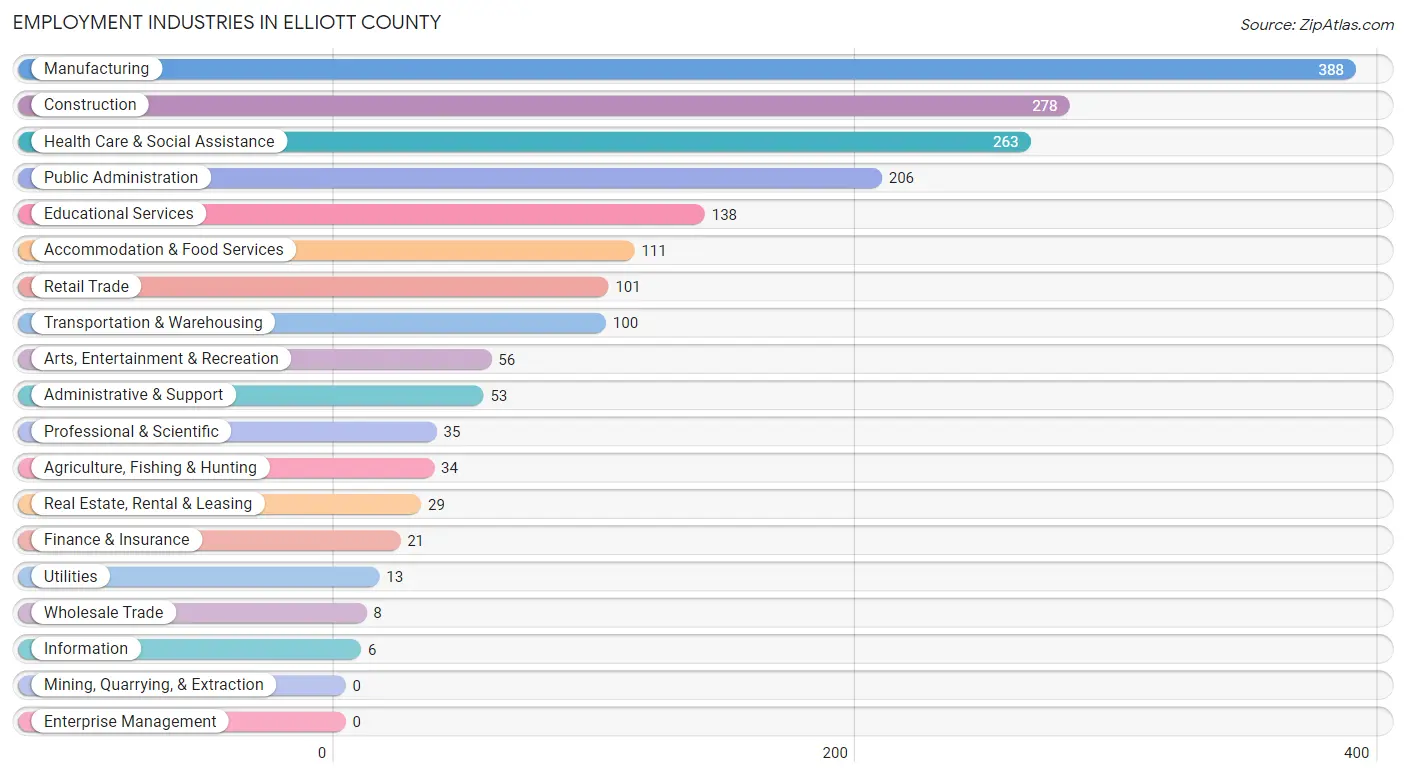
Employment Industries by Sex in Elliott County
Employment Industries in Elliott County
The major employment industries in Elliott County include Manufacturing (388 | 20.6%), Construction (278 | 14.8%), Health Care & Social Assistance (263 | 14.0%), Public Administration (206 | 10.9%), and Educational Services (138 | 7.3%).
Employment Industries by Sex in Elliott County
The Elliott County industries that see more men than women are Agriculture, Fishing & Hunting (100.0%), Wholesale Trade (100.0%), and Transportation & Warehousing (95.0%), whereas the industries that tend to have a higher number of women are Information (100.0%), Arts, Entertainment & Recreation (100.0%), and Accommodation & Food Services (100.0%).

| Industry | Male | Female |
| Agriculture, Fishing & Hunting | 34 (100.0%) | 0 (0.0%) |
| Mining, Quarrying, & Extraction | 0 (0.0%) | 0 (0.0%) |
| Construction | 228 (82.0%) | 50 (18.0%) |
| Manufacturing | 298 (76.8%) | 90 (23.2%) |
| Wholesale Trade | 8 (100.0%) | 0 (0.0%) |
| Retail Trade | 45 (44.6%) | 56 (55.4%) |
| Transportation & Warehousing | 95 (95.0%) | 5 (5.0%) |
| Utilities | 12 (92.3%) | 1 (7.7%) |
| Information | 0 (0.0%) | 6 (100.0%) |
| Finance & Insurance | 12 (57.1%) | 9 (42.9%) |
| Real Estate, Rental & Leasing | 8 (27.6%) | 21 (72.4%) |
| Professional & Scientific | 32 (91.4%) | 3 (8.6%) |
| Enterprise Management | 0 (0.0%) | 0 (0.0%) |
| Administrative & Support | 28 (52.8%) | 25 (47.2%) |
| Educational Services | 102 (73.9%) | 36 (26.1%) |
| Health Care & Social Assistance | 13 (4.9%) | 250 (95.1%) |
| Arts, Entertainment & Recreation | 0 (0.0%) | 56 (100.0%) |
| Accommodation & Food Services | 0 (0.0%) | 111 (100.0%) |
| Public Administration | 95 (46.1%) | 111 (53.9%) |
| Total | 1,031 (54.7%) | 853 (45.3%) |
Education in Elliott County
School Enrollment in Elliott County
The most common levels of schooling among the 1,088 students in Elliott County are middle school (354 | 32.5%), high school (250 | 23.0%), and college / undergraduate (212 | 19.5%).

| School Level | # Students | % Students |
| Nursery / Preschool | 38 | 3.5% |
| Kindergarten | 31 | 2.9% |
| Elementary School | 197 | 18.1% |
| Middle School | 354 | 32.5% |
| High School | 250 | 23.0% |
| College / Undergraduate | 212 | 19.5% |
| Graduate / Professional | 6 | 0.5% |
| Total | 1,088 | 100.0% |
School Enrollment by Age by Funding Source in Elliott County
Out of a total of 1,088 students who are enrolled in schools in Elliott County, 51 (4.7%) attend a private institution, while the remaining 1,037 (95.3%) are enrolled in public schools. The age group of 5 to 9 year old has the highest likelihood of being enrolled in private schools, with 26 (11.4% in the age bracket) enrolled. Conversely, the age group of 3 to 4 year olds has the lowest likelihood of being enrolled in a private school, with 14 (100.0% in the age bracket) attending a public institution.

| Age Bracket | Public School | Private School |
| 3 to 4 Year Olds | 14 (100.0%) | 0 (0.0%) |
| 5 to 9 Year Old | 202 (88.6%) | 26 (11.4%) |
| 10 to 14 Year Olds | 378 (100.0%) | 0 (0.0%) |
| 15 to 17 Year Olds | 205 (89.9%) | 23 (10.1%) |
| 18 to 19 Year Olds | 140 (100.0%) | 0 (0.0%) |
| 20 to 24 Year Olds | 68 (100.0%) | 0 (0.0%) |
| 25 to 34 Year Olds | 9 (100.0%) | 0 (0.0%) |
| 35 Years and over | 21 (91.3%) | 2 (8.7%) |
| Total | 1,037 (95.3%) | 51 (4.7%) |
Educational Attainment by Field of Study in Elliott County
Education (142 | 23.6%), business (109 | 18.1%), science & technology (106 | 17.6%), arts & humanities (99 | 16.5%), and social sciences (37 | 6.1%) are the most common fields of study among 602 individuals in Elliott County who have obtained a bachelor's degree or higher.

| Field of Study | # Graduates | % Graduates |
| Computers & Mathematics | 3 | 0.5% |
| Bio, Nature & Agricultural | 10 | 1.7% |
| Physical & Health Sciences | 23 | 3.8% |
| Psychology | 35 | 5.8% |
| Social Sciences | 37 | 6.1% |
| Engineering | 11 | 1.8% |
| Multidisciplinary Studies | 0 | 0.0% |
| Science & Technology | 106 | 17.6% |
| Business | 109 | 18.1% |
| Education | 142 | 23.6% |
| Literature & Languages | 0 | 0.0% |
| Liberal Arts & History | 0 | 0.0% |
| Visual & Performing Arts | 4 | 0.7% |
| Communications | 23 | 3.8% |
| Arts & Humanities | 99 | 16.5% |
| Total | 602 | 100.0% |
Transportation & Commute in Elliott County
Vehicle Availability by Sex in Elliott County
The most prevalent vehicle ownership categories in Elliott County are males with 4 vehicles (273, accounting for 28.1%) and females with 4 vehicles (83, making up 32.3%).
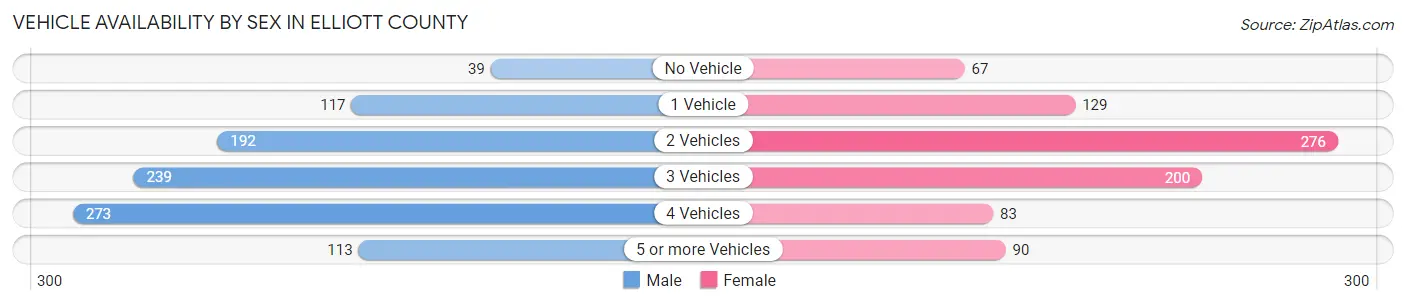
| Vehicles Available | Male | Female |
| No Vehicle | 39 (4.0%) | 67 (7.9%) |
| 1 Vehicle | 117 (12.0%) | 129 (15.3%) |
| 2 Vehicles | 192 (19.7%) | 276 (32.7%) |
| 3 Vehicles | 239 (24.6%) | 200 (23.7%) |
| 4 Vehicles | 273 (28.1%) | 83 (9.8%) |
| 5 or more Vehicles | 113 (11.6%) | 90 (10.6%) |
| Total | 973 (100.0%) | 845 (100.0%) |
Commute Time in Elliott County
The most frequently occuring commute durations in Elliott County are 30 to 34 minutes (299 commuters, 17.8%), 60 to 89 minutes (217 commuters, 12.9%), and 90 or more minutes (172 commuters, 10.2%).
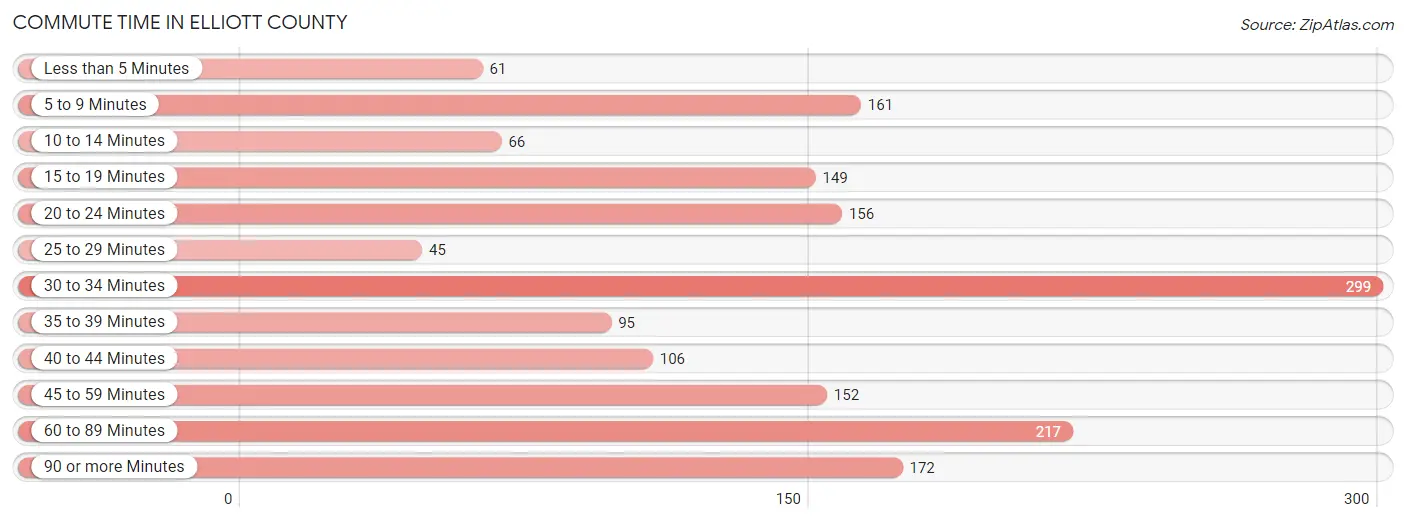
| Commute Time | # Commuters | % Commuters |
| Less than 5 Minutes | 61 | 3.6% |
| 5 to 9 Minutes | 161 | 9.6% |
| 10 to 14 Minutes | 66 | 3.9% |
| 15 to 19 Minutes | 149 | 8.9% |
| 20 to 24 Minutes | 156 | 9.3% |
| 25 to 29 Minutes | 45 | 2.7% |
| 30 to 34 Minutes | 299 | 17.8% |
| 35 to 39 Minutes | 95 | 5.7% |
| 40 to 44 Minutes | 106 | 6.3% |
| 45 to 59 Minutes | 152 | 9.0% |
| 60 to 89 Minutes | 217 | 12.9% |
| 90 or more Minutes | 172 | 10.2% |
Commute Time by Sex in Elliott County
The most common commute times in Elliott County are 30 to 34 minutes (206 commuters, 21.5%) for males and 60 to 89 minutes (125 commuters, 17.3%) for females.
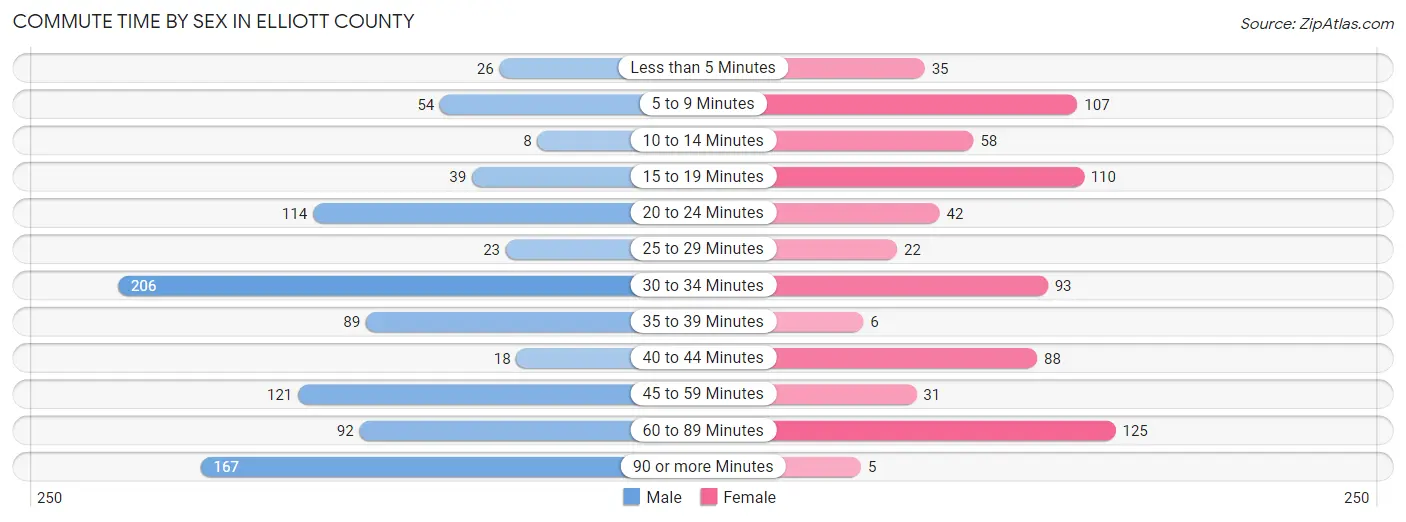
| Commute Time | Male | Female |
| Less than 5 Minutes | 26 (2.7%) | 35 (4.9%) |
| 5 to 9 Minutes | 54 (5.6%) | 107 (14.8%) |
| 10 to 14 Minutes | 8 (0.8%) | 58 (8.0%) |
| 15 to 19 Minutes | 39 (4.1%) | 110 (15.2%) |
| 20 to 24 Minutes | 114 (11.9%) | 42 (5.8%) |
| 25 to 29 Minutes | 23 (2.4%) | 22 (3.0%) |
| 30 to 34 Minutes | 206 (21.5%) | 93 (12.9%) |
| 35 to 39 Minutes | 89 (9.3%) | 6 (0.8%) |
| 40 to 44 Minutes | 18 (1.9%) | 88 (12.2%) |
| 45 to 59 Minutes | 121 (12.6%) | 31 (4.3%) |
| 60 to 89 Minutes | 92 (9.6%) | 125 (17.3%) |
| 90 or more Minutes | 167 (17.4%) | 5 (0.7%) |
Time of Departure to Work by Sex in Elliott County
The most frequent times of departure to work in Elliott County are 7:00 AM to 7:29 AM (231, 24.1%) for males and 12:00 AM to 4:59 AM (114, 15.8%) for females.
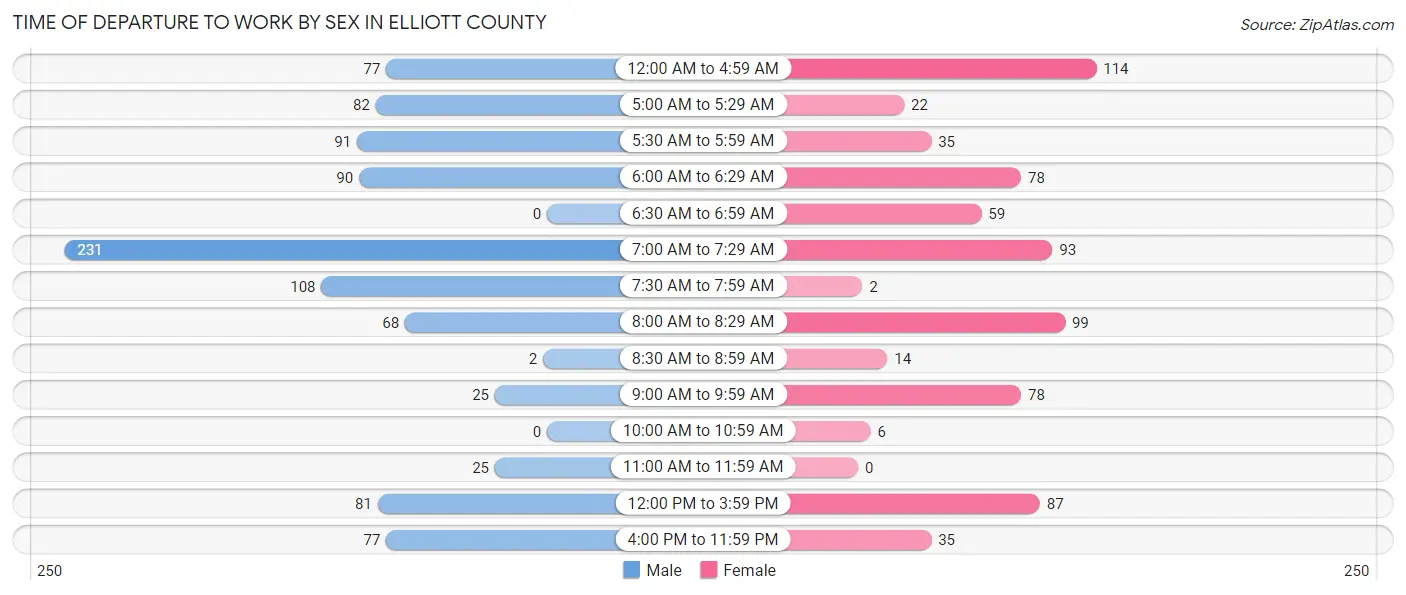
| Time of Departure | Male | Female |
| 12:00 AM to 4:59 AM | 77 (8.1%) | 114 (15.8%) |
| 5:00 AM to 5:29 AM | 82 (8.6%) | 22 (3.0%) |
| 5:30 AM to 5:59 AM | 91 (9.5%) | 35 (4.9%) |
| 6:00 AM to 6:29 AM | 90 (9.4%) | 78 (10.8%) |
| 6:30 AM to 6:59 AM | 0 (0.0%) | 59 (8.2%) |
| 7:00 AM to 7:29 AM | 231 (24.1%) | 93 (12.9%) |
| 7:30 AM to 7:59 AM | 108 (11.3%) | 2 (0.3%) |
| 8:00 AM to 8:29 AM | 68 (7.1%) | 99 (13.7%) |
| 8:30 AM to 8:59 AM | 2 (0.2%) | 14 (1.9%) |
| 9:00 AM to 9:59 AM | 25 (2.6%) | 78 (10.8%) |
| 10:00 AM to 10:59 AM | 0 (0.0%) | 6 (0.8%) |
| 11:00 AM to 11:59 AM | 25 (2.6%) | 0 (0.0%) |
| 12:00 PM to 3:59 PM | 81 (8.5%) | 87 (12.0%) |
| 4:00 PM to 11:59 PM | 77 (8.1%) | 35 (4.9%) |
| Total | 957 (100.0%) | 722 (100.0%) |
Housing Occupancy in Elliott County
Occupancy by Ownership in Elliott County
Of the total 2,263 dwellings in Elliott County, owner-occupied units account for 1,735 (76.7%), while renter-occupied units make up 528 (23.3%).
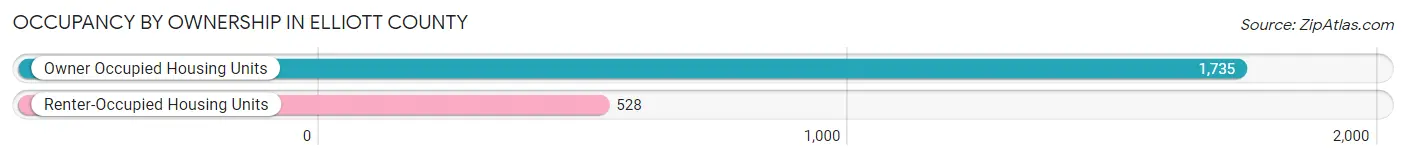
| Occupancy | # Housing Units | % Housing Units |
| Owner Occupied Housing Units | 1,735 | 76.7% |
| Renter-Occupied Housing Units | 528 | 23.3% |
| Total Occupied Housing Units | 2,263 | 100.0% |
Occupancy by Household Size in Elliott County

| Household Size | # Housing Units | % Housing Units |
| 1-Person Household | 621 | 27.4% |
| 2-Person Household | 766 | 33.9% |
| 3-Person Household | 639 | 28.2% |
| 4+ Person Household | 237 | 10.5% |
| Total Housing Units | 2,263 | 100.0% |
Occupancy by Ownership by Household Size in Elliott County

| Household Size | Owner-occupied | Renter-occupied |
| 1-Person Household | 391 (63.0%) | 230 (37.0%) |
| 2-Person Household | 666 (87.0%) | 100 (13.1%) |
| 3-Person Household | 543 (85.0%) | 96 (15.0%) |
| 4+ Person Household | 135 (57.0%) | 102 (43.0%) |
| Total Housing Units | 1,735 (76.7%) | 528 (23.3%) |
Occupancy by Educational Attainment in Elliott County

| Household Size | Owner-occupied | Renter-occupied |
| Less than High School | 444 (70.7%) | 184 (29.3%) |
| High School Diploma | 677 (81.4%) | 155 (18.6%) |
| College/Associate Degree | 320 (70.8%) | 132 (29.2%) |
| Bachelor's Degree or higher | 294 (83.8%) | 57 (16.2%) |
Occupancy by Age of Householder in Elliott County
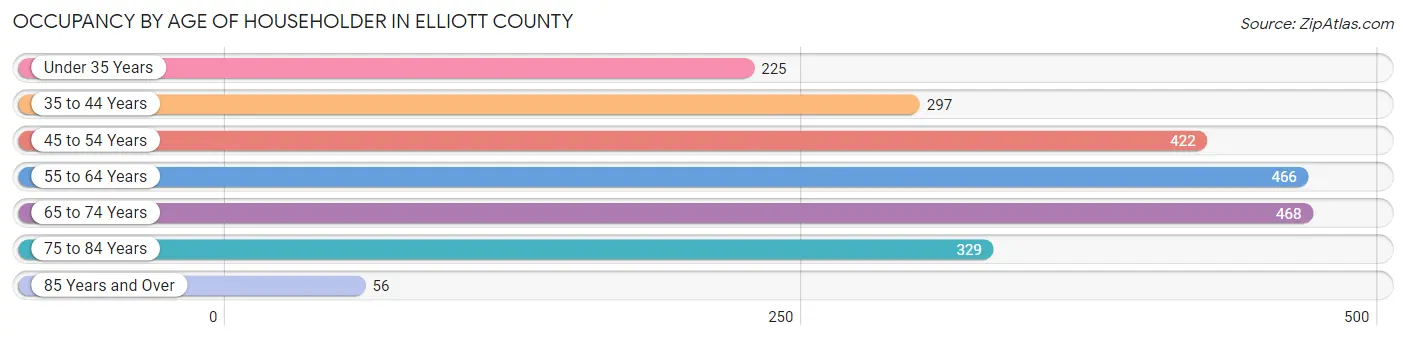
| Age Bracket | # Households | % Households |
| Under 35 Years | 225 | 9.9% |
| 35 to 44 Years | 297 | 13.1% |
| 45 to 54 Years | 422 | 18.6% |
| 55 to 64 Years | 466 | 20.6% |
| 65 to 74 Years | 468 | 20.7% |
| 75 to 84 Years | 329 | 14.5% |
| 85 Years and Over | 56 | 2.5% |
| Total | 2,263 | 100.0% |
Housing Finances in Elliott County
Median Income by Occupancy in Elliott County
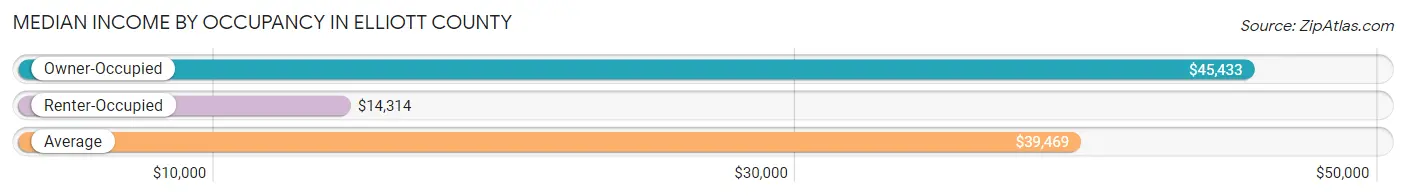
| Occupancy Type | # Households | Median Income |
| Owner-Occupied | 1,735 (76.7%) | $45,433 |
| Renter-Occupied | 528 (23.3%) | $14,314 |
| Average | 2,263 (100.0%) | $39,469 |
Occupancy by Householder Income Bracket in Elliott County
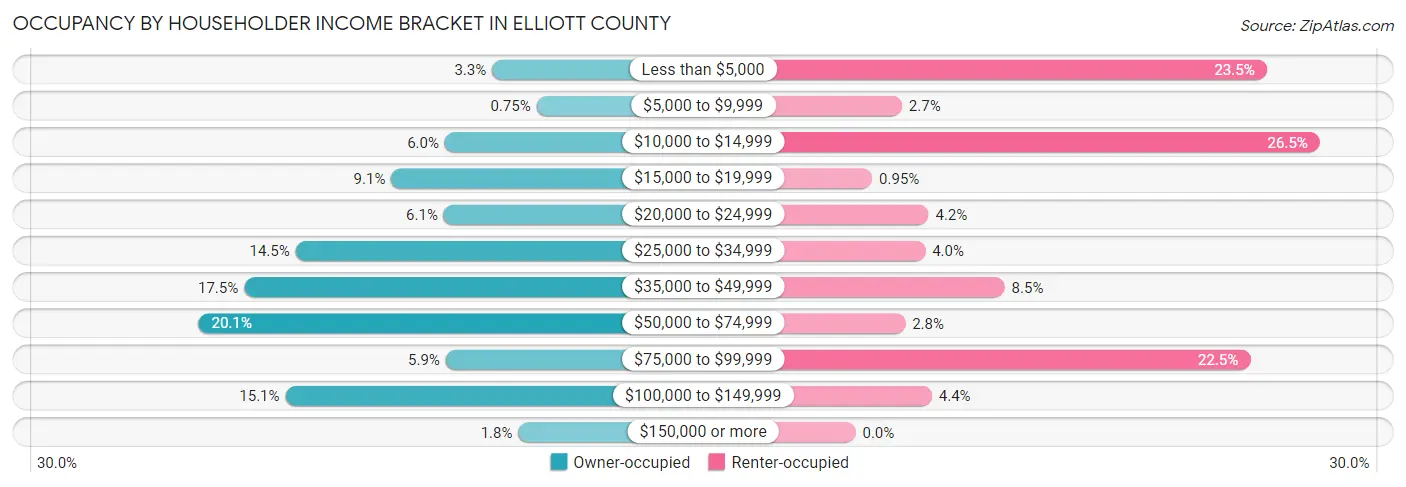
| Income Bracket | Owner-occupied | Renter-occupied |
| Less than $5,000 | 57 (3.3%) | 124 (23.5%) |
| $5,000 to $9,999 | 13 (0.7%) | 14 (2.6%) |
| $10,000 to $14,999 | 104 (6.0%) | 140 (26.5%) |
| $15,000 to $19,999 | 157 (9.0%) | 5 (0.9%) |
| $20,000 to $24,999 | 105 (6.0%) | 22 (4.2%) |
| $25,000 to $34,999 | 252 (14.5%) | 21 (4.0%) |
| $35,000 to $49,999 | 303 (17.5%) | 45 (8.5%) |
| $50,000 to $74,999 | 348 (20.1%) | 15 (2.8%) |
| $75,000 to $99,999 | 103 (5.9%) | 119 (22.5%) |
| $100,000 to $149,999 | 262 (15.1%) | 23 (4.4%) |
| $150,000 or more | 31 (1.8%) | 0 (0.0%) |
| Total | 1,735 (100.0%) | 528 (100.0%) |
Monthly Housing Cost Tiers in Elliott County
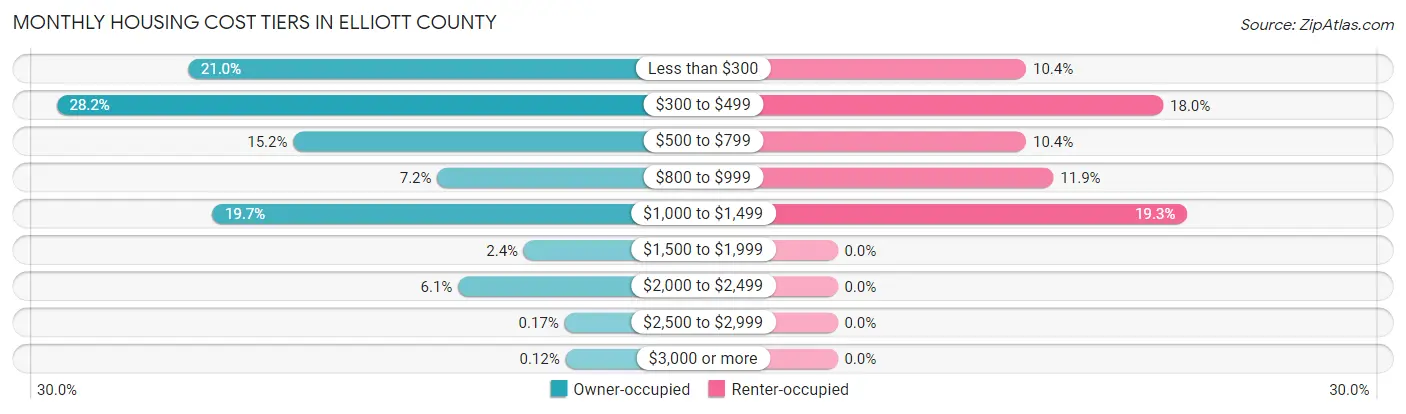
| Monthly Cost | Owner-occupied | Renter-occupied |
| Less than $300 | 364 (21.0%) | 55 (10.4%) |
| $300 to $499 | 490 (28.2%) | 95 (18.0%) |
| $500 to $799 | 263 (15.2%) | 55 (10.4%) |
| $800 to $999 | 125 (7.2%) | 63 (11.9%) |
| $1,000 to $1,499 | 341 (19.7%) | 102 (19.3%) |
| $1,500 to $1,999 | 42 (2.4%) | 0 (0.0%) |
| $2,000 to $2,499 | 105 (6.0%) | 0 (0.0%) |
| $2,500 to $2,999 | 3 (0.2%) | 0 (0.0%) |
| $3,000 or more | 2 (0.1%) | 0 (0.0%) |
| Total | 1,735 (100.0%) | 528 (100.0%) |
Physical Housing Characteristics in Elliott County
Housing Structures in Elliott County
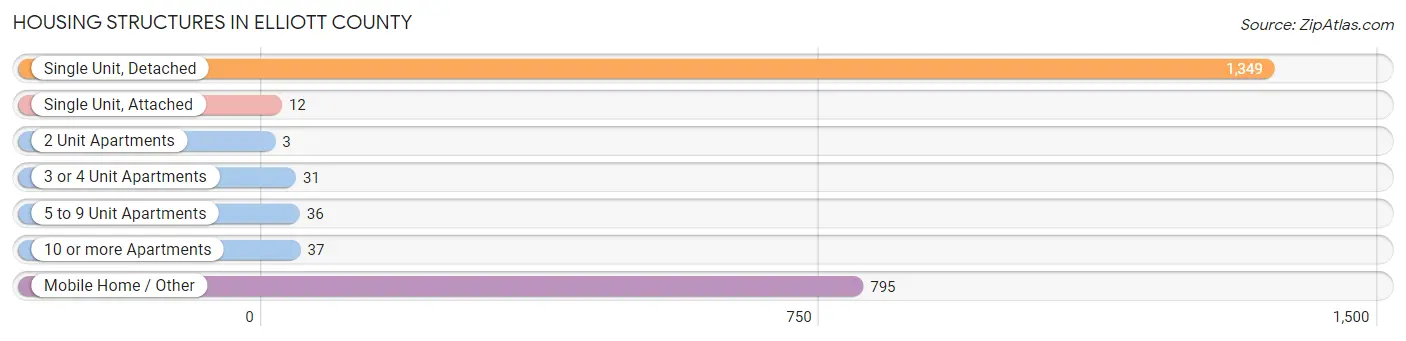
| Structure Type | # Housing Units | % Housing Units |
| Single Unit, Detached | 1,349 | 59.6% |
| Single Unit, Attached | 12 | 0.5% |
| 2 Unit Apartments | 3 | 0.1% |
| 3 or 4 Unit Apartments | 31 | 1.4% |
| 5 to 9 Unit Apartments | 36 | 1.6% |
| 10 or more Apartments | 37 | 1.6% |
| Mobile Home / Other | 795 | 35.1% |
| Total | 2,263 | 100.0% |
Housing Structures by Occupancy in Elliott County

| Structure Type | Owner-occupied | Renter-occupied |
| Single Unit, Detached | 1,130 (83.8%) | 219 (16.2%) |
| Single Unit, Attached | 0 (0.0%) | 12 (100.0%) |
| 2 Unit Apartments | 3 (100.0%) | 0 (0.0%) |
| 3 or 4 Unit Apartments | 0 (0.0%) | 31 (100.0%) |
| 5 to 9 Unit Apartments | 0 (0.0%) | 36 (100.0%) |
| 10 or more Apartments | 0 (0.0%) | 37 (100.0%) |
| Mobile Home / Other | 602 (75.7%) | 193 (24.3%) |
| Total | 1,735 (76.7%) | 528 (23.3%) |
Housing Structures by Number of Rooms in Elliott County

| Number of Rooms | Owner-occupied | Renter-occupied |
| 1 Room | 21 (1.2%) | 0 (0.0%) |
| 2 or 3 Rooms | 17 (1.0%) | 71 (13.5%) |
| 4 or 5 Rooms | 569 (32.8%) | 335 (63.4%) |
| 6 or 7 Rooms | 710 (40.9%) | 67 (12.7%) |
| 8 or more Rooms | 418 (24.1%) | 55 (10.4%) |
| Total | 1,735 (100.0%) | 528 (100.0%) |
Housing Structure by Heating Type in Elliott County

| Heating Type | Owner-occupied | Renter-occupied |
| Utility Gas | 37 (2.1%) | 30 (5.7%) |
| Bottled, Tank, or LP Gas | 467 (26.9%) | 150 (28.4%) |
| Electricity | 884 (50.9%) | 221 (41.9%) |
| Fuel Oil or Kerosene | 0 (0.0%) | 1 (0.2%) |
| Coal or Coke | 88 (5.1%) | 0 (0.0%) |
| All other Fuels | 259 (14.9%) | 126 (23.9%) |
| No Fuel Used | 0 (0.0%) | 0 (0.0%) |
| Total | 1,735 (100.0%) | 528 (100.0%) |
Household Vehicle Usage in Elliott County

| Vehicles per Household | Owner-occupied | Renter-occupied |
| No Vehicle | 81 (4.7%) | 75 (14.2%) |
| 1 Vehicle | 547 (31.5%) | 284 (53.8%) |
| 2 Vehicles | 575 (33.1%) | 130 (24.6%) |
| 3 or more Vehicles | 532 (30.7%) | 39 (7.4%) |
| Total | 1,735 (100.0%) | 528 (100.0%) |
Real Estate & Mortgages in Elliott County
Real Estate and Mortgage Overview in Elliott County
| Characteristic | Without Mortgage | With Mortgage |
| Housing Units | 1,060 | 675 |
| Median Property Value | $69,900 | $130,800 |
| Median Household Income | $36,400 | $26 |
| Monthly Housing Costs | $352 | $2 |
| Real Estate Taxes | $388 | $10 |
Property Value by Mortgage Status in Elliott County

| Property Value | Without Mortgage | With Mortgage |
| Less than $50,000 | 425 (40.1%) | 85 (12.6%) |
| $50,000 to $99,999 | 256 (24.1%) | 197 (29.2%) |
| $100,000 to $299,999 | 344 (32.5%) | 313 (46.4%) |
| $300,000 to $499,999 | 14 (1.3%) | 69 (10.2%) |
| $500,000 to $749,999 | 0 (0.0%) | 9 (1.3%) |
| $750,000 to $999,999 | 0 (0.0%) | 0 (0.0%) |
| $1,000,000 or more | 21 (2.0%) | 2 (0.3%) |
| Total | 1,060 (100.0%) | 675 (100.0%) |
Household Income by Mortgage Status in Elliott County

| Household Income | Without Mortgage | With Mortgage |
| Less than $10,000 | 62 (5.9%) | 7 (1.0%) |
| $10,000 to $24,999 | 259 (24.4%) | 8 (1.2%) |
| $25,000 to $34,999 | 195 (18.4%) | 107 (15.9%) |
| $35,000 to $49,999 | 244 (23.0%) | 57 (8.4%) |
| $50,000 to $74,999 | 130 (12.3%) | 59 (8.7%) |
| $75,000 to $99,999 | 54 (5.1%) | 218 (32.3%) |
| $100,000 to $149,999 | 111 (10.5%) | 49 (7.3%) |
| $150,000 or more | 5 (0.5%) | 151 (22.4%) |
| Total | 1,060 (100.0%) | 675 (100.0%) |
Property Value to Household Income Ratio in Elliott County
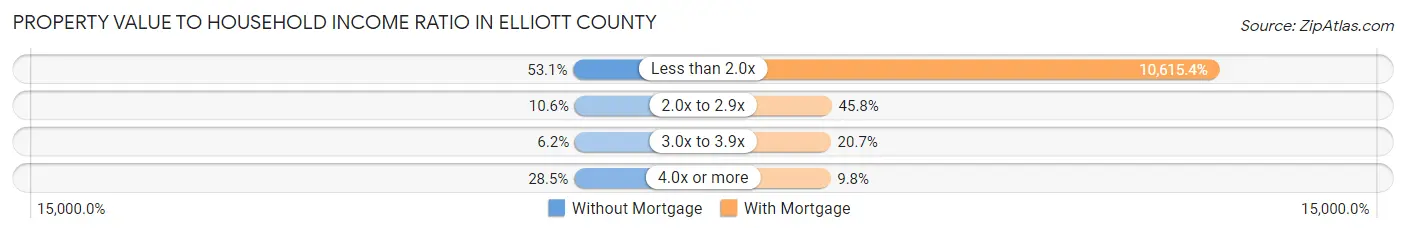
| Value-to-Income Ratio | Without Mortgage | With Mortgage |
| Less than 2.0x | 563 (53.1%) | 71,654 (10,615.4%) |
| 2.0x to 2.9x | 112 (10.6%) | 309 (45.8%) |
| 3.0x to 3.9x | 66 (6.2%) | 140 (20.7%) |
| 4.0x or more | 302 (28.5%) | 66 (9.8%) |
| Total | 1,060 (100.0%) | 675 (100.0%) |
Real Estate Taxes by Mortgage Status in Elliott County

| Property Taxes | Without Mortgage | With Mortgage |
| Less than $800 | 654 (61.7%) | 8 (1.2%) |
| $800 to $1,499 | 103 (9.7%) | 278 (41.2%) |
| $800 to $1,499 | 42 (4.0%) | 203 (30.1%) |
| Total | 1,060 (100.0%) | 675 (100.0%) |
Health & Disability in Elliott County
Health Insurance Coverage by Age in Elliott County
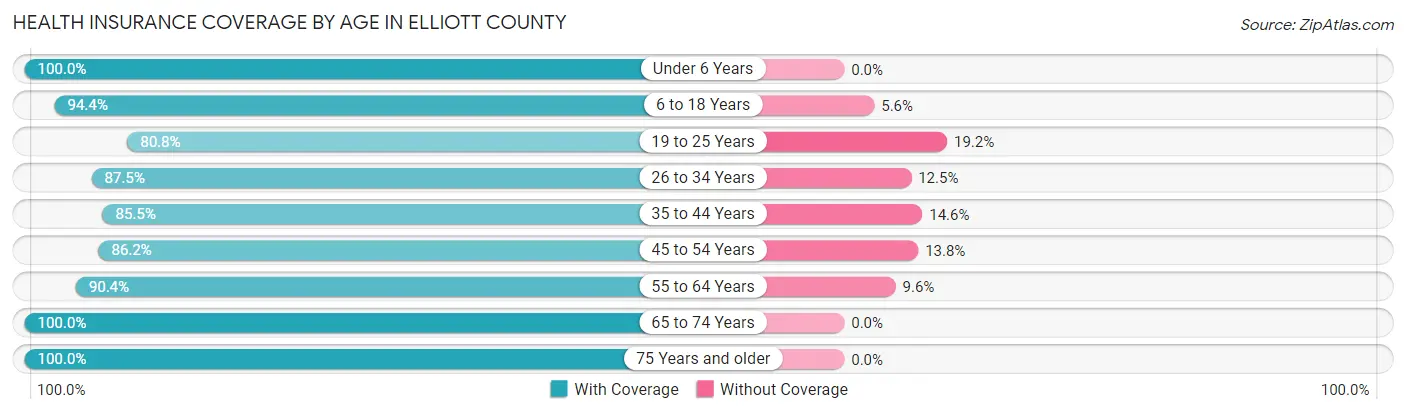
| Age Bracket | With Coverage | Without Coverage |
| Under 6 Years | 434 (100.0%) | 0 (0.0%) |
| 6 to 18 Years | 844 (94.4%) | 50 (5.6%) |
| 19 to 25 Years | 367 (80.8%) | 87 (19.2%) |
| 26 to 34 Years | 568 (87.5%) | 81 (12.5%) |
| 35 to 44 Years | 505 (85.5%) | 86 (14.5%) |
| 45 to 54 Years | 707 (86.2%) | 113 (13.8%) |
| 55 to 64 Years | 737 (90.4%) | 78 (9.6%) |
| 65 to 74 Years | 818 (100.0%) | 0 (0.0%) |
| 75 Years and older | 598 (100.0%) | 0 (0.0%) |
| Total | 5,578 (91.8%) | 495 (8.2%) |
Health Insurance Coverage by Citizenship Status in Elliott County

| Citizenship Status | With Coverage | Without Coverage |
| Native Born | 434 (100.0%) | 0 (0.0%) |
| Foreign Born, Citizen | 844 (94.4%) | 50 (5.6%) |
| Foreign Born, not a Citizen | 367 (80.8%) | 87 (19.2%) |
Health Insurance Coverage by Household Income in Elliott County
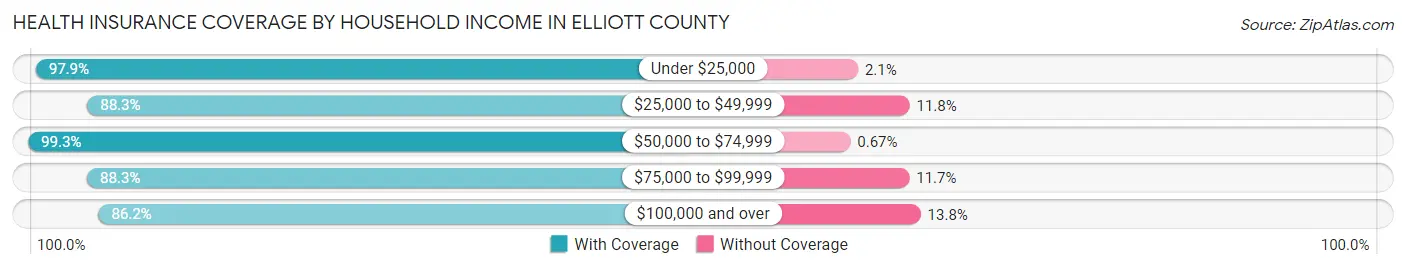
| Household Income | With Coverage | Without Coverage |
| Under $25,000 | 1,490 (97.9%) | 32 (2.1%) |
| $25,000 to $49,999 | 1,510 (88.2%) | 201 (11.7%) |
| $50,000 to $74,999 | 892 (99.3%) | 6 (0.7%) |
| $75,000 to $99,999 | 528 (88.3%) | 70 (11.7%) |
| $100,000 and over | 1,158 (86.2%) | 186 (13.8%) |
Public vs Private Health Insurance Coverage by Age in Elliott County

| Age Bracket | Public Insurance | Private Insurance |
| Under 6 | 281 (64.7%) | 153 (35.2%) |
| 6 to 18 Years | 573 (64.1%) | 338 (37.8%) |
| 19 to 25 Years | 206 (45.4%) | 161 (35.5%) |
| 25 to 34 Years | 217 (33.4%) | 361 (55.6%) |
| 35 to 44 Years | 215 (36.4%) | 290 (49.1%) |
| 45 to 54 Years | 318 (38.8%) | 418 (51.0%) |
| 55 to 64 Years | 522 (64.0%) | 297 (36.4%) |
| 65 to 74 Years | 804 (98.3%) | 294 (35.9%) |
| 75 Years and over | 598 (100.0%) | 291 (48.7%) |
| Total | 3,734 (61.5%) | 2,603 (42.9%) |
Disability Status by Sex by Age in Elliott County

| Age Bracket | Male | Female |
| Under 5 Years | 0 (0.0%) | 0 (0.0%) |
| 5 to 17 Years | 67 (14.7%) | 95 (18.4%) |
| 18 to 34 Years | 157 (25.1%) | 61 (11.6%) |
| 35 to 64 Years | 304 (28.9%) | 363 (30.9%) |
| 65 to 74 Years | 116 (29.5%) | 191 (44.9%) |
| 75 Years and over | 176 (61.8%) | 135 (43.1%) |
Disability Class by Sex by Age in Elliott County
Disability Class: Hearing Difficulty

| Age Bracket | Male | Female |
| Under 5 Years | 0 (0.0%) | 0 (0.0%) |
| 5 to 17 Years | 0 (0.0%) | 0 (0.0%) |
| 18 to 34 Years | 57 (9.1%) | 21 (4.0%) |
| 35 to 64 Years | 67 (6.4%) | 7 (0.6%) |
| 65 to 74 Years | 27 (6.9%) | 48 (11.3%) |
| 75 Years and over | 131 (46.0%) | 52 (16.6%) |
Disability Class: Vision Difficulty

| Age Bracket | Male | Female |
| Under 5 Years | 0 (0.0%) | 0 (0.0%) |
| 5 to 17 Years | 0 (0.0%) | 0 (0.0%) |
| 18 to 34 Years | 5 (0.8%) | 1 (0.2%) |
| 35 to 64 Years | 37 (3.5%) | 33 (2.8%) |
| 65 to 74 Years | 33 (8.4%) | 0 (0.0%) |
| 75 Years and over | 41 (14.4%) | 9 (2.9%) |
Disability Class: Cognitive Difficulty
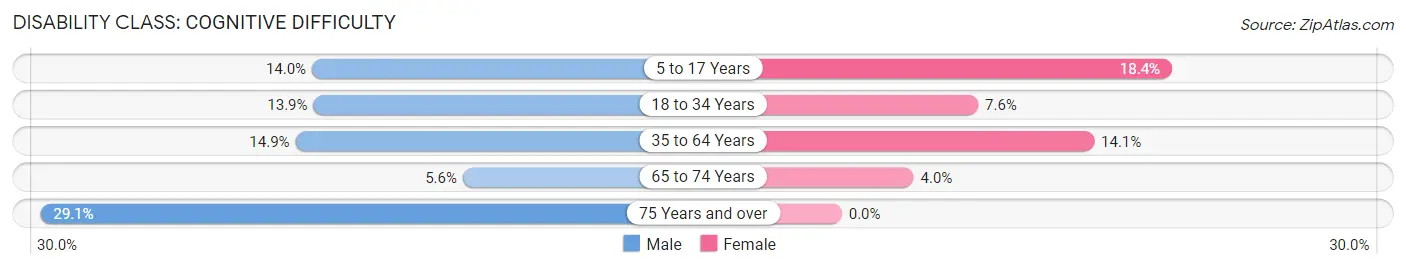
| Age Bracket | Male | Female |
| 5 to 17 Years | 64 (14.0%) | 95 (18.4%) |
| 18 to 34 Years | 87 (13.9%) | 40 (7.6%) |
| 35 to 64 Years | 157 (14.9%) | 165 (14.1%) |
| 65 to 74 Years | 22 (5.6%) | 17 (4.0%) |
| 75 Years and over | 83 (29.1%) | 0 (0.0%) |
Disability Class: Ambulatory Difficulty
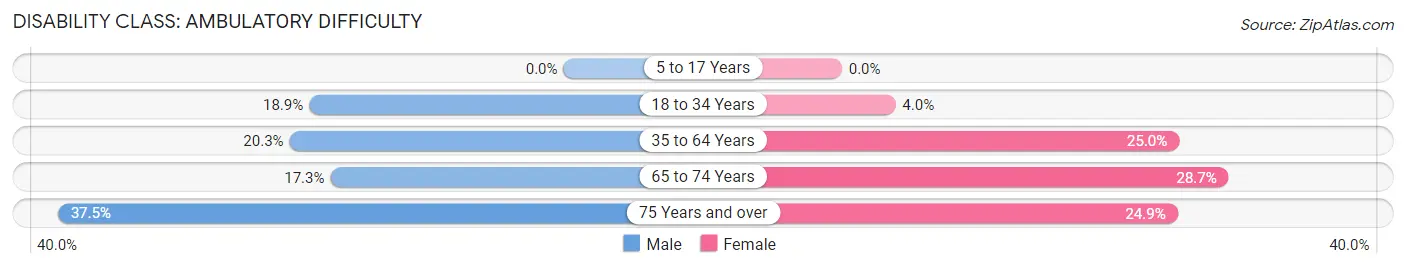
| Age Bracket | Male | Female |
| 5 to 17 Years | 0 (0.0%) | 0 (0.0%) |
| 18 to 34 Years | 118 (18.9%) | 21 (4.0%) |
| 35 to 64 Years | 214 (20.3%) | 294 (25.0%) |
| 65 to 74 Years | 68 (17.3%) | 122 (28.7%) |
| 75 Years and over | 107 (37.5%) | 78 (24.9%) |
Disability Class: Self-Care Difficulty

| Age Bracket | Male | Female |
| 5 to 17 Years | 0 (0.0%) | 0 (0.0%) |
| 18 to 34 Years | 57 (9.1%) | 20 (3.8%) |
| 35 to 64 Years | 47 (4.5%) | 45 (3.8%) |
| 65 to 74 Years | 6 (1.5%) | 16 (3.8%) |
| 75 Years and over | 8 (2.8%) | 0 (0.0%) |
Technology Access in Elliott County
Computing Device Access in Elliott County

| Device Type | # Households | % Households |
| Desktop or Laptop | 1,262 | 55.8% |
| Smartphone | 1,735 | 76.7% |
| Tablet | 1,173 | 51.8% |
| No Computing Device | 363 | 16.0% |
| Total | 2,263 | 100.0% |
Internet Access in Elliott County

| Internet Type | # Households | % Households |
| Dial-Up Internet | 0 | 0.0% |
| Broadband Home | 1,457 | 64.4% |
| Cellular Data Only | 204 | 9.0% |
| Satellite Internet | 75 | 3.3% |
| No Internet | 572 | 25.3% |
| Total | 2,263 | 100.0% |
Elliott County Summary
Elliott County is a county located in the U.S. state of Kentucky. As of the 2010 census, the population was 7,852, making it the second-least populous county in Kentucky. The county seat is Sandy Hook. The county was formed in 1869 from parts of Morgan, Lawrence, and Carter counties and is named for John Milton Elliott, a Kentucky legislator.
History
Elliott County was formed in 1869 from parts of Morgan, Lawrence, and Carter counties. It was named for John Milton Elliott, a Kentucky legislator. The county was originally part of Floyd County, which was created in 1799. In 1821, Morgan County was formed from parts of Floyd and Carter counties, and in 1822, Lawrence County was formed from parts of Floyd and Carter counties. In 1869, Elliott County was formed from parts of Morgan, Lawrence, and Carter counties.
The first settlers in the area were mostly of English and Scottish descent. The first county seat was at Willard, but it was moved to Sandy Hook in 1872. The county was largely rural and agricultural until the 1950s, when the coal industry began to expand in the area.
Geography
Elliott County is located in northeastern Kentucky, along the border with West Virginia. It is bordered by Carter County to the north, Lawrence County to the east, Morgan County to the south, and Boyd County to the west. The county has a total area of 246 square miles, of which 245 square miles is land and 1 square mile (0.4%) is water.
The county is located in the Appalachian Mountains and is mostly hilly and forested. The highest point in the county is located at the summit of Big Sandy Mountain, which has an elevation of 2,845 feet. The county is drained by the Big Sandy River, which forms the western border of the county.
Economy
Elliott County is largely rural and agricultural. The county's economy is largely based on farming, forestry, and coal mining. The county is home to several small businesses, including a sawmill, a furniture factory, and a coal mine.
The county is also home to several tourist attractions, including the Elliott County Historical Museum, the Elliott County Fairgrounds, and the Elliott County Nature Preserve.
Demographics
As of the 2010 census, there were 7,852 people, 3,093 households, and 2,097 families living in the county. The population density was 32.2 people per square mile. The racial makeup of the county was 97.3% White, 0.7% Black or African American, 0.2% Native American, 0.2% Asian, 0.1% Pacific Islander, 0.3% from other races, and 1.2% from two or more races. 1.7% of the population were Hispanic or Latino of any race.
The median income for a household in the county was $25,944, and the median income for a family was $31,944. The per capita income for the county was $14,845. About 19.2% of families and 24.2% of the population were below the poverty line, including 33.2% of those under age 18 and 19.2% of those age 65 or over.
Common Questions
What is Per Capita Income in Elliott County?
Per Capita income in Elliott County is $17,242.
What is the Median Family Income in Elliott County?
Median Family Income in Elliott County is $62,241.
What is the Median Household income in Elliott County?
Median Household Income in Elliott County is $39,469.
What is Income or Wage Gap in Elliott County?
Income or Wage Gap in Elliott County is 21.8%.
Women in Elliott County earn 78.2 cents for every dollar earned by a man.
What is Family Income Deficit in Elliott County?
Family Income Deficit in Elliott County is $10,412.
Families that are below poverty line in Elliott County earn $10,412 less on average than the poverty threshold level.
What is Inequality or Gini Index in Elliott County?
Inequality or Gini Index in Elliott County is 0.43.
What is the Total Population of Elliott County?
Total Population of Elliott County is 7,378.
What is the Total Male Population of Elliott County?
Total Male Population of Elliott County is 4,229.
What is the Total Female Population of Elliott County?
Total Female Population of Elliott County is 3,149.
What is the Ratio of Males per 100 Females in Elliott County?
There are 134.30 Males per 100 Females in Elliott County.
What is the Ratio of Females per 100 Males in Elliott County?
There are 74.46 Females per 100 Males in Elliott County.
What is the Median Population Age in Elliott County?
Median Population Age in Elliott County is 43.6 Years.
What is the Average Family Size in Elliott County
Average Family Size in Elliott County is 3.3 People.
What is the Average Household Size in Elliott County
Average Household Size in Elliott County is 2.7 People.
How Large is the Labor Force in Elliott County?
There are 2,008 People in the Labor Forcein in Elliott County.
What is the Percentage of People in the Labor Force in Elliott County?
32.6% of People are in the Labor Force in Elliott County.
What is the Unemployment Rate in Elliott County?
Unemployment Rate in Elliott County is 6.0%.