Edmonson County, KY Map & Demographics
Edmonson County Map
Edmonson County Overview
$26,781
PER CAPITA INCOME
$66,378
AVG FAMILY INCOME
$53,029
AVG HOUSEHOLD INCOME
38.1%
WAGE / INCOME GAP [ % ]
61.9¢/ $1
WAGE / INCOME GAP [ $ ]
0.42
INEQUALITY / GINI INDEX
12,179
TOTAL POPULATION
6,134
MALE POPULATION
6,045
FEMALE POPULATION
101.47
MALES / 100 FEMALES
98.55
FEMALES / 100 MALES
45.0
MEDIAN AGE
3.0
AVG FAMILY SIZE
2.5
AVG HOUSEHOLD SIZE
5,073
LABOR FORCE [ PEOPLE ]
49.8%
PERCENT IN LABOR FORCE
6.8%
UNEMPLOYMENT RATE
Edmonson County Area Codes
Income in Edmonson County
Income Overview in Edmonson County
Per Capita Income in Edmonson County is $26,781, while median incomes of families and households are $66,378 and $53,029 respectively.
| Characteristic | Number | Measure |
| Per Capita Income | 12,179 | $26,781 |
| Median Family Income | 3,268 | $66,378 |
| Mean Family Income | 3,268 | $77,747 |
| Median Household Income | 4,760 | $53,029 |
| Mean Household Income | 4,760 | $65,087 |
| Income Deficit | 3,268 | $0 |
| Wage / Income Gap (%) | 12,179 | 38.12% |
| Wage / Income Gap ($) | 12,179 | 61.88¢ per $1 |
| Gini / Inequality Index | 12,179 | 0.42 |
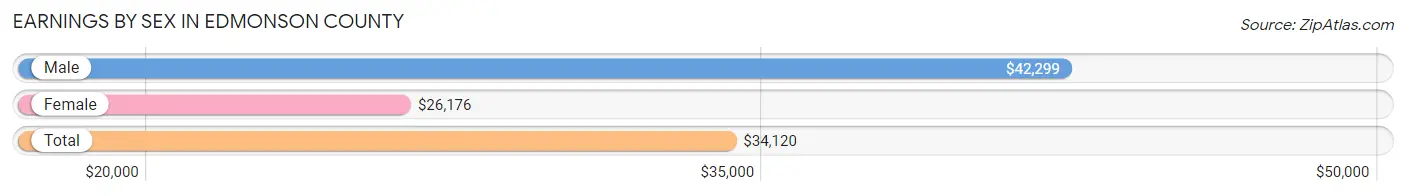
Earnings by Sex in Edmonson County
Average Earnings in Edmonson County are $34,120, $42,299 for men and $26,176 for women, a difference of 38.1%.
| Sex | Number | Average Earnings |
| Male | 2,922 (53.1%) | $42,299 |
| Female | 2,579 (46.9%) | $26,176 |
| Total | 5,501 (100.0%) | $34,120 |
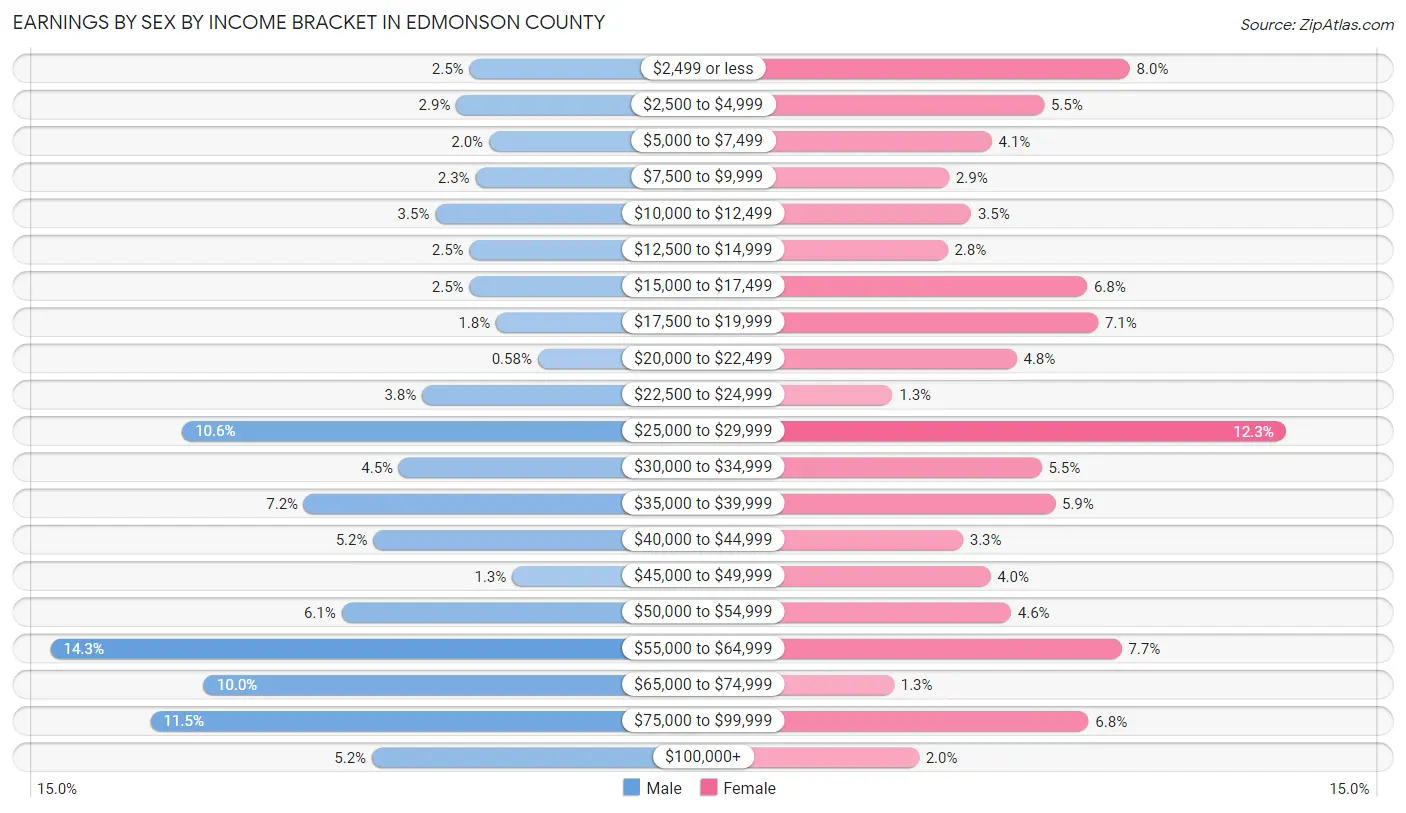
Earnings by Sex by Income Bracket in Edmonson County
The most common earnings brackets in Edmonson County are $55,000 to $64,999 for men (417 | 14.3%) and $25,000 to $29,999 for women (318 | 12.3%).
| Income | Male | Female |
| $2,499 or less | 73 (2.5%) | 205 (8.0%) |
| $2,500 to $4,999 | 84 (2.9%) | 143 (5.5%) |
| $5,000 to $7,499 | 57 (1.9%) | 105 (4.1%) |
| $7,500 to $9,999 | 68 (2.3%) | 74 (2.9%) |
| $10,000 to $12,499 | 101 (3.5%) | 90 (3.5%) |
| $12,500 to $14,999 | 73 (2.5%) | 73 (2.8%) |
| $15,000 to $17,499 | 73 (2.5%) | 174 (6.8%) |
| $17,500 to $19,999 | 51 (1.8%) | 182 (7.1%) |
| $20,000 to $22,499 | 17 (0.6%) | 123 (4.8%) |
| $22,500 to $24,999 | 112 (3.8%) | 33 (1.3%) |
| $25,000 to $29,999 | 309 (10.6%) | 318 (12.3%) |
| $30,000 to $34,999 | 131 (4.5%) | 141 (5.5%) |
| $35,000 to $39,999 | 209 (7.1%) | 151 (5.9%) |
| $40,000 to $44,999 | 152 (5.2%) | 84 (3.3%) |
| $45,000 to $49,999 | 38 (1.3%) | 104 (4.0%) |
| $50,000 to $54,999 | 178 (6.1%) | 119 (4.6%) |
| $55,000 to $64,999 | 417 (14.3%) | 199 (7.7%) |
| $65,000 to $74,999 | 291 (10.0%) | 34 (1.3%) |
| $75,000 to $99,999 | 335 (11.5%) | 175 (6.8%) |
| $100,000+ | 153 (5.2%) | 52 (2.0%) |
| Total | 2,922 (100.0%) | 2,579 (100.0%) |
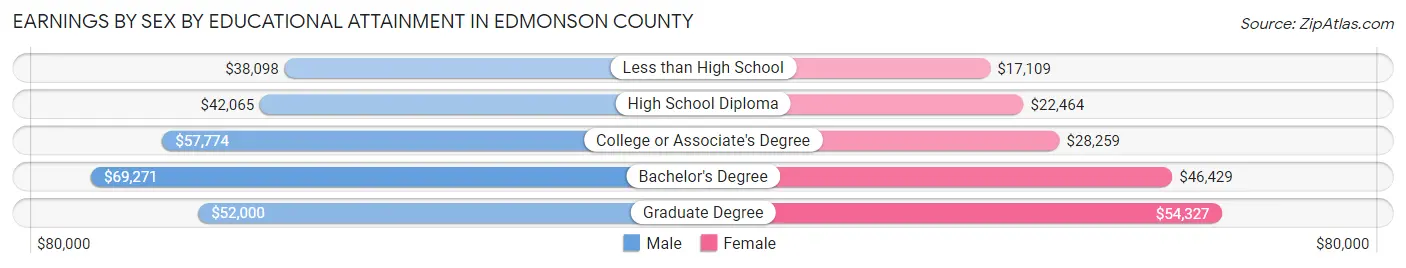
Earnings by Sex by Educational Attainment in Edmonson County
Average earnings in Edmonson County are $51,332 for men and $26,907 for women, a difference of 47.6%. Men with an educational attainment of bachelor's degree enjoy the highest average annual earnings of $69,271, while those with less than high school education earn the least with $38,098. Women with an educational attainment of graduate degree earn the most with the average annual earnings of $54,327, while those with less than high school education have the smallest earnings of $17,109.
| Educational Attainment | Male Income | Female Income |
| Less than High School | $38,098 | $17,109 |
| High School Diploma | $42,065 | $22,464 |
| College or Associate's Degree | $57,774 | $28,259 |
| Bachelor's Degree | $69,271 | $46,429 |
| Graduate Degree | $52,000 | $54,327 |
| Total | $51,332 | $26,907 |
Family Income in Edmonson County
Family Income Brackets in Edmonson County
According to the Edmonson County family income data, there are 660 families falling into the $100,000 to $149,999 income range, which is the most common income bracket and makes up 20.2% of all families. Conversely, the less than $10,000 income bracket is the least frequent group with only 39 families (1.2%) belonging to this category.
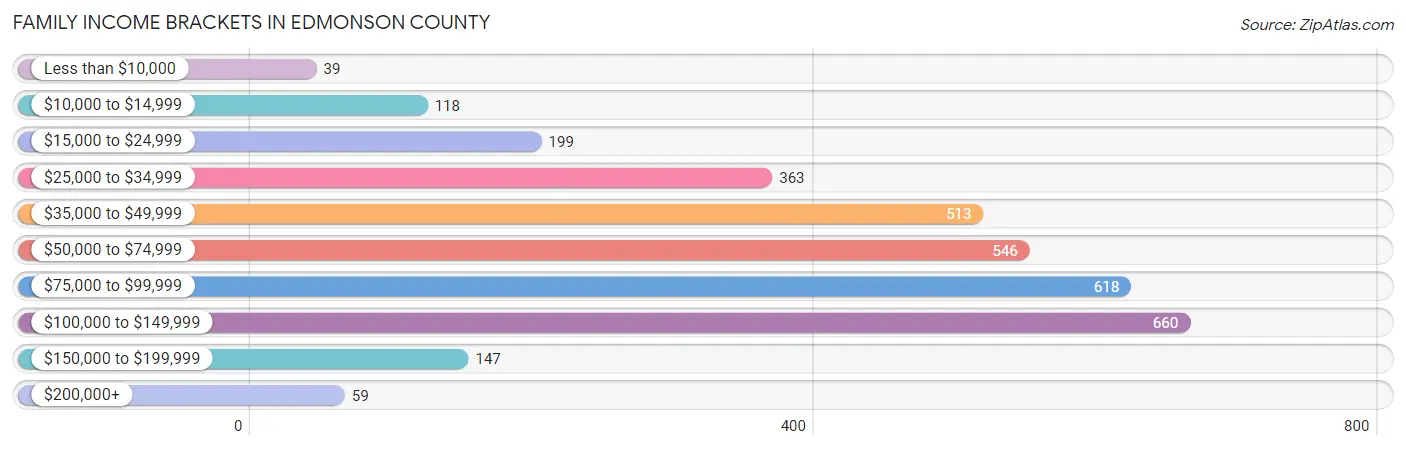
| Income Bracket | # Families | % Families |
| Less than $10,000 | 39 | 1.2% |
| $10,000 to $14,999 | 118 | 3.6% |
| $15,000 to $24,999 | 199 | 6.1% |
| $25,000 to $34,999 | 363 | 11.1% |
| $35,000 to $49,999 | 513 | 15.7% |
| $50,000 to $74,999 | 546 | 16.7% |
| $75,000 to $99,999 | 618 | 18.9% |
| $100,000 to $149,999 | 660 | 20.2% |
| $150,000 to $199,999 | 147 | 4.5% |
| $200,000+ | 59 | 1.8% |
Family Income by Famaliy Size in Edmonson County
4-person families (581 | 17.8%) account for the highest median family income in Edmonson County with $82,482 per family, while 2-person families (1,802 | 55.1%) have the highest median income of $26,939 per family member.
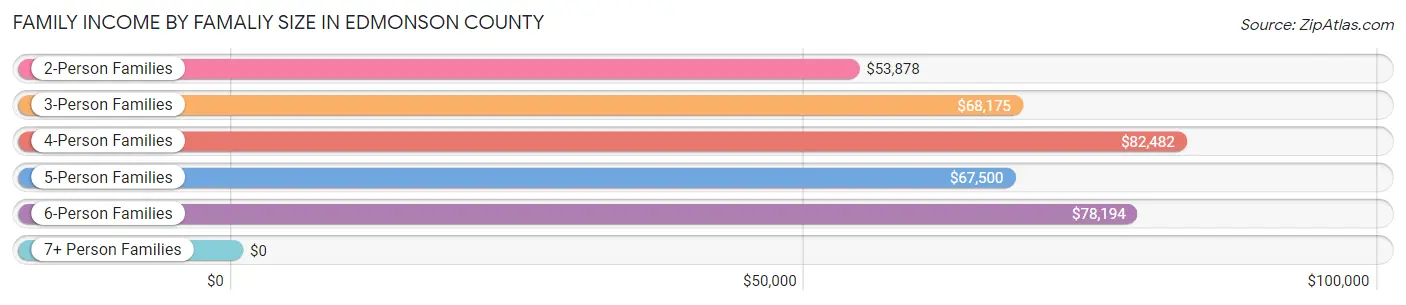
| Income Bracket | # Families | Median Income |
| 2-Person Families | 1,802 (55.1%) | $53,878 |
| 3-Person Families | 635 (19.4%) | $68,175 |
| 4-Person Families | 581 (17.8%) | $82,482 |
| 5-Person Families | 126 (3.9%) | $67,500 |
| 6-Person Families | 81 (2.5%) | $78,194 |
| 7+ Person Families | 43 (1.3%) | $0 |
| Total | 3,268 (100.0%) | $66,378 |
Family Income by Number of Earners in Edmonson County
The median family income in Edmonson County is $66,378, with families comprising 3+ earners (164) having the highest median family income of $132,750, while families with no earners (745) have the lowest median family income of $35,489, accounting for 5.0% and 22.8% of families, respectively.
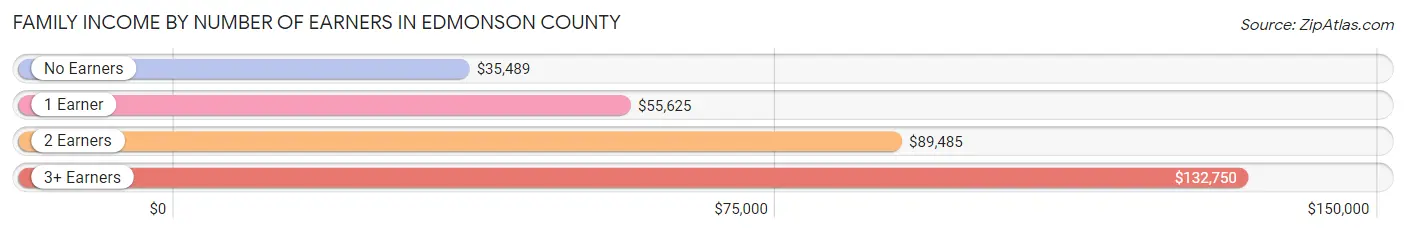
| Number of Earners | # Families | Median Income |
| No Earners | 745 (22.8%) | $35,489 |
| 1 Earner | 1,109 (33.9%) | $55,625 |
| 2 Earners | 1,250 (38.3%) | $89,485 |
| 3+ Earners | 164 (5.0%) | $132,750 |
| Total | 3,268 (100.0%) | $66,378 |
Household Income in Edmonson County
Household Income Brackets in Edmonson County
With 814 households falling in the category, the $50,000 to $74,999 income range is the most frequent in Edmonson County, accounting for 17.1% of all households. In contrast, only 62 households (1.3%) fall into the $200,000+ income bracket, making it the least populous group.
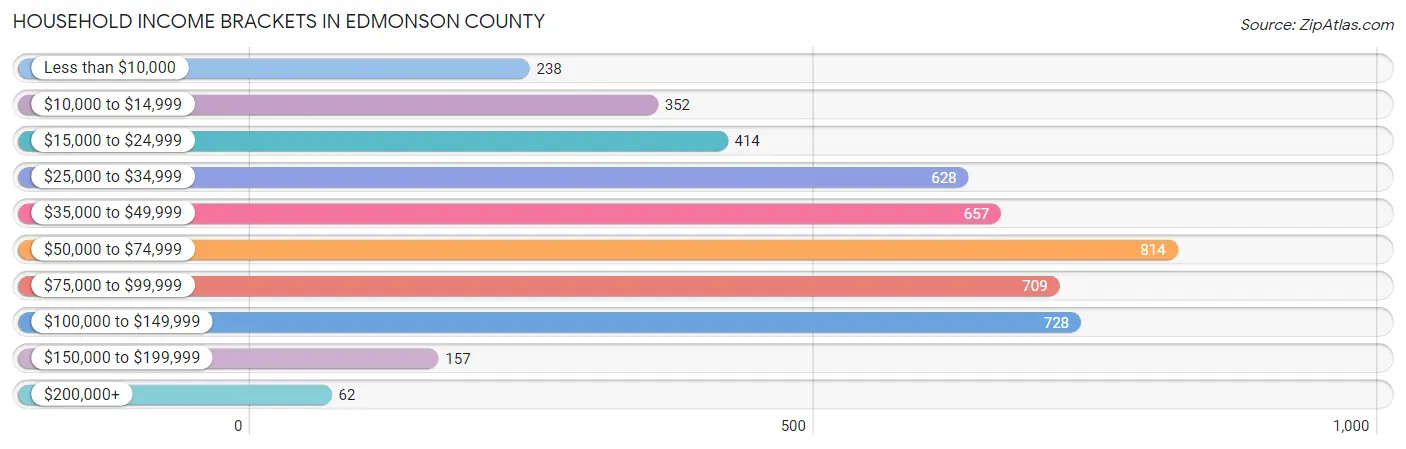
| Income Bracket | # Households | % Households |
| Less than $10,000 | 238 | 5.0% |
| $10,000 to $14,999 | 352 | 7.4% |
| $15,000 to $24,999 | 414 | 8.7% |
| $25,000 to $34,999 | 628 | 13.2% |
| $35,000 to $49,999 | 657 | 13.8% |
| $50,000 to $74,999 | 814 | 17.1% |
| $75,000 to $99,999 | 709 | 14.9% |
| $100,000 to $149,999 | 728 | 15.3% |
| $150,000 to $199,999 | 157 | 3.3% |
| $200,000+ | 62 | 1.3% |
Household Income by Householder Age in Edmonson County
The median household income in Edmonson County is $53,029, with the highest median household income of $68,019 found in the 25 to 44 years age bracket for the primary householder. A total of 1,267 households (26.6%) fall into this category. Meanwhile, the 65+ years age bracket for the primary householder has the lowest median household income of $36,159, with 1,443 households (30.3%) in this group.
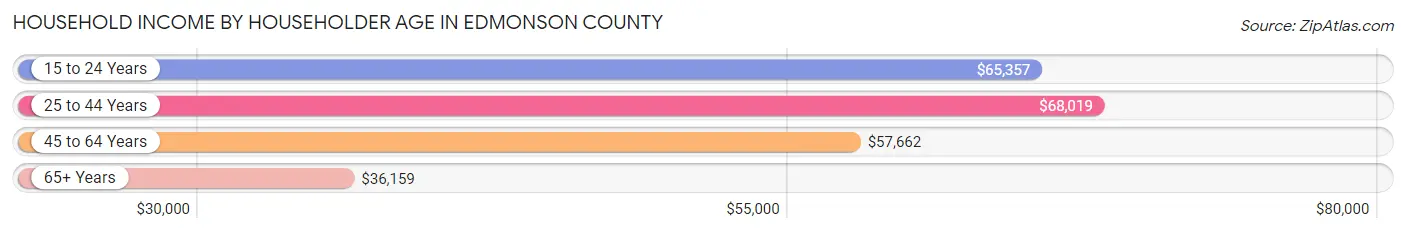
| Income Bracket | # Households | Median Income |
| 15 to 24 Years | 190 (4.0%) | $65,357 |
| 25 to 44 Years | 1,267 (26.6%) | $68,019 |
| 45 to 64 Years | 1,860 (39.1%) | $57,662 |
| 65+ Years | 1,443 (30.3%) | $36,159 |
| Total | 4,760 (100.0%) | $53,029 |
Poverty in Edmonson County
Income Below Poverty by Sex and Age in Edmonson County
With 13.2% poverty level for males and 20.8% for females among the residents of Edmonson County, 18 to 24 year old males and 15 year old females are the most vulnerable to poverty, with 183 males (35.5%) and 10 females (40.0%) in their respective age groups living below the poverty level.
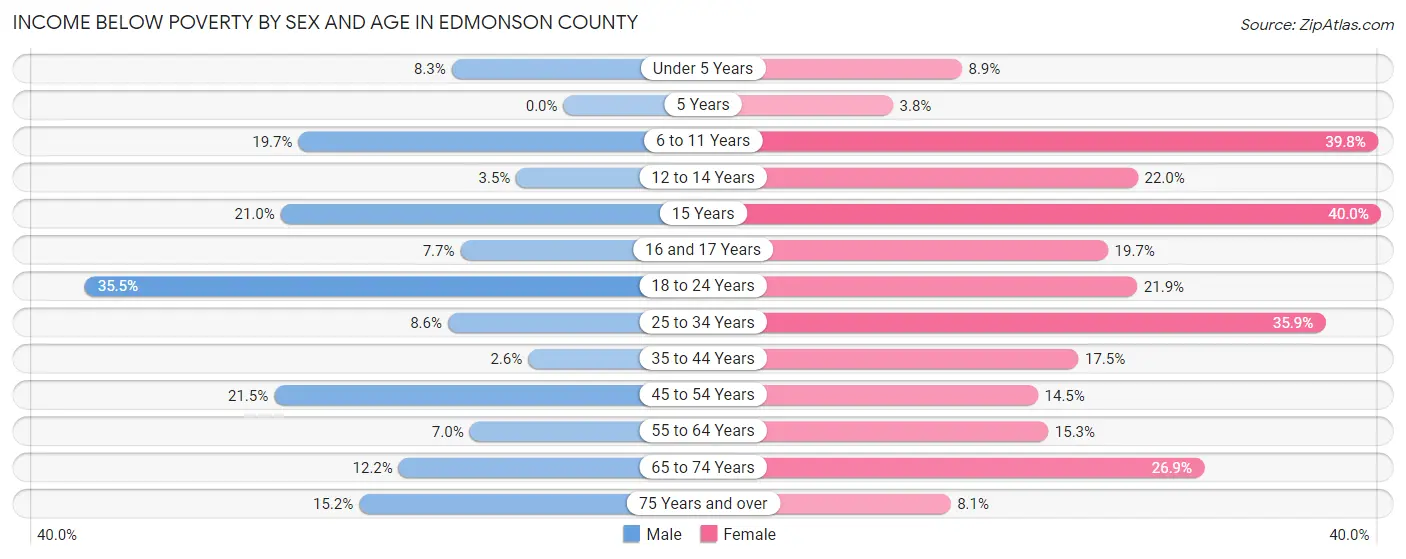
| Age Bracket | Male | Female |
| Under 5 Years | 20 (8.3%) | 24 (8.9%) |
| 5 Years | 0 (0.0%) | 2 (3.8%) |
| 6 to 11 Years | 74 (19.7%) | 142 (39.8%) |
| 12 to 14 Years | 7 (3.5%) | 56 (22.0%) |
| 15 Years | 21 (21.0%) | 10 (40.0%) |
| 16 and 17 Years | 15 (7.6%) | 15 (19.7%) |
| 18 to 24 Years | 183 (35.5%) | 85 (21.9%) |
| 25 to 34 Years | 61 (8.6%) | 258 (35.9%) |
| 35 to 44 Years | 20 (2.6%) | 127 (17.5%) |
| 45 to 54 Years | 171 (21.5%) | 123 (14.5%) |
| 55 to 64 Years | 65 (7.0%) | 140 (15.3%) |
| 65 to 74 Years | 89 (12.2%) | 214 (26.9%) |
| 75 Years and over | 71 (15.2%) | 42 (8.1%) |
| Total | 797 (13.2%) | 1,238 (20.8%) |
Income Above Poverty by Sex and Age in Edmonson County
According to the poverty statistics in Edmonson County, males aged 5 years and females aged 5 years are the age groups that are most secure financially, with 100.0% of males and 96.2% of females in these age groups living above the poverty line.
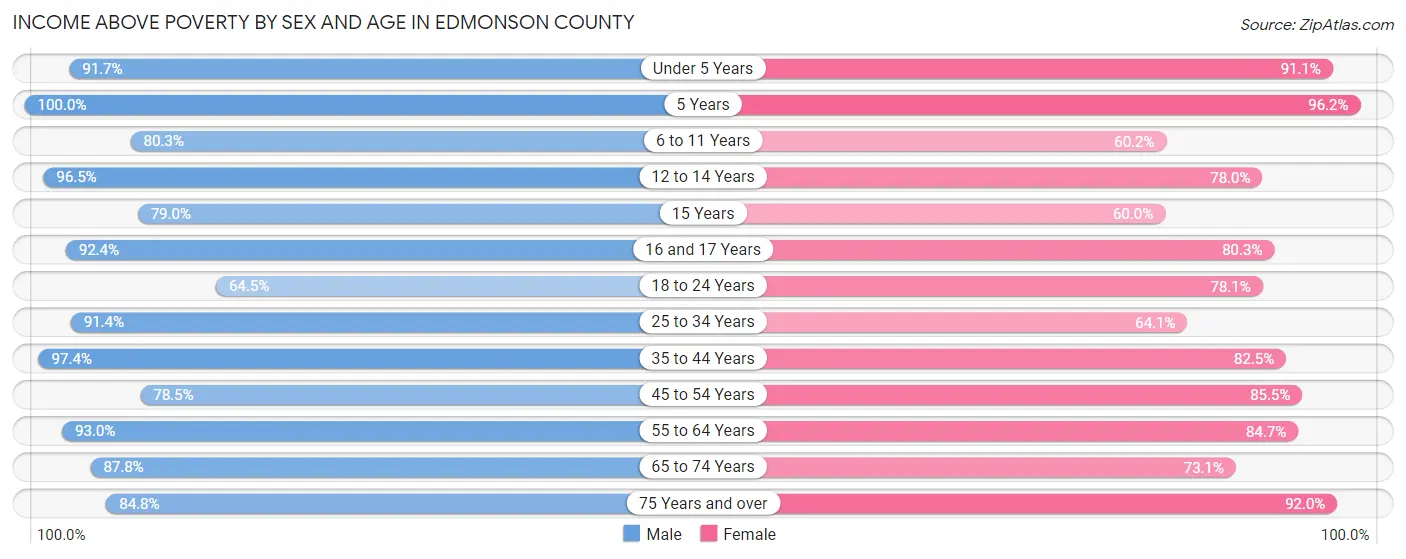
| Age Bracket | Male | Female |
| Under 5 Years | 221 (91.7%) | 246 (91.1%) |
| 5 Years | 27 (100.0%) | 51 (96.2%) |
| 6 to 11 Years | 302 (80.3%) | 215 (60.2%) |
| 12 to 14 Years | 193 (96.5%) | 199 (78.0%) |
| 15 Years | 79 (79.0%) | 15 (60.0%) |
| 16 and 17 Years | 181 (92.3%) | 61 (80.3%) |
| 18 to 24 Years | 332 (64.5%) | 303 (78.1%) |
| 25 to 34 Years | 650 (91.4%) | 461 (64.1%) |
| 35 to 44 Years | 742 (97.4%) | 597 (82.5%) |
| 45 to 54 Years | 625 (78.5%) | 723 (85.5%) |
| 55 to 64 Years | 868 (93.0%) | 775 (84.7%) |
| 65 to 74 Years | 639 (87.8%) | 582 (73.1%) |
| 75 Years and over | 397 (84.8%) | 480 (91.9%) |
| Total | 5,256 (86.8%) | 4,708 (79.2%) |
Income Below Poverty Among Married-Couple Families in Edmonson County
The poverty statistics for married-couple families in Edmonson County show that 5.4% or 140 of the total 2,610 families live below the poverty line. Families with 3 or 4 children have the highest poverty rate of 7.8%, comprising of 13 families. On the other hand, families with 5 or more children have the lowest poverty rate of 0.0%, which includes 0 families.
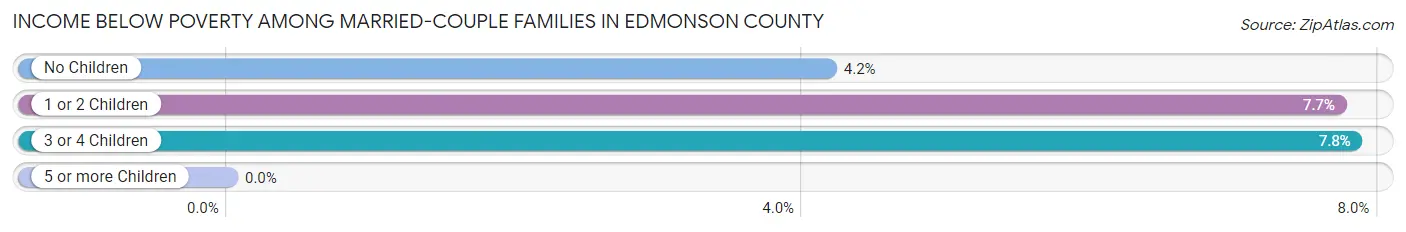
| Children | Above Poverty | Below Poverty |
| No Children | 1,584 (95.8%) | 69 (4.2%) |
| 1 or 2 Children | 693 (92.3%) | 58 (7.7%) |
| 3 or 4 Children | 153 (92.2%) | 13 (7.8%) |
| 5 or more Children | 40 (100.0%) | 0 (0.0%) |
| Total | 2,470 (94.6%) | 140 (5.4%) |
Income Below Poverty Among Single-Parent Households in Edmonson County
According to the poverty data in Edmonson County, 2.0% or 4 single-father households and 40.0% or 182 single-mother households are living below the poverty line. Among single-father households, those with 3 or 4 children have the highest poverty rate, with 4 households (100.0%) experiencing poverty. Likewise, among single-mother households, those with 1 or 2 children have the highest poverty rate, with 94 households (61.0%) falling below the poverty line.
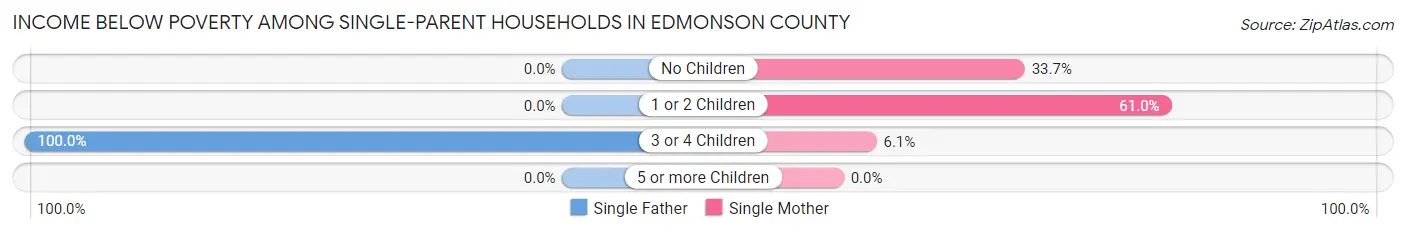
| Children | Single Father | Single Mother |
| No Children | 0 (0.0%) | 85 (33.7%) |
| 1 or 2 Children | 0 (0.0%) | 94 (61.0%) |
| 3 or 4 Children | 4 (100.0%) | 3 (6.1%) |
| 5 or more Children | 0 (0.0%) | 0 (0.0%) |
| Total | 4 (2.0%) | 182 (40.0%) |
Income Below Poverty Among Married-Couple vs Single-Parent Households in Edmonson County
The poverty data for Edmonson County shows that 140 of the married-couple family households (5.4%) and 186 of the single-parent households (28.3%) are living below the poverty level. Within the married-couple family households, those with 3 or 4 children have the highest poverty rate, with 13 households (7.8%) falling below the poverty line. Among the single-parent households, those with 1 or 2 children have the highest poverty rate, with 94 household (33.8%) living below poverty.
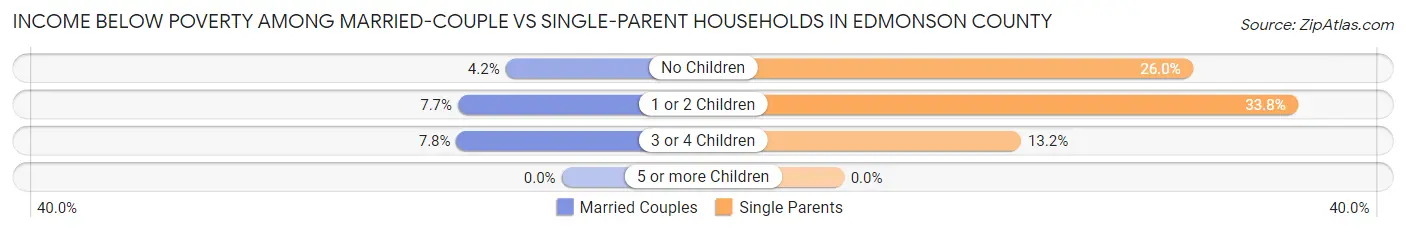
| Children | Married-Couple Families | Single-Parent Households |
| No Children | 69 (4.2%) | 85 (26.0%) |
| 1 or 2 Children | 58 (7.7%) | 94 (33.8%) |
| 3 or 4 Children | 13 (7.8%) | 7 (13.2%) |
| 5 or more Children | 0 (0.0%) | 0 (0.0%) |
| Total | 140 (5.4%) | 186 (28.3%) |
Race in Edmonson County
The most populous races in Edmonson County are White / Caucasian (11,621 | 95.4%), Two or more Races (355 | 2.9%), and Hispanic or Latino (191 | 1.6%).
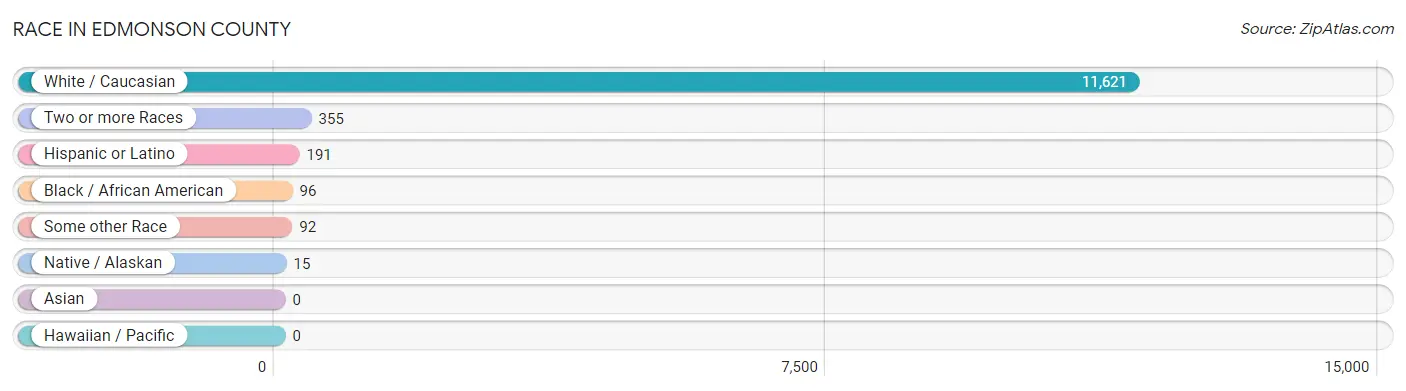
| Race | # Population | % Population |
| Asian | 0 | 0.0% |
| Black / African American | 96 | 0.8% |
| Hawaiian / Pacific | 0 | 0.0% |
| Hispanic or Latino | 191 | 1.6% |
| Native / Alaskan | 15 | 0.1% |
| White / Caucasian | 11,621 | 95.4% |
| Two or more Races | 355 | 2.9% |
| Some other Race | 92 | 0.8% |
| Total | 12,179 | 100.0% |
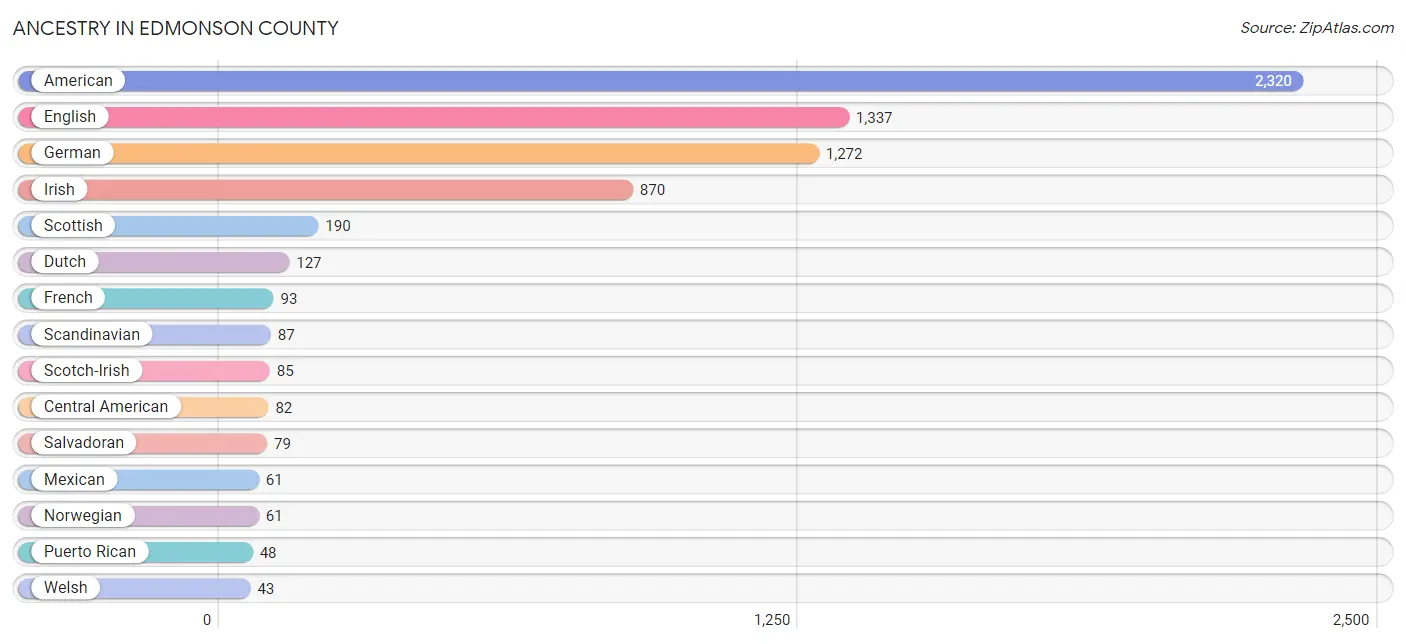
Ancestry in Edmonson County
The most populous ancestries reported in Edmonson County are American (2,320 | 19.1%), English (1,337 | 11.0%), German (1,272 | 10.4%), Irish (870 | 7.1%), and Scottish (190 | 1.6%), together accounting for 49.2% of all Edmonson County residents.
| Ancestry | # Population | % Population |
| African | 9 | 0.1% |
| American | 2,320 | 19.1% |
| Austrian | 32 | 0.3% |
| Burmese | 1 | 0.0% |
| Central American | 82 | 0.7% |
| Cherokee | 40 | 0.3% |
| Croatian | 20 | 0.2% |
| Dutch | 127 | 1.0% |
| English | 1,337 | 11.0% |
| European | 31 | 0.3% |
| French | 93 | 0.8% |
| French Canadian | 11 | 0.1% |
| German | 1,272 | 10.4% |
| Greek | 13 | 0.1% |
| Guatemalan | 3 | 0.0% |
| Irish | 870 | 7.1% |
| Italian | 42 | 0.3% |
| Jamaican | 11 | 0.1% |
| Mexican | 61 | 0.5% |
| Norwegian | 61 | 0.5% |
| Polish | 33 | 0.3% |
| Portuguese | 29 | 0.2% |
| Puerto Rican | 48 | 0.4% |
| Russian | 17 | 0.1% |
| Salvadoran | 79 | 0.6% |
| Scandinavian | 87 | 0.7% |
| Scotch-Irish | 85 | 0.7% |
| Scottish | 190 | 1.6% |
| Seminole | 3 | 0.0% |
| Shoshone | 3 | 0.0% |
| Subsaharan African | 9 | 0.1% |
| Swedish | 42 | 0.3% |
| Welsh | 43 | 0.4% | View All 33 Rows |
Immigrants in Edmonson County
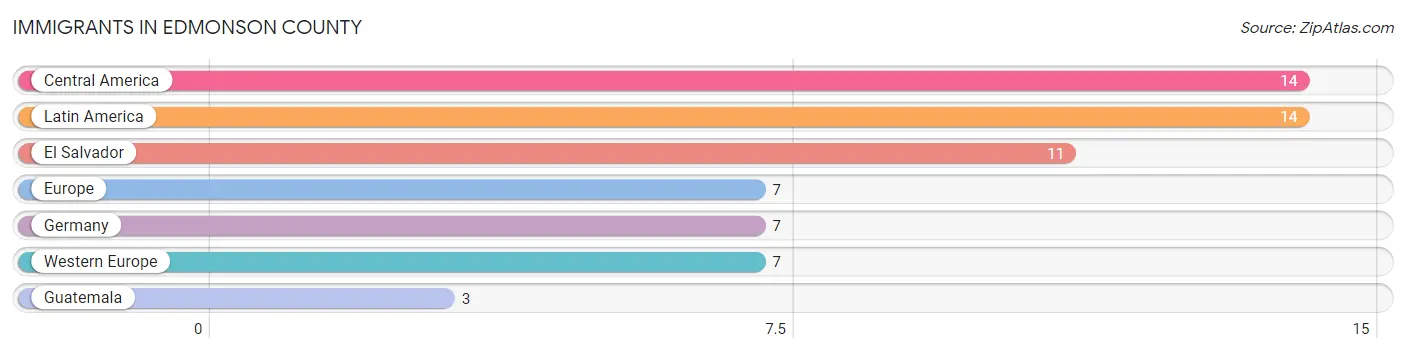
The most numerous immigrant groups reported in Edmonson County came from Central America (14 | 0.1%), Latin America (14 | 0.1%), El Salvador (11 | 0.1%), Europe (7 | 0.1%), and Germany (7 | 0.1%), together accounting for 0.4% of all Edmonson County residents.
| Immigration Origin | # Population | % Population |
| Central America | 14 | 0.1% |
| El Salvador | 11 | 0.1% |
| Europe | 7 | 0.1% |
| Germany | 7 | 0.1% |
| Guatemala | 3 | 0.0% |
| Latin America | 14 | 0.1% |
| Western Europe | 7 | 0.1% | View All 7 Rows |
Sex and Age in Edmonson County
Sex and Age in Edmonson County
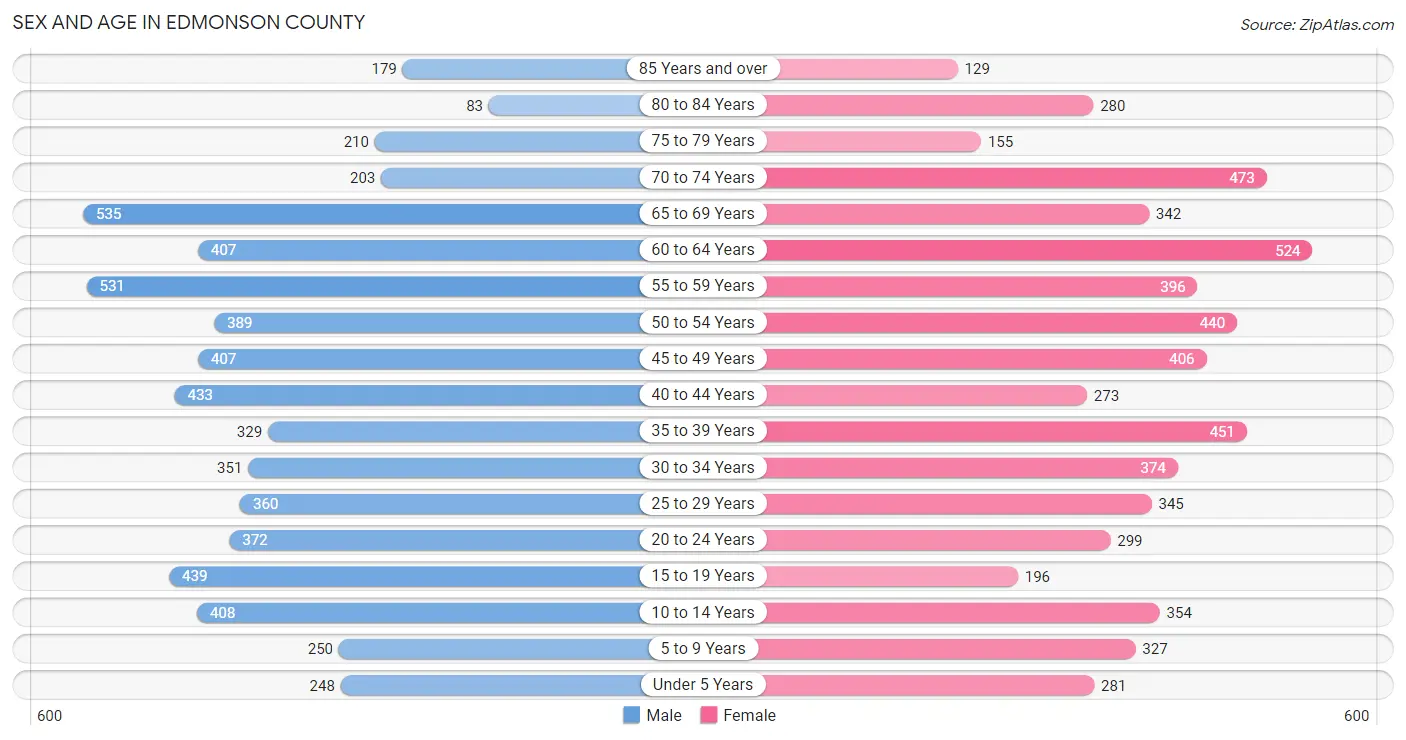
The most populous age groups in Edmonson County are 65 to 69 Years (535 | 8.7%) for men and 60 to 64 Years (524 | 8.7%) for women.
| Age Bracket | Male | Female |
| Under 5 Years | 248 (4.0%) | 281 (4.6%) |
| 5 to 9 Years | 250 (4.1%) | 327 (5.4%) |
| 10 to 14 Years | 408 (6.7%) | 354 (5.9%) |
| 15 to 19 Years | 439 (7.2%) | 196 (3.2%) |
| 20 to 24 Years | 372 (6.1%) | 299 (5.0%) |
| 25 to 29 Years | 360 (5.9%) | 345 (5.7%) |
| 30 to 34 Years | 351 (5.7%) | 374 (6.2%) |
| 35 to 39 Years | 329 (5.4%) | 451 (7.5%) |
| 40 to 44 Years | 433 (7.1%) | 273 (4.5%) |
| 45 to 49 Years | 407 (6.6%) | 406 (6.7%) |
| 50 to 54 Years | 389 (6.3%) | 440 (7.3%) |
| 55 to 59 Years | 531 (8.7%) | 396 (6.6%) |
| 60 to 64 Years | 407 (6.6%) | 524 (8.7%) |
| 65 to 69 Years | 535 (8.7%) | 342 (5.7%) |
| 70 to 74 Years | 203 (3.3%) | 473 (7.8%) |
| 75 to 79 Years | 210 (3.4%) | 155 (2.6%) |
| 80 to 84 Years | 83 (1.3%) | 280 (4.6%) |
| 85 Years and over | 179 (2.9%) | 129 (2.1%) |
| Total | 6,134 (100.0%) | 6,045 (100.0%) |
Families and Households in Edmonson County
Median Family Size in Edmonson County
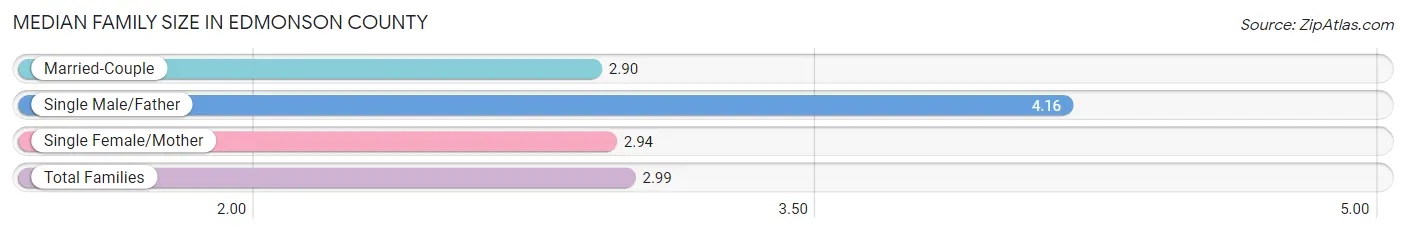
The median family size in Edmonson County is 2.99 persons per family, with single male/father families (203 | 6.2%) accounting for the largest median family size of 4.16 persons per family. On the other hand, married-couple families (2,610 | 79.9%) represent the smallest median family size with 2.90 persons per family.
| Family Type | # Families | Family Size |
| Married-Couple | 2,610 (79.9%) | 2.90 |
| Single Male/Father | 203 (6.2%) | 4.16 |
| Single Female/Mother | 455 (13.9%) | 2.94 |
| Total Families | 3,268 (100.0%) | 2.99 |
Median Household Size in Edmonson County
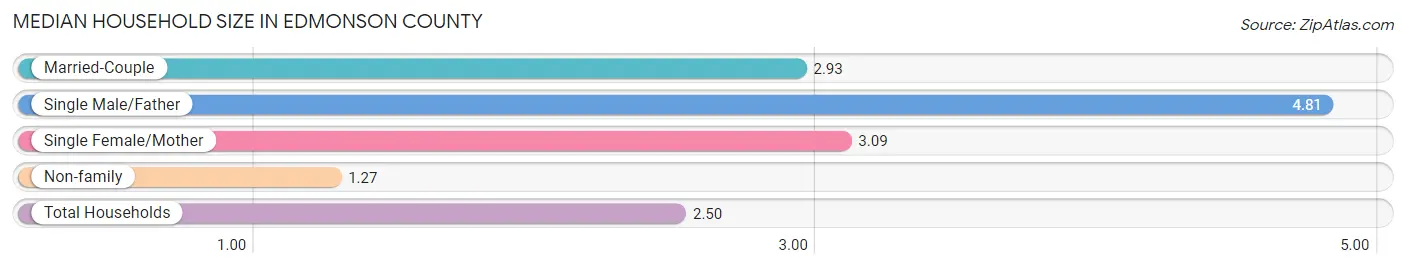
The median household size in Edmonson County is 2.50 persons per household, with single male/father households (203 | 4.3%) accounting for the largest median household size of 4.81 persons per household. non-family households (1,492 | 31.3%) represent the smallest median household size with 1.27 persons per household.
| Household Type | # Households | Household Size |
| Married-Couple | 2,610 (54.8%) | 2.93 |
| Single Male/Father | 203 (4.3%) | 4.81 |
| Single Female/Mother | 455 (9.6%) | 3.09 |
| Non-family | 1,492 (31.3%) | 1.27 |
| Total Households | 4,760 (100.0%) | 2.50 |
Household Size by Marriage Status in Edmonson County
Out of a total of 4,760 households in Edmonson County, 3,268 (68.7%) are family households, while 1,492 (31.3%) are nonfamily households. The most numerous type of family households are 2-person households, comprising 1,636, and the most common type of nonfamily households are 1-person households, comprising 1,190.
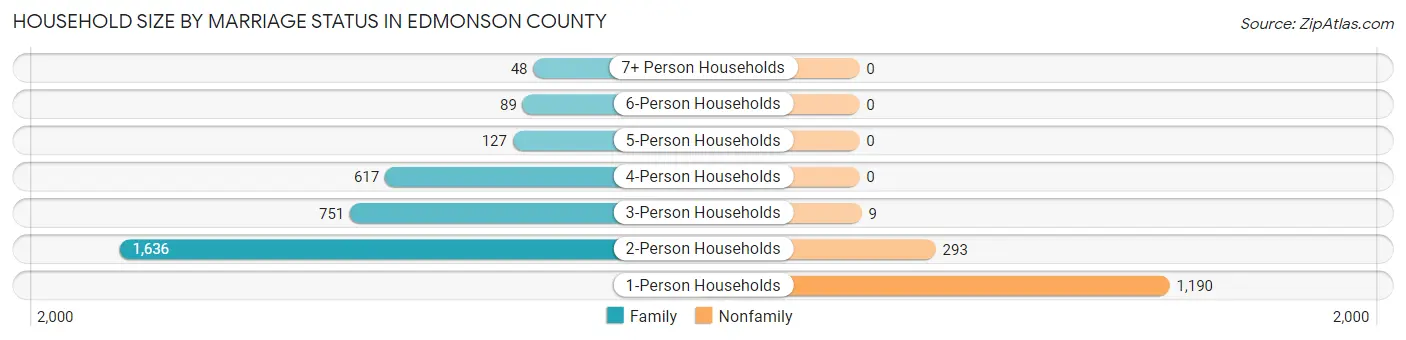
| Household Size | Family Households | Nonfamily Households |
| 1-Person Households | - | 1,190 (25.0%) |
| 2-Person Households | 1,636 (34.4%) | 293 (6.2%) |
| 3-Person Households | 751 (15.8%) | 9 (0.2%) |
| 4-Person Households | 617 (13.0%) | 0 (0.0%) |
| 5-Person Households | 127 (2.7%) | 0 (0.0%) |
| 6-Person Households | 89 (1.9%) | 0 (0.0%) |
| 7+ Person Households | 48 (1.0%) | 0 (0.0%) |
| Total | 3,268 (68.7%) | 1,492 (31.3%) |
Female Fertility in Edmonson County
Fertility by Age in Edmonson County
Average fertility rate in Edmonson County is 49.0 births per 1,000 women. Women in the age bracket of 20 to 34 years have the highest fertility rate with 73.0 births per 1,000 women. Women in the age bracket of 20 to 34 years acount for 62.2% of all women with births.
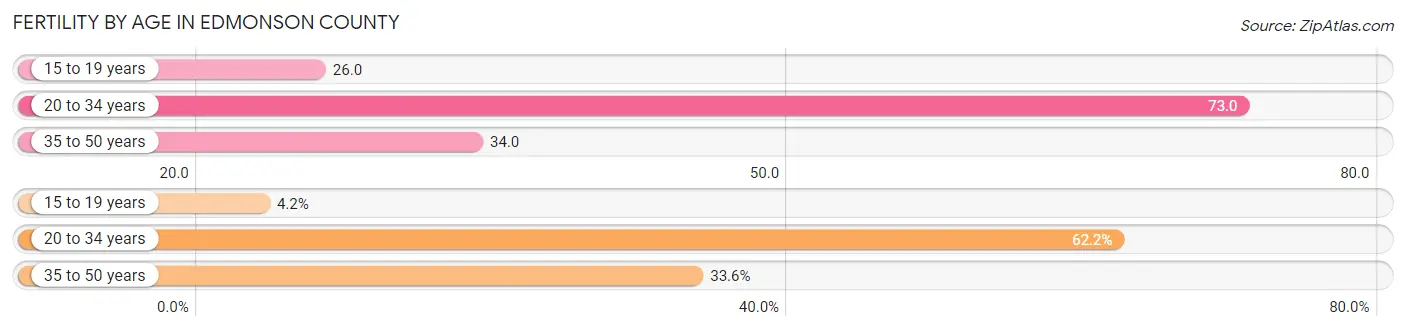
| Age Bracket | Women with Births | Births / 1,000 Women |
| 15 to 19 years | 5 (4.2%) | 26.0 |
| 20 to 34 years | 74 (62.2%) | 73.0 |
| 35 to 50 years | 40 (33.6%) | 34.0 |
| Total | 119 (100.0%) | 49.0 |
Fertility by Age by Marriage Status in Edmonson County
77.3% of women with births (119) in Edmonson County are married. The highest percentage of unmarried women with births falls into 15 to 19 years age bracket with 80.0% of them unmarried at the time of birth, while the lowest percentage of unmarried women with births belong to 35 to 50 years age bracket with 0.0% of them unmarried.
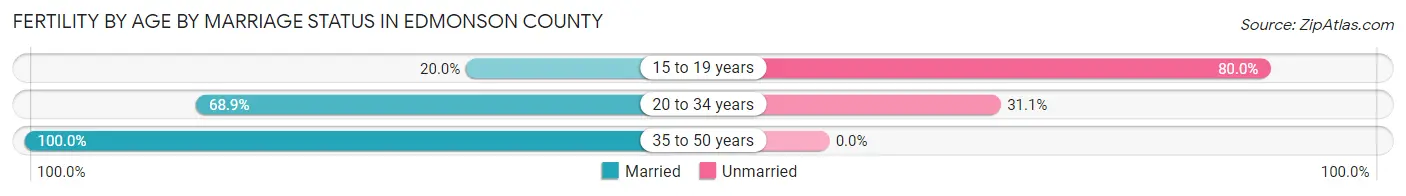
| Age Bracket | Married | Unmarried |
| 15 to 19 years | 1 (20.0%) | 4 (80.0%) |
| 20 to 34 years | 51 (68.9%) | 23 (31.1%) |
| 35 to 50 years | 40 (100.0%) | 0 (0.0%) |
| Total | 92 (77.3%) | 27 (22.7%) |
Fertility by Education in Edmonson County
Average fertility rate in Edmonson County is 49.0 births per 1,000 women. Women with the education attainment of less than high school have the highest fertility rate of 150.0 births per 1,000 women, while women with the education attainment of college or associate's degree have the lowest fertility at 23.0 births per 1,000 women. Women with the education attainment of less than high school represent 33.6% of all women with births.
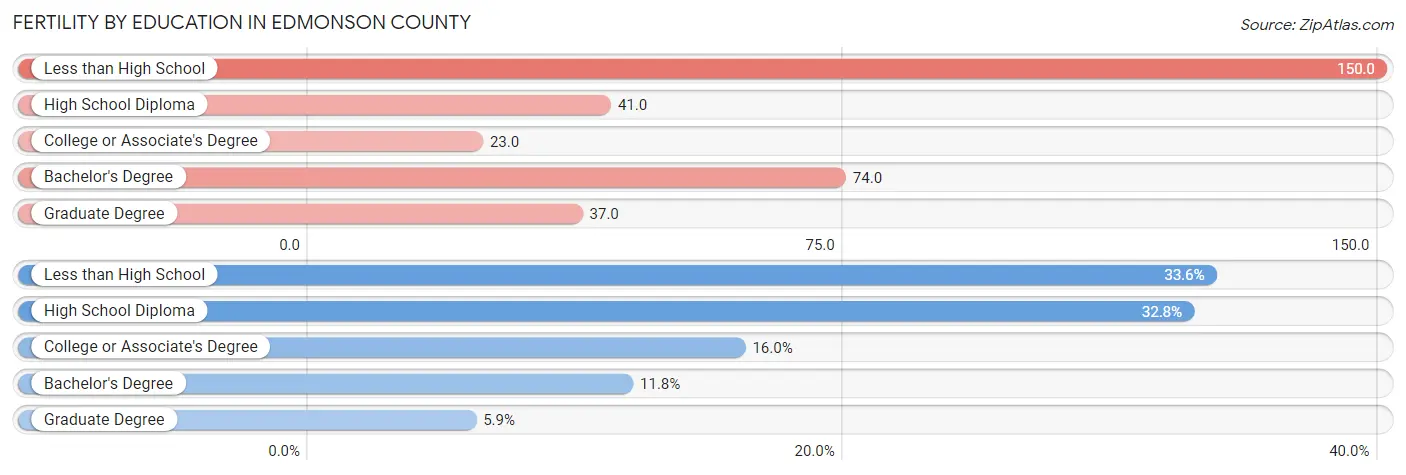
| Educational Attainment | Women with Births | Births / 1,000 Women |
| Less than High School | 40 (33.6%) | 150.0 |
| High School Diploma | 39 (32.8%) | 41.0 |
| College or Associate's Degree | 19 (16.0%) | 23.0 |
| Bachelor's Degree | 14 (11.8%) | 74.0 |
| Graduate Degree | 7 (5.9%) | 37.0 |
| Total | 119 (100.0%) | 49.0 |
Fertility by Education by Marriage Status in Edmonson County
22.7% of women with births in Edmonson County are unmarried. Women with the educational attainment of less than high school are most likely to be married with 100.0% of them married at childbirth, while women with the educational attainment of high school diploma are least likely to be married with 69.2% of them unmarried at childbirth.
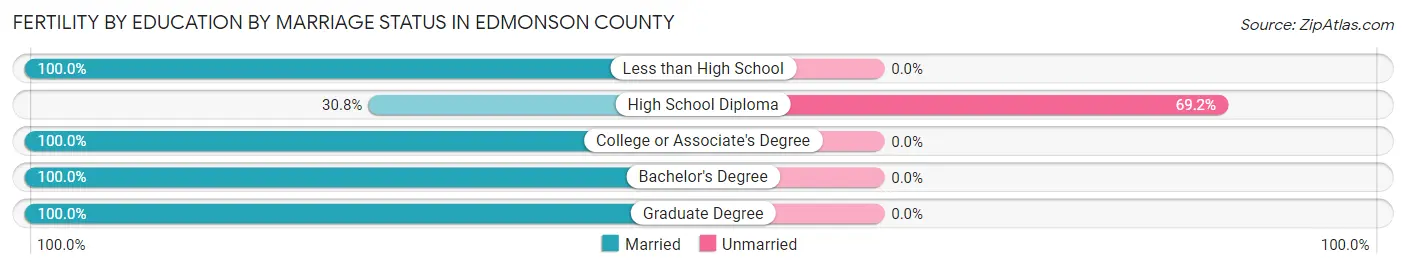
| Educational Attainment | Married | Unmarried |
| Less than High School | 40 (100.0%) | 0 (0.0%) |
| High School Diploma | 12 (30.8%) | 27 (69.2%) |
| College or Associate's Degree | 19 (100.0%) | 0 (0.0%) |
| Bachelor's Degree | 14 (100.0%) | 0 (0.0%) |
| Graduate Degree | 7 (100.0%) | 0 (0.0%) |
| Total | 92 (77.3%) | 27 (22.7%) |
Employment Characteristics in Edmonson County
Employment by Class of Employer in Edmonson County
Among the 4,518 employed individuals in Edmonson County, private company employees (3,143 | 69.6%), not-for-profit organizations (356 | 7.9%), and self-employed (not incorporated) (274 | 6.1%) make up the most common classes of employment.
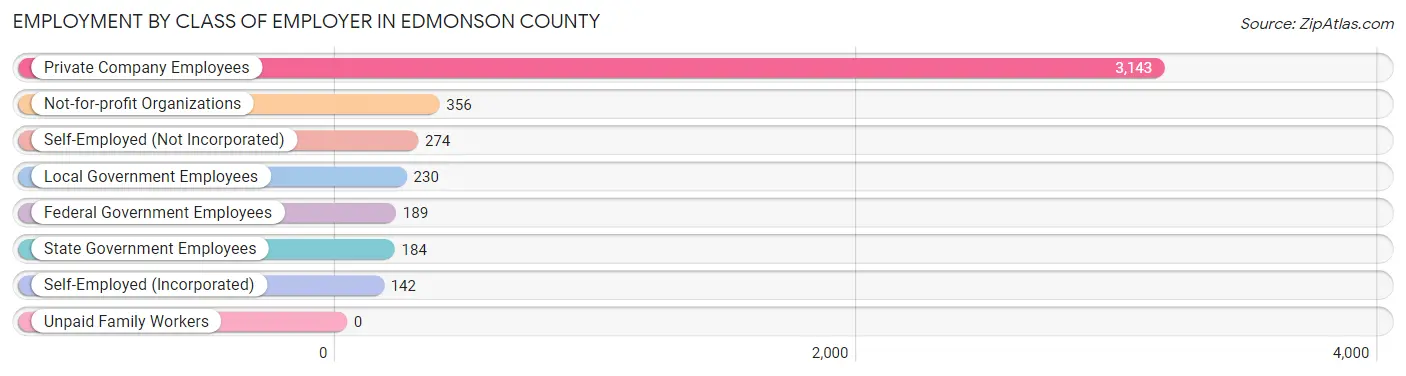
| Employer Class | # Employees | % Employees |
| Private Company Employees | 3,143 | 69.6% |
| Self-Employed (Incorporated) | 142 | 3.1% |
| Self-Employed (Not Incorporated) | 274 | 6.1% |
| Not-for-profit Organizations | 356 | 7.9% |
| Local Government Employees | 230 | 5.1% |
| State Government Employees | 184 | 4.1% |
| Federal Government Employees | 189 | 4.2% |
| Unpaid Family Workers | 0 | 0.0% |
| Total | 4,518 | 100.0% |
Employment Status by Age in Edmonson County
According to the labor force statistics for Edmonson County, out of the total population over 16 years of age (10,186), 49.8% or 5,073 individuals are in the labor force, with 6.8% or 345 of them unemployed. The age group with the highest labor force participation rate is 20 to 24 years, with 80.5% or 540 individuals in the labor force. Within the labor force, the 25 to 29 years age range has the highest percentage of unemployed individuals, with 20.1% or 96 of them being unemployed.
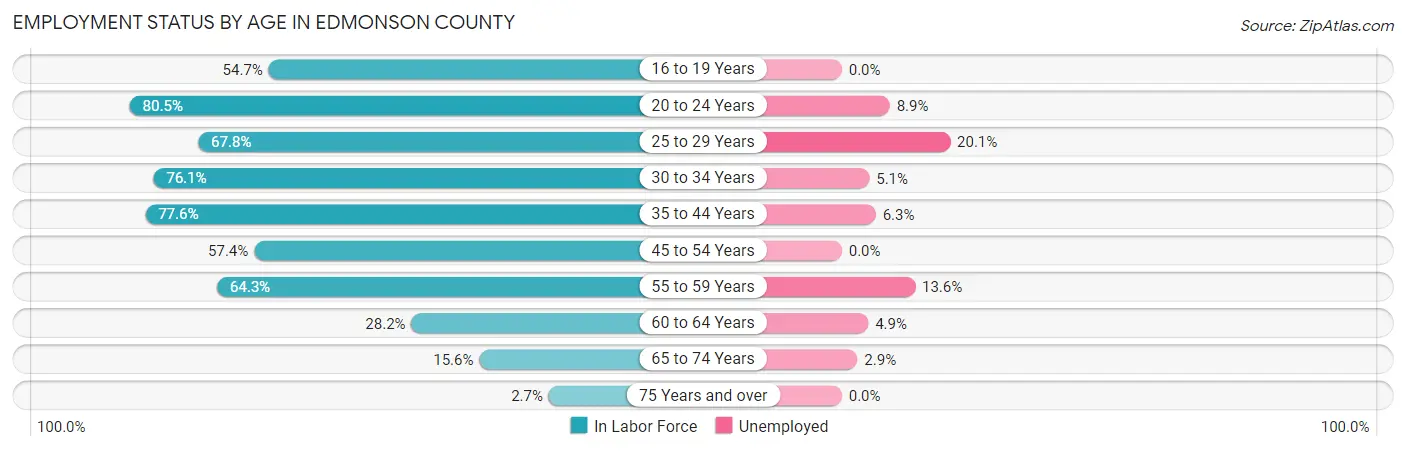
| Age Bracket | In Labor Force | Unemployed |
| 16 to 19 Years | 279 (54.7%) | 0 (0.0%) |
| 20 to 24 Years | 540 (80.5%) | 48 (8.9%) |
| 25 to 29 Years | 478 (67.8%) | 96 (20.1%) |
| 30 to 34 Years | 552 (76.1%) | 28 (5.1%) |
| 35 to 44 Years | 1,153 (77.6%) | 73 (6.3%) |
| 45 to 54 Years | 943 (57.4%) | 0 (0.0%) |
| 55 to 59 Years | 596 (64.3%) | 81 (13.6%) |
| 60 to 64 Years | 263 (28.2%) | 13 (4.9%) |
| 65 to 74 Years | 242 (15.6%) | 7 (2.9%) |
| 75 Years and over | 28 (2.7%) | 0 (0.0%) |
| Total | 5,073 (49.8%) | 345 (6.8%) |
Employment Status by Educational Attainment in Edmonson County
According to labor force statistics for Edmonson County, 62.1% of individuals (3,984) out of the total population between 25 and 64 years of age (6,416) are in the labor force, with 7.3% or 291 of them being unemployed. The group with the highest labor force participation rate are those with the educational attainment of bachelor's degree or higher, with 78.7% or 580 individuals in the labor force. Within the labor force, individuals with less than high school education have the highest percentage of unemployment, with 17.4% or 74 of them being unemployed.
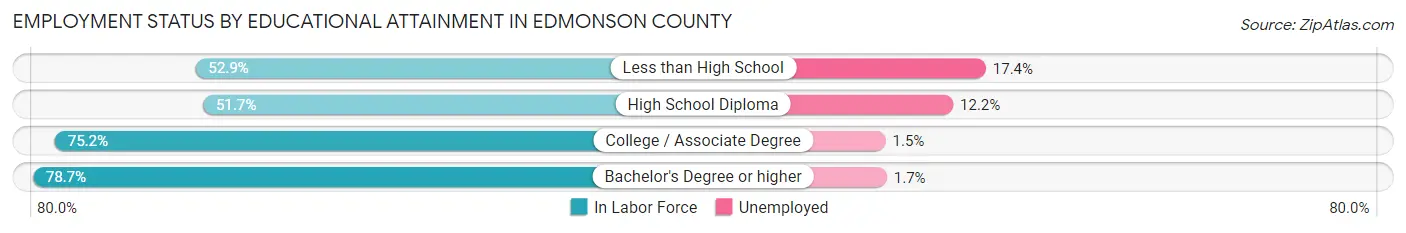
| Educational Attainment | In Labor Force | Unemployed |
| Less than High School | 425 (52.9%) | 140 (17.4%) |
| High School Diploma | 1,513 (51.7%) | 357 (12.2%) |
| College / Associate Degree | 1,465 (75.2%) | 29 (1.5%) |
| Bachelor's Degree or higher | 580 (78.7%) | 13 (1.7%) |
| Total | 3,984 (62.1%) | 468 (7.3%) |
Employment Occupations by Sex in Edmonson County
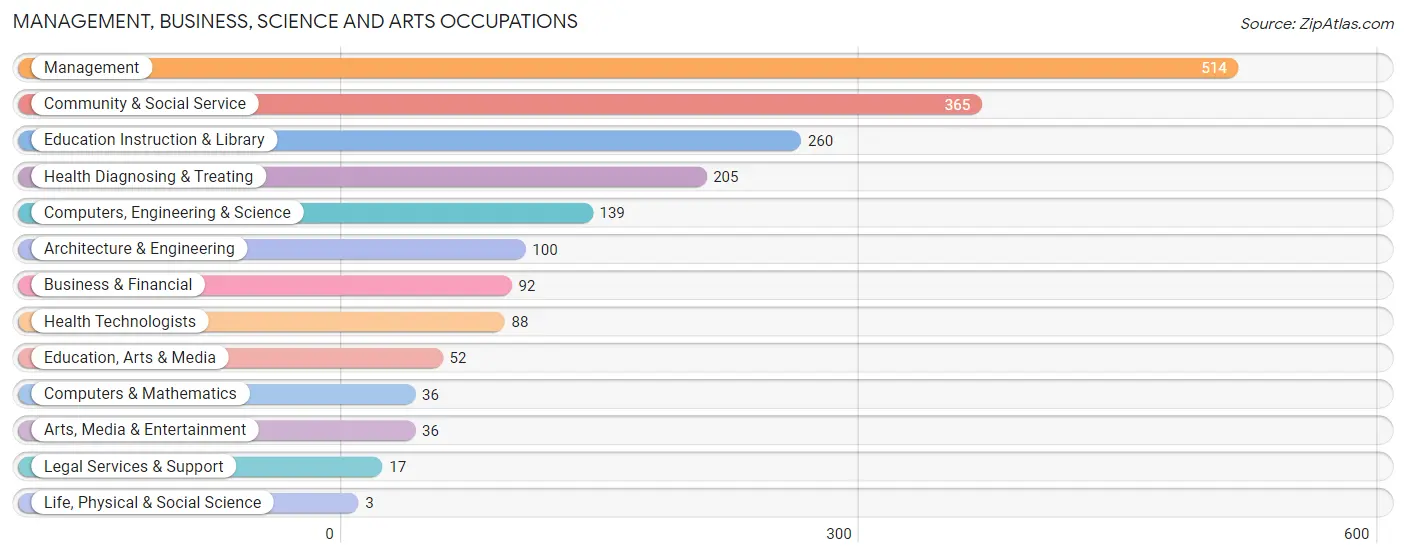
Management, Business, Science and Arts Occupations
The most common Management, Business, Science and Arts occupations in Edmonson County are Management (514 | 10.9%), Community & Social Service (365 | 7.7%), Education Instruction & Library (260 | 5.5%), Health Diagnosing & Treating (205 | 4.3%), and Computers, Engineering & Science (139 | 2.9%).
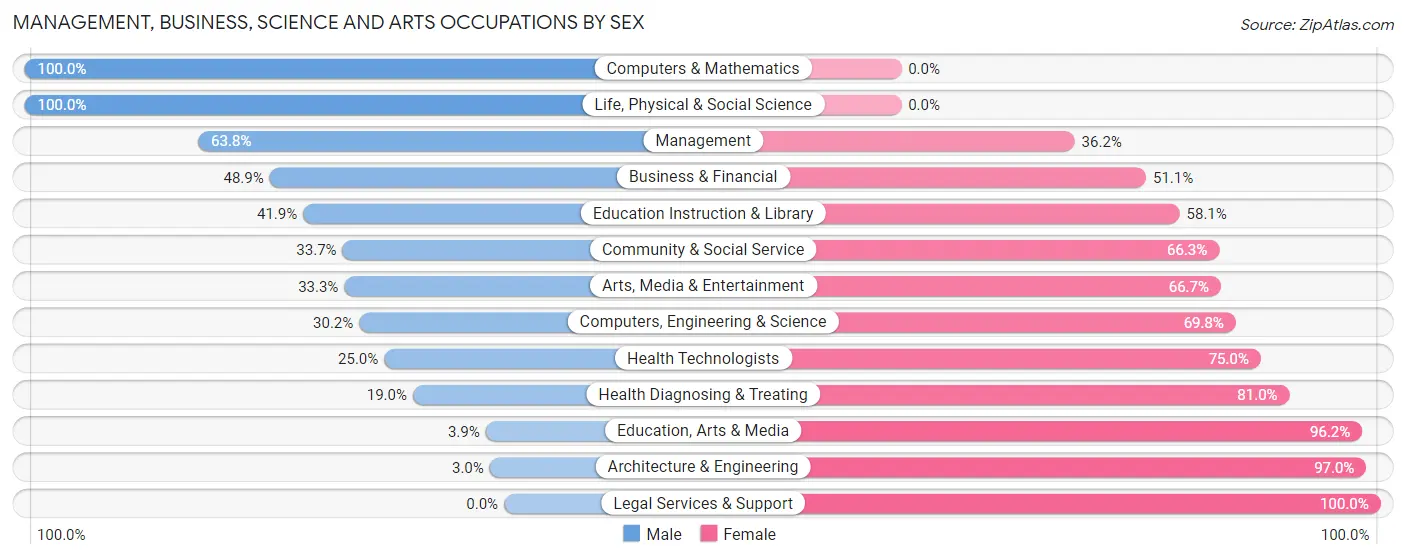
Management, Business, Science and Arts Occupations by Sex
Within the Management, Business, Science and Arts occupations in Edmonson County, the most male-oriented occupations are Computers & Mathematics (100.0%), Life, Physical & Social Science (100.0%), and Management (63.8%), while the most female-oriented occupations are Legal Services & Support (100.0%), Architecture & Engineering (97.0%), and Education, Arts & Media (96.2%).
| Occupation | Male | Female |
| Management | 328 (63.8%) | 186 (36.2%) |
| Business & Financial | 45 (48.9%) | 47 (51.1%) |
| Computers, Engineering & Science | 42 (30.2%) | 97 (69.8%) |
| Computers & Mathematics | 36 (100.0%) | 0 (0.0%) |
| Architecture & Engineering | 3 (3.0%) | 97 (97.0%) |
| Life, Physical & Social Science | 3 (100.0%) | 0 (0.0%) |
| Community & Social Service | 123 (33.7%) | 242 (66.3%) |
| Education, Arts & Media | 2 (3.8%) | 50 (96.2%) |
| Legal Services & Support | 0 (0.0%) | 17 (100.0%) |
| Education Instruction & Library | 109 (41.9%) | 151 (58.1%) |
| Arts, Media & Entertainment | 12 (33.3%) | 24 (66.7%) |
| Health Diagnosing & Treating | 39 (19.0%) | 166 (81.0%) |
| Health Technologists | 22 (25.0%) | 66 (75.0%) |
| Total (Category) | 577 (43.9%) | 738 (56.1%) |
| Total (Overall) | 2,569 (54.3%) | 2,158 (45.7%) |
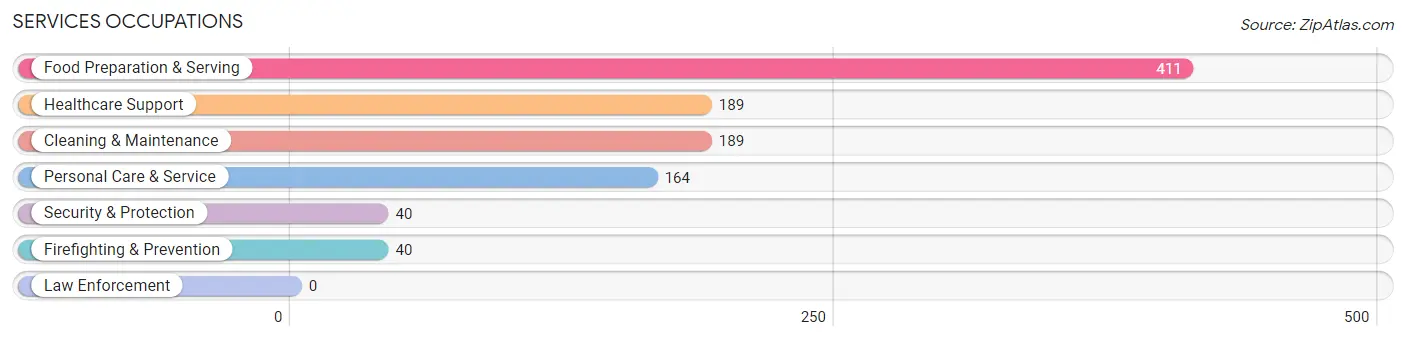
Services Occupations
The most common Services occupations in Edmonson County are Food Preparation & Serving (411 | 8.7%), Healthcare Support (189 | 4.0%), Cleaning & Maintenance (189 | 4.0%), Personal Care & Service (164 | 3.5%), and Security & Protection (40 | 0.9%).
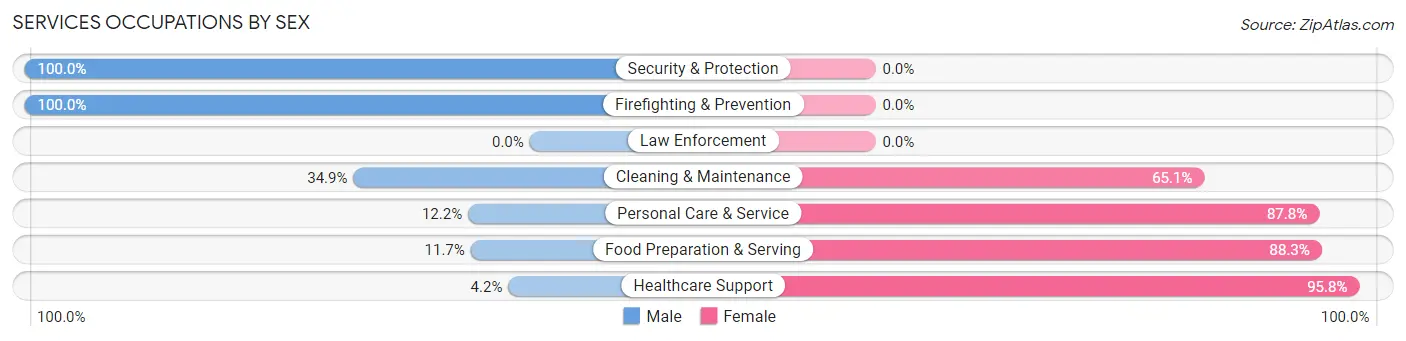
Services Occupations by Sex
Within the Services occupations in Edmonson County, the most male-oriented occupations are Security & Protection (100.0%), Firefighting & Prevention (100.0%), and Cleaning & Maintenance (34.9%), while the most female-oriented occupations are Healthcare Support (95.8%), Food Preparation & Serving (88.3%), and Personal Care & Service (87.8%).
| Occupation | Male | Female |
| Healthcare Support | 8 (4.2%) | 181 (95.8%) |
| Security & Protection | 40 (100.0%) | 0 (0.0%) |
| Firefighting & Prevention | 40 (100.0%) | 0 (0.0%) |
| Law Enforcement | 0 (0.0%) | 0 (0.0%) |
| Food Preparation & Serving | 48 (11.7%) | 363 (88.3%) |
| Cleaning & Maintenance | 66 (34.9%) | 123 (65.1%) |
| Personal Care & Service | 20 (12.2%) | 144 (87.8%) |
| Total (Category) | 182 (18.3%) | 811 (81.7%) |
| Total (Overall) | 2,569 (54.3%) | 2,158 (45.7%) |
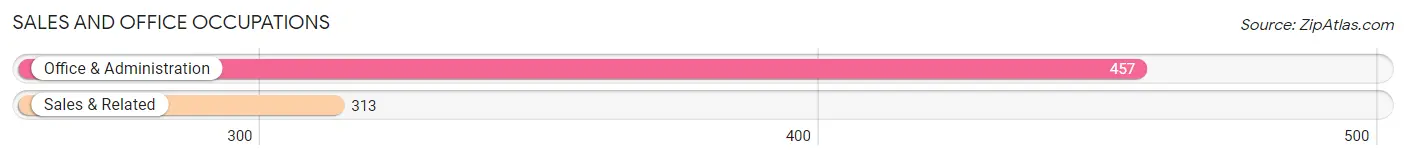
Sales and Office Occupations
The most common Sales and Office occupations in Edmonson County are Office & Administration (457 | 9.7%), and Sales & Related (313 | 6.6%).
Sales and Office Occupations by Sex
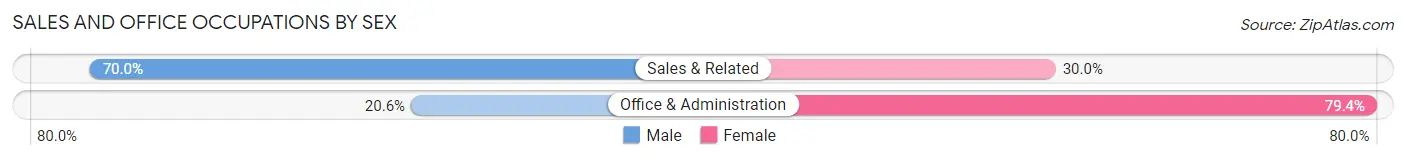
| Occupation | Male | Female |
| Sales & Related | 219 (70.0%) | 94 (30.0%) |
| Office & Administration | 94 (20.6%) | 363 (79.4%) |
| Total (Category) | 313 (40.6%) | 457 (59.4%) |
| Total (Overall) | 2,569 (54.3%) | 2,158 (45.7%) |
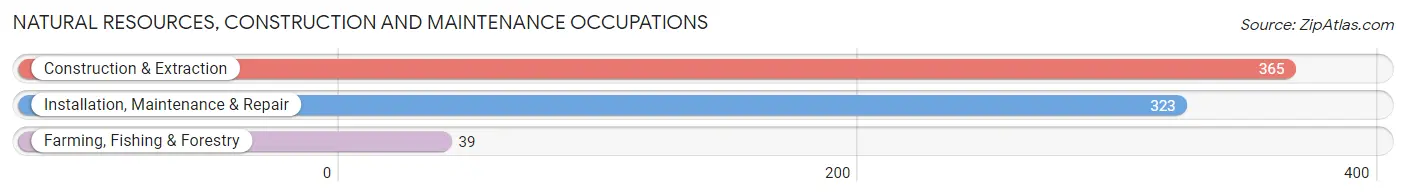
Natural Resources, Construction and Maintenance Occupations
The most common Natural Resources, Construction and Maintenance occupations in Edmonson County are Construction & Extraction (365 | 7.7%), Installation, Maintenance & Repair (323 | 6.8%), and Farming, Fishing & Forestry (39 | 0.8%).
Natural Resources, Construction and Maintenance Occupations by Sex
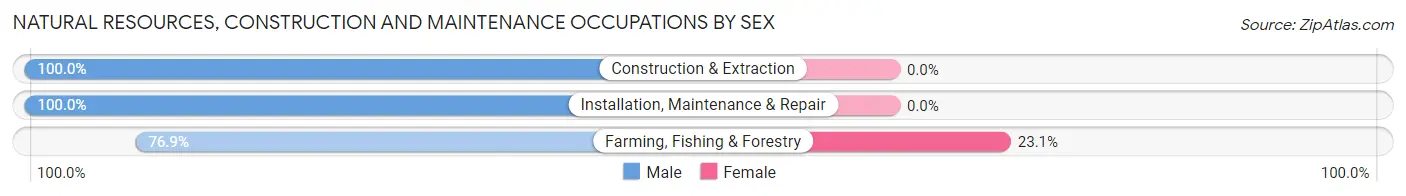
| Occupation | Male | Female |
| Farming, Fishing & Forestry | 30 (76.9%) | 9 (23.1%) |
| Construction & Extraction | 365 (100.0%) | 0 (0.0%) |
| Installation, Maintenance & Repair | 323 (100.0%) | 0 (0.0%) |
| Total (Category) | 718 (98.8%) | 9 (1.2%) |
| Total (Overall) | 2,569 (54.3%) | 2,158 (45.7%) |
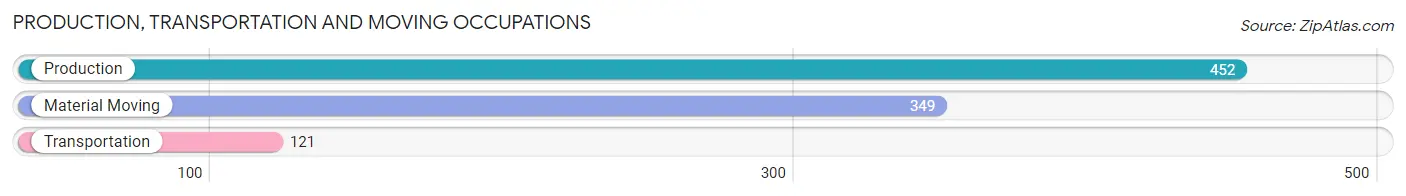
Production, Transportation and Moving Occupations
The most common Production, Transportation and Moving occupations in Edmonson County are Production (452 | 9.6%), Material Moving (349 | 7.4%), and Transportation (121 | 2.6%).
Production, Transportation and Moving Occupations by Sex
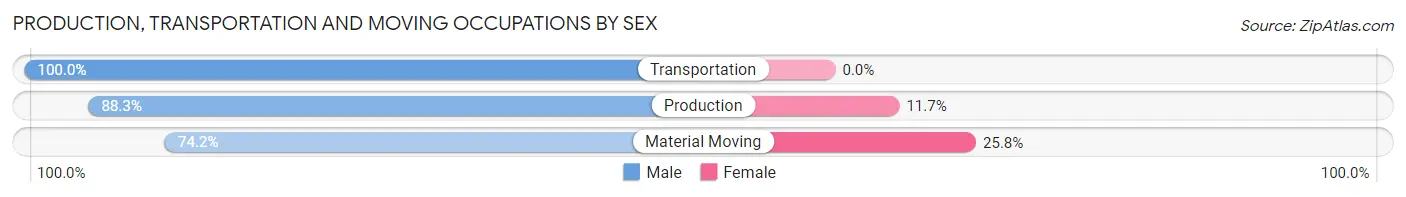
| Occupation | Male | Female |
| Production | 399 (88.3%) | 53 (11.7%) |
| Transportation | 121 (100.0%) | 0 (0.0%) |
| Material Moving | 259 (74.2%) | 90 (25.8%) |
| Total (Category) | 779 (84.5%) | 143 (15.5%) |
| Total (Overall) | 2,569 (54.3%) | 2,158 (45.7%) |
Employment Industries by Sex in Edmonson County
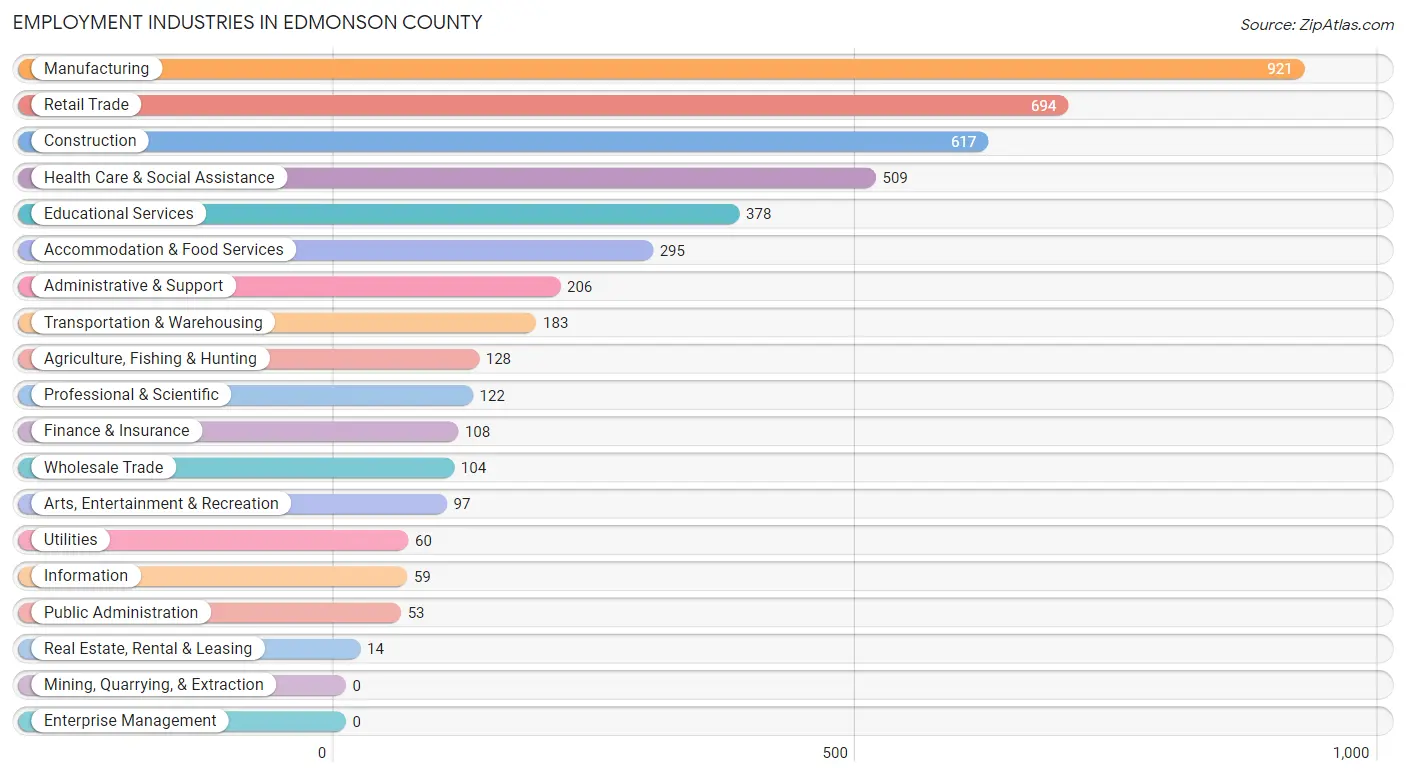
Employment Industries in Edmonson County
The major employment industries in Edmonson County include Manufacturing (921 | 19.5%), Retail Trade (694 | 14.7%), Construction (617 | 13.1%), Health Care & Social Assistance (509 | 10.8%), and Educational Services (378 | 8.0%).
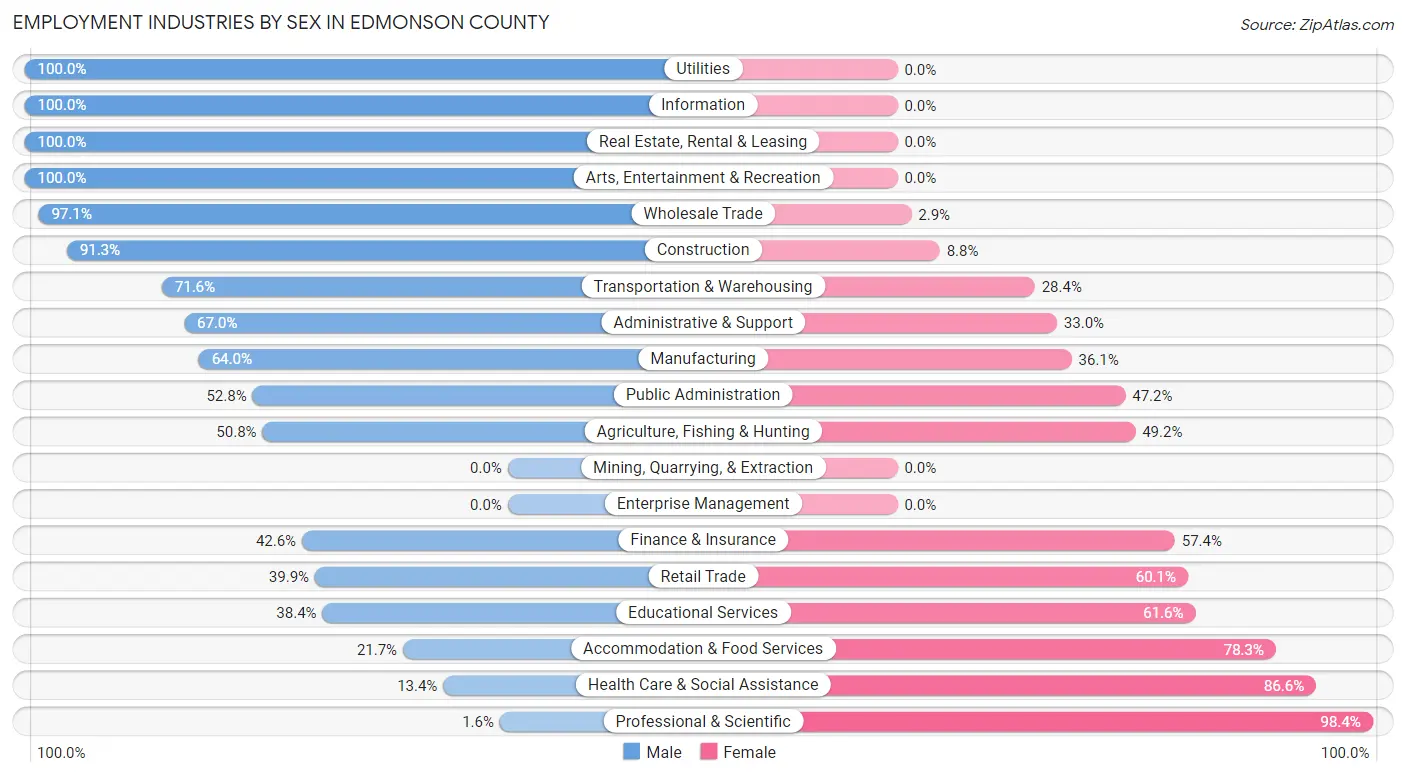
Employment Industries by Sex in Edmonson County
The Edmonson County industries that see more men than women are Utilities (100.0%), Information (100.0%), and Real Estate, Rental & Leasing (100.0%), whereas the industries that tend to have a higher number of women are Professional & Scientific (98.4%), Health Care & Social Assistance (86.6%), and Accommodation & Food Services (78.3%).
| Industry | Male | Female |
| Agriculture, Fishing & Hunting | 65 (50.8%) | 63 (49.2%) |
| Mining, Quarrying, & Extraction | 0 (0.0%) | 0 (0.0%) |
| Construction | 563 (91.2%) | 54 (8.7%) |
| Manufacturing | 589 (63.9%) | 332 (36.0%) |
| Wholesale Trade | 101 (97.1%) | 3 (2.9%) |
| Retail Trade | 277 (39.9%) | 417 (60.1%) |
| Transportation & Warehousing | 131 (71.6%) | 52 (28.4%) |
| Utilities | 60 (100.0%) | 0 (0.0%) |
| Information | 59 (100.0%) | 0 (0.0%) |
| Finance & Insurance | 46 (42.6%) | 62 (57.4%) |
| Real Estate, Rental & Leasing | 14 (100.0%) | 0 (0.0%) |
| Professional & Scientific | 2 (1.6%) | 120 (98.4%) |
| Enterprise Management | 0 (0.0%) | 0 (0.0%) |
| Administrative & Support | 138 (67.0%) | 68 (33.0%) |
| Educational Services | 145 (38.4%) | 233 (61.6%) |
| Health Care & Social Assistance | 68 (13.4%) | 441 (86.6%) |
| Arts, Entertainment & Recreation | 97 (100.0%) | 0 (0.0%) |
| Accommodation & Food Services | 64 (21.7%) | 231 (78.3%) |
| Public Administration | 28 (52.8%) | 25 (47.2%) |
| Total | 2,569 (54.3%) | 2,158 (45.7%) |
Education in Edmonson County
School Enrollment in Edmonson County
The most common levels of schooling among the 2,184 students in Edmonson County are high school (699 | 32.0%), middle school (549 | 25.1%), and elementary school (474 | 21.7%).
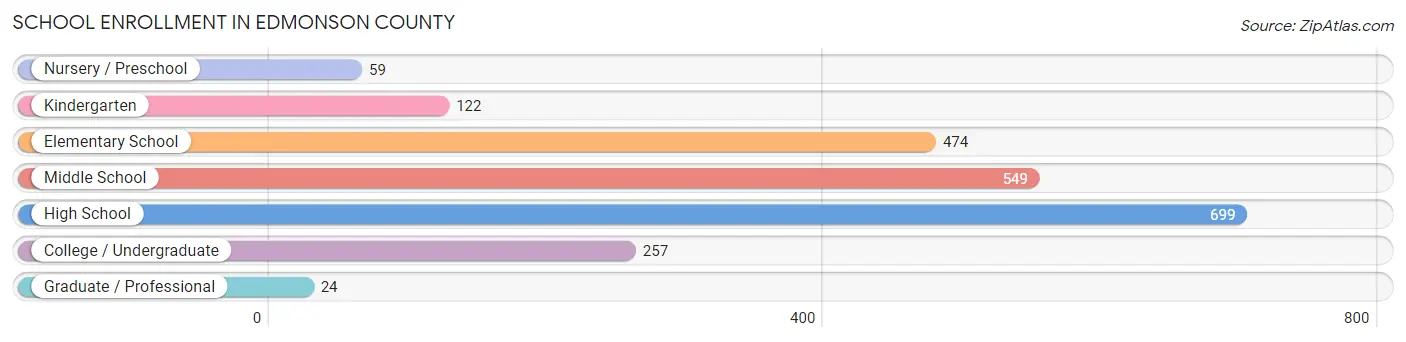
| School Level | # Students | % Students |
| Nursery / Preschool | 59 | 2.7% |
| Kindergarten | 122 | 5.6% |
| Elementary School | 474 | 21.7% |
| Middle School | 549 | 25.1% |
| High School | 699 | 32.0% |
| College / Undergraduate | 257 | 11.8% |
| Graduate / Professional | 24 | 1.1% |
| Total | 2,184 | 100.0% |
School Enrollment by Age by Funding Source in Edmonson County
Out of a total of 2,184 students who are enrolled in schools in Edmonson County, 186 (8.5%) attend a private institution, while the remaining 1,998 (91.5%) are enrolled in public schools. The age group of 3 to 4 year olds has the highest likelihood of being enrolled in private schools, with 9 (16.1% in the age bracket) enrolled. Conversely, the age group of 35 years and over has the lowest likelihood of being enrolled in a private school, with 69 (100.0% in the age bracket) attending a public institution.
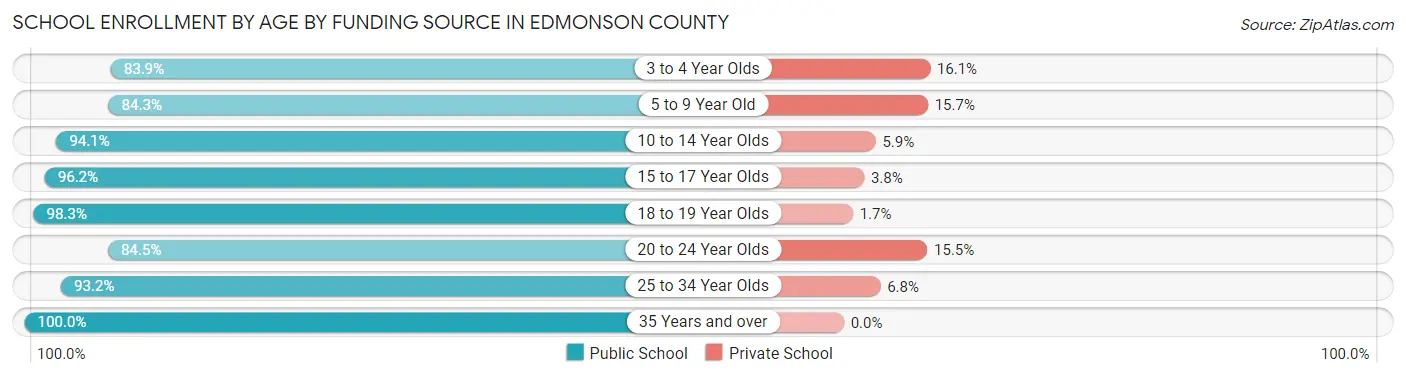
| Age Bracket | Public School | Private School |
| 3 to 4 Year Olds | 47 (83.9%) | 9 (16.1%) |
| 5 to 9 Year Old | 463 (84.3%) | 86 (15.7%) |
| 10 to 14 Year Olds | 699 (94.1%) | 44 (5.9%) |
| 15 to 17 Year Olds | 382 (96.2%) | 15 (3.8%) |
| 18 to 19 Year Olds | 117 (98.3%) | 2 (1.7%) |
| 20 to 24 Year Olds | 125 (84.5%) | 23 (15.5%) |
| 25 to 34 Year Olds | 96 (93.2%) | 7 (6.8%) |
| 35 Years and over | 69 (100.0%) | 0 (0.0%) |
| Total | 1,998 (91.5%) | 186 (8.5%) |
Educational Attainment by Field of Study in Edmonson County
Education (354 | 30.5%), business (159 | 13.7%), bio, nature & agricultural (128 | 11.0%), literature & languages (90 | 7.8%), and science & technology (88 | 7.6%) are the most common fields of study among 1,160 individuals in Edmonson County who have obtained a bachelor's degree or higher.
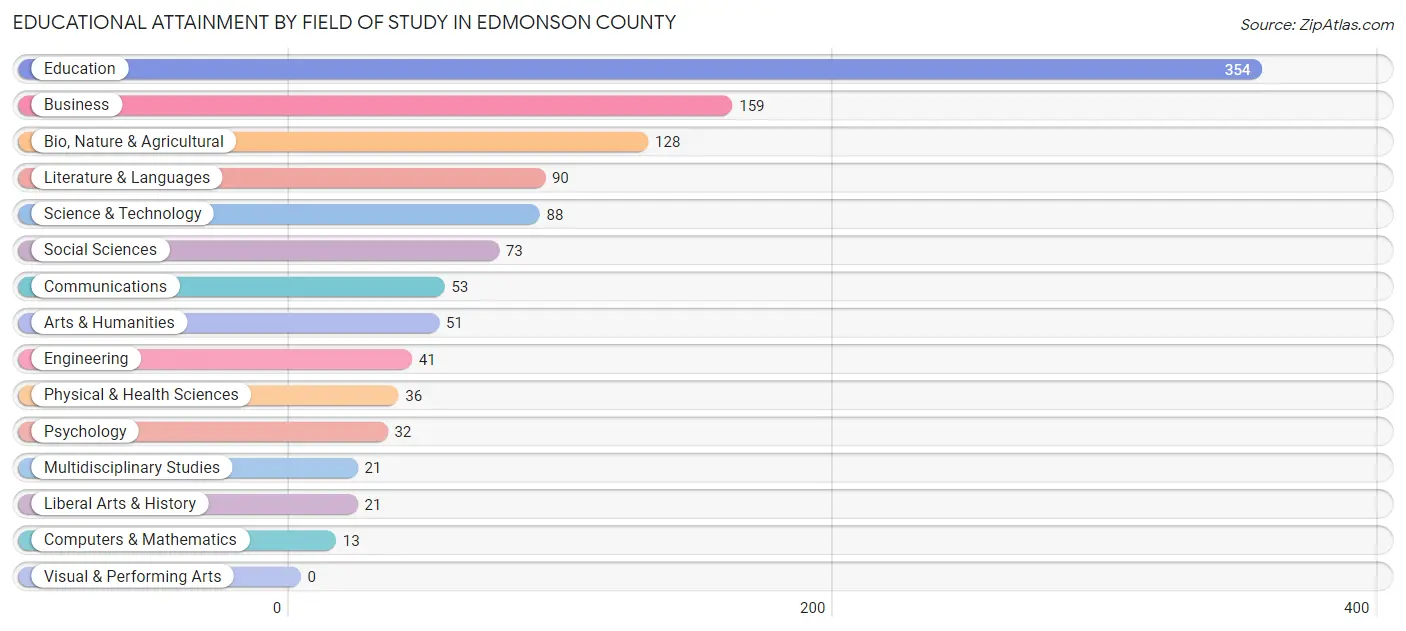
| Field of Study | # Graduates | % Graduates |
| Computers & Mathematics | 13 | 1.1% |
| Bio, Nature & Agricultural | 128 | 11.0% |
| Physical & Health Sciences | 36 | 3.1% |
| Psychology | 32 | 2.8% |
| Social Sciences | 73 | 6.3% |
| Engineering | 41 | 3.5% |
| Multidisciplinary Studies | 21 | 1.8% |
| Science & Technology | 88 | 7.6% |
| Business | 159 | 13.7% |
| Education | 354 | 30.5% |
| Literature & Languages | 90 | 7.8% |
| Liberal Arts & History | 21 | 1.8% |
| Visual & Performing Arts | 0 | 0.0% |
| Communications | 53 | 4.6% |
| Arts & Humanities | 51 | 4.4% |
| Total | 1,160 | 100.0% |
Transportation & Commute in Edmonson County
Vehicle Availability by Sex in Edmonson County
The most prevalent vehicle ownership categories in Edmonson County are males with 3 vehicles (894, accounting for 37.0%) and females with 3 vehicles (611, making up 45.3%).
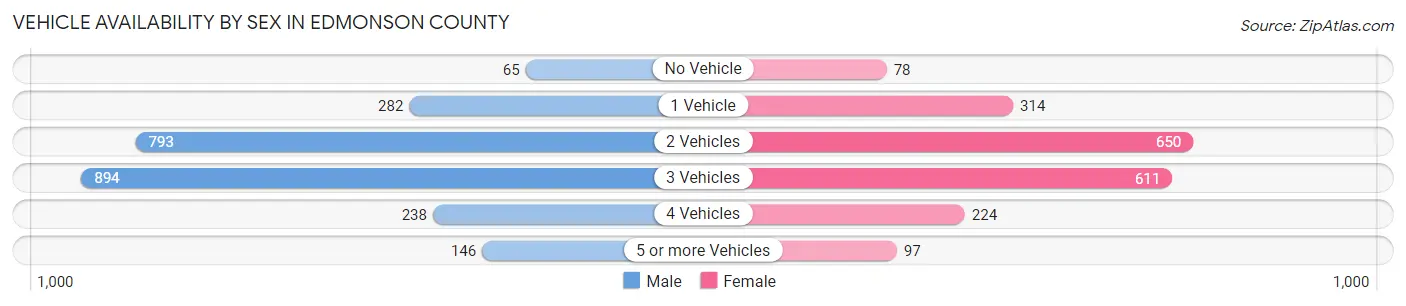
| Vehicles Available | Male | Female |
| No Vehicle | 65 (2.7%) | 78 (4.0%) |
| 1 Vehicle | 282 (11.7%) | 314 (15.9%) |
| 2 Vehicles | 793 (32.8%) | 650 (32.9%) |
| 3 Vehicles | 894 (37.0%) | 611 (30.9%) |
| 4 Vehicles | 238 (9.8%) | 224 (11.4%) |
| 5 or more Vehicles | 146 (6.0%) | 97 (4.9%) |
| Total | 2,418 (100.0%) | 1,974 (100.0%) |
Commute Time in Edmonson County
The most frequently occuring commute durations in Edmonson County are 45 to 59 minutes (532 commuters, 12.4%), 30 to 34 minutes (496 commuters, 11.6%), and 35 to 39 minutes (470 commuters, 11.0%).
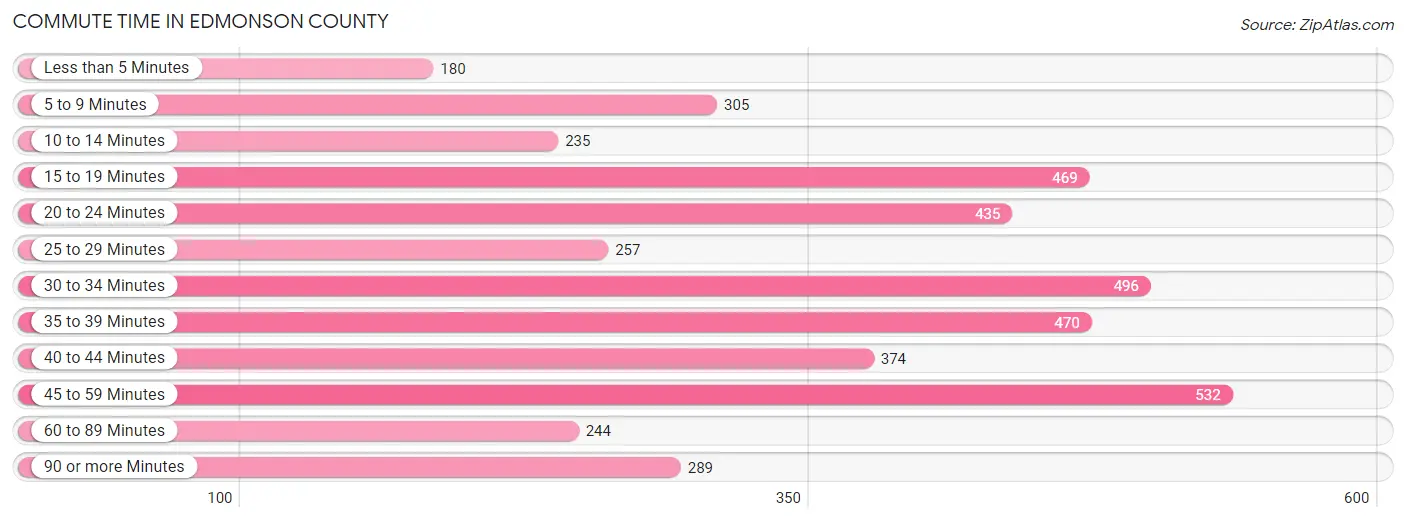
| Commute Time | # Commuters | % Commuters |
| Less than 5 Minutes | 180 | 4.2% |
| 5 to 9 Minutes | 305 | 7.1% |
| 10 to 14 Minutes | 235 | 5.5% |
| 15 to 19 Minutes | 469 | 10.9% |
| 20 to 24 Minutes | 435 | 10.2% |
| 25 to 29 Minutes | 257 | 6.0% |
| 30 to 34 Minutes | 496 | 11.6% |
| 35 to 39 Minutes | 470 | 11.0% |
| 40 to 44 Minutes | 374 | 8.7% |
| 45 to 59 Minutes | 532 | 12.4% |
| 60 to 89 Minutes | 244 | 5.7% |
| 90 or more Minutes | 289 | 6.7% |
Commute Time by Sex in Edmonson County
The most common commute times in Edmonson County are 45 to 59 minutes (398 commuters, 16.3%) for males and 20 to 24 minutes (320 commuters, 17.4%) for females.
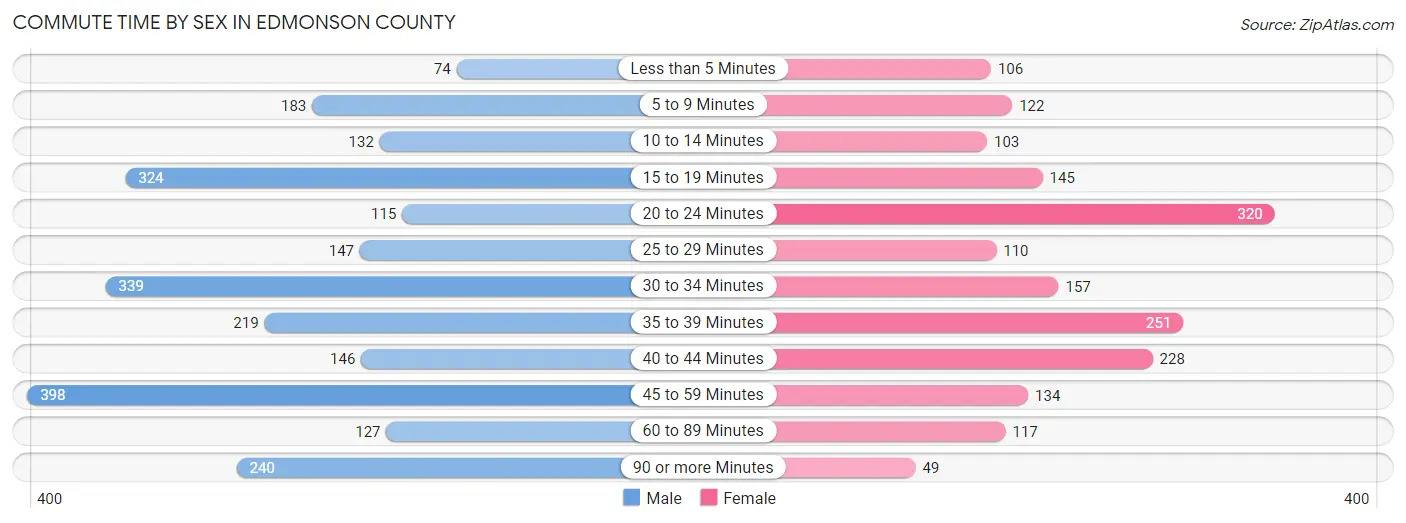
| Commute Time | Male | Female |
| Less than 5 Minutes | 74 (3.0%) | 106 (5.8%) |
| 5 to 9 Minutes | 183 (7.5%) | 122 (6.6%) |
| 10 to 14 Minutes | 132 (5.4%) | 103 (5.6%) |
| 15 to 19 Minutes | 324 (13.3%) | 145 (7.9%) |
| 20 to 24 Minutes | 115 (4.7%) | 320 (17.4%) |
| 25 to 29 Minutes | 147 (6.0%) | 110 (6.0%) |
| 30 to 34 Minutes | 339 (13.9%) | 157 (8.5%) |
| 35 to 39 Minutes | 219 (9.0%) | 251 (13.6%) |
| 40 to 44 Minutes | 146 (6.0%) | 228 (12.4%) |
| 45 to 59 Minutes | 398 (16.3%) | 134 (7.3%) |
| 60 to 89 Minutes | 127 (5.2%) | 117 (6.4%) |
| 90 or more Minutes | 240 (9.8%) | 49 (2.7%) |
Time of Departure to Work by Sex in Edmonson County
The most frequent times of departure to work in Edmonson County are 7:00 AM to 7:29 AM (538, 22.0%) for males and 7:00 AM to 7:29 AM (409, 22.2%) for females.
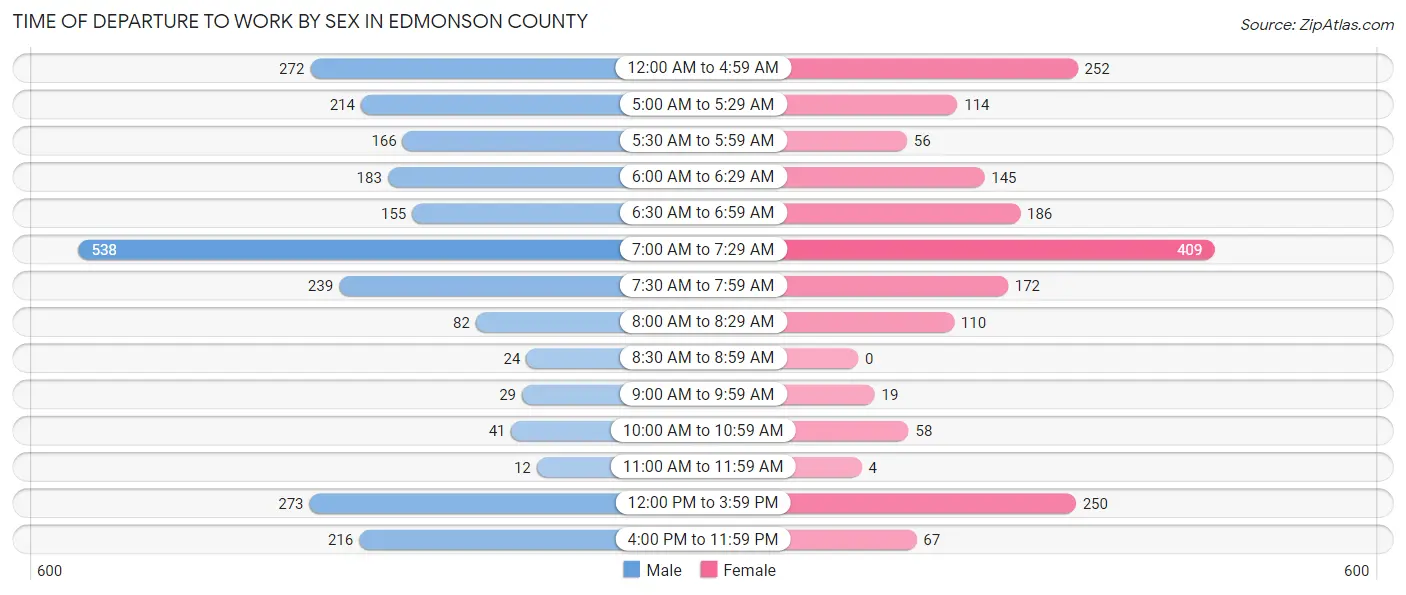
| Time of Departure | Male | Female |
| 12:00 AM to 4:59 AM | 272 (11.1%) | 252 (13.7%) |
| 5:00 AM to 5:29 AM | 214 (8.8%) | 114 (6.2%) |
| 5:30 AM to 5:59 AM | 166 (6.8%) | 56 (3.0%) |
| 6:00 AM to 6:29 AM | 183 (7.5%) | 145 (7.9%) |
| 6:30 AM to 6:59 AM | 155 (6.3%) | 186 (10.1%) |
| 7:00 AM to 7:29 AM | 538 (22.0%) | 409 (22.2%) |
| 7:30 AM to 7:59 AM | 239 (9.8%) | 172 (9.3%) |
| 8:00 AM to 8:29 AM | 82 (3.4%) | 110 (6.0%) |
| 8:30 AM to 8:59 AM | 24 (1.0%) | 0 (0.0%) |
| 9:00 AM to 9:59 AM | 29 (1.2%) | 19 (1.0%) |
| 10:00 AM to 10:59 AM | 41 (1.7%) | 58 (3.2%) |
| 11:00 AM to 11:59 AM | 12 (0.5%) | 4 (0.2%) |
| 12:00 PM to 3:59 PM | 273 (11.2%) | 250 (13.6%) |
| 4:00 PM to 11:59 PM | 216 (8.8%) | 67 (3.6%) |
| Total | 2,444 (100.0%) | 1,842 (100.0%) |
Housing Occupancy in Edmonson County
Occupancy by Ownership in Edmonson County
Of the total 4,760 dwellings in Edmonson County, owner-occupied units account for 3,960 (83.2%), while renter-occupied units make up 800 (16.8%).
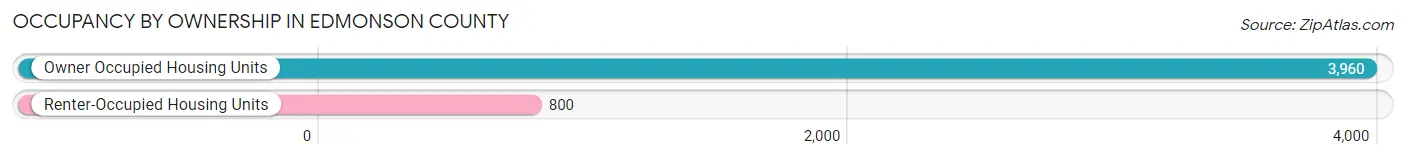
| Occupancy | # Housing Units | % Housing Units |
| Owner Occupied Housing Units | 3,960 | 83.2% |
| Renter-Occupied Housing Units | 800 | 16.8% |
| Total Occupied Housing Units | 4,760 | 100.0% |
Occupancy by Household Size in Edmonson County
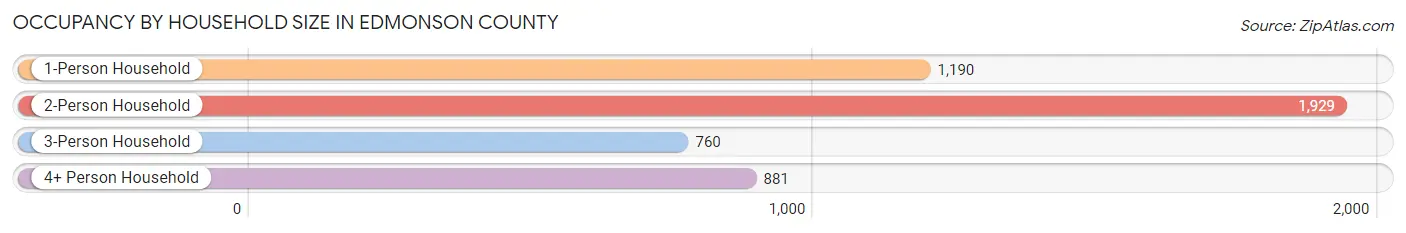
| Household Size | # Housing Units | % Housing Units |
| 1-Person Household | 1,190 | 25.0% |
| 2-Person Household | 1,929 | 40.5% |
| 3-Person Household | 760 | 16.0% |
| 4+ Person Household | 881 | 18.5% |
| Total Housing Units | 4,760 | 100.0% |
Occupancy by Ownership by Household Size in Edmonson County
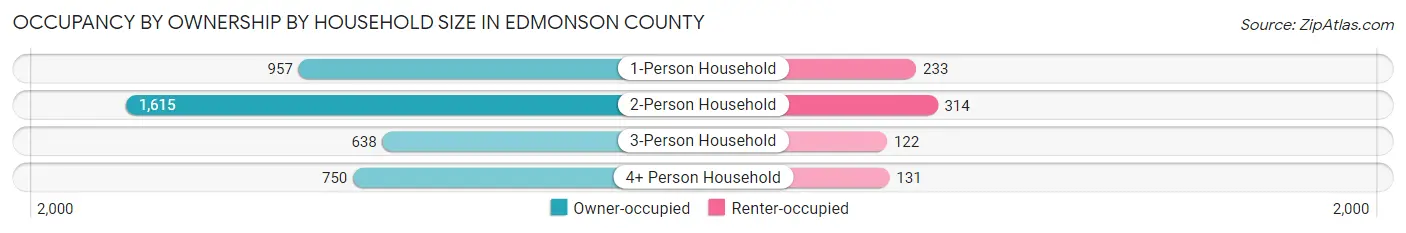
| Household Size | Owner-occupied | Renter-occupied |
| 1-Person Household | 957 (80.4%) | 233 (19.6%) |
| 2-Person Household | 1,615 (83.7%) | 314 (16.3%) |
| 3-Person Household | 638 (84.0%) | 122 (16.1%) |
| 4+ Person Household | 750 (85.1%) | 131 (14.9%) |
| Total Housing Units | 3,960 (83.2%) | 800 (16.8%) |
Occupancy by Educational Attainment in Edmonson County
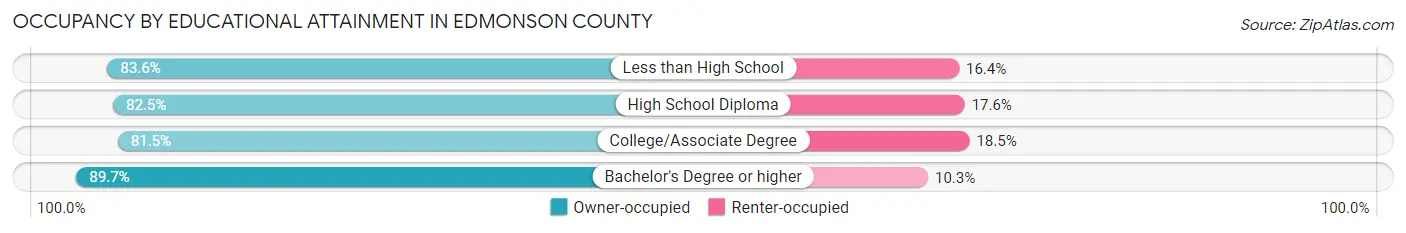
| Household Size | Owner-occupied | Renter-occupied |
| Less than High School | 646 (83.6%) | 127 (16.4%) |
| High School Diploma | 1,719 (82.5%) | 366 (17.5%) |
| College/Associate Degree | 1,106 (81.5%) | 251 (18.5%) |
| Bachelor's Degree or higher | 489 (89.7%) | 56 (10.3%) |
Occupancy by Age of Householder in Edmonson County
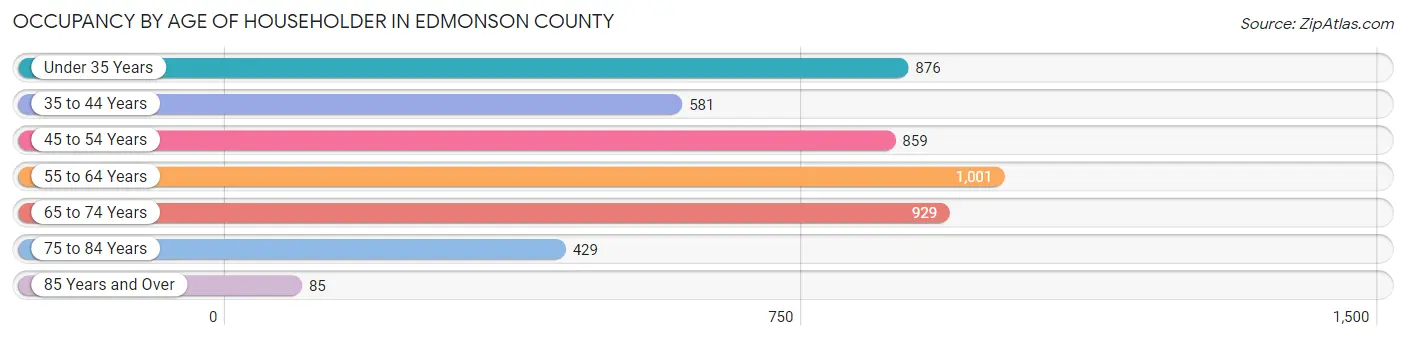
| Age Bracket | # Households | % Households |
| Under 35 Years | 876 | 18.4% |
| 35 to 44 Years | 581 | 12.2% |
| 45 to 54 Years | 859 | 18.0% |
| 55 to 64 Years | 1,001 | 21.0% |
| 65 to 74 Years | 929 | 19.5% |
| 75 to 84 Years | 429 | 9.0% |
| 85 Years and Over | 85 | 1.8% |
| Total | 4,760 | 100.0% |
Housing Finances in Edmonson County
Median Income by Occupancy in Edmonson County
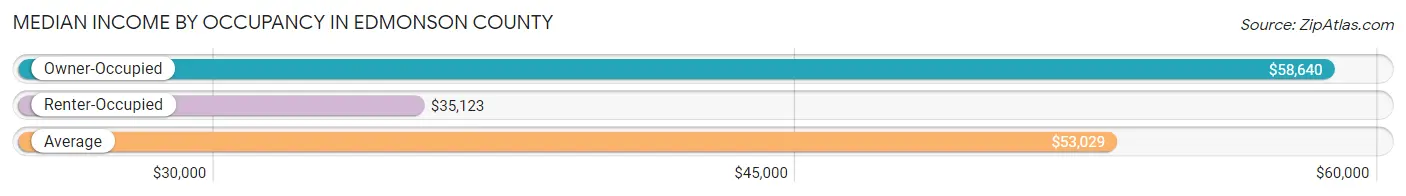
| Occupancy Type | # Households | Median Income |
| Owner-Occupied | 3,960 (83.2%) | $58,640 |
| Renter-Occupied | 800 (16.8%) | $35,123 |
| Average | 4,760 (100.0%) | $53,029 |
Occupancy by Householder Income Bracket in Edmonson County
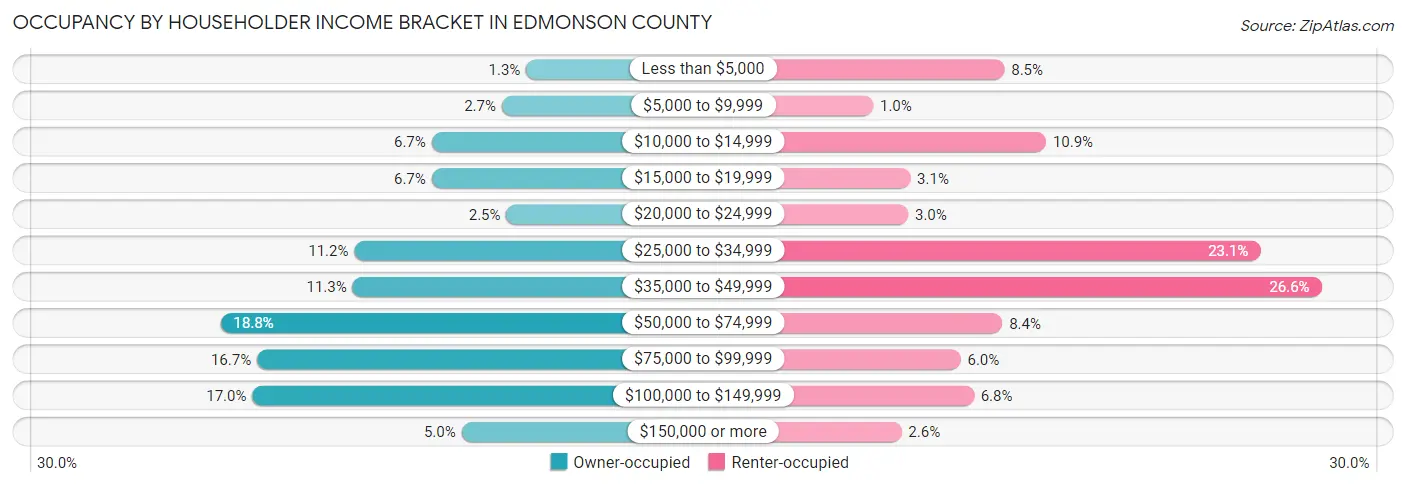
| Income Bracket | Owner-occupied | Renter-occupied |
| Less than $5,000 | 53 (1.3%) | 68 (8.5%) |
| $5,000 to $9,999 | 108 (2.7%) | 8 (1.0%) |
| $10,000 to $14,999 | 267 (6.7%) | 87 (10.9%) |
| $15,000 to $19,999 | 267 (6.7%) | 25 (3.1%) |
| $20,000 to $24,999 | 98 (2.5%) | 24 (3.0%) |
| $25,000 to $34,999 | 442 (11.2%) | 185 (23.1%) |
| $35,000 to $49,999 | 446 (11.3%) | 213 (26.6%) |
| $50,000 to $74,999 | 745 (18.8%) | 67 (8.4%) |
| $75,000 to $99,999 | 662 (16.7%) | 48 (6.0%) |
| $100,000 to $149,999 | 673 (17.0%) | 54 (6.8%) |
| $150,000 or more | 199 (5.0%) | 21 (2.6%) |
| Total | 3,960 (100.0%) | 800 (100.0%) |
Monthly Housing Cost Tiers in Edmonson County
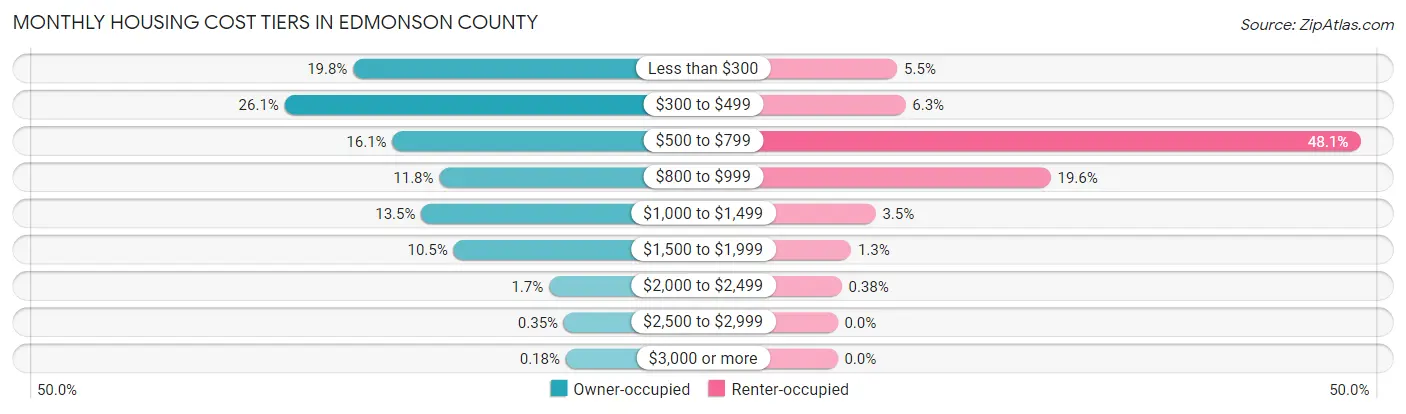
| Monthly Cost | Owner-occupied | Renter-occupied |
| Less than $300 | 782 (19.8%) | 44 (5.5%) |
| $300 to $499 | 1,032 (26.1%) | 50 (6.2%) |
| $500 to $799 | 639 (16.1%) | 385 (48.1%) |
| $800 to $999 | 468 (11.8%) | 157 (19.6%) |
| $1,000 to $1,499 | 534 (13.5%) | 28 (3.5%) |
| $1,500 to $1,999 | 416 (10.5%) | 10 (1.3%) |
| $2,000 to $2,499 | 68 (1.7%) | 3 (0.4%) |
| $2,500 to $2,999 | 14 (0.4%) | 0 (0.0%) |
| $3,000 or more | 7 (0.2%) | 0 (0.0%) |
| Total | 3,960 (100.0%) | 800 (100.0%) |
Physical Housing Characteristics in Edmonson County
Housing Structures in Edmonson County
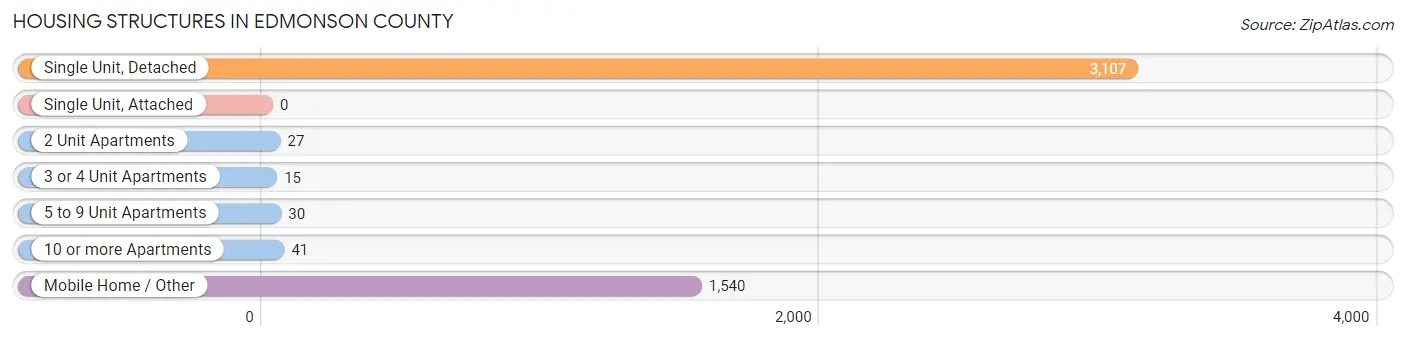
| Structure Type | # Housing Units | % Housing Units |
| Single Unit, Detached | 3,107 | 65.3% |
| Single Unit, Attached | 0 | 0.0% |
| 2 Unit Apartments | 27 | 0.6% |
| 3 or 4 Unit Apartments | 15 | 0.3% |
| 5 to 9 Unit Apartments | 30 | 0.6% |
| 10 or more Apartments | 41 | 0.9% |
| Mobile Home / Other | 1,540 | 32.4% |
| Total | 4,760 | 100.0% |
Housing Structures by Occupancy in Edmonson County
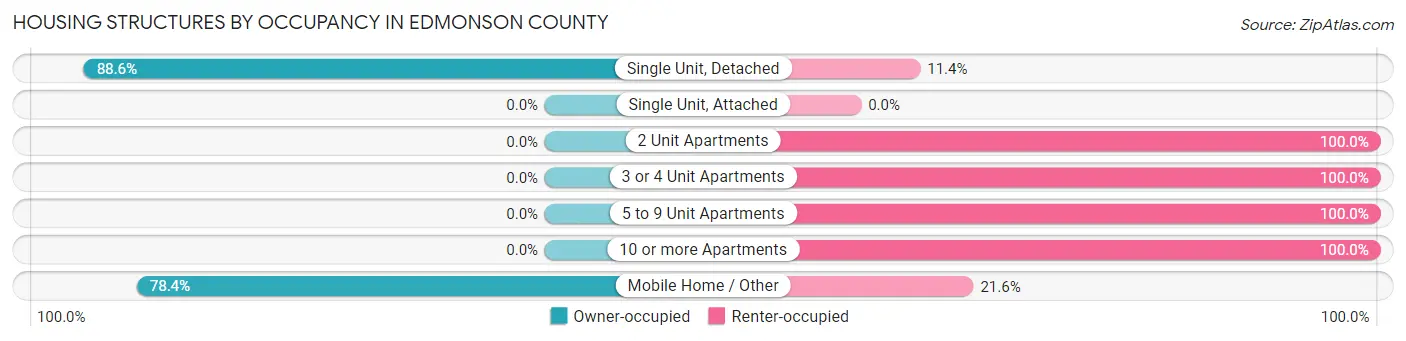
| Structure Type | Owner-occupied | Renter-occupied |
| Single Unit, Detached | 2,753 (88.6%) | 354 (11.4%) |
| Single Unit, Attached | 0 (0.0%) | 0 (0.0%) |
| 2 Unit Apartments | 0 (0.0%) | 27 (100.0%) |
| 3 or 4 Unit Apartments | 0 (0.0%) | 15 (100.0%) |
| 5 to 9 Unit Apartments | 0 (0.0%) | 30 (100.0%) |
| 10 or more Apartments | 0 (0.0%) | 41 (100.0%) |
| Mobile Home / Other | 1,207 (78.4%) | 333 (21.6%) |
| Total | 3,960 (83.2%) | 800 (16.8%) |
Housing Structures by Number of Rooms in Edmonson County
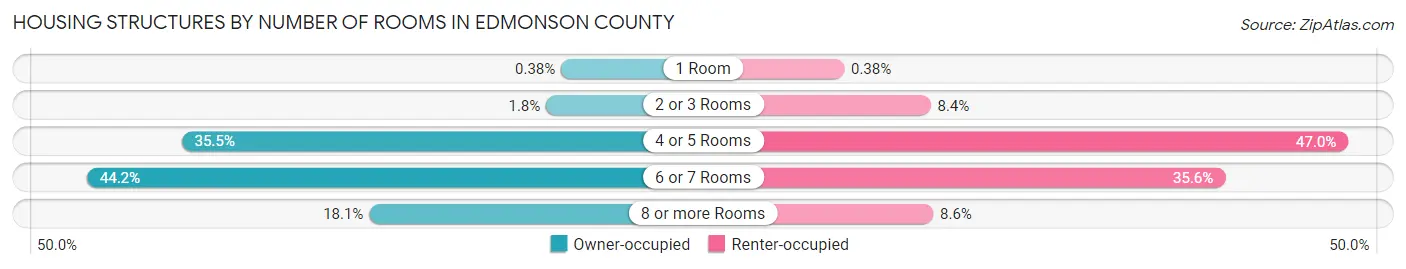
| Number of Rooms | Owner-occupied | Renter-occupied |
| 1 Room | 15 (0.4%) | 3 (0.4%) |
| 2 or 3 Rooms | 70 (1.8%) | 67 (8.4%) |
| 4 or 5 Rooms | 1,405 (35.5%) | 376 (47.0%) |
| 6 or 7 Rooms | 1,752 (44.2%) | 285 (35.6%) |
| 8 or more Rooms | 718 (18.1%) | 69 (8.6%) |
| Total | 3,960 (100.0%) | 800 (100.0%) |
Housing Structure by Heating Type in Edmonson County
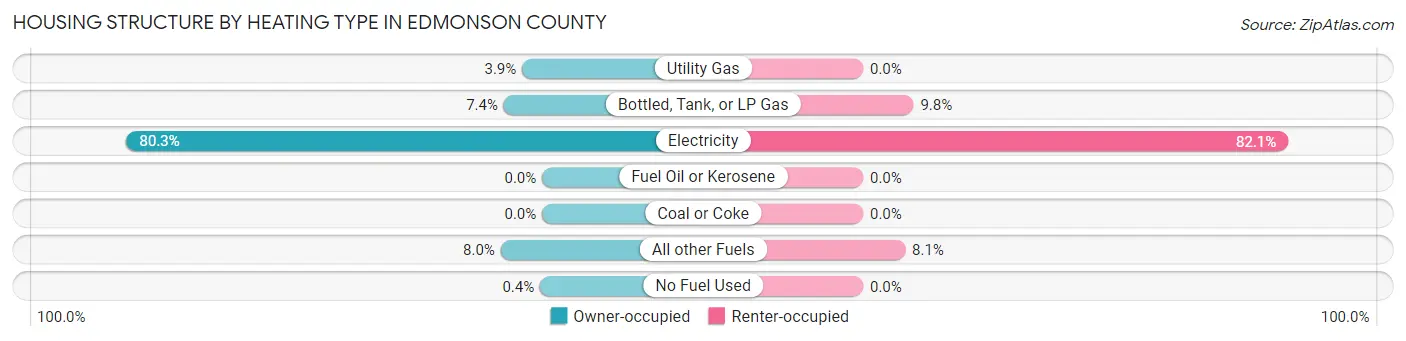
| Heating Type | Owner-occupied | Renter-occupied |
| Utility Gas | 153 (3.9%) | 0 (0.0%) |
| Bottled, Tank, or LP Gas | 293 (7.4%) | 78 (9.8%) |
| Electricity | 3,181 (80.3%) | 657 (82.1%) |
| Fuel Oil or Kerosene | 0 (0.0%) | 0 (0.0%) |
| Coal or Coke | 0 (0.0%) | 0 (0.0%) |
| All other Fuels | 317 (8.0%) | 65 (8.1%) |
| No Fuel Used | 16 (0.4%) | 0 (0.0%) |
| Total | 3,960 (100.0%) | 800 (100.0%) |
Household Vehicle Usage in Edmonson County
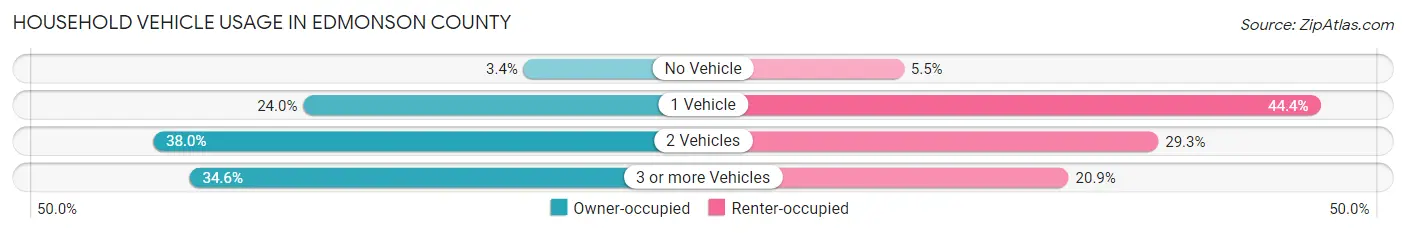
| Vehicles per Household | Owner-occupied | Renter-occupied |
| No Vehicle | 135 (3.4%) | 44 (5.5%) |
| 1 Vehicle | 950 (24.0%) | 355 (44.4%) |
| 2 Vehicles | 1,505 (38.0%) | 234 (29.2%) |
| 3 or more Vehicles | 1,370 (34.6%) | 167 (20.9%) |
| Total | 3,960 (100.0%) | 800 (100.0%) |
Real Estate & Mortgages in Edmonson County
Real Estate and Mortgage Overview in Edmonson County
| Characteristic | Without Mortgage | With Mortgage |
| Housing Units | 2,265 | 1,695 |
| Median Property Value | $97,200 | $144,300 |
| Median Household Income | $38,946 | $101 |
| Monthly Housing Costs | $371 | $7 |
| Real Estate Taxes | $643 | $25 |
Property Value by Mortgage Status in Edmonson County
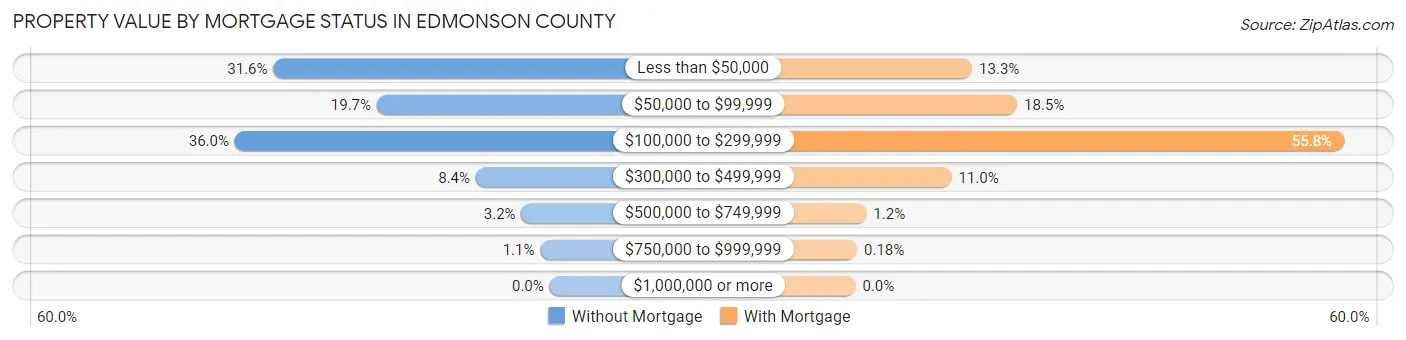
| Property Value | Without Mortgage | With Mortgage |
| Less than $50,000 | 715 (31.6%) | 226 (13.3%) |
| $50,000 to $99,999 | 447 (19.7%) | 313 (18.5%) |
| $100,000 to $299,999 | 815 (36.0%) | 946 (55.8%) |
| $300,000 to $499,999 | 191 (8.4%) | 186 (11.0%) |
| $500,000 to $749,999 | 73 (3.2%) | 21 (1.2%) |
| $750,000 to $999,999 | 24 (1.1%) | 3 (0.2%) |
| $1,000,000 or more | 0 (0.0%) | 0 (0.0%) |
| Total | 2,265 (100.0%) | 1,695 (100.0%) |
Household Income by Mortgage Status in Edmonson County
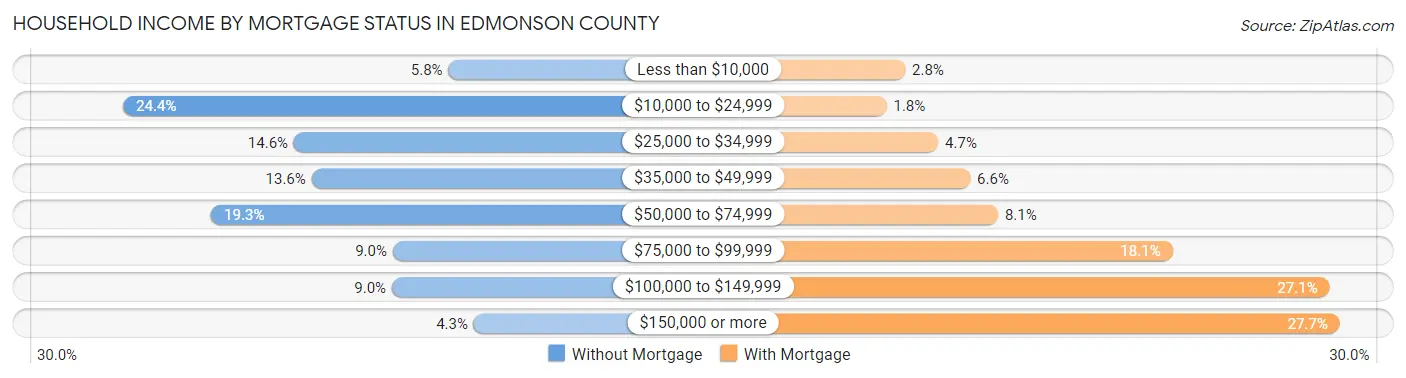
| Household Income | Without Mortgage | With Mortgage |
| Less than $10,000 | 131 (5.8%) | 48 (2.8%) |
| $10,000 to $24,999 | 552 (24.4%) | 30 (1.8%) |
| $25,000 to $34,999 | 331 (14.6%) | 80 (4.7%) |
| $35,000 to $49,999 | 308 (13.6%) | 111 (6.6%) |
| $50,000 to $74,999 | 438 (19.3%) | 138 (8.1%) |
| $75,000 to $99,999 | 203 (9.0%) | 307 (18.1%) |
| $100,000 to $149,999 | 204 (9.0%) | 459 (27.1%) |
| $150,000 or more | 98 (4.3%) | 469 (27.7%) |
| Total | 2,265 (100.0%) | 1,695 (100.0%) |
Property Value to Household Income Ratio in Edmonson County
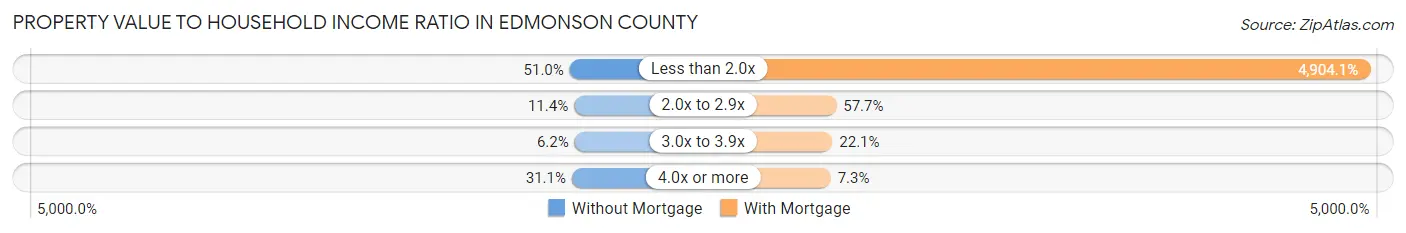
| Value-to-Income Ratio | Without Mortgage | With Mortgage |
| Less than 2.0x | 1,154 (50.9%) | 83,125 (4,904.1%) |
| 2.0x to 2.9x | 258 (11.4%) | 978 (57.7%) |
| 3.0x to 3.9x | 140 (6.2%) | 375 (22.1%) |
| 4.0x or more | 704 (31.1%) | 124 (7.3%) |
| Total | 2,265 (100.0%) | 1,695 (100.0%) |
Real Estate Taxes by Mortgage Status in Edmonson County
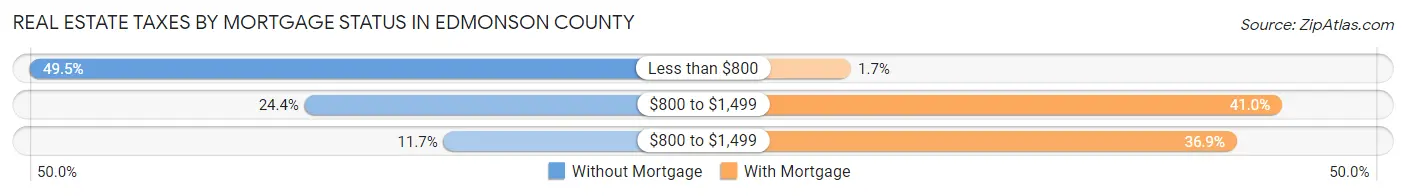
| Property Taxes | Without Mortgage | With Mortgage |
| Less than $800 | 1,121 (49.5%) | 28 (1.7%) |
| $800 to $1,499 | 553 (24.4%) | 695 (41.0%) |
| $800 to $1,499 | 266 (11.7%) | 625 (36.9%) |
| Total | 2,265 (100.0%) | 1,695 (100.0%) |
Health & Disability in Edmonson County
Health Insurance Coverage by Age in Edmonson County
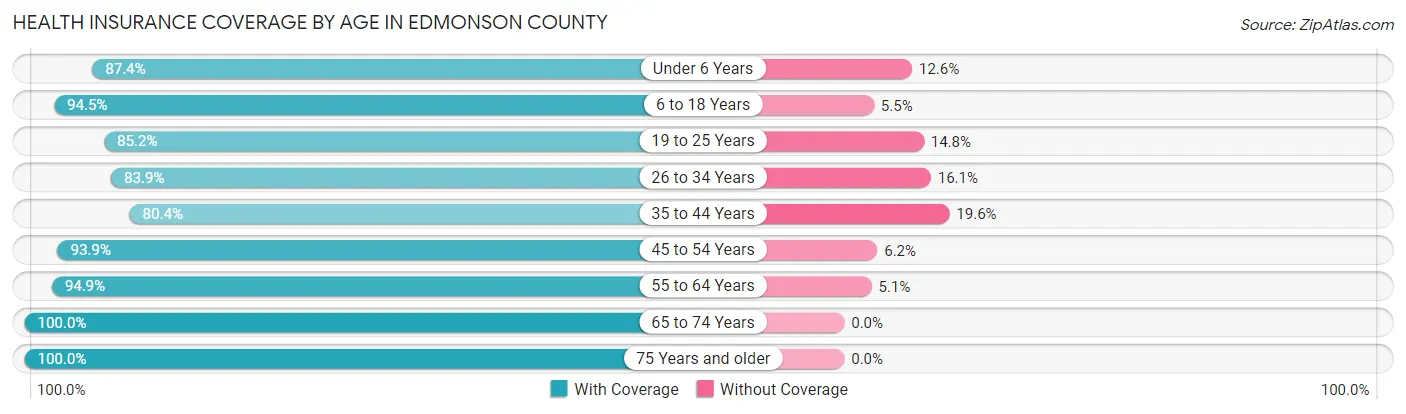
| Age Bracket | With Coverage | Without Coverage |
| Under 6 Years | 532 (87.4%) | 77 (12.6%) |
| 6 to 18 Years | 1,695 (94.5%) | 99 (5.5%) |
| 19 to 25 Years | 845 (85.2%) | 147 (14.8%) |
| 26 to 34 Years | 1,014 (83.9%) | 195 (16.1%) |
| 35 to 44 Years | 1,194 (80.4%) | 291 (19.6%) |
| 45 to 54 Years | 1,541 (93.9%) | 101 (6.1%) |
| 55 to 64 Years | 1,754 (94.9%) | 94 (5.1%) |
| 65 to 74 Years | 1,524 (100.0%) | 0 (0.0%) |
| 75 Years and older | 990 (100.0%) | 0 (0.0%) |
| Total | 11,089 (91.7%) | 1,004 (8.3%) |
Health Insurance Coverage by Citizenship Status in Edmonson County
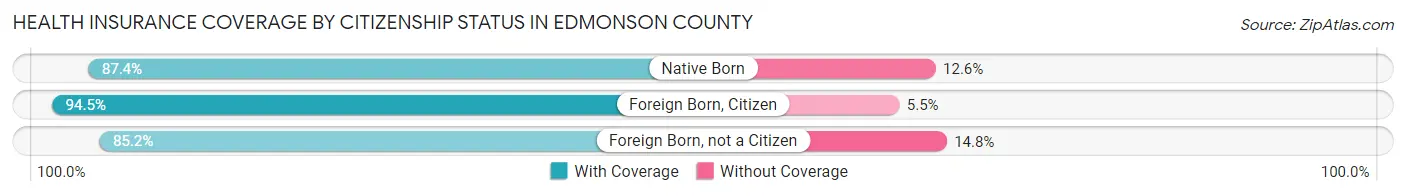
| Citizenship Status | With Coverage | Without Coverage |
| Native Born | 532 (87.4%) | 77 (12.6%) |
| Foreign Born, Citizen | 1,695 (94.5%) | 99 (5.5%) |
| Foreign Born, not a Citizen | 845 (85.2%) | 147 (14.8%) |
Health Insurance Coverage by Household Income in Edmonson County
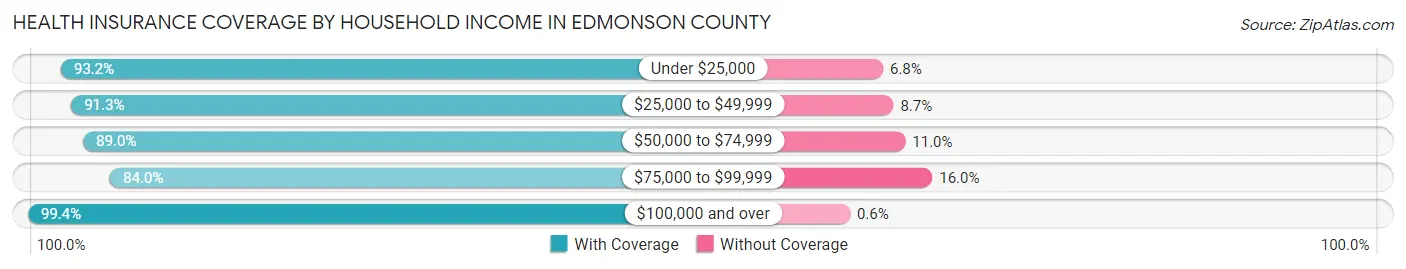
| Household Income | With Coverage | Without Coverage |
| Under $25,000 | 1,620 (93.2%) | 118 (6.8%) |
| $25,000 to $49,999 | 2,641 (91.3%) | 253 (8.7%) |
| $50,000 to $74,999 | 2,045 (89.0%) | 252 (11.0%) |
| $75,000 to $99,999 | 1,803 (84.0%) | 344 (16.0%) |
| $100,000 and over | 2,827 (99.4%) | 17 (0.6%) |
Public vs Private Health Insurance Coverage by Age in Edmonson County
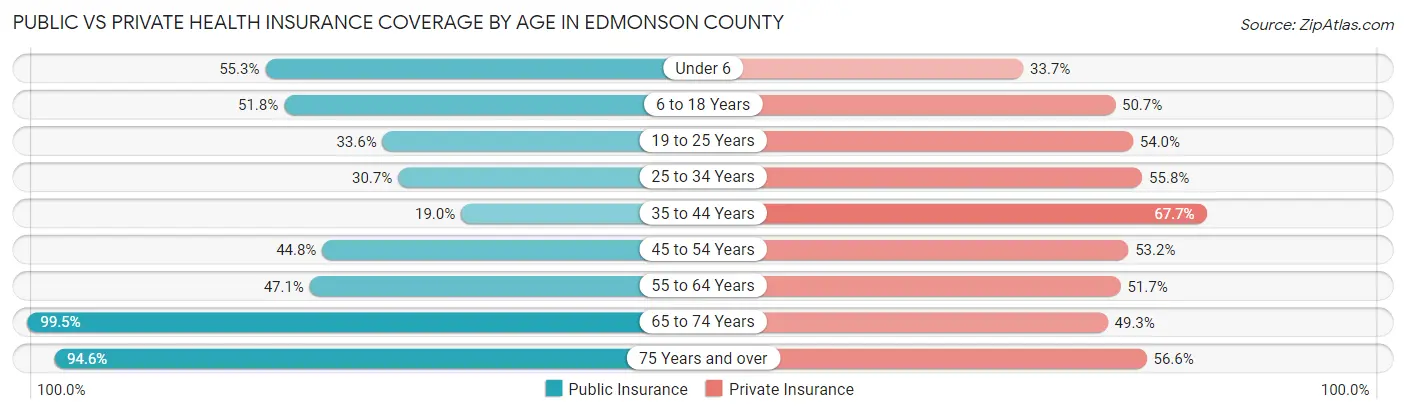
| Age Bracket | Public Insurance | Private Insurance |
| Under 6 | 337 (55.3%) | 205 (33.7%) |
| 6 to 18 Years | 930 (51.8%) | 910 (50.7%) |
| 19 to 25 Years | 333 (33.6%) | 536 (54.0%) |
| 25 to 34 Years | 371 (30.7%) | 674 (55.7%) |
| 35 to 44 Years | 282 (19.0%) | 1,005 (67.7%) |
| 45 to 54 Years | 735 (44.8%) | 873 (53.2%) |
| 55 to 64 Years | 870 (47.1%) | 956 (51.7%) |
| 65 to 74 Years | 1,516 (99.5%) | 752 (49.3%) |
| 75 Years and over | 936 (94.6%) | 560 (56.6%) |
| Total | 6,310 (52.2%) | 6,471 (53.5%) |
Disability Status by Sex by Age in Edmonson County
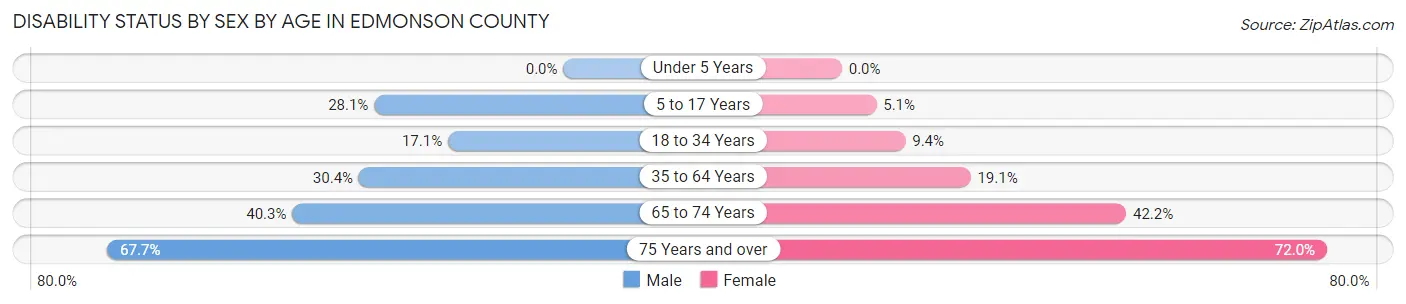
| Age Bracket | Male | Female |
| Under 5 Years | 0 (0.0%) | 0 (0.0%) |
| 5 to 17 Years | 268 (28.1%) | 40 (5.1%) |
| 18 to 34 Years | 210 (17.1%) | 105 (9.4%) |
| 35 to 64 Years | 756 (30.4%) | 475 (19.1%) |
| 65 to 74 Years | 293 (40.3%) | 336 (42.2%) |
| 75 Years and over | 317 (67.7%) | 376 (72.0%) |
Disability Class by Sex by Age in Edmonson County
Disability Class: Hearing Difficulty
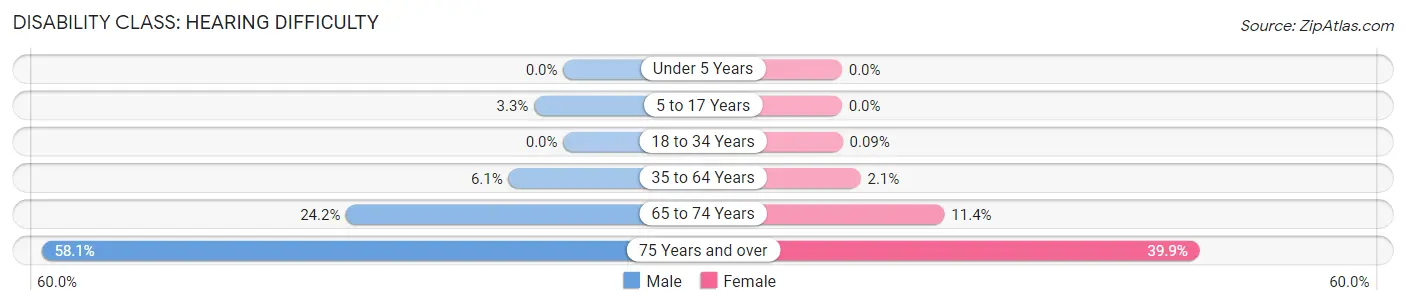
| Age Bracket | Male | Female |
| Under 5 Years | 0 (0.0%) | 0 (0.0%) |
| 5 to 17 Years | 31 (3.3%) | 0 (0.0%) |
| 18 to 34 Years | 0 (0.0%) | 1 (0.1%) |
| 35 to 64 Years | 152 (6.1%) | 52 (2.1%) |
| 65 to 74 Years | 176 (24.2%) | 91 (11.4%) |
| 75 Years and over | 272 (58.1%) | 208 (39.9%) |
Disability Class: Vision Difficulty
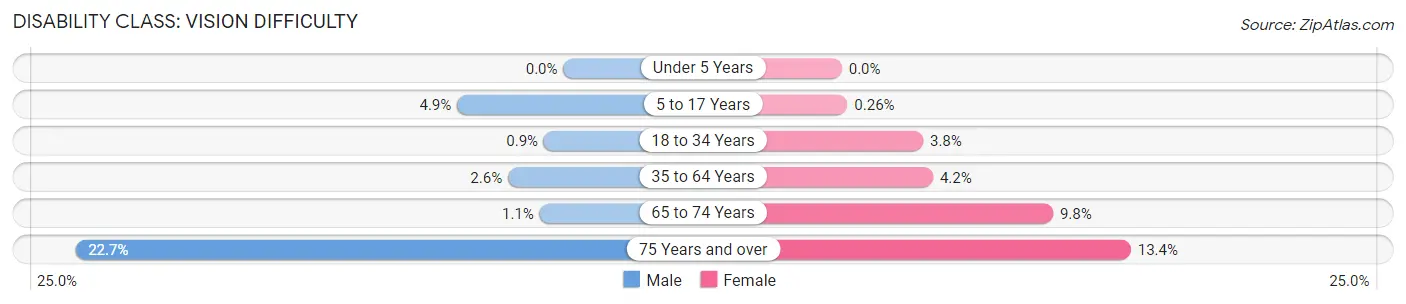
| Age Bracket | Male | Female |
| Under 5 Years | 0 (0.0%) | 0 (0.0%) |
| 5 to 17 Years | 47 (4.9%) | 2 (0.3%) |
| 18 to 34 Years | 11 (0.9%) | 42 (3.8%) |
| 35 to 64 Years | 64 (2.6%) | 105 (4.2%) |
| 65 to 74 Years | 8 (1.1%) | 78 (9.8%) |
| 75 Years and over | 106 (22.7%) | 70 (13.4%) |
Disability Class: Cognitive Difficulty
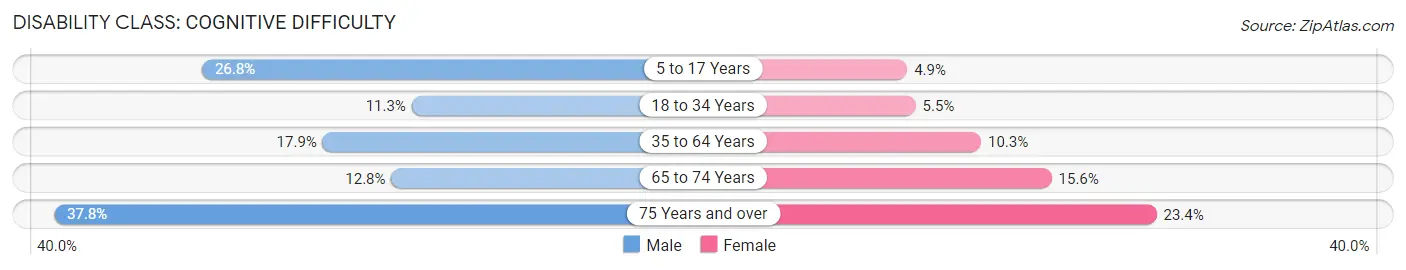
| Age Bracket | Male | Female |
| 5 to 17 Years | 256 (26.8%) | 38 (4.9%) |
| 18 to 34 Years | 138 (11.3%) | 61 (5.5%) |
| 35 to 64 Years | 445 (17.9%) | 257 (10.3%) |
| 65 to 74 Years | 93 (12.8%) | 124 (15.6%) |
| 75 Years and over | 177 (37.8%) | 122 (23.4%) |
Disability Class: Ambulatory Difficulty
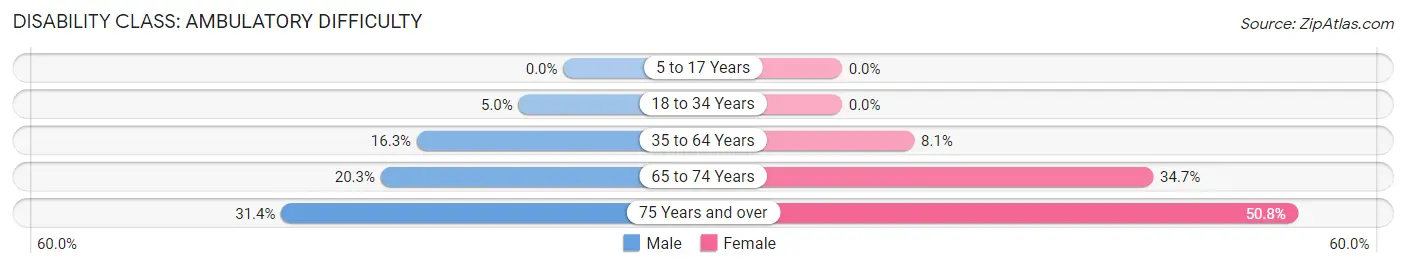
| Age Bracket | Male | Female |
| 5 to 17 Years | 0 (0.0%) | 0 (0.0%) |
| 18 to 34 Years | 61 (5.0%) | 0 (0.0%) |
| 35 to 64 Years | 406 (16.3%) | 200 (8.1%) |
| 65 to 74 Years | 148 (20.3%) | 276 (34.7%) |
| 75 Years and over | 147 (31.4%) | 265 (50.8%) |
Disability Class: Self-Care Difficulty
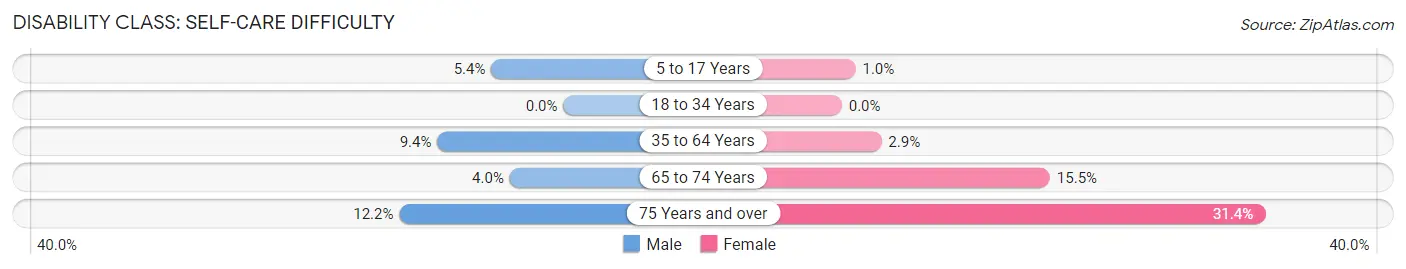
| Age Bracket | Male | Female |
| 5 to 17 Years | 51 (5.3%) | 8 (1.0%) |
| 18 to 34 Years | 0 (0.0%) | 0 (0.0%) |
| 35 to 64 Years | 233 (9.4%) | 73 (2.9%) |
| 65 to 74 Years | 29 (4.0%) | 123 (15.4%) |
| 75 Years and over | 57 (12.2%) | 164 (31.4%) |
Technology Access in Edmonson County
Computing Device Access in Edmonson County
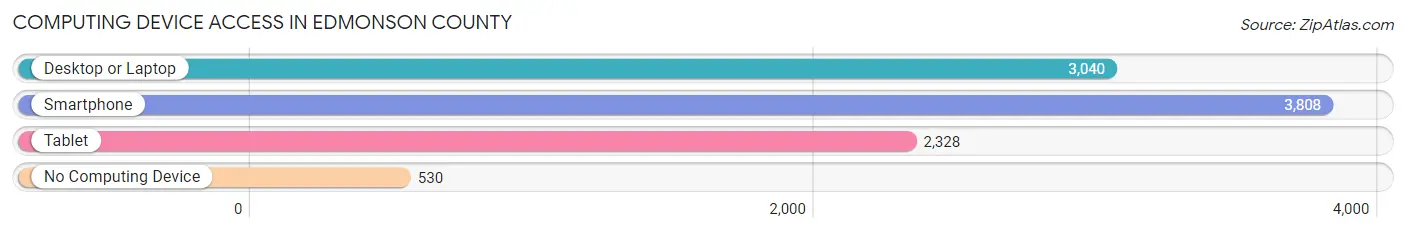
| Device Type | # Households | % Households |
| Desktop or Laptop | 3,040 | 63.9% |
| Smartphone | 3,808 | 80.0% |
| Tablet | 2,328 | 48.9% |
| No Computing Device | 530 | 11.1% |
| Total | 4,760 | 100.0% |
Internet Access in Edmonson County
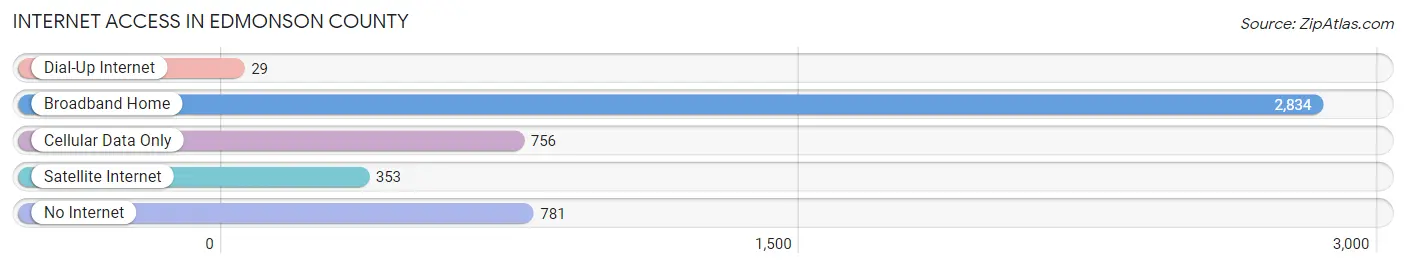
| Internet Type | # Households | % Households |
| Dial-Up Internet | 29 | 0.6% |
| Broadband Home | 2,834 | 59.5% |
| Cellular Data Only | 756 | 15.9% |
| Satellite Internet | 353 | 7.4% |
| No Internet | 781 | 16.4% |
| Total | 4,760 | 100.0% |
Edmonson County Summary
Edmonson County is located in the south-central region of Kentucky, and is part of the Barren River Area Development District. The county was established in 1825 and is named after Captain John Edmonson, a Revolutionary War veteran. The county seat is Brownsville. As of the 2010 census, the population was 12,161.
Geography
Edmonson County is located in the Pennyroyal Plateau region of Kentucky, and is bordered by Grayson County to the north, Hart County to the east, Warren County to the south, and Butler and Ohio Counties to the west. The county has a total area of 286 square miles, of which 285 square miles is land and 1 square mile is water. The terrain is mostly hilly, with some flat areas in the valleys. The highest point in the county is located at the intersection of KY-259 and KY-70, at an elevation of 890 feet.
The county is drained by the Green River, which flows through the western part of the county. The Green River is a tributary of the Ohio River, and is the longest river in the state of Kentucky. Other major waterways in the county include the Barren River, Nolin River, and Rough River.
Climate
Edmonson County has a humid subtropical climate, with hot, humid summers and mild winters. The average annual temperature is 59°F, and the average annual precipitation is 45 inches.
Demographics
As of the 2010 census, there were 12,161 people, 4,845 households, and 3,521 families residing in the county. The population density was 42.6 people per square mile. The racial makeup of the county was 97.2% White, 0.9% Black or African American, 0.2% Native American, 0.2% Asian, 0.2% from other races, and 1.3% from two or more races. 1.3% of the population were Hispanic or Latino of any race.
The median income for a household in the county was $35,945, and the median income for a family was $41,945. The per capita income for the county was $17,845. About 17.2% of the population were below the poverty line.
Economy
The economy of Edmonson County is largely based on agriculture and tourism. The county is home to several large farms, and the main crops grown in the county are corn, soybeans, wheat, and hay. The county is also home to several wineries, and is a popular destination for wine-tasting tours.
The county is also home to several manufacturing companies, including a furniture factory, a plastics factory, and a metal fabrication plant. The county is also home to several small businesses, including restaurants, retail stores, and service providers.
The county is served by two major highways, KY-259 and KY-70. The county is also served by the Barren River Regional Airport, which is located in the city of Brownsville.
Conclusion
Edmonson County is a rural county located in the south-central region of Kentucky. The county is home to a diverse economy, with agriculture, manufacturing, and tourism being the main industries. The county is served by two major highways, and is home to several small businesses. The county is also home to several wineries, and is a popular destination for wine-tasting tours.
Common Questions
What is Per Capita Income in Edmonson County?
Per Capita income in Edmonson County is $26,781.
What is the Median Family Income in Edmonson County?
Median Family Income in Edmonson County is $66,378.
What is the Median Household income in Edmonson County?
Median Household Income in Edmonson County is $53,029.
What is Income or Wage Gap in Edmonson County?
Income or Wage Gap in Edmonson County is 38.1%.
Women in Edmonson County earn 61.9 cents for every dollar earned by a man.
What is Inequality or Gini Index in Edmonson County?
Inequality or Gini Index in Edmonson County is 0.42.
What is the Total Population of Edmonson County?
Total Population of Edmonson County is 12,179.
What is the Total Male Population of Edmonson County?
Total Male Population of Edmonson County is 6,134.
What is the Total Female Population of Edmonson County?
Total Female Population of Edmonson County is 6,045.
What is the Ratio of Males per 100 Females in Edmonson County?
There are 101.47 Males per 100 Females in Edmonson County.
What is the Ratio of Females per 100 Males in Edmonson County?
There are 98.55 Females per 100 Males in Edmonson County.
What is the Median Population Age in Edmonson County?
Median Population Age in Edmonson County is 45.0 Years.
What is the Average Family Size in Edmonson County
Average Family Size in Edmonson County is 3.0 People.
What is the Average Household Size in Edmonson County
Average Household Size in Edmonson County is 2.5 People.
How Large is the Labor Force in Edmonson County?
There are 5,073 People in the Labor Forcein in Edmonson County.
What is the Percentage of People in the Labor Force in Edmonson County?
49.8% of People are in the Labor Force in Edmonson County.
What is the Unemployment Rate in Edmonson County?
Unemployment Rate in Edmonson County is 6.8%.