Crittenden County, KY Map & Demographics
Crittenden County Map
Crittenden County Overview
$28,035
PER CAPITA INCOME
$75,214
AVG FAMILY INCOME
$45,810
AVG HOUSEHOLD INCOME
46.0%
WAGE / INCOME GAP [ % ]
54.0¢/ $1
WAGE / INCOME GAP [ $ ]
0.47
INEQUALITY / GINI INDEX
8,979
TOTAL POPULATION
4,618
MALE POPULATION
4,361
FEMALE POPULATION
105.89
MALES / 100 FEMALES
94.43
FEMALES / 100 MALES
43.4
MEDIAN AGE
3.2
AVG FAMILY SIZE
2.5
AVG HOUSEHOLD SIZE
3,611
LABOR FORCE [ PEOPLE ]
50.2%
PERCENT IN LABOR FORCE
3.4%
UNEMPLOYMENT RATE
Crittenden County Area Codes
Income in Crittenden County
Income Overview in Crittenden County
Per Capita Income in Crittenden County is $28,035, while median incomes of families and households are $75,214 and $45,810 respectively.
| Characteristic | Number | Measure |
| Per Capita Income | 8,979 | $28,035 |
| Median Family Income | 2,182 | $75,214 |
| Mean Family Income | 2,182 | $83,759 |
| Median Household Income | 3,495 | $45,810 |
| Mean Household Income | 3,495 | $67,820 |
| Income Deficit | 2,182 | $0 |
| Wage / Income Gap (%) | 8,979 | 45.95% |
| Wage / Income Gap ($) | 8,979 | 54.05¢ per $1 |
| Gini / Inequality Index | 8,979 | 0.47 |
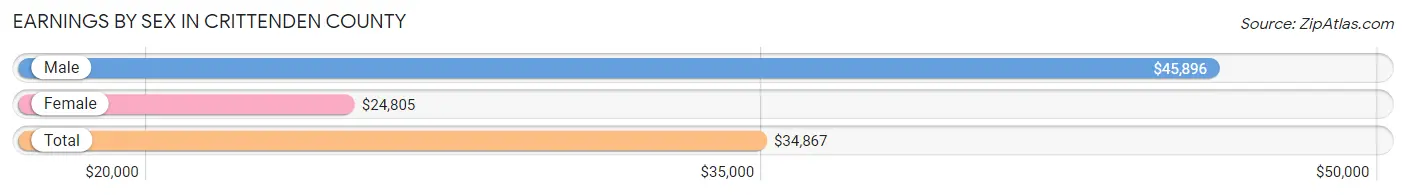
Earnings by Sex in Crittenden County
Average Earnings in Crittenden County are $34,867, $45,896 for men and $24,805 for women, a difference of 46.0%.
| Sex | Number | Average Earnings |
| Male | 2,217 (57.8%) | $45,896 |
| Female | 1,619 (42.2%) | $24,805 |
| Total | 3,836 (100.0%) | $34,867 |
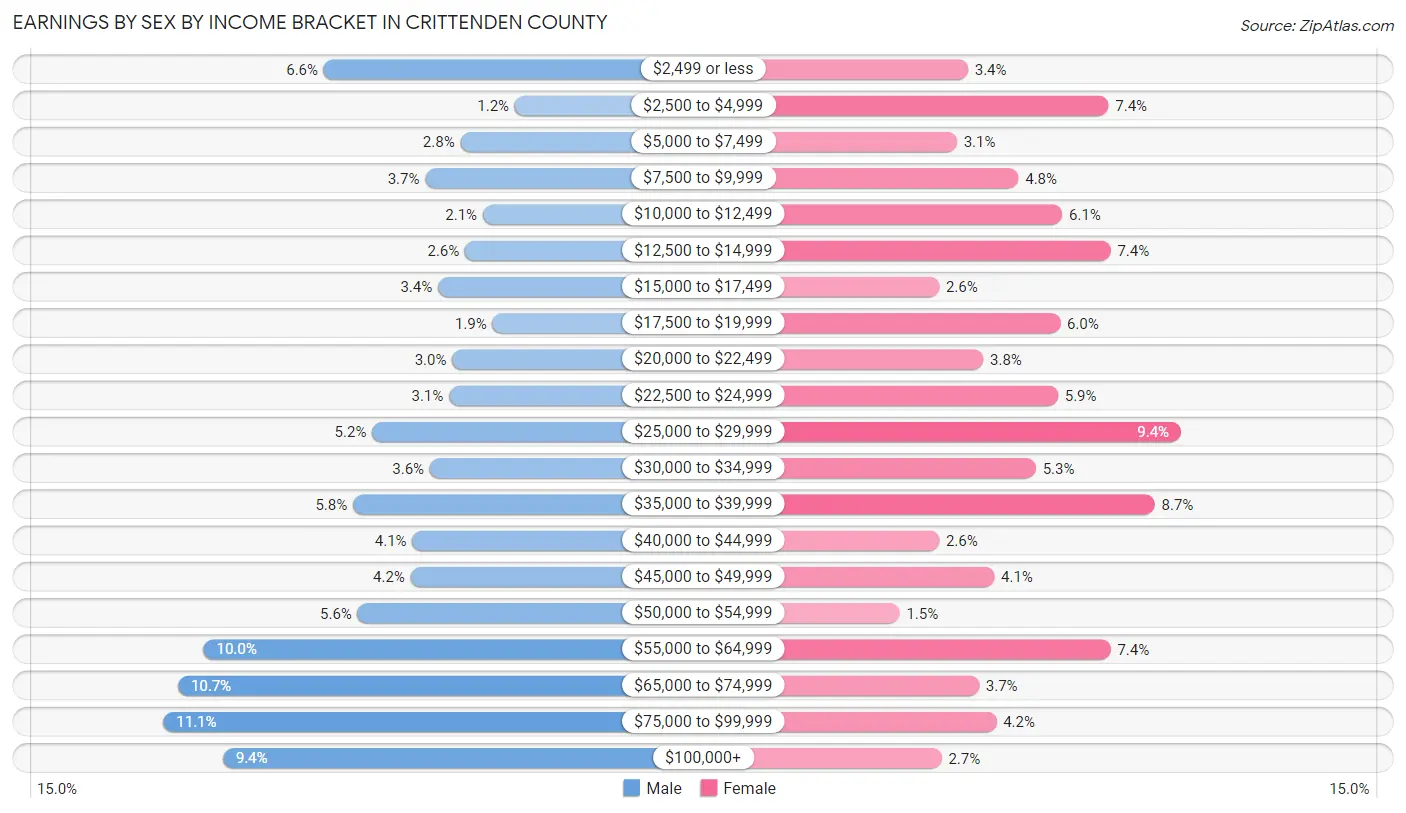
Earnings by Sex by Income Bracket in Crittenden County
The most common earnings brackets in Crittenden County are $75,000 to $99,999 for men (246 | 11.1%) and $25,000 to $29,999 for women (152 | 9.4%).
| Income | Male | Female |
| $2,499 or less | 146 (6.6%) | 55 (3.4%) |
| $2,500 to $4,999 | 27 (1.2%) | 119 (7.3%) |
| $5,000 to $7,499 | 61 (2.8%) | 50 (3.1%) |
| $7,500 to $9,999 | 83 (3.7%) | 78 (4.8%) |
| $10,000 to $12,499 | 47 (2.1%) | 98 (6.0%) |
| $12,500 to $14,999 | 58 (2.6%) | 120 (7.4%) |
| $15,000 to $17,499 | 75 (3.4%) | 42 (2.6%) |
| $17,500 to $19,999 | 41 (1.8%) | 97 (6.0%) |
| $20,000 to $22,499 | 66 (3.0%) | 62 (3.8%) |
| $22,500 to $24,999 | 68 (3.1%) | 96 (5.9%) |
| $25,000 to $29,999 | 116 (5.2%) | 152 (9.4%) |
| $30,000 to $34,999 | 80 (3.6%) | 86 (5.3%) |
| $35,000 to $39,999 | 128 (5.8%) | 140 (8.6%) |
| $40,000 to $44,999 | 91 (4.1%) | 42 (2.6%) |
| $45,000 to $49,999 | 92 (4.2%) | 67 (4.1%) |
| $50,000 to $54,999 | 125 (5.6%) | 24 (1.5%) |
| $55,000 to $64,999 | 221 (10.0%) | 120 (7.4%) |
| $65,000 to $74,999 | 237 (10.7%) | 60 (3.7%) |
| $75,000 to $99,999 | 246 (11.1%) | 68 (4.2%) |
| $100,000+ | 209 (9.4%) | 43 (2.7%) |
| Total | 2,217 (100.0%) | 1,619 (100.0%) |
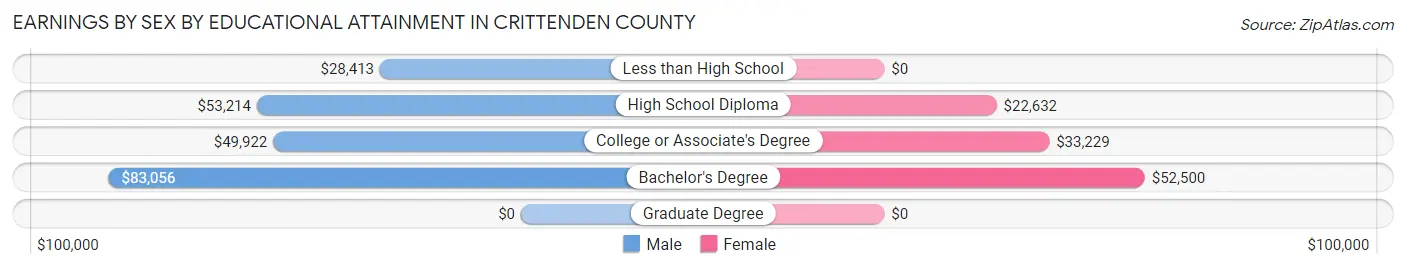
Earnings by Sex by Educational Attainment in Crittenden County
Average earnings in Crittenden County are $51,543 for men and $28,483 for women, a difference of 44.7%. Men with an educational attainment of bachelor's degree enjoy the highest average annual earnings of $83,056, while those with less than high school education earn the least with $28,413. Women with an educational attainment of bachelor's degree earn the most with the average annual earnings of $52,500, while those with high school diploma education have the smallest earnings of $22,632.
| Educational Attainment | Male Income | Female Income |
| Less than High School | $28,413 | $0 |
| High School Diploma | $53,214 | $22,632 |
| College or Associate's Degree | $49,922 | $33,229 |
| Bachelor's Degree | $83,056 | $52,500 |
| Graduate Degree | - | - |
| Total | $51,543 | $28,483 |
Family Income in Crittenden County
Family Income Brackets in Crittenden County
According to the Crittenden County family income data, there are 469 families falling into the $100,000 to $149,999 income range, which is the most common income bracket and makes up 21.5% of all families. Conversely, the $10,000 to $14,999 income bracket is the least frequent group with only 46 families (2.1%) belonging to this category.
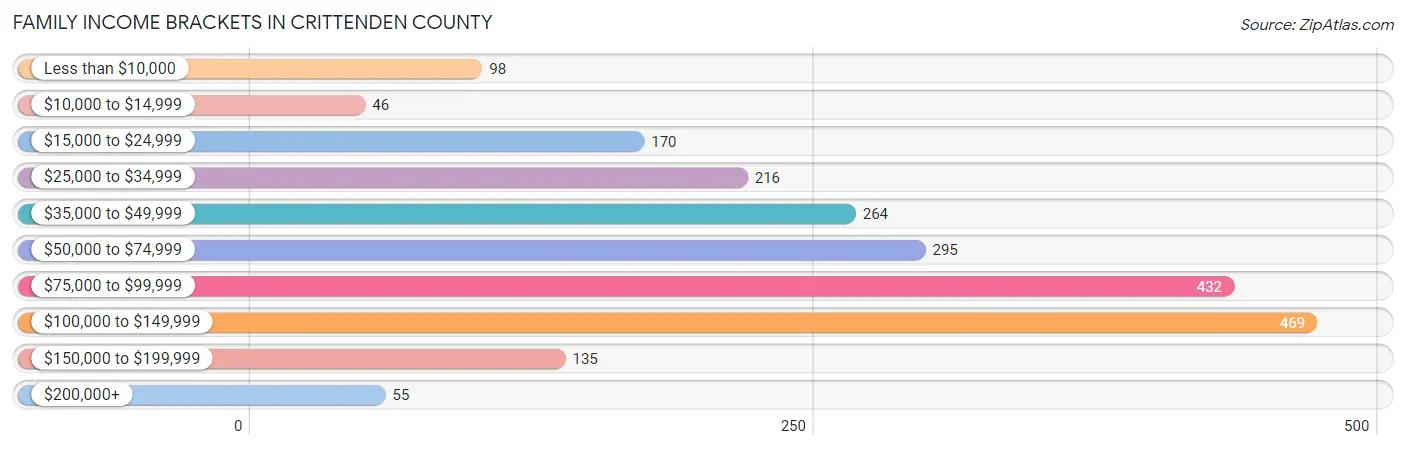
| Income Bracket | # Families | % Families |
| Less than $10,000 | 98 | 4.5% |
| $10,000 to $14,999 | 46 | 2.1% |
| $15,000 to $24,999 | 170 | 7.8% |
| $25,000 to $34,999 | 216 | 9.9% |
| $35,000 to $49,999 | 264 | 12.1% |
| $50,000 to $74,999 | 295 | 13.5% |
| $75,000 to $99,999 | 432 | 19.8% |
| $100,000 to $149,999 | 469 | 21.5% |
| $150,000 to $199,999 | 135 | 6.2% |
| $200,000+ | 55 | 2.5% |
Family Income by Famaliy Size in Crittenden County
6-person families (113 | 5.2%) account for the highest median family income in Crittenden County with $112,565 per family, while 2-person families (1,071 | 49.1%) have the highest median income of $29,594 per family member.
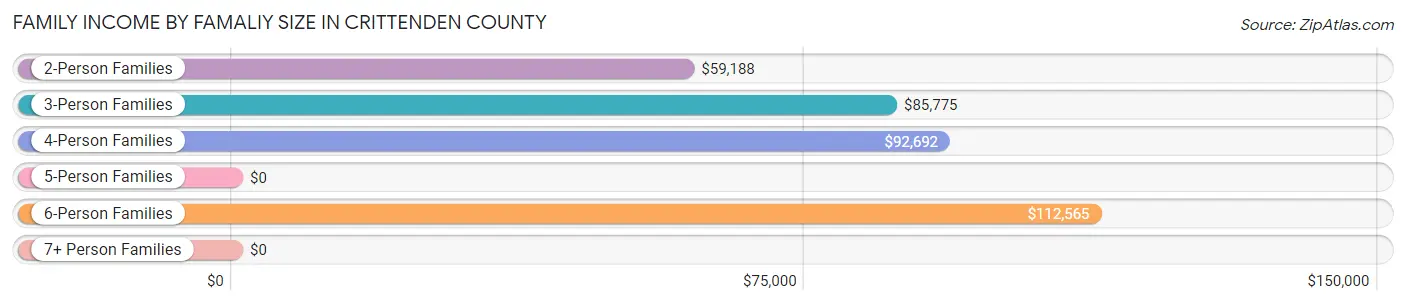
| Income Bracket | # Families | Median Income |
| 2-Person Families | 1,071 (49.1%) | $59,188 |
| 3-Person Families | 575 (26.4%) | $85,775 |
| 4-Person Families | 246 (11.3%) | $92,692 |
| 5-Person Families | 138 (6.3%) | $0 |
| 6-Person Families | 113 (5.2%) | $112,565 |
| 7+ Person Families | 39 (1.8%) | $0 |
| Total | 2,182 (100.0%) | $75,214 |
Family Income by Number of Earners in Crittenden County
The median family income in Crittenden County is $75,214, with families comprising 3+ earners (119) having the highest median family income of $109,750, while families with no earners (427) have the lowest median family income of $32,813, accounting for 5.4% and 19.6% of families, respectively.
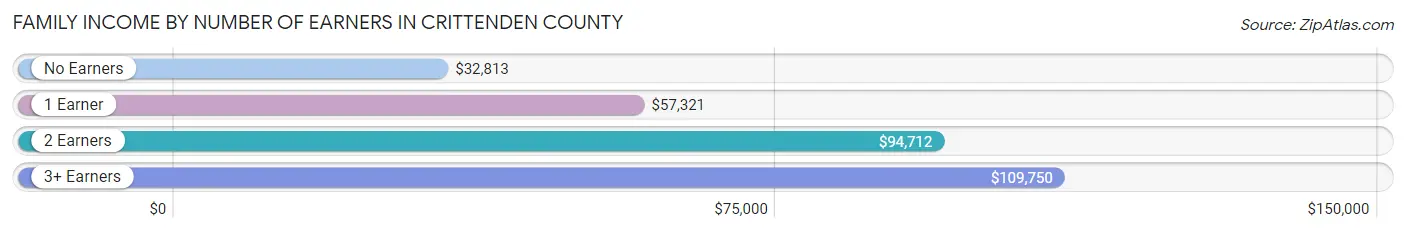
| Number of Earners | # Families | Median Income |
| No Earners | 427 (19.6%) | $32,813 |
| 1 Earner | 889 (40.7%) | $57,321 |
| 2 Earners | 747 (34.2%) | $94,712 |
| 3+ Earners | 119 (5.4%) | $109,750 |
| Total | 2,182 (100.0%) | $75,214 |
Household Income in Crittenden County
Household Income Brackets in Crittenden County
With 535 households falling in the category, the $75,000 to $99,999 income range is the most frequent in Crittenden County, accounting for 15.3% of all households. In contrast, only 87 households (2.5%) fall into the $200,000+ income bracket, making it the least populous group.
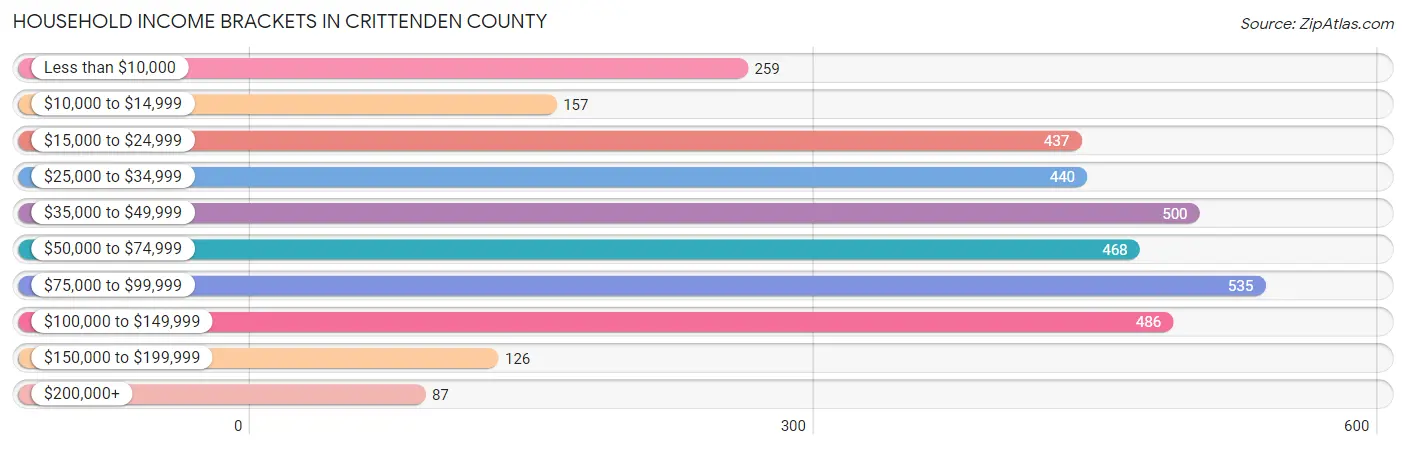
| Income Bracket | # Households | % Households |
| Less than $10,000 | 259 | 7.4% |
| $10,000 to $14,999 | 157 | 4.5% |
| $15,000 to $24,999 | 437 | 12.5% |
| $25,000 to $34,999 | 440 | 12.6% |
| $35,000 to $49,999 | 500 | 14.3% |
| $50,000 to $74,999 | 468 | 13.4% |
| $75,000 to $99,999 | 535 | 15.3% |
| $100,000 to $149,999 | 486 | 13.9% |
| $150,000 to $199,999 | 126 | 3.6% |
| $200,000+ | 87 | 2.5% |
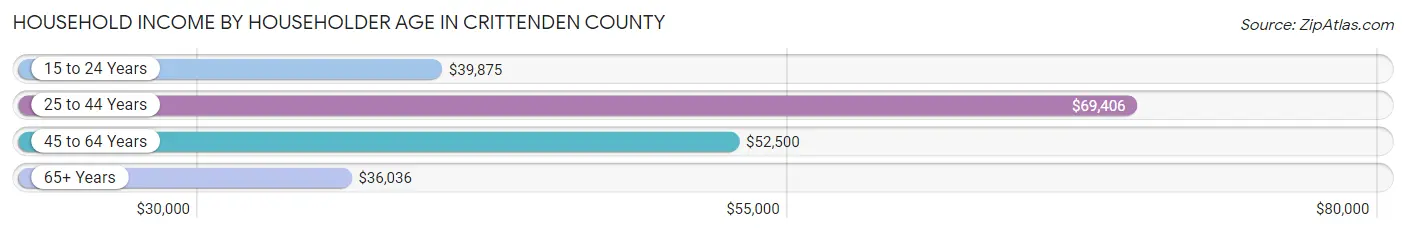
Household Income by Householder Age in Crittenden County
The median household income in Crittenden County is $45,810, with the highest median household income of $69,406 found in the 25 to 44 years age bracket for the primary householder. A total of 881 households (25.2%) fall into this category. Meanwhile, the 65+ years age bracket for the primary householder has the lowest median household income of $36,036, with 1,185 households (33.9%) in this group.
| Income Bracket | # Households | Median Income |
| 15 to 24 Years | 99 (2.8%) | $39,875 |
| 25 to 44 Years | 881 (25.2%) | $69,406 |
| 45 to 64 Years | 1,330 (38.1%) | $52,500 |
| 65+ Years | 1,185 (33.9%) | $36,036 |
| Total | 3,495 (100.0%) | $45,810 |
Poverty in Crittenden County
Income Below Poverty by Sex and Age in Crittenden County
With 17.0% poverty level for males and 18.9% for females among the residents of Crittenden County, under 5 year old males and 16 and 17 year old females are the most vulnerable to poverty, with 174 males (75.3%) and 41 females (53.9%) in their respective age groups living below the poverty level.
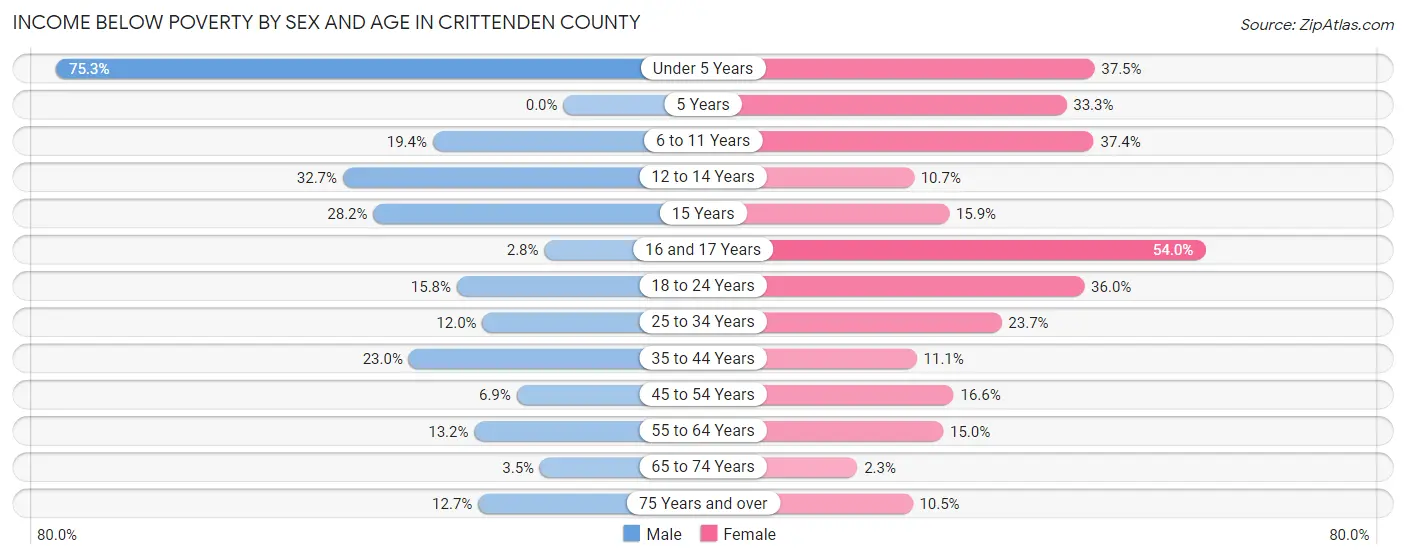
| Age Bracket | Male | Female |
| Under 5 Years | 174 (75.3%) | 90 (37.5%) |
| 5 Years | 0 (0.0%) | 28 (33.3%) |
| 6 to 11 Years | 70 (19.4%) | 114 (37.4%) |
| 12 to 14 Years | 74 (32.7%) | 11 (10.7%) |
| 15 Years | 22 (28.2%) | 14 (15.9%) |
| 16 and 17 Years | 4 (2.8%) | 41 (53.9%) |
| 18 to 24 Years | 52 (15.8%) | 104 (36.0%) |
| 25 to 34 Years | 63 (12.0%) | 100 (23.7%) |
| 35 to 44 Years | 121 (23.0%) | 54 (11.1%) |
| 45 to 54 Years | 39 (6.9%) | 85 (16.6%) |
| 55 to 64 Years | 82 (13.2%) | 104 (15.0%) |
| 65 to 74 Years | 18 (3.5%) | 12 (2.3%) |
| 75 Years and over | 41 (12.7%) | 43 (10.5%) |
| Total | 760 (17.0%) | 800 (18.9%) |
Income Above Poverty by Sex and Age in Crittenden County
According to the poverty statistics in Crittenden County, males aged 5 years and females aged 65 to 74 years are the age groups that are most secure financially, with 100.0% of males and 97.7% of females in these age groups living above the poverty line.
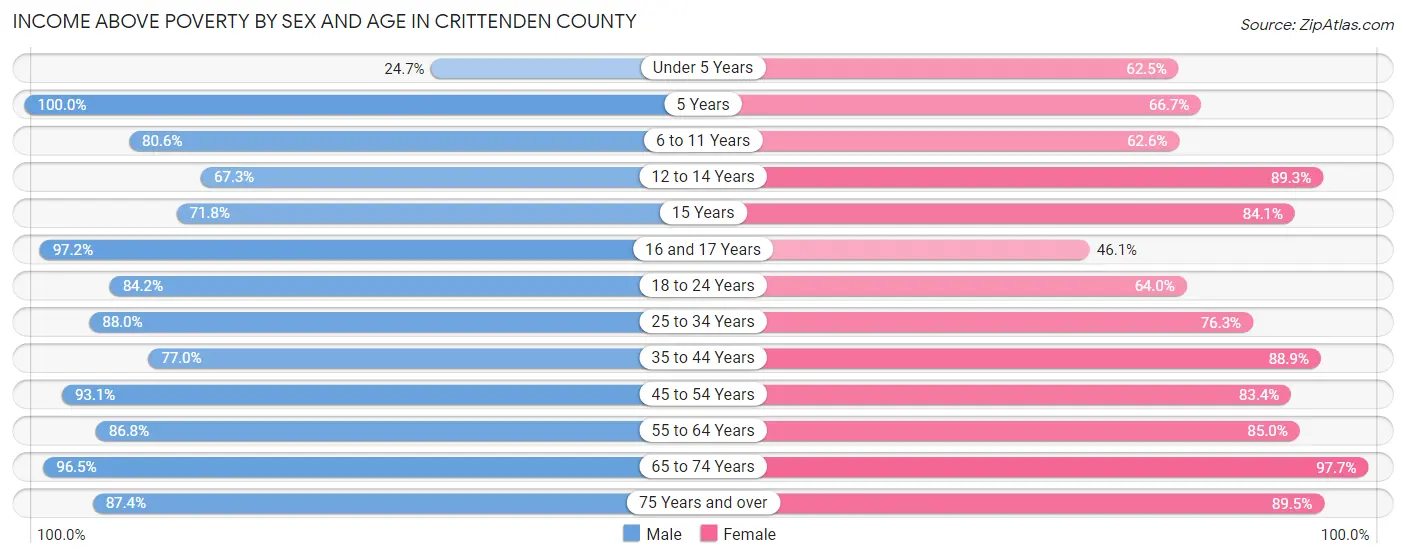
| Age Bracket | Male | Female |
| Under 5 Years | 57 (24.7%) | 150 (62.5%) |
| 5 Years | 38 (100.0%) | 56 (66.7%) |
| 6 to 11 Years | 291 (80.6%) | 191 (62.6%) |
| 12 to 14 Years | 152 (67.3%) | 92 (89.3%) |
| 15 Years | 56 (71.8%) | 74 (84.1%) |
| 16 and 17 Years | 138 (97.2%) | 35 (46.1%) |
| 18 to 24 Years | 277 (84.2%) | 185 (64.0%) |
| 25 to 34 Years | 461 (88.0%) | 322 (76.3%) |
| 35 to 44 Years | 406 (77.0%) | 432 (88.9%) |
| 45 to 54 Years | 523 (93.1%) | 427 (83.4%) |
| 55 to 64 Years | 538 (86.8%) | 588 (85.0%) |
| 65 to 74 Years | 499 (96.5%) | 512 (97.7%) |
| 75 Years and over | 283 (87.4%) | 367 (89.5%) |
| Total | 3,719 (83.0%) | 3,431 (81.1%) |
Income Below Poverty Among Married-Couple Families in Crittenden County
The poverty statistics for married-couple families in Crittenden County show that 8.7% or 145 of the total 1,666 families live below the poverty line. Families with 5 or more children have the highest poverty rate of 75.8%, comprising of 25 families. On the other hand, families with no children have the lowest poverty rate of 3.0%, which includes 31 families.
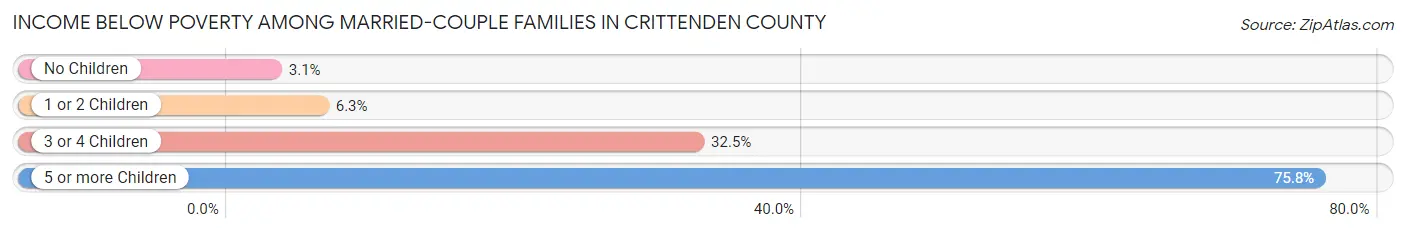
| Children | Above Poverty | Below Poverty |
| No Children | 984 (97.0%) | 31 (3.0%) |
| 1 or 2 Children | 400 (93.7%) | 27 (6.3%) |
| 3 or 4 Children | 129 (67.5%) | 62 (32.5%) |
| 5 or more Children | 8 (24.2%) | 25 (75.8%) |
| Total | 1,521 (91.3%) | 145 (8.7%) |
Income Below Poverty Among Single-Parent Households in Crittenden County
According to the poverty data in Crittenden County, 4.6% or 4 single-father households and 26.1% or 112 single-mother households are living below the poverty line. Among single-father households, those with no children have the highest poverty rate, with 4 households (6.8%) experiencing poverty. Likewise, among single-mother households, those with 5 or more children have the highest poverty rate, with 19 households (100.0%) falling below the poverty line.
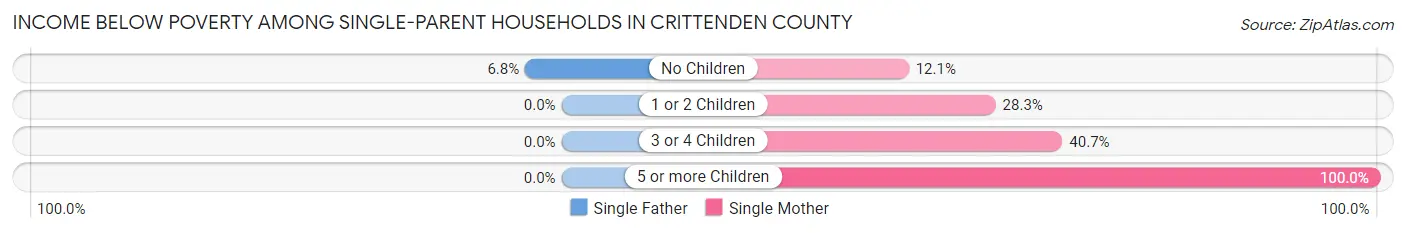
| Children | Single Father | Single Mother |
| No Children | 4 (6.8%) | 20 (12.1%) |
| 1 or 2 Children | 0 (0.0%) | 62 (28.3%) |
| 3 or 4 Children | 0 (0.0%) | 11 (40.7%) |
| 5 or more Children | 0 (0.0%) | 19 (100.0%) |
| Total | 4 (4.6%) | 112 (26.1%) |
Income Below Poverty Among Married-Couple vs Single-Parent Households in Crittenden County
The poverty data for Crittenden County shows that 145 of the married-couple family households (8.7%) and 116 of the single-parent households (22.5%) are living below the poverty level. Within the married-couple family households, those with 5 or more children have the highest poverty rate, with 25 households (75.8%) falling below the poverty line. Among the single-parent households, those with 5 or more children have the highest poverty rate, with 19 household (100.0%) living below poverty.
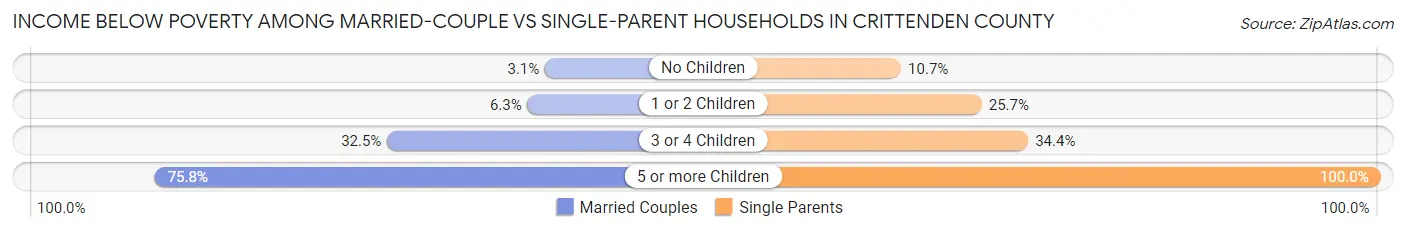
| Children | Married-Couple Families | Single-Parent Households |
| No Children | 31 (3.0%) | 24 (10.7%) |
| 1 or 2 Children | 27 (6.3%) | 62 (25.7%) |
| 3 or 4 Children | 62 (32.5%) | 11 (34.4%) |
| 5 or more Children | 25 (75.8%) | 19 (100.0%) |
| Total | 145 (8.7%) | 116 (22.5%) |
Race in Crittenden County
The most populous races in Crittenden County are White / Caucasian (8,596 | 95.7%), Hispanic or Latino (175 | 1.9%), and Two or more Races (148 | 1.7%).
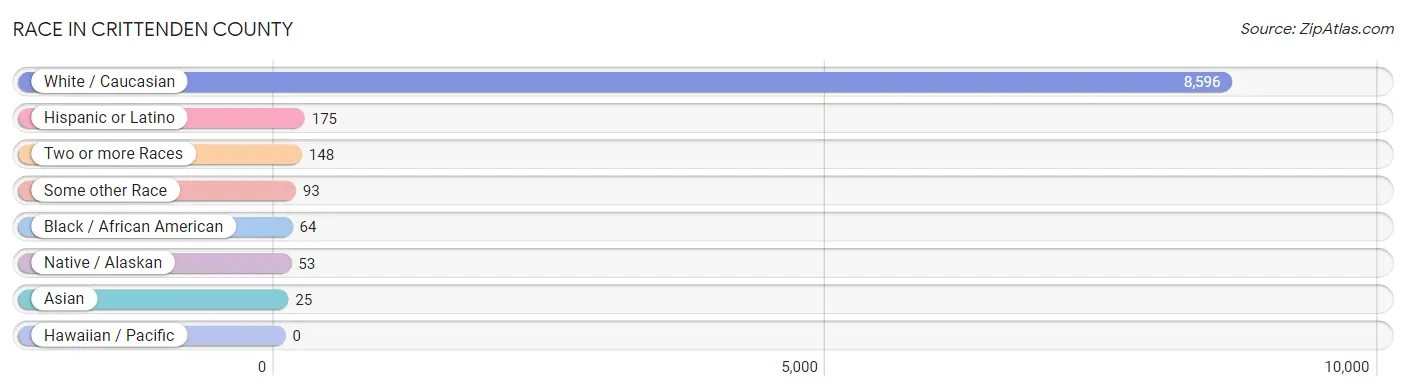
| Race | # Population | % Population |
| Asian | 25 | 0.3% |
| Black / African American | 64 | 0.7% |
| Hawaiian / Pacific | 0 | 0.0% |
| Hispanic or Latino | 175 | 1.9% |
| Native / Alaskan | 53 | 0.6% |
| White / Caucasian | 8,596 | 95.7% |
| Two or more Races | 148 | 1.7% |
| Some other Race | 93 | 1.0% |
| Total | 8,979 | 100.0% |
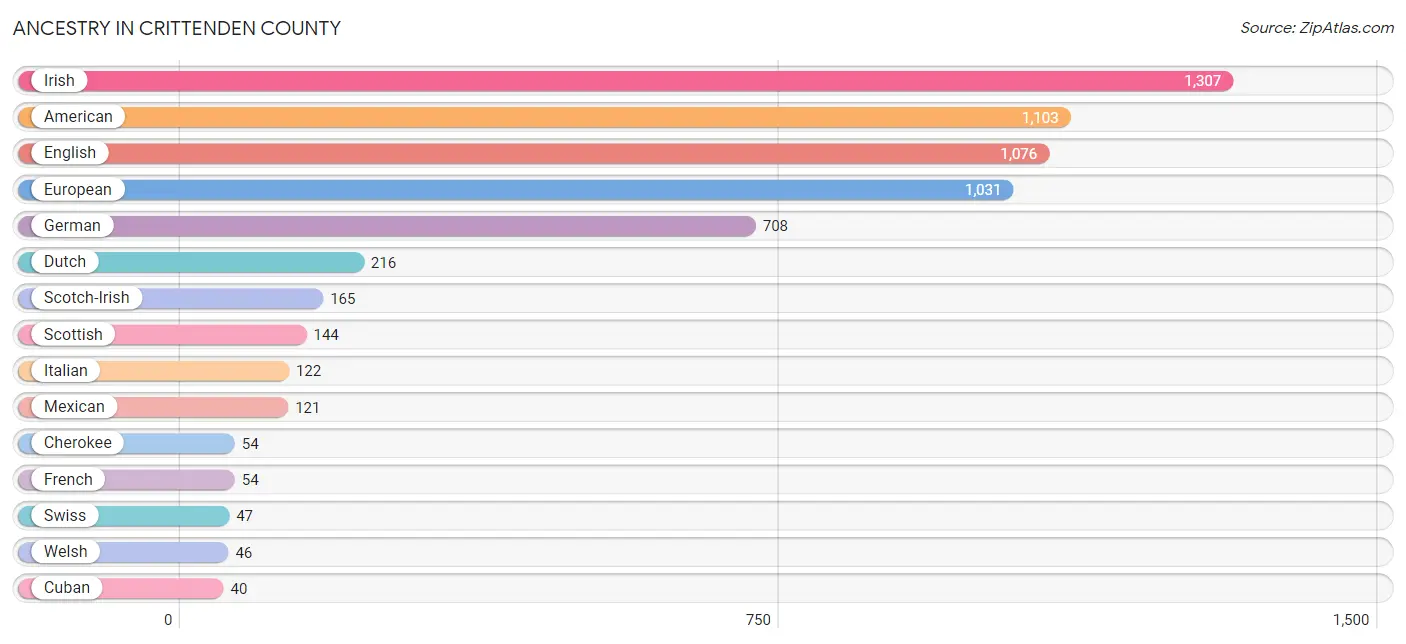
Ancestry in Crittenden County
The most populous ancestries reported in Crittenden County are Irish (1,307 | 14.6%), American (1,103 | 12.3%), English (1,076 | 12.0%), European (1,031 | 11.5%), and German (708 | 7.9%), together accounting for 58.2% of all Crittenden County residents.
| Ancestry | # Population | % Population |
| African | 27 | 0.3% |
| American | 1,103 | 12.3% |
| Belgian | 11 | 0.1% |
| Bhutanese | 25 | 0.3% |
| Blackfeet | 13 | 0.1% |
| British | 7 | 0.1% |
| Central American | 4 | 0.0% |
| Cherokee | 54 | 0.6% |
| Creek | 19 | 0.2% |
| Croatian | 27 | 0.3% |
| Cuban | 40 | 0.4% |
| Czech | 22 | 0.3% |
| Czechoslovakian | 7 | 0.1% |
| Dutch | 216 | 2.4% |
| Eastern European | 22 | 0.3% |
| English | 1,076 | 12.0% |
| European | 1,031 | 11.5% |
| French | 54 | 0.6% |
| French Canadian | 6 | 0.1% |
| German | 708 | 7.9% |
| Guatemalan | 4 | 0.0% |
| Hungarian | 39 | 0.4% |
| Irish | 1,307 | 14.6% |
| Italian | 122 | 1.4% |
| Jamaican | 3 | 0.0% |
| Mexican | 121 | 1.3% |
| Northern European | 3 | 0.0% |
| Norwegian | 8 | 0.1% |
| Polish | 22 | 0.3% |
| Russian | 10 | 0.1% |
| Scandinavian | 4 | 0.0% |
| Scotch-Irish | 165 | 1.8% |
| Scottish | 144 | 1.6% |
| Slovak | 33 | 0.4% |
| Slovene | 23 | 0.3% |
| Spanish | 10 | 0.1% |
| Subsaharan African | 27 | 0.3% |
| Swedish | 11 | 0.1% |
| Swiss | 47 | 0.5% |
| Welsh | 46 | 0.5% | View All 40 Rows |
Immigrants in Crittenden County
The most numerous immigrant groups reported in Crittenden County came from Eastern Europe (29 | 0.3%), Europe (29 | 0.3%), Asia (25 | 0.3%), Eastern Asia (25 | 0.3%), and Japan (25 | 0.3%), together accounting for 1.5% of all Crittenden County residents.
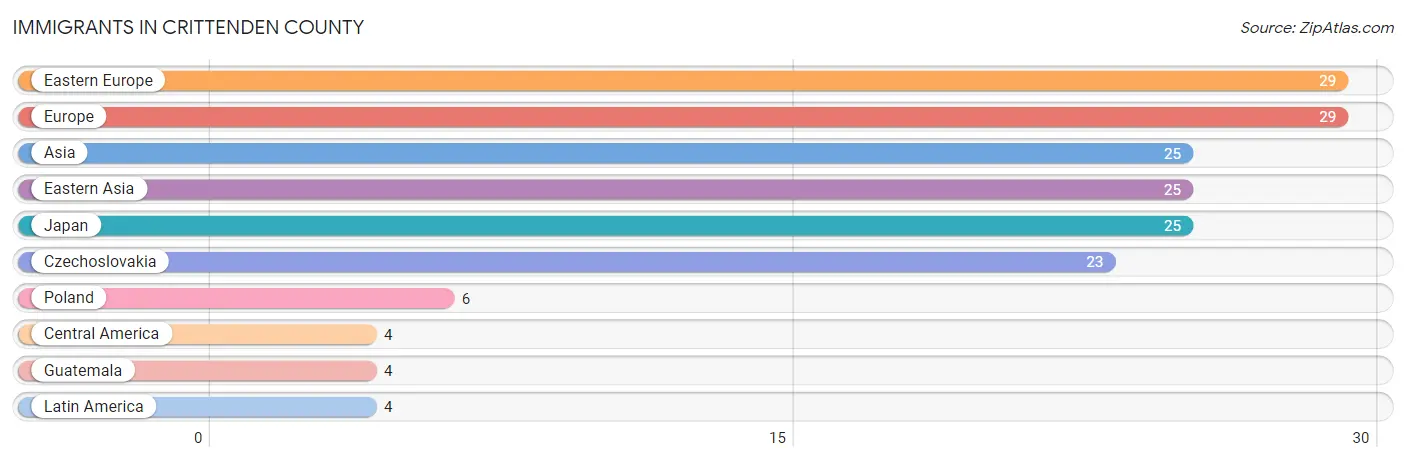
| Immigration Origin | # Population | % Population |
| Asia | 25 | 0.3% |
| Central America | 4 | 0.0% |
| Czechoslovakia | 23 | 0.3% |
| Eastern Asia | 25 | 0.3% |
| Eastern Europe | 29 | 0.3% |
| Europe | 29 | 0.3% |
| Guatemala | 4 | 0.0% |
| Japan | 25 | 0.3% |
| Latin America | 4 | 0.0% |
| Poland | 6 | 0.1% | View All 10 Rows |
Sex and Age in Crittenden County
Sex and Age in Crittenden County
The most populous age groups in Crittenden County are 10 to 14 Years (412 | 8.9%) for men and 55 to 59 Years (398 | 9.1%) for women.
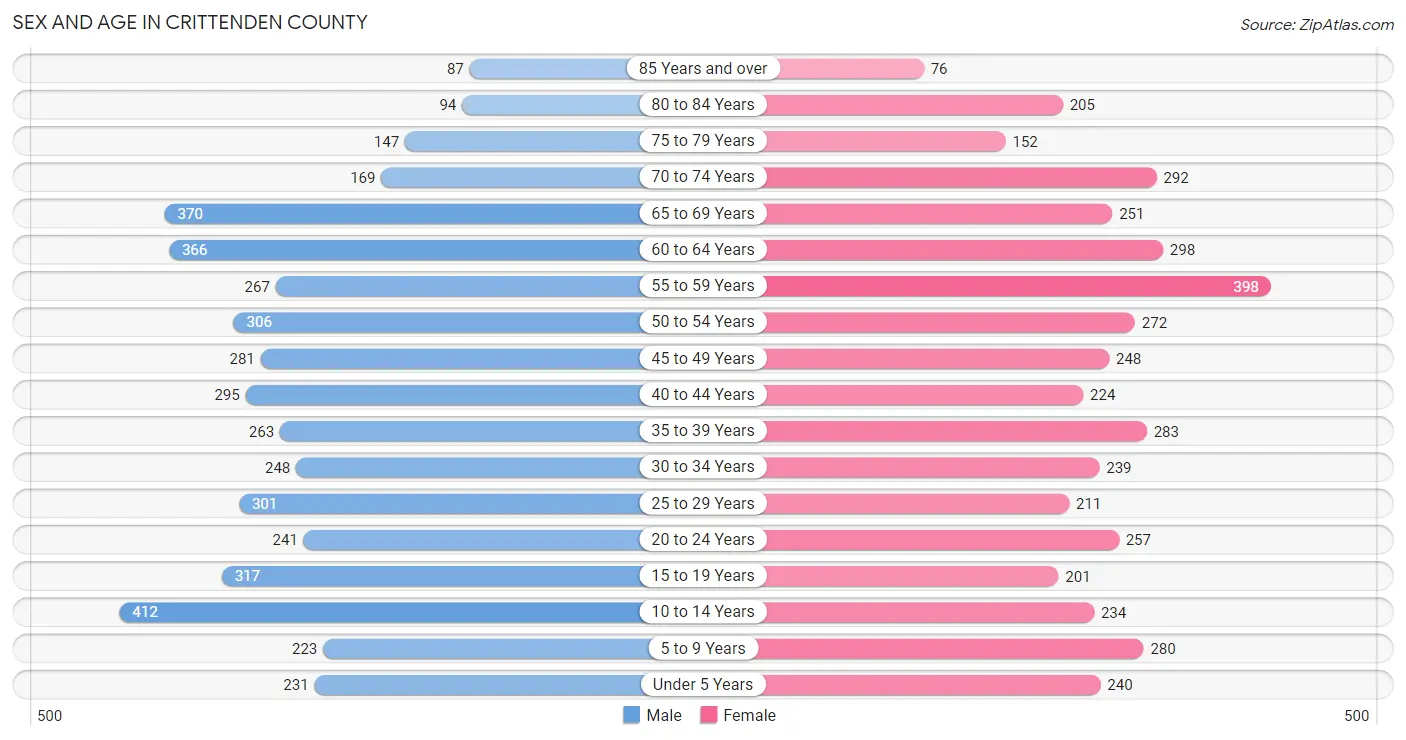
| Age Bracket | Male | Female |
| Under 5 Years | 231 (5.0%) | 240 (5.5%) |
| 5 to 9 Years | 223 (4.8%) | 280 (6.4%) |
| 10 to 14 Years | 412 (8.9%) | 234 (5.4%) |
| 15 to 19 Years | 317 (6.9%) | 201 (4.6%) |
| 20 to 24 Years | 241 (5.2%) | 257 (5.9%) |
| 25 to 29 Years | 301 (6.5%) | 211 (4.8%) |
| 30 to 34 Years | 248 (5.4%) | 239 (5.5%) |
| 35 to 39 Years | 263 (5.7%) | 283 (6.5%) |
| 40 to 44 Years | 295 (6.4%) | 224 (5.1%) |
| 45 to 49 Years | 281 (6.1%) | 248 (5.7%) |
| 50 to 54 Years | 306 (6.6%) | 272 (6.2%) |
| 55 to 59 Years | 267 (5.8%) | 398 (9.1%) |
| 60 to 64 Years | 366 (7.9%) | 298 (6.8%) |
| 65 to 69 Years | 370 (8.0%) | 251 (5.8%) |
| 70 to 74 Years | 169 (3.7%) | 292 (6.7%) |
| 75 to 79 Years | 147 (3.2%) | 152 (3.5%) |
| 80 to 84 Years | 94 (2.0%) | 205 (4.7%) |
| 85 Years and over | 87 (1.9%) | 76 (1.7%) |
| Total | 4,618 (100.0%) | 4,361 (100.0%) |
Families and Households in Crittenden County
Median Family Size in Crittenden County
The median family size in Crittenden County is 3.21 persons per family, with single male/father families (86 | 3.9%) accounting for the largest median family size of 3.43 persons per family. On the other hand, married-couple families (1,666 | 76.3%) represent the smallest median family size with 3.19 persons per family.
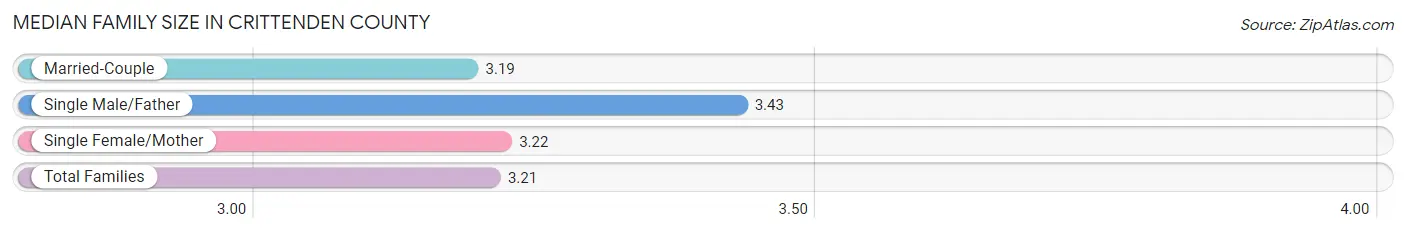
| Family Type | # Families | Family Size |
| Married-Couple | 1,666 (76.3%) | 3.19 |
| Single Male/Father | 86 (3.9%) | 3.43 |
| Single Female/Mother | 430 (19.7%) | 3.22 |
| Total Families | 2,182 (100.0%) | 3.21 |
Median Household Size in Crittenden County
The median household size in Crittenden County is 2.50 persons per household, with single male/father households (86 | 2.5%) accounting for the largest median household size of 4.1 persons per household. non-family households (1,313 | 37.6%) represent the smallest median household size with 1.19 persons per household.
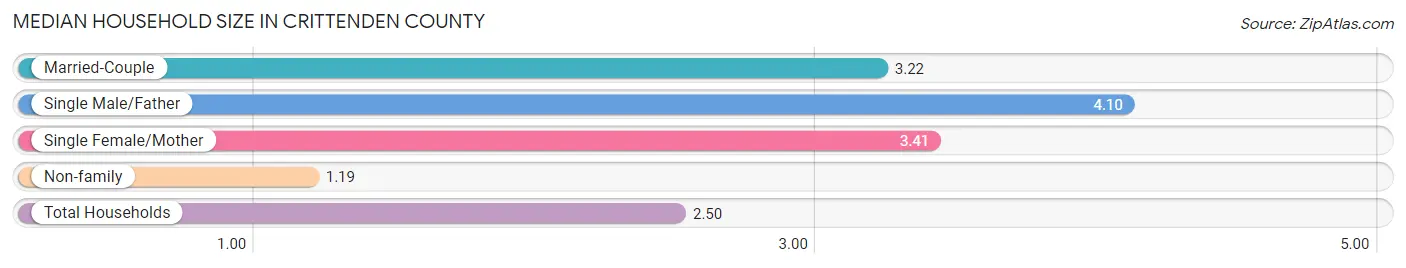
| Household Type | # Households | Household Size |
| Married-Couple | 1,666 (47.7%) | 3.22 |
| Single Male/Father | 86 (2.5%) | 4.10 |
| Single Female/Mother | 430 (12.3%) | 3.41 |
| Non-family | 1,313 (37.6%) | 1.19 |
| Total Households | 3,495 (100.0%) | 2.50 |
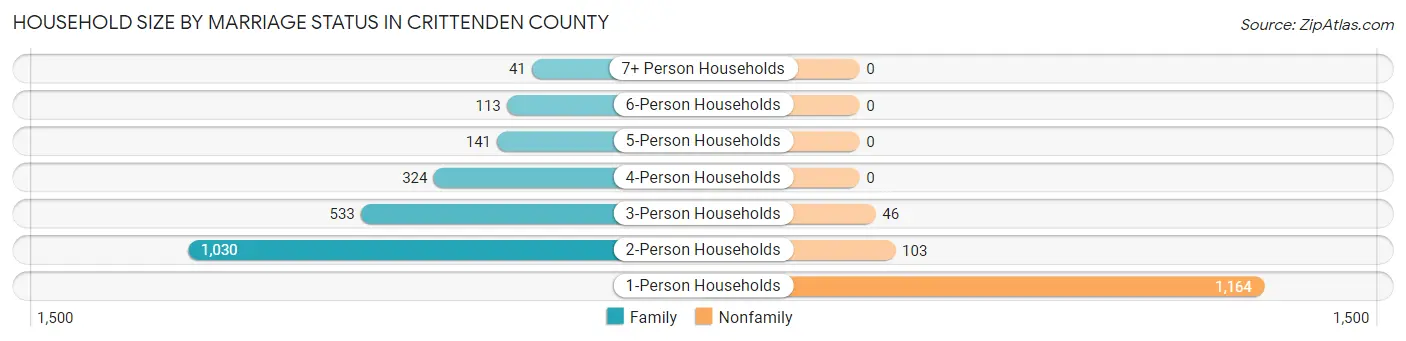
Household Size by Marriage Status in Crittenden County
Out of a total of 3,495 households in Crittenden County, 2,182 (62.4%) are family households, while 1,313 (37.6%) are nonfamily households. The most numerous type of family households are 2-person households, comprising 1,030, and the most common type of nonfamily households are 1-person households, comprising 1,164.
| Household Size | Family Households | Nonfamily Households |
| 1-Person Households | - | 1,164 (33.3%) |
| 2-Person Households | 1,030 (29.5%) | 103 (2.9%) |
| 3-Person Households | 533 (15.2%) | 46 (1.3%) |
| 4-Person Households | 324 (9.3%) | 0 (0.0%) |
| 5-Person Households | 141 (4.0%) | 0 (0.0%) |
| 6-Person Households | 113 (3.2%) | 0 (0.0%) |
| 7+ Person Households | 41 (1.2%) | 0 (0.0%) |
| Total | 2,182 (62.4%) | 1,313 (37.6%) |
Female Fertility in Crittenden County
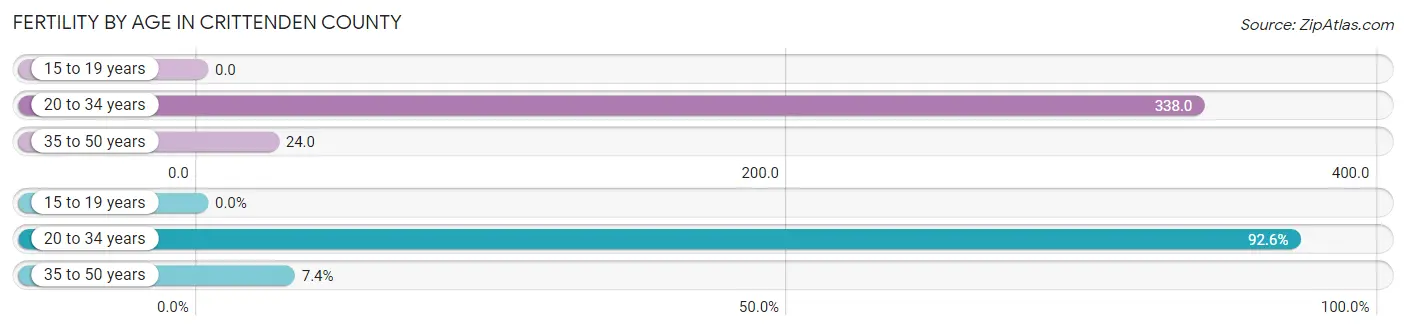
Fertility by Age in Crittenden County
Average fertility rate in Crittenden County is 153.0 births per 1,000 women. Women in the age bracket of 20 to 34 years have the highest fertility rate with 338.0 births per 1,000 women. Women in the age bracket of 20 to 34 years acount for 92.6% of all women with births.
| Age Bracket | Women with Births | Births / 1,000 Women |
| 15 to 19 years | 0 (0.0%) | 0.0 |
| 20 to 34 years | 239 (92.6%) | 338.0 |
| 35 to 50 years | 19 (7.4%) | 24.0 |
| Total | 258 (100.0%) | 153.0 |
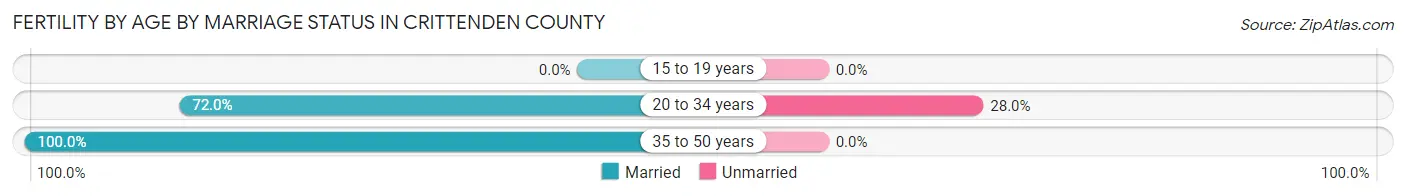
Fertility by Age by Marriage Status in Crittenden County
74.0% of women with births (258) in Crittenden County are married. The highest percentage of unmarried women with births falls into 20 to 34 years age bracket with 28.0% of them unmarried at the time of birth, while the lowest percentage of unmarried women with births belong to 35 to 50 years age bracket with 0.0% of them unmarried.
| Age Bracket | Married | Unmarried |
| 15 to 19 years | 0 (0.0%) | 0 (0.0%) |
| 20 to 34 years | 172 (72.0%) | 67 (28.0%) |
| 35 to 50 years | 19 (100.0%) | 0 (0.0%) |
| Total | 191 (74.0%) | 67 (26.0%) |
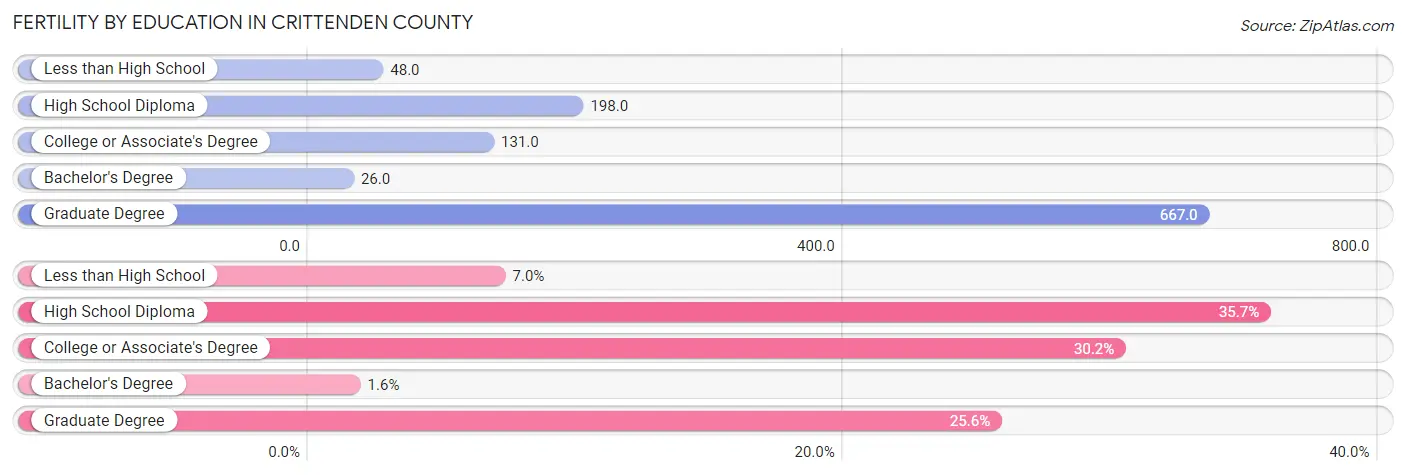
Fertility by Education in Crittenden County
Average fertility rate in Crittenden County is 153.0 births per 1,000 women. Women with the education attainment of graduate degree have the highest fertility rate of 667.0 births per 1,000 women, while women with the education attainment of bachelor's degree have the lowest fertility at 26.0 births per 1,000 women. Women with the education attainment of high school diploma represent 35.7% of all women with births.
| Educational Attainment | Women with Births | Births / 1,000 Women |
| Less than High School | 18 (7.0%) | 48.0 |
| High School Diploma | 92 (35.7%) | 198.0 |
| College or Associate's Degree | 78 (30.2%) | 131.0 |
| Bachelor's Degree | 4 (1.5%) | 26.0 |
| Graduate Degree | 66 (25.6%) | 667.0 |
| Total | 258 (100.0%) | 153.0 |
Fertility by Education by Marriage Status in Crittenden County
26.0% of women with births in Crittenden County are unmarried. Women with the educational attainment of bachelor's degree are most likely to be married with 100.0% of them married at childbirth, while women with the educational attainment of college or associate's degree are least likely to be married with 53.8% of them unmarried at childbirth.
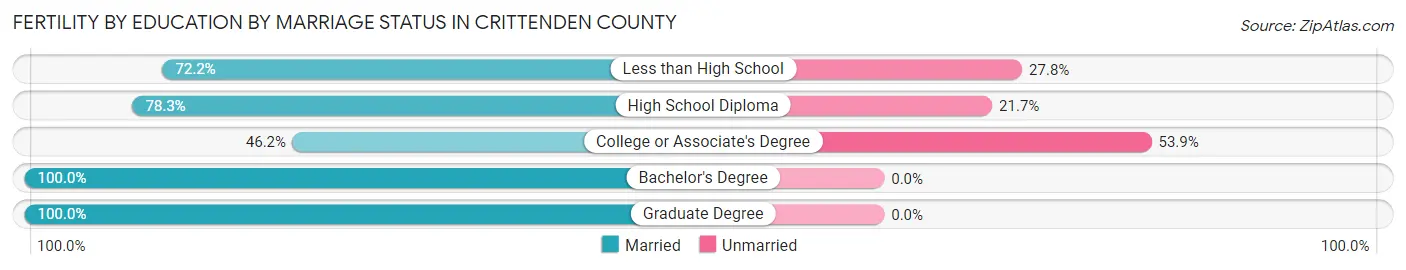
| Educational Attainment | Married | Unmarried |
| Less than High School | 13 (72.2%) | 5 (27.8%) |
| High School Diploma | 72 (78.3%) | 20 (21.7%) |
| College or Associate's Degree | 36 (46.2%) | 42 (53.8%) |
| Bachelor's Degree | 4 (100.0%) | 0 (0.0%) |
| Graduate Degree | 66 (100.0%) | 0 (0.0%) |
| Total | 191 (74.0%) | 67 (26.0%) |
Employment Characteristics in Crittenden County
Employment by Class of Employer in Crittenden County
Among the 3,374 employed individuals in Crittenden County, private company employees (2,474 | 73.3%), not-for-profit organizations (218 | 6.5%), and self-employed (not incorporated) (182 | 5.4%) make up the most common classes of employment.
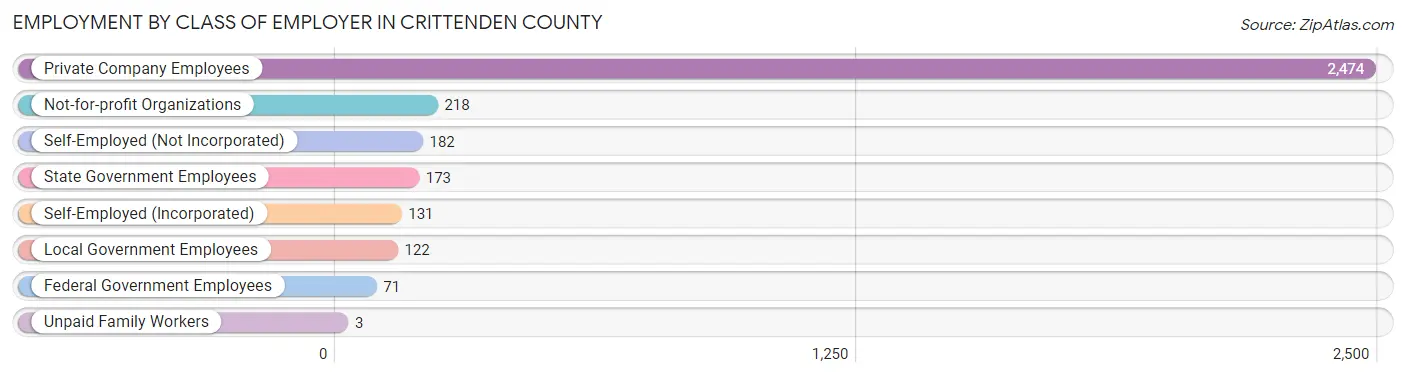
| Employer Class | # Employees | % Employees |
| Private Company Employees | 2,474 | 73.3% |
| Self-Employed (Incorporated) | 131 | 3.9% |
| Self-Employed (Not Incorporated) | 182 | 5.4% |
| Not-for-profit Organizations | 218 | 6.5% |
| Local Government Employees | 122 | 3.6% |
| State Government Employees | 173 | 5.1% |
| Federal Government Employees | 71 | 2.1% |
| Unpaid Family Workers | 3 | 0.1% |
| Total | 3,374 | 100.0% |
Employment Status by Age in Crittenden County
According to the labor force statistics for Crittenden County, out of the total population over 16 years of age (7,193), 50.2% or 3,611 individuals are in the labor force, with 3.4% or 123 of them unemployed. The age group with the highest labor force participation rate is 25 to 29 years, with 82.6% or 423 individuals in the labor force. Within the labor force, the 75 years and over age range has the highest percentage of unemployed individuals, with 22.2% or 8 of them being unemployed.
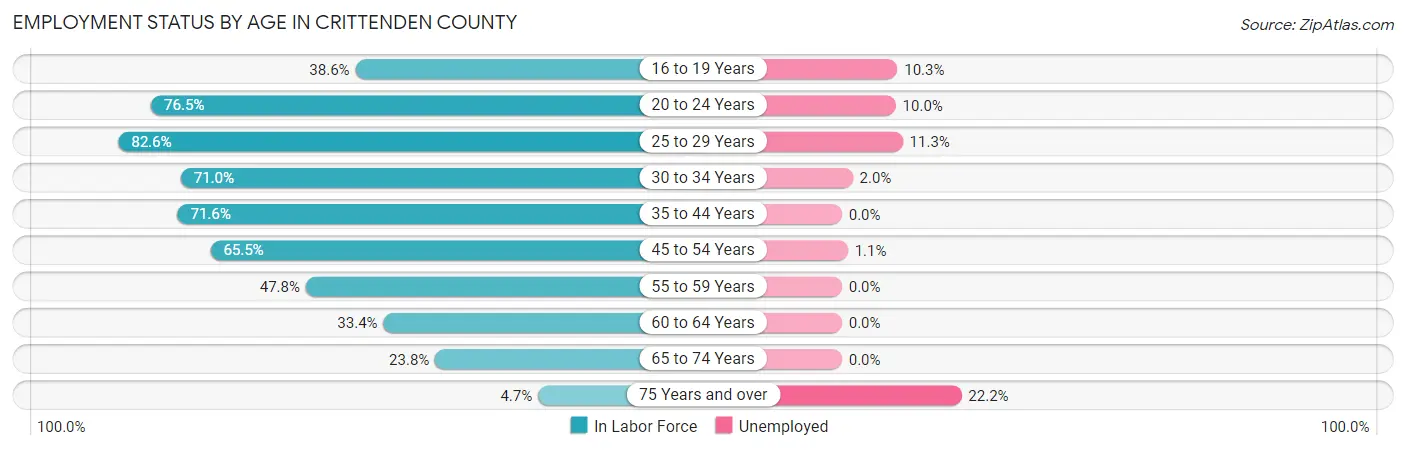
| Age Bracket | In Labor Force | Unemployed |
| 16 to 19 Years | 136 (38.6%) | 14 (10.3%) |
| 20 to 24 Years | 381 (76.5%) | 38 (10.0%) |
| 25 to 29 Years | 423 (82.6%) | 48 (11.3%) |
| 30 to 34 Years | 346 (71.0%) | 7 (2.0%) |
| 35 to 44 Years | 763 (71.6%) | 0 (0.0%) |
| 45 to 54 Years | 725 (65.5%) | 8 (1.1%) |
| 55 to 59 Years | 318 (47.8%) | 0 (0.0%) |
| 60 to 64 Years | 222 (33.4%) | 0 (0.0%) |
| 65 to 74 Years | 258 (23.8%) | 0 (0.0%) |
| 75 Years and over | 36 (4.7%) | 8 (22.2%) |
| Total | 3,611 (50.2%) | 123 (3.4%) |
Employment Status by Educational Attainment in Crittenden County
According to labor force statistics for Crittenden County, 62.2% of individuals (2,799) out of the total population between 25 and 64 years of age (4,500) are in the labor force, with 2.3% or 64 of them being unemployed. The group with the highest labor force participation rate are those with the educational attainment of bachelor's degree or higher, with 78.5% or 419 individuals in the labor force. Within the labor force, individuals with high school diploma education have the highest percentage of unemployment, with 2.9% or 36 of them being unemployed.
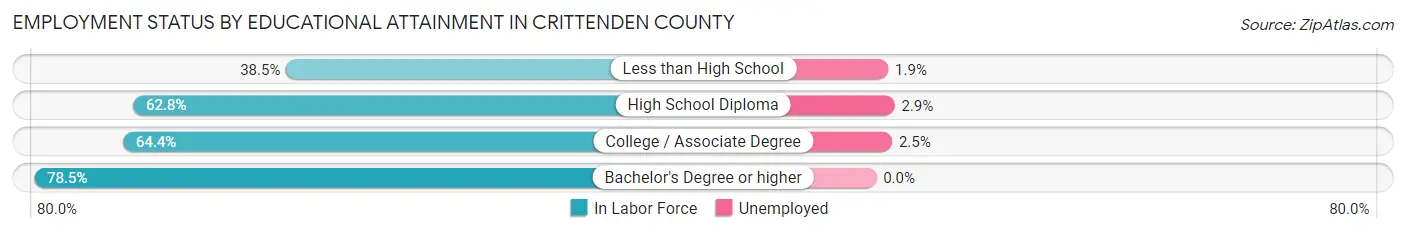
| Educational Attainment | In Labor Force | Unemployed |
| Less than High School | 215 (38.5%) | 11 (1.9%) |
| High School Diploma | 1,237 (62.8%) | 57 (2.9%) |
| College / Associate Degree | 925 (64.4%) | 36 (2.5%) |
| Bachelor's Degree or higher | 419 (78.5%) | 0 (0.0%) |
| Total | 2,799 (62.2%) | 104 (2.3%) |
Employment Occupations by Sex in Crittenden County
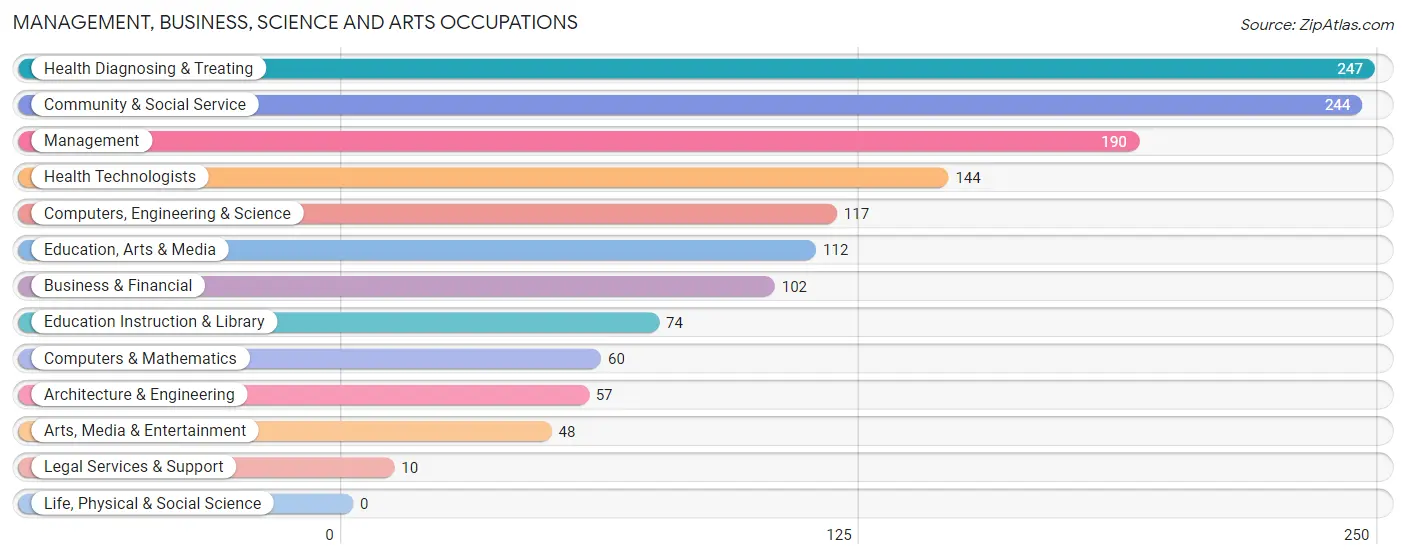
Management, Business, Science and Arts Occupations
The most common Management, Business, Science and Arts occupations in Crittenden County are Health Diagnosing & Treating (247 | 7.1%), Community & Social Service (244 | 7.0%), Management (190 | 5.4%), Health Technologists (144 | 4.1%), and Computers, Engineering & Science (117 | 3.4%).
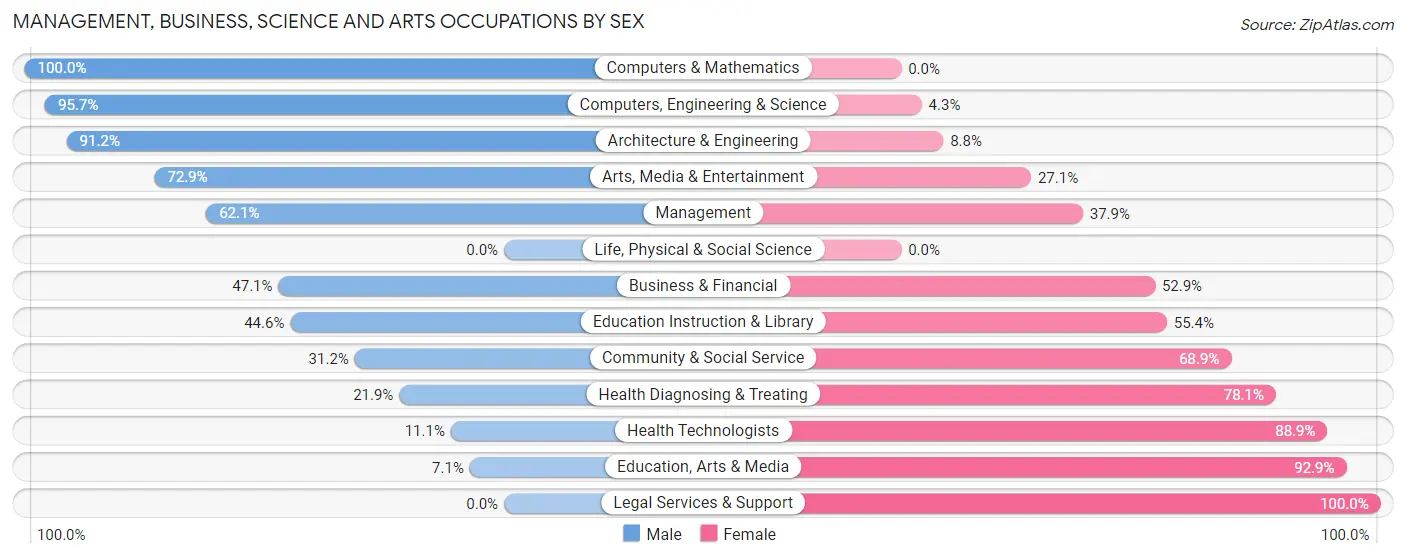
Management, Business, Science and Arts Occupations by Sex
Within the Management, Business, Science and Arts occupations in Crittenden County, the most male-oriented occupations are Computers & Mathematics (100.0%), Computers, Engineering & Science (95.7%), and Architecture & Engineering (91.2%), while the most female-oriented occupations are Legal Services & Support (100.0%), Education, Arts & Media (92.9%), and Health Technologists (88.9%).
| Occupation | Male | Female |
| Management | 118 (62.1%) | 72 (37.9%) |
| Business & Financial | 48 (47.1%) | 54 (52.9%) |
| Computers, Engineering & Science | 112 (95.7%) | 5 (4.3%) |
| Computers & Mathematics | 60 (100.0%) | 0 (0.0%) |
| Architecture & Engineering | 52 (91.2%) | 5 (8.8%) |
| Life, Physical & Social Science | 0 (0.0%) | 0 (0.0%) |
| Community & Social Service | 76 (31.1%) | 168 (68.9%) |
| Education, Arts & Media | 8 (7.1%) | 104 (92.9%) |
| Legal Services & Support | 0 (0.0%) | 10 (100.0%) |
| Education Instruction & Library | 33 (44.6%) | 41 (55.4%) |
| Arts, Media & Entertainment | 35 (72.9%) | 13 (27.1%) |
| Health Diagnosing & Treating | 54 (21.9%) | 193 (78.1%) |
| Health Technologists | 16 (11.1%) | 128 (88.9%) |
| Total (Category) | 408 (45.3%) | 492 (54.7%) |
| Total (Overall) | 2,027 (58.2%) | 1,458 (41.8%) |
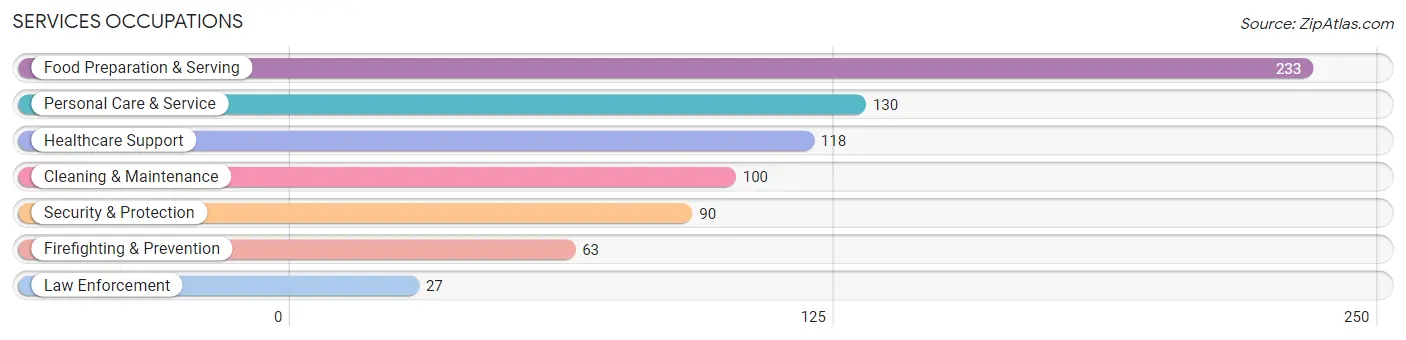
Services Occupations
The most common Services occupations in Crittenden County are Food Preparation & Serving (233 | 6.7%), Personal Care & Service (130 | 3.7%), Healthcare Support (118 | 3.4%), Cleaning & Maintenance (100 | 2.9%), and Security & Protection (90 | 2.6%).
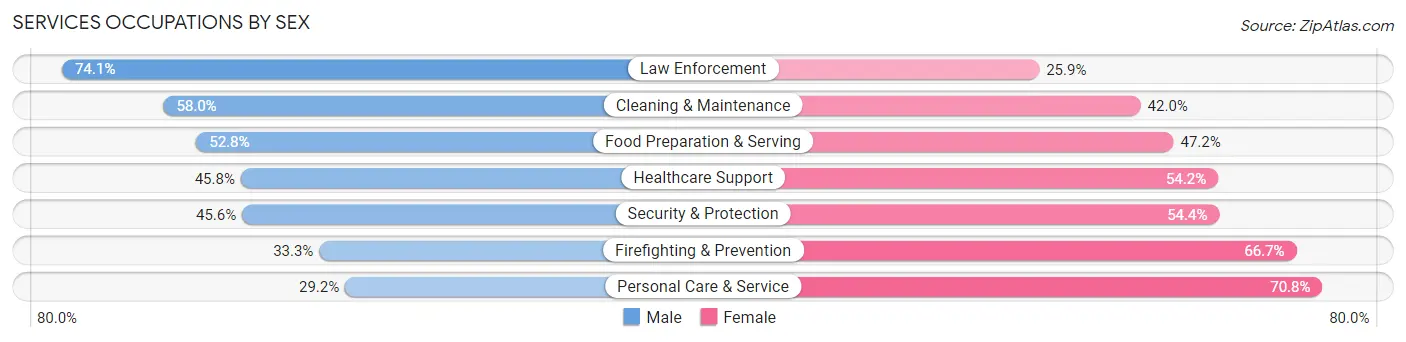
Services Occupations by Sex
Within the Services occupations in Crittenden County, the most male-oriented occupations are Law Enforcement (74.1%), Cleaning & Maintenance (58.0%), and Food Preparation & Serving (52.8%), while the most female-oriented occupations are Personal Care & Service (70.8%), Firefighting & Prevention (66.7%), and Security & Protection (54.4%).
| Occupation | Male | Female |
| Healthcare Support | 54 (45.8%) | 64 (54.2%) |
| Security & Protection | 41 (45.6%) | 49 (54.4%) |
| Firefighting & Prevention | 21 (33.3%) | 42 (66.7%) |
| Law Enforcement | 20 (74.1%) | 7 (25.9%) |
| Food Preparation & Serving | 123 (52.8%) | 110 (47.2%) |
| Cleaning & Maintenance | 58 (58.0%) | 42 (42.0%) |
| Personal Care & Service | 38 (29.2%) | 92 (70.8%) |
| Total (Category) | 314 (46.8%) | 357 (53.2%) |
| Total (Overall) | 2,027 (58.2%) | 1,458 (41.8%) |
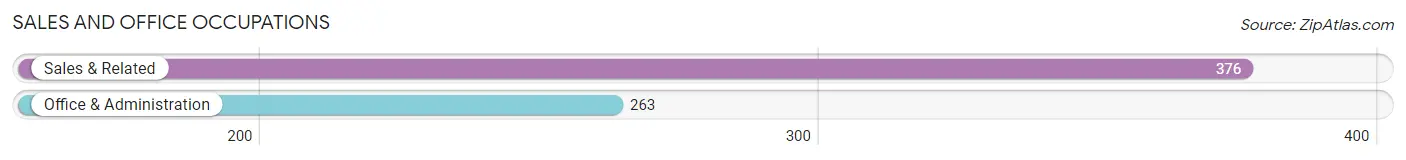
Sales and Office Occupations
The most common Sales and Office occupations in Crittenden County are Sales & Related (376 | 10.8%), and Office & Administration (263 | 7.5%).
Sales and Office Occupations by Sex
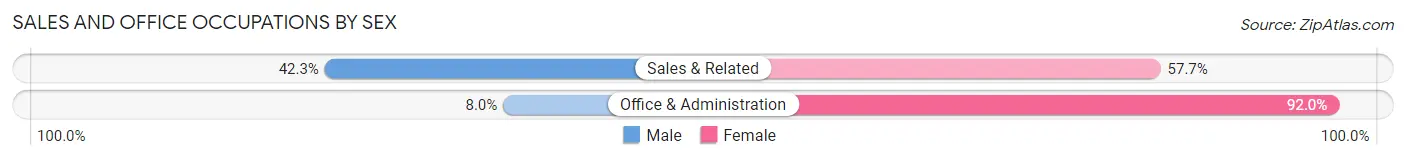
| Occupation | Male | Female |
| Sales & Related | 159 (42.3%) | 217 (57.7%) |
| Office & Administration | 21 (8.0%) | 242 (92.0%) |
| Total (Category) | 180 (28.2%) | 459 (71.8%) |
| Total (Overall) | 2,027 (58.2%) | 1,458 (41.8%) |
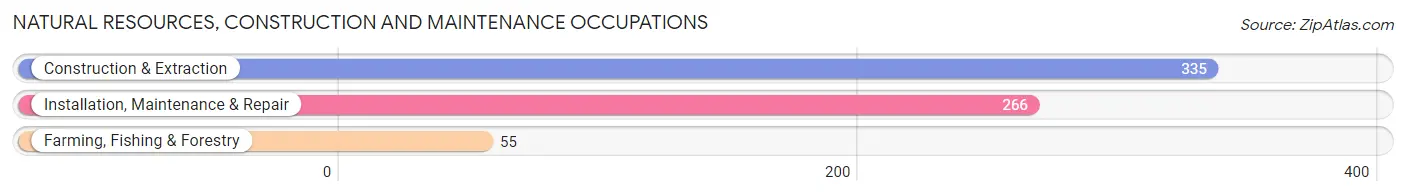
Natural Resources, Construction and Maintenance Occupations
The most common Natural Resources, Construction and Maintenance occupations in Crittenden County are Construction & Extraction (335 | 9.6%), Installation, Maintenance & Repair (266 | 7.6%), and Farming, Fishing & Forestry (55 | 1.6%).
Natural Resources, Construction and Maintenance Occupations by Sex
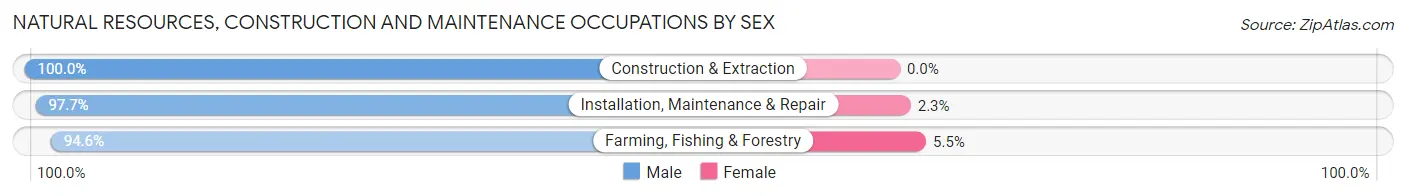
| Occupation | Male | Female |
| Farming, Fishing & Forestry | 52 (94.6%) | 3 (5.4%) |
| Construction & Extraction | 335 (100.0%) | 0 (0.0%) |
| Installation, Maintenance & Repair | 260 (97.7%) | 6 (2.3%) |
| Total (Category) | 647 (98.6%) | 9 (1.4%) |
| Total (Overall) | 2,027 (58.2%) | 1,458 (41.8%) |
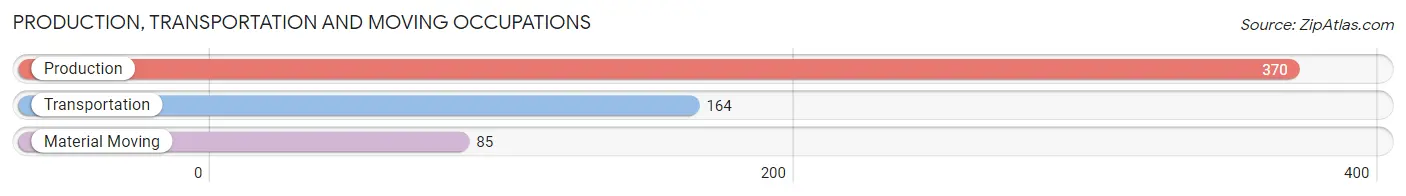
Production, Transportation and Moving Occupations
The most common Production, Transportation and Moving occupations in Crittenden County are Production (370 | 10.6%), Transportation (164 | 4.7%), and Material Moving (85 | 2.4%).
Production, Transportation and Moving Occupations by Sex
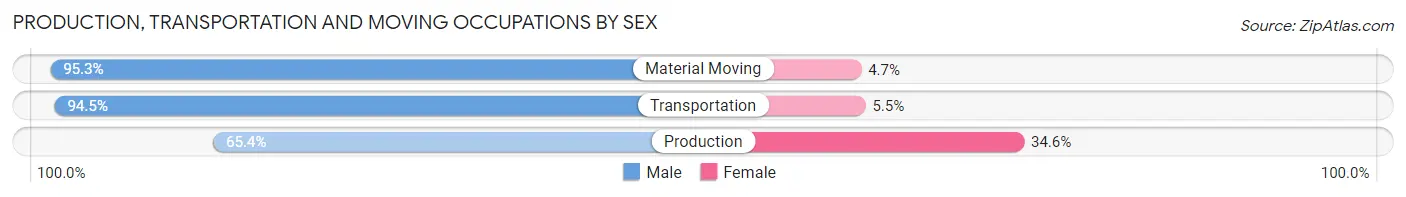
| Occupation | Male | Female |
| Production | 242 (65.4%) | 128 (34.6%) |
| Transportation | 155 (94.5%) | 9 (5.5%) |
| Material Moving | 81 (95.3%) | 4 (4.7%) |
| Total (Category) | 478 (77.2%) | 141 (22.8%) |
| Total (Overall) | 2,027 (58.2%) | 1,458 (41.8%) |
Employment Industries by Sex in Crittenden County
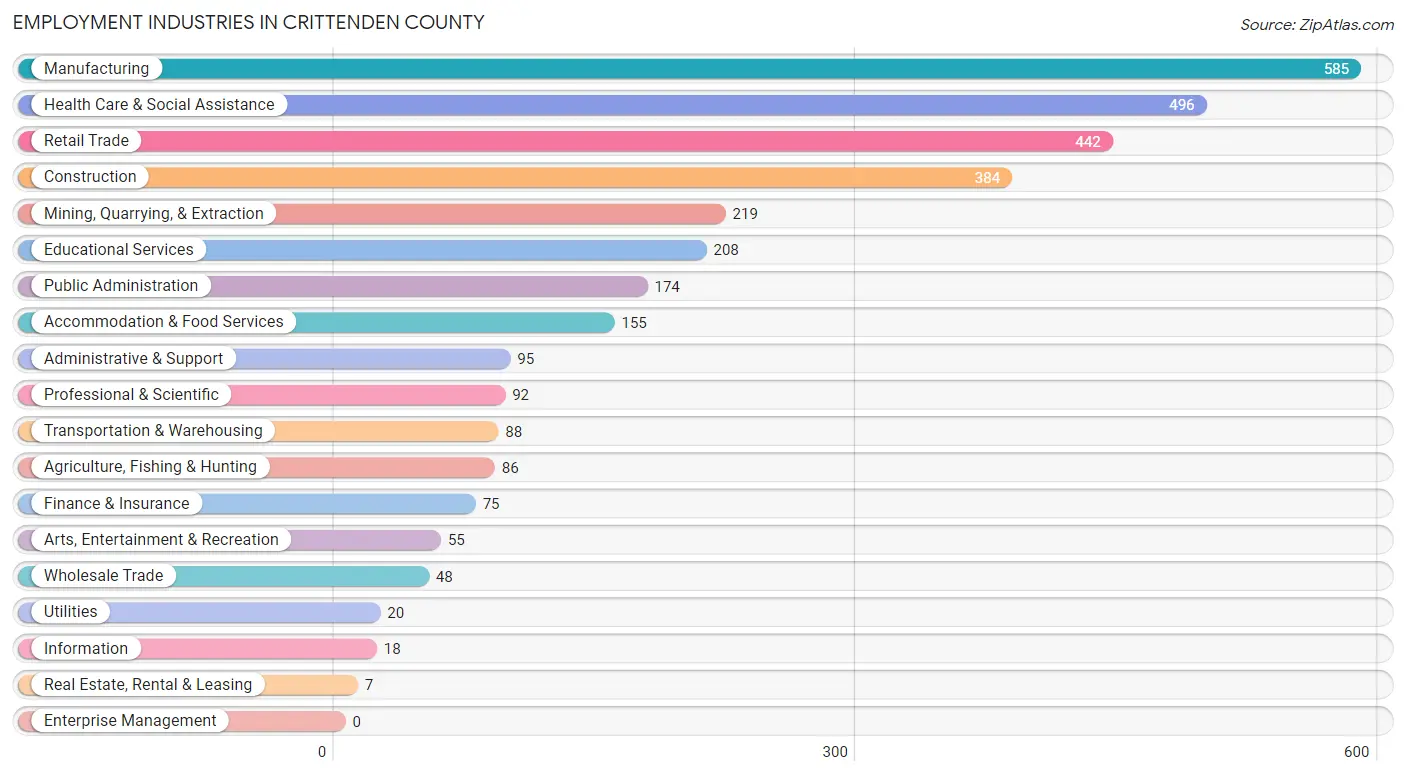
Employment Industries in Crittenden County
The major employment industries in Crittenden County include Manufacturing (585 | 16.8%), Health Care & Social Assistance (496 | 14.2%), Retail Trade (442 | 12.7%), Construction (384 | 11.0%), and Mining, Quarrying, & Extraction (219 | 6.3%).
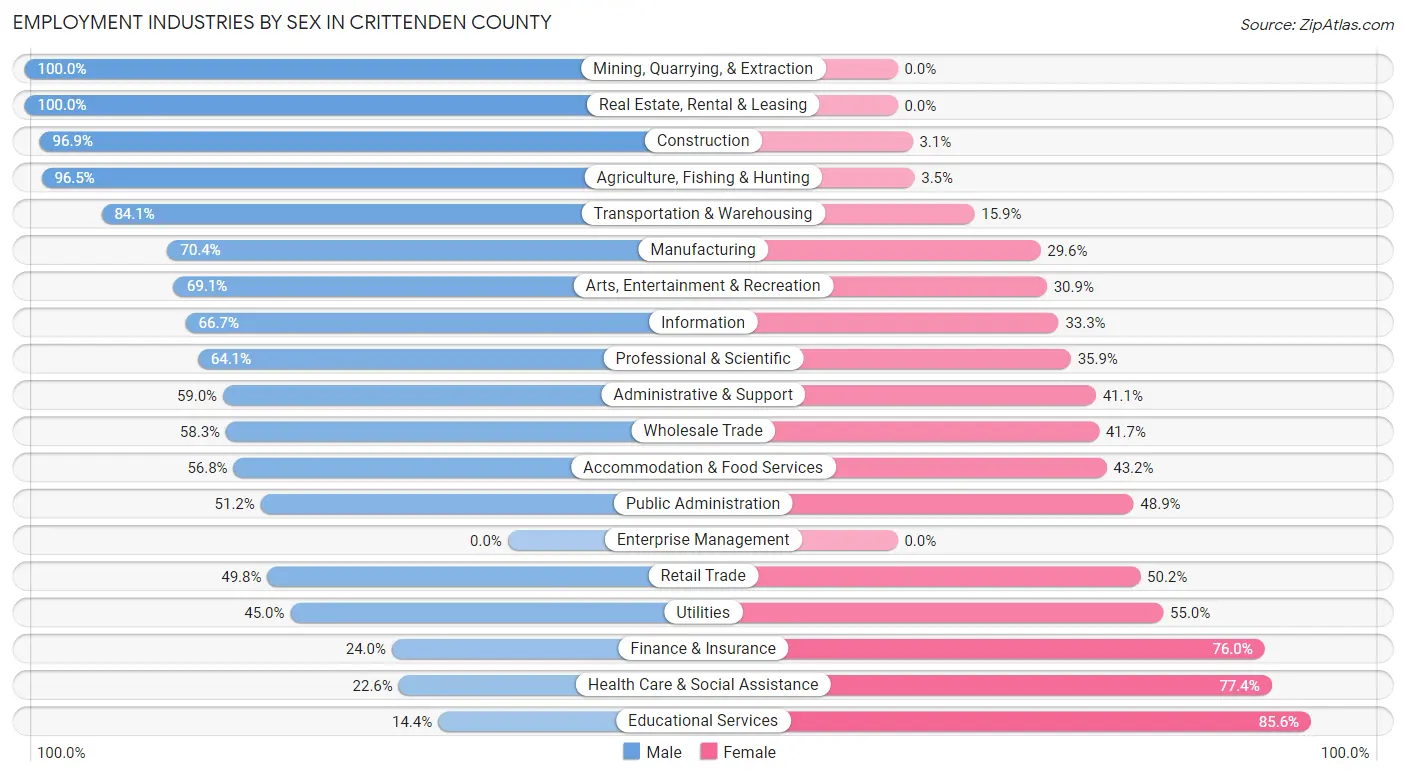
Employment Industries by Sex in Crittenden County
The Crittenden County industries that see more men than women are Mining, Quarrying, & Extraction (100.0%), Real Estate, Rental & Leasing (100.0%), and Construction (96.9%), whereas the industries that tend to have a higher number of women are Educational Services (85.6%), Health Care & Social Assistance (77.4%), and Finance & Insurance (76.0%).
| Industry | Male | Female |
| Agriculture, Fishing & Hunting | 83 (96.5%) | 3 (3.5%) |
| Mining, Quarrying, & Extraction | 219 (100.0%) | 0 (0.0%) |
| Construction | 372 (96.9%) | 12 (3.1%) |
| Manufacturing | 412 (70.4%) | 173 (29.6%) |
| Wholesale Trade | 28 (58.3%) | 20 (41.7%) |
| Retail Trade | 220 (49.8%) | 222 (50.2%) |
| Transportation & Warehousing | 74 (84.1%) | 14 (15.9%) |
| Utilities | 9 (45.0%) | 11 (55.0%) |
| Information | 12 (66.7%) | 6 (33.3%) |
| Finance & Insurance | 18 (24.0%) | 57 (76.0%) |
| Real Estate, Rental & Leasing | 7 (100.0%) | 0 (0.0%) |
| Professional & Scientific | 59 (64.1%) | 33 (35.9%) |
| Enterprise Management | 0 (0.0%) | 0 (0.0%) |
| Administrative & Support | 56 (59.0%) | 39 (41.0%) |
| Educational Services | 30 (14.4%) | 178 (85.6%) |
| Health Care & Social Assistance | 112 (22.6%) | 384 (77.4%) |
| Arts, Entertainment & Recreation | 38 (69.1%) | 17 (30.9%) |
| Accommodation & Food Services | 88 (56.8%) | 67 (43.2%) |
| Public Administration | 89 (51.1%) | 85 (48.8%) |
| Total | 2,027 (58.2%) | 1,458 (41.8%) |
Education in Crittenden County
School Enrollment in Crittenden County
The most common levels of schooling among the 1,780 students in Crittenden County are middle school (537 | 30.2%), high school (521 | 29.3%), and elementary school (333 | 18.7%).
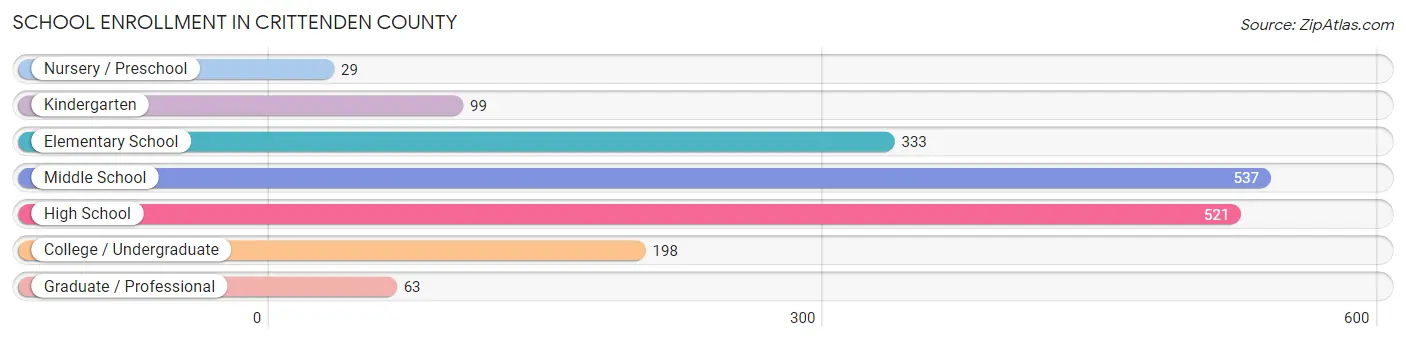
| School Level | # Students | % Students |
| Nursery / Preschool | 29 | 1.6% |
| Kindergarten | 99 | 5.6% |
| Elementary School | 333 | 18.7% |
| Middle School | 537 | 30.2% |
| High School | 521 | 29.3% |
| College / Undergraduate | 198 | 11.1% |
| Graduate / Professional | 63 | 3.5% |
| Total | 1,780 | 100.0% |
School Enrollment by Age by Funding Source in Crittenden County
Out of a total of 1,780 students who are enrolled in schools in Crittenden County, 308 (17.3%) attend a private institution, while the remaining 1,472 (82.7%) are enrolled in public schools. The age group of 3 to 4 year olds has the highest likelihood of being enrolled in private schools, with 5 (100.0% in the age bracket) enrolled. Conversely, the age group of 18 to 19 year olds has the lowest likelihood of being enrolled in a private school, with 53 (100.0% in the age bracket) attending a public institution.
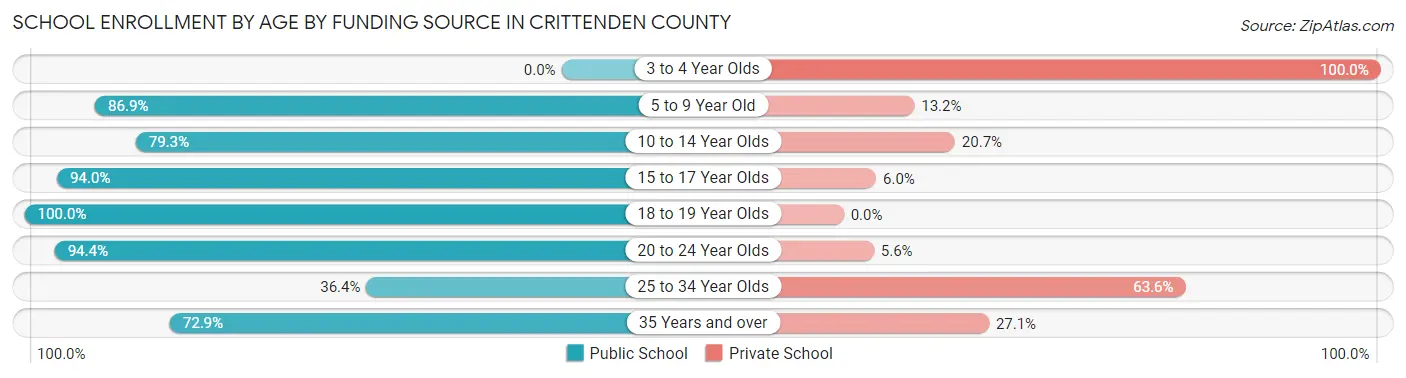
| Age Bracket | Public School | Private School |
| 3 to 4 Year Olds | 0 (0.0%) | 5 (100.0%) |
| 5 to 9 Year Old | 370 (86.9%) | 56 (13.2%) |
| 10 to 14 Year Olds | 509 (79.3%) | 133 (20.7%) |
| 15 to 17 Year Olds | 358 (94.0%) | 23 (6.0%) |
| 18 to 19 Year Olds | 53 (100.0%) | 0 (0.0%) |
| 20 to 24 Year Olds | 84 (94.4%) | 5 (5.6%) |
| 25 to 34 Year Olds | 36 (36.4%) | 63 (63.6%) |
| 35 Years and over | 62 (72.9%) | 23 (27.1%) |
| Total | 1,472 (82.7%) | 308 (17.3%) |
Educational Attainment by Field of Study in Crittenden County
Education (212 | 24.9%), business (158 | 18.5%), science & technology (91 | 10.7%), arts & humanities (72 | 8.5%), and computers & mathematics (71 | 8.3%) are the most common fields of study among 852 individuals in Crittenden County who have obtained a bachelor's degree or higher.
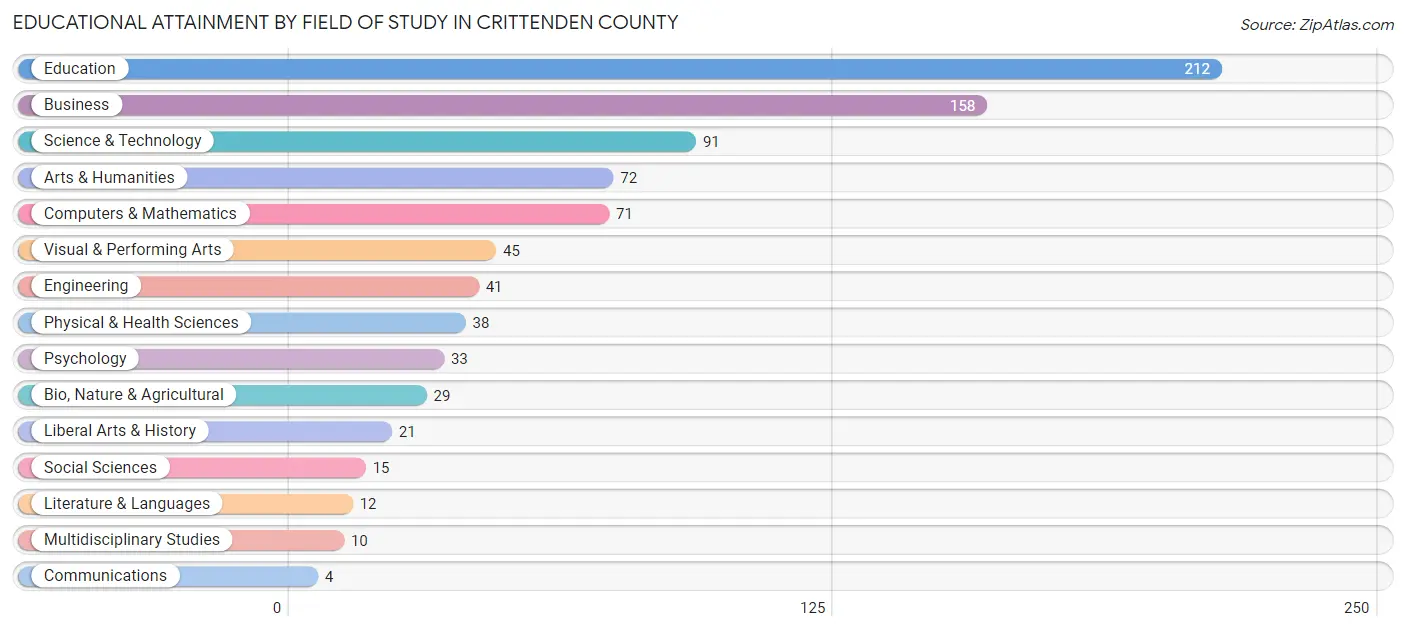
| Field of Study | # Graduates | % Graduates |
| Computers & Mathematics | 71 | 8.3% |
| Bio, Nature & Agricultural | 29 | 3.4% |
| Physical & Health Sciences | 38 | 4.5% |
| Psychology | 33 | 3.9% |
| Social Sciences | 15 | 1.8% |
| Engineering | 41 | 4.8% |
| Multidisciplinary Studies | 10 | 1.2% |
| Science & Technology | 91 | 10.7% |
| Business | 158 | 18.5% |
| Education | 212 | 24.9% |
| Literature & Languages | 12 | 1.4% |
| Liberal Arts & History | 21 | 2.5% |
| Visual & Performing Arts | 45 | 5.3% |
| Communications | 4 | 0.5% |
| Arts & Humanities | 72 | 8.5% |
| Total | 852 | 100.0% |
Transportation & Commute in Crittenden County
Vehicle Availability by Sex in Crittenden County
The most prevalent vehicle ownership categories in Crittenden County are males with 2 vehicles (769, accounting for 38.7%) and females with 2 vehicles (468, making up 55.5%).
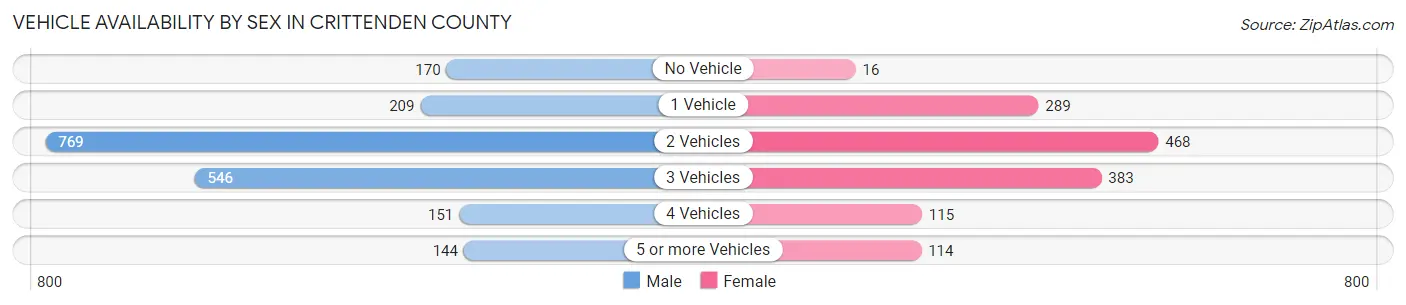
| Vehicles Available | Male | Female |
| No Vehicle | 170 (8.6%) | 16 (1.2%) |
| 1 Vehicle | 209 (10.5%) | 289 (20.9%) |
| 2 Vehicles | 769 (38.7%) | 468 (33.8%) |
| 3 Vehicles | 546 (27.5%) | 383 (27.7%) |
| 4 Vehicles | 151 (7.6%) | 115 (8.3%) |
| 5 or more Vehicles | 144 (7.2%) | 114 (8.2%) |
| Total | 1,989 (100.0%) | 1,385 (100.0%) |
Commute Time in Crittenden County
The most frequently occuring commute durations in Crittenden County are 20 to 24 minutes (582 commuters, 18.1%), 5 to 9 minutes (577 commuters, 17.9%), and 10 to 14 minutes (363 commuters, 11.3%).
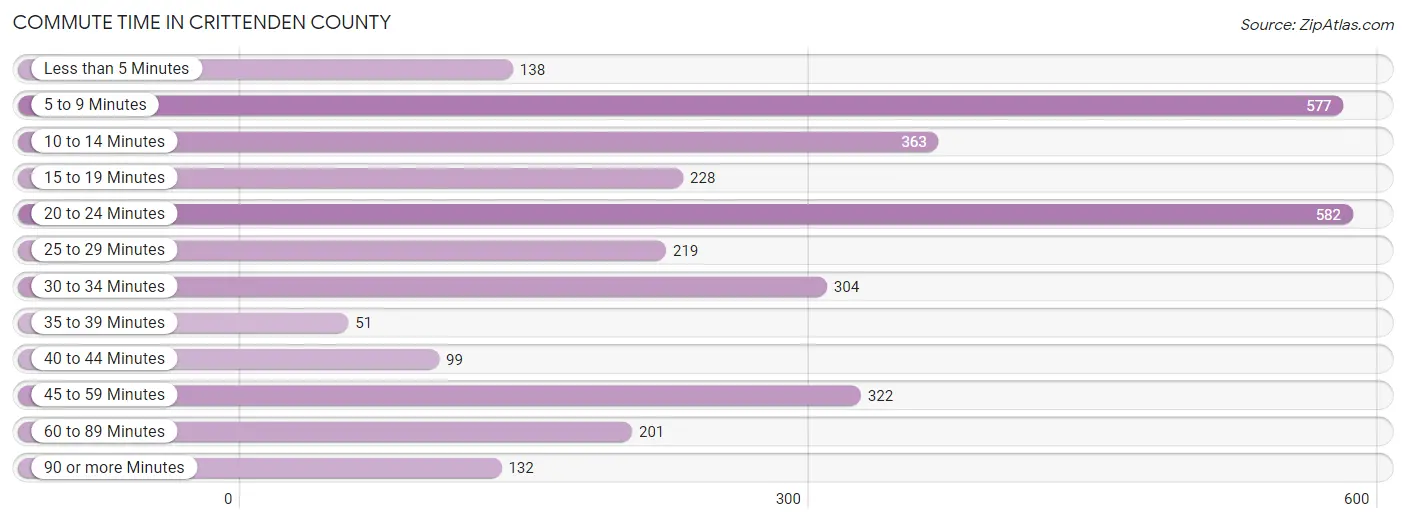
| Commute Time | # Commuters | % Commuters |
| Less than 5 Minutes | 138 | 4.3% |
| 5 to 9 Minutes | 577 | 17.9% |
| 10 to 14 Minutes | 363 | 11.3% |
| 15 to 19 Minutes | 228 | 7.1% |
| 20 to 24 Minutes | 582 | 18.1% |
| 25 to 29 Minutes | 219 | 6.8% |
| 30 to 34 Minutes | 304 | 9.5% |
| 35 to 39 Minutes | 51 | 1.6% |
| 40 to 44 Minutes | 99 | 3.1% |
| 45 to 59 Minutes | 322 | 10.0% |
| 60 to 89 Minutes | 201 | 6.2% |
| 90 or more Minutes | 132 | 4.1% |
Commute Time by Sex in Crittenden County
The most common commute times in Crittenden County are 20 to 24 minutes (276 commuters, 14.6%) for males and 5 to 9 minutes (344 commuters, 26.0%) for females.
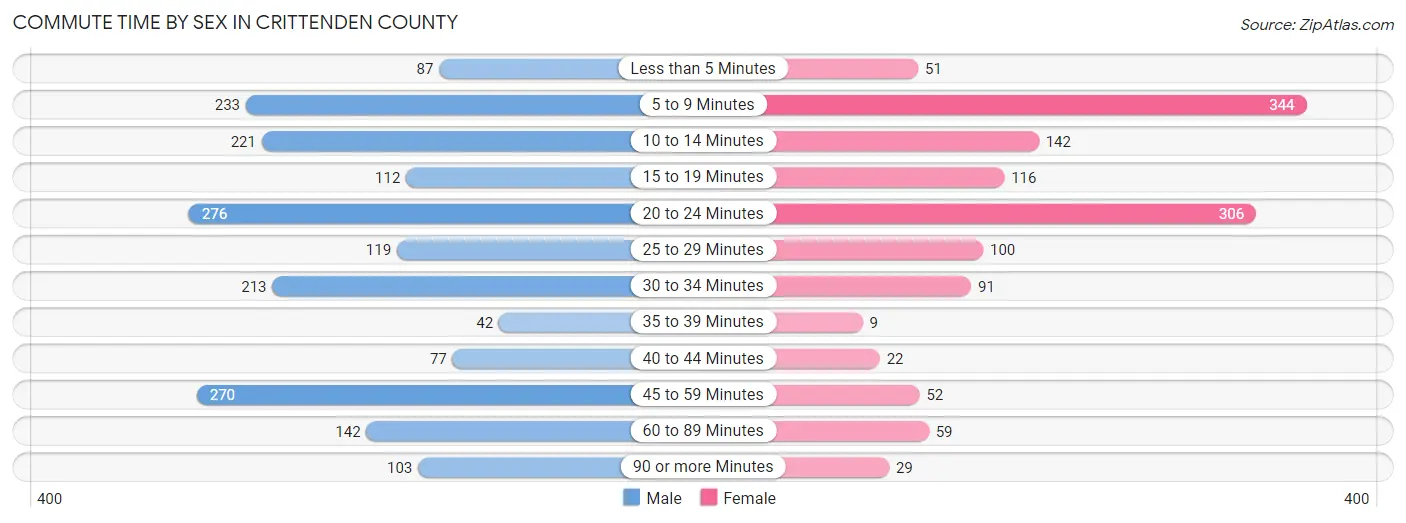
| Commute Time | Male | Female |
| Less than 5 Minutes | 87 (4.6%) | 51 (3.9%) |
| 5 to 9 Minutes | 233 (12.3%) | 344 (26.0%) |
| 10 to 14 Minutes | 221 (11.7%) | 142 (10.7%) |
| 15 to 19 Minutes | 112 (5.9%) | 116 (8.8%) |
| 20 to 24 Minutes | 276 (14.6%) | 306 (23.2%) |
| 25 to 29 Minutes | 119 (6.3%) | 100 (7.6%) |
| 30 to 34 Minutes | 213 (11.2%) | 91 (6.9%) |
| 35 to 39 Minutes | 42 (2.2%) | 9 (0.7%) |
| 40 to 44 Minutes | 77 (4.1%) | 22 (1.7%) |
| 45 to 59 Minutes | 270 (14.2%) | 52 (3.9%) |
| 60 to 89 Minutes | 142 (7.5%) | 59 (4.5%) |
| 90 or more Minutes | 103 (5.4%) | 29 (2.2%) |
Time of Departure to Work by Sex in Crittenden County
The most frequent times of departure to work in Crittenden County are 12:00 AM to 4:59 AM (458, 24.2%) for males and 7:00 AM to 7:29 AM (193, 14.6%) for females.
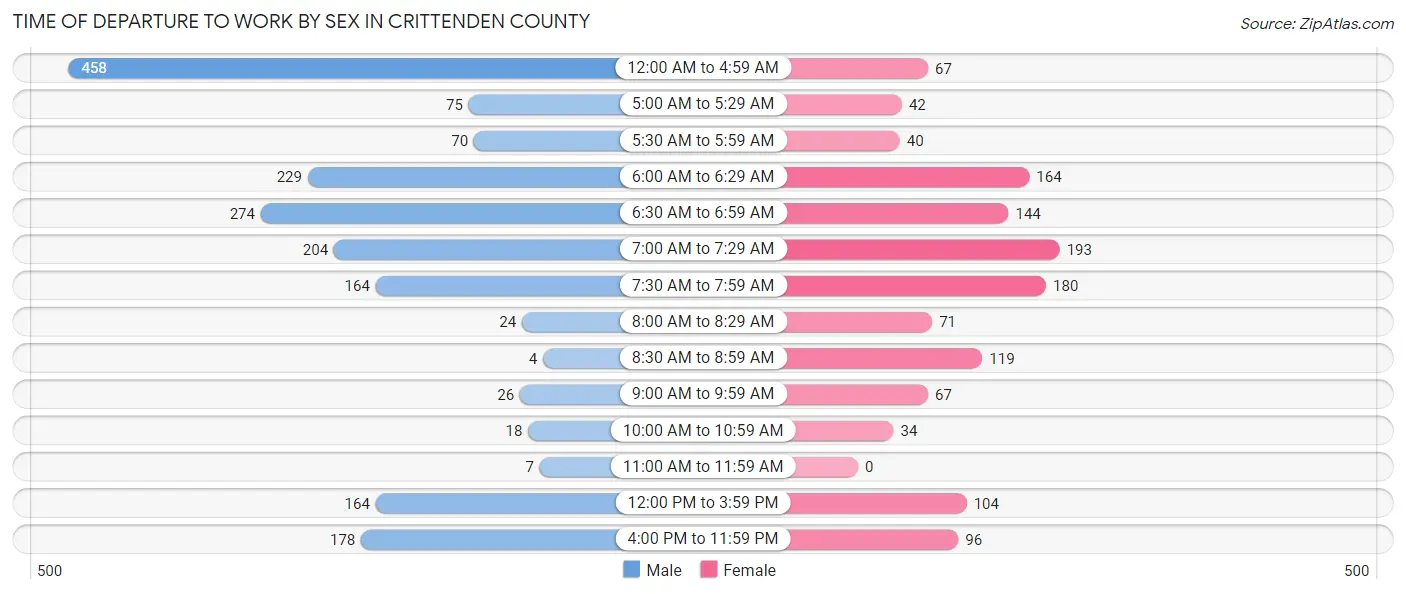
| Time of Departure | Male | Female |
| 12:00 AM to 4:59 AM | 458 (24.2%) | 67 (5.1%) |
| 5:00 AM to 5:29 AM | 75 (4.0%) | 42 (3.2%) |
| 5:30 AM to 5:59 AM | 70 (3.7%) | 40 (3.0%) |
| 6:00 AM to 6:29 AM | 229 (12.1%) | 164 (12.4%) |
| 6:30 AM to 6:59 AM | 274 (14.5%) | 144 (10.9%) |
| 7:00 AM to 7:29 AM | 204 (10.8%) | 193 (14.6%) |
| 7:30 AM to 7:59 AM | 164 (8.6%) | 180 (13.6%) |
| 8:00 AM to 8:29 AM | 24 (1.3%) | 71 (5.4%) |
| 8:30 AM to 8:59 AM | 4 (0.2%) | 119 (9.0%) |
| 9:00 AM to 9:59 AM | 26 (1.4%) | 67 (5.1%) |
| 10:00 AM to 10:59 AM | 18 (0.9%) | 34 (2.6%) |
| 11:00 AM to 11:59 AM | 7 (0.4%) | 0 (0.0%) |
| 12:00 PM to 3:59 PM | 164 (8.6%) | 104 (7.9%) |
| 4:00 PM to 11:59 PM | 178 (9.4%) | 96 (7.3%) |
| Total | 1,895 (100.0%) | 1,321 (100.0%) |
Housing Occupancy in Crittenden County
Occupancy by Ownership in Crittenden County
Of the total 3,495 dwellings in Crittenden County, owner-occupied units account for 2,810 (80.4%), while renter-occupied units make up 685 (19.6%).
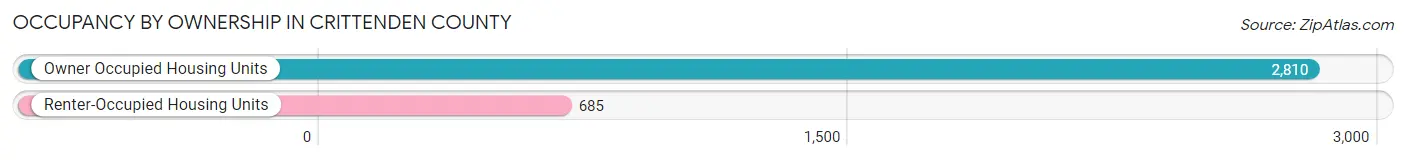
| Occupancy | # Housing Units | % Housing Units |
| Owner Occupied Housing Units | 2,810 | 80.4% |
| Renter-Occupied Housing Units | 685 | 19.6% |
| Total Occupied Housing Units | 3,495 | 100.0% |
Occupancy by Household Size in Crittenden County
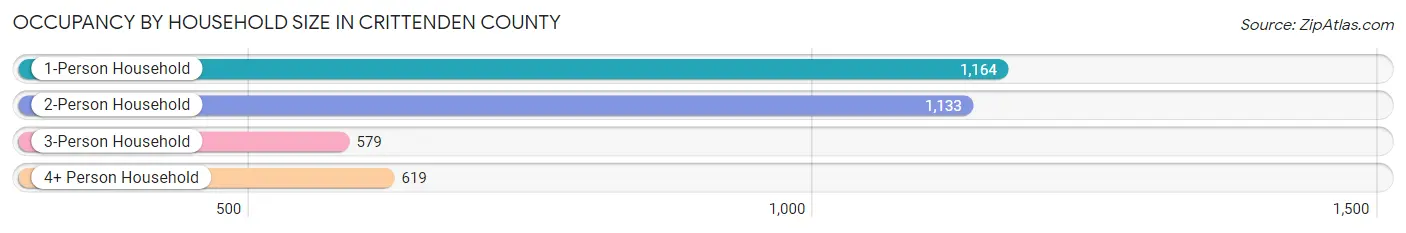
| Household Size | # Housing Units | % Housing Units |
| 1-Person Household | 1,164 | 33.3% |
| 2-Person Household | 1,133 | 32.4% |
| 3-Person Household | 579 | 16.6% |
| 4+ Person Household | 619 | 17.7% |
| Total Housing Units | 3,495 | 100.0% |
Occupancy by Ownership by Household Size in Crittenden County
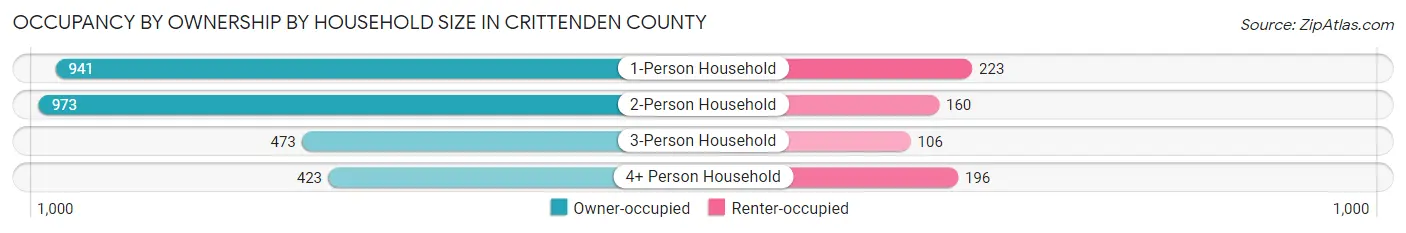
| Household Size | Owner-occupied | Renter-occupied |
| 1-Person Household | 941 (80.8%) | 223 (19.2%) |
| 2-Person Household | 973 (85.9%) | 160 (14.1%) |
| 3-Person Household | 473 (81.7%) | 106 (18.3%) |
| 4+ Person Household | 423 (68.3%) | 196 (31.7%) |
| Total Housing Units | 2,810 (80.4%) | 685 (19.6%) |
Occupancy by Educational Attainment in Crittenden County
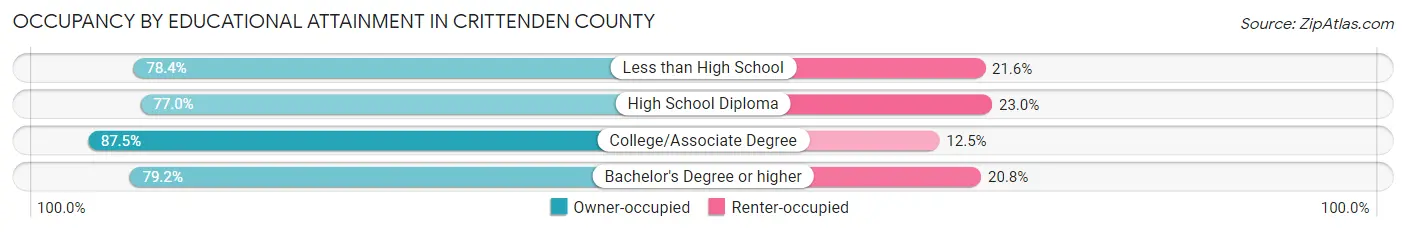
| Household Size | Owner-occupied | Renter-occupied |
| Less than High School | 378 (78.4%) | 104 (21.6%) |
| High School Diploma | 1,184 (77.0%) | 353 (23.0%) |
| College/Associate Degree | 837 (87.5%) | 120 (12.5%) |
| Bachelor's Degree or higher | 411 (79.2%) | 108 (20.8%) |
Occupancy by Age of Householder in Crittenden County
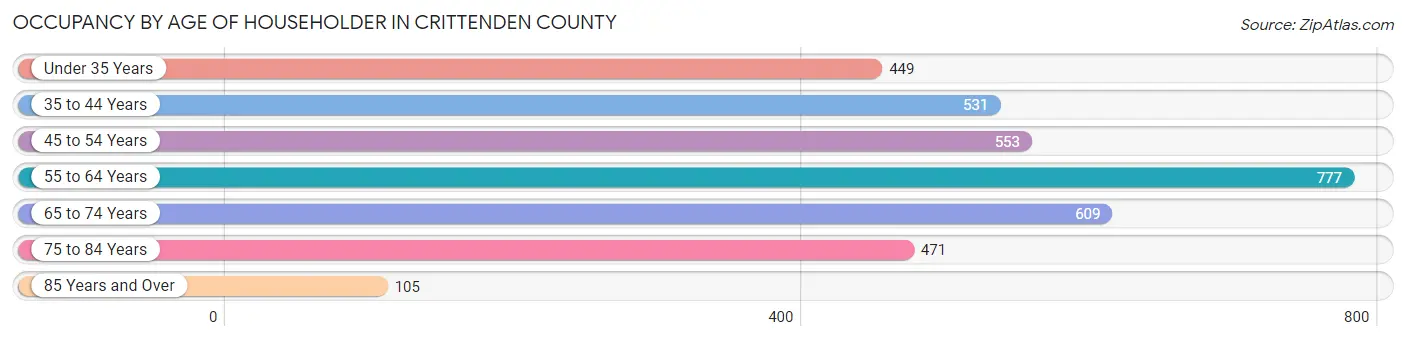
| Age Bracket | # Households | % Households |
| Under 35 Years | 449 | 12.9% |
| 35 to 44 Years | 531 | 15.2% |
| 45 to 54 Years | 553 | 15.8% |
| 55 to 64 Years | 777 | 22.2% |
| 65 to 74 Years | 609 | 17.4% |
| 75 to 84 Years | 471 | 13.5% |
| 85 Years and Over | 105 | 3.0% |
| Total | 3,495 | 100.0% |
Housing Finances in Crittenden County
Median Income by Occupancy in Crittenden County
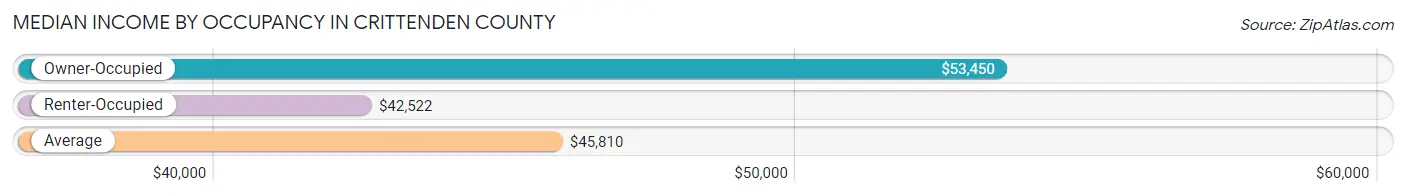
| Occupancy Type | # Households | Median Income |
| Owner-Occupied | 2,810 (80.4%) | $53,450 |
| Renter-Occupied | 685 (19.6%) | $42,522 |
| Average | 3,495 (100.0%) | $45,810 |
Occupancy by Householder Income Bracket in Crittenden County
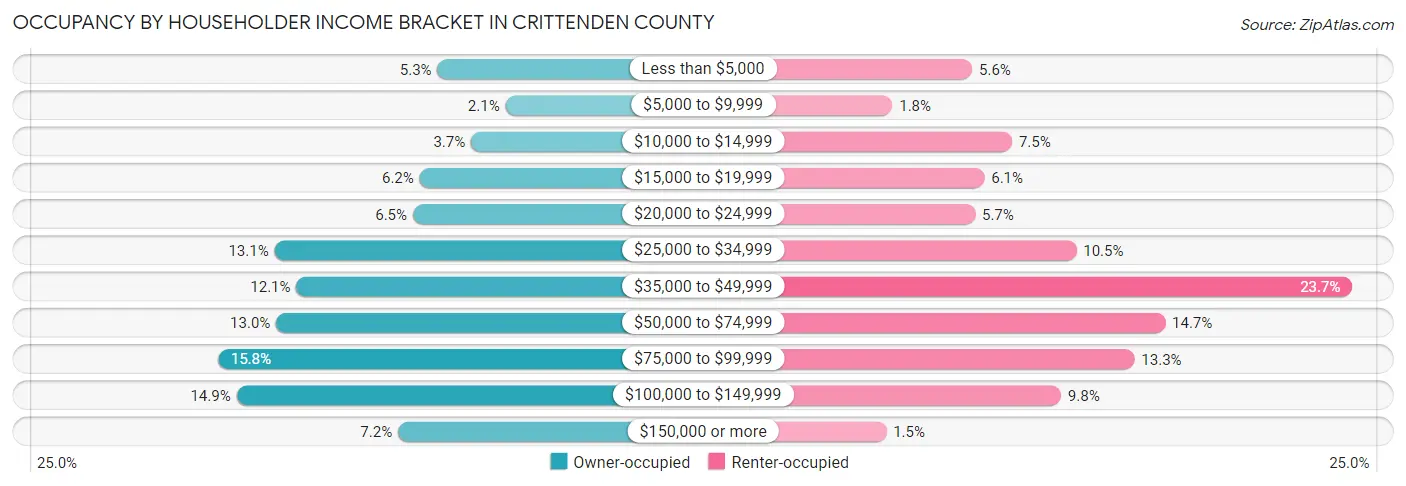
| Income Bracket | Owner-occupied | Renter-occupied |
| Less than $5,000 | 150 (5.3%) | 38 (5.6%) |
| $5,000 to $9,999 | 59 (2.1%) | 12 (1.8%) |
| $10,000 to $14,999 | 105 (3.7%) | 51 (7.4%) |
| $15,000 to $19,999 | 174 (6.2%) | 42 (6.1%) |
| $20,000 to $24,999 | 183 (6.5%) | 39 (5.7%) |
| $25,000 to $34,999 | 368 (13.1%) | 72 (10.5%) |
| $35,000 to $49,999 | 339 (12.1%) | 162 (23.6%) |
| $50,000 to $74,999 | 366 (13.0%) | 101 (14.7%) |
| $75,000 to $99,999 | 444 (15.8%) | 91 (13.3%) |
| $100,000 to $149,999 | 419 (14.9%) | 67 (9.8%) |
| $150,000 or more | 203 (7.2%) | 10 (1.5%) |
| Total | 2,810 (100.0%) | 685 (100.0%) |
Monthly Housing Cost Tiers in Crittenden County
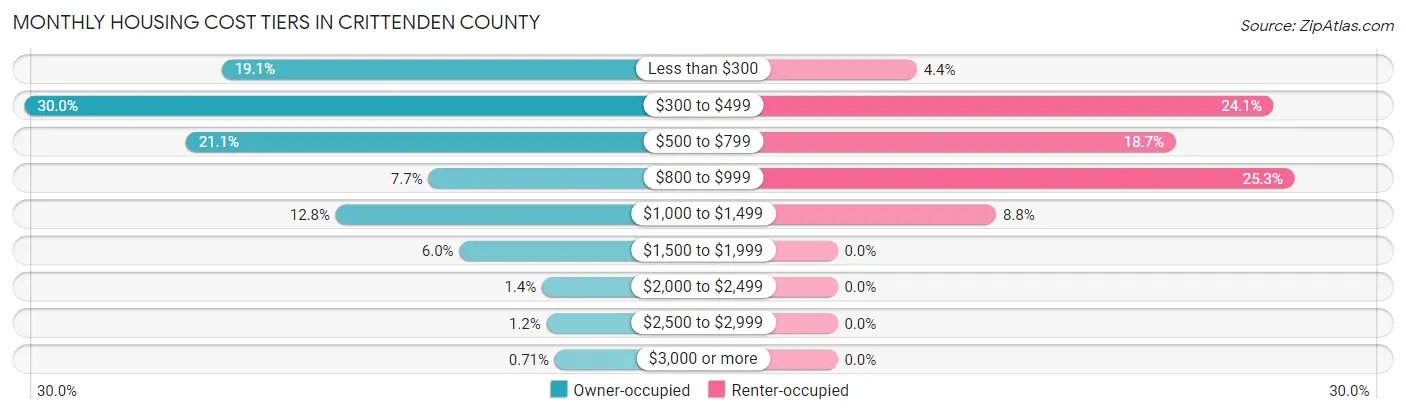
| Monthly Cost | Owner-occupied | Renter-occupied |
| Less than $300 | 537 (19.1%) | 30 (4.4%) |
| $300 to $499 | 843 (30.0%) | 165 (24.1%) |
| $500 to $799 | 593 (21.1%) | 128 (18.7%) |
| $800 to $999 | 216 (7.7%) | 173 (25.3%) |
| $1,000 to $1,499 | 360 (12.8%) | 60 (8.8%) |
| $1,500 to $1,999 | 168 (6.0%) | 0 (0.0%) |
| $2,000 to $2,499 | 40 (1.4%) | 0 (0.0%) |
| $2,500 to $2,999 | 33 (1.2%) | 0 (0.0%) |
| $3,000 or more | 20 (0.7%) | 0 (0.0%) |
| Total | 2,810 (100.0%) | 685 (100.0%) |
Physical Housing Characteristics in Crittenden County
Housing Structures in Crittenden County
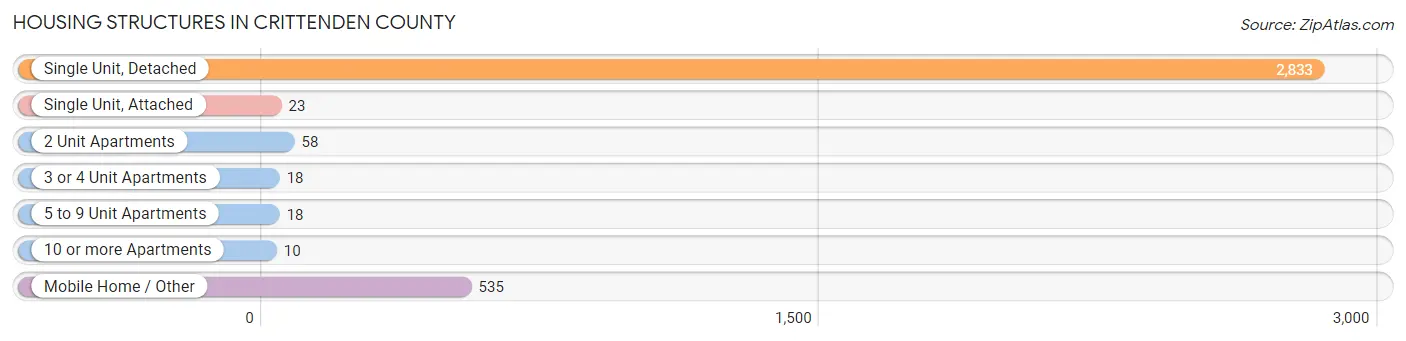
| Structure Type | # Housing Units | % Housing Units |
| Single Unit, Detached | 2,833 | 81.1% |
| Single Unit, Attached | 23 | 0.7% |
| 2 Unit Apartments | 58 | 1.7% |
| 3 or 4 Unit Apartments | 18 | 0.5% |
| 5 to 9 Unit Apartments | 18 | 0.5% |
| 10 or more Apartments | 10 | 0.3% |
| Mobile Home / Other | 535 | 15.3% |
| Total | 3,495 | 100.0% |
Housing Structures by Occupancy in Crittenden County
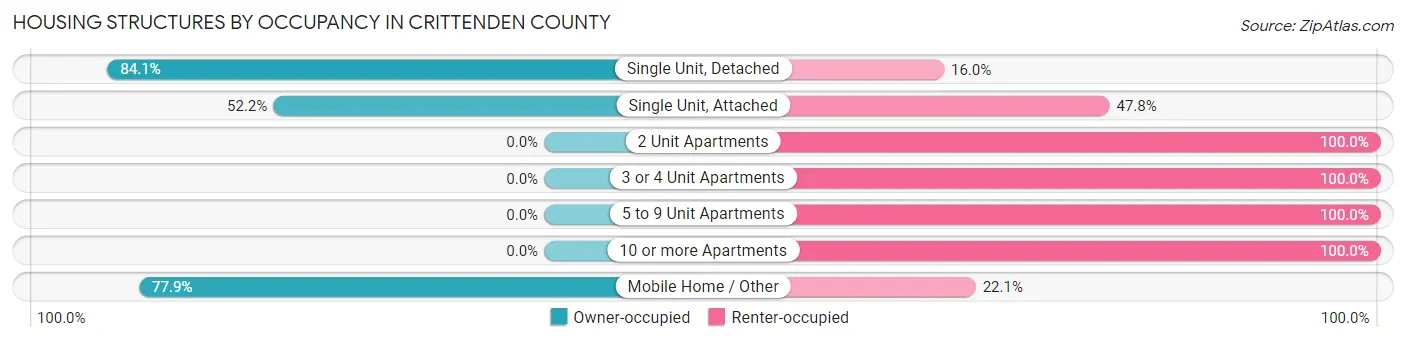
| Structure Type | Owner-occupied | Renter-occupied |
| Single Unit, Detached | 2,381 (84.1%) | 452 (16.0%) |
| Single Unit, Attached | 12 (52.2%) | 11 (47.8%) |
| 2 Unit Apartments | 0 (0.0%) | 58 (100.0%) |
| 3 or 4 Unit Apartments | 0 (0.0%) | 18 (100.0%) |
| 5 to 9 Unit Apartments | 0 (0.0%) | 18 (100.0%) |
| 10 or more Apartments | 0 (0.0%) | 10 (100.0%) |
| Mobile Home / Other | 417 (77.9%) | 118 (22.1%) |
| Total | 2,810 (80.4%) | 685 (19.6%) |
Housing Structures by Number of Rooms in Crittenden County
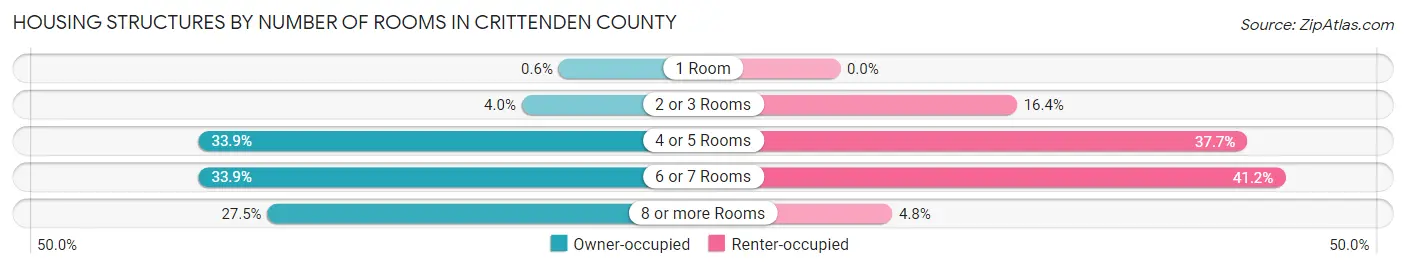
| Number of Rooms | Owner-occupied | Renter-occupied |
| 1 Room | 17 (0.6%) | 0 (0.0%) |
| 2 or 3 Rooms | 113 (4.0%) | 112 (16.4%) |
| 4 or 5 Rooms | 953 (33.9%) | 258 (37.7%) |
| 6 or 7 Rooms | 953 (33.9%) | 282 (41.2%) |
| 8 or more Rooms | 774 (27.5%) | 33 (4.8%) |
| Total | 2,810 (100.0%) | 685 (100.0%) |
Housing Structure by Heating Type in Crittenden County
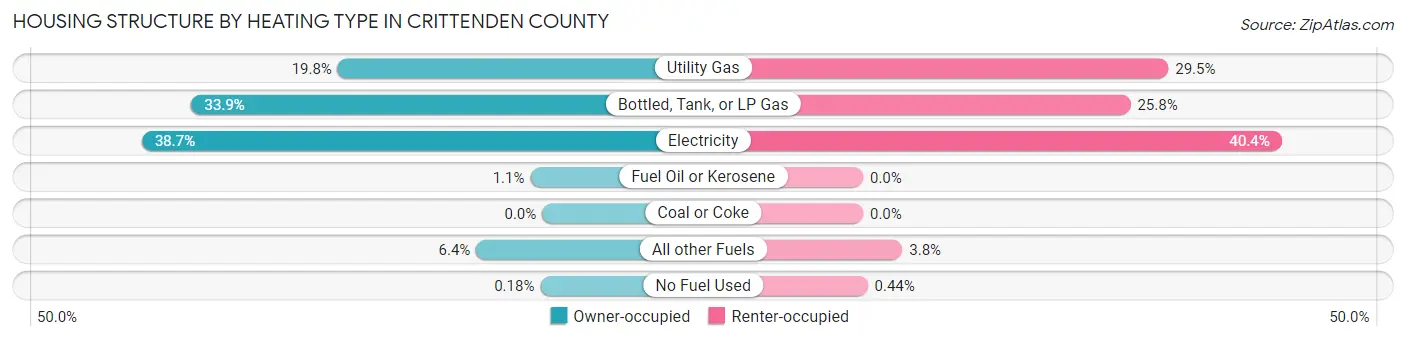
| Heating Type | Owner-occupied | Renter-occupied |
| Utility Gas | 555 (19.8%) | 202 (29.5%) |
| Bottled, Tank, or LP Gas | 952 (33.9%) | 177 (25.8%) |
| Electricity | 1,087 (38.7%) | 277 (40.4%) |
| Fuel Oil or Kerosene | 32 (1.1%) | 0 (0.0%) |
| Coal or Coke | 0 (0.0%) | 0 (0.0%) |
| All other Fuels | 179 (6.4%) | 26 (3.8%) |
| No Fuel Used | 5 (0.2%) | 3 (0.4%) |
| Total | 2,810 (100.0%) | 685 (100.0%) |
Household Vehicle Usage in Crittenden County
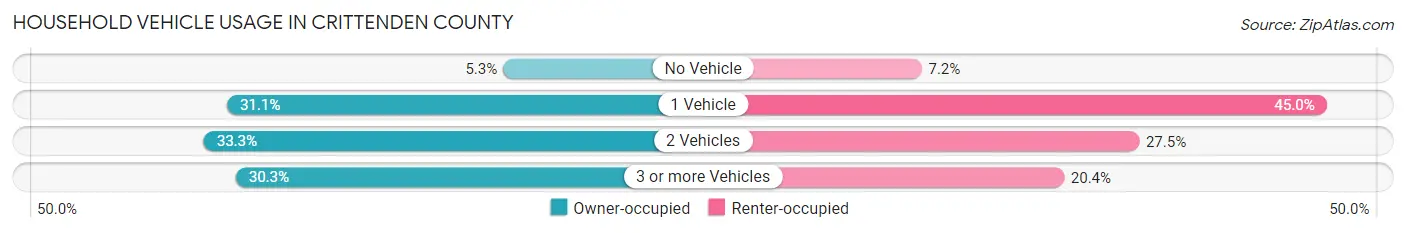
| Vehicles per Household | Owner-occupied | Renter-occupied |
| No Vehicle | 150 (5.3%) | 49 (7.1%) |
| 1 Vehicle | 874 (31.1%) | 308 (45.0%) |
| 2 Vehicles | 935 (33.3%) | 188 (27.5%) |
| 3 or more Vehicles | 851 (30.3%) | 140 (20.4%) |
| Total | 2,810 (100.0%) | 685 (100.0%) |
Real Estate & Mortgages in Crittenden County
Real Estate and Mortgage Overview in Crittenden County
| Characteristic | Without Mortgage | With Mortgage |
| Housing Units | 1,666 | 1,144 |
| Median Property Value | $98,100 | $114,900 |
| Median Household Income | $36,721 | $109 |
| Monthly Housing Costs | $365 | $18 |
| Real Estate Taxes | $558 | $106 |
Property Value by Mortgage Status in Crittenden County
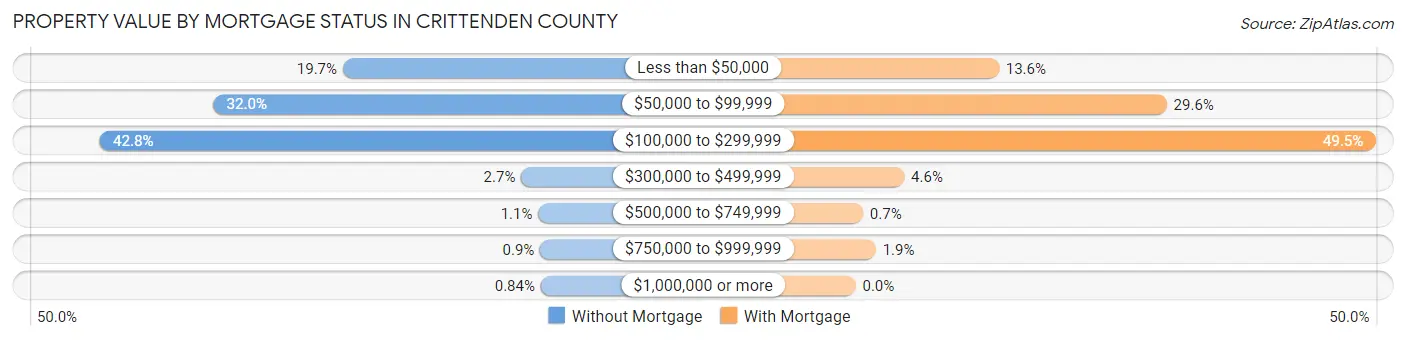
| Property Value | Without Mortgage | With Mortgage |
| Less than $50,000 | 328 (19.7%) | 156 (13.6%) |
| $50,000 to $99,999 | 533 (32.0%) | 339 (29.6%) |
| $100,000 to $299,999 | 713 (42.8%) | 566 (49.5%) |
| $300,000 to $499,999 | 45 (2.7%) | 53 (4.6%) |
| $500,000 to $749,999 | 18 (1.1%) | 8 (0.7%) |
| $750,000 to $999,999 | 15 (0.9%) | 22 (1.9%) |
| $1,000,000 or more | 14 (0.8%) | 0 (0.0%) |
| Total | 1,666 (100.0%) | 1,144 (100.0%) |
Household Income by Mortgage Status in Crittenden County
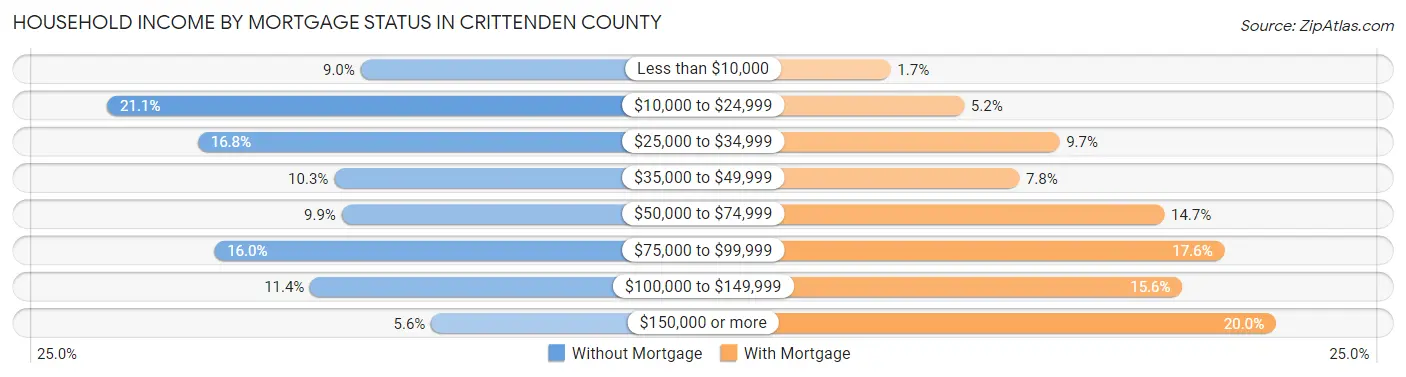
| Household Income | Without Mortgage | With Mortgage |
| Less than $10,000 | 150 (9.0%) | 19 (1.7%) |
| $10,000 to $24,999 | 351 (21.1%) | 59 (5.2%) |
| $25,000 to $34,999 | 279 (16.8%) | 111 (9.7%) |
| $35,000 to $49,999 | 171 (10.3%) | 89 (7.8%) |
| $50,000 to $74,999 | 165 (9.9%) | 168 (14.7%) |
| $75,000 to $99,999 | 266 (16.0%) | 201 (17.6%) |
| $100,000 to $149,999 | 190 (11.4%) | 178 (15.6%) |
| $150,000 or more | 94 (5.6%) | 229 (20.0%) |
| Total | 1,666 (100.0%) | 1,144 (100.0%) |
Property Value to Household Income Ratio in Crittenden County
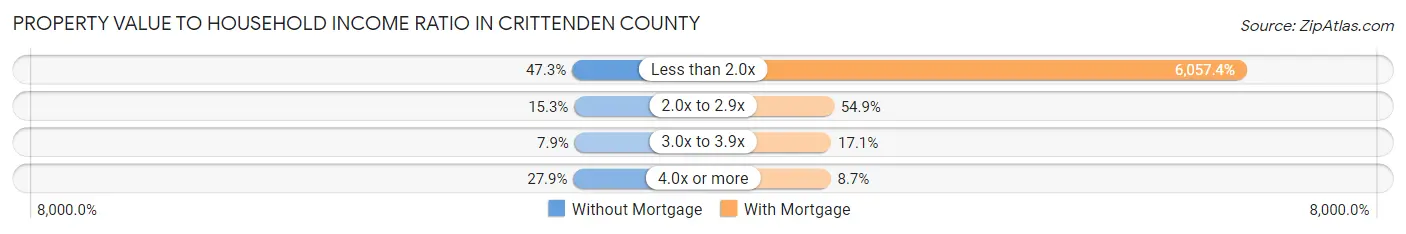
| Value-to-Income Ratio | Without Mortgage | With Mortgage |
| Less than 2.0x | 788 (47.3%) | 69,297 (6,057.4%) |
| 2.0x to 2.9x | 254 (15.2%) | 628 (54.9%) |
| 3.0x to 3.9x | 131 (7.9%) | 195 (17.1%) |
| 4.0x or more | 464 (27.9%) | 100 (8.7%) |
| Total | 1,666 (100.0%) | 1,144 (100.0%) |
Real Estate Taxes by Mortgage Status in Crittenden County
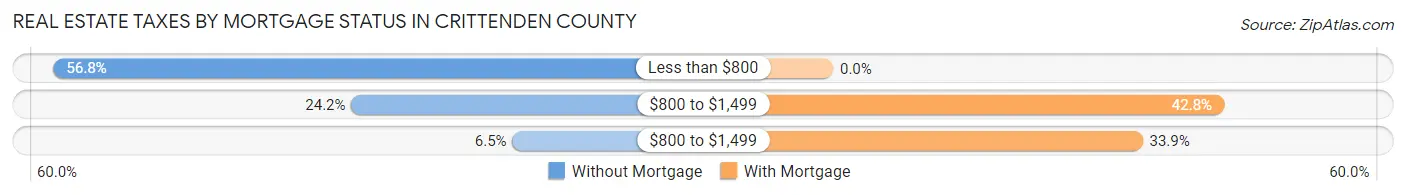
| Property Taxes | Without Mortgage | With Mortgage |
| Less than $800 | 947 (56.8%) | 0 (0.0%) |
| $800 to $1,499 | 403 (24.2%) | 490 (42.8%) |
| $800 to $1,499 | 109 (6.5%) | 388 (33.9%) |
| Total | 1,666 (100.0%) | 1,144 (100.0%) |
Health & Disability in Crittenden County
Health Insurance Coverage by Age in Crittenden County
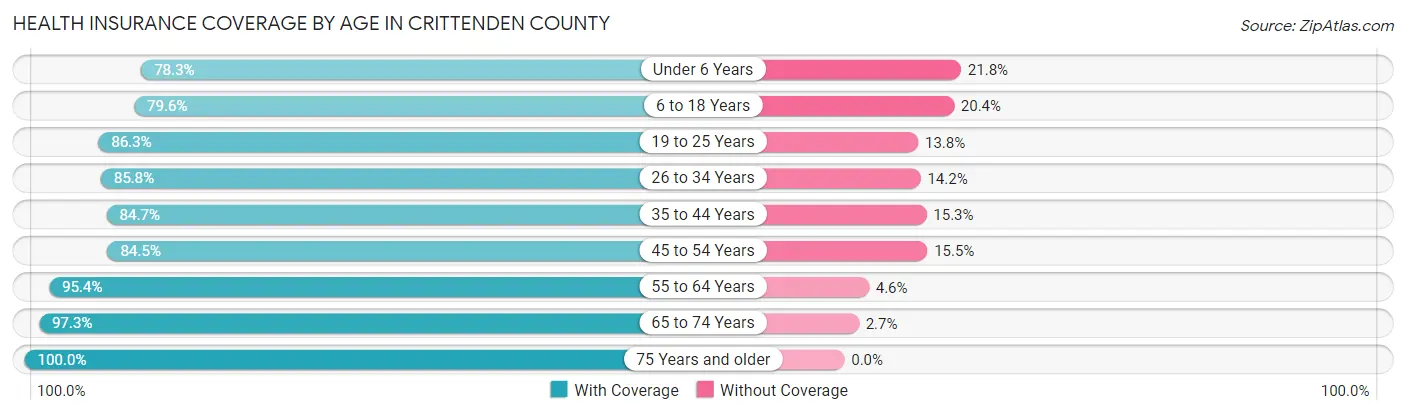
| Age Bracket | With Coverage | Without Coverage |
| Under 6 Years | 464 (78.2%) | 129 (21.7%) |
| 6 to 18 Years | 1,176 (79.6%) | 302 (20.4%) |
| 19 to 25 Years | 502 (86.3%) | 80 (13.8%) |
| 26 to 34 Years | 785 (85.8%) | 130 (14.2%) |
| 35 to 44 Years | 858 (84.7%) | 155 (15.3%) |
| 45 to 54 Years | 908 (84.5%) | 166 (15.5%) |
| 55 to 64 Years | 1,252 (95.4%) | 60 (4.6%) |
| 65 to 74 Years | 1,013 (97.3%) | 28 (2.7%) |
| 75 Years and older | 734 (100.0%) | 0 (0.0%) |
| Total | 7,692 (88.0%) | 1,050 (12.0%) |
Health Insurance Coverage by Citizenship Status in Crittenden County
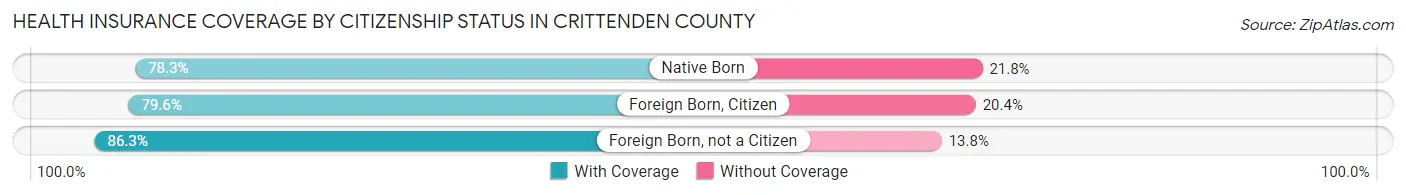
| Citizenship Status | With Coverage | Without Coverage |
| Native Born | 464 (78.2%) | 129 (21.7%) |
| Foreign Born, Citizen | 1,176 (79.6%) | 302 (20.4%) |
| Foreign Born, not a Citizen | 502 (86.3%) | 80 (13.8%) |
Health Insurance Coverage by Household Income in Crittenden County
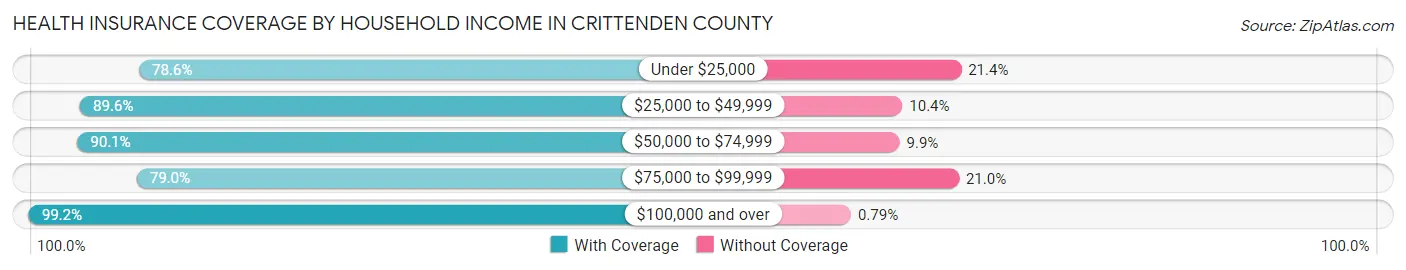
| Household Income | With Coverage | Without Coverage |
| Under $25,000 | 1,202 (78.6%) | 328 (21.4%) |
| $25,000 to $49,999 | 1,773 (89.6%) | 206 (10.4%) |
| $50,000 to $74,999 | 1,020 (90.1%) | 112 (9.9%) |
| $75,000 to $99,999 | 1,450 (79.0%) | 386 (21.0%) |
| $100,000 and over | 2,247 (99.2%) | 18 (0.8%) |
Public vs Private Health Insurance Coverage by Age in Crittenden County
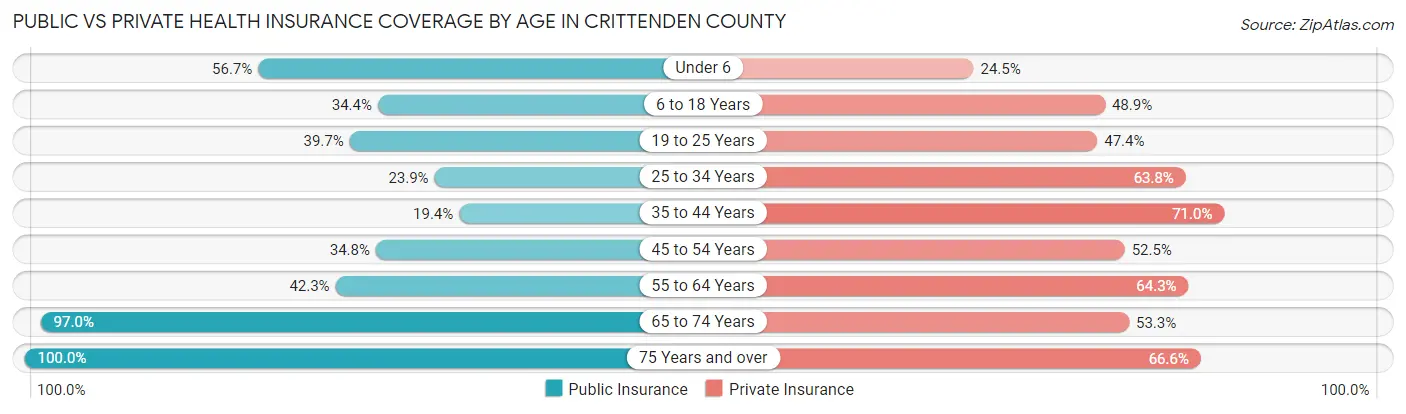
| Age Bracket | Public Insurance | Private Insurance |
| Under 6 | 336 (56.7%) | 145 (24.4%) |
| 6 to 18 Years | 509 (34.4%) | 722 (48.8%) |
| 19 to 25 Years | 231 (39.7%) | 276 (47.4%) |
| 25 to 34 Years | 219 (23.9%) | 584 (63.8%) |
| 35 to 44 Years | 196 (19.4%) | 719 (71.0%) |
| 45 to 54 Years | 374 (34.8%) | 564 (52.5%) |
| 55 to 64 Years | 555 (42.3%) | 844 (64.3%) |
| 65 to 74 Years | 1,010 (97.0%) | 555 (53.3%) |
| 75 Years and over | 734 (100.0%) | 489 (66.6%) |
| Total | 4,164 (47.6%) | 4,898 (56.0%) |
Disability Status by Sex by Age in Crittenden County
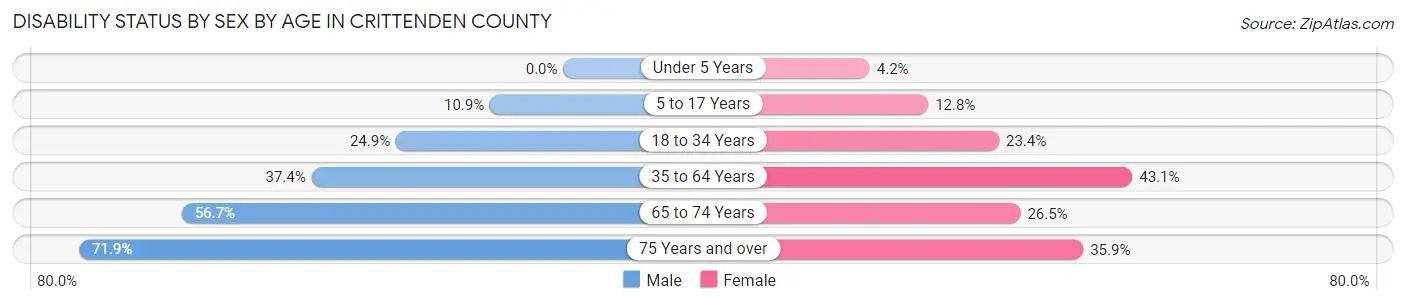
| Age Bracket | Male | Female |
| Under 5 Years | 0 (0.0%) | 10 (4.2%) |
| 5 to 17 Years | 93 (10.9%) | 87 (12.8%) |
| 18 to 34 Years | 212 (24.8%) | 166 (23.4%) |
| 35 to 64 Years | 639 (37.4%) | 729 (43.1%) |
| 65 to 74 Years | 293 (56.7%) | 139 (26.5%) |
| 75 Years and over | 233 (71.9%) | 147 (35.8%) |
Disability Class by Sex by Age in Crittenden County
Disability Class: Hearing Difficulty
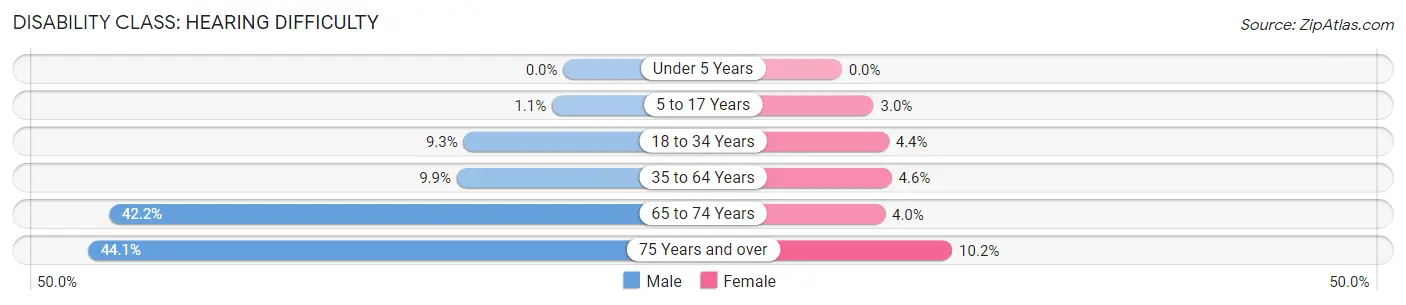
| Age Bracket | Male | Female |
| Under 5 Years | 0 (0.0%) | 0 (0.0%) |
| 5 to 17 Years | 9 (1.1%) | 20 (2.9%) |
| 18 to 34 Years | 79 (9.3%) | 31 (4.4%) |
| 35 to 64 Years | 169 (9.9%) | 78 (4.6%) |
| 65 to 74 Years | 218 (42.2%) | 21 (4.0%) |
| 75 Years and over | 143 (44.1%) | 42 (10.2%) |
Disability Class: Vision Difficulty
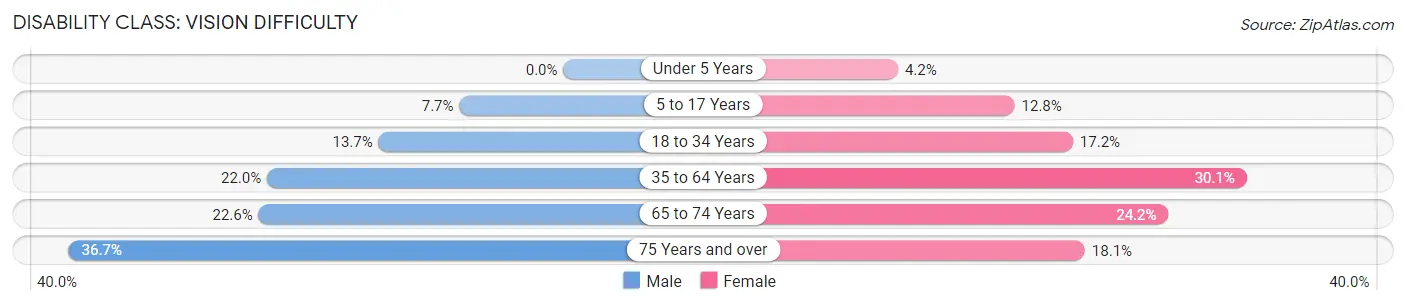
| Age Bracket | Male | Female |
| Under 5 Years | 0 (0.0%) | 10 (4.2%) |
| 5 to 17 Years | 66 (7.7%) | 87 (12.8%) |
| 18 to 34 Years | 117 (13.7%) | 122 (17.2%) |
| 35 to 64 Years | 376 (22.0%) | 508 (30.1%) |
| 65 to 74 Years | 117 (22.6%) | 127 (24.2%) |
| 75 Years and over | 119 (36.7%) | 74 (18.0%) |
Disability Class: Cognitive Difficulty
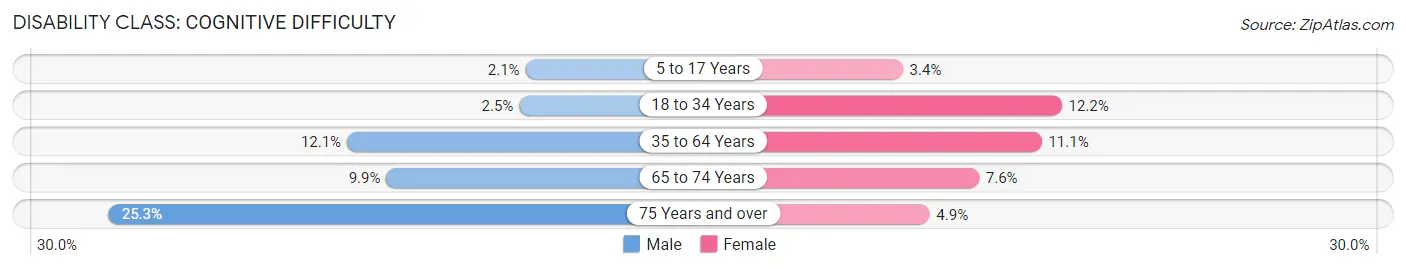
| Age Bracket | Male | Female |
| 5 to 17 Years | 18 (2.1%) | 23 (3.4%) |
| 18 to 34 Years | 21 (2.5%) | 87 (12.2%) |
| 35 to 64 Years | 206 (12.0%) | 188 (11.1%) |
| 65 to 74 Years | 51 (9.9%) | 40 (7.6%) |
| 75 Years and over | 82 (25.3%) | 20 (4.9%) |
Disability Class: Ambulatory Difficulty
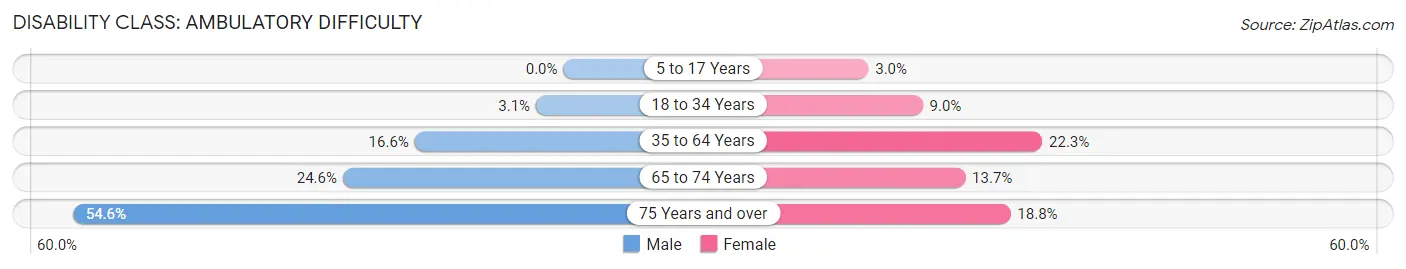
| Age Bracket | Male | Female |
| 5 to 17 Years | 0 (0.0%) | 20 (2.9%) |
| 18 to 34 Years | 26 (3.0%) | 64 (9.0%) |
| 35 to 64 Years | 283 (16.6%) | 377 (22.3%) |
| 65 to 74 Years | 127 (24.6%) | 72 (13.7%) |
| 75 Years and over | 177 (54.6%) | 77 (18.8%) |
Disability Class: Self-Care Difficulty
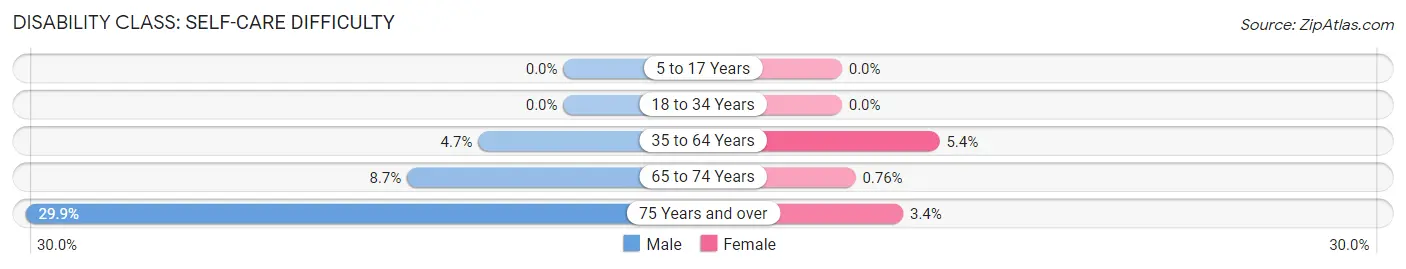
| Age Bracket | Male | Female |
| 5 to 17 Years | 0 (0.0%) | 0 (0.0%) |
| 18 to 34 Years | 0 (0.0%) | 0 (0.0%) |
| 35 to 64 Years | 81 (4.7%) | 92 (5.4%) |
| 65 to 74 Years | 45 (8.7%) | 4 (0.8%) |
| 75 Years and over | 97 (29.9%) | 14 (3.4%) |
Technology Access in Crittenden County
Computing Device Access in Crittenden County
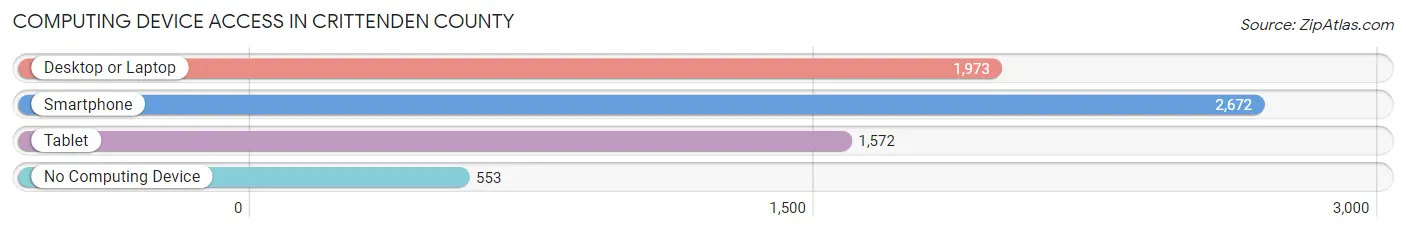
| Device Type | # Households | % Households |
| Desktop or Laptop | 1,973 | 56.5% |
| Smartphone | 2,672 | 76.4% |
| Tablet | 1,572 | 45.0% |
| No Computing Device | 553 | 15.8% |
| Total | 3,495 | 100.0% |
Internet Access in Crittenden County
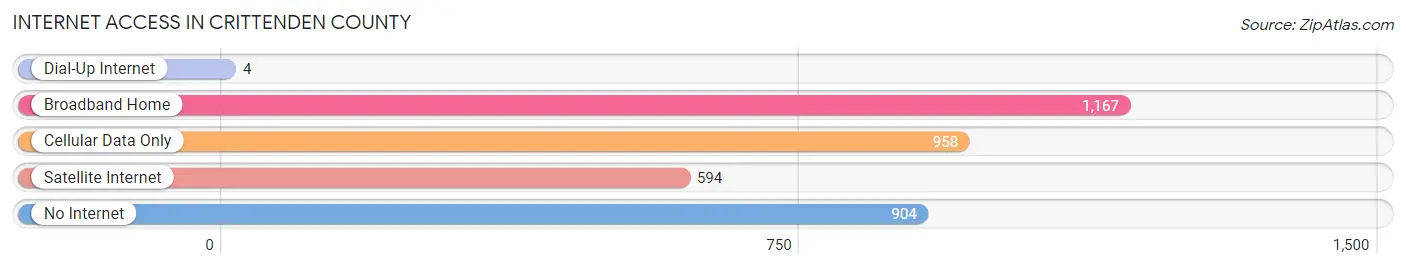
| Internet Type | # Households | % Households |
| Dial-Up Internet | 4 | 0.1% |
| Broadband Home | 1,167 | 33.4% |
| Cellular Data Only | 958 | 27.4% |
| Satellite Internet | 594 | 17.0% |
| No Internet | 904 | 25.9% |
| Total | 3,495 | 100.0% |
Crittenden County Summary
Crittenden County, Kentucky is located in the western part of the state, and is bordered by Livingston County to the north, Union County to the east, Caldwell County to the south, and Webster County to the west. The county seat is Marion, and the county was formed in 1842 from parts of Livingston, Union, and Caldwell counties. The county is named for John J. Crittenden, a former Kentucky governor and United States Senator.
Geography
Crittenden County is located in the Pennyrile region of Kentucky, and is part of the Western Coal Fields. The county is mostly flat, with some rolling hills in the northern part of the county. The highest point in the county is located in the northern part of the county, and is approximately 590 feet above sea level. The county is drained by the Tradewater River, which flows through the county from north to south. The county is also home to several small lakes, including Lake Beshear, Lake Barkley, and Lake Malone.
The county has a total area of 441 square miles, of which 437 square miles is land and 4.2 square miles is water. The county is home to several state parks, including Lake Beshear State Park, Lake Barkley State Park, and Lake Malone State Park.
Demographics
As of the 2010 census, there were 9,315 people, 3,717 households, and 2,619 families residing in the county. The population density was 21.2 people per square mile. The racial makeup of the county was 95.3% White, 2.3% Black or African American, 0.2% Native American, 0.2% Asian, 0.1% Pacific Islander, 0.7% from other races, and 1.2% from two or more races. Hispanic or Latino of any race were 1.7% of the population.
The median income for a household in the county was $35,945, and the median income for a family was $43,945. The per capita income for the county was $17,945. About 16.2% of families and 19.7% of the population were below the poverty line, including 25.2% of those under age 18 and 16.2% of those age 65 or over.
Economy
Crittenden County is a largely rural county, and the economy is largely based on agriculture. The county is home to several large farms, and the main crops grown in the county are corn, soybeans, wheat, and hay. The county is also home to several small businesses, including restaurants, retail stores, and service businesses.
The county is also home to several manufacturing companies, including a furniture manufacturer, a plastics manufacturer, and a metal fabrication company. The county is also home to several coal mines, and the coal industry is a major employer in the county.
Crittenden County is also home to several tourist attractions, including Lake Beshear State Park, Lake Barkley State Park, and Lake Malone State Park. The county is also home to several historic sites, including the Crittenden County Courthouse, the Crittenden County Jail, and the Crittenden County Museum.
Conclusion
Crittenden County, Kentucky is a largely rural county located in the western part of the state. The county is home to several state parks, and is a popular tourist destination. The economy of the county is largely based on agriculture, and the county is also home to several manufacturing companies and coal mines. The county is also home to several historic sites, and is a great place to visit and explore.
Common Questions
What is Per Capita Income in Crittenden County?
Per Capita income in Crittenden County is $28,035.
What is the Median Family Income in Crittenden County?
Median Family Income in Crittenden County is $75,214.
What is the Median Household income in Crittenden County?
Median Household Income in Crittenden County is $45,810.
What is Income or Wage Gap in Crittenden County?
Income or Wage Gap in Crittenden County is 46.0%.
Women in Crittenden County earn 54.0 cents for every dollar earned by a man.
What is Inequality or Gini Index in Crittenden County?
Inequality or Gini Index in Crittenden County is 0.47.
What is the Total Population of Crittenden County?
Total Population of Crittenden County is 8,979.
What is the Total Male Population of Crittenden County?
Total Male Population of Crittenden County is 4,618.
What is the Total Female Population of Crittenden County?
Total Female Population of Crittenden County is 4,361.
What is the Ratio of Males per 100 Females in Crittenden County?
There are 105.89 Males per 100 Females in Crittenden County.
What is the Ratio of Females per 100 Males in Crittenden County?
There are 94.43 Females per 100 Males in Crittenden County.
What is the Median Population Age in Crittenden County?
Median Population Age in Crittenden County is 43.4 Years.
What is the Average Family Size in Crittenden County
Average Family Size in Crittenden County is 3.2 People.
What is the Average Household Size in Crittenden County
Average Household Size in Crittenden County is 2.5 People.
How Large is the Labor Force in Crittenden County?
There are 3,611 People in the Labor Forcein in Crittenden County.
What is the Percentage of People in the Labor Force in Crittenden County?
50.2% of People are in the Labor Force in Crittenden County.
What is the Unemployment Rate in Crittenden County?
Unemployment Rate in Crittenden County is 3.4%.