Clinton County, KY Map & Demographics
Clinton County Map
Clinton County Overview
$23,905
PER CAPITA INCOME
$48,876
AVG FAMILY INCOME
$41,180
AVG HOUSEHOLD INCOME
15.1%
WAGE / INCOME GAP [ % ]
84.9¢/ $1
WAGE / INCOME GAP [ $ ]
$10,182
FAMILY INCOME DEFICIT
0.46
INEQUALITY / GINI INDEX
9,295
TOTAL POPULATION
4,644
MALE POPULATION
4,651
FEMALE POPULATION
99.85
MALES / 100 FEMALES
100.15
FEMALES / 100 MALES
42.4
MEDIAN AGE
3.2
AVG FAMILY SIZE
2.5
AVG HOUSEHOLD SIZE
3,970
LABOR FORCE [ PEOPLE ]
52.5%
PERCENT IN LABOR FORCE
5.6%
UNEMPLOYMENT RATE
Clinton County Area Codes
Income in Clinton County
Income Overview in Clinton County
Per Capita Income in Clinton County is $23,905, while median incomes of families and households are $48,876 and $41,180 respectively.
| Characteristic | Number | Measure |
| Per Capita Income | 9,295 | $23,905 |
| Median Family Income | 2,264 | $48,876 |
| Mean Family Income | 2,264 | $66,001 |
| Median Household Income | 3,672 | $41,180 |
| Mean Household Income | 3,672 | $57,130 |
| Income Deficit | 2,264 | $10,182 |
| Wage / Income Gap (%) | 9,295 | 15.06% |
| Wage / Income Gap ($) | 9,295 | 84.94¢ per $1 |
| Gini / Inequality Index | 9,295 | 0.46 |
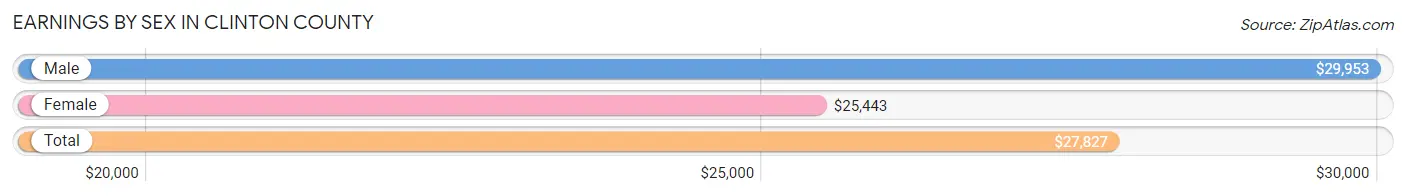
Earnings by Sex in Clinton County
Average Earnings in Clinton County are $27,827, $29,953 for men and $25,443 for women, a difference of 15.1%.
| Sex | Number | Average Earnings |
| Male | 2,229 (52.5%) | $29,953 |
| Female | 2,019 (47.5%) | $25,443 |
| Total | 4,248 (100.0%) | $27,827 |
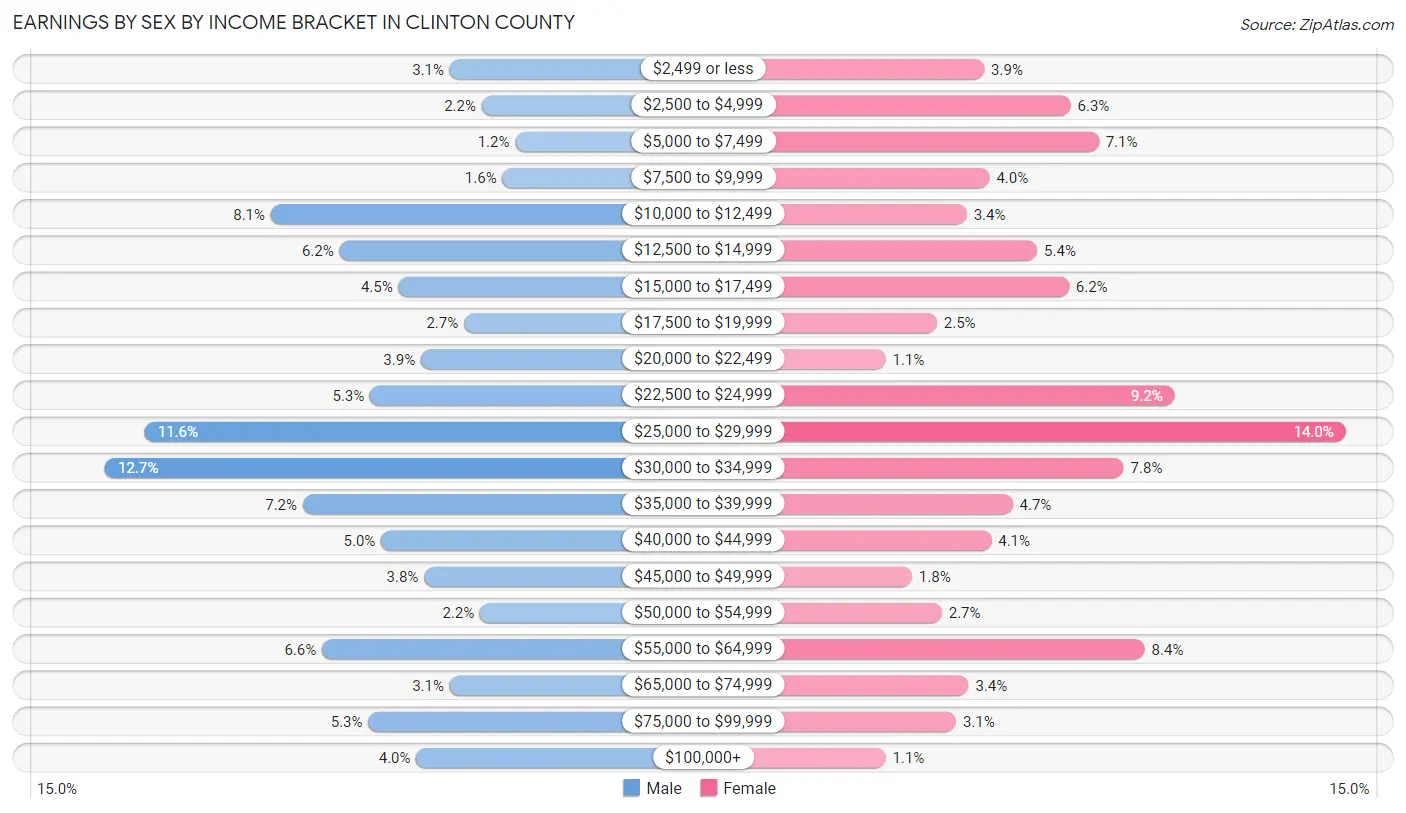
Earnings by Sex by Income Bracket in Clinton County
The most common earnings brackets in Clinton County are $30,000 to $34,999 for men (284 | 12.7%) and $25,000 to $29,999 for women (283 | 14.0%).
| Income | Male | Female |
| $2,499 or less | 68 (3.0%) | 78 (3.9%) |
| $2,500 to $4,999 | 48 (2.1%) | 127 (6.3%) |
| $5,000 to $7,499 | 27 (1.2%) | 143 (7.1%) |
| $7,500 to $9,999 | 35 (1.6%) | 81 (4.0%) |
| $10,000 to $12,499 | 180 (8.1%) | 68 (3.4%) |
| $12,500 to $14,999 | 137 (6.1%) | 108 (5.3%) |
| $15,000 to $17,499 | 100 (4.5%) | 126 (6.2%) |
| $17,500 to $19,999 | 59 (2.6%) | 51 (2.5%) |
| $20,000 to $22,499 | 86 (3.9%) | 22 (1.1%) |
| $22,500 to $24,999 | 118 (5.3%) | 186 (9.2%) |
| $25,000 to $29,999 | 259 (11.6%) | 283 (14.0%) |
| $30,000 to $34,999 | 284 (12.7%) | 157 (7.8%) |
| $35,000 to $39,999 | 160 (7.2%) | 94 (4.7%) |
| $40,000 to $44,999 | 111 (5.0%) | 82 (4.1%) |
| $45,000 to $49,999 | 84 (3.8%) | 37 (1.8%) |
| $50,000 to $54,999 | 49 (2.2%) | 54 (2.7%) |
| $55,000 to $64,999 | 148 (6.6%) | 169 (8.4%) |
| $65,000 to $74,999 | 68 (3.0%) | 69 (3.4%) |
| $75,000 to $99,999 | 119 (5.3%) | 62 (3.1%) |
| $100,000+ | 89 (4.0%) | 22 (1.1%) |
| Total | 2,229 (100.0%) | 2,019 (100.0%) |
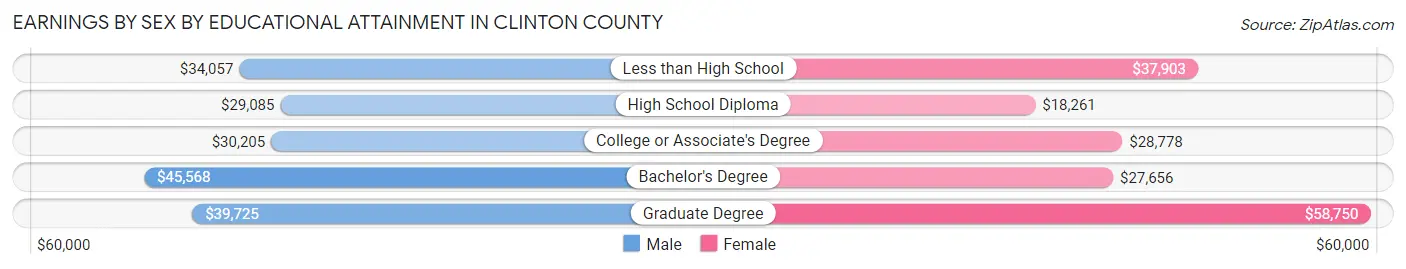
Earnings by Sex by Educational Attainment in Clinton County
Average earnings in Clinton County are $32,569 for men and $27,318 for women, a difference of 16.1%. Men with an educational attainment of bachelor's degree enjoy the highest average annual earnings of $45,568, while those with high school diploma education earn the least with $29,085. Women with an educational attainment of graduate degree earn the most with the average annual earnings of $58,750, while those with high school diploma education have the smallest earnings of $18,261.
| Educational Attainment | Male Income | Female Income |
| Less than High School | $34,057 | $37,903 |
| High School Diploma | $29,085 | $18,261 |
| College or Associate's Degree | $30,205 | $28,778 |
| Bachelor's Degree | $45,568 | $27,656 |
| Graduate Degree | $39,725 | $58,750 |
| Total | $32,569 | $27,318 |
Family Income in Clinton County
Family Income Brackets in Clinton County
According to the Clinton County family income data, there are 534 families falling into the $35,000 to $49,999 income range, which is the most common income bracket and makes up 23.6% of all families. Conversely, the $200,000+ income bracket is the least frequent group with only 52 families (2.3%) belonging to this category.
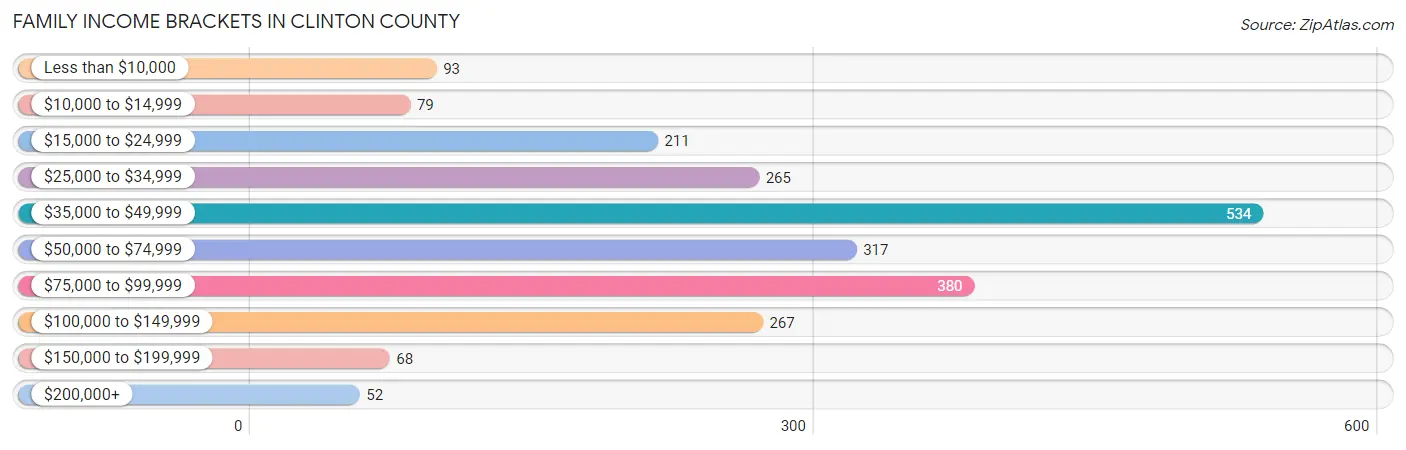
| Income Bracket | # Families | % Families |
| Less than $10,000 | 93 | 4.1% |
| $10,000 to $14,999 | 79 | 3.5% |
| $15,000 to $24,999 | 211 | 9.3% |
| $25,000 to $34,999 | 265 | 11.7% |
| $35,000 to $49,999 | 534 | 23.6% |
| $50,000 to $74,999 | 317 | 14.0% |
| $75,000 to $99,999 | 380 | 16.8% |
| $100,000 to $149,999 | 267 | 11.8% |
| $150,000 to $199,999 | 68 | 3.0% |
| $200,000+ | 52 | 2.3% |
Family Income by Famaliy Size in Clinton County
5-person families (213 | 9.4%) account for the highest median family income in Clinton County with $63,875 per family, while 2-person families (1,116 | 49.3%) have the highest median income of $24,050 per family member.
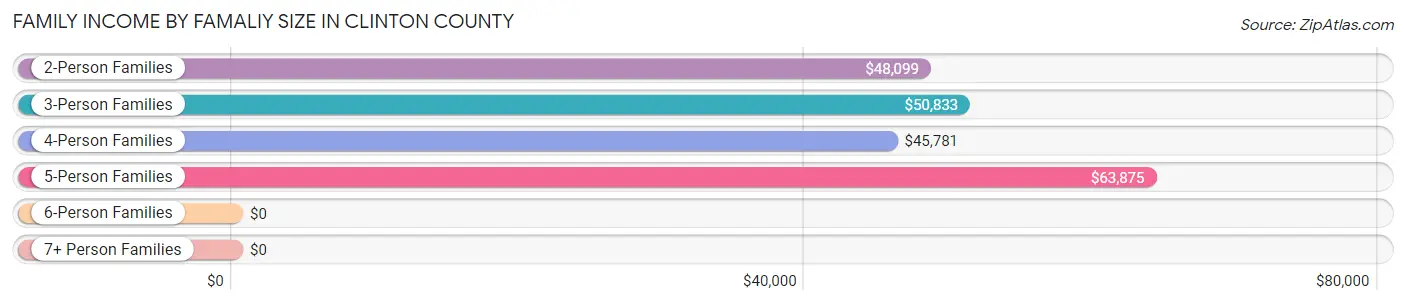
| Income Bracket | # Families | Median Income |
| 2-Person Families | 1,116 (49.3%) | $48,099 |
| 3-Person Families | 558 (24.6%) | $50,833 |
| 4-Person Families | 356 (15.7%) | $45,781 |
| 5-Person Families | 213 (9.4%) | $63,875 |
| 6-Person Families | 9 (0.4%) | $0 |
| 7+ Person Families | 12 (0.5%) | $0 |
| Total | 2,264 (100.0%) | $48,876 |
Family Income by Number of Earners in Clinton County
The median family income in Clinton County is $48,876, with families comprising 3+ earners (243) having the highest median family income of $85,573, while families with no earners (565) have the lowest median family income of $33,125, accounting for 10.7% and 25.0% of families, respectively.
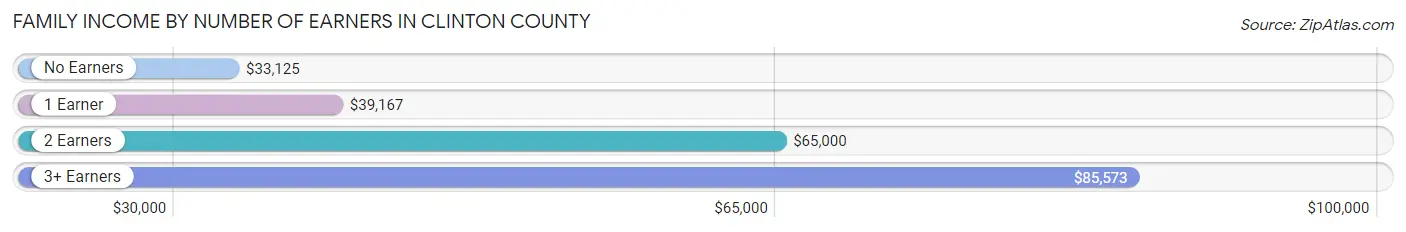
| Number of Earners | # Families | Median Income |
| No Earners | 565 (25.0%) | $33,125 |
| 1 Earner | 682 (30.1%) | $39,167 |
| 2 Earners | 774 (34.2%) | $65,000 |
| 3+ Earners | 243 (10.7%) | $85,573 |
| Total | 2,264 (100.0%) | $48,876 |
Household Income in Clinton County
Household Income Brackets in Clinton County
With 771 households falling in the category, the $35,000 to $49,999 income range is the most frequent in Clinton County, accounting for 21.0% of all households. In contrast, only 62 households (1.7%) fall into the $200,000+ income bracket, making it the least populous group.
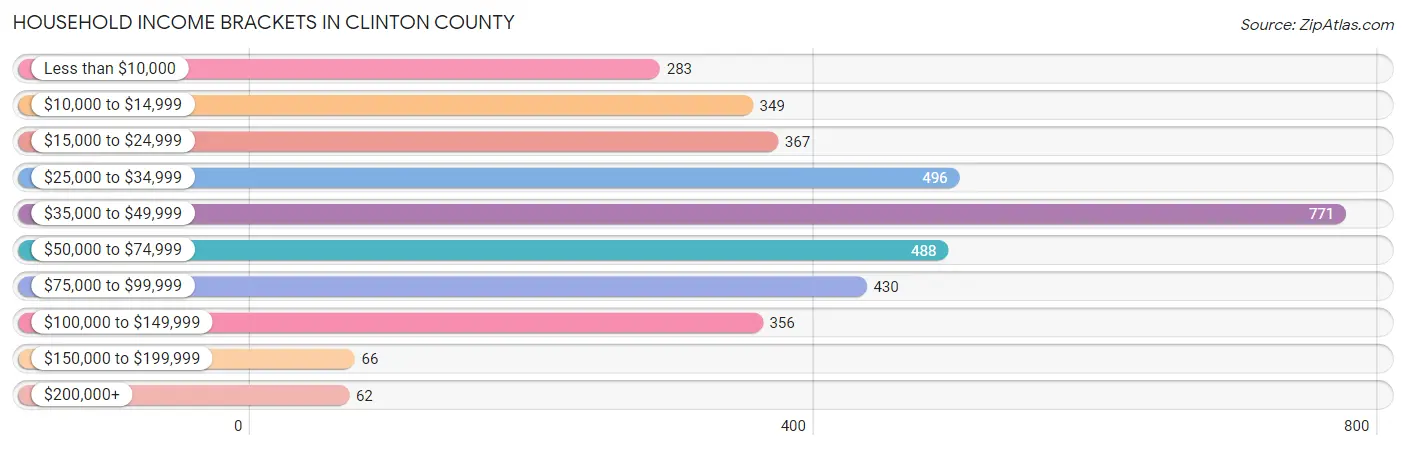
| Income Bracket | # Households | % Households |
| Less than $10,000 | 283 | 7.7% |
| $10,000 to $14,999 | 349 | 9.5% |
| $15,000 to $24,999 | 367 | 10.0% |
| $25,000 to $34,999 | 496 | 13.5% |
| $35,000 to $49,999 | 771 | 21.0% |
| $50,000 to $74,999 | 488 | 13.3% |
| $75,000 to $99,999 | 430 | 11.7% |
| $100,000 to $149,999 | 356 | 9.7% |
| $150,000 to $199,999 | 66 | 1.8% |
| $200,000+ | 62 | 1.7% |
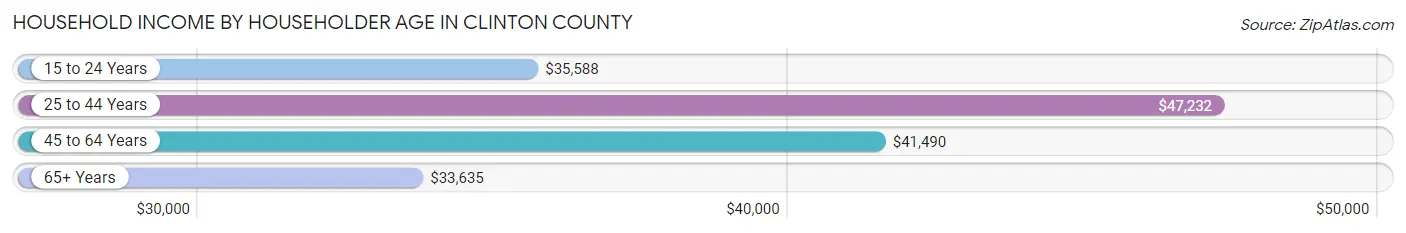
Household Income by Householder Age in Clinton County
The median household income in Clinton County is $41,180, with the highest median household income of $47,232 found in the 25 to 44 years age bracket for the primary householder. A total of 920 households (25.1%) fall into this category. Meanwhile, the 65+ years age bracket for the primary householder has the lowest median household income of $33,635, with 1,089 households (29.7%) in this group.
| Income Bracket | # Households | Median Income |
| 15 to 24 Years | 84 (2.3%) | $35,588 |
| 25 to 44 Years | 920 (25.1%) | $47,232 |
| 45 to 64 Years | 1,579 (43.0%) | $41,490 |
| 65+ Years | 1,089 (29.7%) | $33,635 |
| Total | 3,672 (100.0%) | $41,180 |
Poverty in Clinton County
Income Below Poverty by Sex and Age in Clinton County
With 17.3% poverty level for males and 23.2% for females among the residents of Clinton County, 6 to 11 year old males and 5 year old females are the most vulnerable to poverty, with 131 males (51.6%) and 55 females (88.7%) in their respective age groups living below the poverty level.
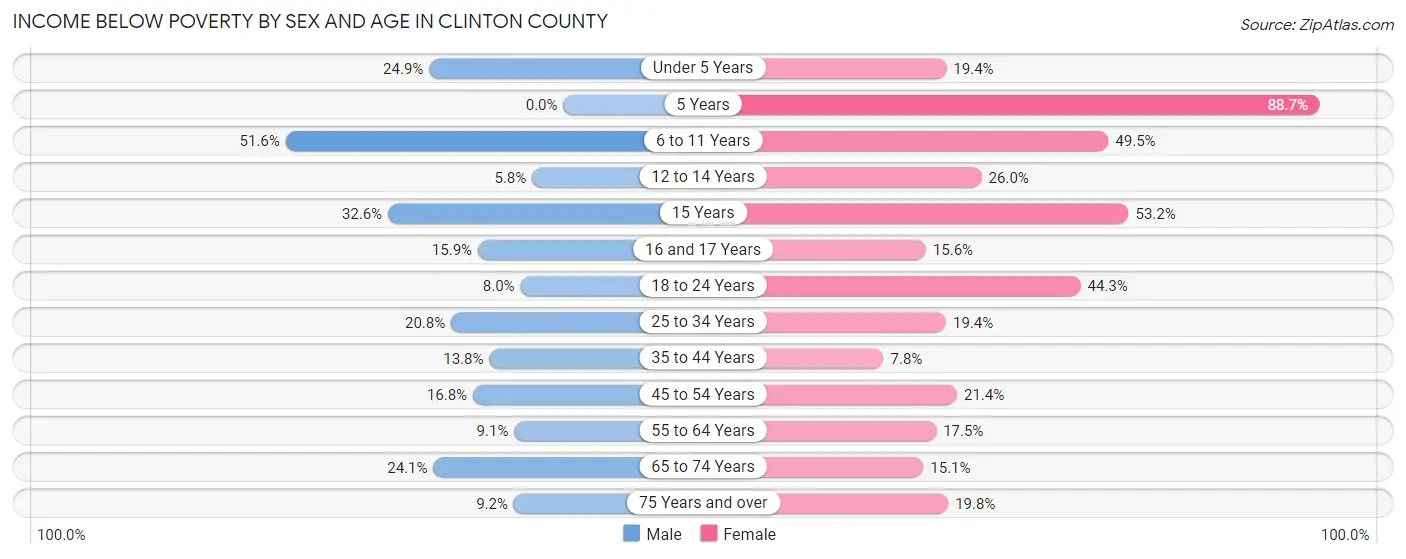
| Age Bracket | Male | Female |
| Under 5 Years | 69 (24.9%) | 47 (19.4%) |
| 5 Years | 0 (0.0%) | 55 (88.7%) |
| 6 to 11 Years | 131 (51.6%) | 193 (49.5%) |
| 12 to 14 Years | 12 (5.8%) | 27 (26.0%) |
| 15 Years | 14 (32.6%) | 33 (53.2%) |
| 16 and 17 Years | 23 (15.9%) | 15 (15.6%) |
| 18 to 24 Years | 29 (8.0%) | 144 (44.3%) |
| 25 to 34 Years | 109 (20.8%) | 97 (19.4%) |
| 35 to 44 Years | 74 (13.8%) | 46 (7.8%) |
| 45 to 54 Years | 101 (16.8%) | 129 (21.4%) |
| 55 to 64 Years | 60 (9.1%) | 120 (17.5%) |
| 65 to 74 Years | 133 (24.1%) | 81 (15.1%) |
| 75 Years and over | 30 (9.2%) | 78 (19.8%) |
| Total | 785 (17.3%) | 1,065 (23.2%) |
Income Above Poverty by Sex and Age in Clinton County
According to the poverty statistics in Clinton County, males aged 5 years and females aged 35 to 44 years are the age groups that are most secure financially, with 100.0% of males and 92.2% of females in these age groups living above the poverty line.
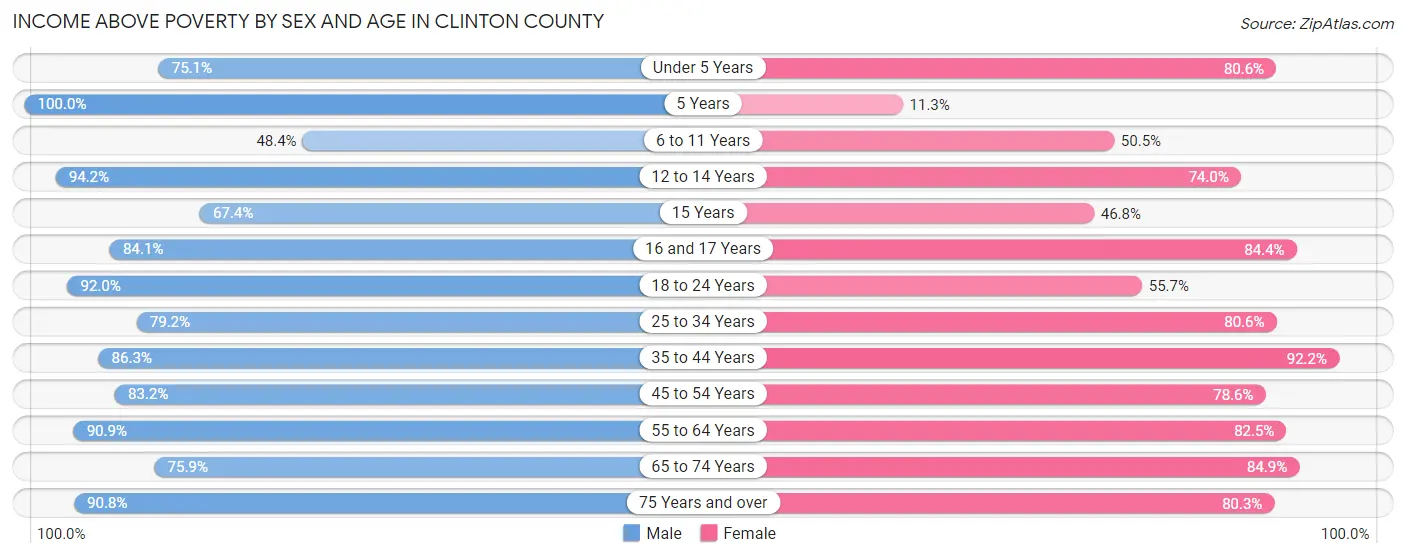
| Age Bracket | Male | Female |
| Under 5 Years | 208 (75.1%) | 195 (80.6%) |
| 5 Years | 43 (100.0%) | 7 (11.3%) |
| 6 to 11 Years | 123 (48.4%) | 197 (50.5%) |
| 12 to 14 Years | 195 (94.2%) | 77 (74.0%) |
| 15 Years | 29 (67.4%) | 29 (46.8%) |
| 16 and 17 Years | 122 (84.1%) | 81 (84.4%) |
| 18 to 24 Years | 335 (92.0%) | 181 (55.7%) |
| 25 to 34 Years | 414 (79.2%) | 404 (80.6%) |
| 35 to 44 Years | 464 (86.3%) | 547 (92.2%) |
| 45 to 54 Years | 501 (83.2%) | 474 (78.6%) |
| 55 to 64 Years | 598 (90.9%) | 565 (82.5%) |
| 65 to 74 Years | 418 (75.9%) | 454 (84.9%) |
| 75 Years and over | 296 (90.8%) | 317 (80.2%) |
| Total | 3,746 (82.7%) | 3,528 (76.8%) |
Income Below Poverty Among Married-Couple Families in Clinton County
The poverty statistics for married-couple families in Clinton County show that 6.3% or 102 of the total 1,614 families live below the poverty line. Families with 3 or 4 children have the highest poverty rate of 21.9%, comprising of 34 families. On the other hand, families with 5 or more children have the lowest poverty rate of 0.0%, which includes 0 families.
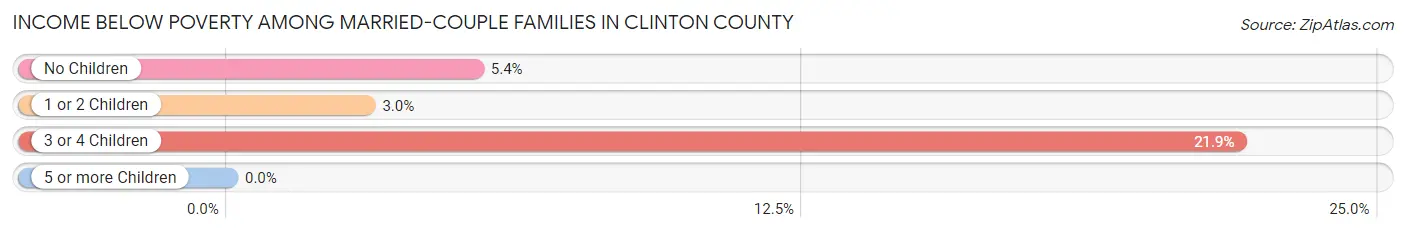
| Children | Above Poverty | Below Poverty |
| No Children | 990 (94.7%) | 56 (5.3%) |
| 1 or 2 Children | 389 (97.0%) | 12 (3.0%) |
| 3 or 4 Children | 121 (78.1%) | 34 (21.9%) |
| 5 or more Children | 12 (100.0%) | 0 (0.0%) |
| Total | 1,512 (93.7%) | 102 (6.3%) |
Income Below Poverty Among Single-Parent Households in Clinton County
According to the poverty data in Clinton County, 40.7% or 101 single-father households and 31.6% or 127 single-mother households are living below the poverty line. Among single-father households, those with 3 or 4 children have the highest poverty rate, with 36 households (100.0%) experiencing poverty. Likewise, among single-mother households, those with 3 or 4 children have the highest poverty rate, with 14 households (100.0%) falling below the poverty line.
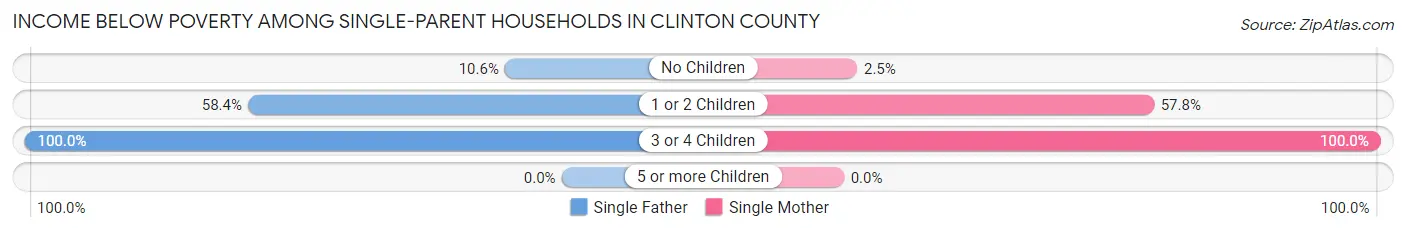
| Children | Single Father | Single Mother |
| No Children | 13 (10.6%) | 5 (2.5%) |
| 1 or 2 Children | 52 (58.4%) | 108 (57.8%) |
| 3 or 4 Children | 36 (100.0%) | 14 (100.0%) |
| 5 or more Children | 0 (0.0%) | 0 (0.0%) |
| Total | 101 (40.7%) | 127 (31.6%) |
Income Below Poverty Among Married-Couple vs Single-Parent Households in Clinton County
The poverty data for Clinton County shows that 102 of the married-couple family households (6.3%) and 228 of the single-parent households (35.1%) are living below the poverty level. Within the married-couple family households, those with 3 or 4 children have the highest poverty rate, with 34 households (21.9%) falling below the poverty line. Among the single-parent households, those with 3 or 4 children have the highest poverty rate, with 50 household (100.0%) living below poverty.
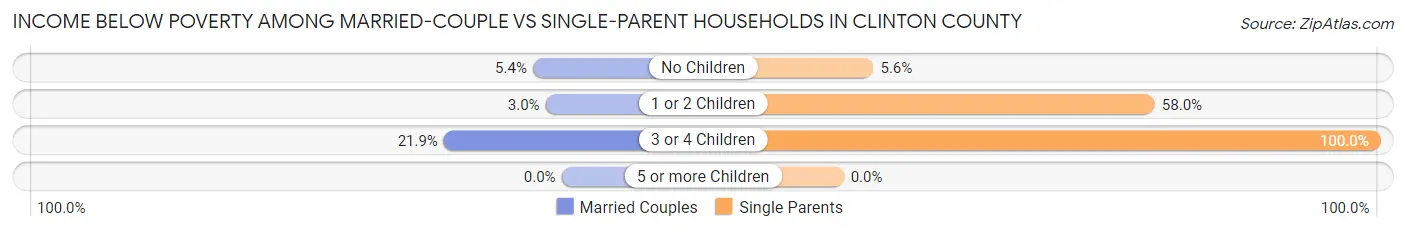
| Children | Married-Couple Families | Single-Parent Households |
| No Children | 56 (5.3%) | 18 (5.6%) |
| 1 or 2 Children | 12 (3.0%) | 160 (58.0%) |
| 3 or 4 Children | 34 (21.9%) | 50 (100.0%) |
| 5 or more Children | 0 (0.0%) | 0 (0.0%) |
| Total | 102 (6.3%) | 228 (35.1%) |
Race in Clinton County
The most populous races in Clinton County are White / Caucasian (8,828 | 95.0%), Hispanic or Latino (309 | 3.3%), and Two or more Races (226 | 2.4%).
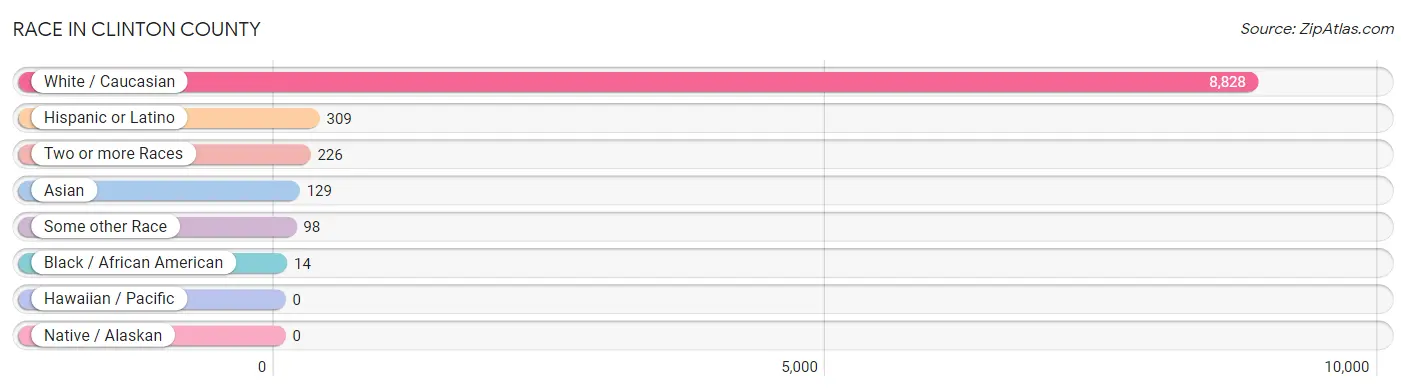
| Race | # Population | % Population |
| Asian | 129 | 1.4% |
| Black / African American | 14 | 0.2% |
| Hawaiian / Pacific | 0 | 0.0% |
| Hispanic or Latino | 309 | 3.3% |
| Native / Alaskan | 0 | 0.0% |
| White / Caucasian | 8,828 | 95.0% |
| Two or more Races | 226 | 2.4% |
| Some other Race | 98 | 1.1% |
| Total | 9,295 | 100.0% |
Ancestry in Clinton County
The most populous ancestries reported in Clinton County are English (1,825 | 19.6%), American (1,062 | 11.4%), German (608 | 6.5%), Irish (542 | 5.8%), and Scotch-Irish (346 | 3.7%), together accounting for 47.2% of all Clinton County residents.
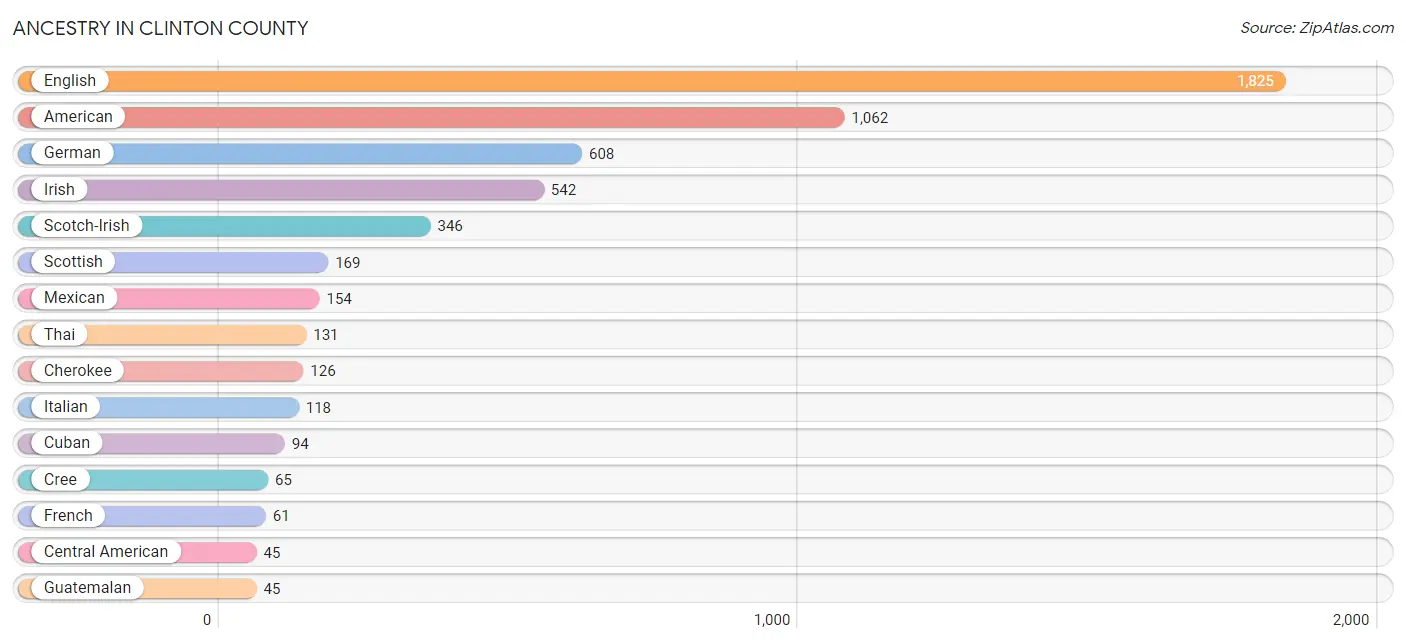
| Ancestry | # Population | % Population |
| American | 1,062 | 11.4% |
| British | 6 | 0.1% |
| Central American | 45 | 0.5% |
| Cherokee | 126 | 1.4% |
| Cree | 65 | 0.7% |
| Cuban | 94 | 1.0% |
| Dutch | 25 | 0.3% |
| English | 1,825 | 19.6% |
| European | 19 | 0.2% |
| French | 61 | 0.7% |
| German | 608 | 6.5% |
| Greek | 12 | 0.1% |
| Guatemalan | 45 | 0.5% |
| Indonesian | 4 | 0.0% |
| Irish | 542 | 5.8% |
| Italian | 118 | 1.3% |
| Mexican | 154 | 1.7% |
| Norwegian | 7 | 0.1% |
| Polish | 14 | 0.2% |
| Puerto Rican | 16 | 0.2% |
| Scandinavian | 30 | 0.3% |
| Scotch-Irish | 346 | 3.7% |
| Scottish | 169 | 1.8% |
| Swedish | 27 | 0.3% |
| Thai | 131 | 1.4% | View All 25 Rows |
Immigrants in Clinton County
The most numerous immigrant groups reported in Clinton County came from Latin America (111 | 1.2%), Caribbean (94 | 1.0%), Cuba (94 | 1.0%), Central America (17 | 0.2%), and Honduras (16 | 0.2%), together accounting for 3.6% of all Clinton County residents.
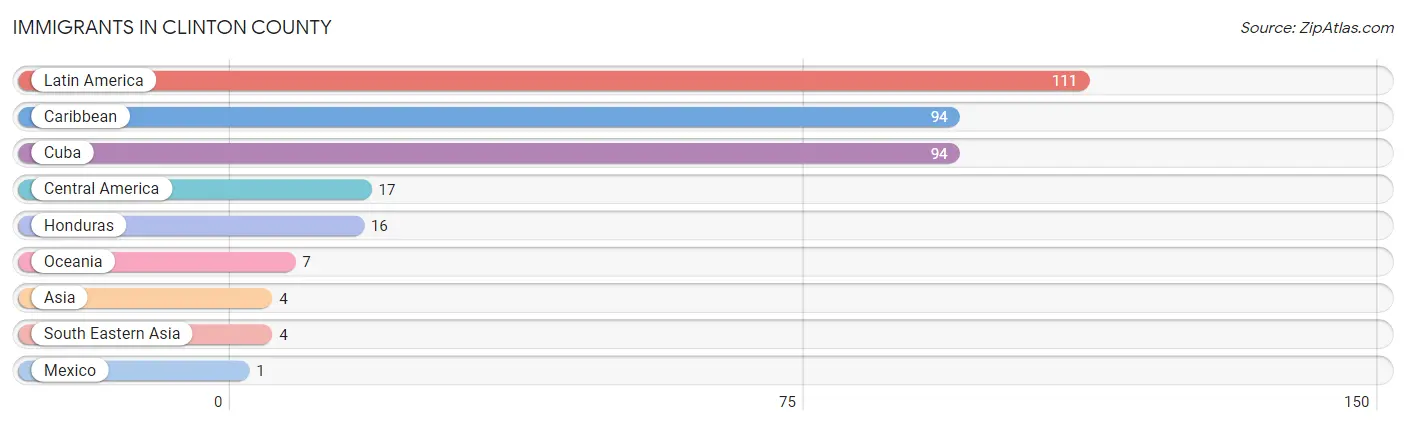
| Immigration Origin | # Population | % Population |
| Asia | 4 | 0.0% |
| Caribbean | 94 | 1.0% |
| Central America | 17 | 0.2% |
| Cuba | 94 | 1.0% |
| Honduras | 16 | 0.2% |
| Latin America | 111 | 1.2% |
| Mexico | 1 | 0.0% |
| Oceania | 7 | 0.1% |
| South Eastern Asia | 4 | 0.0% | View All 9 Rows |
Sex and Age in Clinton County
Sex and Age in Clinton County
The most populous age groups in Clinton County are 60 to 64 Years (370 | 8.0%) for men and 65 to 69 Years (372 | 8.0%) for women.
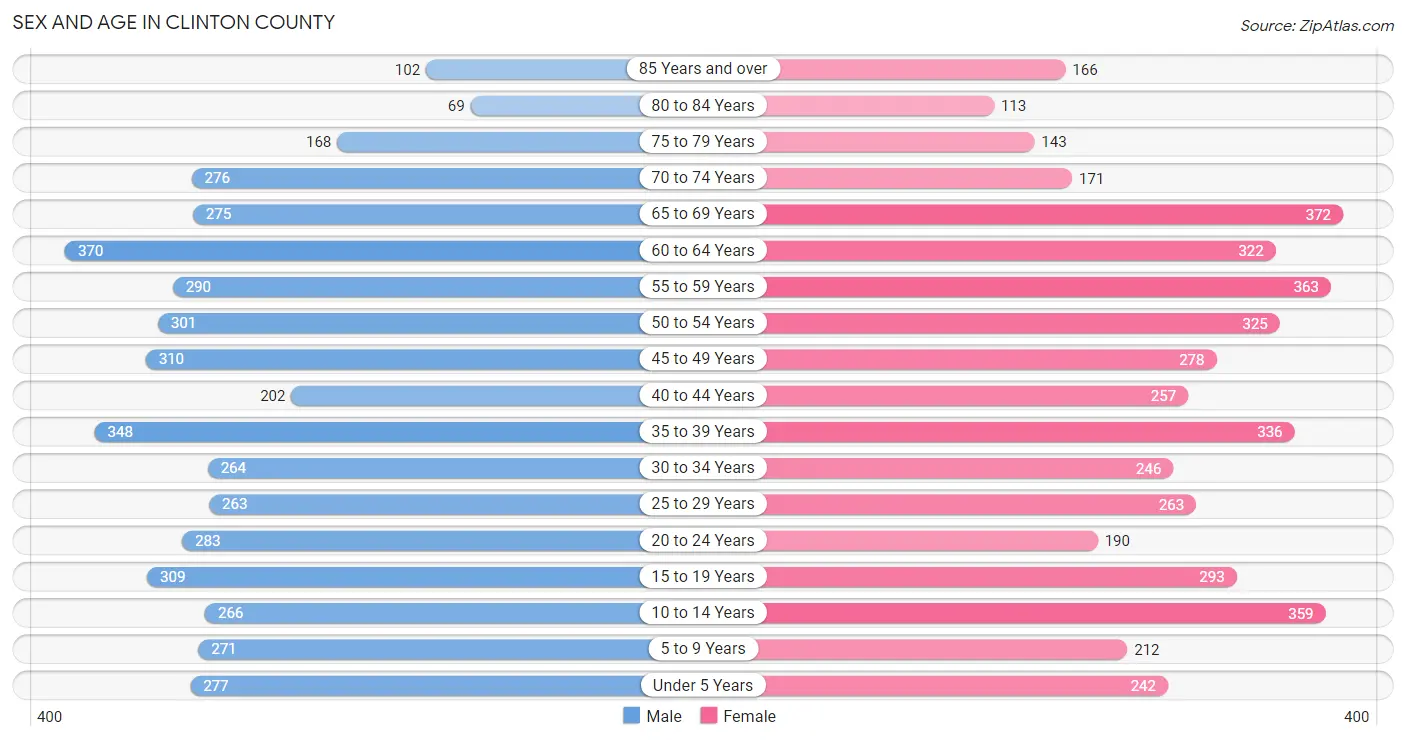
| Age Bracket | Male | Female |
| Under 5 Years | 277 (6.0%) | 242 (5.2%) |
| 5 to 9 Years | 271 (5.8%) | 212 (4.6%) |
| 10 to 14 Years | 266 (5.7%) | 359 (7.7%) |
| 15 to 19 Years | 309 (6.7%) | 293 (6.3%) |
| 20 to 24 Years | 283 (6.1%) | 190 (4.1%) |
| 25 to 29 Years | 263 (5.7%) | 263 (5.7%) |
| 30 to 34 Years | 264 (5.7%) | 246 (5.3%) |
| 35 to 39 Years | 348 (7.5%) | 336 (7.2%) |
| 40 to 44 Years | 202 (4.3%) | 257 (5.5%) |
| 45 to 49 Years | 310 (6.7%) | 278 (6.0%) |
| 50 to 54 Years | 301 (6.5%) | 325 (7.0%) |
| 55 to 59 Years | 290 (6.2%) | 363 (7.8%) |
| 60 to 64 Years | 370 (8.0%) | 322 (6.9%) |
| 65 to 69 Years | 275 (5.9%) | 372 (8.0%) |
| 70 to 74 Years | 276 (5.9%) | 171 (3.7%) |
| 75 to 79 Years | 168 (3.6%) | 143 (3.1%) |
| 80 to 84 Years | 69 (1.5%) | 113 (2.4%) |
| 85 Years and over | 102 (2.2%) | 166 (3.6%) |
| Total | 4,644 (100.0%) | 4,651 (100.0%) |
Families and Households in Clinton County
Median Family Size in Clinton County
The median family size in Clinton County is 3.22 persons per family, with single female/mother families (402 | 17.8%) accounting for the largest median family size of 3.87 persons per family. On the other hand, married-couple families (1,614 | 71.3%) represent the smallest median family size with 3.08 persons per family.
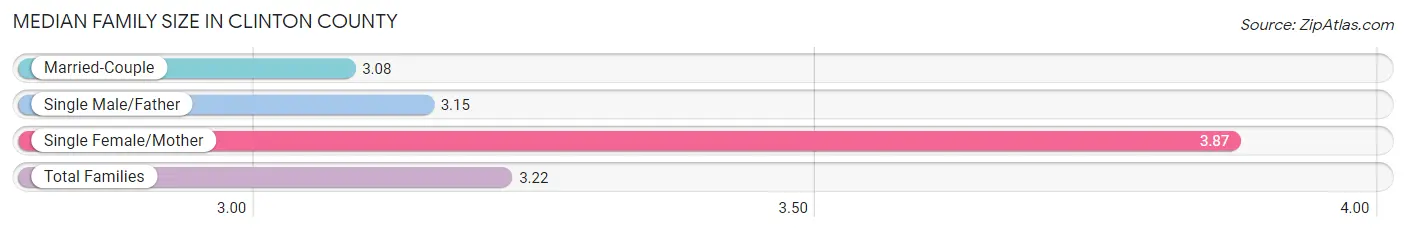
| Family Type | # Families | Family Size |
| Married-Couple | 1,614 (71.3%) | 3.08 |
| Single Male/Father | 248 (11.0%) | 3.15 |
| Single Female/Mother | 402 (17.8%) | 3.87 |
| Total Families | 2,264 (100.0%) | 3.22 |
Median Household Size in Clinton County
The median household size in Clinton County is 2.49 persons per household, with single female/mother households (402 | 11.0%) accounting for the largest median household size of 4.06 persons per household. non-family households (1,408 | 38.3%) represent the smallest median household size with 1.16 persons per household.
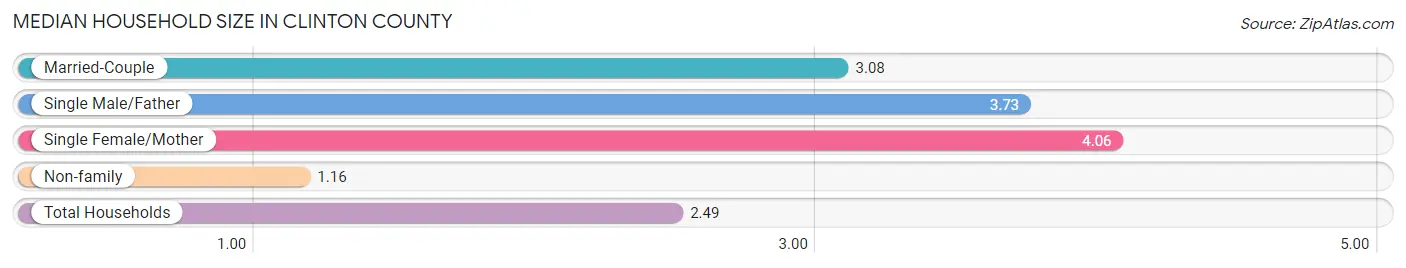
| Household Type | # Households | Household Size |
| Married-Couple | 1,614 (44.0%) | 3.08 |
| Single Male/Father | 248 (6.8%) | 3.73 |
| Single Female/Mother | 402 (11.0%) | 4.06 |
| Non-family | 1,408 (38.3%) | 1.16 |
| Total Households | 3,672 (100.0%) | 2.49 |
Household Size by Marriage Status in Clinton County
Out of a total of 3,672 households in Clinton County, 2,264 (61.7%) are family households, while 1,408 (38.3%) are nonfamily households. The most numerous type of family households are 2-person households, comprising 1,018, and the most common type of nonfamily households are 1-person households, comprising 1,225.
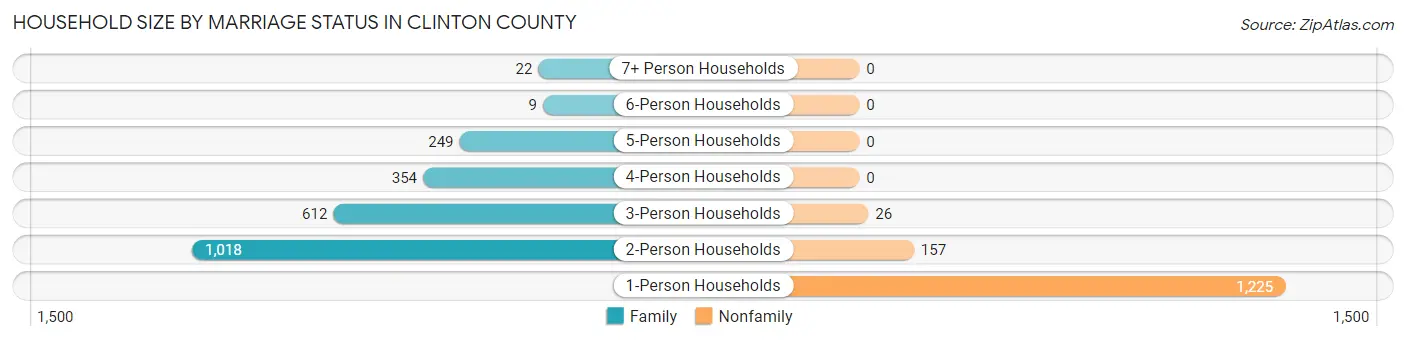
| Household Size | Family Households | Nonfamily Households |
| 1-Person Households | - | 1,225 (33.4%) |
| 2-Person Households | 1,018 (27.7%) | 157 (4.3%) |
| 3-Person Households | 612 (16.7%) | 26 (0.7%) |
| 4-Person Households | 354 (9.6%) | 0 (0.0%) |
| 5-Person Households | 249 (6.8%) | 0 (0.0%) |
| 6-Person Households | 9 (0.3%) | 0 (0.0%) |
| 7+ Person Households | 22 (0.6%) | 0 (0.0%) |
| Total | 2,264 (61.7%) | 1,408 (38.3%) |
Female Fertility in Clinton County
Fertility by Age in Clinton County
Average fertility rate in Clinton County is 51.0 births per 1,000 women. Women in the age bracket of 20 to 34 years have the highest fertility rate with 139.0 births per 1,000 women. Women in the age bracket of 20 to 34 years acount for 100.0% of all women with births.
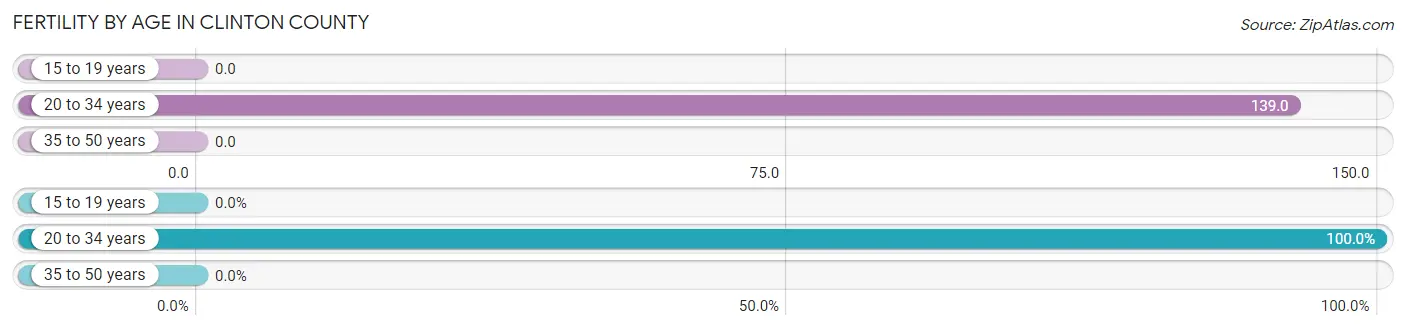
| Age Bracket | Women with Births | Births / 1,000 Women |
| 15 to 19 years | 0 (0.0%) | 0.0 |
| 20 to 34 years | 97 (100.0%) | 139.0 |
| 35 to 50 years | 0 (0.0%) | 0.0 |
| Total | 97 (100.0%) | 51.0 |
Fertility by Age by Marriage Status in Clinton County
44.3% of women with births (97) in Clinton County are married. The highest percentage of unmarried women with births falls into 20 to 34 years age bracket with 55.7% of them unmarried at the time of birth, while the lowest percentage of unmarried women with births belong to 20 to 34 years age bracket with 55.7% of them unmarried.
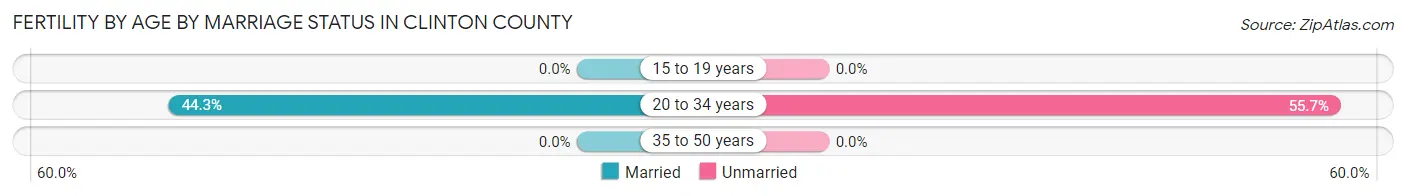
| Age Bracket | Married | Unmarried |
| 15 to 19 years | 0 (0.0%) | 0 (0.0%) |
| 20 to 34 years | 43 (44.3%) | 54 (55.7%) |
| 35 to 50 years | 0 (0.0%) | 0 (0.0%) |
| Total | 43 (44.3%) | 54 (55.7%) |
Fertility by Education in Clinton County
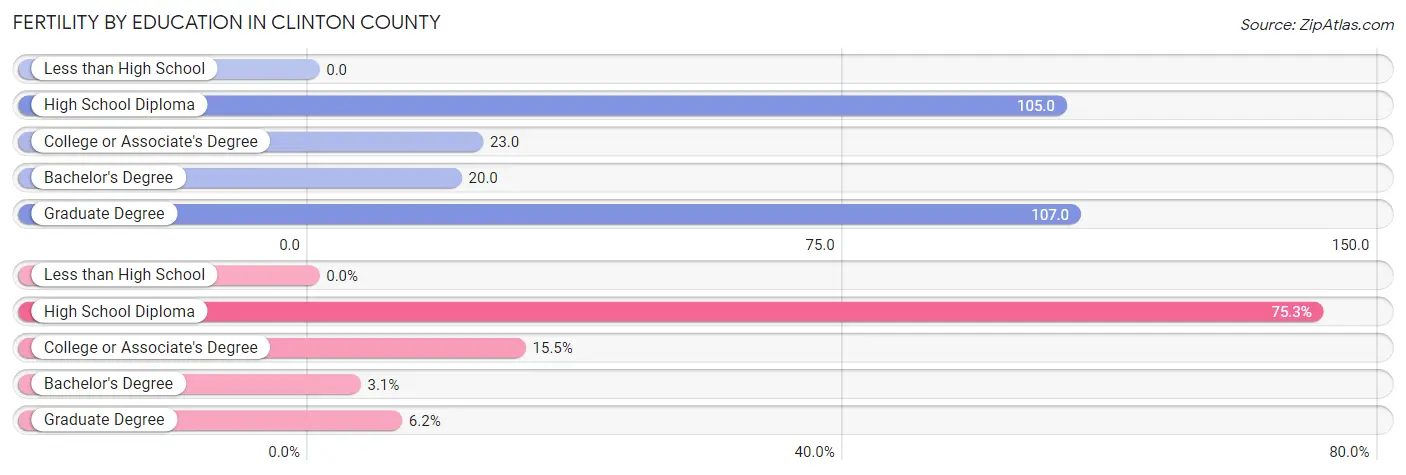
| Educational Attainment | Women with Births | Births / 1,000 Women |
| Less than High School | 0 (0.0%) | 0.0 |
| High School Diploma | 73 (75.3%) | 105.0 |
| College or Associate's Degree | 15 (15.5%) | 23.0 |
| Bachelor's Degree | 3 (3.1%) | 20.0 |
| Graduate Degree | 6 (6.2%) | 107.0 |
| Total | 97 (100.0%) | 51.0 |
Fertility by Education by Marriage Status in Clinton County
55.7% of women with births in Clinton County are unmarried. Women with the educational attainment of bachelor's degree are most likely to be married with 100.0% of them married at childbirth, while women with the educational attainment of college or associate's degree are least likely to be married with 66.7% of them unmarried at childbirth.
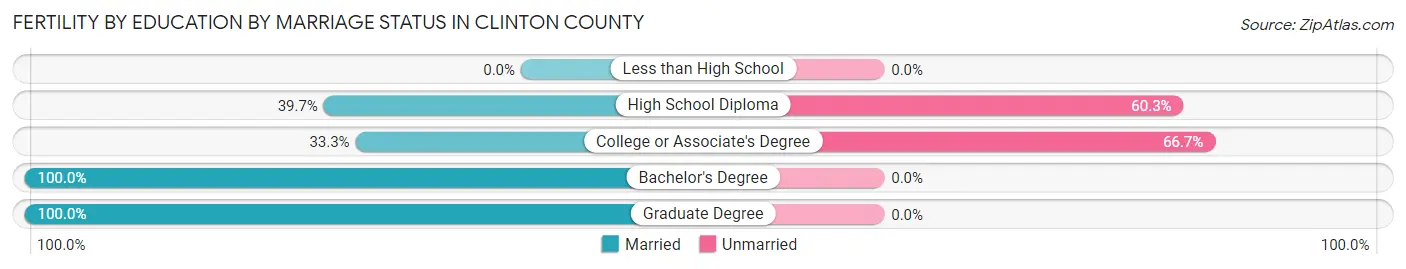
| Educational Attainment | Married | Unmarried |
| Less than High School | 0 (0.0%) | 0 (0.0%) |
| High School Diploma | 29 (39.7%) | 44 (60.3%) |
| College or Associate's Degree | 5 (33.3%) | 10 (66.7%) |
| Bachelor's Degree | 3 (100.0%) | 0 (0.0%) |
| Graduate Degree | 6 (100.0%) | 0 (0.0%) |
| Total | 43 (44.3%) | 54 (55.7%) |
Employment Characteristics in Clinton County
Employment by Class of Employer in Clinton County
Among the 3,710 employed individuals in Clinton County, private company employees (2,486 | 67.0%), self-employed (not incorporated) (290 | 7.8%), and local government employees (246 | 6.6%) make up the most common classes of employment.
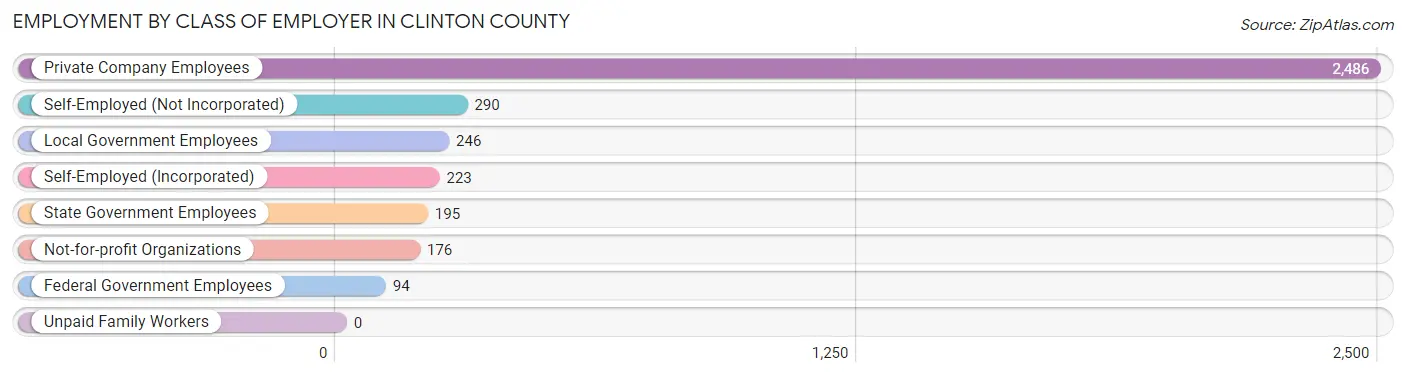
| Employer Class | # Employees | % Employees |
| Private Company Employees | 2,486 | 67.0% |
| Self-Employed (Incorporated) | 223 | 6.0% |
| Self-Employed (Not Incorporated) | 290 | 7.8% |
| Not-for-profit Organizations | 176 | 4.7% |
| Local Government Employees | 246 | 6.6% |
| State Government Employees | 195 | 5.3% |
| Federal Government Employees | 94 | 2.5% |
| Unpaid Family Workers | 0 | 0.0% |
| Total | 3,710 | 100.0% |
Employment Status by Age in Clinton County
According to the labor force statistics for Clinton County, out of the total population over 16 years of age (7,561), 52.5% or 3,970 individuals are in the labor force, with 5.6% or 222 of them unemployed. The age group with the highest labor force participation rate is 35 to 44 years, with 81.0% or 926 individuals in the labor force. Within the labor force, the 16 to 19 years age range has the highest percentage of unemployed individuals, with 31.8% or 41 of them being unemployed.
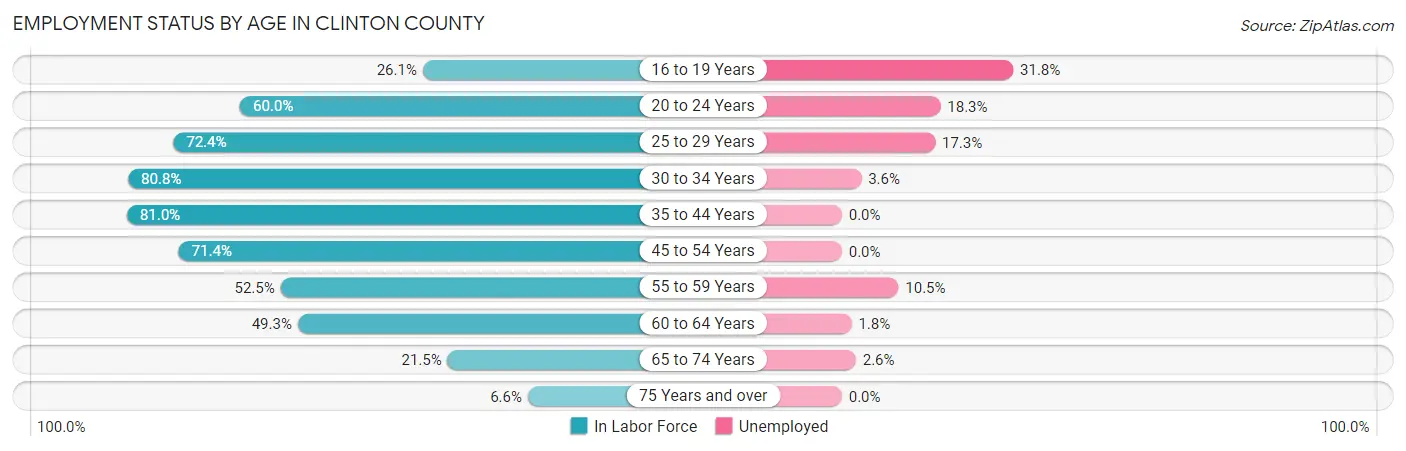
| Age Bracket | In Labor Force | Unemployed |
| 16 to 19 Years | 129 (26.1%) | 41 (31.8%) |
| 20 to 24 Years | 284 (60.0%) | 52 (18.3%) |
| 25 to 29 Years | 381 (72.4%) | 66 (17.3%) |
| 30 to 34 Years | 412 (80.8%) | 15 (3.6%) |
| 35 to 44 Years | 926 (81.0%) | 0 (0.0%) |
| 45 to 54 Years | 867 (71.4%) | 0 (0.0%) |
| 55 to 59 Years | 343 (52.5%) | 36 (10.5%) |
| 60 to 64 Years | 341 (49.3%) | 6 (1.8%) |
| 65 to 74 Years | 235 (21.5%) | 6 (2.6%) |
| 75 Years and over | 50 (6.6%) | 0 (0.0%) |
| Total | 3,970 (52.5%) | 222 (5.6%) |
Employment Status by Educational Attainment in Clinton County
According to labor force statistics for Clinton County, 69.0% of individuals (3,269) out of the total population between 25 and 64 years of age (4,738) are in the labor force, with 3.8% or 124 of them being unemployed. The group with the highest labor force participation rate are those with the educational attainment of bachelor's degree or higher, with 89.6% or 543 individuals in the labor force. Within the labor force, individuals with less than high school education have the highest percentage of unemployment, with 9.3% or 29 of them being unemployed.
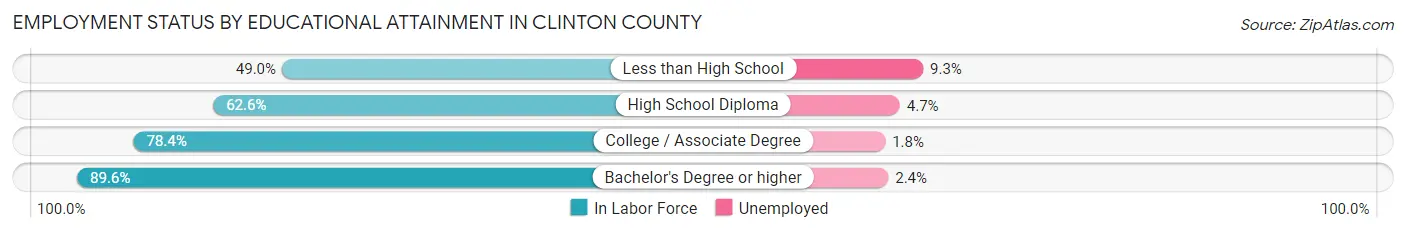
| Educational Attainment | In Labor Force | Unemployed |
| Less than High School | 313 (49.0%) | 59 (9.3%) |
| High School Diploma | 1,288 (62.6%) | 97 (4.7%) |
| College / Associate Degree | 1,126 (78.4%) | 26 (1.8%) |
| Bachelor's Degree or higher | 543 (89.6%) | 15 (2.4%) |
| Total | 3,269 (69.0%) | 180 (3.8%) |
Employment Occupations by Sex in Clinton County
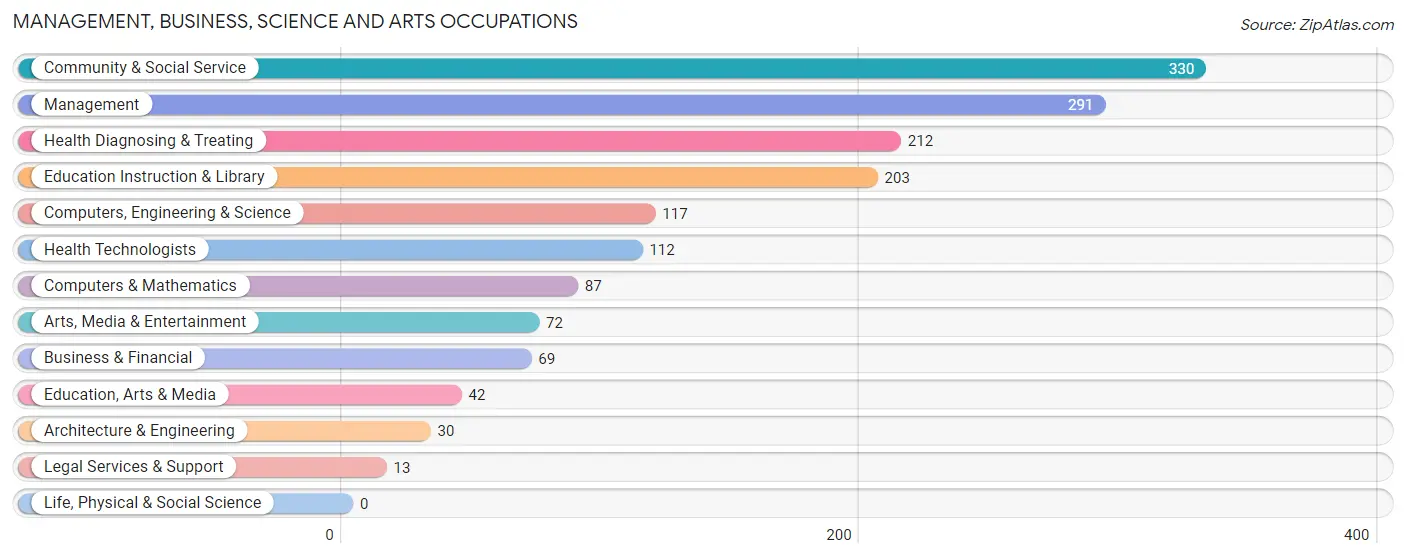
Management, Business, Science and Arts Occupations
The most common Management, Business, Science and Arts occupations in Clinton County are Community & Social Service (330 | 8.8%), Management (291 | 7.8%), Health Diagnosing & Treating (212 | 5.7%), Education Instruction & Library (203 | 5.4%), and Computers, Engineering & Science (117 | 3.1%).
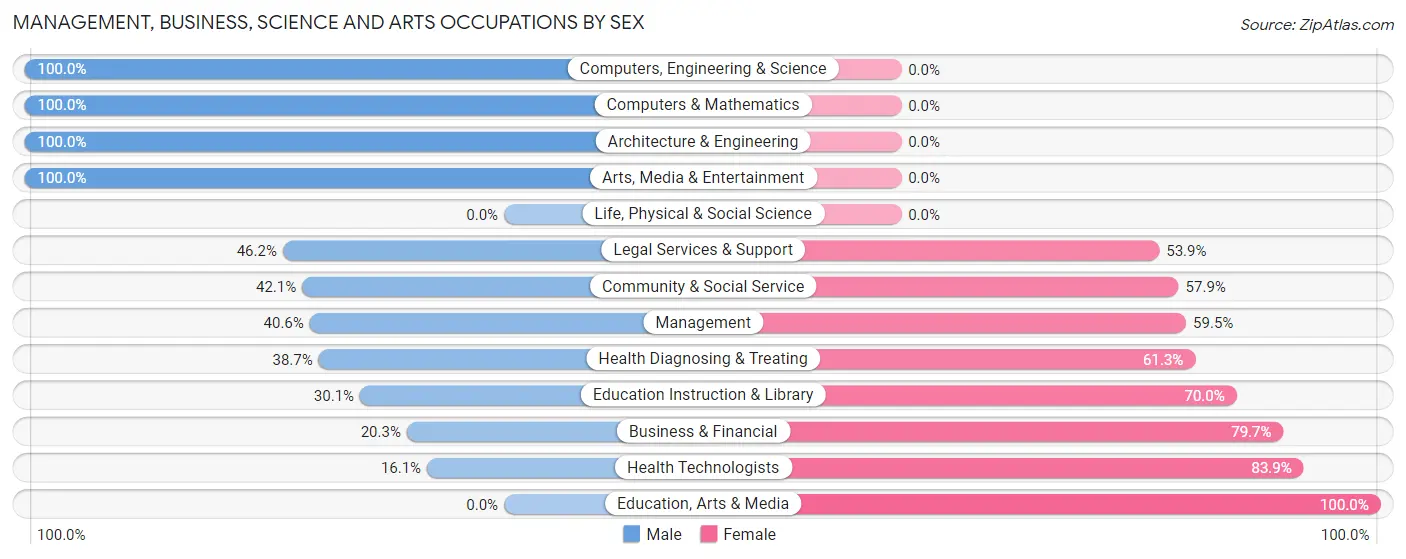
Management, Business, Science and Arts Occupations by Sex
Within the Management, Business, Science and Arts occupations in Clinton County, the most male-oriented occupations are Computers, Engineering & Science (100.0%), Computers & Mathematics (100.0%), and Architecture & Engineering (100.0%), while the most female-oriented occupations are Education, Arts & Media (100.0%), Health Technologists (83.9%), and Business & Financial (79.7%).
| Occupation | Male | Female |
| Management | 118 (40.6%) | 173 (59.5%) |
| Business & Financial | 14 (20.3%) | 55 (79.7%) |
| Computers, Engineering & Science | 117 (100.0%) | 0 (0.0%) |
| Computers & Mathematics | 87 (100.0%) | 0 (0.0%) |
| Architecture & Engineering | 30 (100.0%) | 0 (0.0%) |
| Life, Physical & Social Science | 0 (0.0%) | 0 (0.0%) |
| Community & Social Service | 139 (42.1%) | 191 (57.9%) |
| Education, Arts & Media | 0 (0.0%) | 42 (100.0%) |
| Legal Services & Support | 6 (46.2%) | 7 (53.8%) |
| Education Instruction & Library | 61 (30.0%) | 142 (70.0%) |
| Arts, Media & Entertainment | 72 (100.0%) | 0 (0.0%) |
| Health Diagnosing & Treating | 82 (38.7%) | 130 (61.3%) |
| Health Technologists | 18 (16.1%) | 94 (83.9%) |
| Total (Category) | 470 (46.1%) | 549 (53.9%) |
| Total (Overall) | 2,031 (54.2%) | 1,715 (45.8%) |
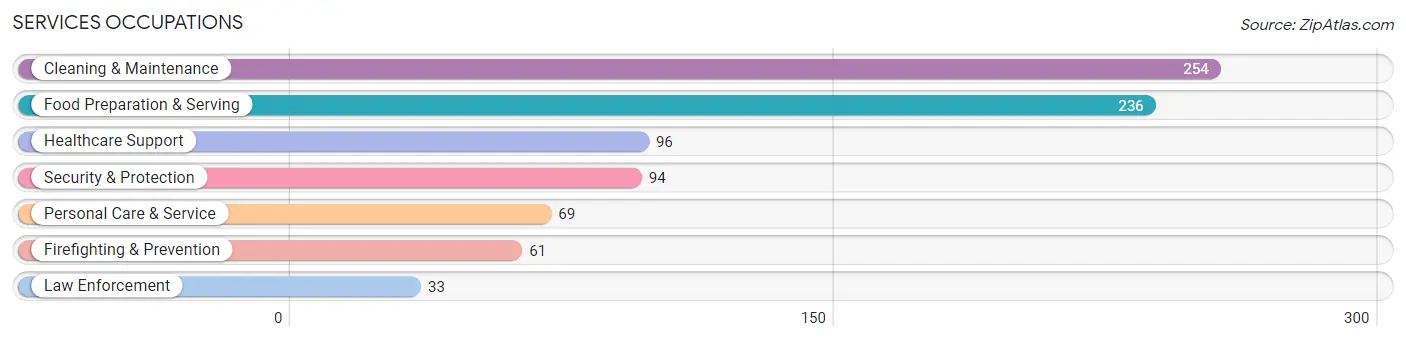
Services Occupations
The most common Services occupations in Clinton County are Cleaning & Maintenance (254 | 6.8%), Food Preparation & Serving (236 | 6.3%), Healthcare Support (96 | 2.6%), Security & Protection (94 | 2.5%), and Personal Care & Service (69 | 1.8%).
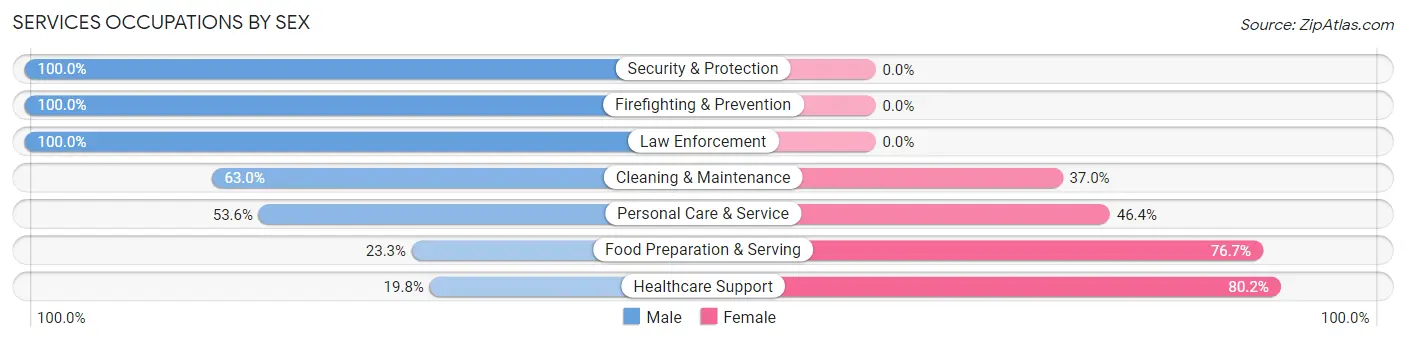
Services Occupations by Sex
Within the Services occupations in Clinton County, the most male-oriented occupations are Security & Protection (100.0%), Firefighting & Prevention (100.0%), and Law Enforcement (100.0%), while the most female-oriented occupations are Healthcare Support (80.2%), Food Preparation & Serving (76.7%), and Personal Care & Service (46.4%).
| Occupation | Male | Female |
| Healthcare Support | 19 (19.8%) | 77 (80.2%) |
| Security & Protection | 94 (100.0%) | 0 (0.0%) |
| Firefighting & Prevention | 61 (100.0%) | 0 (0.0%) |
| Law Enforcement | 33 (100.0%) | 0 (0.0%) |
| Food Preparation & Serving | 55 (23.3%) | 181 (76.7%) |
| Cleaning & Maintenance | 160 (63.0%) | 94 (37.0%) |
| Personal Care & Service | 37 (53.6%) | 32 (46.4%) |
| Total (Category) | 365 (48.7%) | 384 (51.3%) |
| Total (Overall) | 2,031 (54.2%) | 1,715 (45.8%) |
Sales and Office Occupations
The most common Sales and Office occupations in Clinton County are Office & Administration (448 | 12.0%), and Sales & Related (335 | 8.9%).
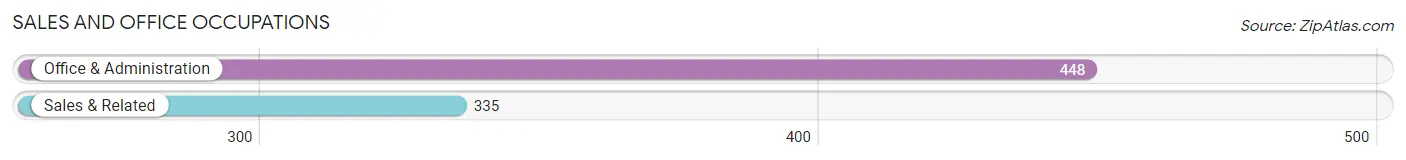
Sales and Office Occupations by Sex
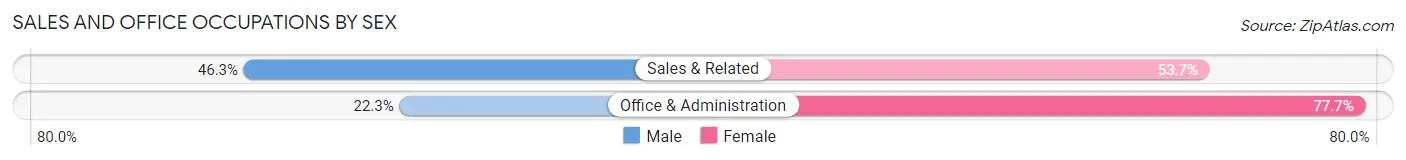
| Occupation | Male | Female |
| Sales & Related | 155 (46.3%) | 180 (53.7%) |
| Office & Administration | 100 (22.3%) | 348 (77.7%) |
| Total (Category) | 255 (32.6%) | 528 (67.4%) |
| Total (Overall) | 2,031 (54.2%) | 1,715 (45.8%) |
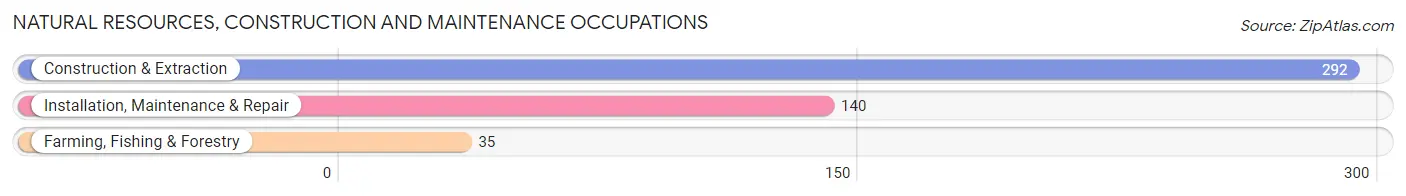
Natural Resources, Construction and Maintenance Occupations
The most common Natural Resources, Construction and Maintenance occupations in Clinton County are Construction & Extraction (292 | 7.8%), Installation, Maintenance & Repair (140 | 3.7%), and Farming, Fishing & Forestry (35 | 0.9%).
Natural Resources, Construction and Maintenance Occupations by Sex
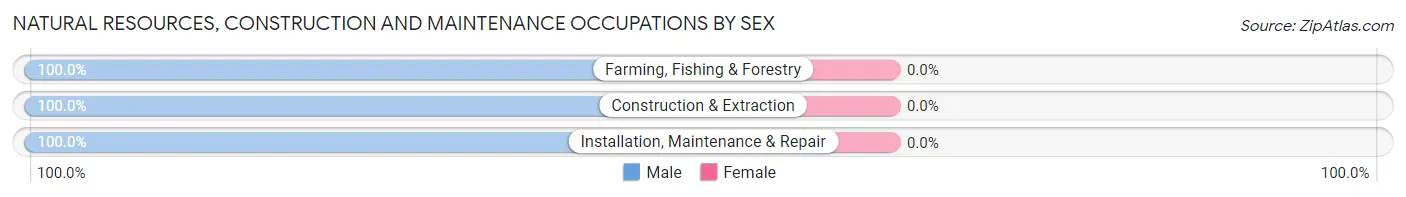
| Occupation | Male | Female |
| Farming, Fishing & Forestry | 35 (100.0%) | 0 (0.0%) |
| Construction & Extraction | 292 (100.0%) | 0 (0.0%) |
| Installation, Maintenance & Repair | 140 (100.0%) | 0 (0.0%) |
| Total (Category) | 467 (100.0%) | 0 (0.0%) |
| Total (Overall) | 2,031 (54.2%) | 1,715 (45.8%) |
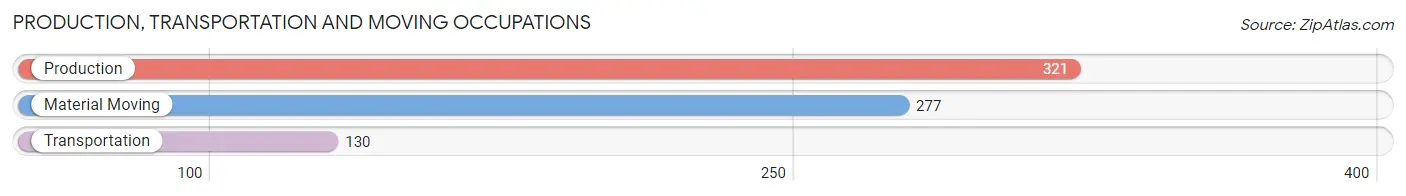
Production, Transportation and Moving Occupations
The most common Production, Transportation and Moving occupations in Clinton County are Production (321 | 8.6%), Material Moving (277 | 7.4%), and Transportation (130 | 3.5%).
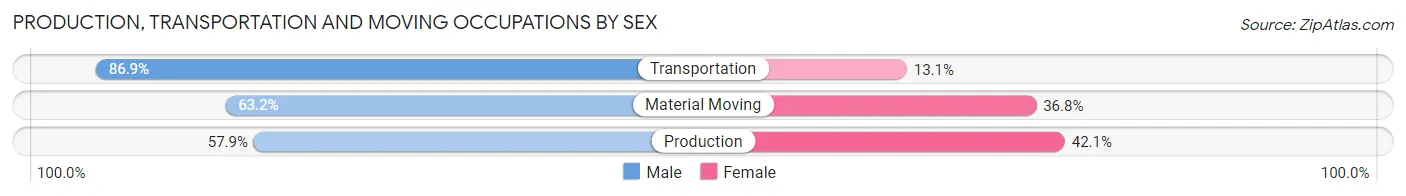
Production, Transportation and Moving Occupations by Sex
| Occupation | Male | Female |
| Production | 186 (57.9%) | 135 (42.1%) |
| Transportation | 113 (86.9%) | 17 (13.1%) |
| Material Moving | 175 (63.2%) | 102 (36.8%) |
| Total (Category) | 474 (65.1%) | 254 (34.9%) |
| Total (Overall) | 2,031 (54.2%) | 1,715 (45.8%) |
Employment Industries by Sex in Clinton County
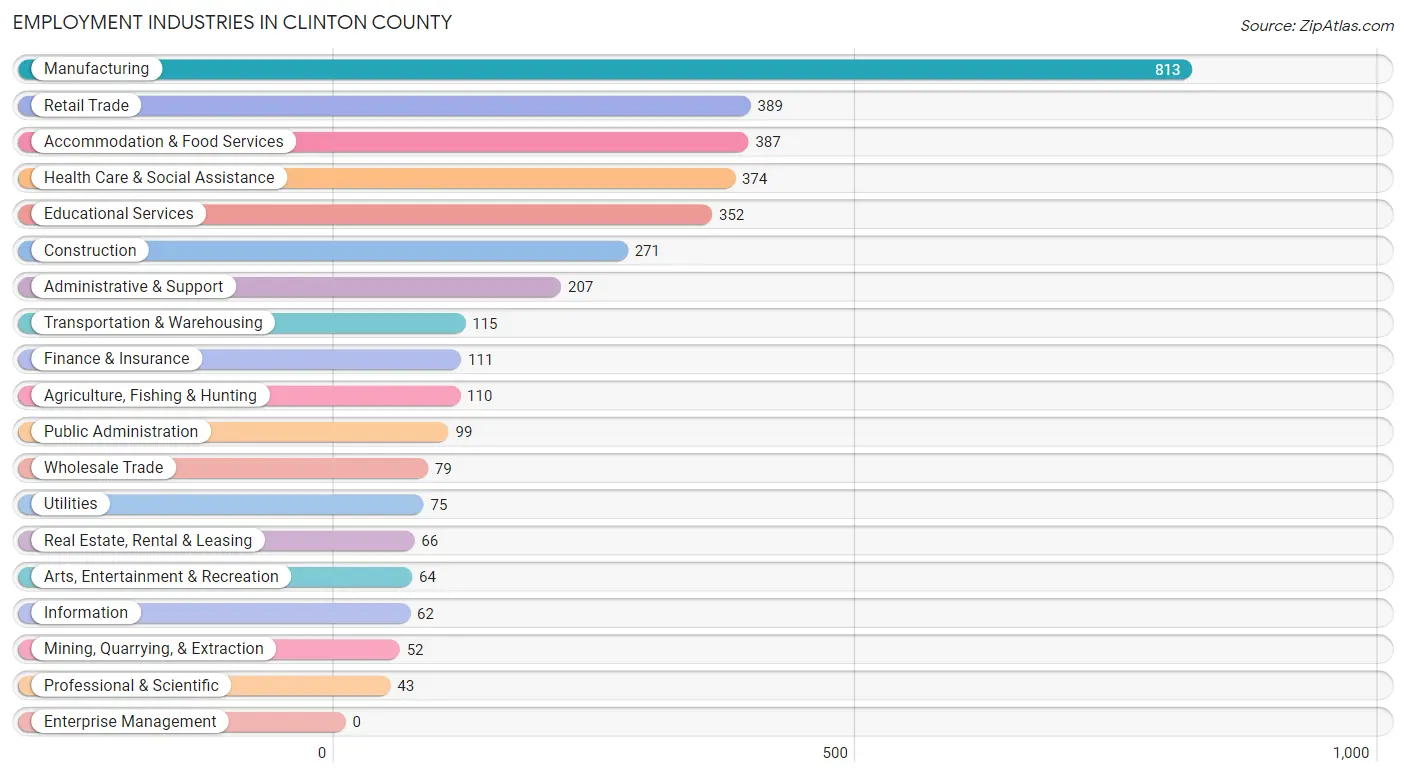
Employment Industries in Clinton County
The major employment industries in Clinton County include Manufacturing (813 | 21.7%), Retail Trade (389 | 10.4%), Accommodation & Food Services (387 | 10.3%), Health Care & Social Assistance (374 | 10.0%), and Educational Services (352 | 9.4%).
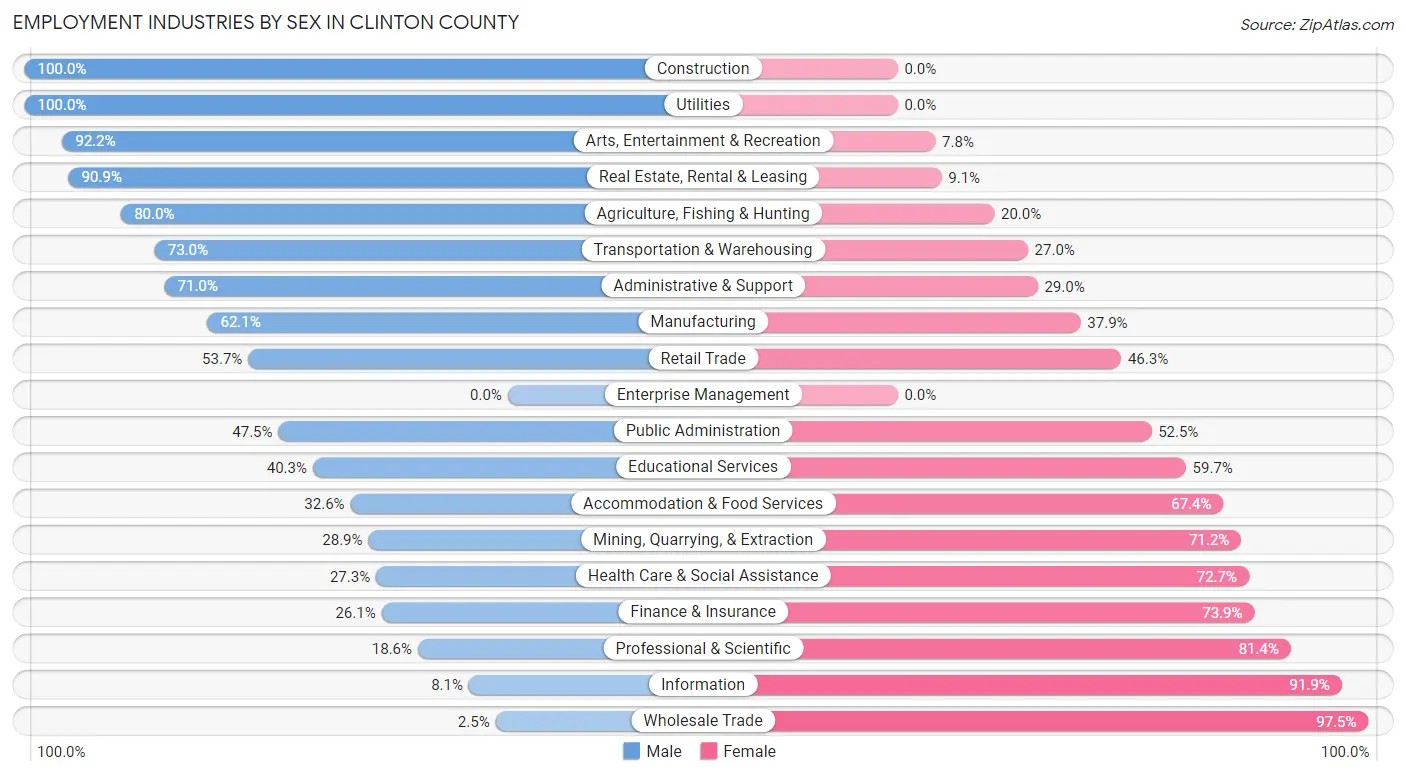
Employment Industries by Sex in Clinton County
The Clinton County industries that see more men than women are Construction (100.0%), Utilities (100.0%), and Arts, Entertainment & Recreation (92.2%), whereas the industries that tend to have a higher number of women are Wholesale Trade (97.5%), Information (91.9%), and Professional & Scientific (81.4%).
| Industry | Male | Female |
| Agriculture, Fishing & Hunting | 88 (80.0%) | 22 (20.0%) |
| Mining, Quarrying, & Extraction | 15 (28.8%) | 37 (71.2%) |
| Construction | 271 (100.0%) | 0 (0.0%) |
| Manufacturing | 505 (62.1%) | 308 (37.9%) |
| Wholesale Trade | 2 (2.5%) | 77 (97.5%) |
| Retail Trade | 209 (53.7%) | 180 (46.3%) |
| Transportation & Warehousing | 84 (73.0%) | 31 (27.0%) |
| Utilities | 75 (100.0%) | 0 (0.0%) |
| Information | 5 (8.1%) | 57 (91.9%) |
| Finance & Insurance | 29 (26.1%) | 82 (73.9%) |
| Real Estate, Rental & Leasing | 60 (90.9%) | 6 (9.1%) |
| Professional & Scientific | 8 (18.6%) | 35 (81.4%) |
| Enterprise Management | 0 (0.0%) | 0 (0.0%) |
| Administrative & Support | 147 (71.0%) | 60 (29.0%) |
| Educational Services | 142 (40.3%) | 210 (59.7%) |
| Health Care & Social Assistance | 102 (27.3%) | 272 (72.7%) |
| Arts, Entertainment & Recreation | 59 (92.2%) | 5 (7.8%) |
| Accommodation & Food Services | 126 (32.6%) | 261 (67.4%) |
| Public Administration | 47 (47.5%) | 52 (52.5%) |
| Total | 2,031 (54.2%) | 1,715 (45.8%) |
Education in Clinton County
School Enrollment in Clinton County
The most common levels of schooling among the 1,923 students in Clinton County are middle school (537 | 27.9%), high school (425 | 22.1%), and elementary school (363 | 18.9%).
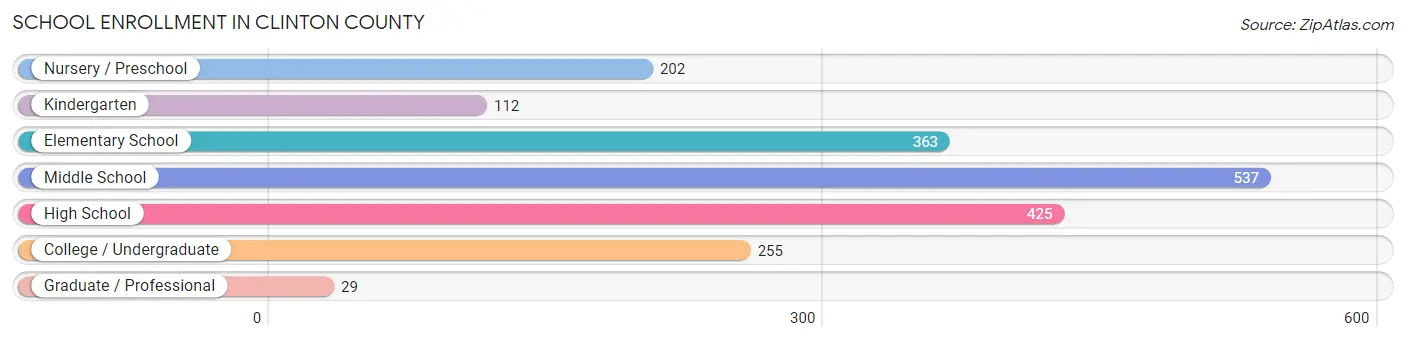
| School Level | # Students | % Students |
| Nursery / Preschool | 202 | 10.5% |
| Kindergarten | 112 | 5.8% |
| Elementary School | 363 | 18.9% |
| Middle School | 537 | 27.9% |
| High School | 425 | 22.1% |
| College / Undergraduate | 255 | 13.3% |
| Graduate / Professional | 29 | 1.5% |
| Total | 1,923 | 100.0% |
School Enrollment by Age by Funding Source in Clinton County
Out of a total of 1,923 students who are enrolled in schools in Clinton County, 52 (2.7%) attend a private institution, while the remaining 1,871 (97.3%) are enrolled in public schools. The age group of 25 to 34 year olds has the highest likelihood of being enrolled in private schools, with 3 (5.9% in the age bracket) enrolled. Conversely, the age group of 3 to 4 year olds has the lowest likelihood of being enrolled in a private school, with 147 (100.0% in the age bracket) attending a public institution.
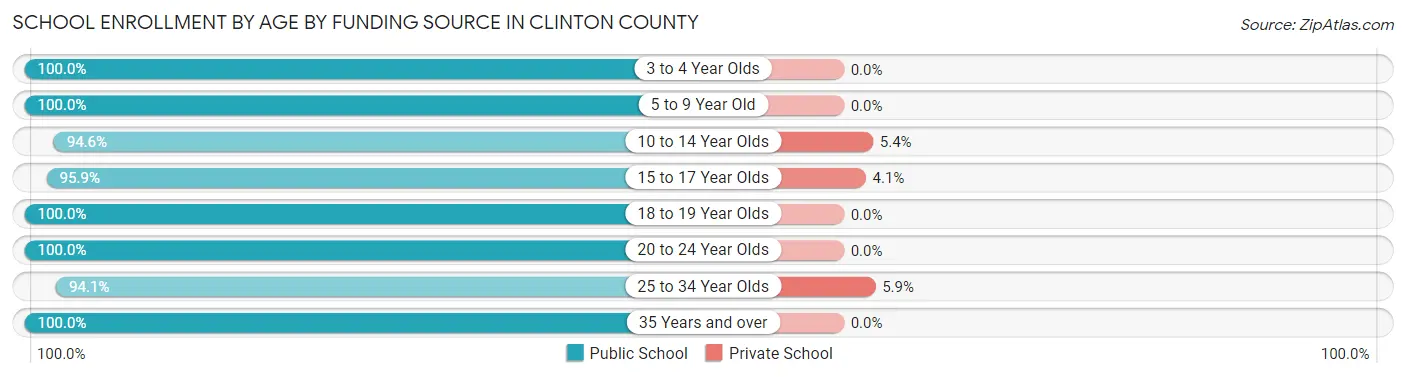
| Age Bracket | Public School | Private School |
| 3 to 4 Year Olds | 147 (100.0%) | 0 (0.0%) |
| 5 to 9 Year Old | 446 (100.0%) | 0 (0.0%) |
| 10 to 14 Year Olds | 591 (94.6%) | 34 (5.4%) |
| 15 to 17 Year Olds | 328 (95.9%) | 14 (4.1%) |
| 18 to 19 Year Olds | 148 (100.0%) | 0 (0.0%) |
| 20 to 24 Year Olds | 124 (100.0%) | 0 (0.0%) |
| 25 to 34 Year Olds | 48 (94.1%) | 3 (5.9%) |
| 35 Years and over | 40 (100.0%) | 0 (0.0%) |
| Total | 1,871 (97.3%) | 52 (2.7%) |
Educational Attainment by Field of Study in Clinton County
Education (267 | 27.3%), bio, nature & agricultural (127 | 13.0%), arts & humanities (119 | 12.2%), science & technology (112 | 11.5%), and business (93 | 9.5%) are the most common fields of study among 978 individuals in Clinton County who have obtained a bachelor's degree or higher.
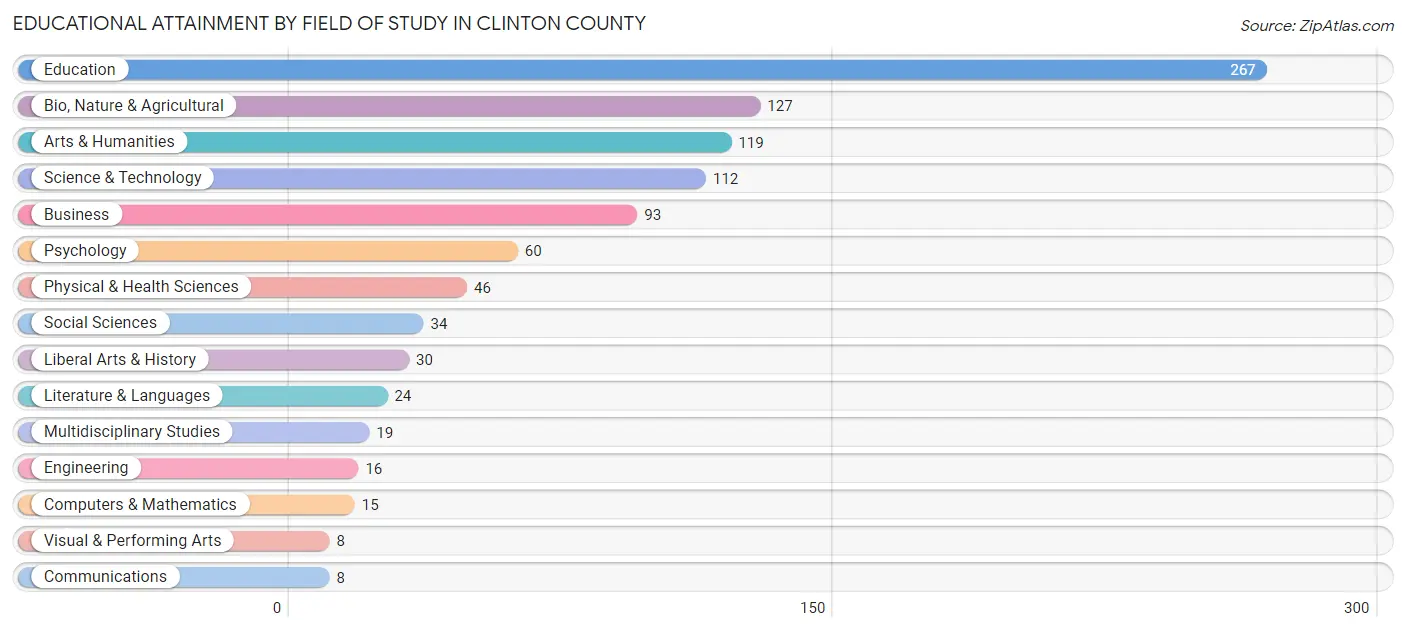
| Field of Study | # Graduates | % Graduates |
| Computers & Mathematics | 15 | 1.5% |
| Bio, Nature & Agricultural | 127 | 13.0% |
| Physical & Health Sciences | 46 | 4.7% |
| Psychology | 60 | 6.1% |
| Social Sciences | 34 | 3.5% |
| Engineering | 16 | 1.6% |
| Multidisciplinary Studies | 19 | 1.9% |
| Science & Technology | 112 | 11.5% |
| Business | 93 | 9.5% |
| Education | 267 | 27.3% |
| Literature & Languages | 24 | 2.5% |
| Liberal Arts & History | 30 | 3.1% |
| Visual & Performing Arts | 8 | 0.8% |
| Communications | 8 | 0.8% |
| Arts & Humanities | 119 | 12.2% |
| Total | 978 | 100.0% |
Transportation & Commute in Clinton County
Vehicle Availability by Sex in Clinton County
The most prevalent vehicle ownership categories in Clinton County are males with 2 vehicles (951, accounting for 47.2%) and females with 2 vehicles (777, making up 56.2%).
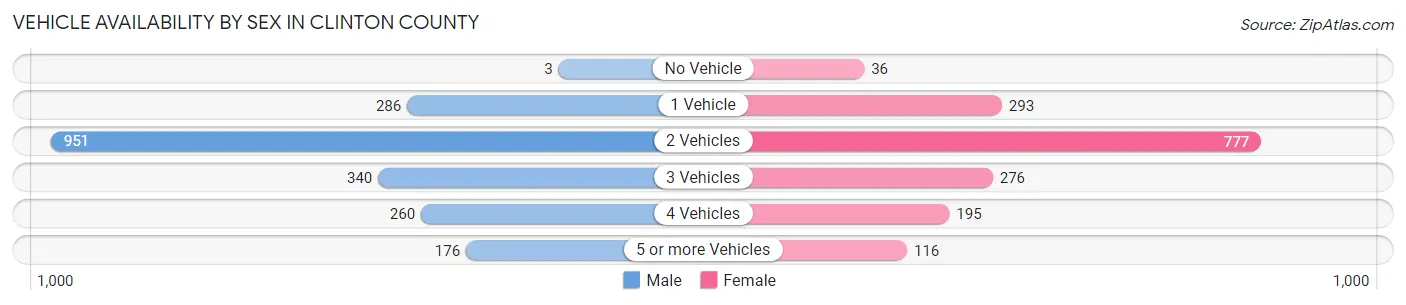
| Vehicles Available | Male | Female |
| No Vehicle | 3 (0.2%) | 36 (2.1%) |
| 1 Vehicle | 286 (14.2%) | 293 (17.3%) |
| 2 Vehicles | 951 (47.2%) | 777 (45.9%) |
| 3 Vehicles | 340 (16.9%) | 276 (16.3%) |
| 4 Vehicles | 260 (12.9%) | 195 (11.5%) |
| 5 or more Vehicles | 176 (8.7%) | 116 (6.9%) |
| Total | 2,016 (100.0%) | 1,693 (100.0%) |
Commute Time in Clinton County
The most frequently occuring commute durations in Clinton County are 10 to 14 minutes (846 commuters, 24.4%), 15 to 19 minutes (725 commuters, 20.9%), and 5 to 9 minutes (556 commuters, 16.1%).
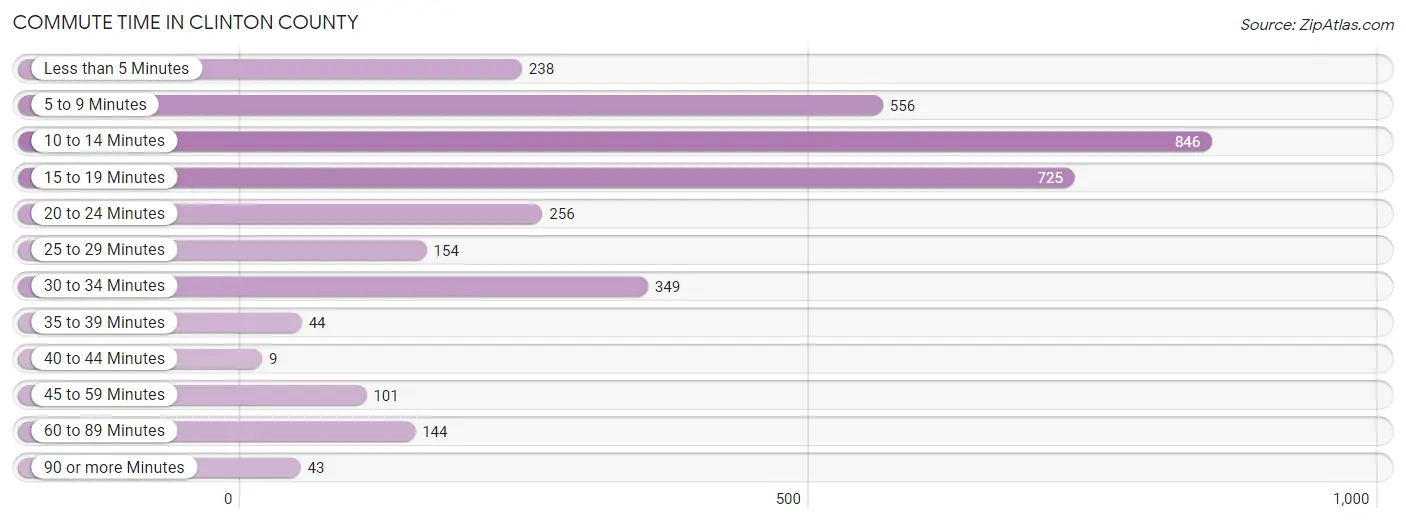
| Commute Time | # Commuters | % Commuters |
| Less than 5 Minutes | 238 | 6.9% |
| 5 to 9 Minutes | 556 | 16.1% |
| 10 to 14 Minutes | 846 | 24.4% |
| 15 to 19 Minutes | 725 | 20.9% |
| 20 to 24 Minutes | 256 | 7.4% |
| 25 to 29 Minutes | 154 | 4.4% |
| 30 to 34 Minutes | 349 | 10.1% |
| 35 to 39 Minutes | 44 | 1.3% |
| 40 to 44 Minutes | 9 | 0.3% |
| 45 to 59 Minutes | 101 | 2.9% |
| 60 to 89 Minutes | 144 | 4.2% |
| 90 or more Minutes | 43 | 1.2% |
Commute Time by Sex in Clinton County
The most common commute times in Clinton County are 10 to 14 minutes (442 commuters, 22.8%) for males and 10 to 14 minutes (404 commuters, 26.5%) for females.
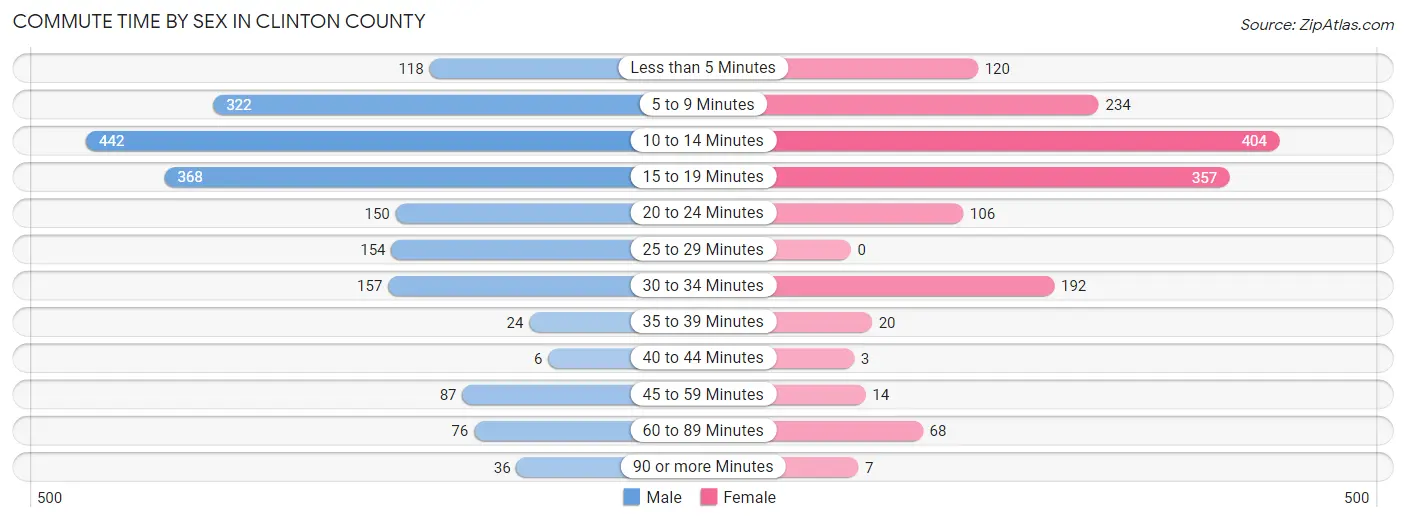
| Commute Time | Male | Female |
| Less than 5 Minutes | 118 (6.1%) | 120 (7.9%) |
| 5 to 9 Minutes | 322 (16.6%) | 234 (15.3%) |
| 10 to 14 Minutes | 442 (22.8%) | 404 (26.5%) |
| 15 to 19 Minutes | 368 (19.0%) | 357 (23.4%) |
| 20 to 24 Minutes | 150 (7.7%) | 106 (7.0%) |
| 25 to 29 Minutes | 154 (7.9%) | 0 (0.0%) |
| 30 to 34 Minutes | 157 (8.1%) | 192 (12.6%) |
| 35 to 39 Minutes | 24 (1.2%) | 20 (1.3%) |
| 40 to 44 Minutes | 6 (0.3%) | 3 (0.2%) |
| 45 to 59 Minutes | 87 (4.5%) | 14 (0.9%) |
| 60 to 89 Minutes | 76 (3.9%) | 68 (4.5%) |
| 90 or more Minutes | 36 (1.9%) | 7 (0.5%) |
Time of Departure to Work by Sex in Clinton County
The most frequent times of departure to work in Clinton County are 7:00 AM to 7:29 AM (394, 20.3%) for males and 7:00 AM to 7:29 AM (279, 18.3%) for females.
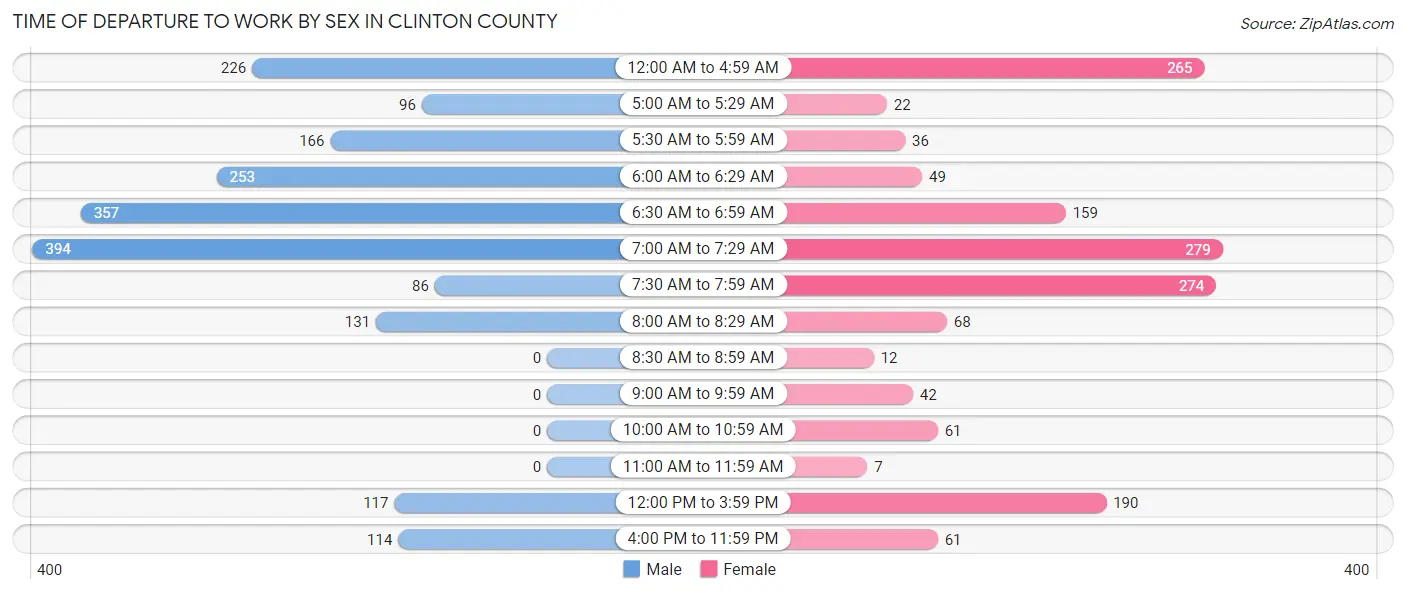
| Time of Departure | Male | Female |
| 12:00 AM to 4:59 AM | 226 (11.7%) | 265 (17.4%) |
| 5:00 AM to 5:29 AM | 96 (5.0%) | 22 (1.4%) |
| 5:30 AM to 5:59 AM | 166 (8.6%) | 36 (2.4%) |
| 6:00 AM to 6:29 AM | 253 (13.0%) | 49 (3.2%) |
| 6:30 AM to 6:59 AM | 357 (18.4%) | 159 (10.4%) |
| 7:00 AM to 7:29 AM | 394 (20.3%) | 279 (18.3%) |
| 7:30 AM to 7:59 AM | 86 (4.4%) | 274 (18.0%) |
| 8:00 AM to 8:29 AM | 131 (6.8%) | 68 (4.5%) |
| 8:30 AM to 8:59 AM | 0 (0.0%) | 12 (0.8%) |
| 9:00 AM to 9:59 AM | 0 (0.0%) | 42 (2.8%) |
| 10:00 AM to 10:59 AM | 0 (0.0%) | 61 (4.0%) |
| 11:00 AM to 11:59 AM | 0 (0.0%) | 7 (0.5%) |
| 12:00 PM to 3:59 PM | 117 (6.0%) | 190 (12.5%) |
| 4:00 PM to 11:59 PM | 114 (5.9%) | 61 (4.0%) |
| Total | 1,940 (100.0%) | 1,525 (100.0%) |
Housing Occupancy in Clinton County
Occupancy by Ownership in Clinton County
Of the total 3,672 dwellings in Clinton County, owner-occupied units account for 2,674 (72.8%), while renter-occupied units make up 998 (27.2%).
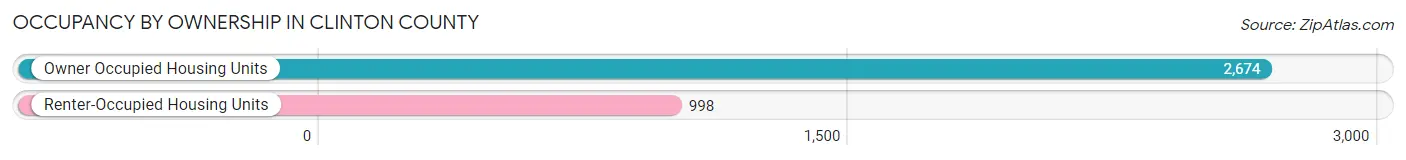
| Occupancy | # Housing Units | % Housing Units |
| Owner Occupied Housing Units | 2,674 | 72.8% |
| Renter-Occupied Housing Units | 998 | 27.2% |
| Total Occupied Housing Units | 3,672 | 100.0% |
Occupancy by Household Size in Clinton County
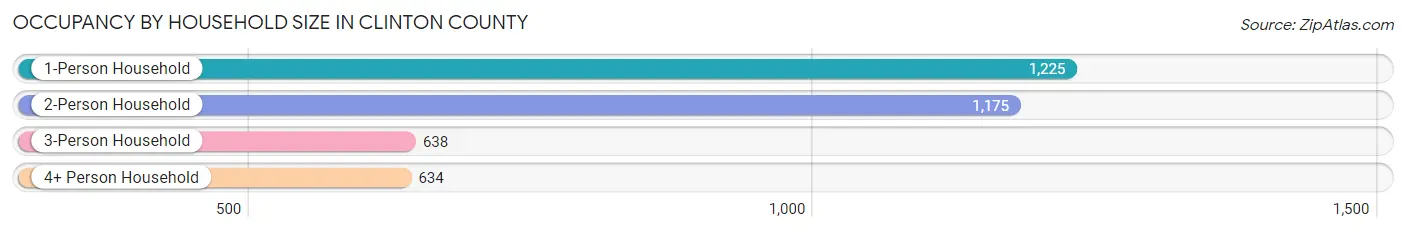
| Household Size | # Housing Units | % Housing Units |
| 1-Person Household | 1,225 | 33.4% |
| 2-Person Household | 1,175 | 32.0% |
| 3-Person Household | 638 | 17.4% |
| 4+ Person Household | 634 | 17.3% |
| Total Housing Units | 3,672 | 100.0% |
Occupancy by Ownership by Household Size in Clinton County
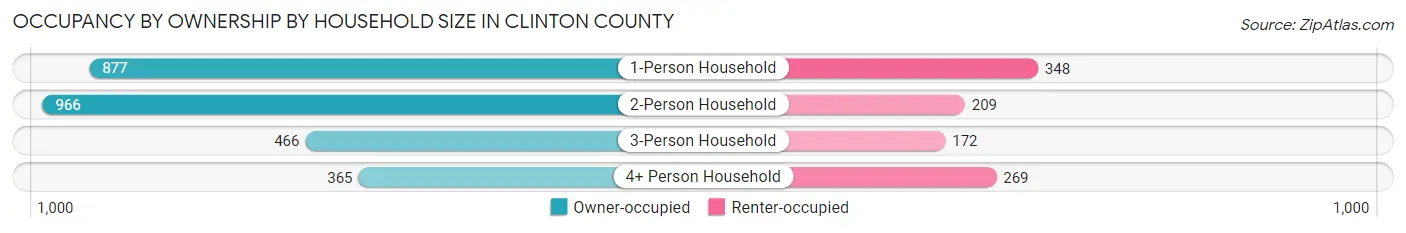
| Household Size | Owner-occupied | Renter-occupied |
| 1-Person Household | 877 (71.6%) | 348 (28.4%) |
| 2-Person Household | 966 (82.2%) | 209 (17.8%) |
| 3-Person Household | 466 (73.0%) | 172 (27.0%) |
| 4+ Person Household | 365 (57.6%) | 269 (42.4%) |
| Total Housing Units | 2,674 (72.8%) | 998 (27.2%) |
Occupancy by Educational Attainment in Clinton County
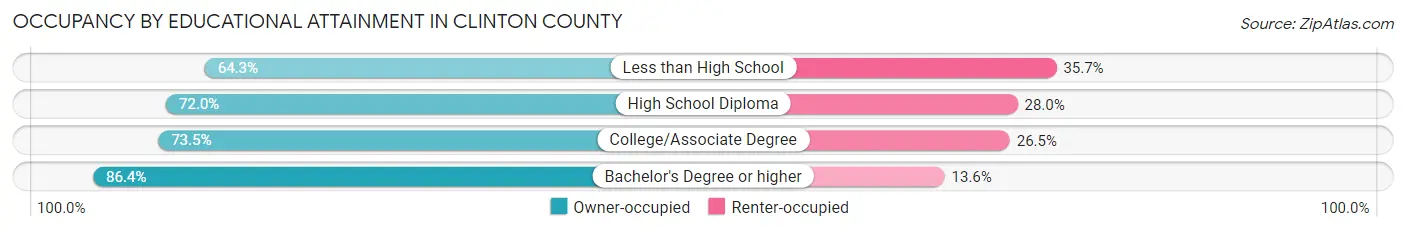
| Household Size | Owner-occupied | Renter-occupied |
| Less than High School | 507 (64.3%) | 282 (35.7%) |
| High School Diploma | 1,014 (72.0%) | 395 (28.0%) |
| College/Associate Degree | 688 (73.5%) | 248 (26.5%) |
| Bachelor's Degree or higher | 465 (86.4%) | 73 (13.6%) |
Occupancy by Age of Householder in Clinton County
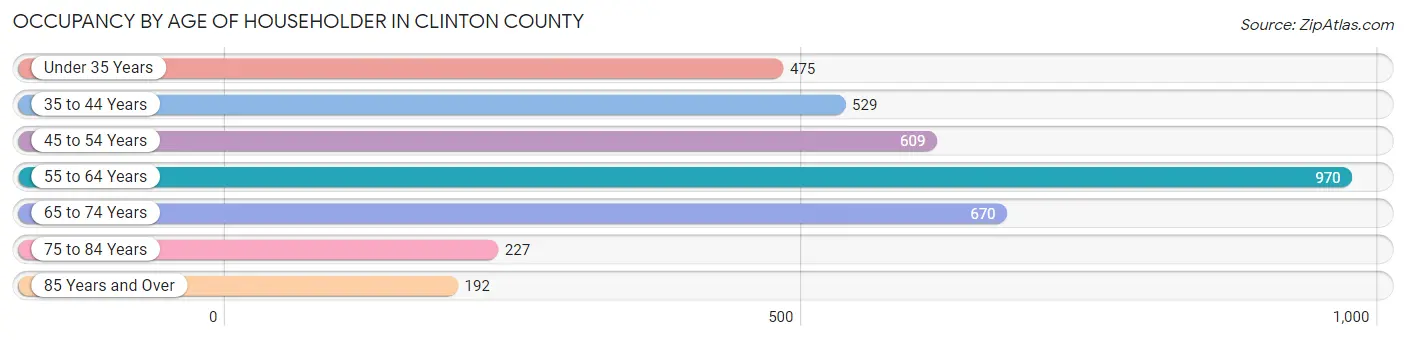
| Age Bracket | # Households | % Households |
| Under 35 Years | 475 | 12.9% |
| 35 to 44 Years | 529 | 14.4% |
| 45 to 54 Years | 609 | 16.6% |
| 55 to 64 Years | 970 | 26.4% |
| 65 to 74 Years | 670 | 18.2% |
| 75 to 84 Years | 227 | 6.2% |
| 85 Years and Over | 192 | 5.2% |
| Total | 3,672 | 100.0% |
Housing Finances in Clinton County
Median Income by Occupancy in Clinton County
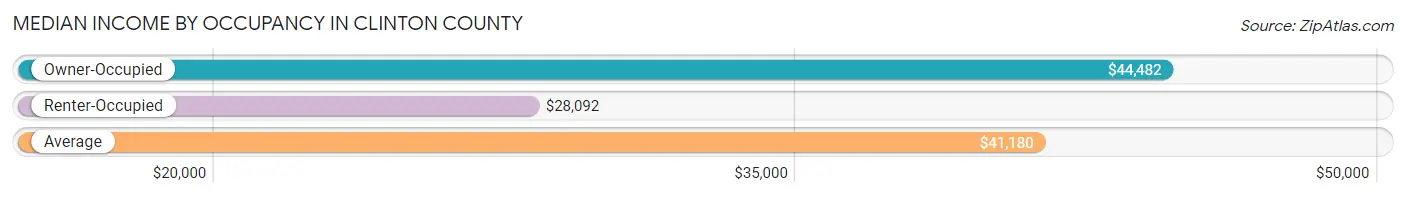
| Occupancy Type | # Households | Median Income |
| Owner-Occupied | 2,674 (72.8%) | $44,482 |
| Renter-Occupied | 998 (27.2%) | $28,092 |
| Average | 3,672 (100.0%) | $41,180 |
Occupancy by Householder Income Bracket in Clinton County
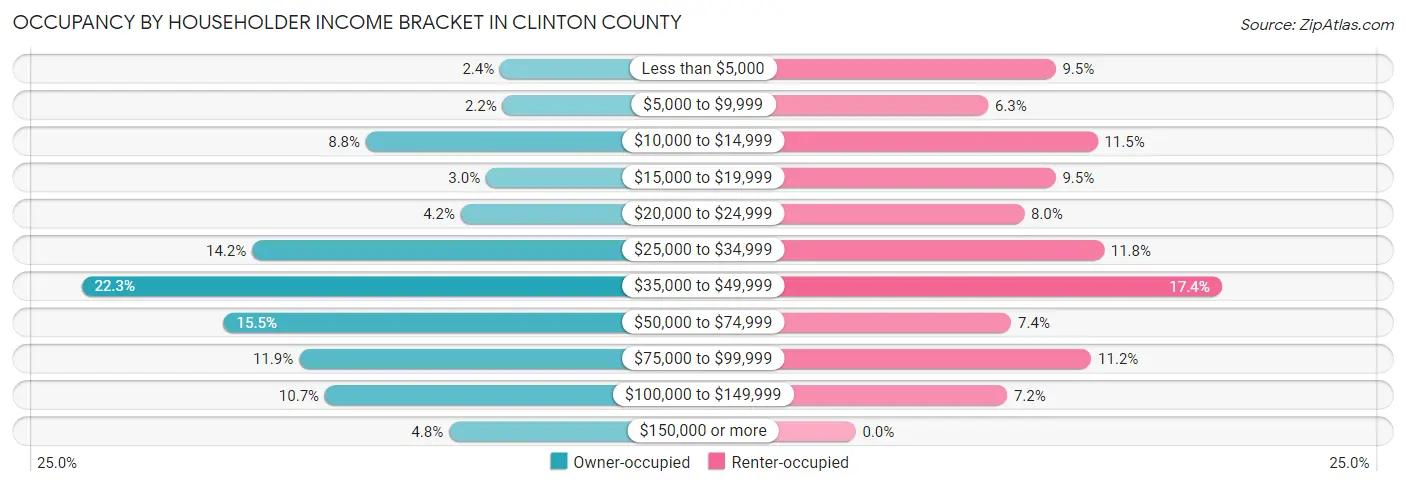
| Income Bracket | Owner-occupied | Renter-occupied |
| Less than $5,000 | 63 (2.4%) | 95 (9.5%) |
| $5,000 to $9,999 | 60 (2.2%) | 63 (6.3%) |
| $10,000 to $14,999 | 234 (8.7%) | 115 (11.5%) |
| $15,000 to $19,999 | 81 (3.0%) | 95 (9.5%) |
| $20,000 to $24,999 | 113 (4.2%) | 80 (8.0%) |
| $25,000 to $34,999 | 379 (14.2%) | 118 (11.8%) |
| $35,000 to $49,999 | 596 (22.3%) | 174 (17.4%) |
| $50,000 to $74,999 | 415 (15.5%) | 74 (7.4%) |
| $75,000 to $99,999 | 319 (11.9%) | 112 (11.2%) |
| $100,000 to $149,999 | 286 (10.7%) | 72 (7.2%) |
| $150,000 or more | 128 (4.8%) | 0 (0.0%) |
| Total | 2,674 (100.0%) | 998 (100.0%) |
Monthly Housing Cost Tiers in Clinton County
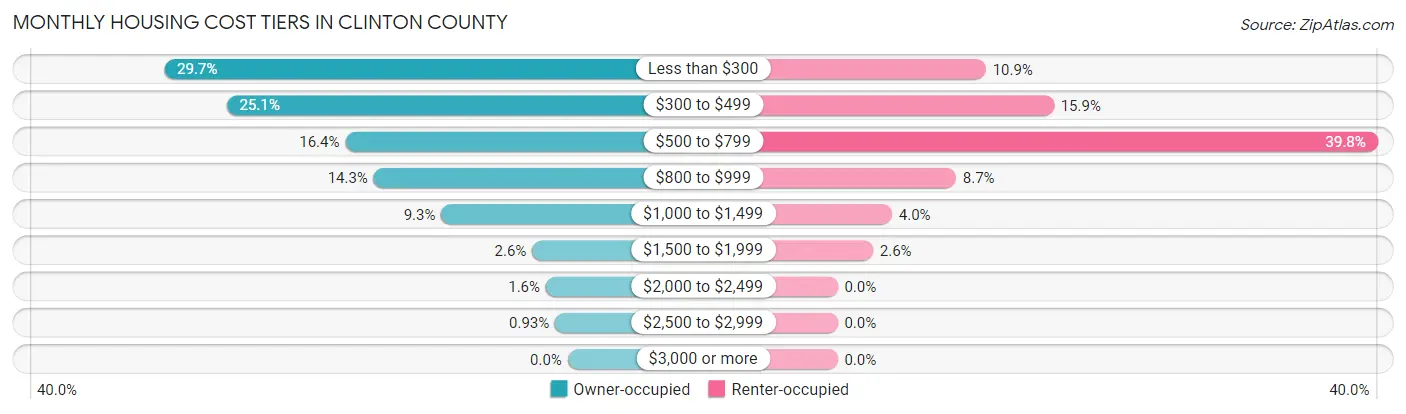
| Monthly Cost | Owner-occupied | Renter-occupied |
| Less than $300 | 795 (29.7%) | 109 (10.9%) |
| $300 to $499 | 672 (25.1%) | 159 (15.9%) |
| $500 to $799 | 438 (16.4%) | 397 (39.8%) |
| $800 to $999 | 382 (14.3%) | 87 (8.7%) |
| $1,000 to $1,499 | 249 (9.3%) | 40 (4.0%) |
| $1,500 to $1,999 | 70 (2.6%) | 26 (2.6%) |
| $2,000 to $2,499 | 43 (1.6%) | 0 (0.0%) |
| $2,500 to $2,999 | 25 (0.9%) | 0 (0.0%) |
| $3,000 or more | 0 (0.0%) | 0 (0.0%) |
| Total | 2,674 (100.0%) | 998 (100.0%) |
Physical Housing Characteristics in Clinton County
Housing Structures in Clinton County
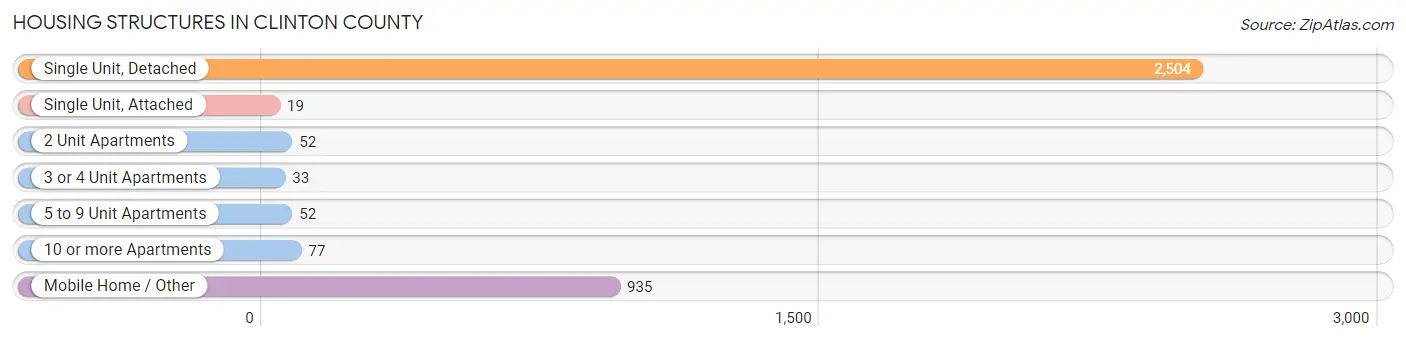
| Structure Type | # Housing Units | % Housing Units |
| Single Unit, Detached | 2,504 | 68.2% |
| Single Unit, Attached | 19 | 0.5% |
| 2 Unit Apartments | 52 | 1.4% |
| 3 or 4 Unit Apartments | 33 | 0.9% |
| 5 to 9 Unit Apartments | 52 | 1.4% |
| 10 or more Apartments | 77 | 2.1% |
| Mobile Home / Other | 935 | 25.5% |
| Total | 3,672 | 100.0% |
Housing Structures by Occupancy in Clinton County
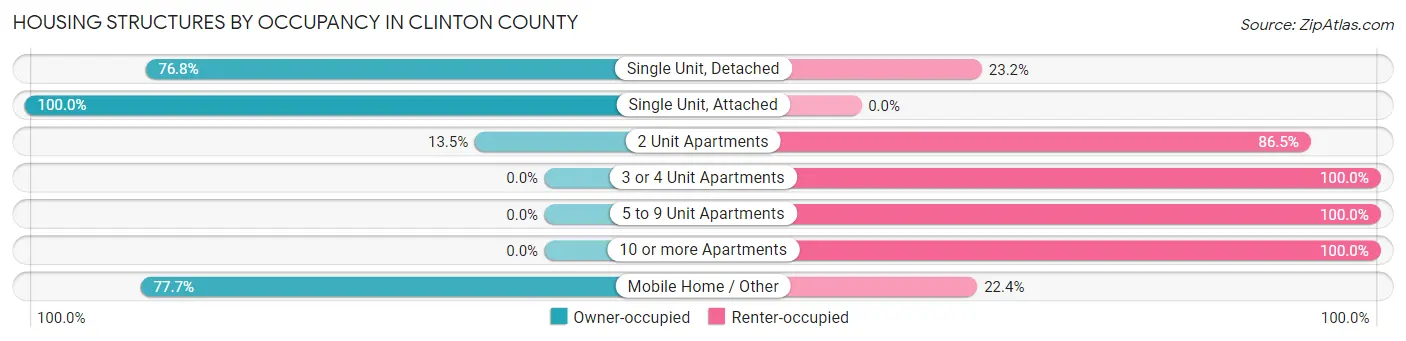
| Structure Type | Owner-occupied | Renter-occupied |
| Single Unit, Detached | 1,922 (76.8%) | 582 (23.2%) |
| Single Unit, Attached | 19 (100.0%) | 0 (0.0%) |
| 2 Unit Apartments | 7 (13.5%) | 45 (86.5%) |
| 3 or 4 Unit Apartments | 0 (0.0%) | 33 (100.0%) |
| 5 to 9 Unit Apartments | 0 (0.0%) | 52 (100.0%) |
| 10 or more Apartments | 0 (0.0%) | 77 (100.0%) |
| Mobile Home / Other | 726 (77.6%) | 209 (22.4%) |
| Total | 2,674 (72.8%) | 998 (27.2%) |
Housing Structures by Number of Rooms in Clinton County
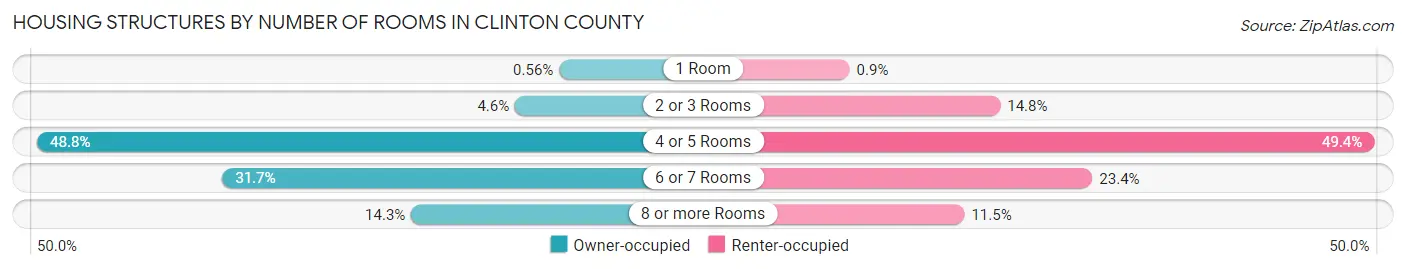
| Number of Rooms | Owner-occupied | Renter-occupied |
| 1 Room | 15 (0.6%) | 9 (0.9%) |
| 2 or 3 Rooms | 124 (4.6%) | 148 (14.8%) |
| 4 or 5 Rooms | 1,306 (48.8%) | 493 (49.4%) |
| 6 or 7 Rooms | 848 (31.7%) | 233 (23.4%) |
| 8 or more Rooms | 381 (14.2%) | 115 (11.5%) |
| Total | 2,674 (100.0%) | 998 (100.0%) |
Housing Structure by Heating Type in Clinton County
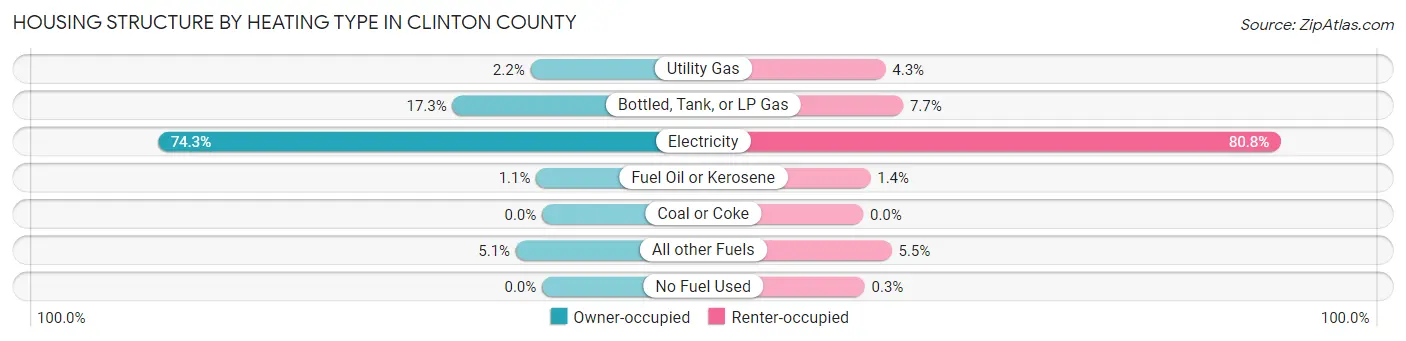
| Heating Type | Owner-occupied | Renter-occupied |
| Utility Gas | 60 (2.2%) | 43 (4.3%) |
| Bottled, Tank, or LP Gas | 463 (17.3%) | 77 (7.7%) |
| Electricity | 1,986 (74.3%) | 806 (80.8%) |
| Fuel Oil or Kerosene | 30 (1.1%) | 14 (1.4%) |
| Coal or Coke | 0 (0.0%) | 0 (0.0%) |
| All other Fuels | 135 (5.1%) | 55 (5.5%) |
| No Fuel Used | 0 (0.0%) | 3 (0.3%) |
| Total | 2,674 (100.0%) | 998 (100.0%) |
Household Vehicle Usage in Clinton County
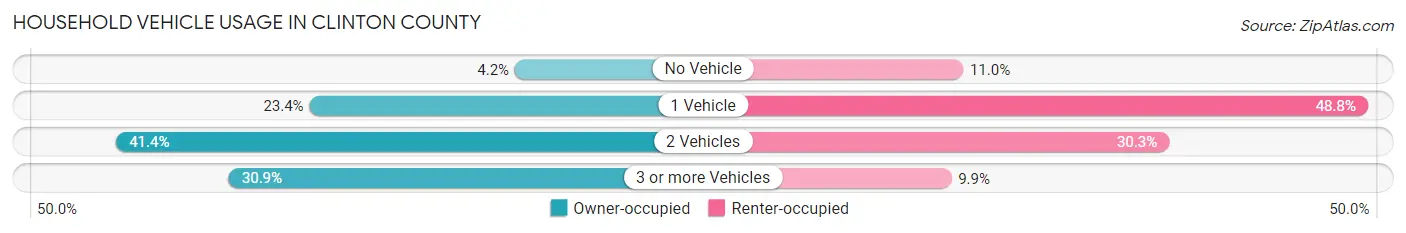
| Vehicles per Household | Owner-occupied | Renter-occupied |
| No Vehicle | 113 (4.2%) | 110 (11.0%) |
| 1 Vehicle | 626 (23.4%) | 487 (48.8%) |
| 2 Vehicles | 1,108 (41.4%) | 302 (30.3%) |
| 3 or more Vehicles | 827 (30.9%) | 99 (9.9%) |
| Total | 2,674 (100.0%) | 998 (100.0%) |
Real Estate & Mortgages in Clinton County
Real Estate and Mortgage Overview in Clinton County
| Characteristic | Without Mortgage | With Mortgage |
| Housing Units | 1,733 | 941 |
| Median Property Value | $74,600 | $148,600 |
| Median Household Income | $40,265 | $89 |
| Monthly Housing Costs | $313 | $0 |
| Real Estate Taxes | $417 | $70 |
Property Value by Mortgage Status in Clinton County
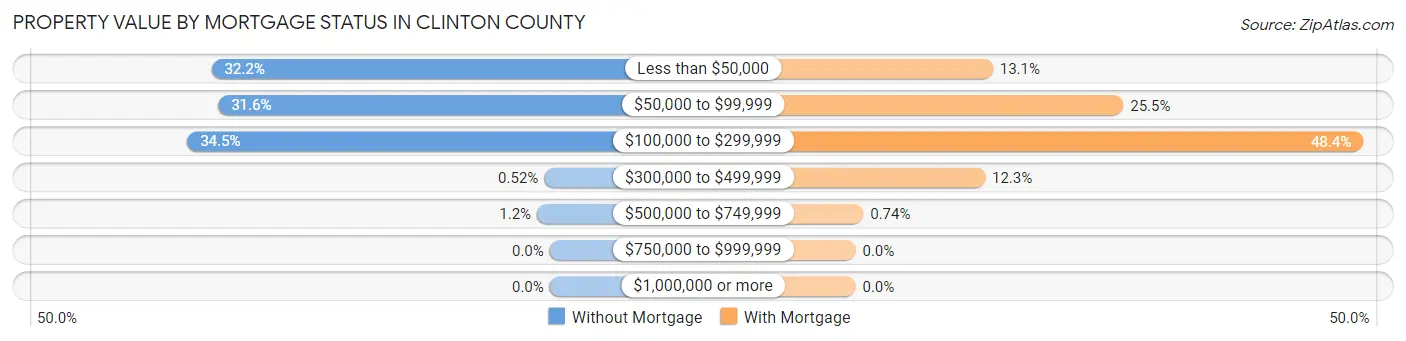
| Property Value | Without Mortgage | With Mortgage |
| Less than $50,000 | 558 (32.2%) | 123 (13.1%) |
| $50,000 to $99,999 | 547 (31.6%) | 240 (25.5%) |
| $100,000 to $299,999 | 598 (34.5%) | 455 (48.3%) |
| $300,000 to $499,999 | 9 (0.5%) | 116 (12.3%) |
| $500,000 to $749,999 | 21 (1.2%) | 7 (0.7%) |
| $750,000 to $999,999 | 0 (0.0%) | 0 (0.0%) |
| $1,000,000 or more | 0 (0.0%) | 0 (0.0%) |
| Total | 1,733 (100.0%) | 941 (100.0%) |
Household Income by Mortgage Status in Clinton County
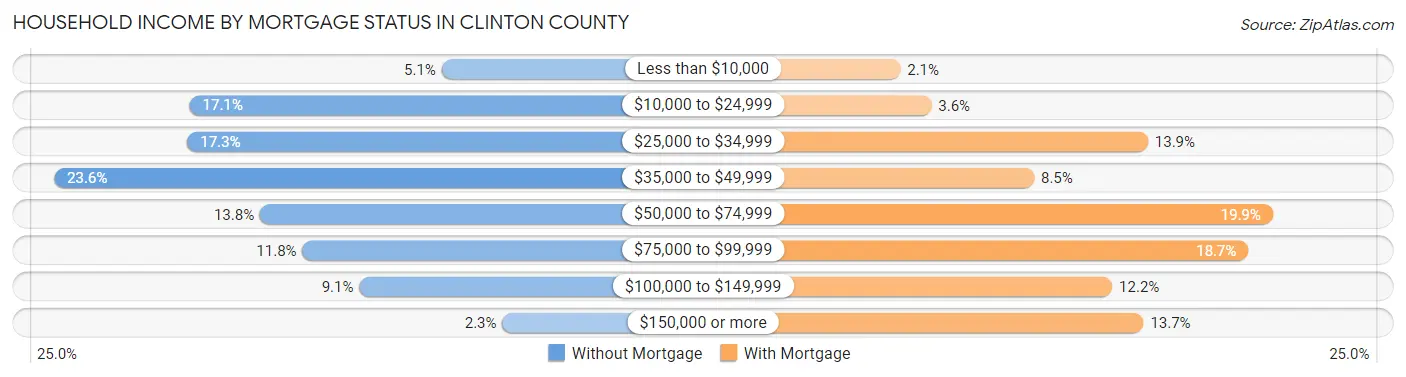
| Household Income | Without Mortgage | With Mortgage |
| Less than $10,000 | 89 (5.1%) | 20 (2.1%) |
| $10,000 to $24,999 | 297 (17.1%) | 34 (3.6%) |
| $25,000 to $34,999 | 299 (17.2%) | 131 (13.9%) |
| $35,000 to $49,999 | 409 (23.6%) | 80 (8.5%) |
| $50,000 to $74,999 | 239 (13.8%) | 187 (19.9%) |
| $75,000 to $99,999 | 204 (11.8%) | 176 (18.7%) |
| $100,000 to $149,999 | 157 (9.1%) | 115 (12.2%) |
| $150,000 or more | 39 (2.2%) | 129 (13.7%) |
| Total | 1,733 (100.0%) | 941 (100.0%) |
Property Value to Household Income Ratio in Clinton County
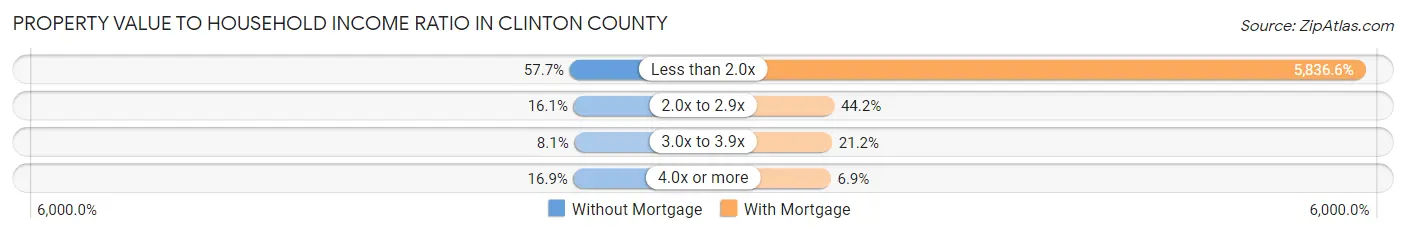
| Value-to-Income Ratio | Without Mortgage | With Mortgage |
| Less than 2.0x | 1,000 (57.7%) | 54,922 (5,836.6%) |
| 2.0x to 2.9x | 279 (16.1%) | 416 (44.2%) |
| 3.0x to 3.9x | 141 (8.1%) | 199 (21.1%) |
| 4.0x or more | 293 (16.9%) | 65 (6.9%) |
| Total | 1,733 (100.0%) | 941 (100.0%) |
Real Estate Taxes by Mortgage Status in Clinton County
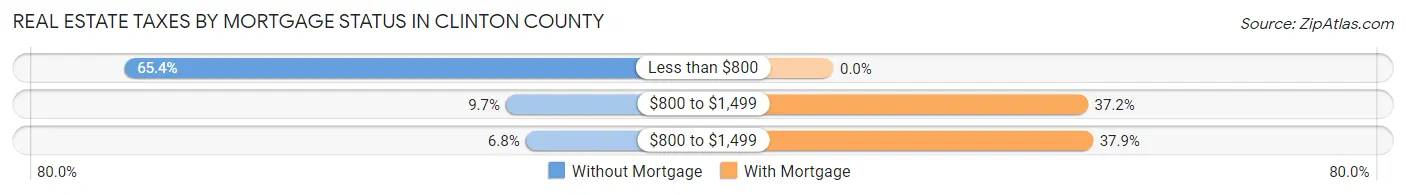
| Property Taxes | Without Mortgage | With Mortgage |
| Less than $800 | 1,134 (65.4%) | 0 (0.0%) |
| $800 to $1,499 | 168 (9.7%) | 350 (37.2%) |
| $800 to $1,499 | 118 (6.8%) | 357 (37.9%) |
| Total | 1,733 (100.0%) | 941 (100.0%) |
Health & Disability in Clinton County
Health Insurance Coverage by Age in Clinton County
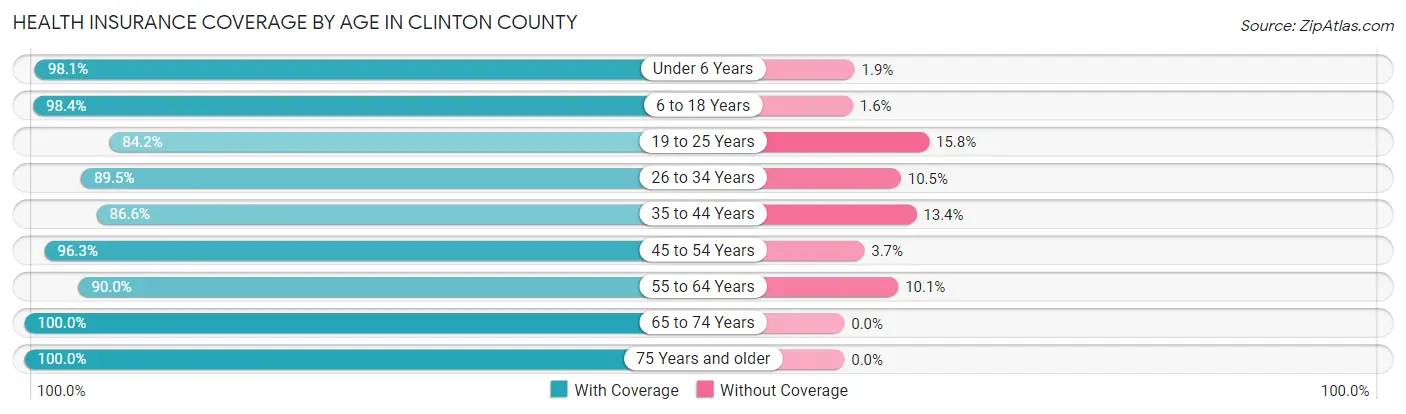
| Age Bracket | With Coverage | Without Coverage |
| Under 6 Years | 612 (98.1%) | 12 (1.9%) |
| 6 to 18 Years | 1,473 (98.4%) | 24 (1.6%) |
| 19 to 25 Years | 549 (84.2%) | 103 (15.8%) |
| 26 to 34 Years | 807 (89.5%) | 95 (10.5%) |
| 35 to 44 Years | 979 (86.6%) | 152 (13.4%) |
| 45 to 54 Years | 1,160 (96.3%) | 45 (3.7%) |
| 55 to 64 Years | 1,208 (89.9%) | 135 (10.1%) |
| 65 to 74 Years | 1,086 (100.0%) | 0 (0.0%) |
| 75 Years and older | 721 (100.0%) | 0 (0.0%) |
| Total | 8,595 (93.8%) | 566 (6.2%) |
Health Insurance Coverage by Citizenship Status in Clinton County
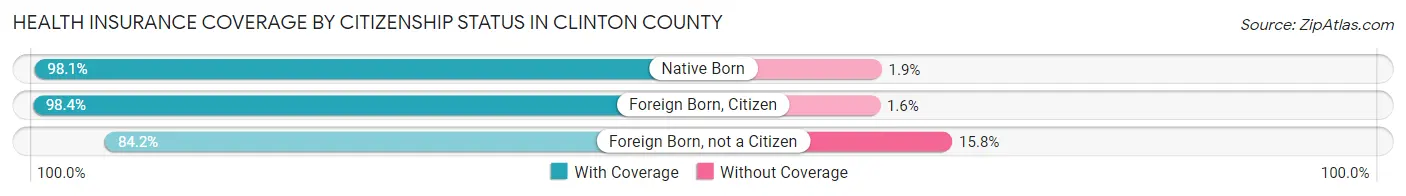
| Citizenship Status | With Coverage | Without Coverage |
| Native Born | 612 (98.1%) | 12 (1.9%) |
| Foreign Born, Citizen | 1,473 (98.4%) | 24 (1.6%) |
| Foreign Born, not a Citizen | 549 (84.2%) | 103 (15.8%) |
Health Insurance Coverage by Household Income in Clinton County
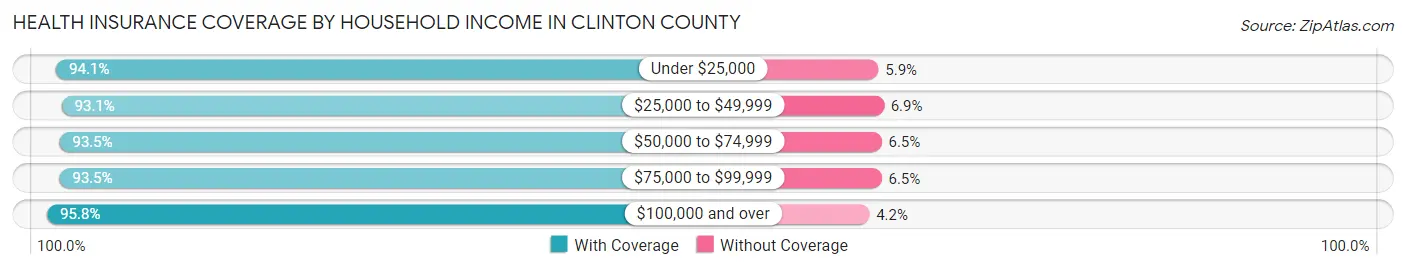
| Household Income | With Coverage | Without Coverage |
| Under $25,000 | 1,609 (94.1%) | 101 (5.9%) |
| $25,000 to $49,999 | 3,071 (93.1%) | 228 (6.9%) |
| $50,000 to $74,999 | 1,279 (93.5%) | 89 (6.5%) |
| $75,000 to $99,999 | 1,220 (93.5%) | 85 (6.5%) |
| $100,000 and over | 1,413 (95.8%) | 62 (4.2%) |
Public vs Private Health Insurance Coverage by Age in Clinton County
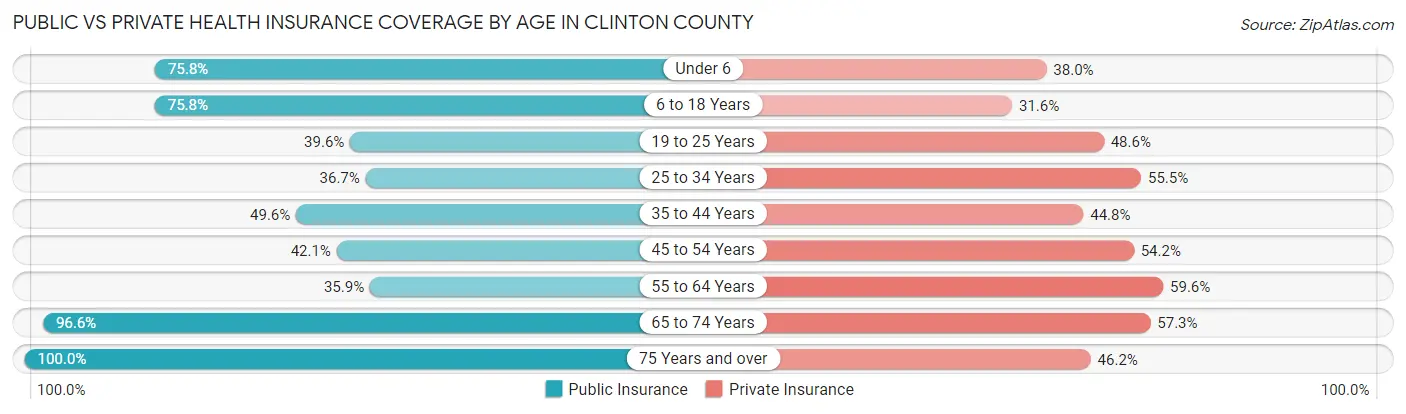
| Age Bracket | Public Insurance | Private Insurance |
| Under 6 | 473 (75.8%) | 237 (38.0%) |
| 6 to 18 Years | 1,135 (75.8%) | 473 (31.6%) |
| 19 to 25 Years | 258 (39.6%) | 317 (48.6%) |
| 25 to 34 Years | 331 (36.7%) | 501 (55.5%) |
| 35 to 44 Years | 561 (49.6%) | 507 (44.8%) |
| 45 to 54 Years | 507 (42.1%) | 653 (54.2%) |
| 55 to 64 Years | 482 (35.9%) | 801 (59.6%) |
| 65 to 74 Years | 1,049 (96.6%) | 622 (57.3%) |
| 75 Years and over | 721 (100.0%) | 333 (46.2%) |
| Total | 5,517 (60.2%) | 4,444 (48.5%) |
Disability Status by Sex by Age in Clinton County
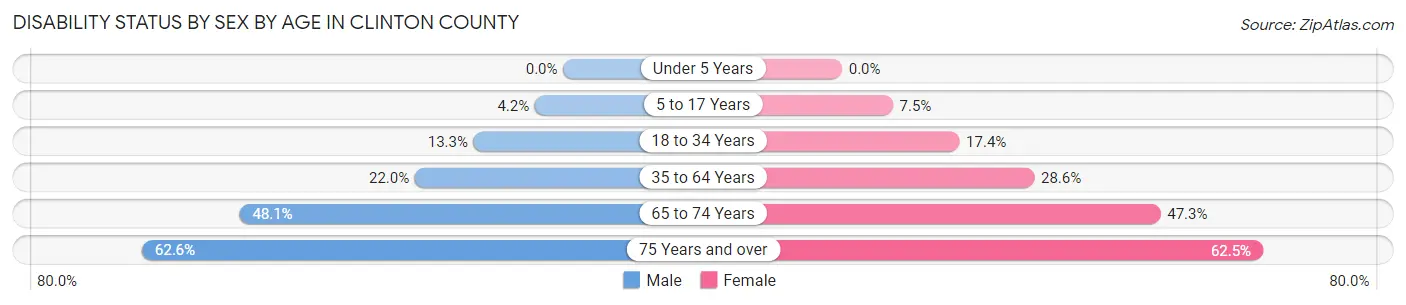
| Age Bracket | Male | Female |
| Under 5 Years | 0 (0.0%) | 0 (0.0%) |
| 5 to 17 Years | 30 (4.2%) | 55 (7.5%) |
| 18 to 34 Years | 118 (13.3%) | 144 (17.4%) |
| 35 to 64 Years | 396 (22.0%) | 537 (28.5%) |
| 65 to 74 Years | 265 (48.1%) | 253 (47.3%) |
| 75 Years and over | 204 (62.6%) | 247 (62.5%) |
Disability Class by Sex by Age in Clinton County
Disability Class: Hearing Difficulty
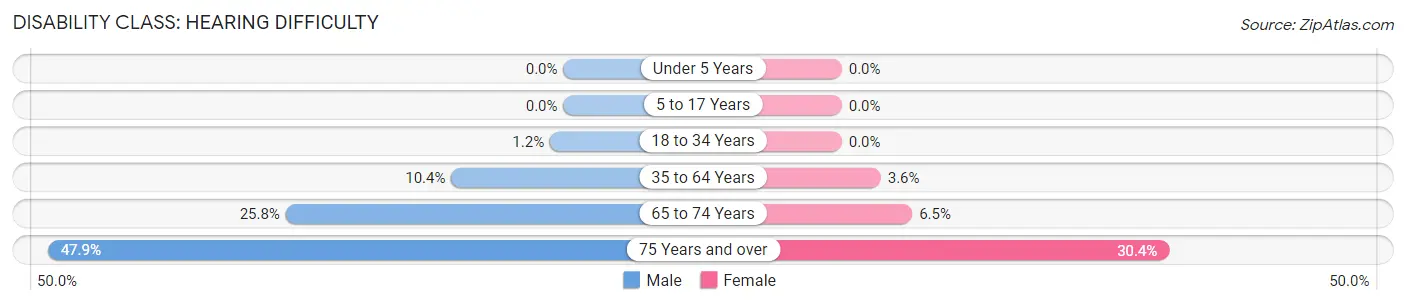
| Age Bracket | Male | Female |
| Under 5 Years | 0 (0.0%) | 0 (0.0%) |
| 5 to 17 Years | 0 (0.0%) | 0 (0.0%) |
| 18 to 34 Years | 11 (1.2%) | 0 (0.0%) |
| 35 to 64 Years | 187 (10.4%) | 68 (3.6%) |
| 65 to 74 Years | 142 (25.8%) | 35 (6.5%) |
| 75 Years and over | 156 (47.8%) | 120 (30.4%) |
Disability Class: Vision Difficulty
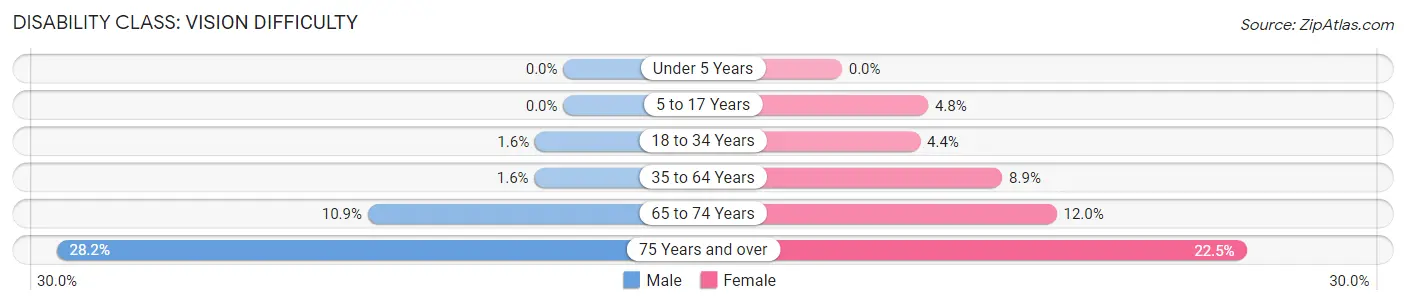
| Age Bracket | Male | Female |
| Under 5 Years | 0 (0.0%) | 0 (0.0%) |
| 5 to 17 Years | 0 (0.0%) | 35 (4.8%) |
| 18 to 34 Years | 14 (1.6%) | 36 (4.4%) |
| 35 to 64 Years | 29 (1.6%) | 168 (8.9%) |
| 65 to 74 Years | 60 (10.9%) | 64 (12.0%) |
| 75 Years and over | 92 (28.2%) | 89 (22.5%) |
Disability Class: Cognitive Difficulty
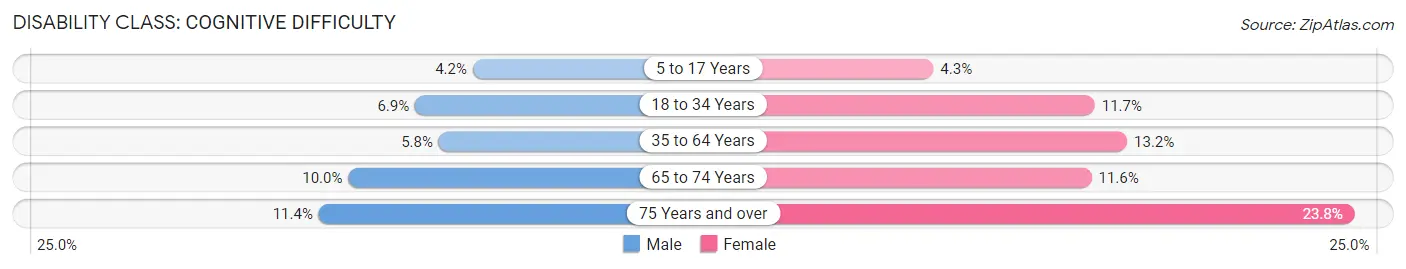
| Age Bracket | Male | Female |
| 5 to 17 Years | 30 (4.2%) | 31 (4.3%) |
| 18 to 34 Years | 61 (6.9%) | 97 (11.7%) |
| 35 to 64 Years | 104 (5.8%) | 249 (13.2%) |
| 65 to 74 Years | 55 (10.0%) | 62 (11.6%) |
| 75 Years and over | 37 (11.4%) | 94 (23.8%) |
Disability Class: Ambulatory Difficulty
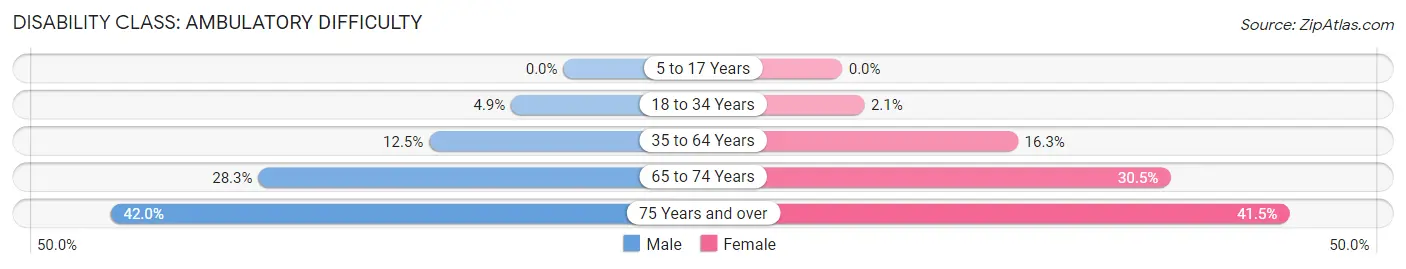
| Age Bracket | Male | Female |
| 5 to 17 Years | 0 (0.0%) | 0 (0.0%) |
| 18 to 34 Years | 43 (4.9%) | 17 (2.1%) |
| 35 to 64 Years | 224 (12.5%) | 307 (16.3%) |
| 65 to 74 Years | 156 (28.3%) | 163 (30.5%) |
| 75 Years and over | 137 (42.0%) | 164 (41.5%) |
Disability Class: Self-Care Difficulty
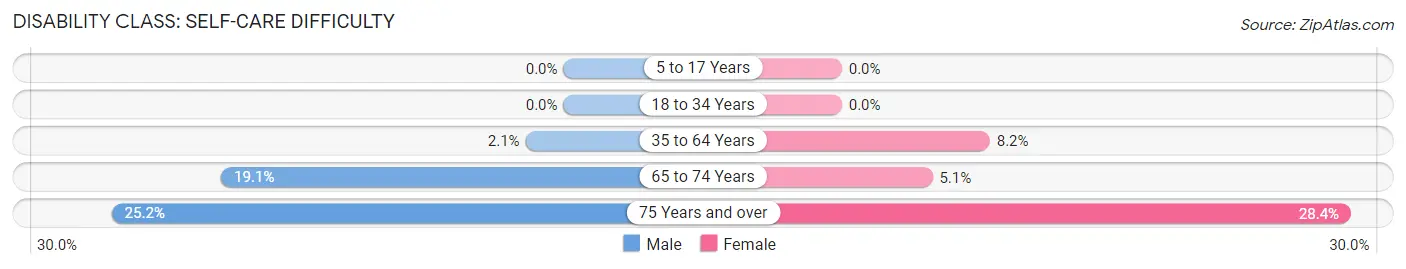
| Age Bracket | Male | Female |
| 5 to 17 Years | 0 (0.0%) | 0 (0.0%) |
| 18 to 34 Years | 0 (0.0%) | 0 (0.0%) |
| 35 to 64 Years | 38 (2.1%) | 155 (8.2%) |
| 65 to 74 Years | 105 (19.1%) | 27 (5.1%) |
| 75 Years and over | 82 (25.2%) | 112 (28.3%) |
Technology Access in Clinton County
Computing Device Access in Clinton County
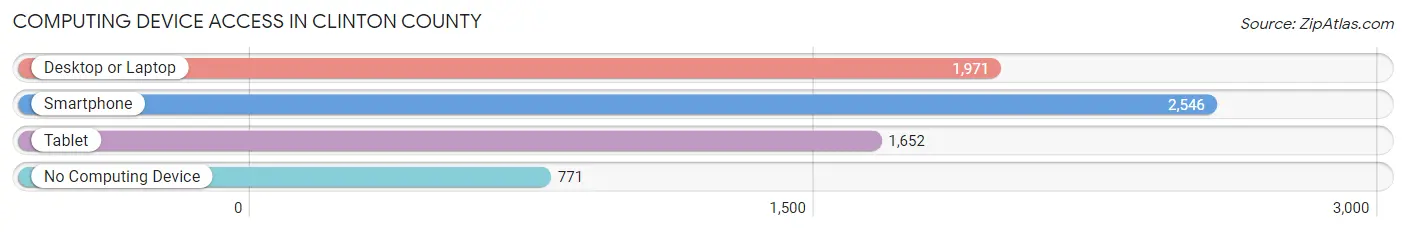
| Device Type | # Households | % Households |
| Desktop or Laptop | 1,971 | 53.7% |
| Smartphone | 2,546 | 69.3% |
| Tablet | 1,652 | 45.0% |
| No Computing Device | 771 | 21.0% |
| Total | 3,672 | 100.0% |
Internet Access in Clinton County
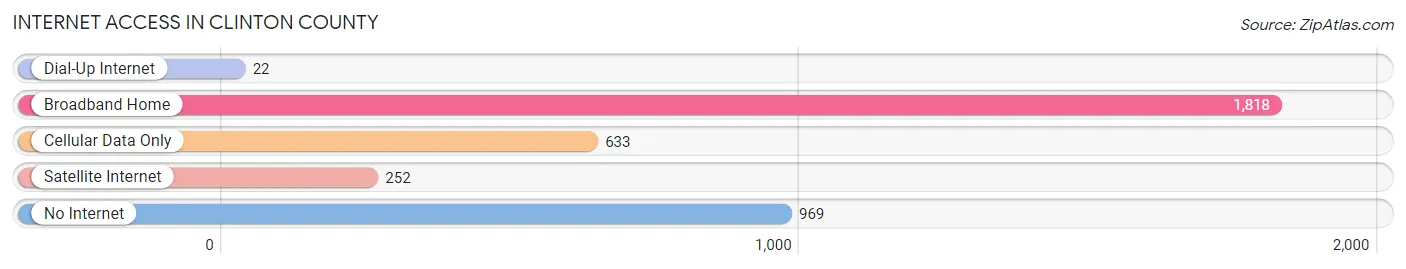
| Internet Type | # Households | % Households |
| Dial-Up Internet | 22 | 0.6% |
| Broadband Home | 1,818 | 49.5% |
| Cellular Data Only | 633 | 17.2% |
| Satellite Internet | 252 | 6.9% |
| No Internet | 969 | 26.4% |
| Total | 3,672 | 100.0% |
Clinton County Summary
County History
Clinton County is located in the south-central region of Kentucky and is part of the Cumberland Plateau. It was established in 1835 from parts of Cumberland and Wayne counties and was named after DeWitt Clinton, the seventh governor of New York. The county seat is Albany, which was established in 1837.
The county was originally inhabited by Native Americans, including the Cherokee, Chickasaw, and Shawnee tribes. The first European settlers arrived in the late 1700s and early 1800s, and the county was officially established in 1835.
The county was largely agricultural in the 19th century, with tobacco, corn, and wheat being the main crops. The county also had a thriving timber industry, with the timber being used to build homes and other structures.
In the early 20th century, the county began to diversify its economy, with the establishment of several manufacturing plants. The county also saw an influx of new residents, as people moved to the area to take advantage of the new job opportunities.
Geography
Clinton County is located in the south-central region of Kentucky and is part of the Cumberland Plateau. It is bordered by Wayne County to the north, Cumberland County to the east, Russell County to the south, and Adair County to the west.
The county has a total area of 437 square miles, of which 434 square miles is land and 3 square miles is water. The county is mostly hilly, with the highest point being the summit of Big Hill, which has an elevation of 1,845 feet.
The county is home to several rivers and creeks, including the Cumberland River, the Big South Fork of the Cumberland River, and the Little South Fork of the Cumberland River. The county also has several lakes, including Lake Cumberland, Lake Malone, and Lake Cumberland State Park.
Economy
Clinton County has a diverse economy, with a mix of agriculture, manufacturing, and tourism. The county is home to several large employers, including the Clinton County Correctional Facility, the Clinton County Regional Detention Center, and the Clinton County Industrial Park.
Agriculture is an important part of the county’s economy, with the main crops being tobacco, corn, and wheat. The county also has a thriving timber industry, with the timber being used to build homes and other structures.
Manufacturing is also an important part of the county’s economy, with several large plants located in the county. The largest employer in the county is the Clinton County Correctional Facility, which employs over 1,000 people.
Tourism is also an important part of the county’s economy, with several popular attractions, including Lake Cumberland State Park, the Big South Fork National River and Recreation Area, and the Clinton County Historical Museum.
Demographics
As of the 2010 census, the population of Clinton County was 10,272. The population has remained relatively stable over the past decade, with a slight decrease of 0.3% since 2000.
The racial makeup of the county is 95.3% White, 2.7% Black or African American, 0.3% Native American, 0.2% Asian, 0.1% Pacific Islander, 0.5% from other races, and 0.9% from two or more races. The median household income is $33,945, and the median family income is $41,945.
The largest employers in the county are the Clinton County Correctional Facility, the Clinton County Regional Detention Center, and the Clinton County Industrial Park. The county also has several large manufacturing plants, including the Clinton County Industrial Park and the Clinton County Manufacturing Plant.
Conclusion
Clinton County is located in the south-central region of Kentucky and is part of the Cumberland Plateau. It was established in 1835 from parts of Cumberland and Wayne counties and was named after DeWitt Clinton, the seventh governor of New York. The county has a diverse economy, with a mix of agriculture, manufacturing, and tourism. The population of the county is 10,272, and the median household income is $33,945. The largest employers in the county are the Clinton County Correctional Facility, the Clinton County Regional Detention Center, and the Clinton County Industrial Park.
Common Questions
What is Per Capita Income in Clinton County?
Per Capita income in Clinton County is $23,905.
What is the Median Family Income in Clinton County?
Median Family Income in Clinton County is $48,876.
What is the Median Household income in Clinton County?
Median Household Income in Clinton County is $41,180.
What is Income or Wage Gap in Clinton County?
Income or Wage Gap in Clinton County is 15.1%.
Women in Clinton County earn 84.9 cents for every dollar earned by a man.
What is Family Income Deficit in Clinton County?
Family Income Deficit in Clinton County is $10,182.
Families that are below poverty line in Clinton County earn $10,182 less on average than the poverty threshold level.
What is Inequality or Gini Index in Clinton County?
Inequality or Gini Index in Clinton County is 0.46.
What is the Total Population of Clinton County?
Total Population of Clinton County is 9,295.
What is the Total Male Population of Clinton County?
Total Male Population of Clinton County is 4,644.
What is the Total Female Population of Clinton County?
Total Female Population of Clinton County is 4,651.
What is the Ratio of Males per 100 Females in Clinton County?
There are 99.85 Males per 100 Females in Clinton County.
What is the Ratio of Females per 100 Males in Clinton County?
There are 100.15 Females per 100 Males in Clinton County.
What is the Median Population Age in Clinton County?
Median Population Age in Clinton County is 42.4 Years.
What is the Average Family Size in Clinton County
Average Family Size in Clinton County is 3.2 People.
What is the Average Household Size in Clinton County
Average Household Size in Clinton County is 2.5 People.
How Large is the Labor Force in Clinton County?
There are 3,970 People in the Labor Forcein in Clinton County.
What is the Percentage of People in the Labor Force in Clinton County?
52.5% of People are in the Labor Force in Clinton County.
What is the Unemployment Rate in Clinton County?
Unemployment Rate in Clinton County is 5.6%.