Clay County, KY Map & Demographics
Clay County Map
Clay County Overview
$19,579
PER CAPITA INCOME
$43,927
AVG FAMILY INCOME
$37,888
AVG HOUSEHOLD INCOME
3.2%
WAGE / INCOME GAP [ % ]
96.8¢/ $1
WAGE / INCOME GAP [ $ ]
$11,139
FAMILY INCOME DEFICIT
0.46
INEQUALITY / GINI INDEX
20,322
TOTAL POPULATION
10,703
MALE POPULATION
9,619
FEMALE POPULATION
111.27
MALES / 100 FEMALES
89.87
FEMALES / 100 MALES
40.4
MEDIAN AGE
3.1
AVG FAMILY SIZE
2.7
AVG HOUSEHOLD SIZE
6,894
LABOR FORCE [ PEOPLE ]
41.7%
PERCENT IN LABOR FORCE
10.0%
UNEMPLOYMENT RATE
Clay County Area Codes
Income in Clay County
Income Overview in Clay County
Per Capita Income in Clay County is $19,579, while median incomes of families and households are $43,927 and $37,888 respectively.
| Characteristic | Number | Measure |
| Per Capita Income | 20,322 | $19,579 |
| Median Family Income | 5,139 | $43,927 |
| Mean Family Income | 5,139 | $56,775 |
| Median Household Income | 7,110 | $37,888 |
| Mean Household Income | 7,110 | $49,866 |
| Income Deficit | 5,139 | $11,139 |
| Wage / Income Gap (%) | 20,322 | 3.21% |
| Wage / Income Gap ($) | 20,322 | 96.79¢ per $1 |
| Gini / Inequality Index | 20,322 | 0.46 |
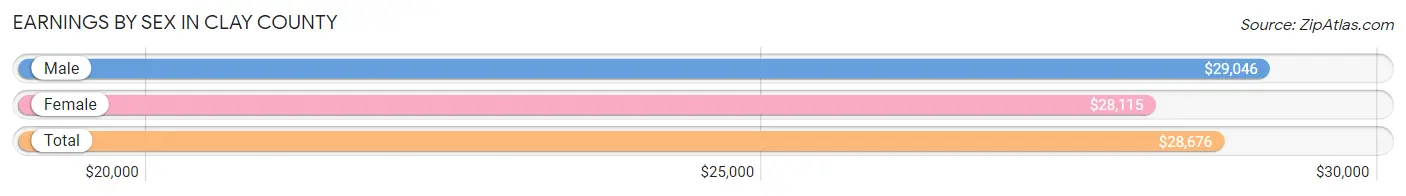
Earnings by Sex in Clay County
Average Earnings in Clay County are $28,676, $29,046 for men and $28,115 for women, a difference of 3.2%.
| Sex | Number | Average Earnings |
| Male | 4,161 (55.8%) | $29,046 |
| Female | 3,297 (44.2%) | $28,115 |
| Total | 7,458 (100.0%) | $28,676 |
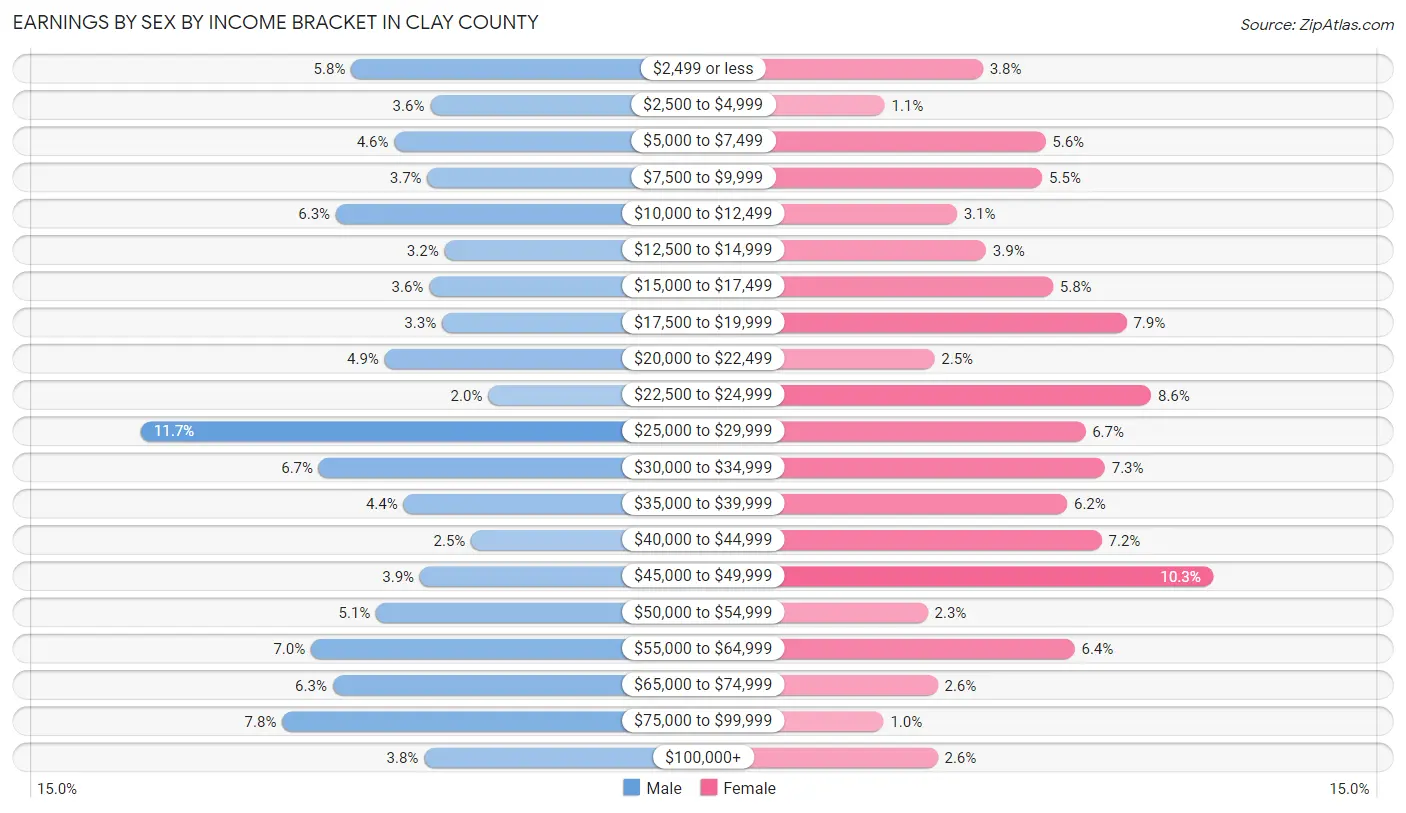
Earnings by Sex by Income Bracket in Clay County
The most common earnings brackets in Clay County are $25,000 to $29,999 for men (488 | 11.7%) and $45,000 to $49,999 for women (339 | 10.3%).
| Income | Male | Female |
| $2,499 or less | 242 (5.8%) | 126 (3.8%) |
| $2,500 to $4,999 | 150 (3.6%) | 35 (1.1%) |
| $5,000 to $7,499 | 192 (4.6%) | 184 (5.6%) |
| $7,500 to $9,999 | 153 (3.7%) | 181 (5.5%) |
| $10,000 to $12,499 | 260 (6.2%) | 102 (3.1%) |
| $12,500 to $14,999 | 133 (3.2%) | 129 (3.9%) |
| $15,000 to $17,499 | 151 (3.6%) | 191 (5.8%) |
| $17,500 to $19,999 | 136 (3.3%) | 259 (7.9%) |
| $20,000 to $22,499 | 203 (4.9%) | 81 (2.5%) |
| $22,500 to $24,999 | 82 (2.0%) | 282 (8.6%) |
| $25,000 to $29,999 | 488 (11.7%) | 221 (6.7%) |
| $30,000 to $34,999 | 280 (6.7%) | 239 (7.2%) |
| $35,000 to $39,999 | 181 (4.3%) | 204 (6.2%) |
| $40,000 to $44,999 | 102 (2.5%) | 236 (7.2%) |
| $45,000 to $49,999 | 162 (3.9%) | 339 (10.3%) |
| $50,000 to $54,999 | 213 (5.1%) | 75 (2.3%) |
| $55,000 to $64,999 | 289 (7.0%) | 211 (6.4%) |
| $65,000 to $74,999 | 264 (6.3%) | 84 (2.5%) |
| $75,000 to $99,999 | 323 (7.8%) | 34 (1.0%) |
| $100,000+ | 157 (3.8%) | 84 (2.5%) |
| Total | 4,161 (100.0%) | 3,297 (100.0%) |
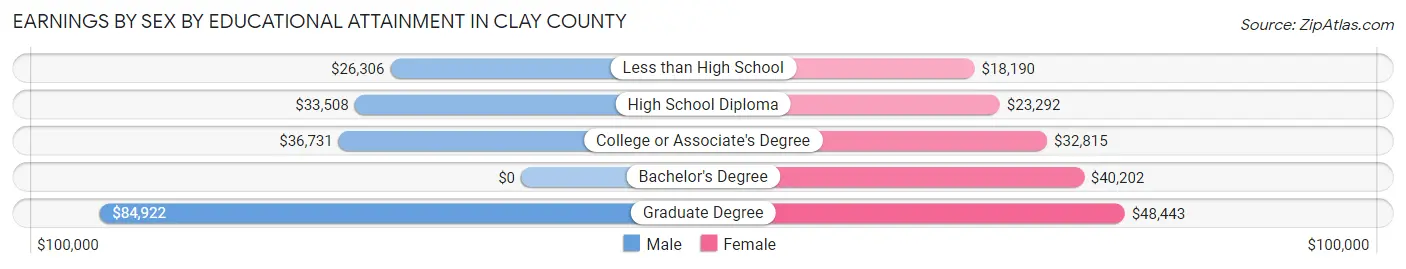
Earnings by Sex by Educational Attainment in Clay County
Average earnings in Clay County are $31,847 for men and $29,330 for women, a difference of 7.9%. Men with an educational attainment of graduate degree enjoy the highest average annual earnings of $84,922, while those with less than high school education earn the least with $26,306. Women with an educational attainment of graduate degree earn the most with the average annual earnings of $48,443, while those with less than high school education have the smallest earnings of $18,190.
| Educational Attainment | Male Income | Female Income |
| Less than High School | $26,306 | $18,190 |
| High School Diploma | $33,508 | $23,292 |
| College or Associate's Degree | $36,731 | $32,815 |
| Bachelor's Degree | - | - |
| Graduate Degree | $84,922 | $48,443 |
| Total | $31,847 | $29,330 |
Family Income in Clay County
Family Income Brackets in Clay County
According to the Clay County family income data, there are 863 families falling into the $50,000 to $74,999 income range, which is the most common income bracket and makes up 16.8% of all families. Conversely, the $200,000+ income bracket is the least frequent group with only 77 families (1.5%) belonging to this category.
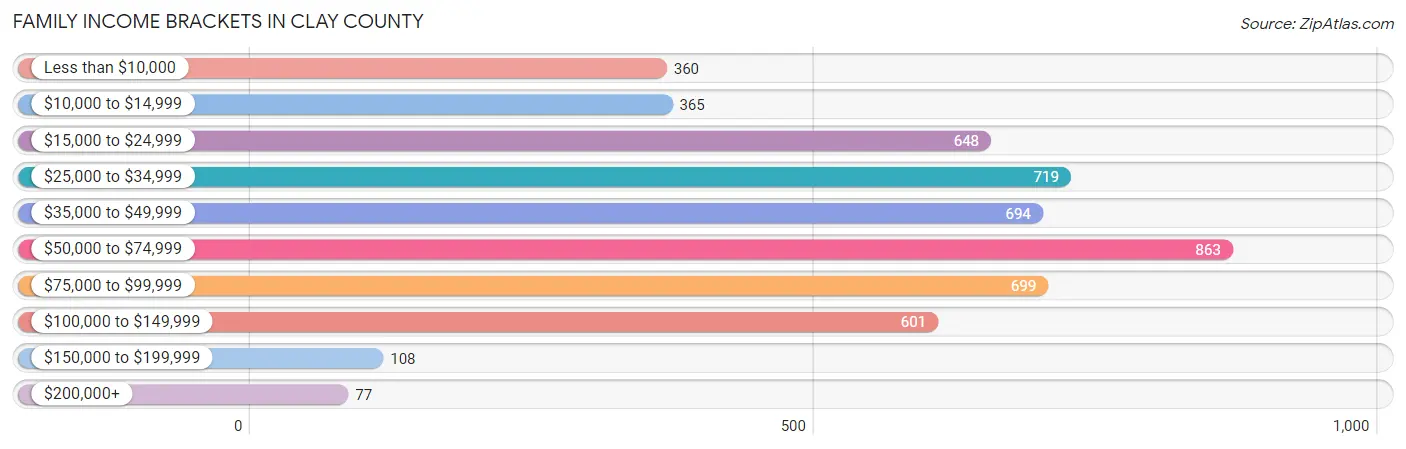
| Income Bracket | # Families | % Families |
| Less than $10,000 | 360 | 7.0% |
| $10,000 to $14,999 | 365 | 7.1% |
| $15,000 to $24,999 | 648 | 12.6% |
| $25,000 to $34,999 | 719 | 14.0% |
| $35,000 to $49,999 | 694 | 13.5% |
| $50,000 to $74,999 | 863 | 16.8% |
| $75,000 to $99,999 | 699 | 13.6% |
| $100,000 to $149,999 | 601 | 11.7% |
| $150,000 to $199,999 | 108 | 2.1% |
| $200,000+ | 77 | 1.5% |
Family Income by Famaliy Size in Clay County
6-person families (95 | 1.8%) account for the highest median family income in Clay County with $92,232 per family, while 2-person families (2,133 | 41.5%) have the highest median income of $20,768 per family member.
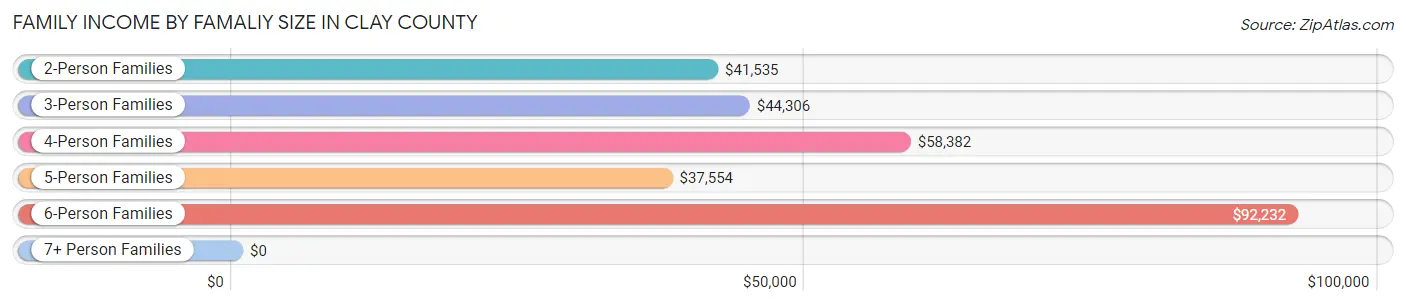
| Income Bracket | # Families | Median Income |
| 2-Person Families | 2,133 (41.5%) | $41,535 |
| 3-Person Families | 1,434 (27.9%) | $44,306 |
| 4-Person Families | 1,120 (21.8%) | $58,382 |
| 5-Person Families | 331 (6.4%) | $37,554 |
| 6-Person Families | 95 (1.8%) | $92,232 |
| 7+ Person Families | 26 (0.5%) | $0 |
| Total | 5,139 (100.0%) | $43,927 |
Family Income by Number of Earners in Clay County
The median family income in Clay County is $43,927, with families comprising 3+ earners (134) having the highest median family income of $122,596, while families with no earners (1,596) have the lowest median family income of $24,074, accounting for 2.6% and 31.1% of families, respectively.
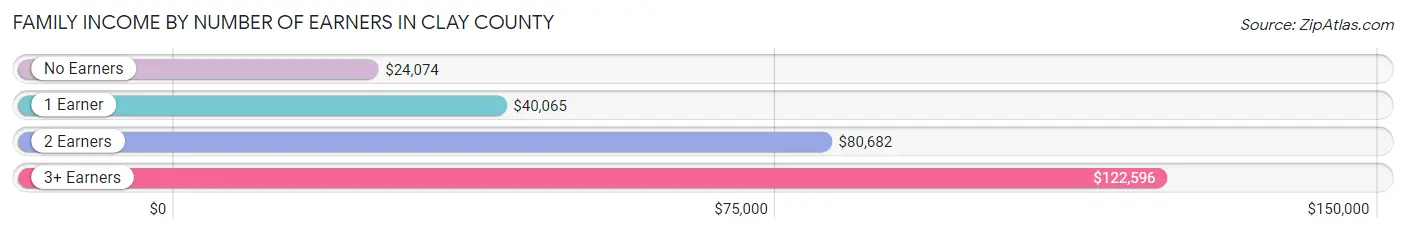
| Number of Earners | # Families | Median Income |
| No Earners | 1,596 (31.1%) | $24,074 |
| 1 Earner | 2,043 (39.8%) | $40,065 |
| 2 Earners | 1,366 (26.6%) | $80,682 |
| 3+ Earners | 134 (2.6%) | $122,596 |
| Total | 5,139 (100.0%) | $43,927 |
Household Income in Clay County
Household Income Brackets in Clay County
With 1,010 households falling in the category, the $50,000 to $74,999 income range is the most frequent in Clay County, accounting for 14.2% of all households. In contrast, only 78 households (1.1%) fall into the $200,000+ income bracket, making it the least populous group.
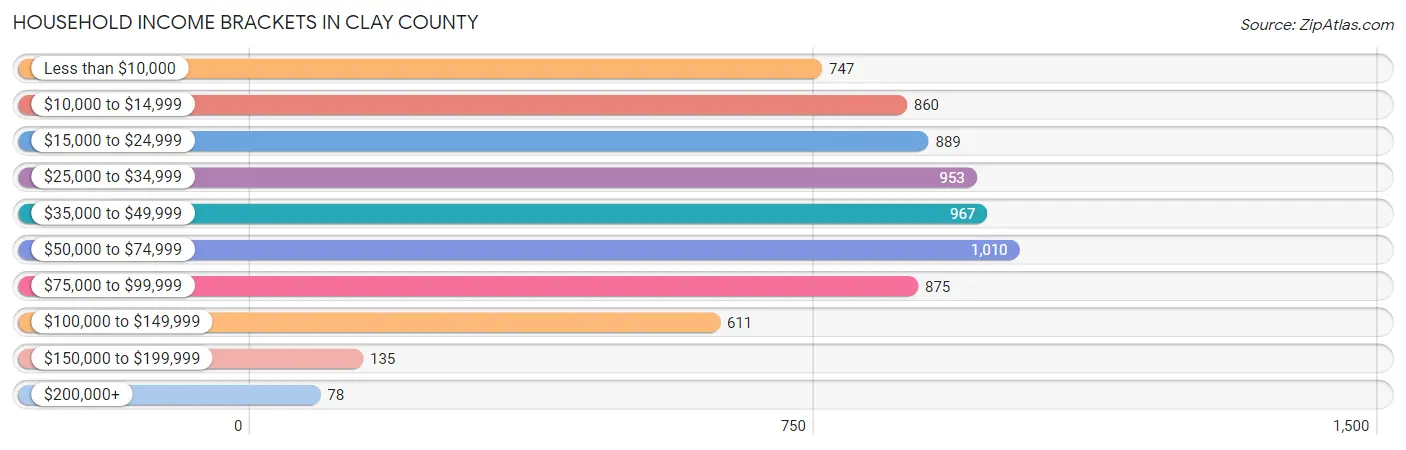
| Income Bracket | # Households | % Households |
| Less than $10,000 | 747 | 10.5% |
| $10,000 to $14,999 | 860 | 12.1% |
| $15,000 to $24,999 | 889 | 12.5% |
| $25,000 to $34,999 | 953 | 13.4% |
| $35,000 to $49,999 | 967 | 13.6% |
| $50,000 to $74,999 | 1,010 | 14.2% |
| $75,000 to $99,999 | 875 | 12.3% |
| $100,000 to $149,999 | 611 | 8.6% |
| $150,000 to $199,999 | 135 | 1.9% |
| $200,000+ | 78 | 1.1% |
Household Income by Householder Age in Clay County
The median household income in Clay County is $37,888, with the highest median household income of $44,235 found in the 45 to 64 years age bracket for the primary householder. A total of 2,948 households (41.5%) fall into this category. Meanwhile, the 65+ years age bracket for the primary householder has the lowest median household income of $31,852, with 1,972 households (27.7%) in this group.
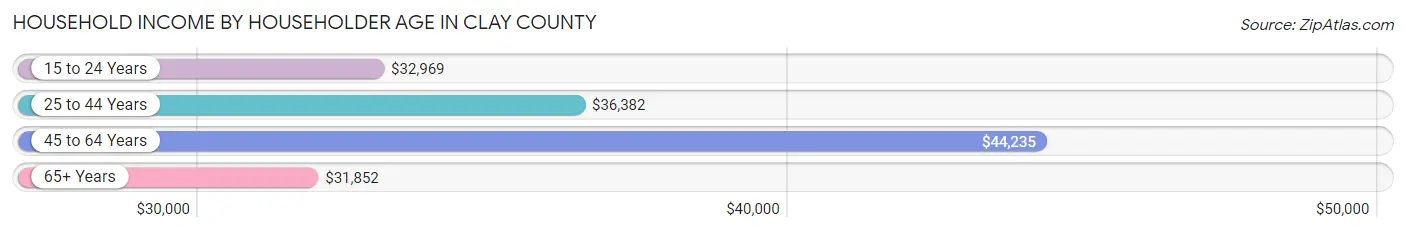
| Income Bracket | # Households | Median Income |
| 15 to 24 Years | 136 (1.9%) | $32,969 |
| 25 to 44 Years | 2,054 (28.9%) | $36,382 |
| 45 to 64 Years | 2,948 (41.5%) | $44,235 |
| 65+ Years | 1,972 (27.7%) | $31,852 |
| Total | 7,110 (100.0%) | $37,888 |
Poverty in Clay County
Income Below Poverty by Sex and Age in Clay County
With 27.9% poverty level for males and 34.5% for females among the residents of Clay County, 15 year old males and 6 to 11 year old females are the most vulnerable to poverty, with 98 males (66.2%) and 340 females (62.0%) in their respective age groups living below the poverty level.
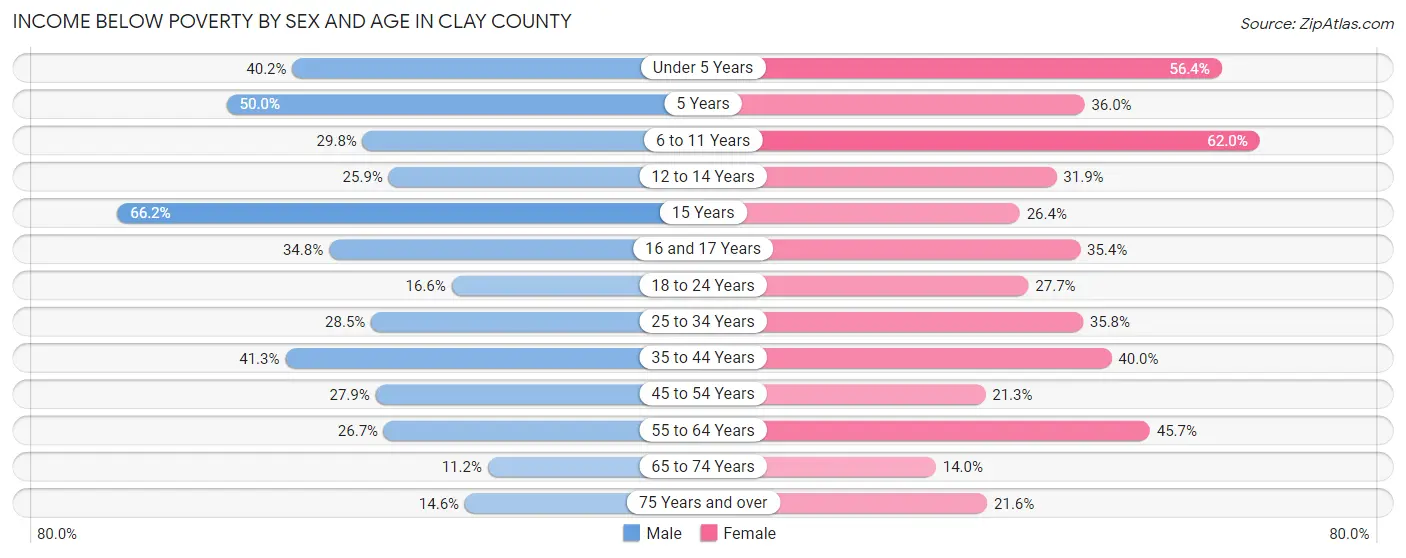
| Age Bracket | Male | Female |
| Under 5 Years | 235 (40.2%) | 362 (56.4%) |
| 5 Years | 22 (50.0%) | 49 (36.0%) |
| 6 to 11 Years | 183 (29.8%) | 340 (62.0%) |
| 12 to 14 Years | 131 (25.9%) | 116 (31.9%) |
| 15 Years | 98 (66.2%) | 28 (26.4%) |
| 16 and 17 Years | 71 (34.8%) | 75 (35.4%) |
| 18 to 24 Years | 110 (16.6%) | 171 (27.7%) |
| 25 to 34 Years | 403 (28.5%) | 475 (35.8%) |
| 35 to 44 Years | 462 (41.3%) | 476 (40.0%) |
| 45 to 54 Years | 384 (27.9%) | 270 (21.3%) |
| 55 to 64 Years | 355 (26.7%) | 617 (45.7%) |
| 65 to 74 Years | 109 (11.2%) | 152 (14.0%) |
| 75 Years and over | 63 (14.6%) | 134 (21.6%) |
| Total | 2,626 (27.9%) | 3,265 (34.5%) |
Income Above Poverty by Sex and Age in Clay County
According to the poverty statistics in Clay County, males aged 65 to 74 years and females aged 65 to 74 years are the age groups that are most secure financially, with 88.8% of males and 86.0% of females in these age groups living above the poverty line.
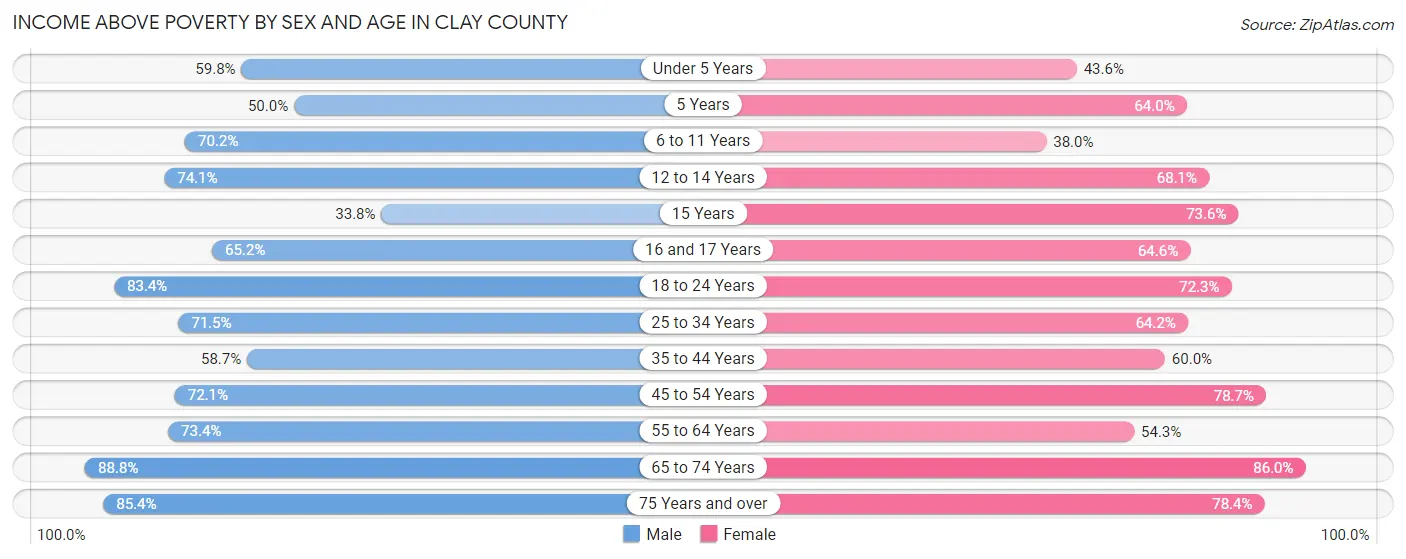
| Age Bracket | Male | Female |
| Under 5 Years | 349 (59.8%) | 280 (43.6%) |
| 5 Years | 22 (50.0%) | 87 (64.0%) |
| 6 to 11 Years | 431 (70.2%) | 208 (38.0%) |
| 12 to 14 Years | 374 (74.1%) | 248 (68.1%) |
| 15 Years | 50 (33.8%) | 78 (73.6%) |
| 16 and 17 Years | 133 (65.2%) | 137 (64.6%) |
| 18 to 24 Years | 553 (83.4%) | 446 (72.3%) |
| 25 to 34 Years | 1,009 (71.5%) | 852 (64.2%) |
| 35 to 44 Years | 657 (58.7%) | 713 (60.0%) |
| 45 to 54 Years | 993 (72.1%) | 997 (78.7%) |
| 55 to 64 Years | 977 (73.4%) | 732 (54.3%) |
| 65 to 74 Years | 862 (88.8%) | 937 (86.0%) |
| 75 Years and over | 368 (85.4%) | 487 (78.4%) |
| Total | 6,778 (72.1%) | 6,202 (65.5%) |
Income Below Poverty Among Married-Couple Families in Clay County
The poverty statistics for married-couple families in Clay County show that 19.4% or 648 of the total 3,349 families live below the poverty line. Families with 3 or 4 children have the highest poverty rate of 63.9%, comprising of 101 families. On the other hand, families with no children have the lowest poverty rate of 11.3%, which includes 201 families.
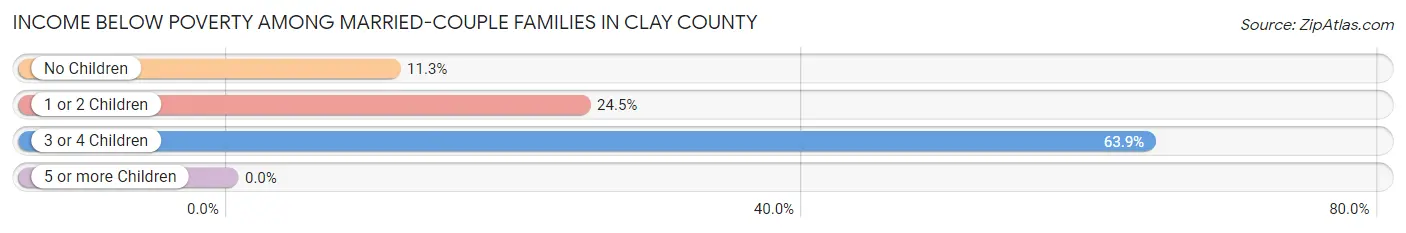
| Children | Above Poverty | Below Poverty |
| No Children | 1,579 (88.7%) | 201 (11.3%) |
| 1 or 2 Children | 1,065 (75.5%) | 346 (24.5%) |
| 3 or 4 Children | 57 (36.1%) | 101 (63.9%) |
| 5 or more Children | 0 (0.0%) | 0 (0.0%) |
| Total | 2,701 (80.6%) | 648 (19.4%) |
Income Below Poverty Among Single-Parent Households in Clay County
According to the poverty data in Clay County, 24.9% or 128 single-father households and 44.3% or 566 single-mother households are living below the poverty line. Among single-father households, those with no children have the highest poverty rate, with 80 households (41.0%) experiencing poverty. Likewise, among single-mother households, those with 3 or 4 children have the highest poverty rate, with 145 households (100.0%) falling below the poverty line.
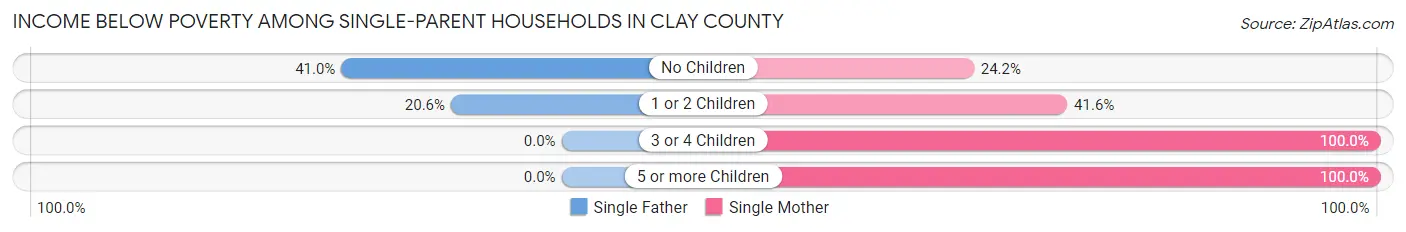
| Children | Single Father | Single Mother |
| No Children | 80 (41.0%) | 88 (24.2%) |
| 1 or 2 Children | 48 (20.6%) | 311 (41.6%) |
| 3 or 4 Children | 0 (0.0%) | 145 (100.0%) |
| 5 or more Children | 0 (0.0%) | 22 (100.0%) |
| Total | 128 (24.9%) | 566 (44.3%) |
Income Below Poverty Among Married-Couple vs Single-Parent Households in Clay County
The poverty data for Clay County shows that 648 of the married-couple family households (19.4%) and 694 of the single-parent households (38.8%) are living below the poverty level. Within the married-couple family households, those with 3 or 4 children have the highest poverty rate, with 101 households (63.9%) falling below the poverty line. Among the single-parent households, those with 5 or more children have the highest poverty rate, with 22 household (100.0%) living below poverty.
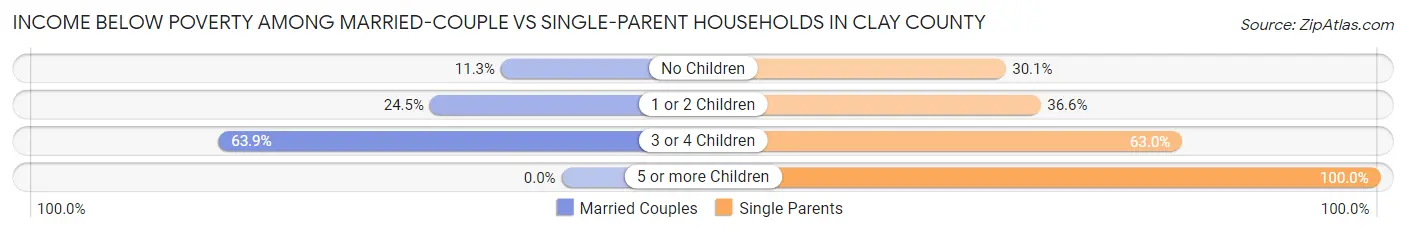
| Children | Married-Couple Families | Single-Parent Households |
| No Children | 201 (11.3%) | 168 (30.1%) |
| 1 or 2 Children | 346 (24.5%) | 359 (36.6%) |
| 3 or 4 Children | 101 (63.9%) | 145 (63.0%) |
| 5 or more Children | 0 (0.0%) | 22 (100.0%) |
| Total | 648 (19.4%) | 694 (38.8%) |
Race in Clay County
The most populous races in Clay County are White / Caucasian (18,736 | 92.2%), Black / African American (852 | 4.2%), and Two or more Races (683 | 3.4%).
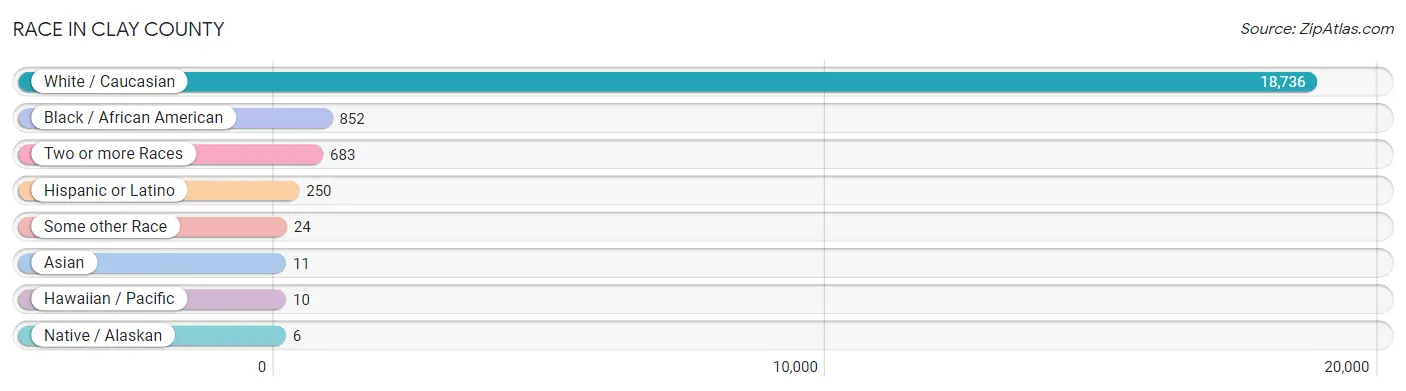
| Race | # Population | % Population |
| Asian | 11 | 0.1% |
| Black / African American | 852 | 4.2% |
| Hawaiian / Pacific | 10 | 0.1% |
| Hispanic or Latino | 250 | 1.2% |
| Native / Alaskan | 6 | 0.0% |
| White / Caucasian | 18,736 | 92.2% |
| Two or more Races | 683 | 3.4% |
| Some other Race | 24 | 0.1% |
| Total | 20,322 | 100.0% |
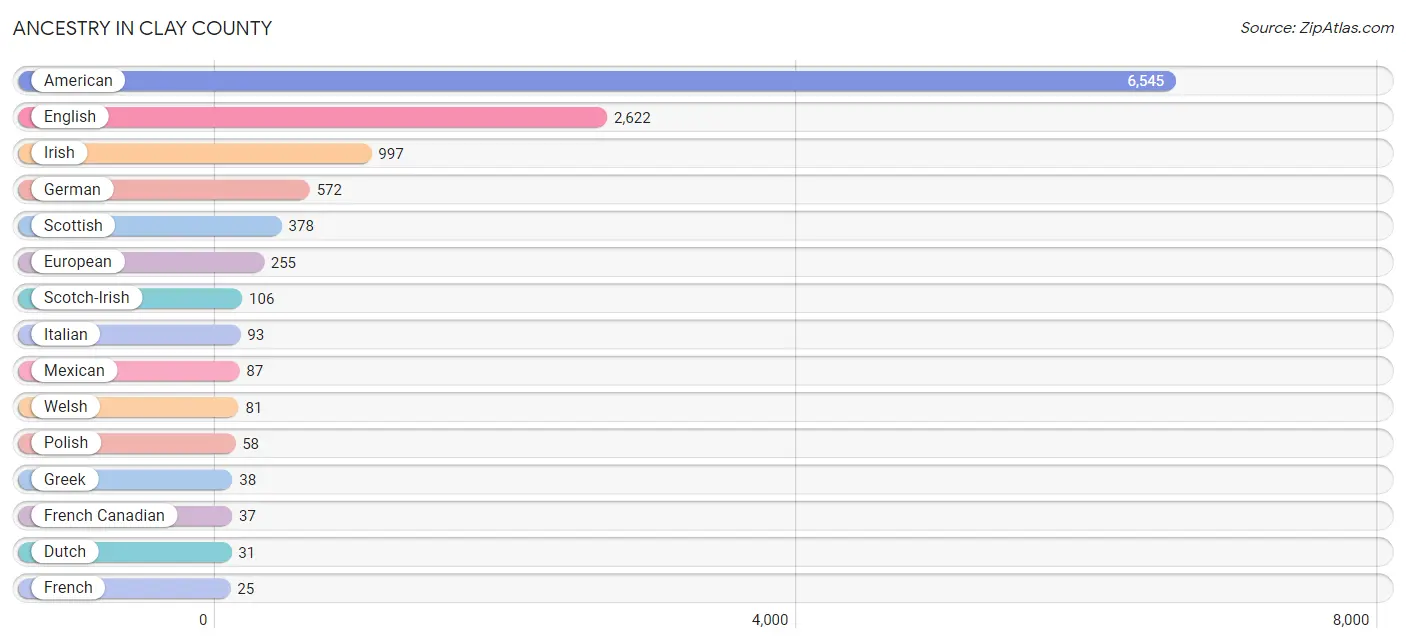
Ancestry in Clay County
The most populous ancestries reported in Clay County are American (6,545 | 32.2%), English (2,622 | 12.9%), Irish (997 | 4.9%), German (572 | 2.8%), and Scottish (378 | 1.9%), together accounting for 54.7% of all Clay County residents.
| Ancestry | # Population | % Population |
| African | 9 | 0.0% |
| American | 6,545 | 32.2% |
| Arab | 9 | 0.0% |
| Armenian | 5 | 0.0% |
| Bhutanese | 5 | 0.0% |
| British | 12 | 0.1% |
| Cherokee | 19 | 0.1% |
| Dutch | 31 | 0.2% |
| Eastern European | 3 | 0.0% |
| English | 2,622 | 12.9% |
| European | 255 | 1.3% |
| French | 25 | 0.1% |
| French Canadian | 37 | 0.2% |
| German | 572 | 2.8% |
| Greek | 38 | 0.2% |
| Indian (Asian) | 24 | 0.1% |
| Irish | 997 | 4.9% |
| Italian | 93 | 0.5% |
| Mexican | 87 | 0.4% |
| Moroccan | 9 | 0.0% |
| Native Hawaiian | 10 | 0.1% |
| Northern European | 13 | 0.1% |
| Norwegian | 9 | 0.0% |
| Polish | 58 | 0.3% |
| Puerto Rican | 22 | 0.1% |
| Russian | 6 | 0.0% |
| Scandinavian | 6 | 0.0% |
| Scotch-Irish | 106 | 0.5% |
| Scottish | 378 | 1.9% |
| Spanish | 8 | 0.0% |
| Subsaharan African | 9 | 0.0% |
| Swiss | 5 | 0.0% |
| Welsh | 81 | 0.4% | View All 33 Rows |
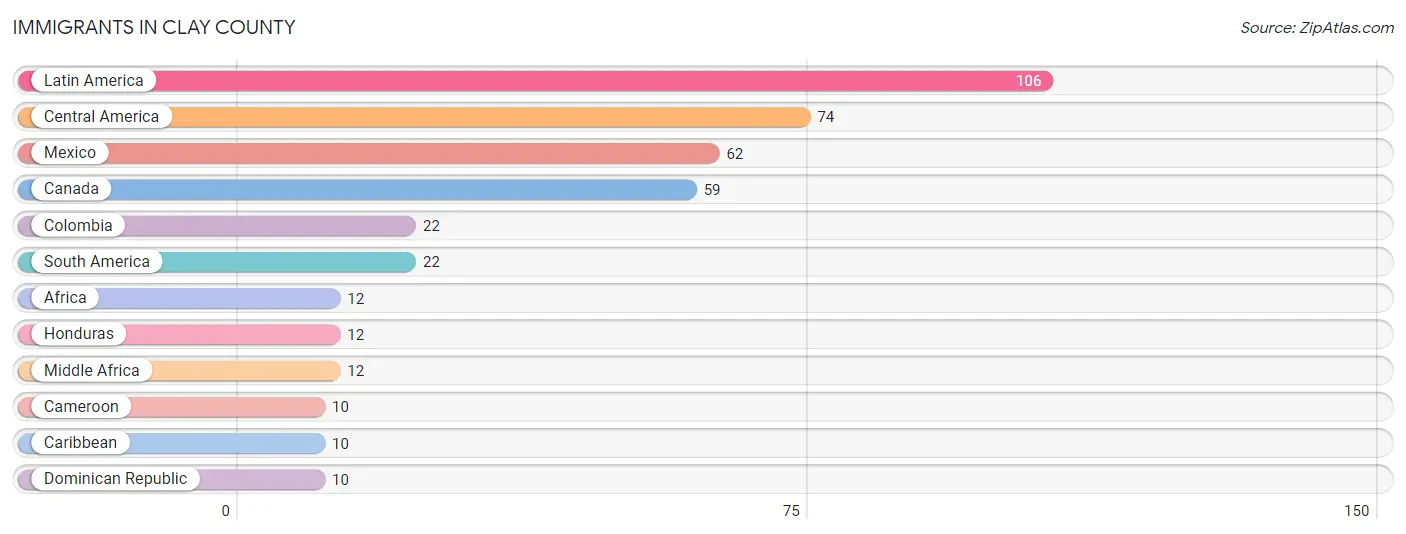
Immigrants in Clay County
The most numerous immigrant groups reported in Clay County came from Latin America (106 | 0.5%), Central America (74 | 0.4%), Mexico (62 | 0.3%), Canada (59 | 0.3%), and Colombia (22 | 0.1%), together accounting for 1.6% of all Clay County residents.
| Immigration Origin | # Population | % Population |
| Africa | 12 | 0.1% |
| Cameroon | 10 | 0.1% |
| Canada | 59 | 0.3% |
| Caribbean | 10 | 0.1% |
| Central America | 74 | 0.4% |
| Colombia | 22 | 0.1% |
| Dominican Republic | 10 | 0.1% |
| Honduras | 12 | 0.1% |
| Latin America | 106 | 0.5% |
| Mexico | 62 | 0.3% |
| Middle Africa | 12 | 0.1% |
| South America | 22 | 0.1% | View All 12 Rows |
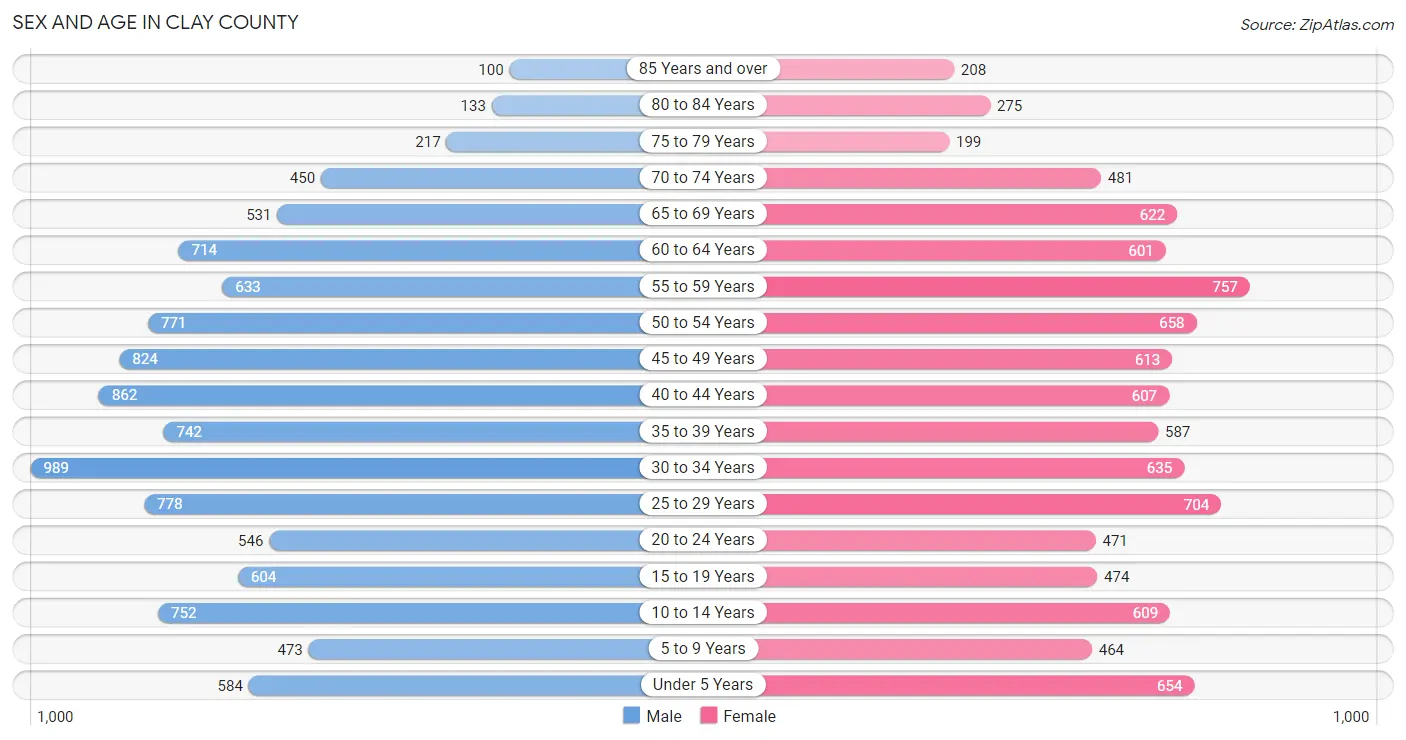
Sex and Age in Clay County
Sex and Age in Clay County
The most populous age groups in Clay County are 30 to 34 Years (989 | 9.2%) for men and 55 to 59 Years (757 | 7.9%) for women.
| Age Bracket | Male | Female |
| Under 5 Years | 584 (5.5%) | 654 (6.8%) |
| 5 to 9 Years | 473 (4.4%) | 464 (4.8%) |
| 10 to 14 Years | 752 (7.0%) | 609 (6.3%) |
| 15 to 19 Years | 604 (5.6%) | 474 (4.9%) |
| 20 to 24 Years | 546 (5.1%) | 471 (4.9%) |
| 25 to 29 Years | 778 (7.3%) | 704 (7.3%) |
| 30 to 34 Years | 989 (9.2%) | 635 (6.6%) |
| 35 to 39 Years | 742 (6.9%) | 587 (6.1%) |
| 40 to 44 Years | 862 (8.1%) | 607 (6.3%) |
| 45 to 49 Years | 824 (7.7%) | 613 (6.4%) |
| 50 to 54 Years | 771 (7.2%) | 658 (6.8%) |
| 55 to 59 Years | 633 (5.9%) | 757 (7.9%) |
| 60 to 64 Years | 714 (6.7%) | 601 (6.2%) |
| 65 to 69 Years | 531 (5.0%) | 622 (6.5%) |
| 70 to 74 Years | 450 (4.2%) | 481 (5.0%) |
| 75 to 79 Years | 217 (2.0%) | 199 (2.1%) |
| 80 to 84 Years | 133 (1.2%) | 275 (2.9%) |
| 85 Years and over | 100 (0.9%) | 208 (2.2%) |
| Total | 10,703 (100.0%) | 9,619 (100.0%) |
Families and Households in Clay County
Median Family Size in Clay County
The median family size in Clay County is 3.08 persons per family, with married-couple families (3,349 | 65.2%) accounting for the largest median family size of 3.13 persons per family. On the other hand, single male/father families (513 | 10.0%) represent the smallest median family size with 2.80 persons per family.
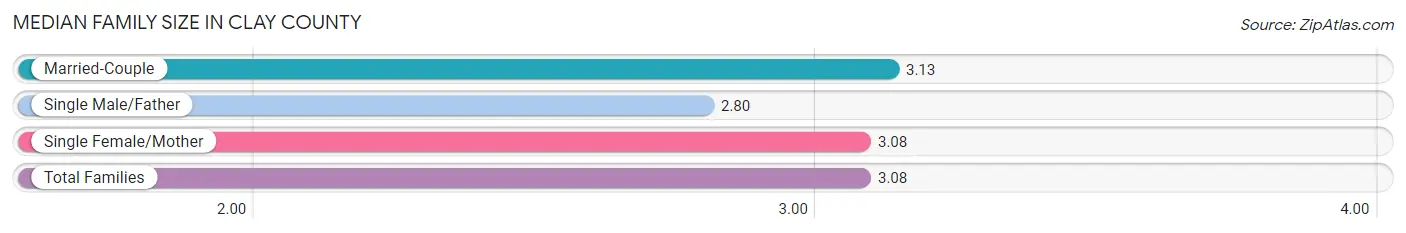
| Family Type | # Families | Family Size |
| Married-Couple | 3,349 (65.2%) | 3.13 |
| Single Male/Father | 513 (10.0%) | 2.80 |
| Single Female/Mother | 1,277 (24.8%) | 3.08 |
| Total Families | 5,139 (100.0%) | 3.08 |
Median Household Size in Clay County
The median household size in Clay County is 2.66 persons per household, with single female/mother households (1,277 | 18.0%) accounting for the largest median household size of 3.6 persons per household. non-family households (1,971 | 27.7%) represent the smallest median household size with 1.10 persons per household.
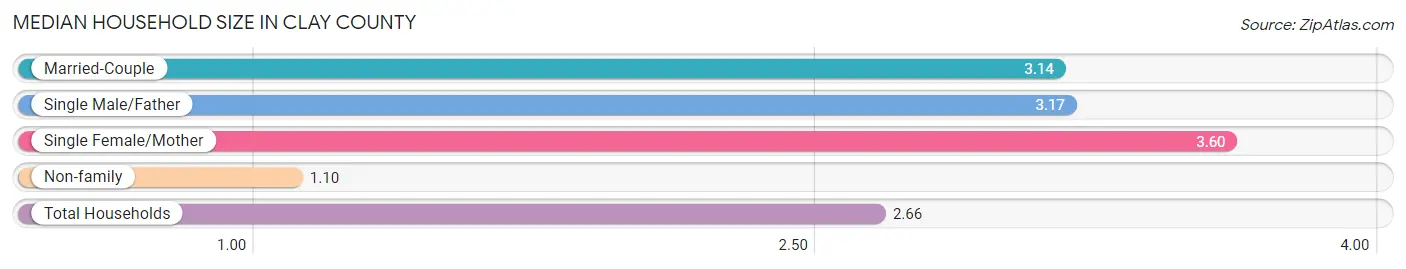
| Household Type | # Households | Household Size |
| Married-Couple | 3,349 (47.1%) | 3.14 |
| Single Male/Father | 513 (7.2%) | 3.17 |
| Single Female/Mother | 1,277 (18.0%) | 3.60 |
| Non-family | 1,971 (27.7%) | 1.10 |
| Total Households | 7,110 (100.0%) | 2.66 |
Household Size by Marriage Status in Clay County
Out of a total of 7,110 households in Clay County, 5,139 (72.3%) are family households, while 1,971 (27.7%) are nonfamily households. The most numerous type of family households are 2-person households, comprising 1,852, and the most common type of nonfamily households are 1-person households, comprising 1,797.
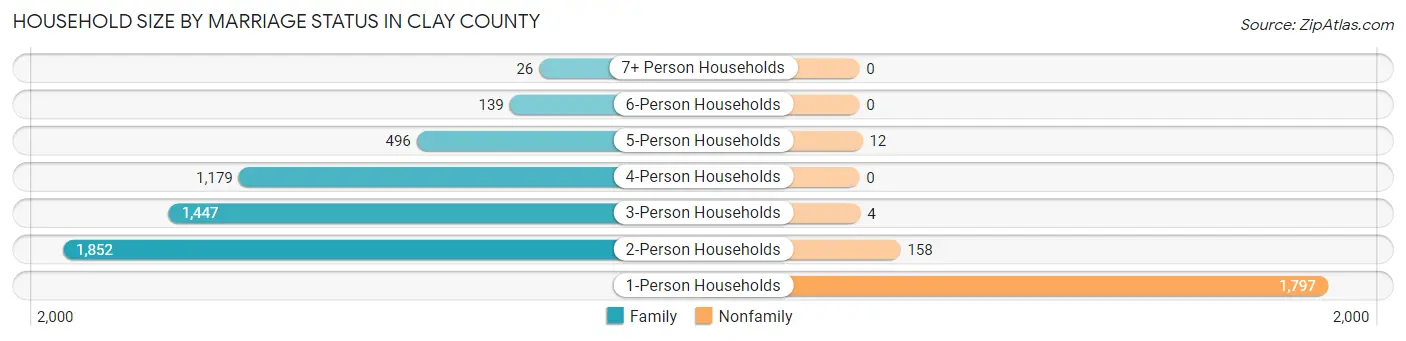
| Household Size | Family Households | Nonfamily Households |
| 1-Person Households | - | 1,797 (25.3%) |
| 2-Person Households | 1,852 (26.1%) | 158 (2.2%) |
| 3-Person Households | 1,447 (20.3%) | 4 (0.1%) |
| 4-Person Households | 1,179 (16.6%) | 0 (0.0%) |
| 5-Person Households | 496 (7.0%) | 12 (0.2%) |
| 6-Person Households | 139 (1.9%) | 0 (0.0%) |
| 7+ Person Households | 26 (0.4%) | 0 (0.0%) |
| Total | 5,139 (72.3%) | 1,971 (27.7%) |
Female Fertility in Clay County
Fertility by Age in Clay County
Average fertility rate in Clay County is 39.0 births per 1,000 women. Women in the age bracket of 20 to 34 years have the highest fertility rate with 79.0 births per 1,000 women. Women in the age bracket of 20 to 34 years acount for 88.3% of all women with births.
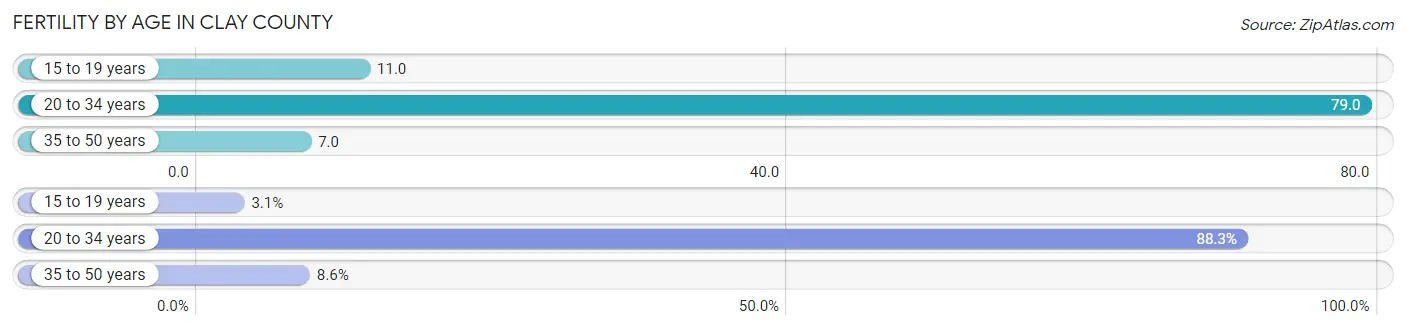
| Age Bracket | Women with Births | Births / 1,000 Women |
| 15 to 19 years | 5 (3.1%) | 11.0 |
| 20 to 34 years | 143 (88.3%) | 79.0 |
| 35 to 50 years | 14 (8.6%) | 7.0 |
| Total | 162 (100.0%) | 39.0 |
Fertility by Age by Marriage Status in Clay County
51.2% of women with births (162) in Clay County are married. The highest percentage of unmarried women with births falls into 15 to 19 years age bracket with 100.0% of them unmarried at the time of birth, while the lowest percentage of unmarried women with births belong to 20 to 34 years age bracket with 42.0% of them unmarried.
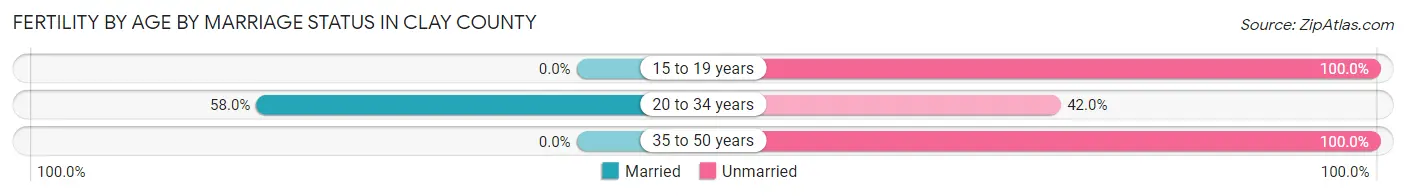
| Age Bracket | Married | Unmarried |
| 15 to 19 years | 0 (0.0%) | 5 (100.0%) |
| 20 to 34 years | 83 (58.0%) | 60 (42.0%) |
| 35 to 50 years | 0 (0.0%) | 14 (100.0%) |
| Total | 83 (51.2%) | 79 (48.8%) |
Fertility by Education in Clay County
Average fertility rate in Clay County is 39.0 births per 1,000 women. Women with the education attainment of graduate degree have the highest fertility rate of 126.0 births per 1,000 women, while women with the education attainment of less than high school have the lowest fertility at 6.0 births per 1,000 women. Women with the education attainment of high school diploma represent 48.1% of all women with births.
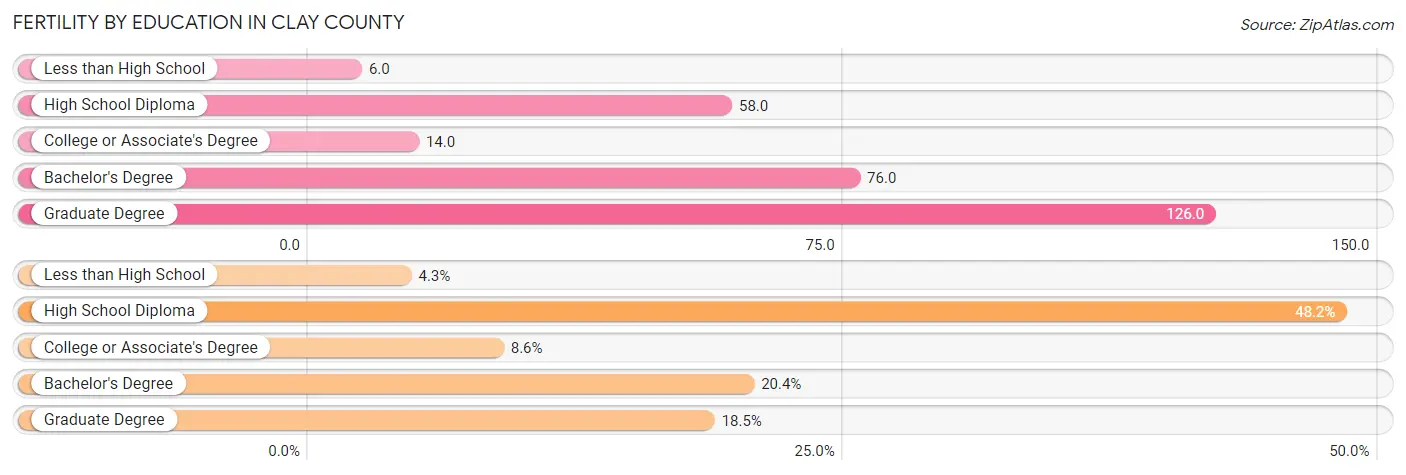
| Educational Attainment | Women with Births | Births / 1,000 Women |
| Less than High School | 7 (4.3%) | 6.0 |
| High School Diploma | 78 (48.1%) | 58.0 |
| College or Associate's Degree | 14 (8.6%) | 14.0 |
| Bachelor's Degree | 33 (20.4%) | 76.0 |
| Graduate Degree | 30 (18.5%) | 126.0 |
| Total | 162 (100.0%) | 39.0 |
Fertility by Education by Marriage Status in Clay County
48.8% of women with births in Clay County are unmarried. Women with the educational attainment of graduate degree are most likely to be married with 100.0% of them married at childbirth, while women with the educational attainment of less than high school are least likely to be married with 100.0% of them unmarried at childbirth.
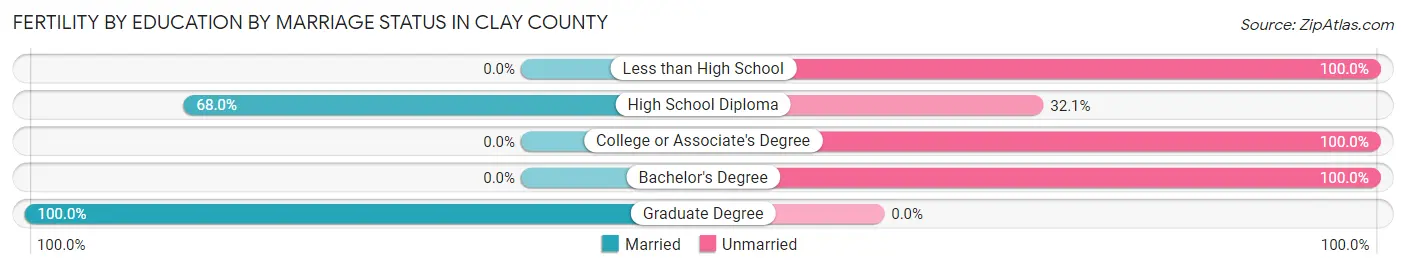
| Educational Attainment | Married | Unmarried |
| Less than High School | 0 (0.0%) | 7 (100.0%) |
| High School Diploma | 53 (67.9%) | 25 (32.1%) |
| College or Associate's Degree | 0 (0.0%) | 14 (100.0%) |
| Bachelor's Degree | 0 (0.0%) | 33 (100.0%) |
| Graduate Degree | 30 (100.0%) | 0 (0.0%) |
| Total | 83 (51.2%) | 79 (48.8%) |
Employment Characteristics in Clay County
Employment by Class of Employer in Clay County
Among the 6,120 employed individuals in Clay County, private company employees (4,014 | 65.6%), state government employees (583 | 9.5%), and not-for-profit organizations (489 | 8.0%) make up the most common classes of employment.
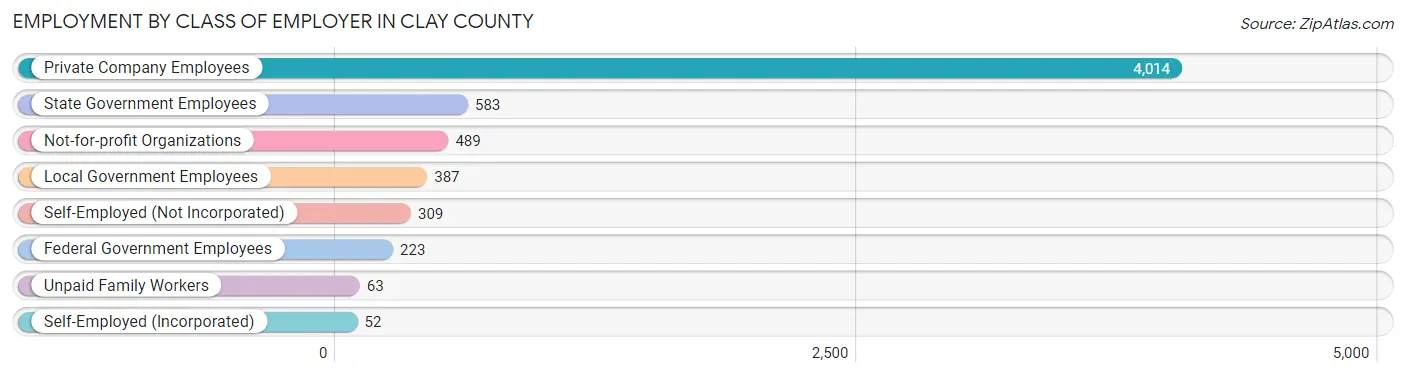
| Employer Class | # Employees | % Employees |
| Private Company Employees | 4,014 | 65.6% |
| Self-Employed (Incorporated) | 52 | 0.9% |
| Self-Employed (Not Incorporated) | 309 | 5.1% |
| Not-for-profit Organizations | 489 | 8.0% |
| Local Government Employees | 387 | 6.3% |
| State Government Employees | 583 | 9.5% |
| Federal Government Employees | 223 | 3.6% |
| Unpaid Family Workers | 63 | 1.0% |
| Total | 6,120 | 100.0% |
Employment Status by Age in Clay County
According to the labor force statistics for Clay County, out of the total population over 16 years of age (16,532), 41.7% or 6,894 individuals are in the labor force, with 10.0% or 689 of them unemployed. The age group with the highest labor force participation rate is 25 to 29 years, with 76.0% or 1,126 individuals in the labor force. Within the labor force, the 75 years and over age range has the highest percentage of unemployed individuals, with 38.5% or 25 of them being unemployed.
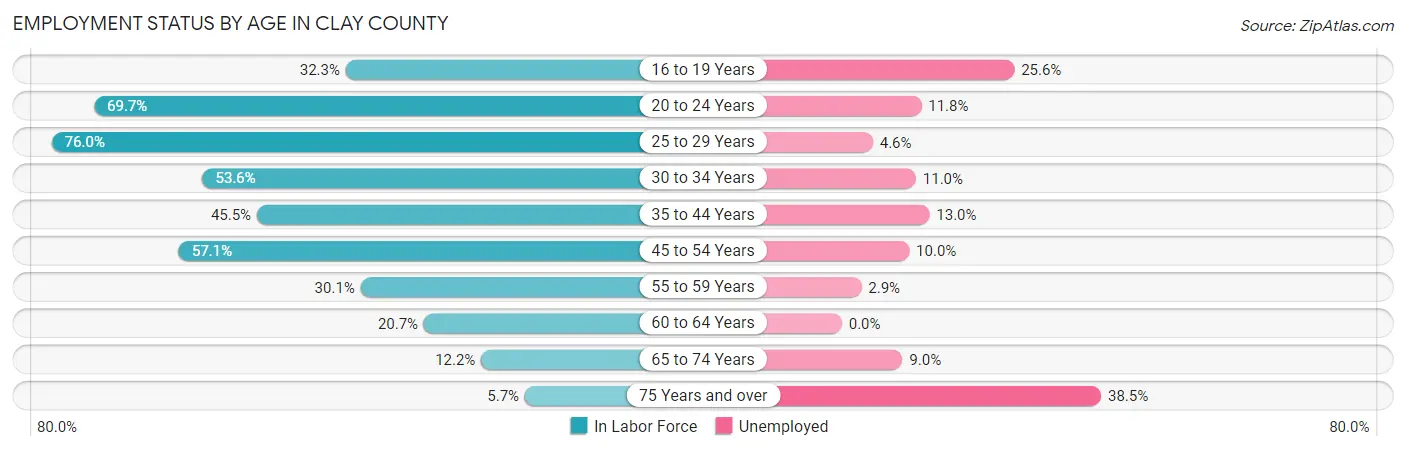
| Age Bracket | In Labor Force | Unemployed |
| 16 to 19 Years | 266 (32.3%) | 68 (25.6%) |
| 20 to 24 Years | 709 (69.7%) | 84 (11.8%) |
| 25 to 29 Years | 1,126 (76.0%) | 52 (4.6%) |
| 30 to 34 Years | 870 (53.6%) | 96 (11.0%) |
| 35 to 44 Years | 1,273 (45.5%) | 165 (13.0%) |
| 45 to 54 Years | 1,636 (57.1%) | 164 (10.0%) |
| 55 to 59 Years | 418 (30.1%) | 12 (2.9%) |
| 60 to 64 Years | 272 (20.7%) | 0 (0.0%) |
| 65 to 74 Years | 254 (12.2%) | 23 (9.0%) |
| 75 Years and over | 65 (5.7%) | 25 (38.5%) |
| Total | 6,894 (41.7%) | 689 (10.0%) |
Employment Status by Educational Attainment in Clay County
According to labor force statistics for Clay County, 48.8% of individuals (5,600) out of the total population between 25 and 64 years of age (11,475) are in the labor force, with 8.7% or 487 of them being unemployed. The group with the highest labor force participation rate are those with the educational attainment of bachelor's degree or higher, with 78.1% or 1,275 individuals in the labor force. Within the labor force, individuals with less than high school education have the highest percentage of unemployment, with 16.4% or 117 of them being unemployed.

| Educational Attainment | In Labor Force | Unemployed |
| Less than High School | 714 (24.5%) | 478 (16.4%) |
| High School Diploma | 2,340 (50.6%) | 615 (13.3%) |
| College / Associate Degree | 1,268 (55.1%) | 67 (2.9%) |
| Bachelor's Degree or higher | 1,275 (78.1%) | 29 (1.8%) |
| Total | 5,600 (48.8%) | 998 (8.7%) |
Employment Occupations by Sex in Clay County
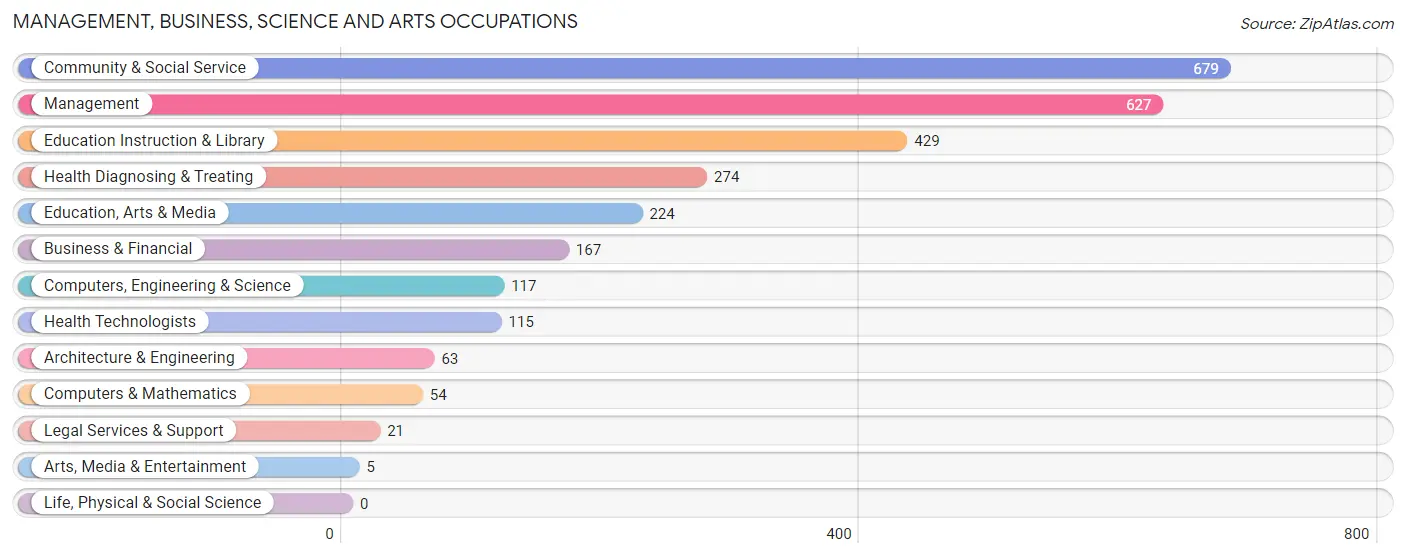
Management, Business, Science and Arts Occupations
The most common Management, Business, Science and Arts occupations in Clay County are Community & Social Service (679 | 11.0%), Management (627 | 10.1%), Education Instruction & Library (429 | 6.9%), Health Diagnosing & Treating (274 | 4.4%), and Education, Arts & Media (224 | 3.6%).
Management, Business, Science and Arts Occupations by Sex
Within the Management, Business, Science and Arts occupations in Clay County, the most male-oriented occupations are Legal Services & Support (100.0%), Architecture & Engineering (68.2%), and Computers, Engineering & Science (61.5%), while the most female-oriented occupations are Arts, Media & Entertainment (100.0%), Health Technologists (100.0%), and Business & Financial (88.6%).
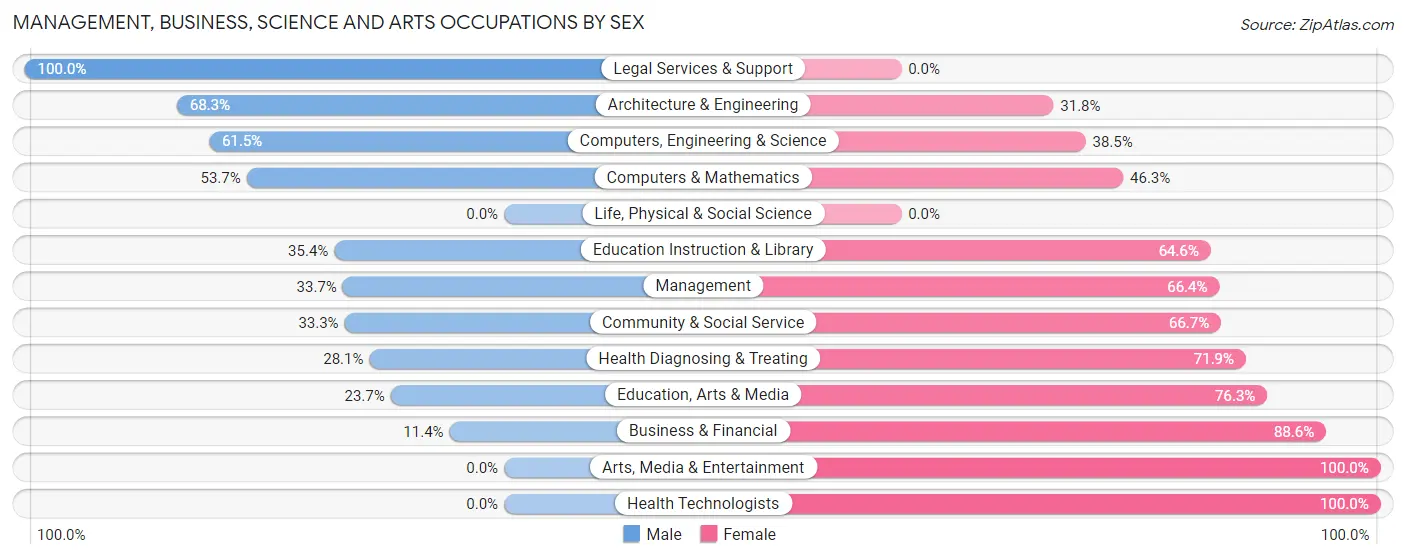
| Occupation | Male | Female |
| Management | 211 (33.7%) | 416 (66.3%) |
| Business & Financial | 19 (11.4%) | 148 (88.6%) |
| Computers, Engineering & Science | 72 (61.5%) | 45 (38.5%) |
| Computers & Mathematics | 29 (53.7%) | 25 (46.3%) |
| Architecture & Engineering | 43 (68.2%) | 20 (31.8%) |
| Life, Physical & Social Science | 0 (0.0%) | 0 (0.0%) |
| Community & Social Service | 226 (33.3%) | 453 (66.7%) |
| Education, Arts & Media | 53 (23.7%) | 171 (76.3%) |
| Legal Services & Support | 21 (100.0%) | 0 (0.0%) |
| Education Instruction & Library | 152 (35.4%) | 277 (64.6%) |
| Arts, Media & Entertainment | 0 (0.0%) | 5 (100.0%) |
| Health Diagnosing & Treating | 77 (28.1%) | 197 (71.9%) |
| Health Technologists | 0 (0.0%) | 115 (100.0%) |
| Total (Category) | 605 (32.5%) | 1,259 (67.5%) |
| Total (Overall) | 3,203 (51.6%) | 2,999 (48.4%) |
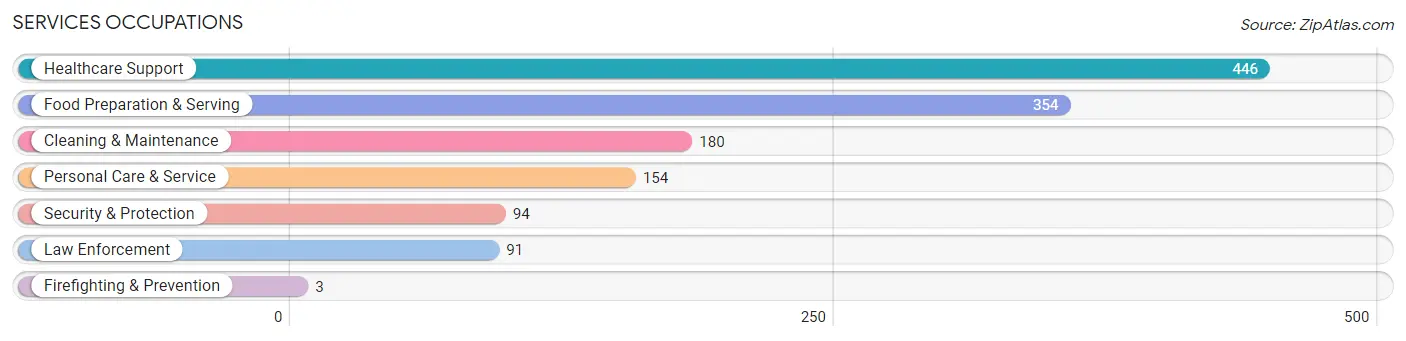
Services Occupations
The most common Services occupations in Clay County are Healthcare Support (446 | 7.2%), Food Preparation & Serving (354 | 5.7%), Cleaning & Maintenance (180 | 2.9%), Personal Care & Service (154 | 2.5%), and Security & Protection (94 | 1.5%).
Services Occupations by Sex
Within the Services occupations in Clay County, the most male-oriented occupations are Security & Protection (100.0%), Firefighting & Prevention (100.0%), and Law Enforcement (100.0%), while the most female-oriented occupations are Healthcare Support (100.0%), Cleaning & Maintenance (77.8%), and Personal Care & Service (42.9%).
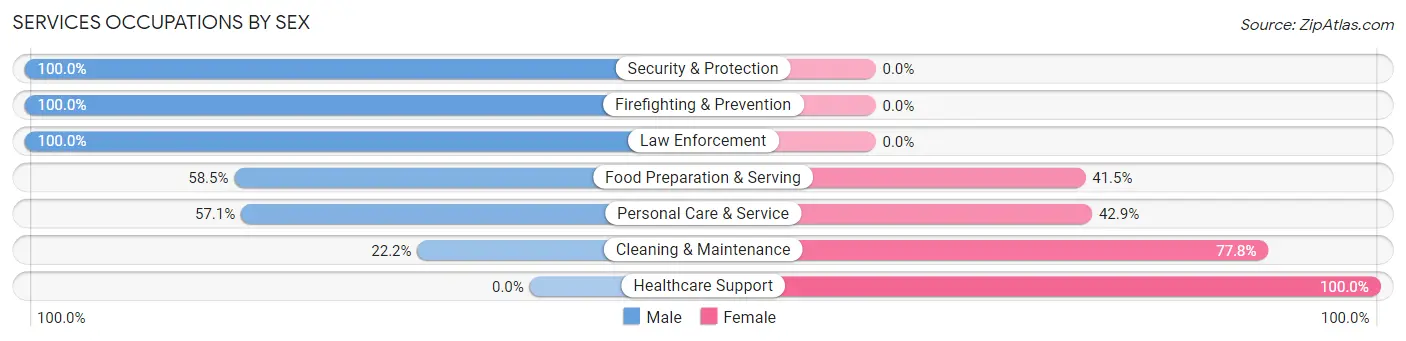
| Occupation | Male | Female |
| Healthcare Support | 0 (0.0%) | 446 (100.0%) |
| Security & Protection | 94 (100.0%) | 0 (0.0%) |
| Firefighting & Prevention | 3 (100.0%) | 0 (0.0%) |
| Law Enforcement | 91 (100.0%) | 0 (0.0%) |
| Food Preparation & Serving | 207 (58.5%) | 147 (41.5%) |
| Cleaning & Maintenance | 40 (22.2%) | 140 (77.8%) |
| Personal Care & Service | 88 (57.1%) | 66 (42.9%) |
| Total (Category) | 429 (34.9%) | 799 (65.1%) |
| Total (Overall) | 3,203 (51.6%) | 2,999 (48.4%) |
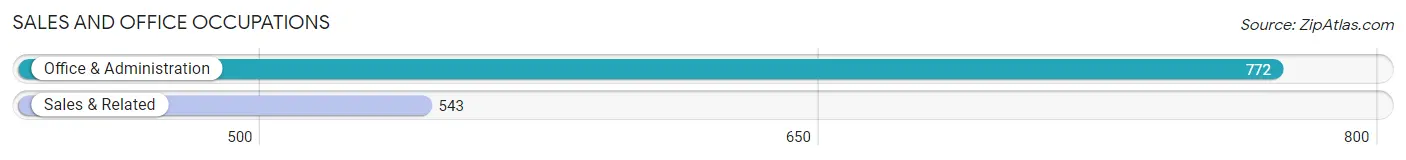
Sales and Office Occupations
The most common Sales and Office occupations in Clay County are Office & Administration (772 | 12.4%), and Sales & Related (543 | 8.8%).
Sales and Office Occupations by Sex
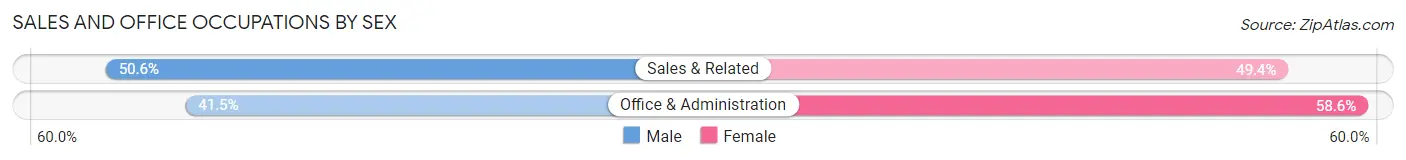
| Occupation | Male | Female |
| Sales & Related | 275 (50.6%) | 268 (49.4%) |
| Office & Administration | 320 (41.4%) | 452 (58.6%) |
| Total (Category) | 595 (45.3%) | 720 (54.7%) |
| Total (Overall) | 3,203 (51.6%) | 2,999 (48.4%) |
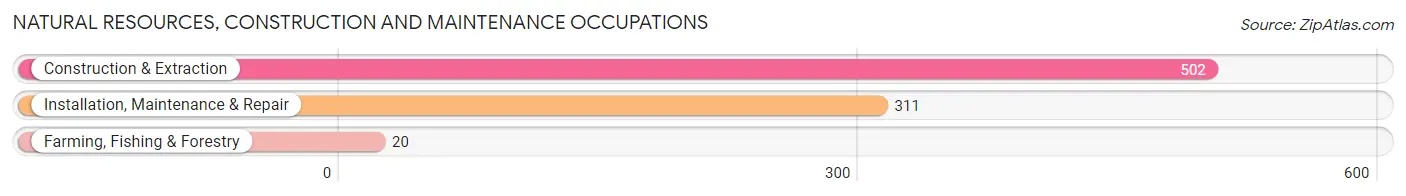
Natural Resources, Construction and Maintenance Occupations
The most common Natural Resources, Construction and Maintenance occupations in Clay County are Construction & Extraction (502 | 8.1%), Installation, Maintenance & Repair (311 | 5.0%), and Farming, Fishing & Forestry (20 | 0.3%).
Natural Resources, Construction and Maintenance Occupations by Sex
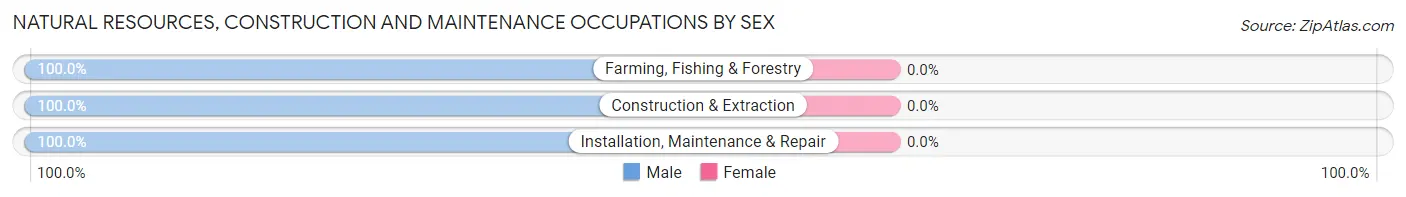
| Occupation | Male | Female |
| Farming, Fishing & Forestry | 20 (100.0%) | 0 (0.0%) |
| Construction & Extraction | 502 (100.0%) | 0 (0.0%) |
| Installation, Maintenance & Repair | 311 (100.0%) | 0 (0.0%) |
| Total (Category) | 833 (100.0%) | 0 (0.0%) |
| Total (Overall) | 3,203 (51.6%) | 2,999 (48.4%) |
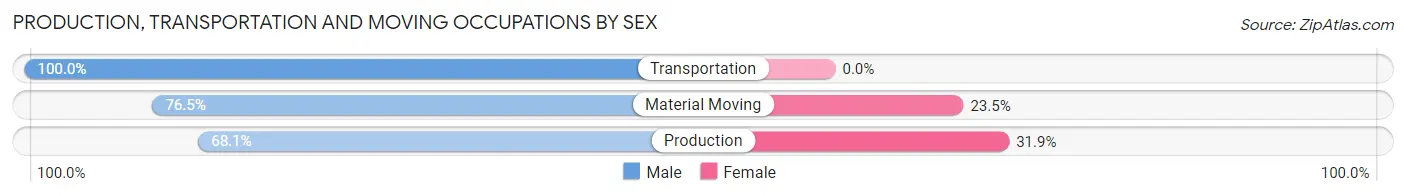
Production, Transportation and Moving Occupations
The most common Production, Transportation and Moving occupations in Clay County are Production (477 | 7.7%), Material Moving (294 | 4.7%), and Transportation (191 | 3.1%).
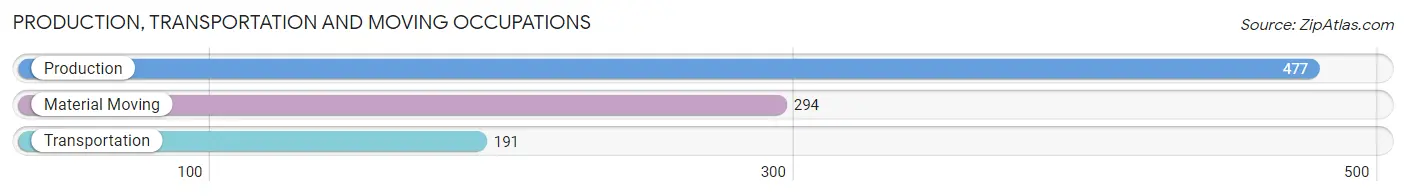
Production, Transportation and Moving Occupations by Sex
| Occupation | Male | Female |
| Production | 325 (68.1%) | 152 (31.9%) |
| Transportation | 191 (100.0%) | 0 (0.0%) |
| Material Moving | 225 (76.5%) | 69 (23.5%) |
| Total (Category) | 741 (77.0%) | 221 (23.0%) |
| Total (Overall) | 3,203 (51.6%) | 2,999 (48.4%) |
Employment Industries by Sex in Clay County
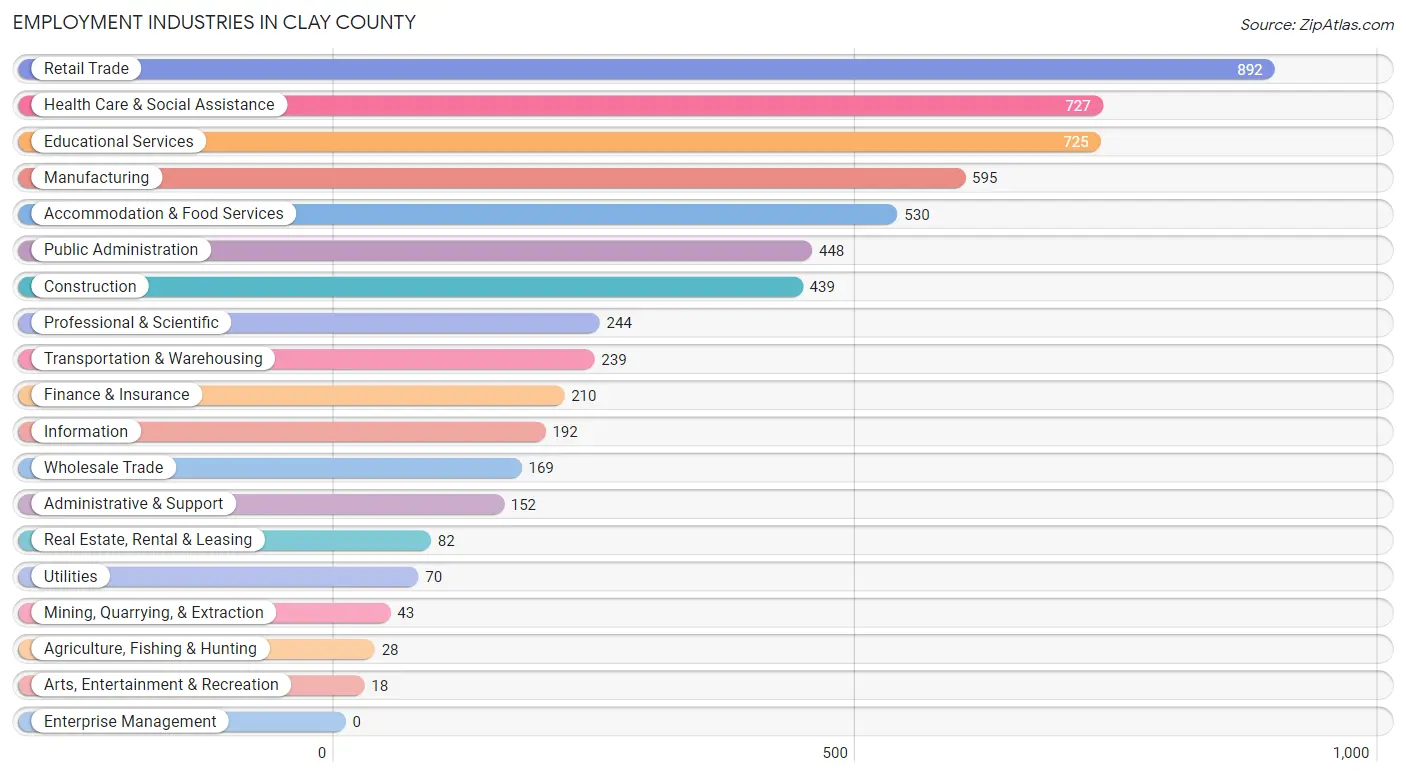
Employment Industries in Clay County
The major employment industries in Clay County include Retail Trade (892 | 14.4%), Health Care & Social Assistance (727 | 11.7%), Educational Services (725 | 11.7%), Manufacturing (595 | 9.6%), and Accommodation & Food Services (530 | 8.6%).
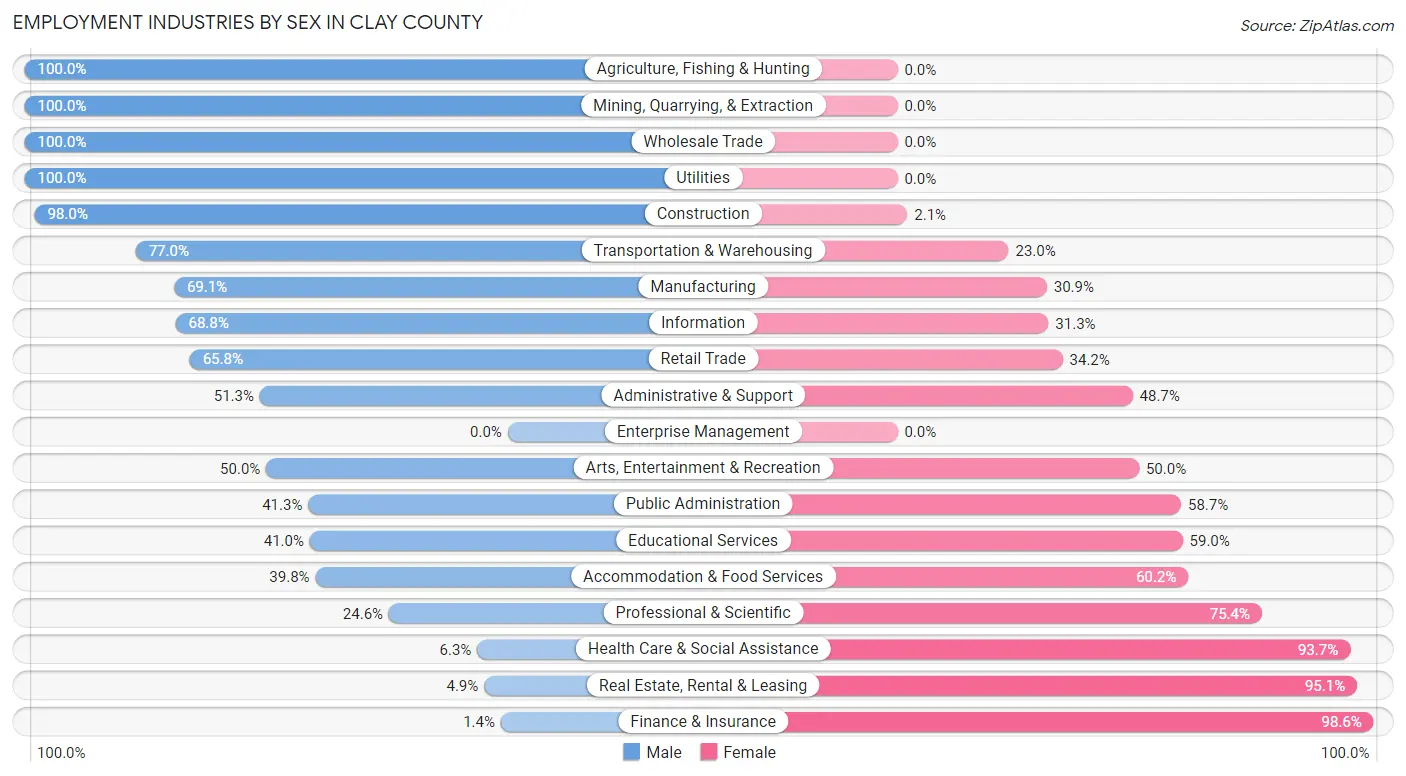
Employment Industries by Sex in Clay County
The Clay County industries that see more men than women are Agriculture, Fishing & Hunting (100.0%), Mining, Quarrying, & Extraction (100.0%), and Wholesale Trade (100.0%), whereas the industries that tend to have a higher number of women are Finance & Insurance (98.6%), Real Estate, Rental & Leasing (95.1%), and Health Care & Social Assistance (93.7%).
| Industry | Male | Female |
| Agriculture, Fishing & Hunting | 28 (100.0%) | 0 (0.0%) |
| Mining, Quarrying, & Extraction | 43 (100.0%) | 0 (0.0%) |
| Construction | 430 (98.0%) | 9 (2.1%) |
| Manufacturing | 411 (69.1%) | 184 (30.9%) |
| Wholesale Trade | 169 (100.0%) | 0 (0.0%) |
| Retail Trade | 587 (65.8%) | 305 (34.2%) |
| Transportation & Warehousing | 184 (77.0%) | 55 (23.0%) |
| Utilities | 70 (100.0%) | 0 (0.0%) |
| Information | 132 (68.8%) | 60 (31.2%) |
| Finance & Insurance | 3 (1.4%) | 207 (98.6%) |
| Real Estate, Rental & Leasing | 4 (4.9%) | 78 (95.1%) |
| Professional & Scientific | 60 (24.6%) | 184 (75.4%) |
| Enterprise Management | 0 (0.0%) | 0 (0.0%) |
| Administrative & Support | 78 (51.3%) | 74 (48.7%) |
| Educational Services | 297 (41.0%) | 428 (59.0%) |
| Health Care & Social Assistance | 46 (6.3%) | 681 (93.7%) |
| Arts, Entertainment & Recreation | 9 (50.0%) | 9 (50.0%) |
| Accommodation & Food Services | 211 (39.8%) | 319 (60.2%) |
| Public Administration | 185 (41.3%) | 263 (58.7%) |
| Total | 3,203 (51.6%) | 2,999 (48.4%) |
Education in Clay County
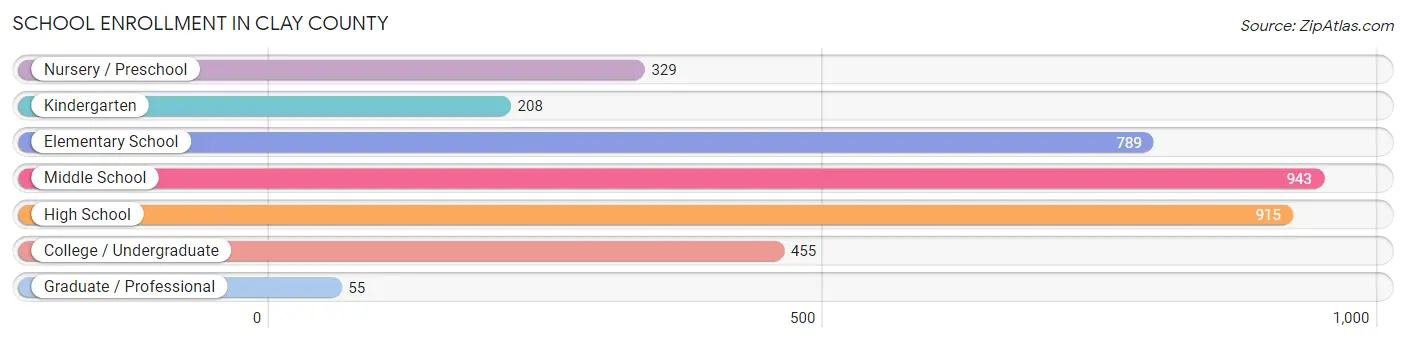
School Enrollment in Clay County
The most common levels of schooling among the 3,694 students in Clay County are middle school (943 | 25.5%), high school (915 | 24.8%), and elementary school (789 | 21.4%).
| School Level | # Students | % Students |
| Nursery / Preschool | 329 | 8.9% |
| Kindergarten | 208 | 5.6% |
| Elementary School | 789 | 21.4% |
| Middle School | 943 | 25.5% |
| High School | 915 | 24.8% |
| College / Undergraduate | 455 | 12.3% |
| Graduate / Professional | 55 | 1.5% |
| Total | 3,694 | 100.0% |
School Enrollment by Age by Funding Source in Clay County
Out of a total of 3,694 students who are enrolled in schools in Clay County, 332 (9.0%) attend a private institution, while the remaining 3,362 (91.0%) are enrolled in public schools. The age group of 25 to 34 year olds has the highest likelihood of being enrolled in private schools, with 64 (70.3% in the age bracket) enrolled. Conversely, the age group of 10 to 14 year olds has the lowest likelihood of being enrolled in a private school, with 1,194 (96.5% in the age bracket) attending a public institution.
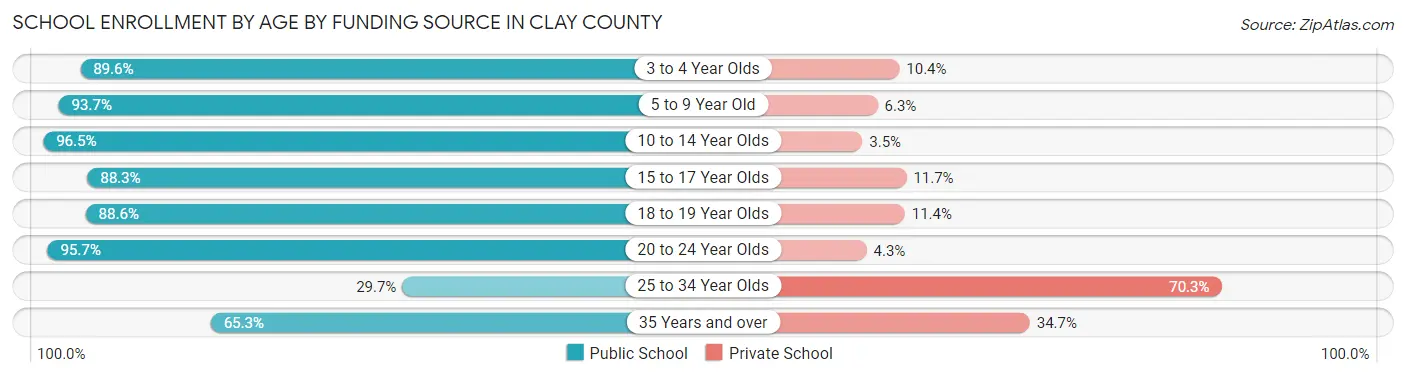
| Age Bracket | Public School | Private School |
| 3 to 4 Year Olds | 242 (89.6%) | 28 (10.4%) |
| 5 to 9 Year Old | 830 (93.7%) | 56 (6.3%) |
| 10 to 14 Year Olds | 1,194 (96.5%) | 43 (3.5%) |
| 15 to 17 Year Olds | 529 (88.3%) | 70 (11.7%) |
| 18 to 19 Year Olds | 288 (88.6%) | 37 (11.4%) |
| 20 to 24 Year Olds | 202 (95.7%) | 9 (4.3%) |
| 25 to 34 Year Olds | 27 (29.7%) | 64 (70.3%) |
| 35 Years and over | 49 (65.3%) | 26 (34.7%) |
| Total | 3,362 (91.0%) | 332 (9.0%) |
Educational Attainment by Field of Study in Clay County
Education (832 | 36.6%), science & technology (304 | 13.4%), arts & humanities (230 | 10.1%), business (192 | 8.5%), and liberal arts & history (170 | 7.5%) are the most common fields of study among 2,270 individuals in Clay County who have obtained a bachelor's degree or higher.
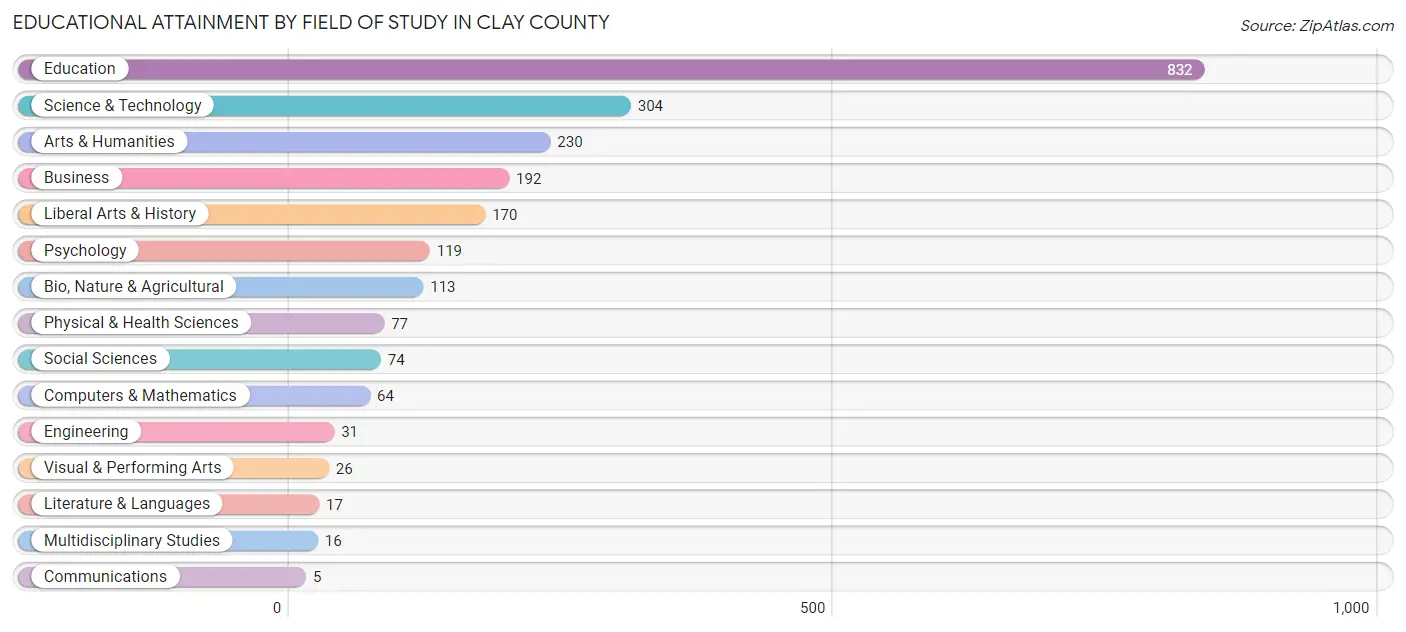
| Field of Study | # Graduates | % Graduates |
| Computers & Mathematics | 64 | 2.8% |
| Bio, Nature & Agricultural | 113 | 5.0% |
| Physical & Health Sciences | 77 | 3.4% |
| Psychology | 119 | 5.2% |
| Social Sciences | 74 | 3.3% |
| Engineering | 31 | 1.4% |
| Multidisciplinary Studies | 16 | 0.7% |
| Science & Technology | 304 | 13.4% |
| Business | 192 | 8.5% |
| Education | 832 | 36.6% |
| Literature & Languages | 17 | 0.7% |
| Liberal Arts & History | 170 | 7.5% |
| Visual & Performing Arts | 26 | 1.1% |
| Communications | 5 | 0.2% |
| Arts & Humanities | 230 | 10.1% |
| Total | 2,270 | 100.0% |
Transportation & Commute in Clay County
Vehicle Availability by Sex in Clay County
The most prevalent vehicle ownership categories in Clay County are males with 2 vehicles (1,146, accounting for 36.5%) and females with 2 vehicles (979, making up 38.8%).
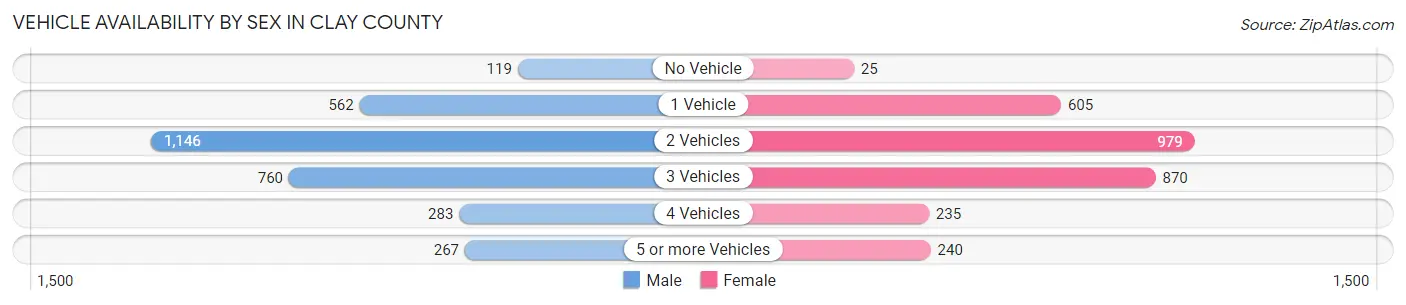
| Vehicles Available | Male | Female |
| No Vehicle | 119 (3.8%) | 25 (0.9%) |
| 1 Vehicle | 562 (17.9%) | 605 (20.5%) |
| 2 Vehicles | 1,146 (36.5%) | 979 (33.1%) |
| 3 Vehicles | 760 (24.2%) | 870 (29.4%) |
| 4 Vehicles | 283 (9.0%) | 235 (8.0%) |
| 5 or more Vehicles | 267 (8.5%) | 240 (8.1%) |
| Total | 3,137 (100.0%) | 2,954 (100.0%) |
Commute Time in Clay County
The most frequently occuring commute durations in Clay County are 5 to 9 minutes (908 commuters, 16.0%), 10 to 14 minutes (868 commuters, 15.3%), and 15 to 19 minutes (652 commuters, 11.5%).
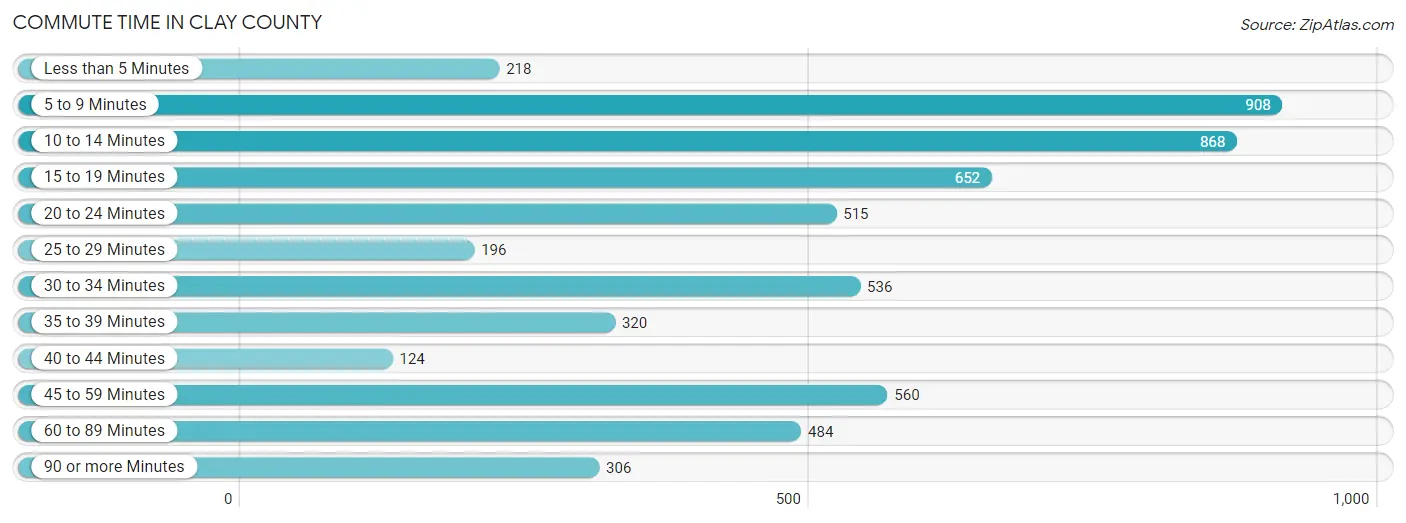
| Commute Time | # Commuters | % Commuters |
| Less than 5 Minutes | 218 | 3.8% |
| 5 to 9 Minutes | 908 | 16.0% |
| 10 to 14 Minutes | 868 | 15.3% |
| 15 to 19 Minutes | 652 | 11.5% |
| 20 to 24 Minutes | 515 | 9.1% |
| 25 to 29 Minutes | 196 | 3.5% |
| 30 to 34 Minutes | 536 | 9.4% |
| 35 to 39 Minutes | 320 | 5.6% |
| 40 to 44 Minutes | 124 | 2.2% |
| 45 to 59 Minutes | 560 | 9.9% |
| 60 to 89 Minutes | 484 | 8.5% |
| 90 or more Minutes | 306 | 5.4% |
Commute Time by Sex in Clay County
The most common commute times in Clay County are 10 to 14 minutes (517 commuters, 17.6%) for males and 5 to 9 minutes (476 commuters, 17.3%) for females.
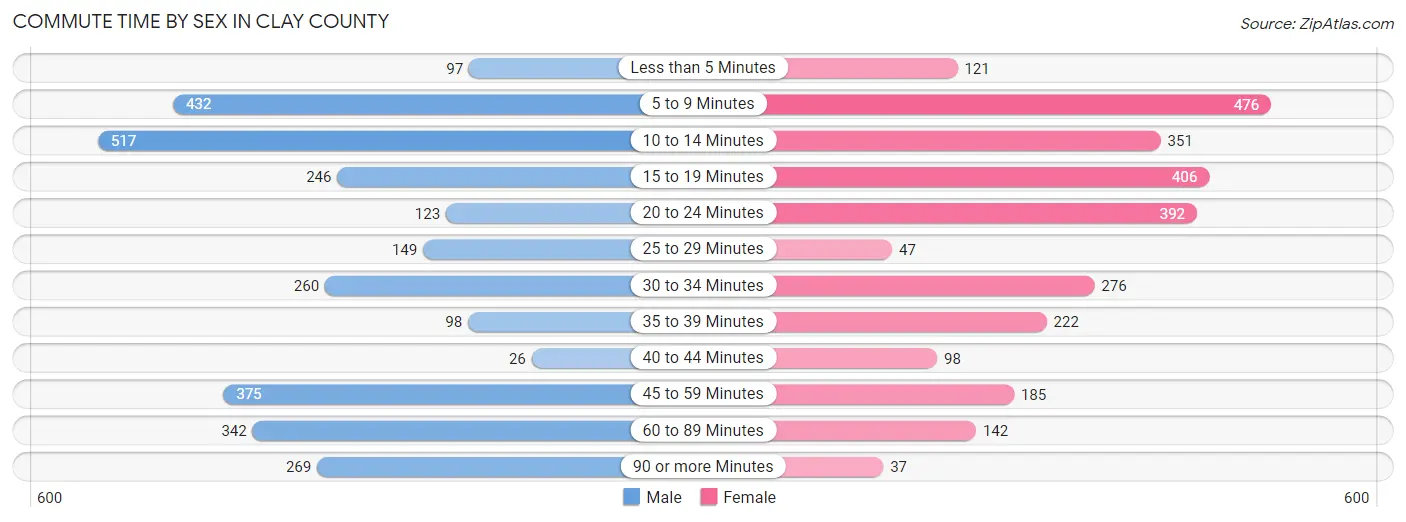
| Commute Time | Male | Female |
| Less than 5 Minutes | 97 (3.3%) | 121 (4.4%) |
| 5 to 9 Minutes | 432 (14.7%) | 476 (17.3%) |
| 10 to 14 Minutes | 517 (17.6%) | 351 (12.8%) |
| 15 to 19 Minutes | 246 (8.4%) | 406 (14.7%) |
| 20 to 24 Minutes | 123 (4.2%) | 392 (14.2%) |
| 25 to 29 Minutes | 149 (5.1%) | 47 (1.7%) |
| 30 to 34 Minutes | 260 (8.9%) | 276 (10.0%) |
| 35 to 39 Minutes | 98 (3.3%) | 222 (8.1%) |
| 40 to 44 Minutes | 26 (0.9%) | 98 (3.6%) |
| 45 to 59 Minutes | 375 (12.8%) | 185 (6.7%) |
| 60 to 89 Minutes | 342 (11.7%) | 142 (5.2%) |
| 90 or more Minutes | 269 (9.2%) | 37 (1.3%) |
Time of Departure to Work by Sex in Clay County
The most frequent times of departure to work in Clay County are 6:00 AM to 6:29 AM (439, 15.0%) for males and 7:00 AM to 7:29 AM (671, 24.4%) for females.
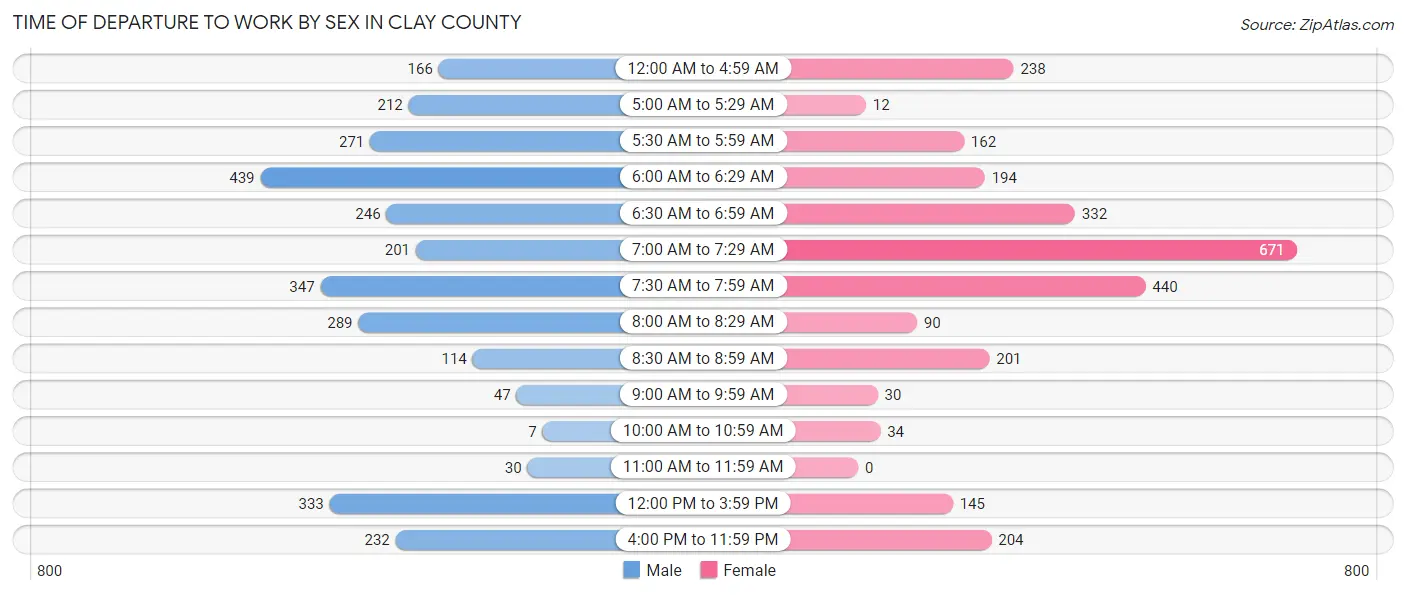
| Time of Departure | Male | Female |
| 12:00 AM to 4:59 AM | 166 (5.7%) | 238 (8.6%) |
| 5:00 AM to 5:29 AM | 212 (7.2%) | 12 (0.4%) |
| 5:30 AM to 5:59 AM | 271 (9.2%) | 162 (5.9%) |
| 6:00 AM to 6:29 AM | 439 (15.0%) | 194 (7.0%) |
| 6:30 AM to 6:59 AM | 246 (8.4%) | 332 (12.1%) |
| 7:00 AM to 7:29 AM | 201 (6.9%) | 671 (24.4%) |
| 7:30 AM to 7:59 AM | 347 (11.8%) | 440 (16.0%) |
| 8:00 AM to 8:29 AM | 289 (9.9%) | 90 (3.3%) |
| 8:30 AM to 8:59 AM | 114 (3.9%) | 201 (7.3%) |
| 9:00 AM to 9:59 AM | 47 (1.6%) | 30 (1.1%) |
| 10:00 AM to 10:59 AM | 7 (0.2%) | 34 (1.2%) |
| 11:00 AM to 11:59 AM | 30 (1.0%) | 0 (0.0%) |
| 12:00 PM to 3:59 PM | 333 (11.4%) | 145 (5.3%) |
| 4:00 PM to 11:59 PM | 232 (7.9%) | 204 (7.4%) |
| Total | 2,934 (100.0%) | 2,753 (100.0%) |
Housing Occupancy in Clay County
Occupancy by Ownership in Clay County
Of the total 7,110 dwellings in Clay County, owner-occupied units account for 5,314 (74.7%), while renter-occupied units make up 1,796 (25.3%).
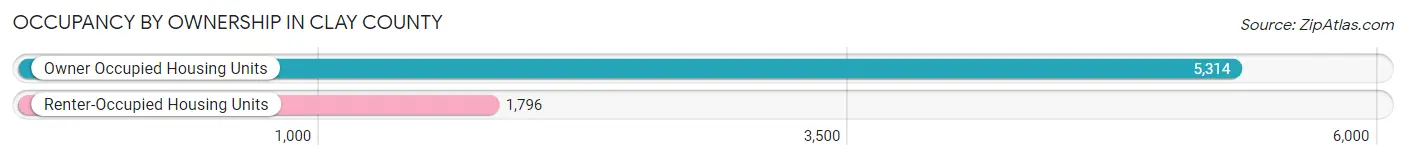
| Occupancy | # Housing Units | % Housing Units |
| Owner Occupied Housing Units | 5,314 | 74.7% |
| Renter-Occupied Housing Units | 1,796 | 25.3% |
| Total Occupied Housing Units | 7,110 | 100.0% |
Occupancy by Household Size in Clay County
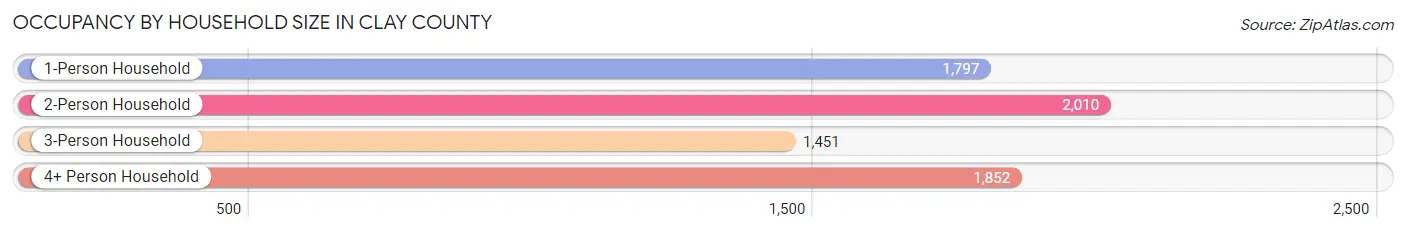
| Household Size | # Housing Units | % Housing Units |
| 1-Person Household | 1,797 | 25.3% |
| 2-Person Household | 2,010 | 28.3% |
| 3-Person Household | 1,451 | 20.4% |
| 4+ Person Household | 1,852 | 26.1% |
| Total Housing Units | 7,110 | 100.0% |
Occupancy by Ownership by Household Size in Clay County
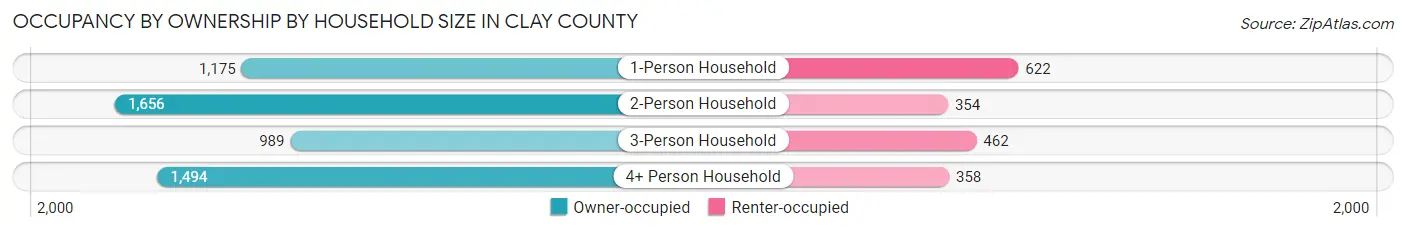
| Household Size | Owner-occupied | Renter-occupied |
| 1-Person Household | 1,175 (65.4%) | 622 (34.6%) |
| 2-Person Household | 1,656 (82.4%) | 354 (17.6%) |
| 3-Person Household | 989 (68.2%) | 462 (31.8%) |
| 4+ Person Household | 1,494 (80.7%) | 358 (19.3%) |
| Total Housing Units | 5,314 (74.7%) | 1,796 (25.3%) |
Occupancy by Educational Attainment in Clay County
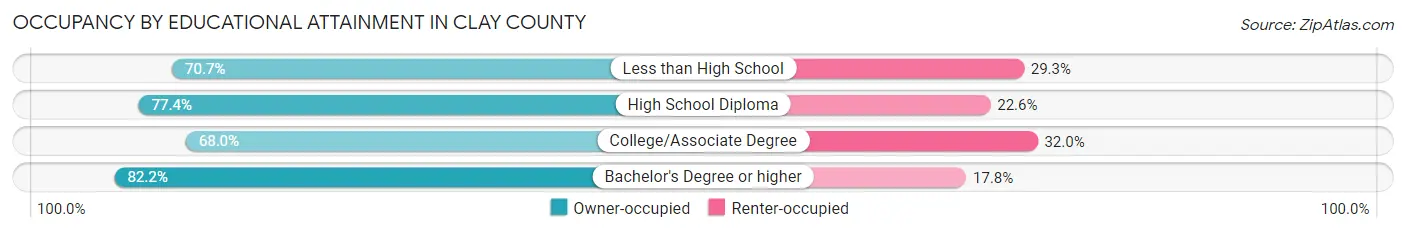
| Household Size | Owner-occupied | Renter-occupied |
| Less than High School | 1,204 (70.7%) | 498 (29.3%) |
| High School Diploma | 2,306 (77.4%) | 674 (22.6%) |
| College/Associate Degree | 919 (68.0%) | 432 (32.0%) |
| Bachelor's Degree or higher | 885 (82.2%) | 192 (17.8%) |
Occupancy by Age of Householder in Clay County
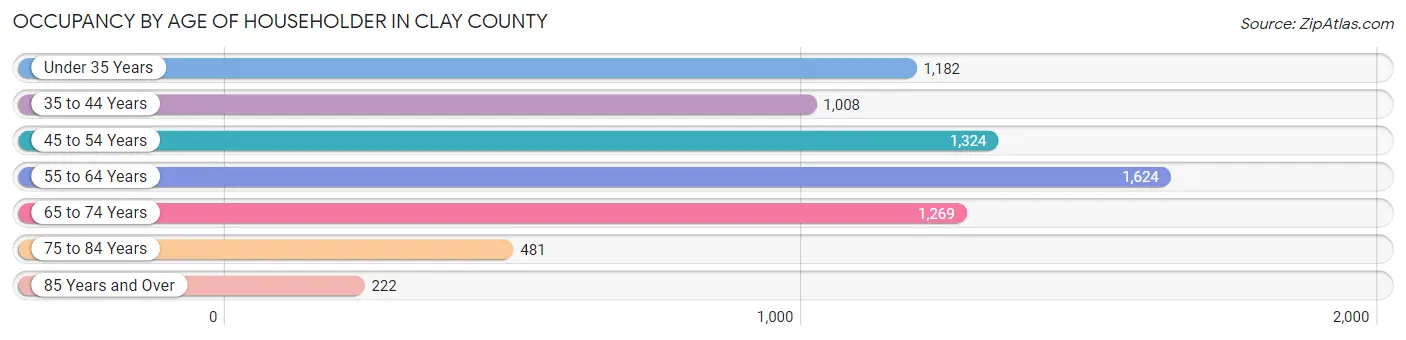
| Age Bracket | # Households | % Households |
| Under 35 Years | 1,182 | 16.6% |
| 35 to 44 Years | 1,008 | 14.2% |
| 45 to 54 Years | 1,324 | 18.6% |
| 55 to 64 Years | 1,624 | 22.8% |
| 65 to 74 Years | 1,269 | 17.8% |
| 75 to 84 Years | 481 | 6.8% |
| 85 Years and Over | 222 | 3.1% |
| Total | 7,110 | 100.0% |
Housing Finances in Clay County
Median Income by Occupancy in Clay County
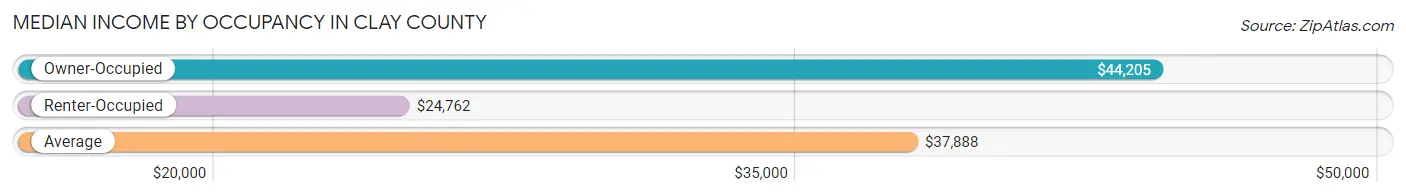
| Occupancy Type | # Households | Median Income |
| Owner-Occupied | 5,314 (74.7%) | $44,205 |
| Renter-Occupied | 1,796 (25.3%) | $24,762 |
| Average | 7,110 (100.0%) | $37,888 |
Occupancy by Householder Income Bracket in Clay County
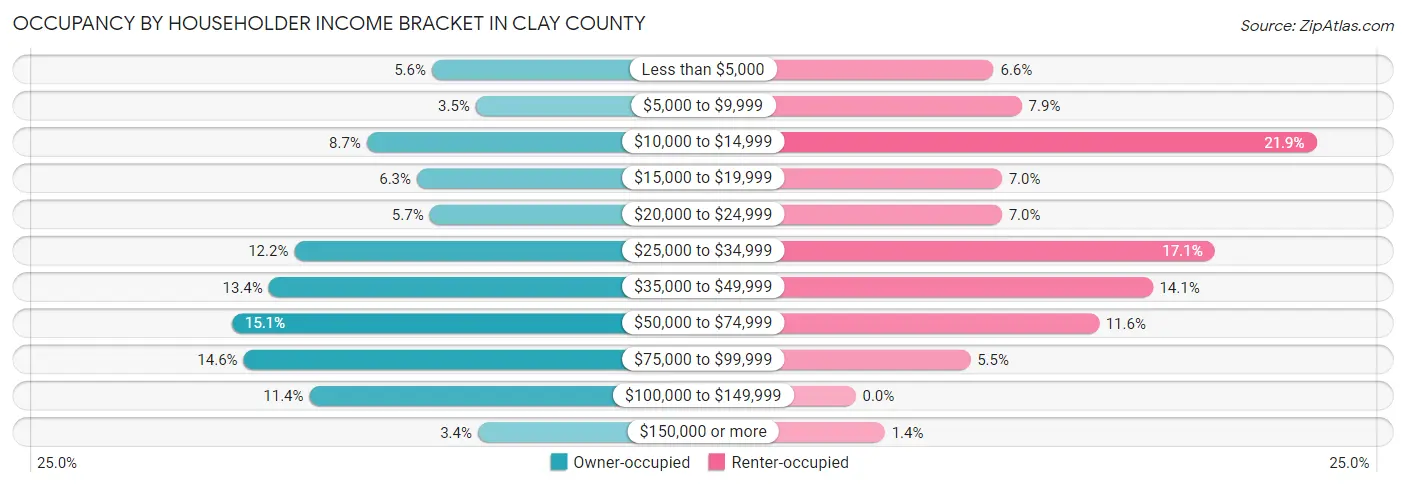
| Income Bracket | Owner-occupied | Renter-occupied |
| Less than $5,000 | 298 (5.6%) | 118 (6.6%) |
| $5,000 to $9,999 | 187 (3.5%) | 142 (7.9%) |
| $10,000 to $14,999 | 463 (8.7%) | 394 (21.9%) |
| $15,000 to $19,999 | 336 (6.3%) | 125 (7.0%) |
| $20,000 to $24,999 | 304 (5.7%) | 125 (7.0%) |
| $25,000 to $34,999 | 646 (12.2%) | 307 (17.1%) |
| $35,000 to $49,999 | 711 (13.4%) | 254 (14.1%) |
| $50,000 to $74,999 | 804 (15.1%) | 208 (11.6%) |
| $75,000 to $99,999 | 775 (14.6%) | 98 (5.5%) |
| $100,000 to $149,999 | 608 (11.4%) | 0 (0.0%) |
| $150,000 or more | 182 (3.4%) | 25 (1.4%) |
| Total | 5,314 (100.0%) | 1,796 (100.0%) |
Monthly Housing Cost Tiers in Clay County
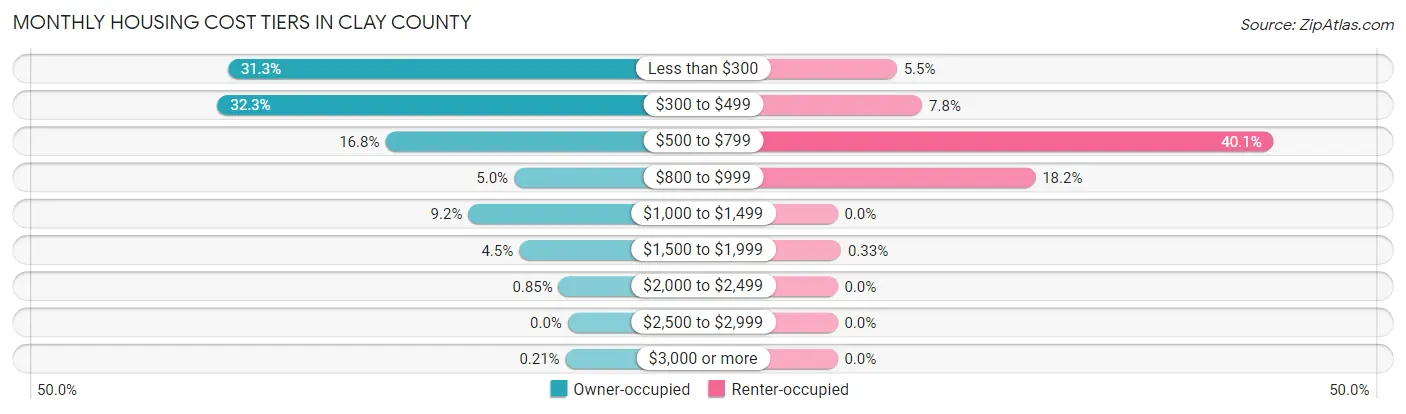
| Monthly Cost | Owner-occupied | Renter-occupied |
| Less than $300 | 1,663 (31.3%) | 98 (5.5%) |
| $300 to $499 | 1,714 (32.3%) | 140 (7.8%) |
| $500 to $799 | 893 (16.8%) | 721 (40.1%) |
| $800 to $999 | 263 (5.0%) | 327 (18.2%) |
| $1,000 to $1,499 | 487 (9.2%) | 0 (0.0%) |
| $1,500 to $1,999 | 238 (4.5%) | 6 (0.3%) |
| $2,000 to $2,499 | 45 (0.9%) | 0 (0.0%) |
| $2,500 to $2,999 | 0 (0.0%) | 0 (0.0%) |
| $3,000 or more | 11 (0.2%) | 0 (0.0%) |
| Total | 5,314 (100.0%) | 1,796 (100.0%) |
Physical Housing Characteristics in Clay County
Housing Structures in Clay County
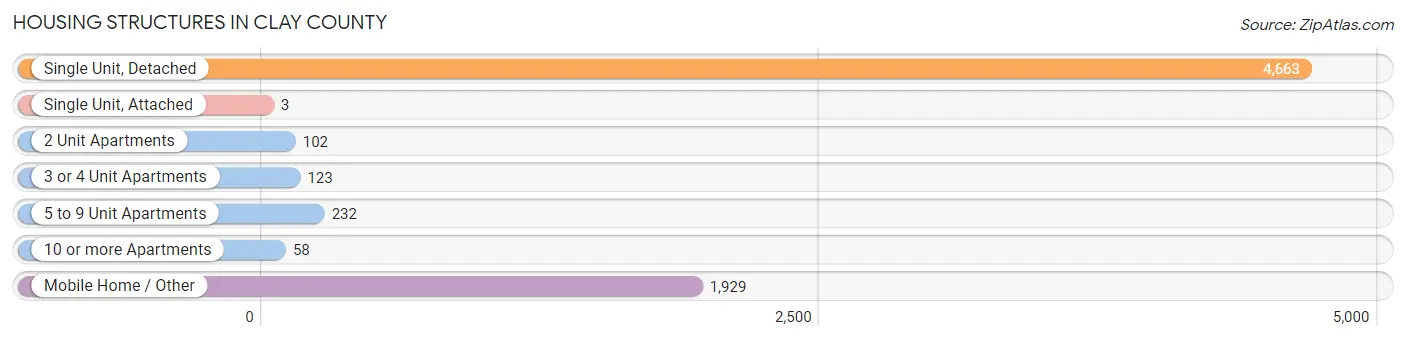
| Structure Type | # Housing Units | % Housing Units |
| Single Unit, Detached | 4,663 | 65.6% |
| Single Unit, Attached | 3 | 0.0% |
| 2 Unit Apartments | 102 | 1.4% |
| 3 or 4 Unit Apartments | 123 | 1.7% |
| 5 to 9 Unit Apartments | 232 | 3.3% |
| 10 or more Apartments | 58 | 0.8% |
| Mobile Home / Other | 1,929 | 27.1% |
| Total | 7,110 | 100.0% |
Housing Structures by Occupancy in Clay County
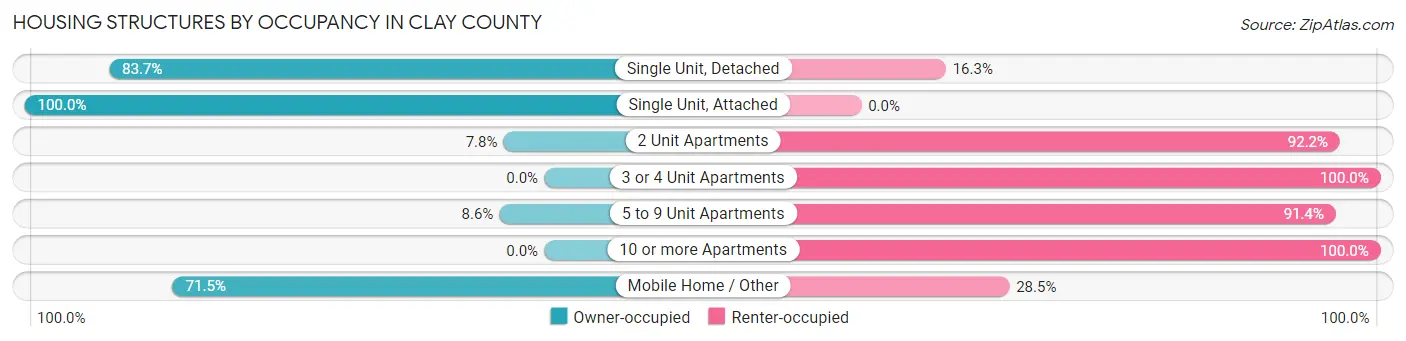
| Structure Type | Owner-occupied | Renter-occupied |
| Single Unit, Detached | 3,904 (83.7%) | 759 (16.3%) |
| Single Unit, Attached | 3 (100.0%) | 0 (0.0%) |
| 2 Unit Apartments | 8 (7.8%) | 94 (92.2%) |
| 3 or 4 Unit Apartments | 0 (0.0%) | 123 (100.0%) |
| 5 to 9 Unit Apartments | 20 (8.6%) | 212 (91.4%) |
| 10 or more Apartments | 0 (0.0%) | 58 (100.0%) |
| Mobile Home / Other | 1,379 (71.5%) | 550 (28.5%) |
| Total | 5,314 (74.7%) | 1,796 (25.3%) |
Housing Structures by Number of Rooms in Clay County
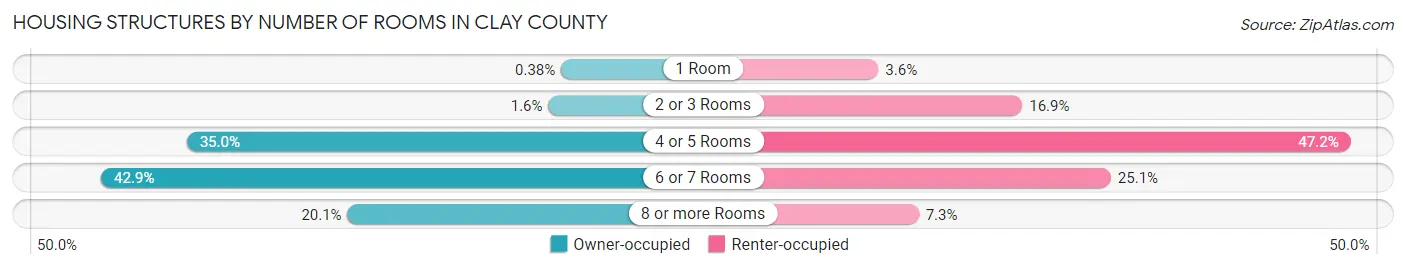
| Number of Rooms | Owner-occupied | Renter-occupied |
| 1 Room | 20 (0.4%) | 64 (3.6%) |
| 2 or 3 Rooms | 83 (1.6%) | 303 (16.9%) |
| 4 or 5 Rooms | 1,860 (35.0%) | 848 (47.2%) |
| 6 or 7 Rooms | 2,281 (42.9%) | 450 (25.1%) |
| 8 or more Rooms | 1,070 (20.1%) | 131 (7.3%) |
| Total | 5,314 (100.0%) | 1,796 (100.0%) |
Housing Structure by Heating Type in Clay County
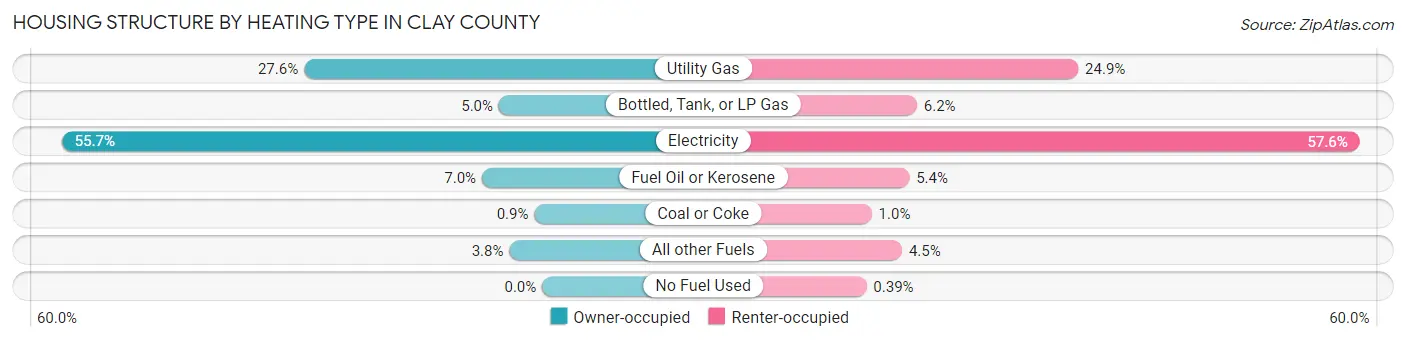
| Heating Type | Owner-occupied | Renter-occupied |
| Utility Gas | 1,467 (27.6%) | 448 (24.9%) |
| Bottled, Tank, or LP Gas | 266 (5.0%) | 112 (6.2%) |
| Electricity | 2,960 (55.7%) | 1,034 (57.6%) |
| Fuel Oil or Kerosene | 371 (7.0%) | 96 (5.3%) |
| Coal or Coke | 48 (0.9%) | 18 (1.0%) |
| All other Fuels | 202 (3.8%) | 81 (4.5%) |
| No Fuel Used | 0 (0.0%) | 7 (0.4%) |
| Total | 5,314 (100.0%) | 1,796 (100.0%) |
Household Vehicle Usage in Clay County
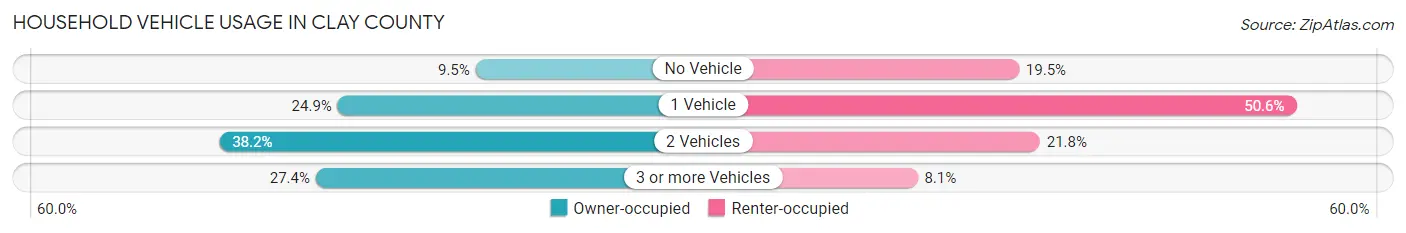
| Vehicles per Household | Owner-occupied | Renter-occupied |
| No Vehicle | 504 (9.5%) | 350 (19.5%) |
| 1 Vehicle | 1,325 (24.9%) | 908 (50.6%) |
| 2 Vehicles | 2,030 (38.2%) | 392 (21.8%) |
| 3 or more Vehicles | 1,455 (27.4%) | 146 (8.1%) |
| Total | 5,314 (100.0%) | 1,796 (100.0%) |
Real Estate & Mortgages in Clay County
Real Estate and Mortgage Overview in Clay County
| Characteristic | Without Mortgage | With Mortgage |
| Housing Units | 3,733 | 1,581 |
| Median Property Value | $55,700 | $112,400 |
| Median Household Income | $34,133 | $123 |
| Monthly Housing Costs | $331 | $11 |
| Real Estate Taxes | $475 | $208 |
Property Value by Mortgage Status in Clay County
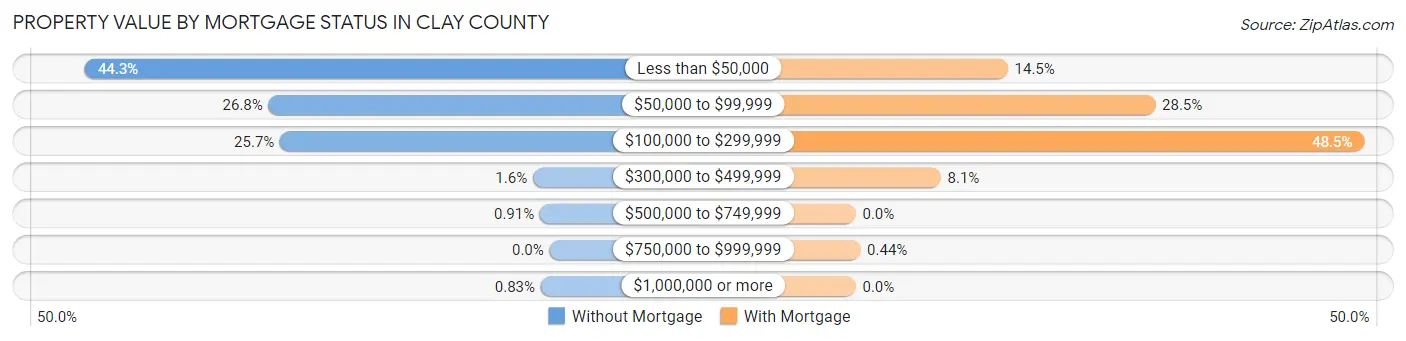
| Property Value | Without Mortgage | With Mortgage |
| Less than $50,000 | 1,652 (44.3%) | 229 (14.5%) |
| $50,000 to $99,999 | 999 (26.8%) | 451 (28.5%) |
| $100,000 to $299,999 | 958 (25.7%) | 766 (48.4%) |
| $300,000 to $499,999 | 59 (1.6%) | 128 (8.1%) |
| $500,000 to $749,999 | 34 (0.9%) | 0 (0.0%) |
| $750,000 to $999,999 | 0 (0.0%) | 7 (0.4%) |
| $1,000,000 or more | 31 (0.8%) | 0 (0.0%) |
| Total | 3,733 (100.0%) | 1,581 (100.0%) |
Household Income by Mortgage Status in Clay County
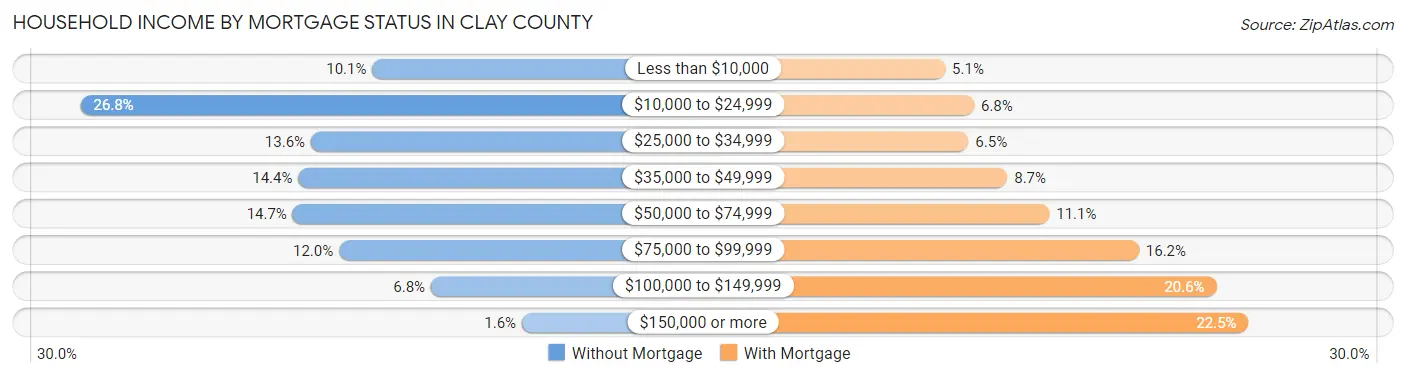
| Household Income | Without Mortgage | With Mortgage |
| Less than $10,000 | 378 (10.1%) | 81 (5.1%) |
| $10,000 to $24,999 | 1,001 (26.8%) | 107 (6.8%) |
| $25,000 to $34,999 | 509 (13.6%) | 102 (6.5%) |
| $35,000 to $49,999 | 536 (14.4%) | 137 (8.7%) |
| $50,000 to $74,999 | 548 (14.7%) | 175 (11.1%) |
| $75,000 to $99,999 | 449 (12.0%) | 256 (16.2%) |
| $100,000 to $149,999 | 253 (6.8%) | 326 (20.6%) |
| $150,000 or more | 59 (1.6%) | 355 (22.5%) |
| Total | 3,733 (100.0%) | 1,581 (100.0%) |
Property Value to Household Income Ratio in Clay County
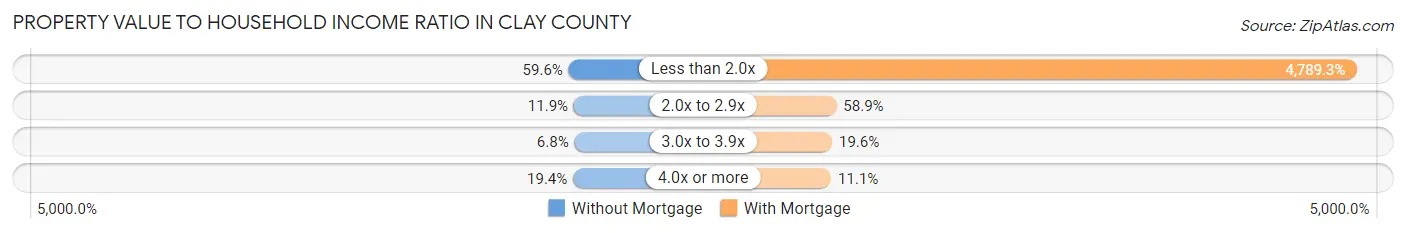
| Value-to-Income Ratio | Without Mortgage | With Mortgage |
| Less than 2.0x | 2,226 (59.6%) | 75,718 (4,789.2%) |
| 2.0x to 2.9x | 444 (11.9%) | 931 (58.9%) |
| 3.0x to 3.9x | 254 (6.8%) | 310 (19.6%) |
| 4.0x or more | 724 (19.4%) | 176 (11.1%) |
| Total | 3,733 (100.0%) | 1,581 (100.0%) |
Real Estate Taxes by Mortgage Status in Clay County
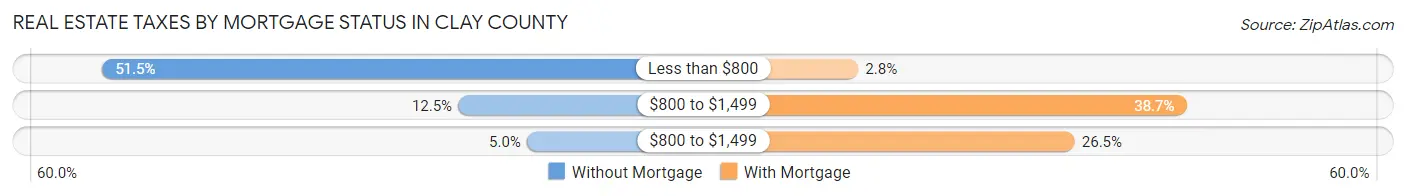
| Property Taxes | Without Mortgage | With Mortgage |
| Less than $800 | 1,922 (51.5%) | 44 (2.8%) |
| $800 to $1,499 | 467 (12.5%) | 612 (38.7%) |
| $800 to $1,499 | 186 (5.0%) | 419 (26.5%) |
| Total | 3,733 (100.0%) | 1,581 (100.0%) |
Health & Disability in Clay County
Health Insurance Coverage by Age in Clay County
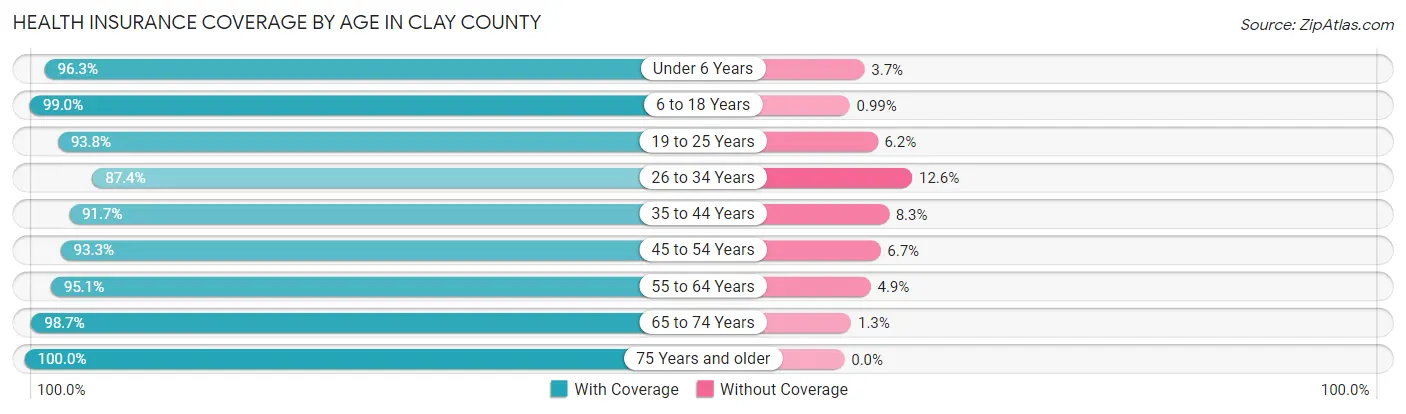
| Age Bracket | With Coverage | Without Coverage |
| Under 6 Years | 1,365 (96.3%) | 53 (3.7%) |
| 6 to 18 Years | 2,907 (99.0%) | 29 (1.0%) |
| 19 to 25 Years | 1,259 (93.8%) | 83 (6.2%) |
| 26 to 34 Years | 2,268 (87.4%) | 328 (12.6%) |
| 35 to 44 Years | 2,117 (91.7%) | 191 (8.3%) |
| 45 to 54 Years | 2,466 (93.3%) | 178 (6.7%) |
| 55 to 64 Years | 2,550 (95.1%) | 131 (4.9%) |
| 65 to 74 Years | 2,034 (98.7%) | 26 (1.3%) |
| 75 Years and older | 1,052 (100.0%) | 0 (0.0%) |
| Total | 18,018 (94.7%) | 1,019 (5.3%) |
Health Insurance Coverage by Citizenship Status in Clay County
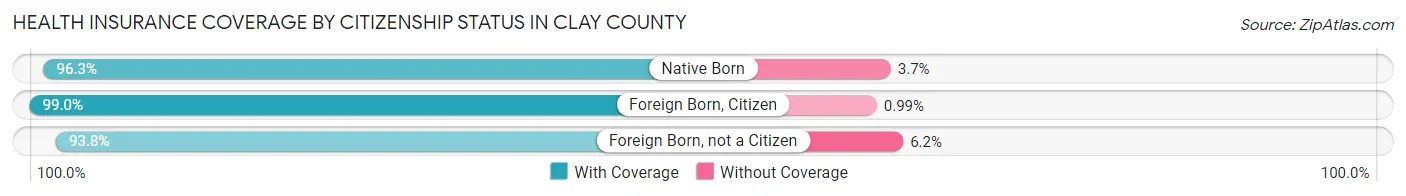
| Citizenship Status | With Coverage | Without Coverage |
| Native Born | 1,365 (96.3%) | 53 (3.7%) |
| Foreign Born, Citizen | 2,907 (99.0%) | 29 (1.0%) |
| Foreign Born, not a Citizen | 1,259 (93.8%) | 83 (6.2%) |
Health Insurance Coverage by Household Income in Clay County
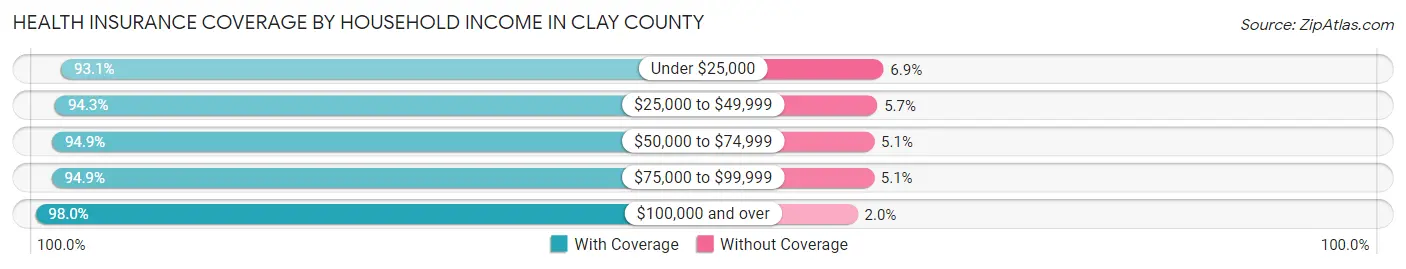
| Household Income | With Coverage | Without Coverage |
| Under $25,000 | 4,929 (93.1%) | 363 (6.9%) |
| $25,000 to $49,999 | 4,631 (94.3%) | 280 (5.7%) |
| $50,000 to $74,999 | 2,829 (94.9%) | 153 (5.1%) |
| $75,000 to $99,999 | 2,529 (94.9%) | 135 (5.1%) |
| $100,000 and over | 2,997 (98.0%) | 62 (2.0%) |
Public vs Private Health Insurance Coverage by Age in Clay County
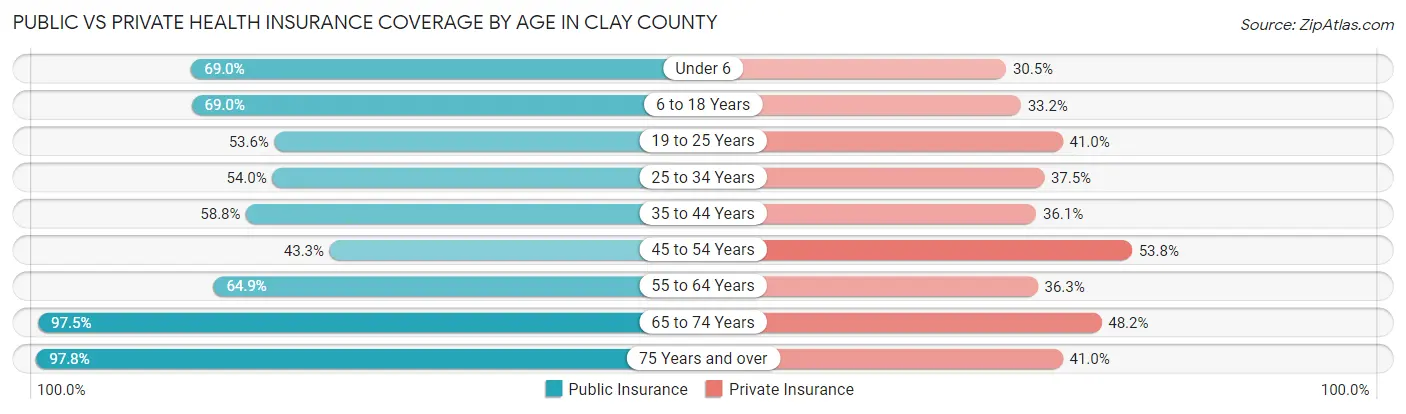
| Age Bracket | Public Insurance | Private Insurance |
| Under 6 | 979 (69.0%) | 432 (30.5%) |
| 6 to 18 Years | 2,026 (69.0%) | 975 (33.2%) |
| 19 to 25 Years | 719 (53.6%) | 550 (41.0%) |
| 25 to 34 Years | 1,401 (54.0%) | 974 (37.5%) |
| 35 to 44 Years | 1,358 (58.8%) | 832 (36.0%) |
| 45 to 54 Years | 1,146 (43.3%) | 1,423 (53.8%) |
| 55 to 64 Years | 1,741 (64.9%) | 974 (36.3%) |
| 65 to 74 Years | 2,008 (97.5%) | 992 (48.2%) |
| 75 Years and over | 1,029 (97.8%) | 431 (41.0%) |
| Total | 12,407 (65.2%) | 7,583 (39.8%) |
Disability Status by Sex by Age in Clay County
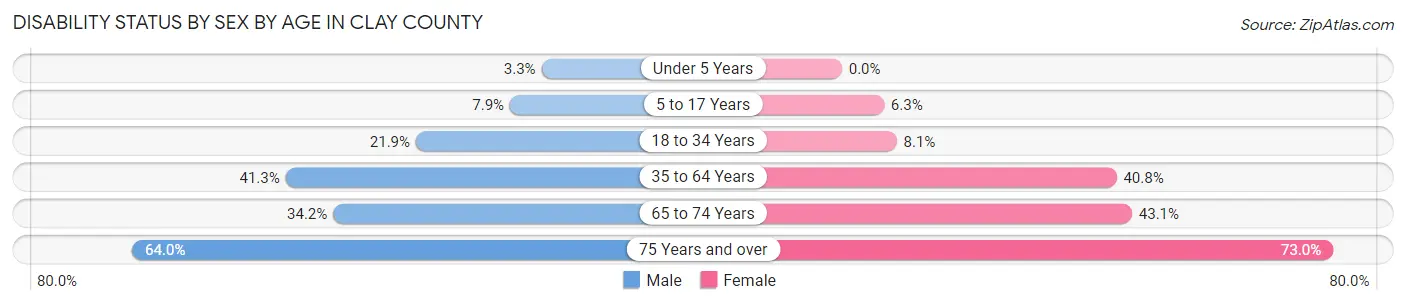
| Age Bracket | Male | Female |
| Under 5 Years | 19 (3.3%) | 0 (0.0%) |
| 5 to 17 Years | 125 (7.9%) | 87 (6.2%) |
| 18 to 34 Years | 467 (21.9%) | 159 (8.1%) |
| 35 to 64 Years | 1,579 (41.2%) | 1,552 (40.8%) |
| 65 to 74 Years | 332 (34.2%) | 469 (43.1%) |
| 75 Years and over | 276 (64.0%) | 453 (73.0%) |
Disability Class by Sex by Age in Clay County
Disability Class: Hearing Difficulty
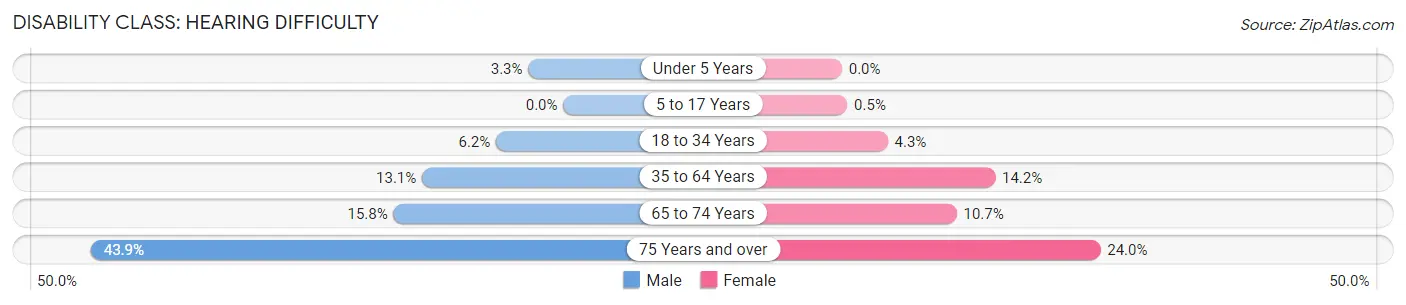
| Age Bracket | Male | Female |
| Under 5 Years | 19 (3.3%) | 0 (0.0%) |
| 5 to 17 Years | 0 (0.0%) | 7 (0.5%) |
| 18 to 34 Years | 133 (6.2%) | 83 (4.3%) |
| 35 to 64 Years | 502 (13.1%) | 541 (14.2%) |
| 65 to 74 Years | 153 (15.8%) | 116 (10.6%) |
| 75 Years and over | 189 (43.9%) | 149 (24.0%) |
Disability Class: Vision Difficulty
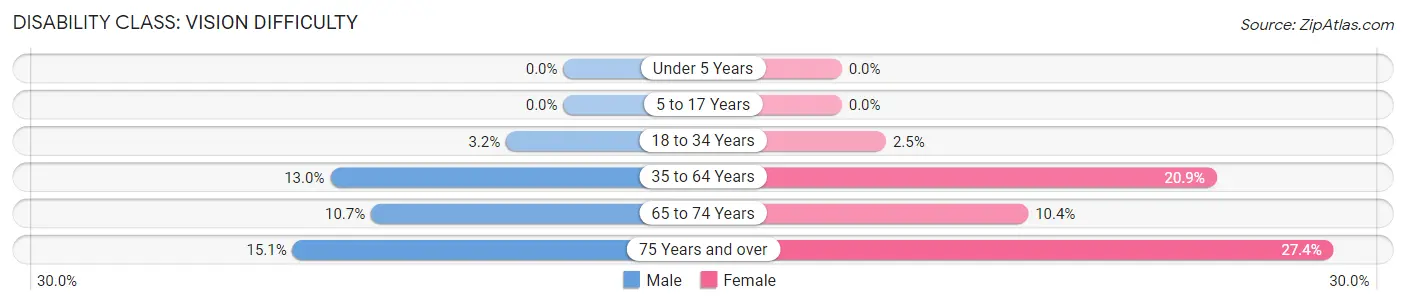
| Age Bracket | Male | Female |
| Under 5 Years | 0 (0.0%) | 0 (0.0%) |
| 5 to 17 Years | 0 (0.0%) | 0 (0.0%) |
| 18 to 34 Years | 68 (3.2%) | 48 (2.5%) |
| 35 to 64 Years | 497 (13.0%) | 794 (20.9%) |
| 65 to 74 Years | 104 (10.7%) | 113 (10.4%) |
| 75 Years and over | 65 (15.1%) | 170 (27.4%) |
Disability Class: Cognitive Difficulty
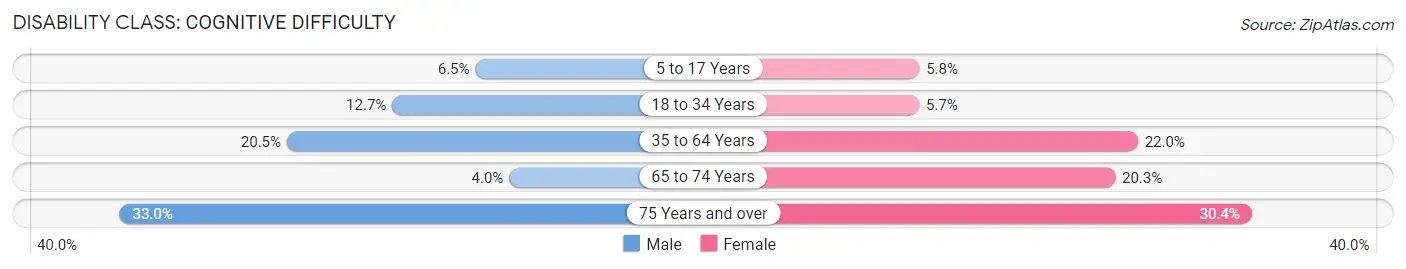
| Age Bracket | Male | Female |
| 5 to 17 Years | 103 (6.5%) | 80 (5.8%) |
| 18 to 34 Years | 271 (12.7%) | 112 (5.7%) |
| 35 to 64 Years | 786 (20.5%) | 836 (22.0%) |
| 65 to 74 Years | 39 (4.0%) | 221 (20.3%) |
| 75 Years and over | 142 (33.0%) | 189 (30.4%) |
Disability Class: Ambulatory Difficulty
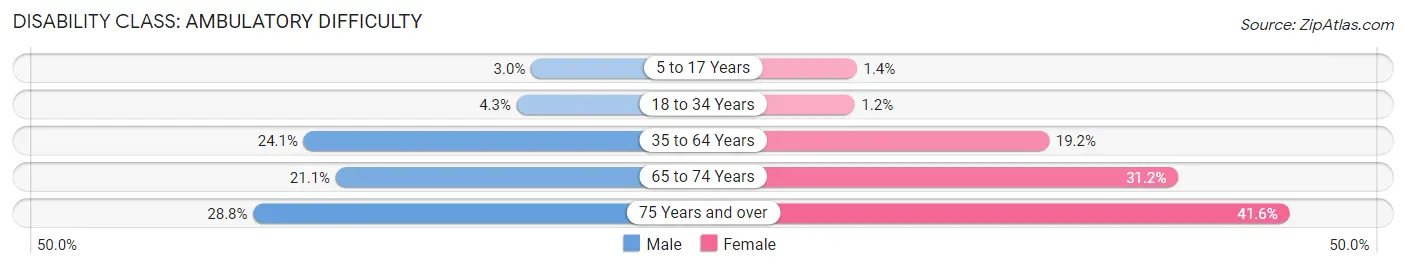
| Age Bracket | Male | Female |
| 5 to 17 Years | 47 (3.0%) | 19 (1.4%) |
| 18 to 34 Years | 92 (4.3%) | 23 (1.2%) |
| 35 to 64 Years | 922 (24.1%) | 731 (19.2%) |
| 65 to 74 Years | 205 (21.1%) | 340 (31.2%) |
| 75 Years and over | 124 (28.8%) | 258 (41.5%) |
Disability Class: Self-Care Difficulty
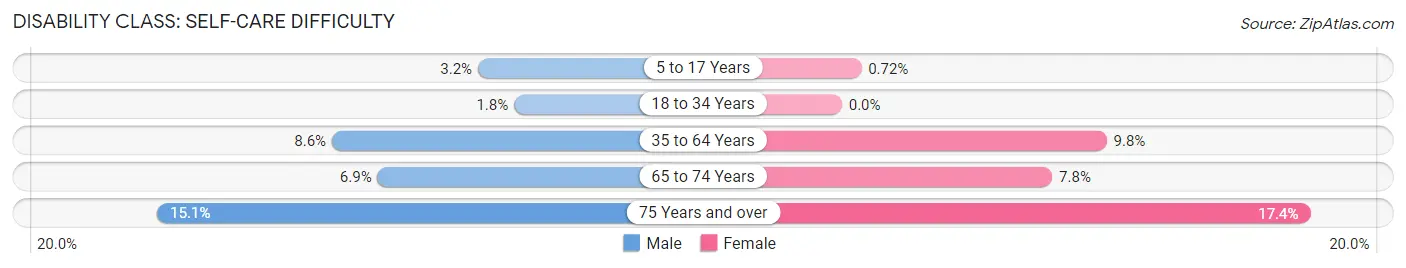
| Age Bracket | Male | Female |
| 5 to 17 Years | 50 (3.2%) | 10 (0.7%) |
| 18 to 34 Years | 39 (1.8%) | 0 (0.0%) |
| 35 to 64 Years | 329 (8.6%) | 374 (9.8%) |
| 65 to 74 Years | 67 (6.9%) | 85 (7.8%) |
| 75 Years and over | 65 (15.1%) | 108 (17.4%) |
Technology Access in Clay County
Computing Device Access in Clay County
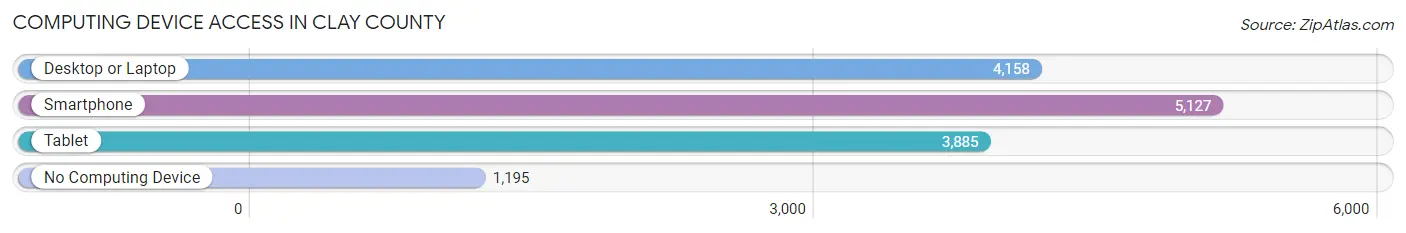
| Device Type | # Households | % Households |
| Desktop or Laptop | 4,158 | 58.5% |
| Smartphone | 5,127 | 72.1% |
| Tablet | 3,885 | 54.6% |
| No Computing Device | 1,195 | 16.8% |
| Total | 7,110 | 100.0% |
Internet Access in Clay County
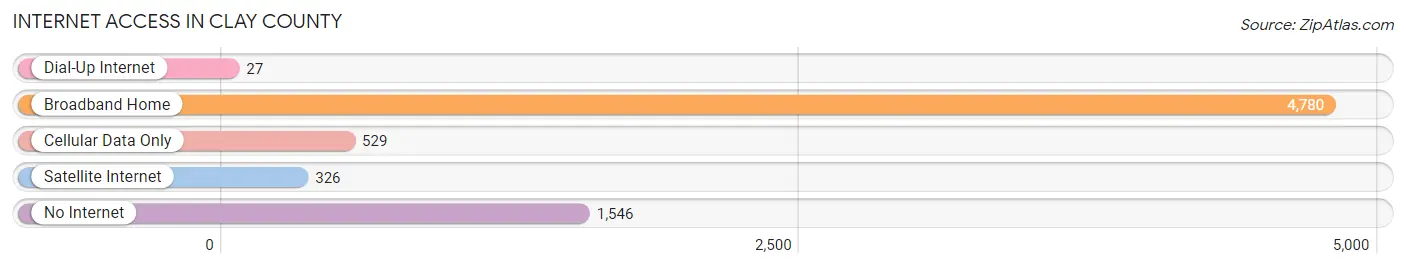
| Internet Type | # Households | % Households |
| Dial-Up Internet | 27 | 0.4% |
| Broadband Home | 4,780 | 67.2% |
| Cellular Data Only | 529 | 7.4% |
| Satellite Internet | 326 | 4.6% |
| No Internet | 1,546 | 21.7% |
| Total | 7,110 | 100.0% |
Clay County Summary
Clay County is located in the southeastern corner of Kentucky, and is bordered by Leslie County to the north, Bell County to the east, Knox County to the south, and Laurel County to the west. Clay County is part of the Appalachian region of the United States, and is known for its rugged terrain and beautiful scenery. The county is home to the Daniel Boone National Forest, which covers much of the county and provides a variety of recreational activities.
Clay County was formed in 1807 from parts of Knox and Madison counties. It was named for Green Clay, a prominent Kentucky politician and Revolutionary War veteran. The county seat is Manchester, which was established in 1820.
The population of Clay County was 21,845 in 2000, according to the U.S. Census Bureau. The population has remained relatively stable over the past few decades, with a slight decrease in the 1990s. The population is spread out across the county, with the largest concentration in the city of Manchester. The population is predominantly white, with a small African American population.
The economy of Clay County is largely based on agriculture and forestry. The county is home to several large farms, as well as a number of smaller family farms. The county is also home to several timber companies, which harvest timber from the Daniel Boone National Forest. The county also has a number of small businesses, including restaurants, retail stores, and service providers.
The median household income in Clay County was $25,845 in 2000, according to the U.S. Census Bureau. This is slightly lower than the national median of $41,994. The poverty rate in Clay County was 22.3%, which is higher than the national average of 12.4%.
Clay County is served by several public school districts, including the Clay County School District, Manchester Independent School District, and the Clay County Vocational School District. The county also has several private schools, including the Clay County Christian Academy and the Clay County Academy.
Clay County is home to several attractions, including the Daniel Boone National Forest, the Clay County Historical Museum, and the Clay County Fairgrounds. The county is also home to several festivals and events, including the Clay County Fair, the Clay County Music Festival, and the Clay County Bluegrass Festival.
Clay County is a beautiful and unique part of Kentucky, with a rich history and culture. The county is home to a variety of attractions and activities, and is a great place to live, work, and play.
Common Questions
What is Per Capita Income in Clay County?
Per Capita income in Clay County is $19,579.
What is the Median Family Income in Clay County?
Median Family Income in Clay County is $43,927.
What is the Median Household income in Clay County?
Median Household Income in Clay County is $37,888.
What is Income or Wage Gap in Clay County?
Income or Wage Gap in Clay County is 3.2%.
Women in Clay County earn 96.8 cents for every dollar earned by a man.
What is Family Income Deficit in Clay County?
Family Income Deficit in Clay County is $11,139.
Families that are below poverty line in Clay County earn $11,139 less on average than the poverty threshold level.
What is Inequality or Gini Index in Clay County?
Inequality or Gini Index in Clay County is 0.46.
What is the Total Population of Clay County?
Total Population of Clay County is 20,322.
What is the Total Male Population of Clay County?
Total Male Population of Clay County is 10,703.
What is the Total Female Population of Clay County?
Total Female Population of Clay County is 9,619.
What is the Ratio of Males per 100 Females in Clay County?
There are 111.27 Males per 100 Females in Clay County.
What is the Ratio of Females per 100 Males in Clay County?
There are 89.87 Females per 100 Males in Clay County.
What is the Median Population Age in Clay County?
Median Population Age in Clay County is 40.4 Years.
What is the Average Family Size in Clay County
Average Family Size in Clay County is 3.1 People.
What is the Average Household Size in Clay County
Average Household Size in Clay County is 2.7 People.
How Large is the Labor Force in Clay County?
There are 6,894 People in the Labor Forcein in Clay County.
What is the Percentage of People in the Labor Force in Clay County?
41.7% of People are in the Labor Force in Clay County.
What is the Unemployment Rate in Clay County?
Unemployment Rate in Clay County is 10.0%.